Area Code 831 Map & Demographics
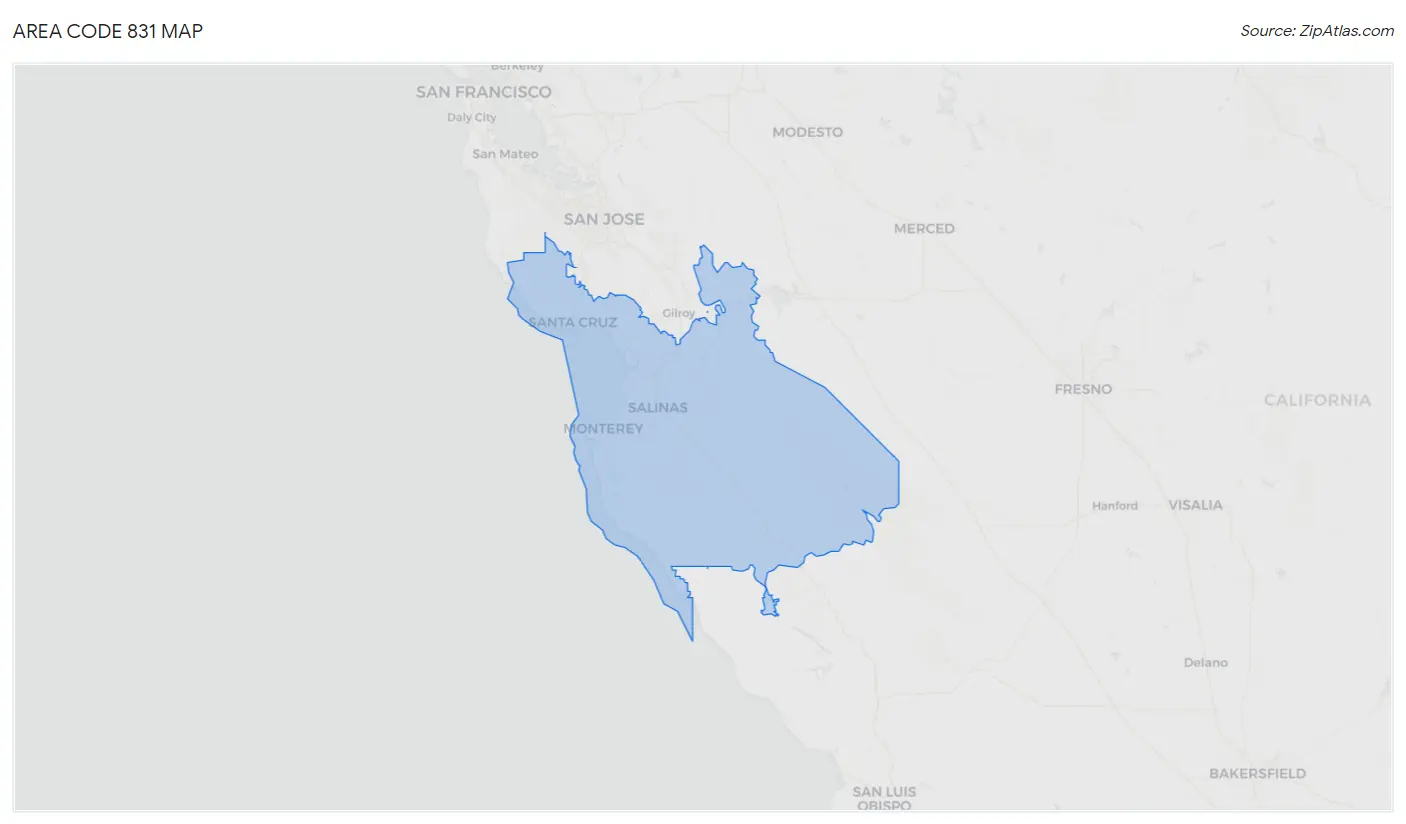
Area Code 831 Map
Area Code 831 Overview
$50,209
PER CAPITA INCOME
$119,216
AVG FAMILY INCOME
$104,788
AVG HOUSEHOLD INCOME
32.6%
WAGE / INCOME GAP [ % ]
67.4¢/ $1
WAGE / INCOME GAP [ $ ]
$10,913
FAMILY INCOME DEFICIT
17.79
INEQUALITY / GINI INDEX
713,666
TOTAL POPULATION
362,164
MALE POPULATION
351,502
FEMALE POPULATION
103.03
MALES / 100 FEMALES
97.06
FEMALES / 100 MALES
40.3
MEDIAN AGE
3.3
AVG FAMILY SIZE
2.9
AVG HOUSEHOLD SIZE
350,297
LABOR FORCE [ PEOPLE ]
62.1%
PERCENT IN LABOR FORCE
5.6%
UNEMPLOYMENT RATE
Income in Area Code 831
Income Overview in Area Code 831
Per Capita Income in Area Code 831 is $50,209, while median incomes of families and households are $119,216 and $104,788 respectively.
| Characteristic | Number | Measure |
| Per Capita Income | 713,666 | $50,209 |
| Median Family Income | 158,790 | $119,216 |
| Mean Family Income | 158,790 | $6,375,896 |
| Median Household Income | 226,628 | $104,788 |
| Mean Household Income | 226,628 | $5,722,462 |
| Income Deficit | 158,790 | $10,913 |
| Wage / Income Gap (%) | 713,666 | 32.65% |
| Wage / Income Gap ($) | 713,666 | 67.36¢ per $1 |
| Gini / Inequality Index | 713,666 | 17.79 |
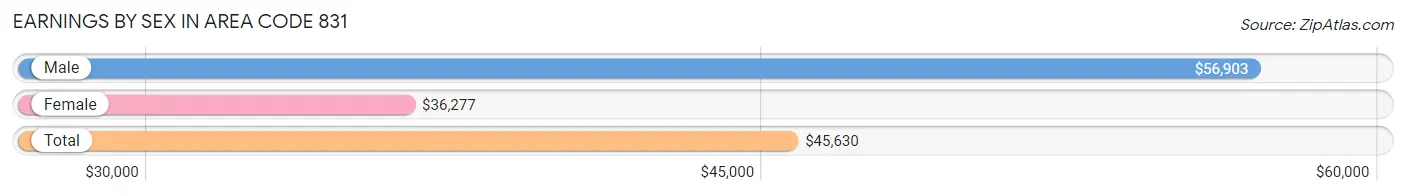
Earnings by Sex in Area Code 831
Average Earnings in Area Code 831 are $45,630, $56,903 for men and $36,277 for women, a difference of 36.2%.
| Sex | Number | Average Earnings |
| Male | 206,211 (54.8%) | $56,903 |
| Female | 170,299 (45.2%) | $36,277 |
| Total | 376,510 (100.0%) | $45,630 |
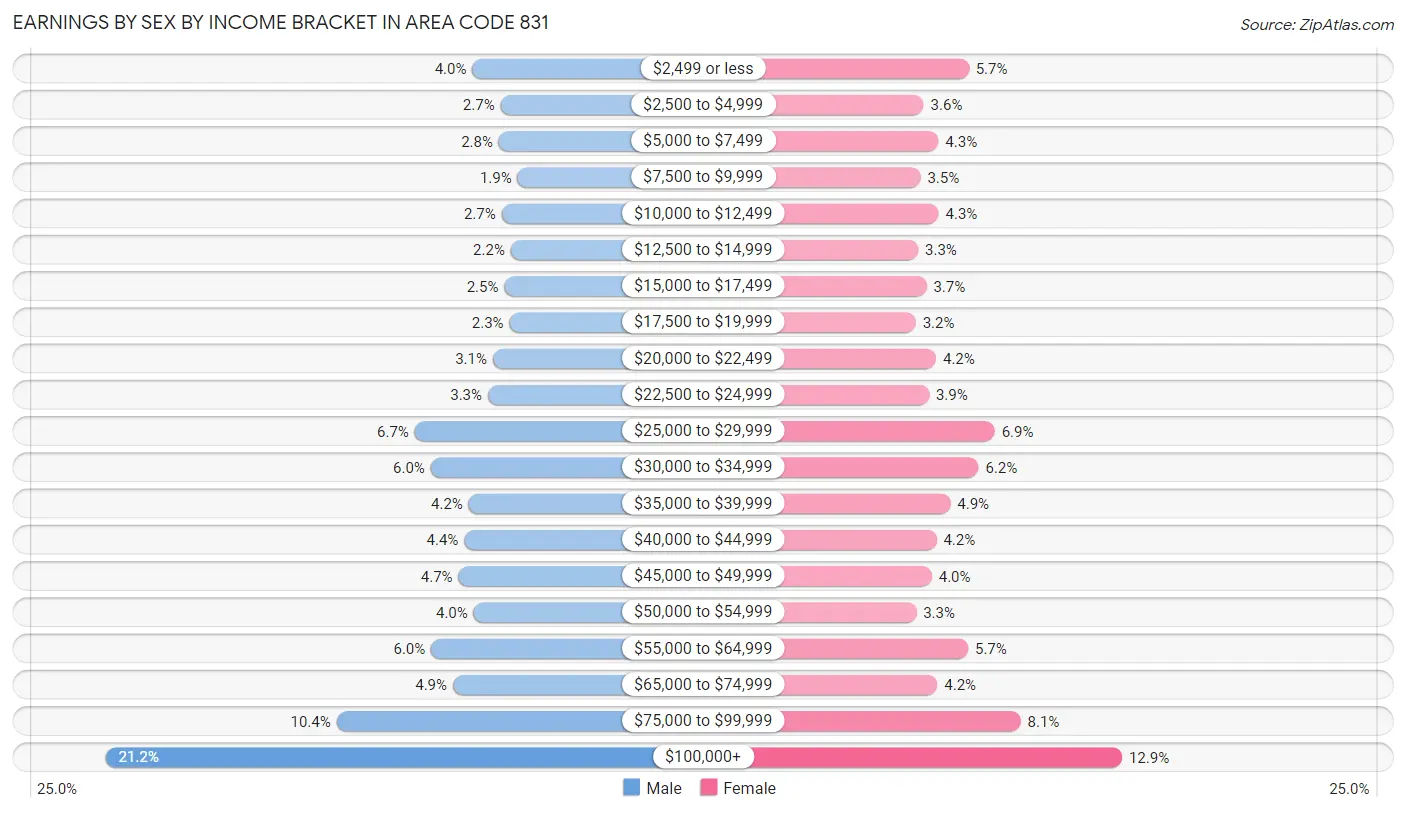
Earnings by Sex by Income Bracket in Area Code 831
The most common earnings brackets in Area Code 831 are $100,000+ for men (43,739 | 21.2%) and $100,000+ for women (21,954 | 12.9%).
| Income | Male | Female |
| $2,499 or less | 8,311 (4.0%) | 9,716 (5.7%) |
| $2,500 to $4,999 | 5,592 (2.7%) | 6,129 (3.6%) |
| $5,000 to $7,499 | 5,749 (2.8%) | 7,303 (4.3%) |
| $7,500 to $9,999 | 3,936 (1.9%) | 5,877 (3.5%) |
| $10,000 to $12,499 | 5,487 (2.7%) | 7,319 (4.3%) |
| $12,500 to $14,999 | 4,597 (2.2%) | 5,684 (3.3%) |
| $15,000 to $17,499 | 5,217 (2.5%) | 6,353 (3.7%) |
| $17,500 to $19,999 | 4,728 (2.3%) | 5,506 (3.2%) |
| $20,000 to $22,499 | 6,331 (3.1%) | 7,121 (4.2%) |
| $22,500 to $24,999 | 6,809 (3.3%) | 6,555 (3.8%) |
| $25,000 to $29,999 | 13,880 (6.7%) | 11,800 (6.9%) |
| $30,000 to $34,999 | 12,331 (6.0%) | 10,500 (6.2%) |
| $35,000 to $39,999 | 8,655 (4.2%) | 8,251 (4.9%) |
| $40,000 to $44,999 | 9,095 (4.4%) | 7,149 (4.2%) |
| $45,000 to $49,999 | 9,656 (4.7%) | 6,783 (4.0%) |
| $50,000 to $54,999 | 8,194 (4.0%) | 5,533 (3.3%) |
| $55,000 to $64,999 | 12,289 (6.0%) | 9,671 (5.7%) |
| $65,000 to $74,999 | 10,192 (4.9%) | 7,228 (4.2%) |
| $75,000 to $99,999 | 21,423 (10.4%) | 13,867 (8.1%) |
| $100,000+ | 43,739 (21.2%) | 21,954 (12.9%) |
| Total | 206,211 (100.0%) | 170,299 (100.0%) |
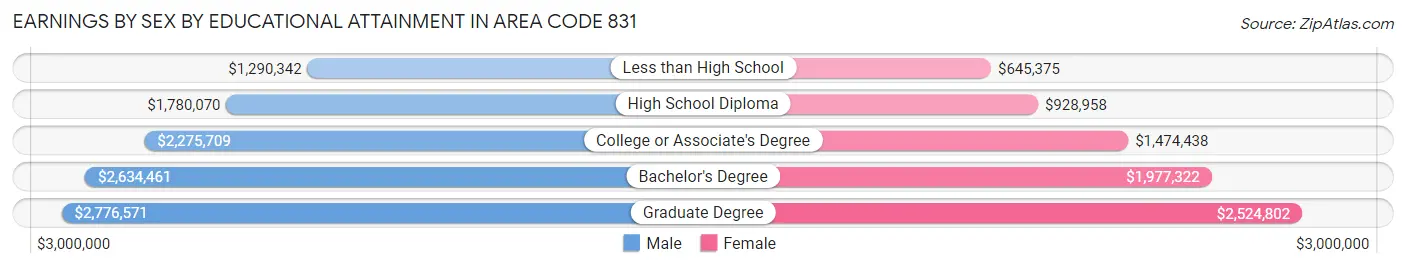
Earnings by Sex by Educational Attainment in Area Code 831
Average earnings in Area Code 831 are $2,680,134 for men and $1,762,682 for women, a difference of 34.2%. Men with an educational attainment of graduate degree enjoy the highest average annual earnings of $2,776,571, while those with less than high school education earn the least with $1,290,342. Women with an educational attainment of graduate degree earn the most with the average annual earnings of $2,524,802, while those with less than high school education have the smallest earnings of $645,375.
| Educational Attainment | Male Income | Female Income |
| Less than High School | $1,290,342 | $645,375 |
| High School Diploma | $1,780,070 | $928,958 |
| College or Associate's Degree | $2,275,709 | $1,474,438 |
| Bachelor's Degree | $2,634,461 | $1,977,322 |
| Graduate Degree | $2,776,571 | $2,524,802 |
| Total | $2,680,134 | $1,762,682 |
Family Income in Area Code 831
Family Income Brackets in Area Code 831
According to the Area Code 831 family income data, there are 1,649,987 families falling into the $200,000+ income range, which is the most common income bracket and makes up 1,039.1% of all families. Conversely, the $10,000 to $14,999 income bracket is the least frequent group with only 54,147 families (34.1%) belonging to this category.
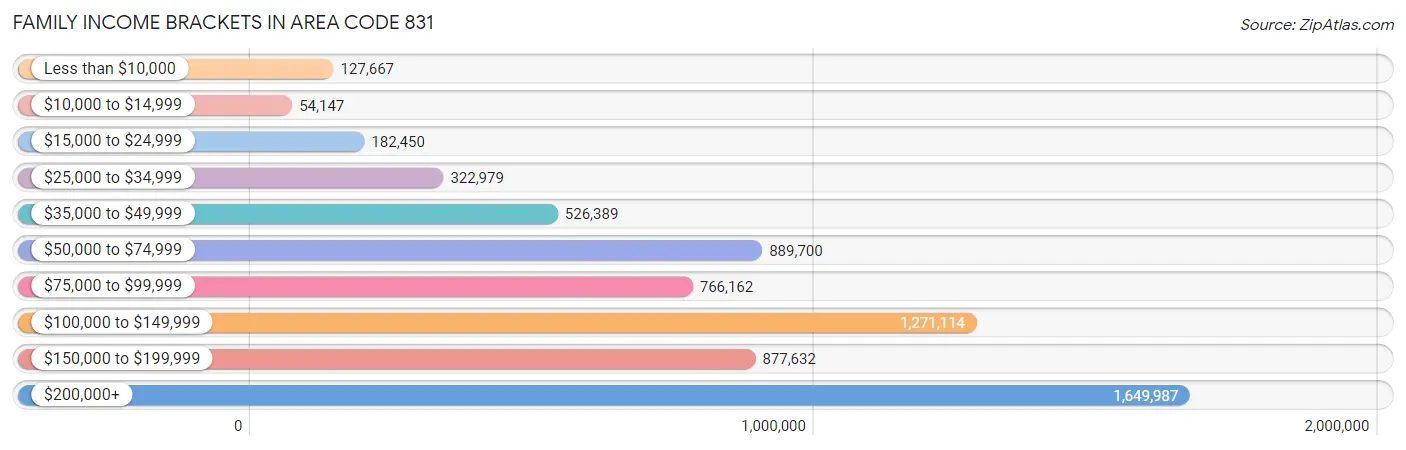
| Income Bracket | # Families | % Families |
| Less than $10,000 | 127,667 | 80.4% |
| $10,000 to $14,999 | 54,147 | 34.1% |
| $15,000 to $24,999 | 182,450 | 114.9% |
| $25,000 to $34,999 | 322,979 | 203.4% |
| $35,000 to $49,999 | 526,389 | 331.5% |
| $50,000 to $74,999 | 889,700 | 560.3% |
| $75,000 to $99,999 | 766,162 | 482.5% |
| $100,000 to $149,999 | 1,271,114 | 800.5% |
| $150,000 to $199,999 | 877,632 | 552.7% |
| $200,000+ | 1,649,987 | 1,039.1% |
Family Income by Famaliy Size in Area Code 831
7+ person families (6,537 | 4.1%) account for the highest median family income in Area Code 831 with $155,602 per family, while 2-person families (61,232 | 38.6%) have the highest median income of $55,780 per family member.
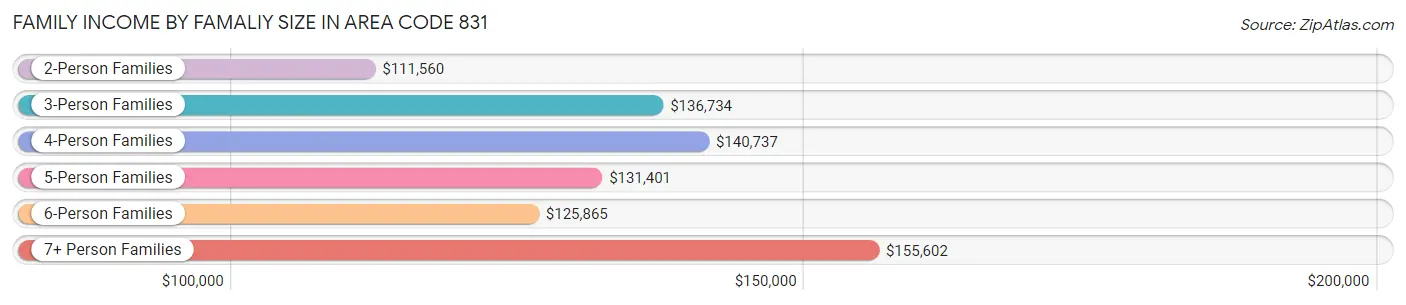
| Income Bracket | # Families | Median Income |
| 2-Person Families | 61,232 (38.6%) | $111,560 |
| 3-Person Families | 32,216 (20.3%) | $136,734 |
| 4-Person Families | 33,155 (20.9%) | $140,737 |
| 5-Person Families | 17,266 (10.9%) | $131,401 |
| 6-Person Families | 8,384 (5.3%) | $125,865 |
| 7+ Person Families | 6,537 (4.1%) | $155,602 |
| Total | 158,790 (100.0%) | $119,216 |
Family Income by Number of Earners in Area Code 831
The median family income in Area Code 831 is $119,216, with families comprising 3+ earners (29,351) having the highest median family income of $169,803, while families with no earners (19,179) have the lowest median family income of $77,096, accounting for 18.5% and 12.1% of families, respectively.
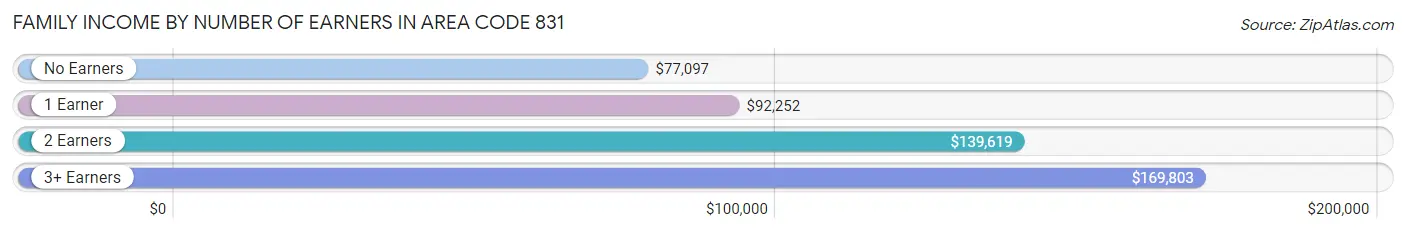
| Number of Earners | # Families | Median Income |
| No Earners | 19,179 (12.1%) | $77,096 |
| 1 Earner | 47,939 (30.2%) | $92,252 |
| 2 Earners | 62,321 (39.3%) | $139,619 |
| 3+ Earners | 29,351 (18.5%) | $169,803 |
| Total | 158,790 (100.0%) | $119,216 |
Household Income in Area Code 831
Household Income Brackets in Area Code 831
With 2,055,743 households falling in the category, the $200,000+ income range is the most frequent in Area Code 831, accounting for 907.1% of all households. In contrast, only 186,288 households (82.2%) fall into the $10,000 to $14,999 income bracket, making it the least populous group.
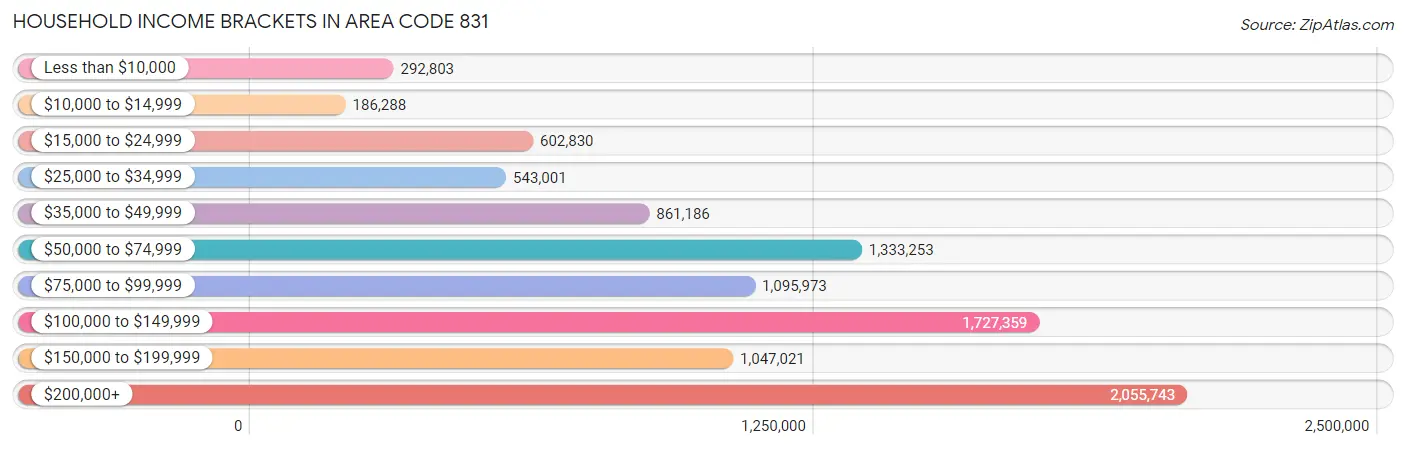
| Income Bracket | # Households | % Households |
| Less than $10,000 | 292,803 | 129.2% |
| $10,000 to $14,999 | 186,288 | 82.2% |
| $15,000 to $24,999 | 602,830 | 266.0% |
| $25,000 to $34,999 | 543,001 | 239.6% |
| $35,000 to $49,999 | 861,186 | 380.0% |
| $50,000 to $74,999 | 1,333,253 | 588.3% |
| $75,000 to $99,999 | 1,095,973 | 483.6% |
| $100,000 to $149,999 | 1,727,359 | 762.2% |
| $150,000 to $199,999 | 1,047,021 | 462.0% |
| $200,000+ | 2,055,743 | 907.1% |
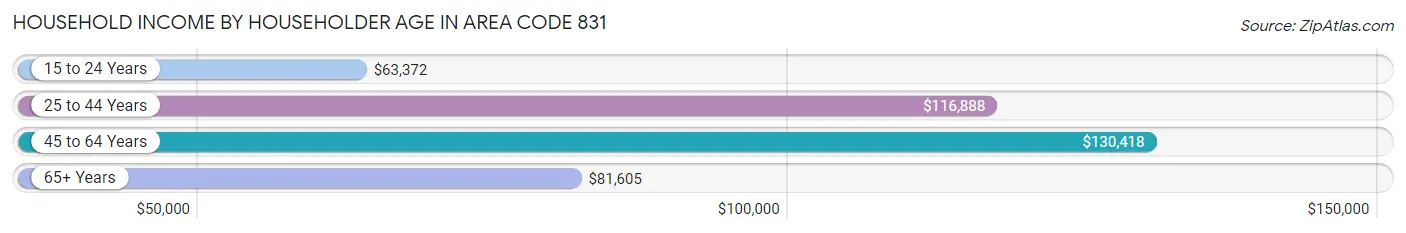
Household Income by Householder Age in Area Code 831
The median household income in Area Code 831 is $104,788, with the highest median household income of $130,418 found in the 45 to 64 years age bracket for the primary householder. A total of 87,150 households (38.5%) fall into this category. Meanwhile, the 15 to 24 years age bracket for the primary householder has the lowest median household income of $63,372, with 7,931 households (3.5%) in this group.
| Income Bracket | # Households | Median Income |
| 15 to 24 Years | 7,931 (3.5%) | $63,372 |
| 25 to 44 Years | 68,477 (30.2%) | $116,888 |
| 45 to 64 Years | 87,150 (38.5%) | $130,418 |
| 65+ Years | 63,070 (27.8%) | $81,605 |
| Total | 226,628 (100.0%) | $104,788 |
Poverty in Area Code 831
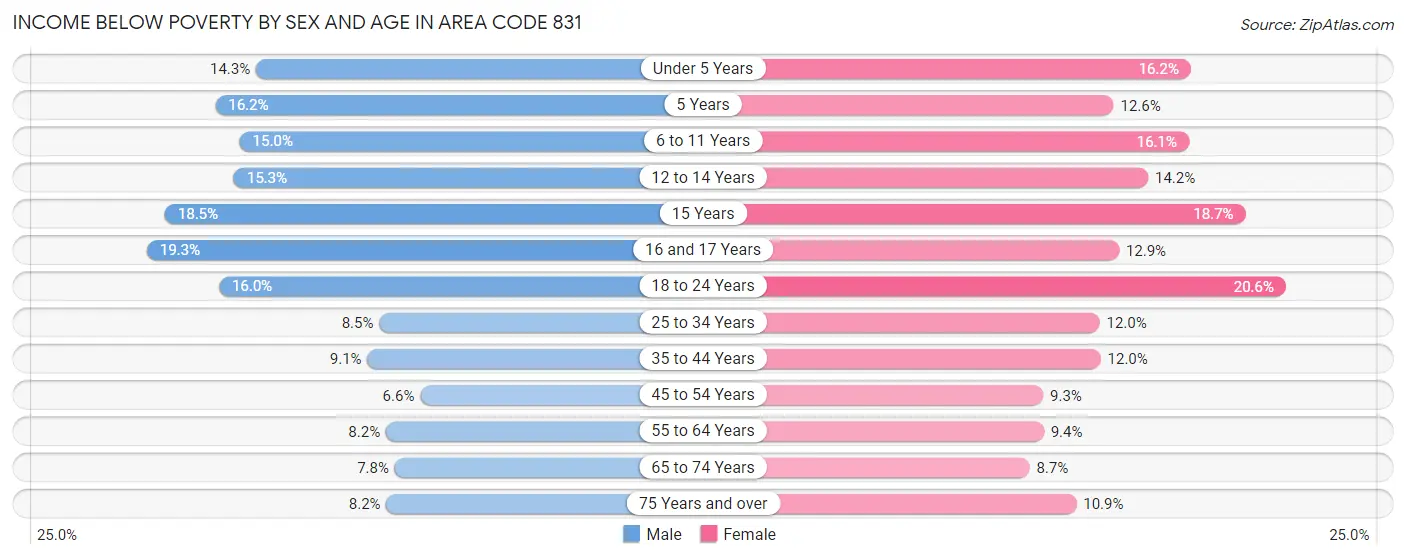
Income Below Poverty by Sex and Age in Area Code 831
With 10.8% poverty level for males and 12.6% for females among the residents of Area Code 831, 16 and 17 year old males and 18 to 24 year old females are the most vulnerable to poverty, with 1,825 males (19.3%) and 7,219 females (20.6%) in their respective age groups living below the poverty level.
| Age Bracket | Male | Female |
| Under 5 Years | 3,022 (14.3%) | 3,347 (16.2%) |
| 5 Years | 650 (16.2%) | 519 (12.6%) |
| 6 to 11 Years | 4,352 (15.0%) | 4,350 (16.1%) |
| 12 to 14 Years | 2,363 (15.3%) | 2,049 (14.2%) |
| 15 Years | 949 (18.5%) | 954 (18.7%) |
| 16 and 17 Years | 1,825 (19.3%) | 1,201 (12.9%) |
| 18 to 24 Years | 5,764 (16.0%) | 7,219 (20.6%) |
| 25 to 34 Years | 3,944 (8.5%) | 5,292 (12.0%) |
| 35 to 44 Years | 4,210 (9.1%) | 5,219 (12.0%) |
| 45 to 54 Years | 2,874 (6.6%) | 3,792 (9.3%) |
| 55 to 64 Years | 3,338 (8.2%) | 3,925 (9.4%) |
| 65 to 74 Years | 2,459 (7.8%) | 2,911 (8.7%) |
| 75 Years and over | 1,431 (8.2%) | 2,598 (10.9%) |
| Total | 37,181 (10.8%) | 43,376 (12.6%) |
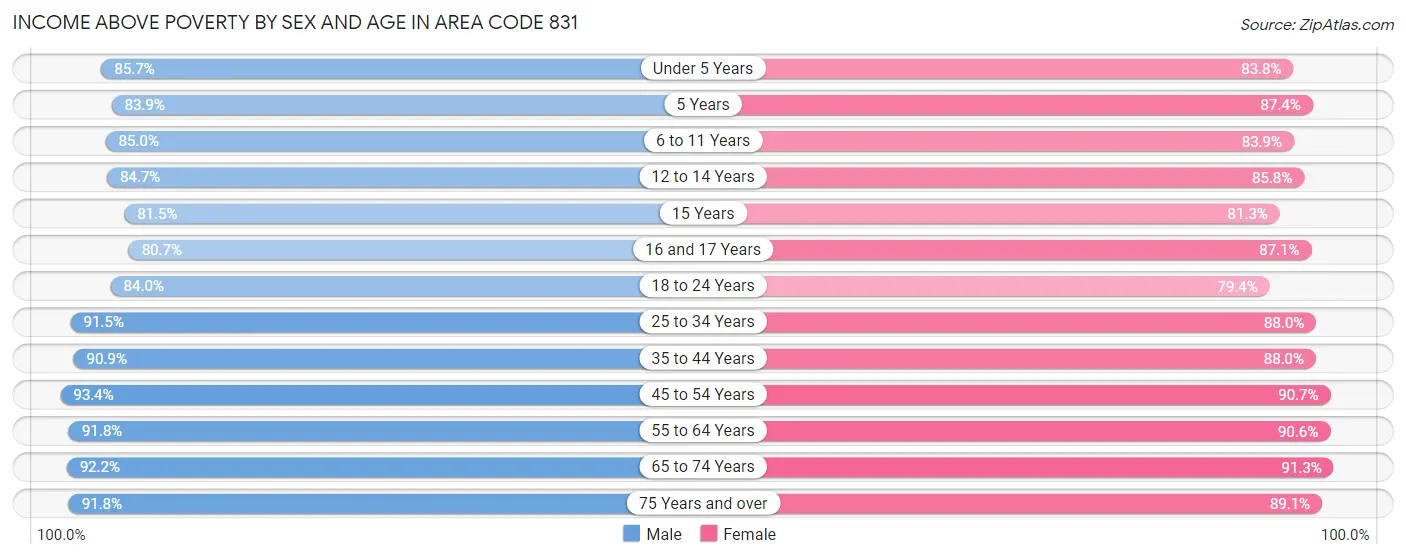
Income Above Poverty by Sex and Age in Area Code 831
According to the poverty statistics in Area Code 831, males aged 45 to 54 years and females aged 65 to 74 years are the age groups that are most secure financially, with 93.4% of males and 91.3% of females in these age groups living above the poverty line.
| Age Bracket | Male | Female |
| Under 5 Years | 18,169 (85.7%) | 17,325 (83.8%) |
| 5 Years | 3,374 (83.9%) | 3,598 (87.4%) |
| 6 to 11 Years | 24,616 (85.0%) | 22,668 (83.9%) |
| 12 to 14 Years | 13,095 (84.7%) | 12,373 (85.8%) |
| 15 Years | 4,183 (81.5%) | 4,140 (81.3%) |
| 16 and 17 Years | 7,618 (80.7%) | 8,135 (87.1%) |
| 18 to 24 Years | 30,312 (84.0%) | 27,821 (79.4%) |
| 25 to 34 Years | 42,227 (91.5%) | 38,950 (88.0%) |
| 35 to 44 Years | 42,097 (90.9%) | 38,248 (88.0%) |
| 45 to 54 Years | 40,410 (93.4%) | 36,800 (90.7%) |
| 55 to 64 Years | 37,221 (91.8%) | 37,958 (90.6%) |
| 65 to 74 Years | 28,976 (92.2%) | 30,495 (91.3%) |
| 75 Years and over | 16,006 (91.8%) | 21,281 (89.1%) |
| Total | 308,304 (89.2%) | 299,792 (87.4%) |
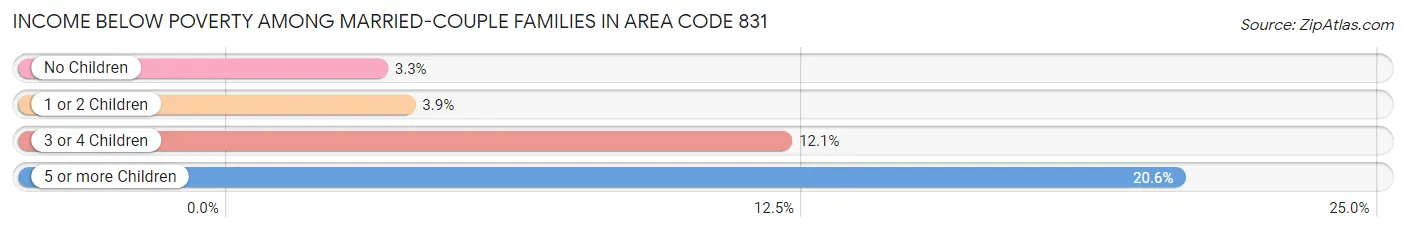
Income Below Poverty Among Married-Couple Families in Area Code 831
The poverty statistics for married-couple families in Area Code 831 show that 4.5% or 5,259 of the total 116,934 families live below the poverty line. Families with 5 or more children have the highest poverty rate of 20.6%, comprising of 211 families. On the other hand, families with no children have the lowest poverty rate of 3.3%, which includes 2,091 families.
| Children | Above Poverty | Below Poverty |
| No Children | 62,148 (96.7%) | 2,091 (3.3%) |
| 1 or 2 Children | 38,415 (96.1%) | 1,544 (3.9%) |
| 3 or 4 Children | 10,299 (87.9%) | 1,413 (12.1%) |
| 5 or more Children | 813 (79.4%) | 211 (20.6%) |
| Total | 111,675 (95.5%) | 5,259 (4.5%) |
Income Below Poverty Among Single-Parent Households in Area Code 831
According to the poverty data in Area Code 831, 10.0% or 1,394 single-father households and 20.5% or 5,744 single-mother households are living below the poverty line. Among single-father households, those with 3 or 4 children have the highest poverty rate, with 313 households (17.8%) experiencing poverty. Likewise, among single-mother households, those with 3 or 4 children have the highest poverty rate, with 1,989 households (53.0%) falling below the poverty line.
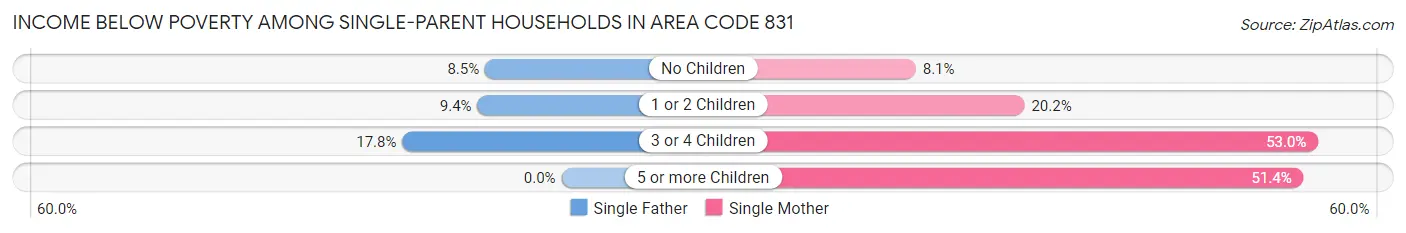
| Children | Single Father | Single Mother |
| No Children | 506 (8.5%) | 879 (8.1%) |
| 1 or 2 Children | 575 (9.4%) | 2,564 (20.2%) |
| 3 or 4 Children | 313 (17.8%) | 1,989 (53.0%) |
| 5 or more Children | 0 (0.0%) | 312 (51.4%) |
| Total | 1,394 (10.0%) | 5,744 (20.5%) |
Income Below Poverty Among Married-Couple vs Single-Parent Households in Area Code 831
The poverty data for Area Code 831 shows that 5,259 of the married-couple family households (4.5%) and 7,138 of the single-parent households (17.1%) are living below the poverty level. Within the married-couple family households, those with 5 or more children have the highest poverty rate, with 211 households (20.6%) falling below the poverty line. Among the single-parent households, those with 5 or more children have the highest poverty rate, with 312 household (44.4%) living below poverty.
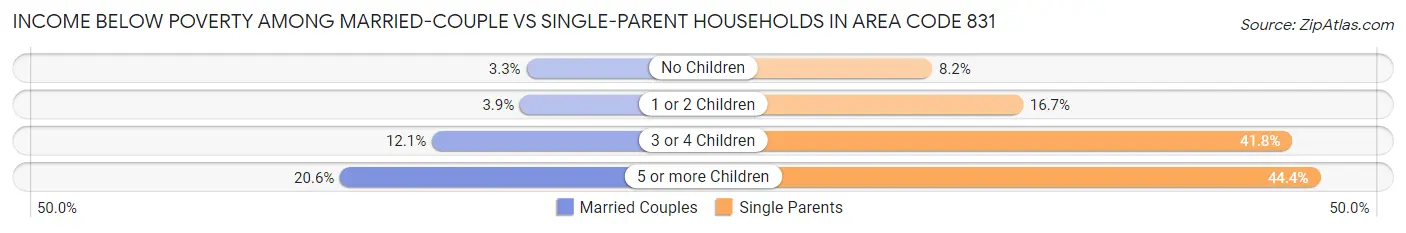
| Children | Married-Couple Families | Single-Parent Households |
| No Children | 2,091 (3.3%) | 1,385 (8.2%) |
| 1 or 2 Children | 1,544 (3.9%) | 3,139 (16.7%) |
| 3 or 4 Children | 1,413 (12.1%) | 2,302 (41.8%) |
| 5 or more Children | 211 (20.6%) | 312 (44.4%) |
| Total | 5,259 (4.5%) | 7,138 (17.1%) |
Race in Area Code 831
The most populous races in Area Code 831 are Hispanic or Latino (375,770 | 52.6%), White / Caucasian (352,015 | 49.3%), and Some other Race (214,945 | 30.1%).
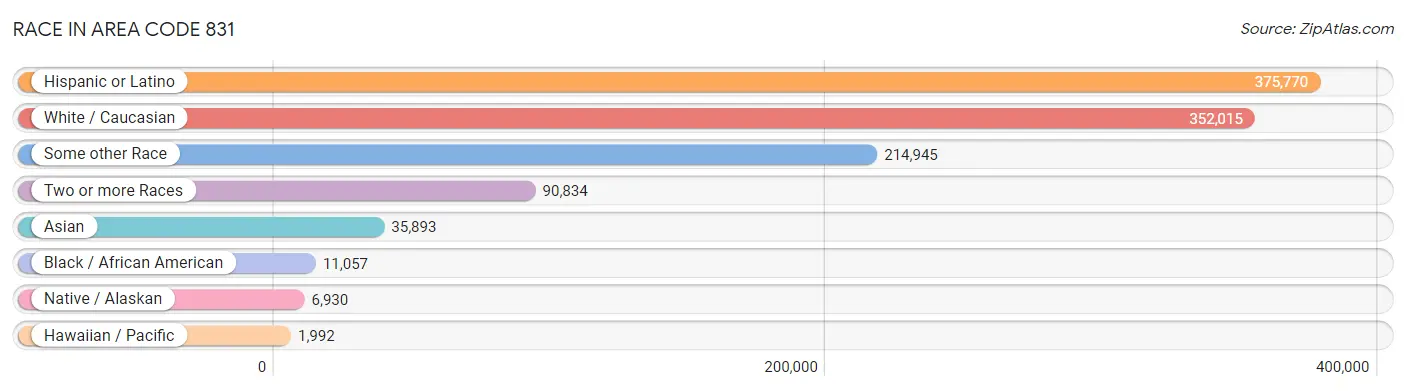
| Race | # Population | % Population |
| Asian | 35,893 | 5.0% |
| Black / African American | 11,057 | 1.5% |
| Hawaiian / Pacific | 1,992 | 0.3% |
| Hispanic or Latino | 375,770 | 52.6% |
| Native / Alaskan | 6,930 | 1.0% |
| White / Caucasian | 352,015 | 49.3% |
| Two or more Races | 90,834 | 12.7% |
| Some other Race | 214,945 | 30.1% |
| Total | 713,666 | 100.0% |
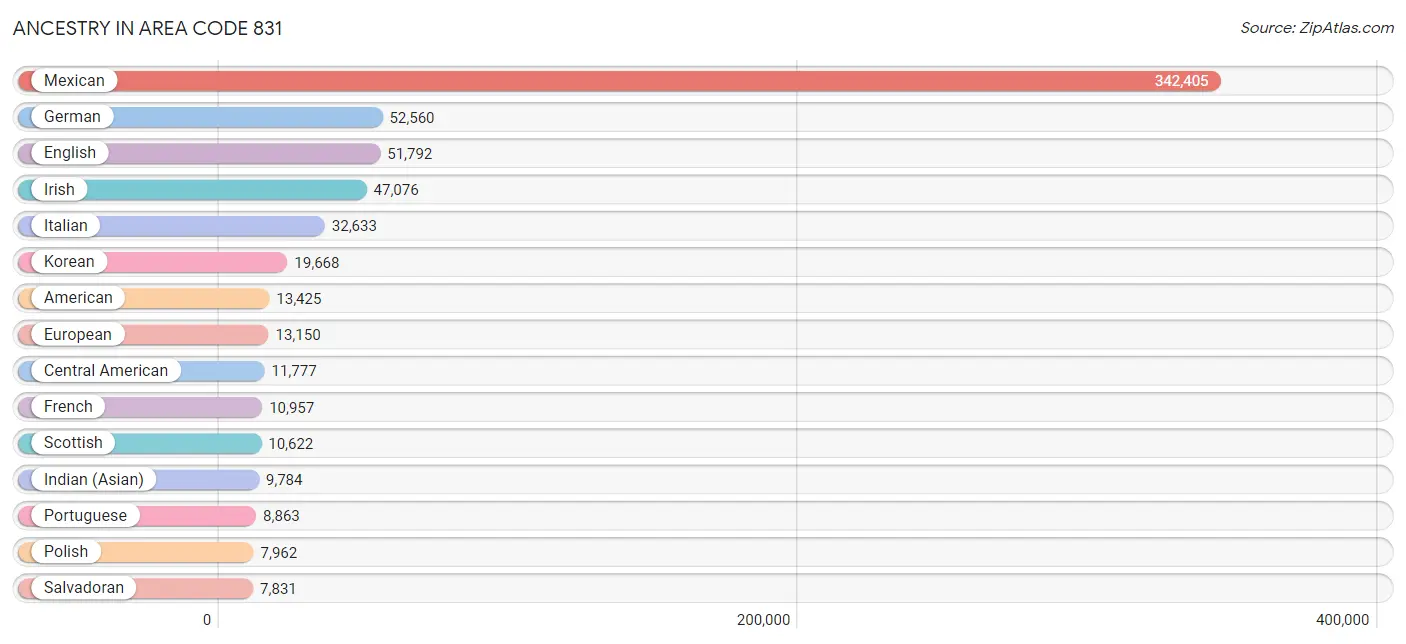
Ancestry in Area Code 831
The most populous ancestries reported in Area Code 831 are Mexican (342,405 | 48.0%), German (52,560 | 7.4%), English (51,792 | 7.3%), Irish (47,076 | 6.6%), and Italian (32,633 | 4.6%), together accounting for 73.8% of all Area Code 831 residents.
| Ancestry | # Population | % Population |
| Afghan | 310 | 0.0% |
| African | 1,799 | 0.3% |
| Alaska Native | 25 | 0.0% |
| Albanian | 27 | 0.0% |
| Alsatian | 52 | 0.0% |
| American | 13,425 | 1.9% |
| Apache | 772 | 0.1% |
| Arab | 3,544 | 0.5% |
| Arapaho | 16 | 0.0% |
| Argentinean | 1,187 | 0.2% |
| Armenian | 1,095 | 0.2% |
| Assyrian / Chaldean / Syriac | 127 | 0.0% |
| Australian | 158 | 0.0% |
| Austrian | 1,222 | 0.2% |
| Bahamian | 2 | 0.0% |
| Bangladeshi | 180 | 0.0% |
| Barbadian | 45 | 0.0% |
| Basque | 215 | 0.0% |
| Belgian | 401 | 0.1% |
| Belizean | 99 | 0.0% |
| Bhutanese | 6,969 | 1.0% |
| Blackfeet | 674 | 0.1% |
| Bolivian | 116 | 0.0% |
| Brazilian | 564 | 0.1% |
| British | 4,292 | 0.6% |
| British West Indian | 22 | 0.0% |
| Bulgarian | 59 | 0.0% |
| Burmese | 3,979 | 0.6% |
| Cajun | 59 | 0.0% |
| Cambodian | 98 | 0.0% |
| Canadian | 906 | 0.1% |
| Cape Verdean | 69 | 0.0% |
| Celtic | 175 | 0.0% |
| Central American | 11,777 | 1.7% |
| Central American Indian | 825 | 0.1% |
| Cherokee | 2,274 | 0.3% |
| Chickasaw | 152 | 0.0% |
| Chilean | 322 | 0.1% |
| Chippewa | 181 | 0.0% |
| Choctaw | 691 | 0.1% |
| Colombian | 533 | 0.1% |
| Comanche | 95 | 0.0% |
| Costa Rican | 226 | 0.0% |
| Cree | 32 | 0.0% |
| Creek | 19 | 0.0% |
| Croatian | 1,204 | 0.2% |
| Cuban | 1,456 | 0.2% |
| Czech | 2,216 | 0.3% |
| Czechoslovakian | 230 | 0.0% |
| Danish | 3,925 | 0.5% |
| Dominican | 184 | 0.0% |
| Dutch | 5,842 | 0.8% |
| Dutch West Indian | 20 | 0.0% |
| Eastern European | 2,077 | 0.3% |
| Ecuadorian | 453 | 0.1% |
| Egyptian | 479 | 0.1% |
| English | 51,792 | 7.3% |
| Estonian | 121 | 0.0% |
| Ethiopian | 72 | 0.0% |
| European | 13,150 | 1.8% |
| Filipino | 591 | 0.1% |
| Finnish | 1,030 | 0.1% |
| French | 10,957 | 1.5% |
| French American Indian | 105 | 0.0% |
| French Canadian | 2,140 | 0.3% |
| German | 52,560 | 7.4% |
| German Russian | 111 | 0.0% |
| Greek | 1,768 | 0.3% |
| Guamanian / Chamorro | 499 | 0.1% |
| Guatemalan | 1,756 | 0.3% |
| Haitian | 154 | 0.0% |
| Honduran | 957 | 0.1% |
| Hopi | 70 | 0.0% |
| Hungarian | 1,499 | 0.2% |
| Icelander | 314 | 0.0% |
| Indian (Asian) | 9,784 | 1.4% |
| Indonesian | 103 | 0.0% |
| Inupiat | 77 | 0.0% |
| Iranian | 1,171 | 0.2% |
| Iraqi | 198 | 0.0% |
| Irish | 47,076 | 6.6% |
| Iroquois | 78 | 0.0% |
| Israeli | 183 | 0.0% |
| Italian | 32,633 | 4.6% |
| Jamaican | 211 | 0.0% |
| Japanese | 266 | 0.0% |
| Jordanian | 6 | 0.0% |
| Kenyan | 37 | 0.0% |
| Kiowa | 20 | 0.0% |
| Korean | 19,668 | 2.8% |
| Laotian | 193 | 0.0% |
| Latvian | 121 | 0.0% |
| Lebanese | 961 | 0.1% |
| Lithuanian | 885 | 0.1% |
| Lumbee | 3 | 0.0% |
| Luxembourger | 139 | 0.0% |
| Macedonian | 143 | 0.0% |
| Malaysian | 119 | 0.0% |
| Maltese | 52 | 0.0% |
| Menominee | 20 | 0.0% |
| Mexican | 342,405 | 48.0% |
| Mexican American Indian | 4,236 | 0.6% |
| Mongolian | 74 | 0.0% |
| Moroccan | 52 | 0.0% |
| Native Hawaiian | 2,006 | 0.3% |
| Navajo | 282 | 0.0% |
| New Zealander | 75 | 0.0% |
| Nicaraguan | 637 | 0.1% |
| Nigerian | 242 | 0.0% |
| Northern European | 1,949 | 0.3% |
| Norwegian | 7,822 | 1.1% |
| Okinawan | 4 | 0.0% |
| Osage | 18 | 0.0% |
| Ottawa | 31 | 0.0% |
| Paiute | 127 | 0.0% |
| Pakistani | 621 | 0.1% |
| Palestinian | 218 | 0.0% |
| Panamanian | 307 | 0.0% |
| Paraguayan | 69 | 0.0% |
| Pennsylvania German | 47 | 0.0% |
| Peruvian | 724 | 0.1% |
| Pima | 5 | 0.0% |
| Polish | 7,962 | 1.1% |
| Portuguese | 8,863 | 1.2% |
| Potawatomi | 86 | 0.0% |
| Pueblo | 102 | 0.0% |
| Puerto Rican | 4,214 | 0.6% |
| Romanian | 628 | 0.1% |
| Russian | 5,081 | 0.7% |
| Salvadoran | 7,831 | 1.1% |
| Samoan | 961 | 0.1% |
| Scandinavian | 1,764 | 0.3% |
| Scotch-Irish | 4,767 | 0.7% |
| Scottish | 10,622 | 1.5% |
| Seminole | 31 | 0.0% |
| Serbian | 387 | 0.1% |
| Shoshone | 65 | 0.0% |
| Sierra Leonean | 13 | 0.0% |
| Sioux | 296 | 0.0% |
| Slavic | 134 | 0.0% |
| Slovak | 646 | 0.1% |
| Slovene | 243 | 0.0% |
| Somali | 20 | 0.0% |
| South African | 178 | 0.0% |
| South American | 3,985 | 0.6% |
| South American Indian | 42 | 0.0% |
| Spaniard | 3,696 | 0.5% |
| Spanish | 2,813 | 0.4% |
| Spanish American | 37 | 0.0% |
| Spanish American Indian | 32 | 0.0% |
| Sri Lankan | 2,884 | 0.4% |
| Subsaharan African | 2,561 | 0.4% |
| Sudanese | 12 | 0.0% |
| Swedish | 7,275 | 1.0% |
| Swiss | 3,149 | 0.4% |
| Syrian | 535 | 0.1% |
| Thai | 4,693 | 0.7% |
| Tlingit-Haida | 116 | 0.0% |
| Tohono O'Odham | 10 | 0.0% |
| Tongan | 471 | 0.1% |
| Trinidadian and Tobagonian | 61 | 0.0% |
| Turkish | 572 | 0.1% |
| Ugandan | 21 | 0.0% |
| Ukrainian | 1,271 | 0.2% |
| Uruguayan | 195 | 0.0% |
| Ute | 70 | 0.0% |
| Venezuelan | 386 | 0.1% |
| Vietnamese | 95 | 0.0% |
| Welsh | 3,285 | 0.5% |
| West Indian | 153 | 0.0% |
| Yaqui | 442 | 0.1% |
| Yugoslavian | 272 | 0.0% | View All 172 Rows |
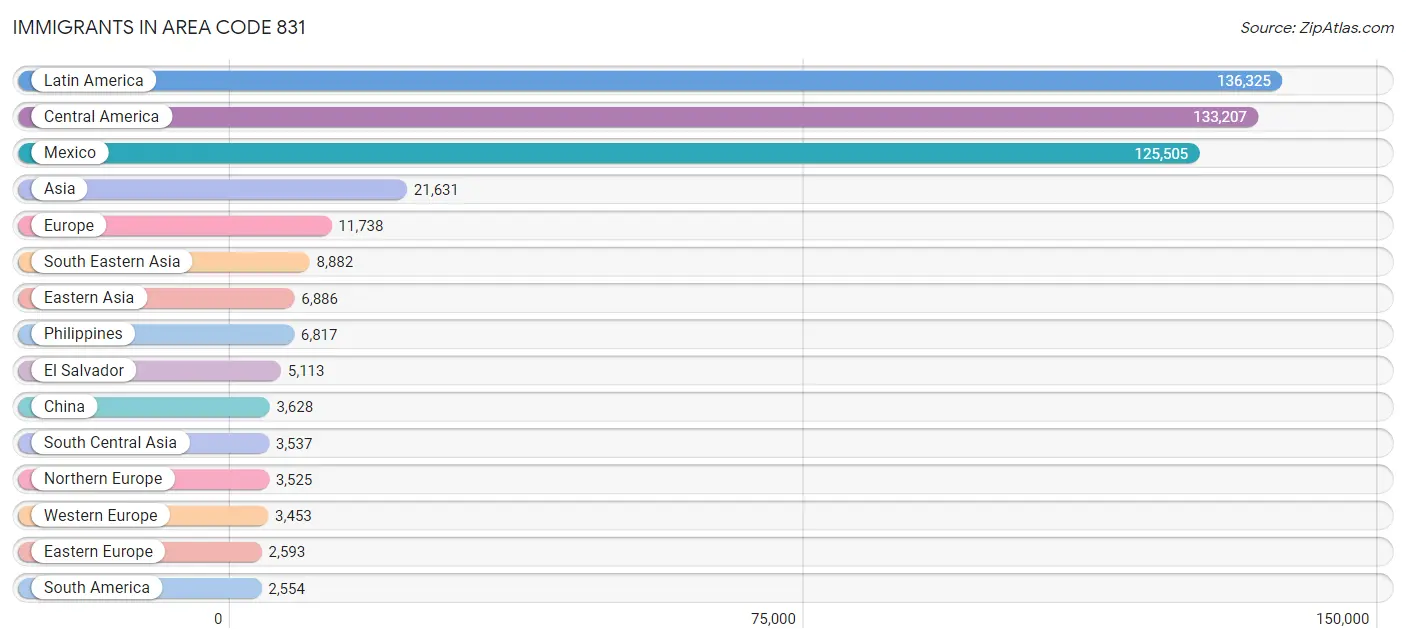
Immigrants in Area Code 831
The most numerous immigrant groups reported in Area Code 831 came from Latin America (136,325 | 19.1%), Central America (133,207 | 18.7%), Mexico (125,505 | 17.6%), Asia (21,631 | 3.0%), and Europe (11,738 | 1.6%), together accounting for 60.0% of all Area Code 831 residents.
| Immigration Origin | # Population | % Population |
| Afghanistan | 181 | 0.0% |
| Africa | 1,089 | 0.2% |
| Argentina | 323 | 0.1% |
| Armenia | 66 | 0.0% |
| Asia | 21,631 | 3.0% |
| Australia | 237 | 0.0% |
| Austria | 117 | 0.0% |
| Azores | 244 | 0.0% |
| Bangladesh | 67 | 0.0% |
| Barbados | 17 | 0.0% |
| Belarus | 149 | 0.0% |
| Belgium | 43 | 0.0% |
| Belize | 78 | 0.0% |
| Bolivia | 18 | 0.0% |
| Bosnia and Herzegovina | 19 | 0.0% |
| Brazil | 563 | 0.1% |
| Bulgaria | 42 | 0.0% |
| Cambodia | 142 | 0.0% |
| Cameroon | 1 | 0.0% |
| Canada | 2,107 | 0.3% |
| Caribbean | 564 | 0.1% |
| Central America | 133,207 | 18.7% |
| Chile | 166 | 0.0% |
| China | 3,628 | 0.5% |
| Colombia | 462 | 0.1% |
| Costa Rica | 117 | 0.0% |
| Croatia | 142 | 0.0% |
| Cuba | 176 | 0.0% |
| Czechoslovakia | 309 | 0.0% |
| Denmark | 58 | 0.0% |
| Dominica | 21 | 0.0% |
| Dominican Republic | 77 | 0.0% |
| Eastern Africa | 237 | 0.0% |
| Eastern Asia | 6,886 | 1.0% |
| Eastern Europe | 2,593 | 0.4% |
| Ecuador | 177 | 0.0% |
| Egypt | 310 | 0.0% |
| El Salvador | 5,113 | 0.7% |
| England | 1,251 | 0.2% |
| Ethiopia | 53 | 0.0% |
| Europe | 11,738 | 1.6% |
| Fiji | 308 | 0.0% |
| France | 421 | 0.1% |
| Germany | 2,277 | 0.3% |
| Ghana | 15 | 0.0% |
| Greece | 54 | 0.0% |
| Guatemala | 1,230 | 0.2% |
| Guyana | 36 | 0.0% |
| Haiti | 11 | 0.0% |
| Honduras | 691 | 0.1% |
| Hong Kong | 204 | 0.0% |
| Hungary | 102 | 0.0% |
| India | 2,166 | 0.3% |
| Indonesia | 137 | 0.0% |
| Iran | 824 | 0.1% |
| Iraq | 243 | 0.0% |
| Ireland | 173 | 0.0% |
| Israel | 251 | 0.0% |
| Italy | 759 | 0.1% |
| Jamaica | 90 | 0.0% |
| Japan | 1,126 | 0.2% |
| Jordan | 34 | 0.0% |
| Kazakhstan | 23 | 0.0% |
| Kenya | 62 | 0.0% |
| Korea | 2,028 | 0.3% |
| Kuwait | 58 | 0.0% |
| Laos | 44 | 0.0% |
| Latin America | 136,325 | 19.1% |
| Latvia | 20 | 0.0% |
| Lebanon | 415 | 0.1% |
| Lithuania | 2 | 0.0% |
| Malaysia | 89 | 0.0% |
| Mexico | 125,505 | 17.6% |
| Micronesia | 20 | 0.0% |
| Middle Africa | 1 | 0.0% |
| Moldova | 60 | 0.0% |
| Morocco | 15 | 0.0% |
| Nepal | 88 | 0.0% |
| Netherlands | 524 | 0.1% |
| Nicaragua | 355 | 0.1% |
| Nigeria | 38 | 0.0% |
| Northern Africa | 438 | 0.1% |
| Northern Europe | 3,525 | 0.5% |
| Norway | 103 | 0.0% |
| Oceania | 1,119 | 0.2% |
| Pakistan | 129 | 0.0% |
| Panama | 118 | 0.0% |
| Peru | 552 | 0.1% |
| Philippines | 6,817 | 1.0% |
| Poland | 272 | 0.0% |
| Portugal | 1,073 | 0.2% |
| Romania | 261 | 0.0% |
| Russia | 570 | 0.1% |
| Saudi Arabia | 16 | 0.0% |
| Scotland | 321 | 0.0% |
| Senegal | 23 | 0.0% |
| Serbia | 118 | 0.0% |
| Sierra Leone | 11 | 0.0% |
| Singapore | 195 | 0.0% |
| South Africa | 239 | 0.0% |
| South America | 2,554 | 0.4% |
| South Central Asia | 3,537 | 0.5% |
| South Eastern Asia | 8,882 | 1.2% |
| Southern Europe | 2,142 | 0.3% |
| Spain | 256 | 0.0% |
| Sri Lanka | 39 | 0.0% |
| Sudan | 15 | 0.0% |
| Sweden | 286 | 0.0% |
| Switzerland | 71 | 0.0% |
| Syria | 498 | 0.1% |
| Taiwan | 465 | 0.1% |
| Thailand | 315 | 0.0% |
| Trinidad and Tobago | 172 | 0.0% |
| Turkey | 250 | 0.0% |
| Uganda | 25 | 0.0% |
| Ukraine | 215 | 0.0% |
| Uruguay | 39 | 0.0% |
| Uzbekistan | 20 | 0.0% |
| Venezuela | 178 | 0.0% |
| Vietnam | 1,130 | 0.2% |
| Western Africa | 127 | 0.0% |
| Western Asia | 2,184 | 0.3% |
| Western Europe | 3,453 | 0.5% |
| Yemen | 220 | 0.0% |
| Zimbabwe | 48 | 0.0% | View All 125 Rows |
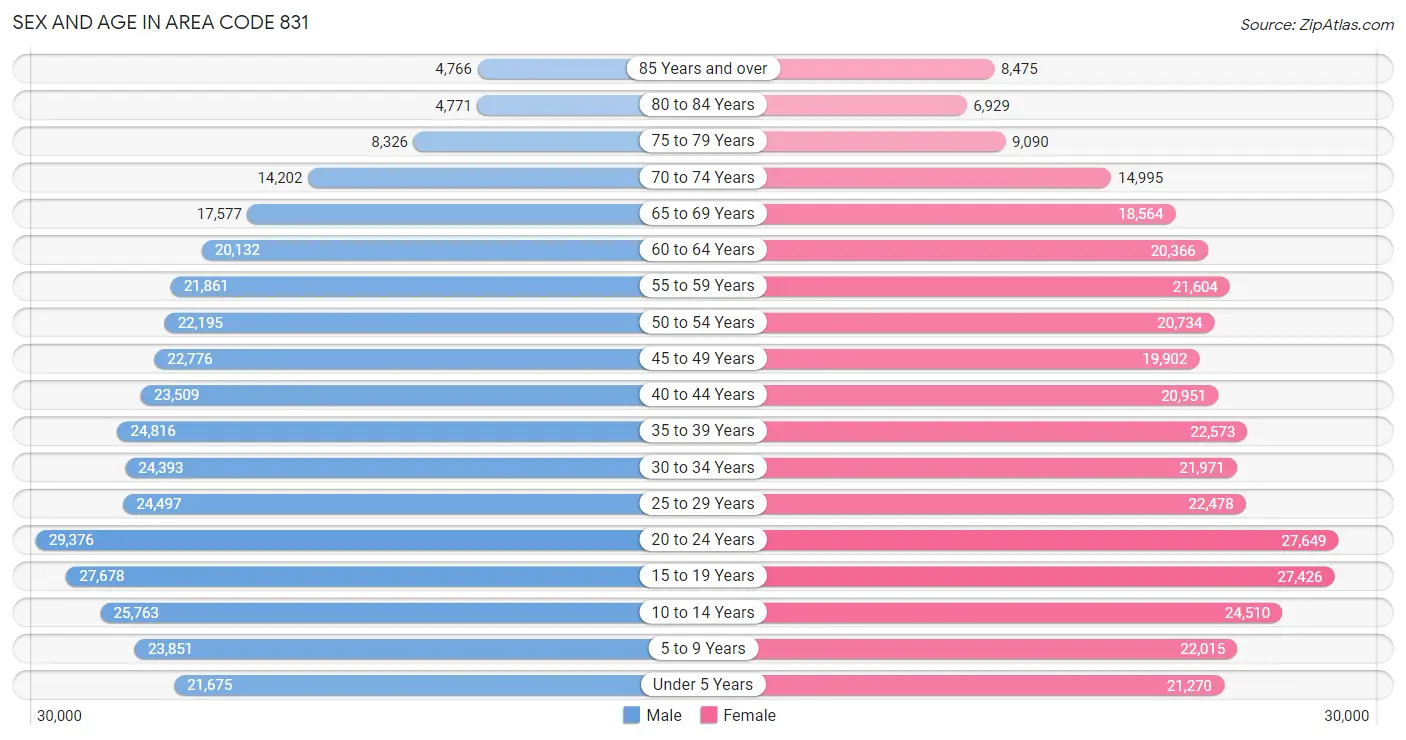
Sex and Age in Area Code 831
Sex and Age in Area Code 831
The most populous age groups in Area Code 831 are 20 to 24 Years (29,376 | 8.1%) for men and 20 to 24 Years (27,649 | 7.9%) for women.
| Age Bracket | Male | Female |
| Under 5 Years | 21,675 (6.0%) | 21,270 (6.0%) |
| 5 to 9 Years | 23,851 (6.6%) | 22,015 (6.3%) |
| 10 to 14 Years | 25,763 (7.1%) | 24,510 (7.0%) |
| 15 to 19 Years | 27,678 (7.6%) | 27,426 (7.8%) |
| 20 to 24 Years | 29,376 (8.1%) | 27,649 (7.9%) |
| 25 to 29 Years | 24,497 (6.8%) | 22,478 (6.4%) |
| 30 to 34 Years | 24,393 (6.7%) | 21,971 (6.2%) |
| 35 to 39 Years | 24,816 (6.9%) | 22,573 (6.4%) |
| 40 to 44 Years | 23,509 (6.5%) | 20,951 (6.0%) |
| 45 to 49 Years | 22,776 (6.3%) | 19,902 (5.7%) |
| 50 to 54 Years | 22,195 (6.1%) | 20,734 (5.9%) |
| 55 to 59 Years | 21,861 (6.0%) | 21,604 (6.1%) |
| 60 to 64 Years | 20,132 (5.6%) | 20,366 (5.8%) |
| 65 to 69 Years | 17,577 (4.9%) | 18,564 (5.3%) |
| 70 to 74 Years | 14,202 (3.9%) | 14,995 (4.3%) |
| 75 to 79 Years | 8,326 (2.3%) | 9,090 (2.6%) |
| 80 to 84 Years | 4,771 (1.3%) | 6,929 (2.0%) |
| 85 Years and over | 4,766 (1.3%) | 8,475 (2.4%) |
| Total | 362,164 (100.0%) | 351,502 (100.0%) |
Families and Households in Area Code 831
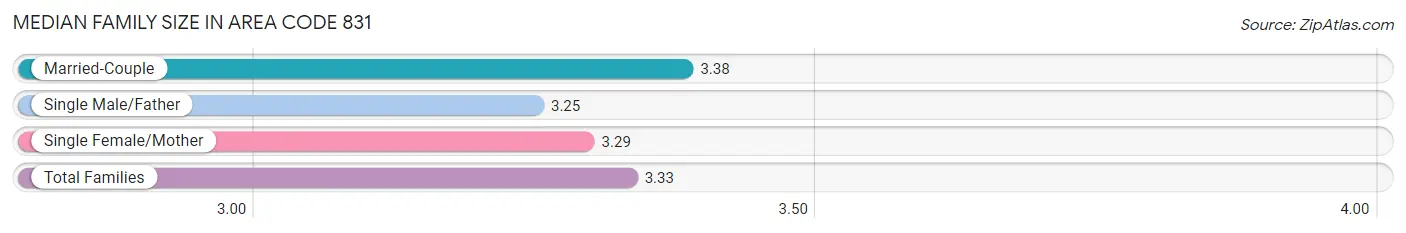
Median Family Size in Area Code 831
The median family size in Area Code 831 is 3.33 persons per family, with married-couple families (116,934 | 73.6%) accounting for the largest median family size of 3.38166 persons per family. On the other hand, single male/father families (13,902 | 8.7%) represent the smallest median family size with 3.25 persons per family.
| Family Type | # Families | Family Size |
| Married-Couple | 116,934 (73.6%) | 3.38 |
| Single Male/Father | 13,902 (8.7%) | 3.25 |
| Single Female/Mother | 27,954 (17.6%) | 3.29 |
| Total Families | 158,790 (100.0%) | 3.33 |
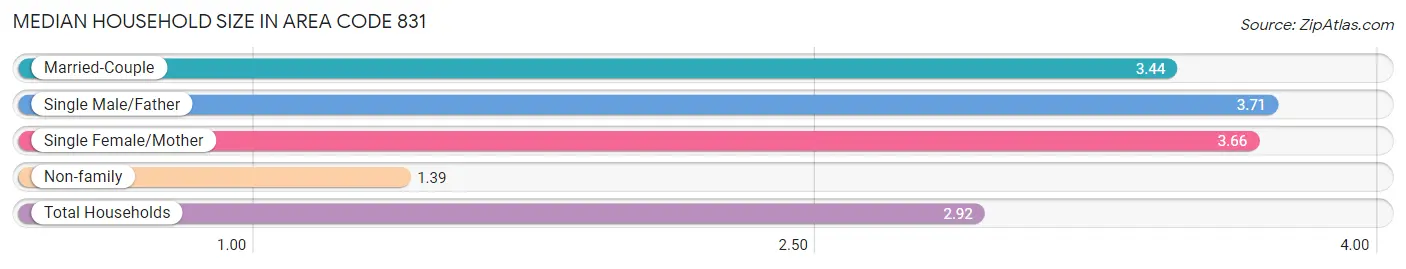
Median Household Size in Area Code 831
The median household size in Area Code 831 is 2.92 persons per household, with single male/father households (13,902 | 6.1%) accounting for the largest median household size of 3.70837 persons per household. non-family households (67,838 | 29.9%) represent the smallest median household size with 1.39 persons per household.
| Household Type | # Households | Household Size |
| Married-Couple | 116,934 (51.6%) | 3.44 |
| Single Male/Father | 13,902 (6.1%) | 3.71 |
| Single Female/Mother | 27,954 (12.3%) | 3.66 |
| Non-family | 67,838 (29.9%) | 1.39 |
| Total Households | 226,628 (100.0%) | 2.92 |
Household Size by Marriage Status in Area Code 831
Out of a total of 226,628 households in Area Code 831, 158,790 (70.1%) are family households, while 67,838 (29.9%) are nonfamily households. The most numerous type of family households are 2-person households, comprising 54,750, and the most common type of nonfamily households are 1-person households, comprising 48,452.
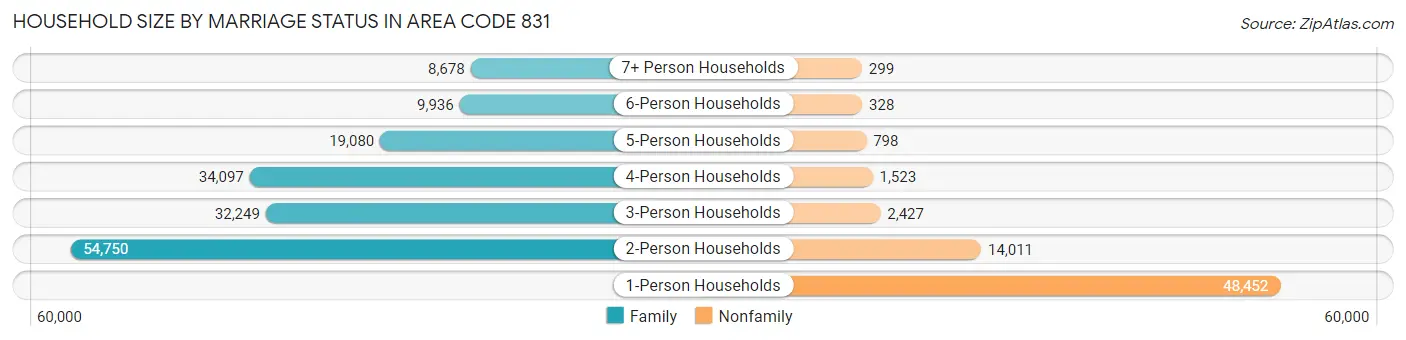
| Household Size | Family Households | Nonfamily Households |
| 1-Person Households | - | 48,452 (21.4%) |
| 2-Person Households | 54,750 (24.2%) | 14,011 (6.2%) |
| 3-Person Households | 32,249 (14.2%) | 2,427 (1.1%) |
| 4-Person Households | 34,097 (15.0%) | 1,523 (0.7%) |
| 5-Person Households | 19,080 (8.4%) | 798 (0.4%) |
| 6-Person Households | 9,936 (4.4%) | 328 (0.1%) |
| 7+ Person Households | 8,678 (3.8%) | 299 (0.1%) |
| Total | 158,790 (70.1%) | 67,838 (29.9%) |
Female Fertility in Area Code 831
Fertility by Age in Area Code 831
Average fertility rate in Area Code 831 is 56.9 births per 1,000 women. Women in the age bracket of 20 to 34 years have the highest fertility rate with 98.3 births per 1,000 women. Women in the age bracket of 20 to 34 years acount for 60.8% of all women with births.
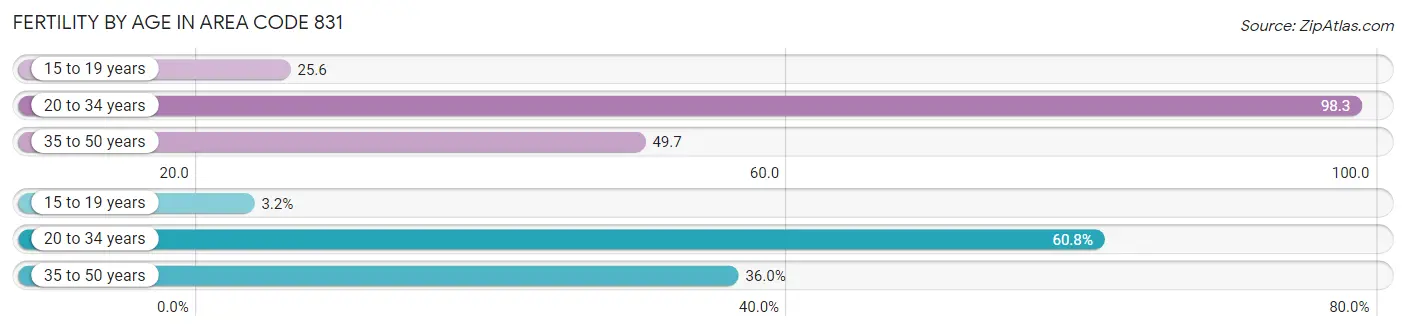
| Age Bracket | Women with Births | Births / 1,000 Women |
| 15 to 19 years | 244 (3.2%) | 25.6 |
| 20 to 34 years | 4,708 (60.8%) | 98.3 |
| 35 to 50 years | 2,786 (36.0%) | 49.7 |
| Total | 7,738 (100.0%) | 56.9 |
Fertility by Age by Marriage Status in Area Code 831
65.5% of women with births (7,738) in Area Code 831 are married. The highest percentage of unmarried women with births falls into 15 to 19 years age bracket with 100.0% of them unmarried at the time of birth, while the lowest percentage of unmarried women with births belong to 35 to 50 years age bracket with 23.1% of them unmarried.
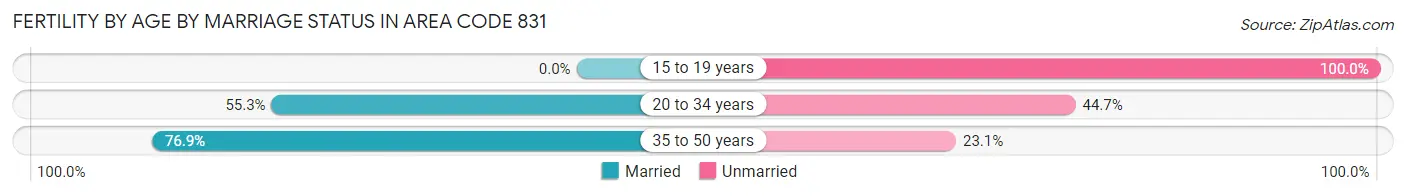
| Age Bracket | Married | Unmarried |
| 15 to 19 years | 0 (0.0%) | 244 (100.0%) |
| 20 to 34 years | 2,602 (55.3%) | 2,106 (44.7%) |
| 35 to 50 years | 2,143 (76.9%) | 643 (23.1%) |
| Total | 5,067 (65.5%) | 2,671 (34.5%) |
Fertility by Education in Area Code 831
Average fertility rate in Area Code 831 is 56.9 births per 1,000 women. Women with the education attainment of bachelor's degree have the highest fertility rate of 115.3 births per 1,000 women, while women with the education attainment of less than high school have the lowest fertility at 46.1 births per 1,000 women. Women with the education attainment of college or associate's degree represent 29.7% of all women with births.
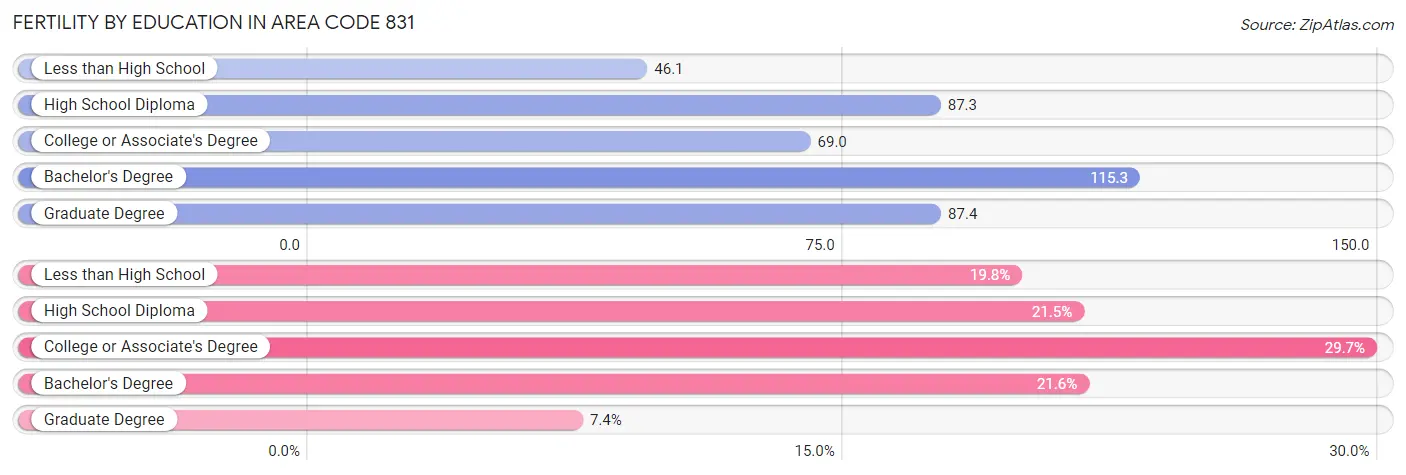
| Educational Attainment | Women with Births | Births / 1,000 Women |
| Less than High School | 1,528 (19.8%) | 46.1 |
| High School Diploma | 1,663 (21.5%) | 87.3 |
| College or Associate's Degree | 2,300 (29.7%) | 69.0 |
| Bachelor's Degree | 1,674 (21.6%) | 115.3 |
| Graduate Degree | 573 (7.4%) | 87.4 |
| Total | 7,738 (100.0%) | 56.9 |
Fertility by Education by Marriage Status in Area Code 831
34.5% of women with births in Area Code 831 are unmarried. Women with the educational attainment of graduate degree are most likely to be married with 66.1% of them married at childbirth, while women with the educational attainment of less than high school are least likely to be married with 73.0% of them unmarried at childbirth.
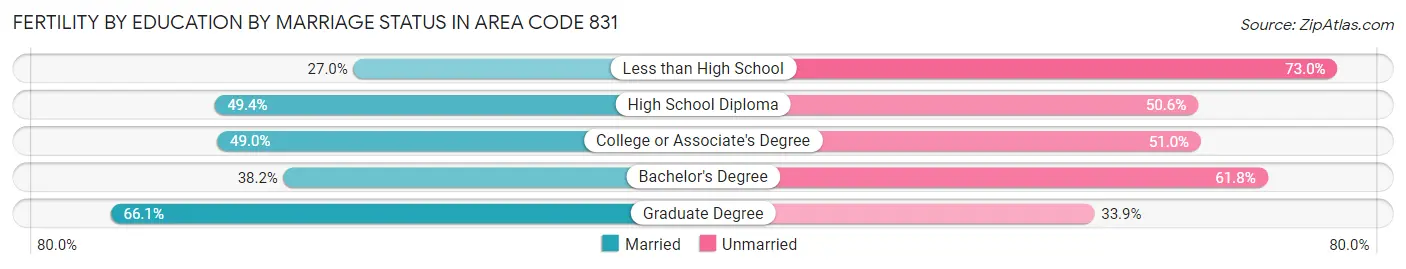
| Educational Attainment | Married | Unmarried |
| Less than High School | 412 (27.0%) | 1,116 (73.0%) |
| High School Diploma | 822 (49.4%) | 841 (50.6%) |
| College or Associate's Degree | 1,126 (49.0%) | 1,174 (51.0%) |
| Bachelor's Degree | 640 (38.2%) | 1,034 (61.8%) |
| Graduate Degree | 379 (66.1%) | 194 (33.9%) |
| Total | 5,067 (65.5%) | 2,671 (34.5%) |
Employment Characteristics in Area Code 831
Employment by Class of Employer in Area Code 831
Among the 321,942 employed individuals in Area Code 831, private company employees (208,075 | 64.6%), local government employees (29,379 | 9.1%), and self-employed (not incorporated) (25,546 | 7.9%) make up the most common classes of employment.
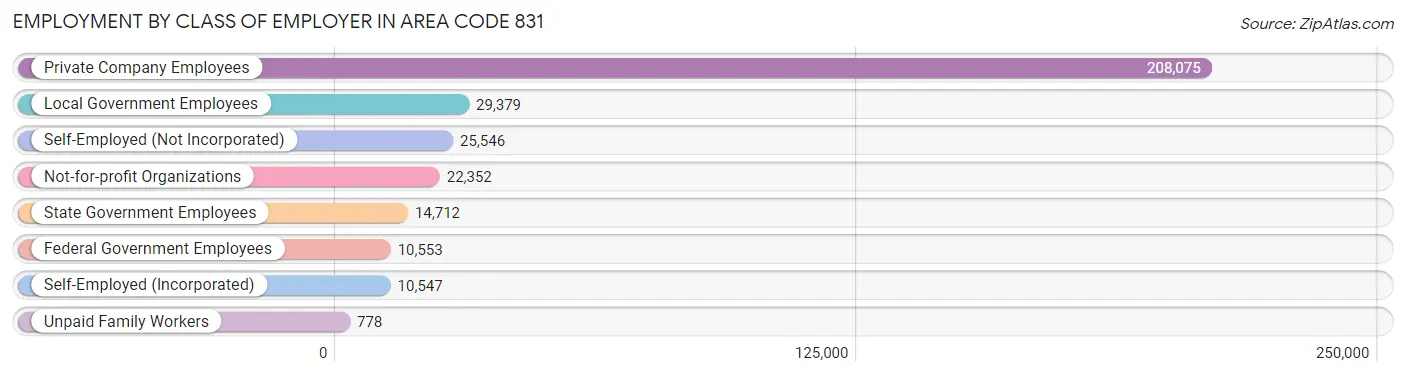
| Employer Class | # Employees | % Employees |
| Private Company Employees | 208,075 | 64.6% |
| Self-Employed (Incorporated) | 10,547 | 3.3% |
| Self-Employed (Not Incorporated) | 25,546 | 7.9% |
| Not-for-profit Organizations | 22,352 | 6.9% |
| Local Government Employees | 29,379 | 9.1% |
| State Government Employees | 14,712 | 4.6% |
| Federal Government Employees | 10,553 | 3.3% |
| Unpaid Family Workers | 778 | 0.2% |
| Total | 321,942 | 100.0% |
Employment Status by Age in Area Code 831
According to the labor force statistics for Area Code 831, out of the total population over 16 years of age (564,339), 62.1% or 350,285 individuals are in the labor force, with 5.6% or 19,721 of them unemployed. The age group with the highest labor force participation rate is 35 to 44 years, with 81.4% or 74,802 individuals in the labor force. Within the labor force, the 16 to 19 years age range has the highest percentage of unemployed individuals, with 578.9% or 88,166 of them being unemployed.
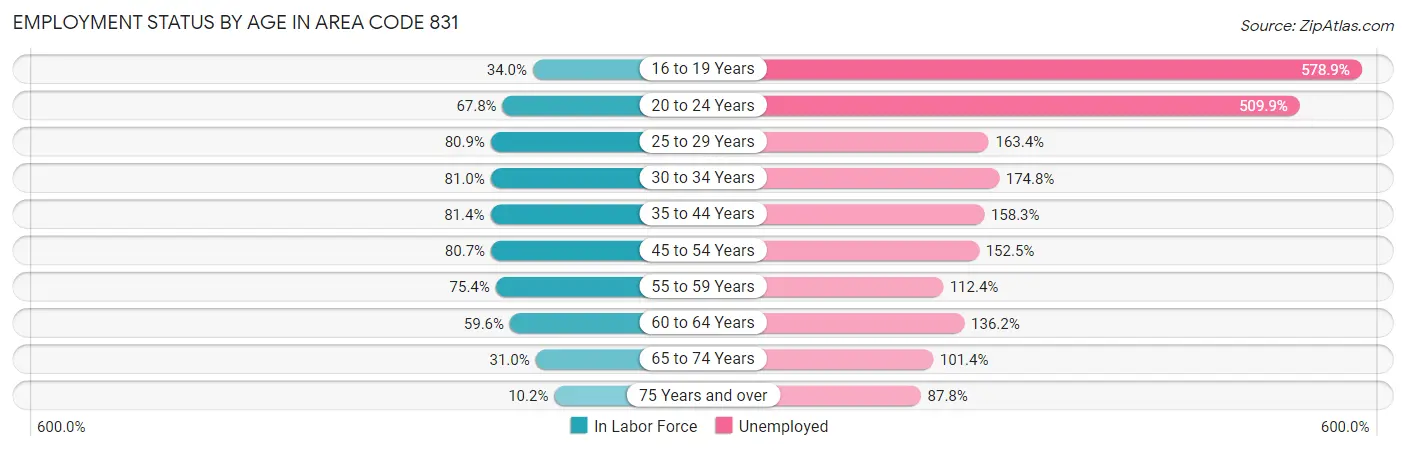
| Age Bracket | In Labor Force | Unemployed |
| 16 to 19 Years | 15,229 (34.0%) | 88,166 (578.9%) |
| 20 to 24 Years | 38,679 (67.8%) | 197,229 (509.9%) |
| 25 to 29 Years | 38,007 (80.9%) | 62,103 (163.4%) |
| 30 to 34 Years | 37,556 (81.0%) | 65,646 (174.8%) |
| 35 to 44 Years | 74,804 (81.4%) | 118,412 (158.3%) |
| 45 to 54 Years | 69,054 (80.7%) | 105,303 (152.5%) |
| 55 to 59 Years | 32,791 (75.4%) | 36,856 (112.4%) |
| 60 to 64 Years | 24,123 (59.6%) | 32,853 (136.2%) |
| 65 to 74 Years | 20,248 (31.0%) | 20,531 (101.4%) |
| 75 Years and over | 4,305 (10.2%) | 3,778 (87.8%) |
| Total | 350,297 (62.1%) | 19,721 (5.6%) |
Employment Status by Educational Attainment in Area Code 831
According to labor force statistics for Area Code 831, 77.0% of individuals (273,199) out of the total population between 25 and 64 years of age (354,758) are in the labor force, with 160.4% or 438,211 of them being unemployed. The group with the highest labor force participation rate are those with the educational attainment of bachelor's degree or higher, with 84.2% or 89,264 individuals in the labor force. Within the labor force, individuals with college / associate degree education have the highest percentage of unemployment, with 224.2% or 168,101 of them being unemployed.
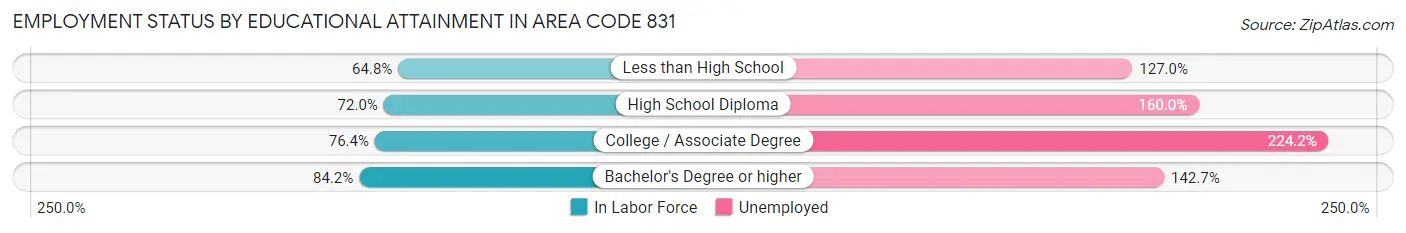
| Educational Attainment | In Labor Force | Unemployed |
| Less than High School | 50,867 (64.8%) | 99,632 (127.0%) |
| High School Diploma | 52,007 (72.0%) | 115,531 (160.0%) |
| College / Associate Degree | 74,980 (76.4%) | 219,911 (224.2%) |
| Bachelor's Degree or higher | 89,269 (84.2%) | 151,282 (142.7%) |
| Total | 273,205 (77.0%) | 569,032 (160.4%) |
Employment Occupations by Sex in Area Code 831
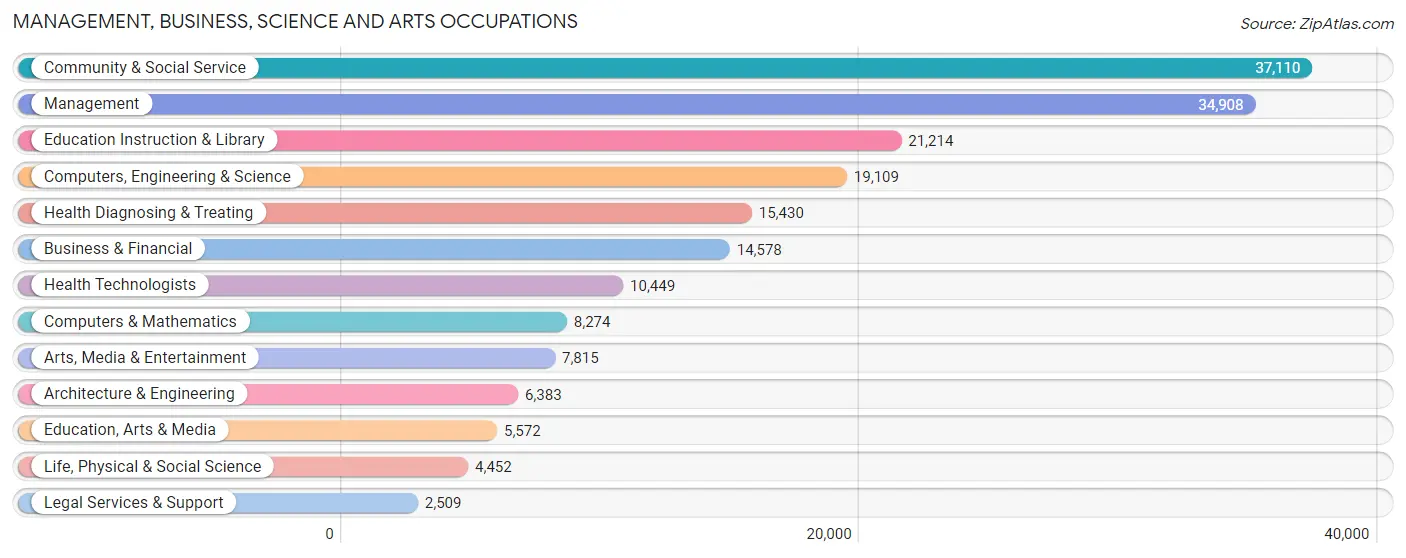
Management, Business, Science and Arts Occupations
The most common Management, Business, Science and Arts occupations in Area Code 831 are Community & Social Service (37,110 | 11.3%), Management (34,908 | 10.6%), Education Instruction & Library (21,214 | 6.5%), Computers, Engineering & Science (19,109 | 5.8%), and Health Diagnosing & Treating (15,430 | 4.7%).
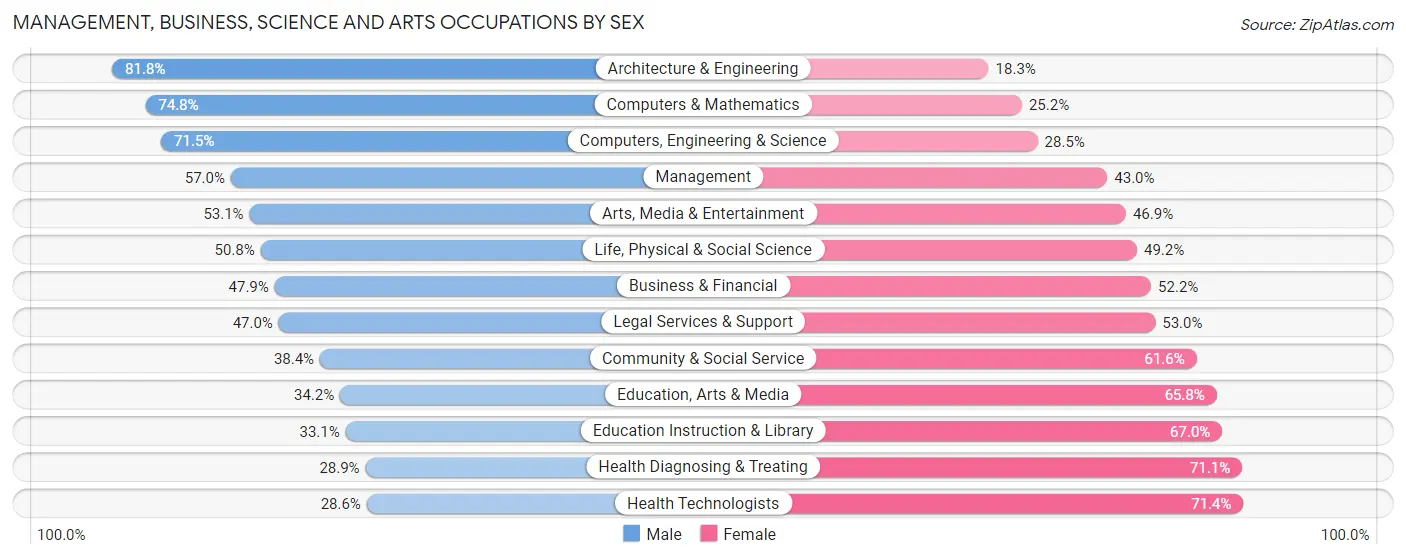
Management, Business, Science and Arts Occupations by Sex
Within the Management, Business, Science and Arts occupations in Area Code 831, the most male-oriented occupations are Architecture & Engineering (81.8%), Computers & Mathematics (74.8%), and Computers, Engineering & Science (71.5%), while the most female-oriented occupations are Health Technologists (71.4%), Health Diagnosing & Treating (71.1%), and Education Instruction & Library (66.9%).
| Occupation | Male | Female |
| Management | 19,893 (57.0%) | 15,015 (43.0%) |
| Business & Financial | 6,976 (47.8%) | 7,602 (52.1%) |
| Computers, Engineering & Science | 13,668 (71.5%) | 5,441 (28.5%) |
| Computers & Mathematics | 6,189 (74.8%) | 2,085 (25.2%) |
| Architecture & Engineering | 5,218 (81.8%) | 1,165 (18.2%) |
| Life, Physical & Social Science | 2,261 (50.8%) | 2,191 (49.2%) |
| Community & Social Service | 14,245 (38.4%) | 22,865 (61.6%) |
| Education, Arts & Media | 1,905 (34.2%) | 3,667 (65.8%) |
| Legal Services & Support | 1,179 (47.0%) | 1,330 (53.0%) |
| Education Instruction & Library | 7,011 (33.1%) | 14,203 (66.9%) |
| Arts, Media & Entertainment | 4,150 (53.1%) | 3,665 (46.9%) |
| Health Diagnosing & Treating | 4,460 (28.9%) | 10,970 (71.1%) |
| Health Technologists | 2,993 (28.6%) | 7,456 (71.4%) |
| Total (Category) | 59,242 (48.9%) | 61,893 (51.1%) |
| Total (Overall) | 179,277 (54.7%) | 148,354 (45.3%) |
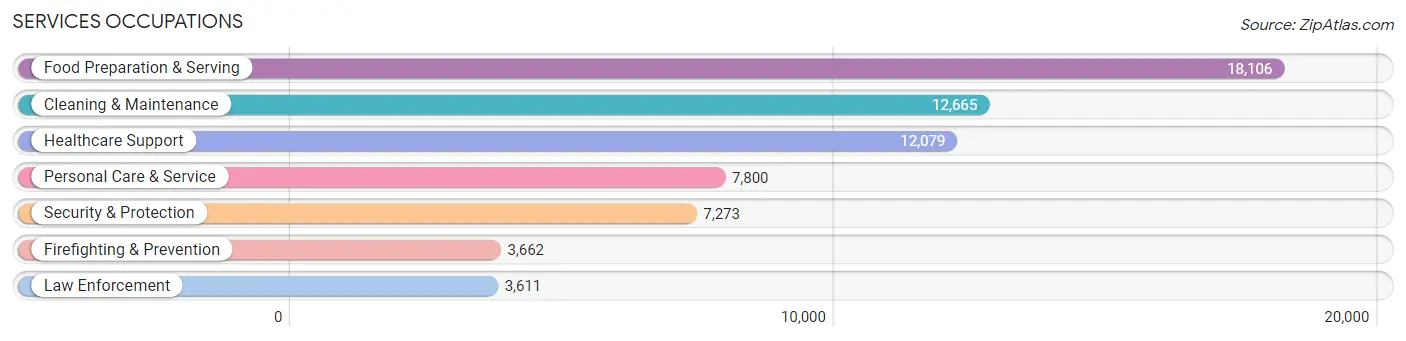
Services Occupations
The most common Services occupations in Area Code 831 are Food Preparation & Serving (18,106 | 5.5%), Cleaning & Maintenance (12,665 | 3.9%), Healthcare Support (12,079 | 3.7%), Personal Care & Service (7,800 | 2.4%), and Security & Protection (7,273 | 2.2%).
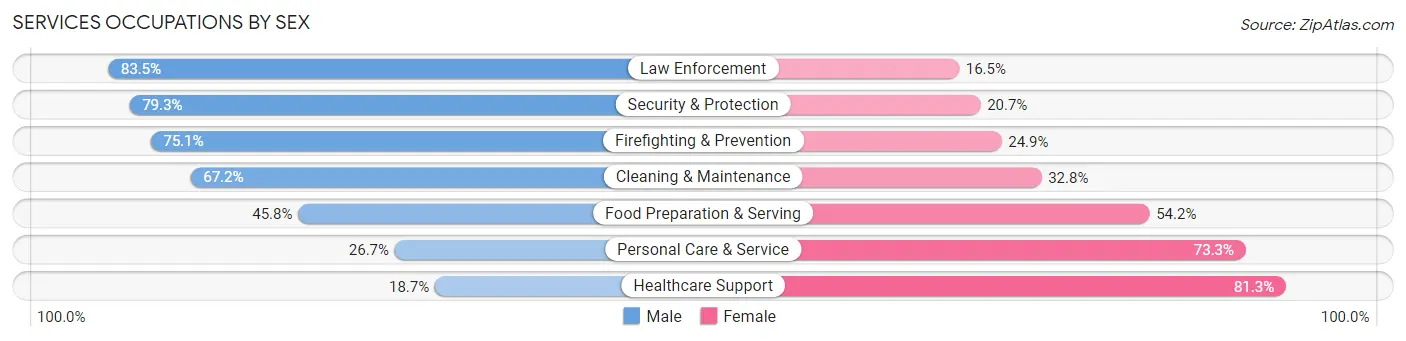
Services Occupations by Sex
Within the Services occupations in Area Code 831, the most male-oriented occupations are Law Enforcement (83.5%), Security & Protection (79.3%), and Firefighting & Prevention (75.1%), while the most female-oriented occupations are Healthcare Support (81.3%), Personal Care & Service (73.3%), and Food Preparation & Serving (54.2%).
| Occupation | Male | Female |
| Healthcare Support | 2,262 (18.7%) | 9,817 (81.3%) |
| Security & Protection | 5,766 (79.3%) | 1,507 (20.7%) |
| Firefighting & Prevention | 2,750 (75.1%) | 912 (24.9%) |
| Law Enforcement | 3,016 (83.5%) | 595 (16.5%) |
| Food Preparation & Serving | 8,293 (45.8%) | 9,813 (54.2%) |
| Cleaning & Maintenance | 8,509 (67.2%) | 4,156 (32.8%) |
| Personal Care & Service | 2,081 (26.7%) | 5,719 (73.3%) |
| Total (Category) | 26,911 (46.5%) | 31,012 (53.5%) |
| Total (Overall) | 179,277 (54.7%) | 148,354 (45.3%) |
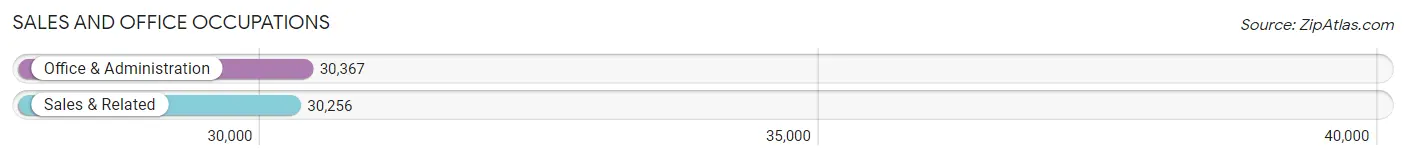
Sales and Office Occupations
The most common Sales and Office occupations in Area Code 831 are Office & Administration (30,367 | 9.3%), and Sales & Related (30,256 | 9.2%).
Sales and Office Occupations by Sex
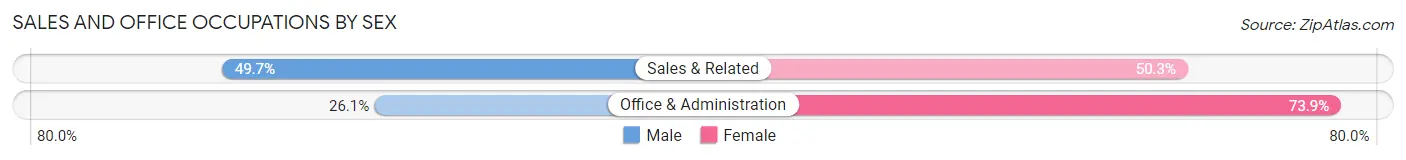
| Occupation | Male | Female |
| Sales & Related | 15,024 (49.7%) | 15,232 (50.3%) |
| Office & Administration | 7,919 (26.1%) | 22,448 (73.9%) |
| Total (Category) | 22,943 (37.9%) | 37,680 (62.2%) |
| Total (Overall) | 179,277 (54.7%) | 148,354 (45.3%) |
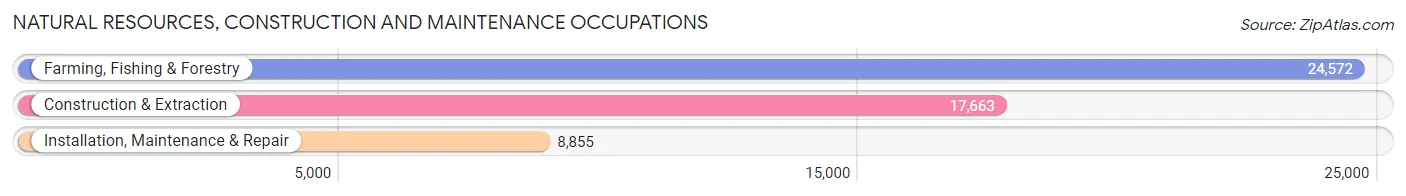
Natural Resources, Construction and Maintenance Occupations
The most common Natural Resources, Construction and Maintenance occupations in Area Code 831 are Farming, Fishing & Forestry (24,572 | 7.5%), Construction & Extraction (17,663 | 5.4%), and Installation, Maintenance & Repair (8,855 | 2.7%).
Natural Resources, Construction and Maintenance Occupations by Sex
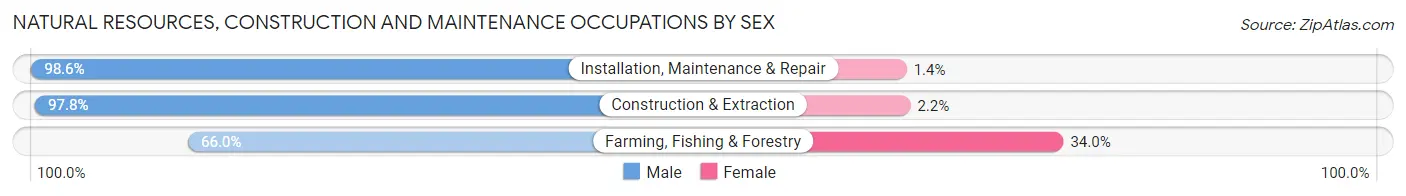
| Occupation | Male | Female |
| Farming, Fishing & Forestry | 16,211 (66.0%) | 8,361 (34.0%) |
| Construction & Extraction | 17,274 (97.8%) | 389 (2.2%) |
| Installation, Maintenance & Repair | 8,730 (98.6%) | 125 (1.4%) |
| Total (Category) | 42,215 (82.6%) | 8,875 (17.4%) |
| Total (Overall) | 179,277 (54.7%) | 148,354 (45.3%) |
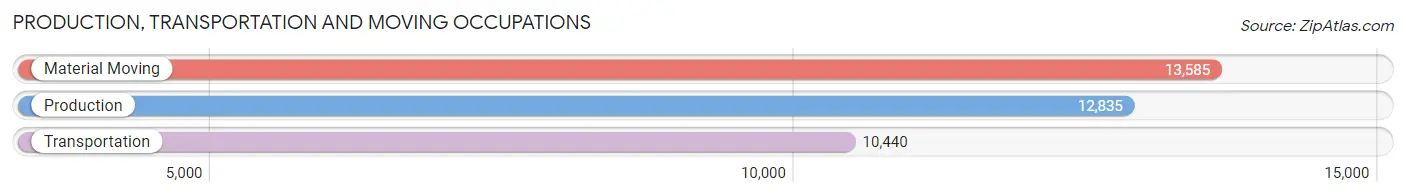
Production, Transportation and Moving Occupations
The most common Production, Transportation and Moving occupations in Area Code 831 are Material Moving (13,585 | 4.2%), Production (12,835 | 3.9%), and Transportation (10,440 | 3.2%).
Production, Transportation and Moving Occupations by Sex
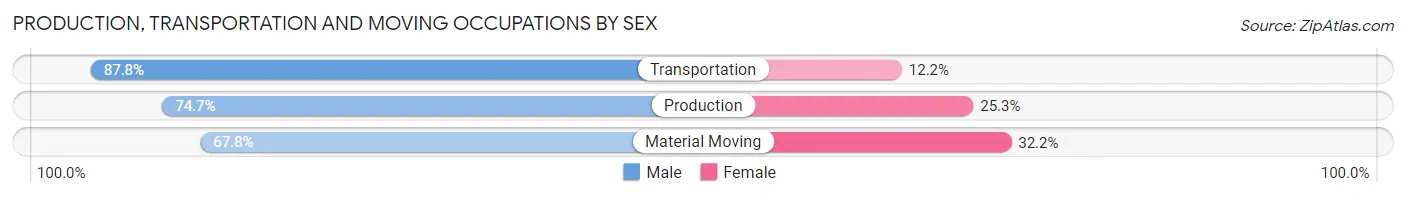
| Occupation | Male | Female |
| Production | 9,592 (74.7%) | 3,243 (25.3%) |
| Transportation | 9,169 (87.8%) | 1,271 (12.2%) |
| Material Moving | 9,205 (67.8%) | 4,380 (32.2%) |
| Total (Category) | 27,966 (75.9%) | 8,894 (24.1%) |
| Total (Overall) | 179,277 (54.7%) | 148,354 (45.3%) |
Employment Industries by Sex in Area Code 831
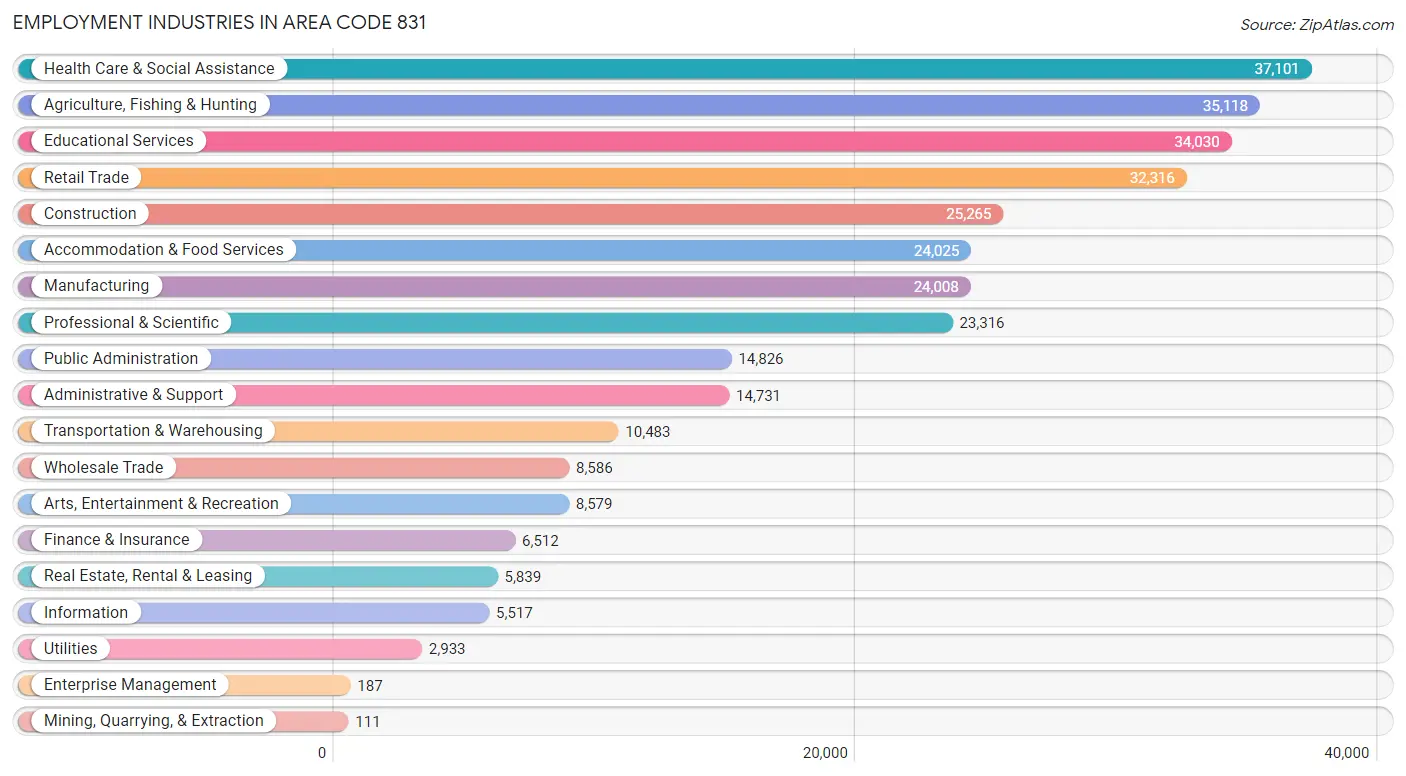
Employment Industries in Area Code 831
The major employment industries in Area Code 831 include Health Care & Social Assistance (37,101 | 11.3%), Agriculture, Fishing & Hunting (35,118 | 10.7%), Educational Services (34,030 | 10.4%), Retail Trade (32,316 | 9.9%), and Construction (25,265 | 7.7%).
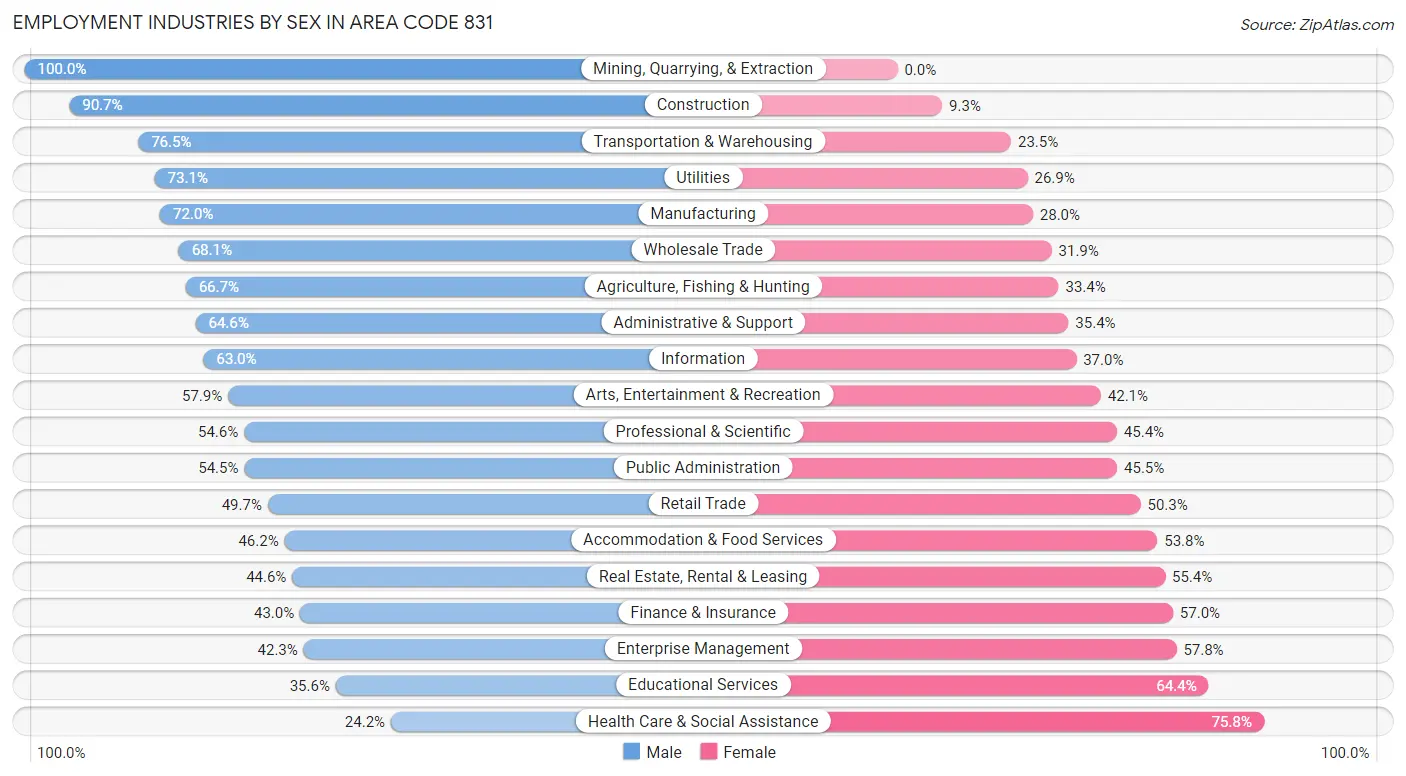
Employment Industries by Sex in Area Code 831
The Area Code 831 industries that see more men than women are Mining, Quarrying, & Extraction (100.0%), Construction (90.7%), and Transportation & Warehousing (76.5%), whereas the industries that tend to have a higher number of women are Health Care & Social Assistance (75.8%), Educational Services (64.4%), and Enterprise Management (57.8%).
| Industry | Male | Female |
| Agriculture, Fishing & Hunting | 23,407 (66.6%) | 11,711 (33.4%) |
| Mining, Quarrying, & Extraction | 111 (100.0%) | 0 (0.0%) |
| Construction | 22,926 (90.7%) | 2,339 (9.3%) |
| Manufacturing | 17,276 (72.0%) | 6,732 (28.0%) |
| Wholesale Trade | 5,846 (68.1%) | 2,740 (31.9%) |
| Retail Trade | 16,052 (49.7%) | 16,264 (50.3%) |
| Transportation & Warehousing | 8,017 (76.5%) | 2,466 (23.5%) |
| Utilities | 2,143 (73.1%) | 790 (26.9%) |
| Information | 3,475 (63.0%) | 2,042 (37.0%) |
| Finance & Insurance | 2,799 (43.0%) | 3,713 (57.0%) |
| Real Estate, Rental & Leasing | 2,605 (44.6%) | 3,234 (55.4%) |
| Professional & Scientific | 12,723 (54.6%) | 10,593 (45.4%) |
| Enterprise Management | 79 (42.2%) | 108 (57.8%) |
| Administrative & Support | 9,517 (64.6%) | 5,214 (35.4%) |
| Educational Services | 12,113 (35.6%) | 21,917 (64.4%) |
| Health Care & Social Assistance | 8,971 (24.2%) | 28,130 (75.8%) |
| Arts, Entertainment & Recreation | 4,966 (57.9%) | 3,613 (42.1%) |
| Accommodation & Food Services | 11,102 (46.2%) | 12,923 (53.8%) |
| Public Administration | 8,084 (54.5%) | 6,742 (45.5%) |
| Total | 179,277 (54.7%) | 148,354 (45.3%) |
Education in Area Code 831
School Enrollment in Area Code 831
The most common levels of schooling among the 199,753 students in Area Code 831 are college / undergraduate (54,386 | 27.2%), high school (43,275 | 21.7%), and middle school (38,307 | 19.2%).
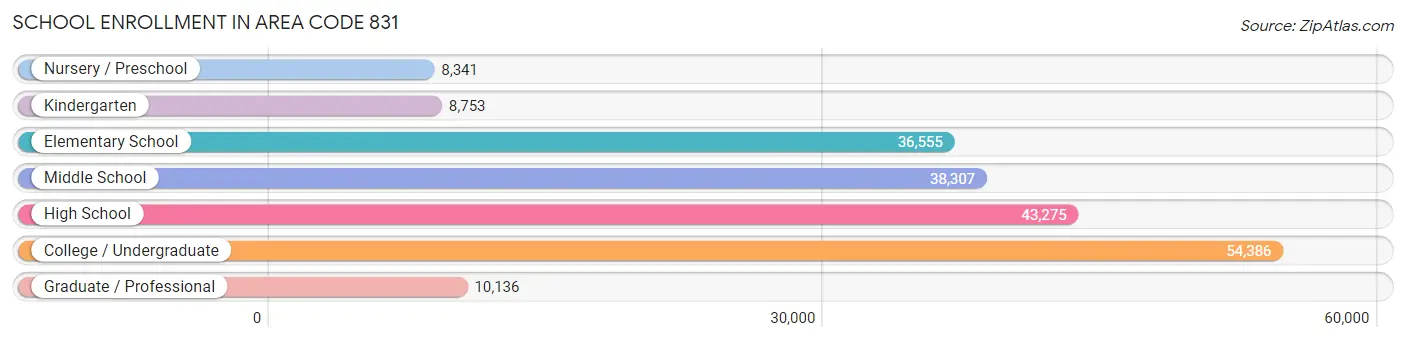
| School Level | # Students | % Students |
| Nursery / Preschool | 8,341 | 4.2% |
| Kindergarten | 8,753 | 4.4% |
| Elementary School | 36,555 | 18.3% |
| Middle School | 38,307 | 19.2% |
| High School | 43,275 | 21.7% |
| College / Undergraduate | 54,386 | 27.2% |
| Graduate / Professional | 10,136 | 5.1% |
| Total | 199,753 | 100.0% |
School Enrollment by Age by Funding Source in Area Code 831
Out of a total of 199,753 students who are enrolled in schools in Area Code 831, 20,561 (10.3%) attend a private institution, while the remaining 179,192 (89.7%) are enrolled in public schools. The age group of 3 to 4 year olds has the highest likelihood of being enrolled in private schools, with 2,388 (36.1% in the age bracket) enrolled. Conversely, the age group of 18 to 19 year olds has the lowest likelihood of being enrolled in a private school, with 18,701 (93.5% in the age bracket) attending a public institution.
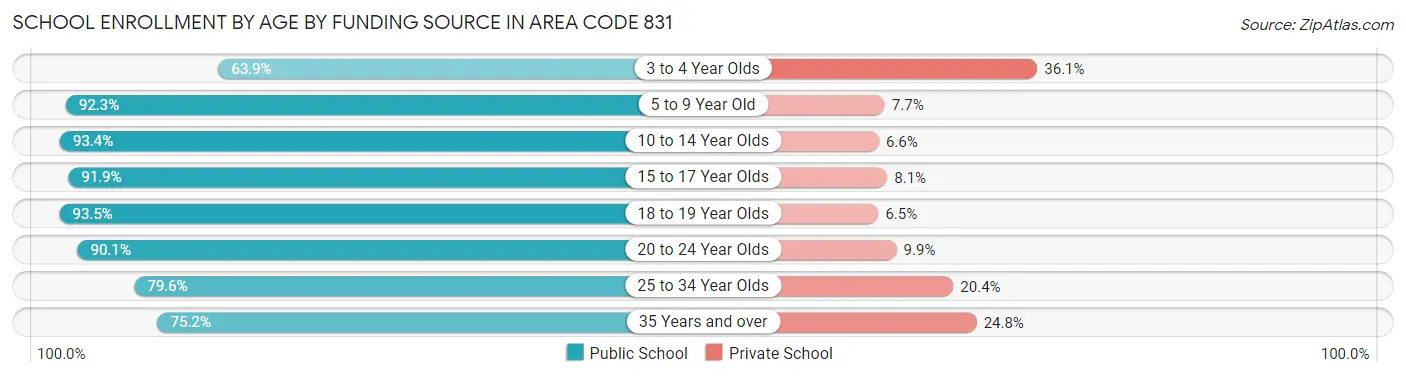
| Age Bracket | Public School | Private School |
| 3 to 4 Year Olds | 4,230 (63.9%) | 2,388 (36.1%) |
| 5 to 9 Year Old | 40,210 (92.3%) | 3,346 (7.7%) |
| 10 to 14 Year Olds | 46,522 (93.4%) | 3,272 (6.6%) |
| 15 to 17 Year Olds | 26,208 (91.9%) | 2,322 (8.1%) |
| 18 to 19 Year Olds | 18,701 (93.5%) | 1,297 (6.5%) |
| 20 to 24 Year Olds | 25,385 (90.1%) | 2,779 (9.9%) |
| 25 to 34 Year Olds | 10,264 (79.6%) | 2,637 (20.4%) |
| 35 Years and over | 7,666 (75.2%) | 2,526 (24.8%) |
| Total | 179,192 (89.7%) | 20,561 (10.3%) |
Educational Attainment by Field of Study in Area Code 831
Business (20,015 | 12.7%), social sciences (18,623 | 11.8%), bio, nature & agricultural (15,437 | 9.8%), liberal arts & history (12,033 | 7.6%), and science & technology (11,683 | 7.4%) are the most common fields of study among 158,259 individuals in Area Code 831 who have obtained a bachelor's degree or higher.
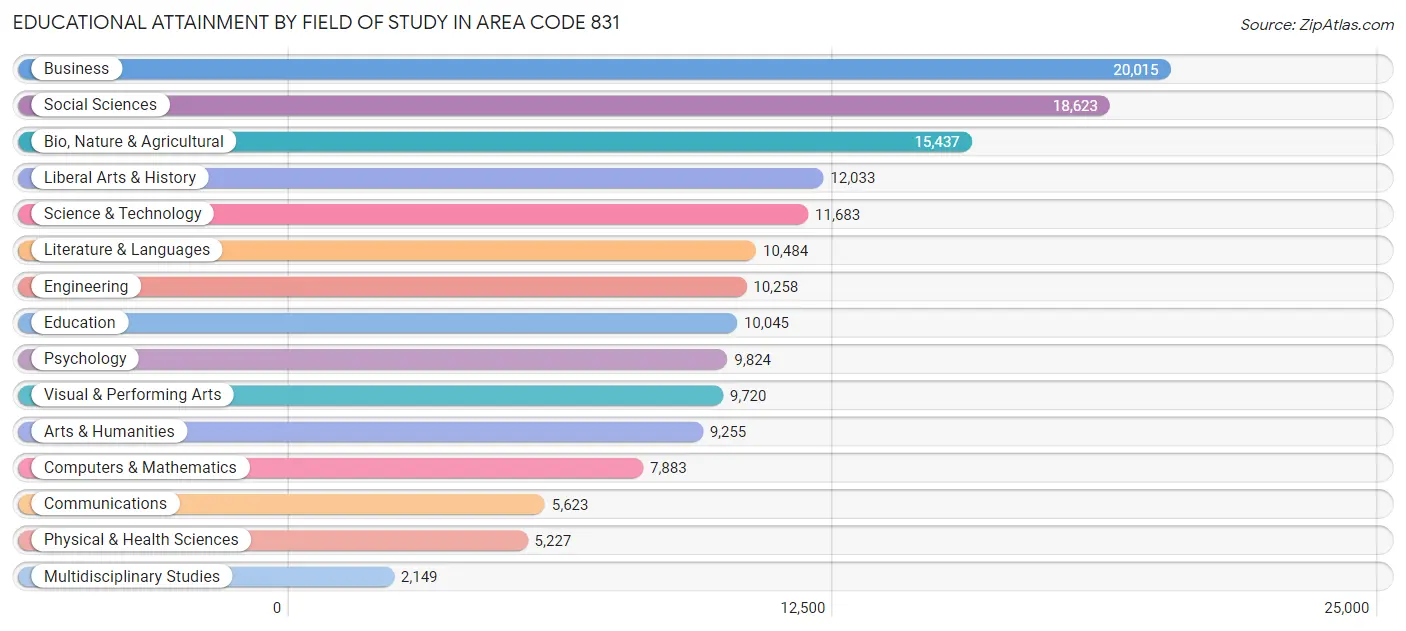
| Field of Study | # Graduates | % Graduates |
| Computers & Mathematics | 7,883 | 5.0% |
| Bio, Nature & Agricultural | 15,437 | 9.8% |
| Physical & Health Sciences | 5,227 | 3.3% |
| Psychology | 9,824 | 6.2% |
| Social Sciences | 18,623 | 11.8% |
| Engineering | 10,258 | 6.5% |
| Multidisciplinary Studies | 2,149 | 1.4% |
| Science & Technology | 11,683 | 7.4% |
| Business | 20,015 | 12.7% |
| Education | 10,045 | 6.4% |
| Literature & Languages | 10,484 | 6.6% |
| Liberal Arts & History | 12,033 | 7.6% |
| Visual & Performing Arts | 9,720 | 6.1% |
| Communications | 5,623 | 3.5% |
| Arts & Humanities | 9,255 | 5.9% |
| Total | 158,259 | 100.0% |
Transportation & Commute in Area Code 831
Vehicle Availability by Sex in Area Code 831
The most prevalent vehicle ownership categories in Area Code 831 are males with 2 vehicles (64,435, accounting for 36.9%) and females with 2 vehicles (49,781, making up 46.0%).
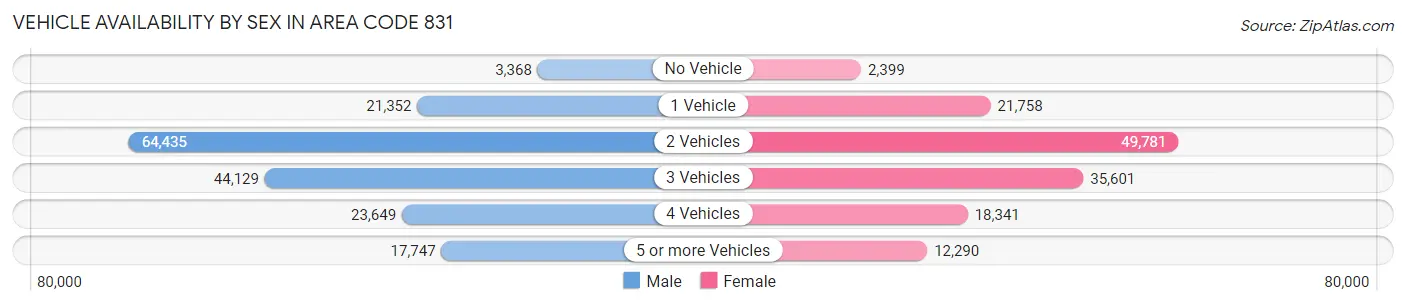
| Vehicles Available | Male | Female |
| No Vehicle | 3,368 (1.9%) | 2,399 (1.7%) |
| 1 Vehicle | 21,352 (12.2%) | 21,758 (15.5%) |
| 2 Vehicles | 64,435 (36.9%) | 49,781 (35.5%) |
| 3 Vehicles | 44,129 (25.3%) | 35,601 (25.4%) |
| 4 Vehicles | 23,649 (13.5%) | 18,341 (13.1%) |
| 5 or more Vehicles | 17,747 (10.2%) | 12,290 (8.8%) |
| Total | 174,680 (100.0%) | 140,170 (100.0%) |
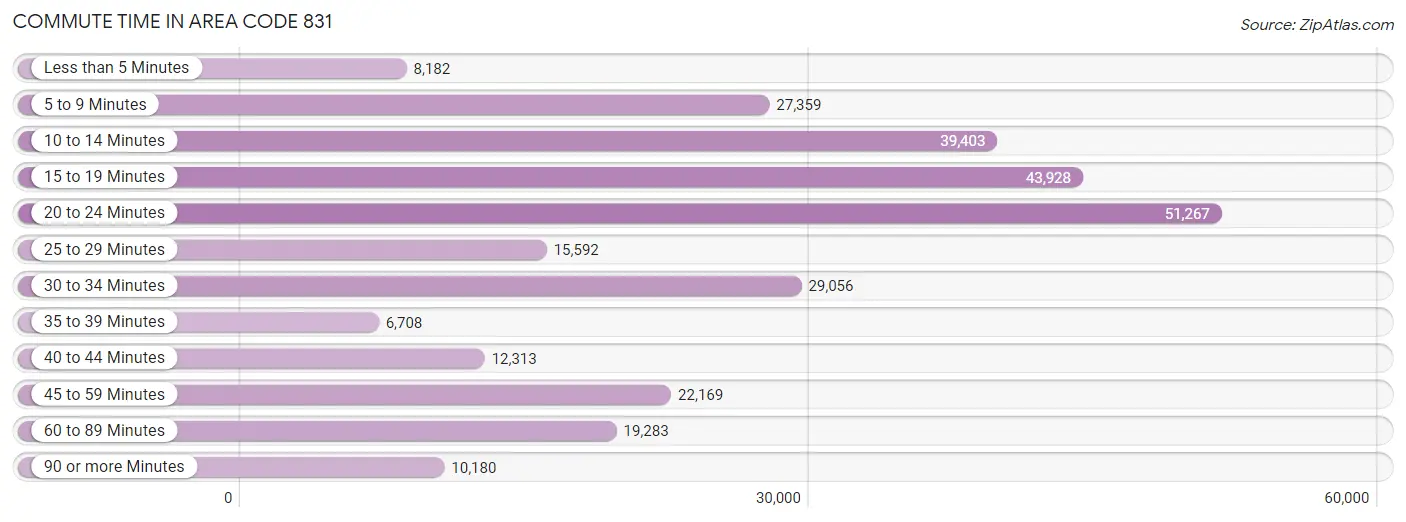
Commute Time in Area Code 831
The most frequently occuring commute durations in Area Code 831 are 20 to 24 minutes (51,267 commuters, 18.0%), 15 to 19 minutes (43,928 commuters, 15.4%), and 10 to 14 minutes (39,403 commuters, 13.8%).
| Commute Time | # Commuters | % Commuters |
| Less than 5 Minutes | 8,182 | 2.9% |
| 5 to 9 Minutes | 27,359 | 9.6% |
| 10 to 14 Minutes | 39,403 | 13.8% |
| 15 to 19 Minutes | 43,928 | 15.4% |
| 20 to 24 Minutes | 51,267 | 18.0% |
| 25 to 29 Minutes | 15,592 | 5.5% |
| 30 to 34 Minutes | 29,056 | 10.2% |
| 35 to 39 Minutes | 6,708 | 2.4% |
| 40 to 44 Minutes | 12,313 | 4.3% |
| 45 to 59 Minutes | 22,169 | 7.8% |
| 60 to 89 Minutes | 19,283 | 6.8% |
| 90 or more Minutes | 10,180 | 3.6% |
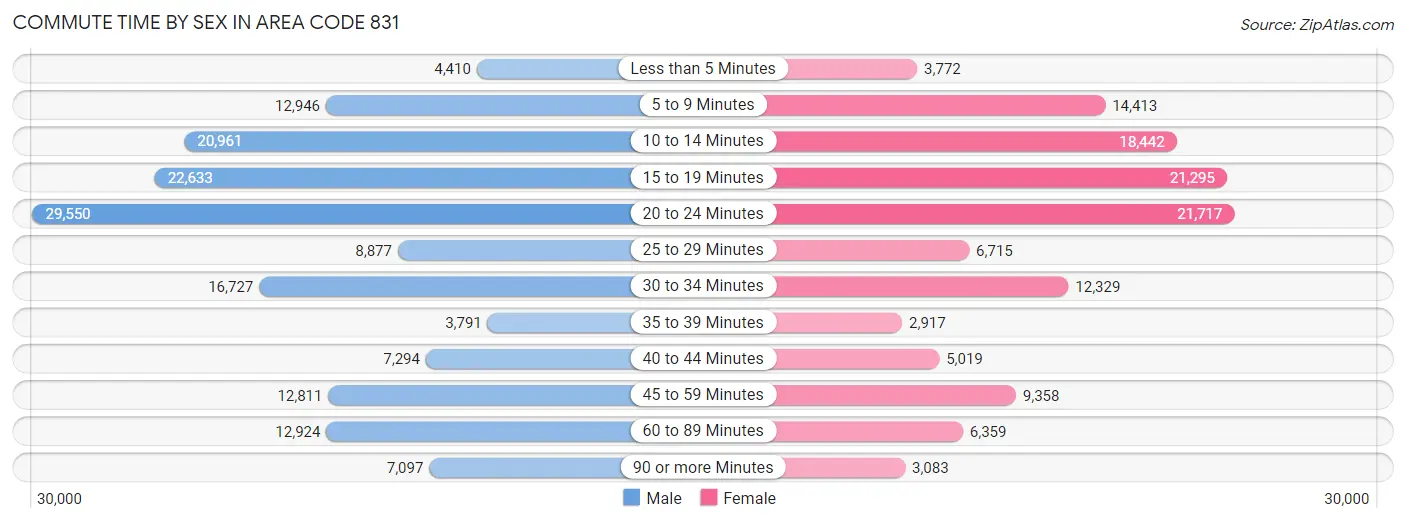
Commute Time by Sex in Area Code 831
The most common commute times in Area Code 831 are 20 to 24 minutes (29,550 commuters, 18.5%) for males and 20 to 24 minutes (21,717 commuters, 17.3%) for females.
| Commute Time | Male | Female |
| Less than 5 Minutes | 4,410 (2.8%) | 3,772 (3.0%) |
| 5 to 9 Minutes | 12,946 (8.1%) | 14,413 (11.5%) |
| 10 to 14 Minutes | 20,961 (13.1%) | 18,442 (14.7%) |
| 15 to 19 Minutes | 22,633 (14.1%) | 21,295 (17.0%) |
| 20 to 24 Minutes | 29,550 (18.5%) | 21,717 (17.3%) |
| 25 to 29 Minutes | 8,877 (5.6%) | 6,715 (5.3%) |
| 30 to 34 Minutes | 16,727 (10.4%) | 12,329 (9.8%) |
| 35 to 39 Minutes | 3,791 (2.4%) | 2,917 (2.3%) |
| 40 to 44 Minutes | 7,294 (4.6%) | 5,019 (4.0%) |
| 45 to 59 Minutes | 12,811 (8.0%) | 9,358 (7.5%) |
| 60 to 89 Minutes | 12,924 (8.1%) | 6,359 (5.1%) |
| 90 or more Minutes | 7,097 (4.4%) | 3,083 (2.5%) |
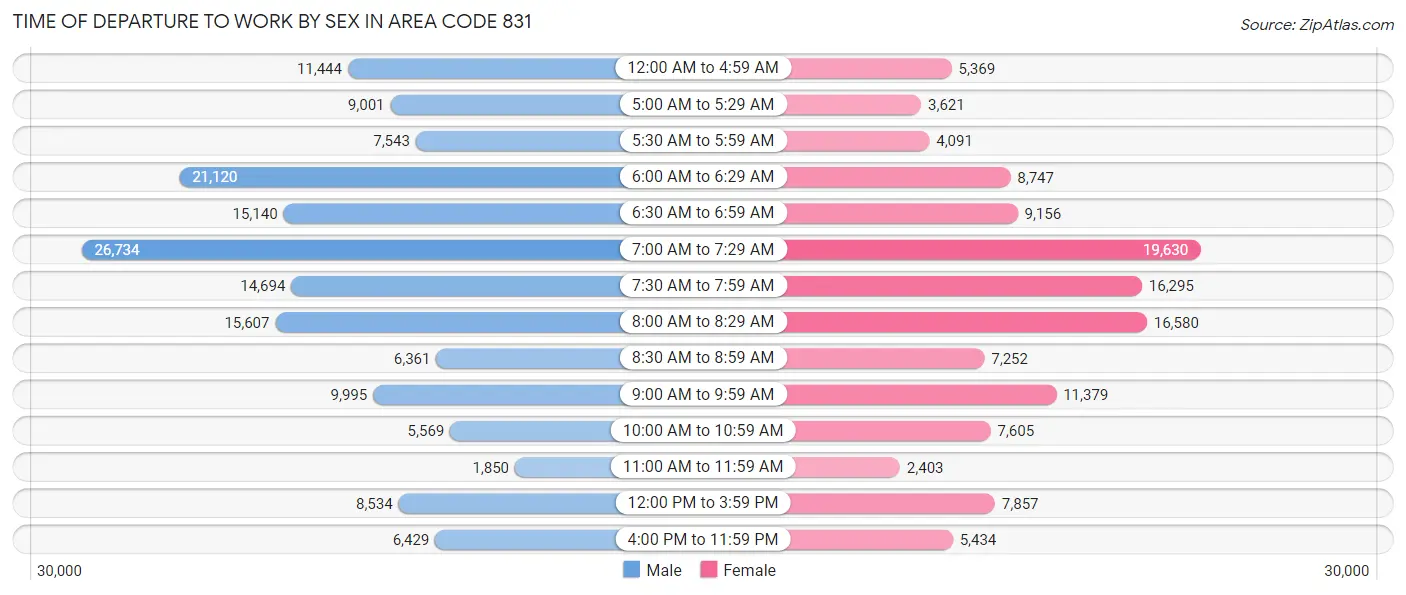
Time of Departure to Work by Sex in Area Code 831
The most frequent times of departure to work in Area Code 831 are 7:00 AM to 7:29 AM (26,734, 16.7%) for males and 7:00 AM to 7:29 AM (19,630, 15.7%) for females.
| Time of Departure | Male | Female |
| 12:00 AM to 4:59 AM | 11,444 (7.1%) | 5,369 (4.3%) |
| 5:00 AM to 5:29 AM | 9,001 (5.6%) | 3,621 (2.9%) |
| 5:30 AM to 5:59 AM | 7,543 (4.7%) | 4,091 (3.3%) |
| 6:00 AM to 6:29 AM | 21,120 (13.2%) | 8,747 (7.0%) |
| 6:30 AM to 6:59 AM | 15,140 (9.5%) | 9,156 (7.3%) |
| 7:00 AM to 7:29 AM | 26,734 (16.7%) | 19,630 (15.7%) |
| 7:30 AM to 7:59 AM | 14,694 (9.2%) | 16,295 (13.0%) |
| 8:00 AM to 8:29 AM | 15,607 (9.8%) | 16,580 (13.2%) |
| 8:30 AM to 8:59 AM | 6,361 (4.0%) | 7,252 (5.8%) |
| 9:00 AM to 9:59 AM | 9,995 (6.2%) | 11,379 (9.1%) |
| 10:00 AM to 10:59 AM | 5,569 (3.5%) | 7,605 (6.1%) |
| 11:00 AM to 11:59 AM | 1,850 (1.2%) | 2,403 (1.9%) |
| 12:00 PM to 3:59 PM | 8,534 (5.3%) | 7,857 (6.3%) |
| 4:00 PM to 11:59 PM | 6,429 (4.0%) | 5,434 (4.3%) |
| Total | 160,021 (100.0%) | 125,419 (100.0%) |
Housing Occupancy in Area Code 831
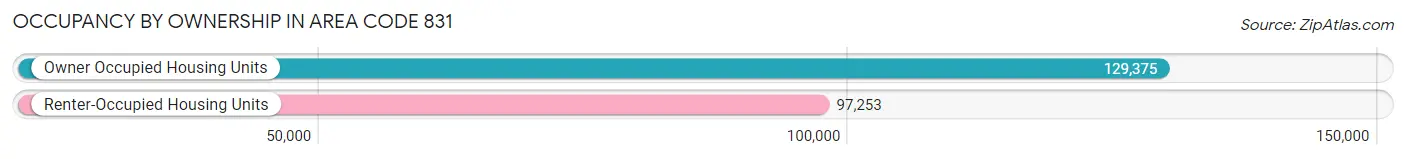
Occupancy by Ownership in Area Code 831
Of the total 226,628 dwellings in Area Code 831, owner-occupied units account for 129,375 (57.1%), while renter-occupied units make up 97,253 (42.9%).
| Occupancy | # Housing Units | % Housing Units |
| Owner Occupied Housing Units | 129,375 | 57.1% |
| Renter-Occupied Housing Units | 97,253 | 42.9% |
| Total Occupied Housing Units | 226,628 | 100.0% |
Occupancy by Household Size in Area Code 831
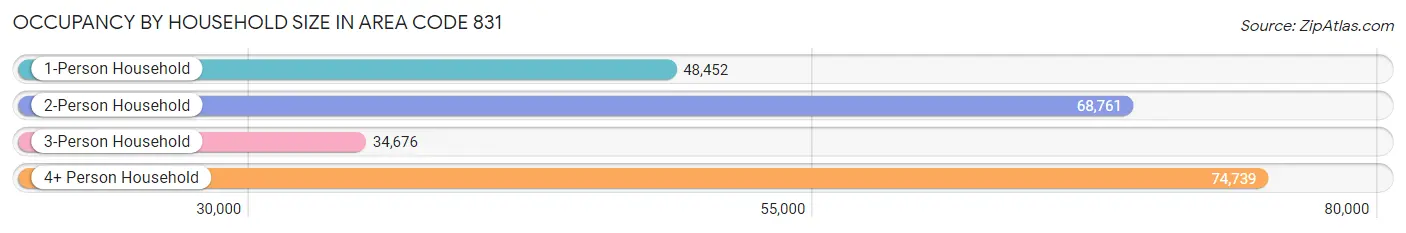
| Household Size | # Housing Units | % Housing Units |
| 1-Person Household | 48,452 | 21.4% |
| 2-Person Household | 68,761 | 30.3% |
| 3-Person Household | 34,676 | 15.3% |
| 4+ Person Household | 74,739 | 33.0% |
| Total Housing Units | 226,628 | 100.0% |
Occupancy by Ownership by Household Size in Area Code 831
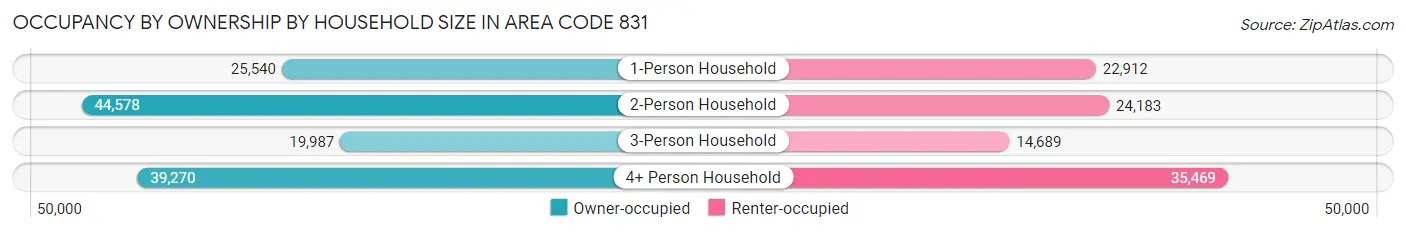
| Household Size | Owner-occupied | Renter-occupied |
| 1-Person Household | 25,540 (52.7%) | 22,912 (47.3%) |
| 2-Person Household | 44,578 (64.8%) | 24,183 (35.2%) |
| 3-Person Household | 19,987 (57.6%) | 14,689 (42.4%) |
| 4+ Person Household | 39,270 (52.5%) | 35,469 (47.5%) |
| Total Housing Units | 129,375 (57.1%) | 97,253 (42.9%) |
Occupancy by Educational Attainment in Area Code 831
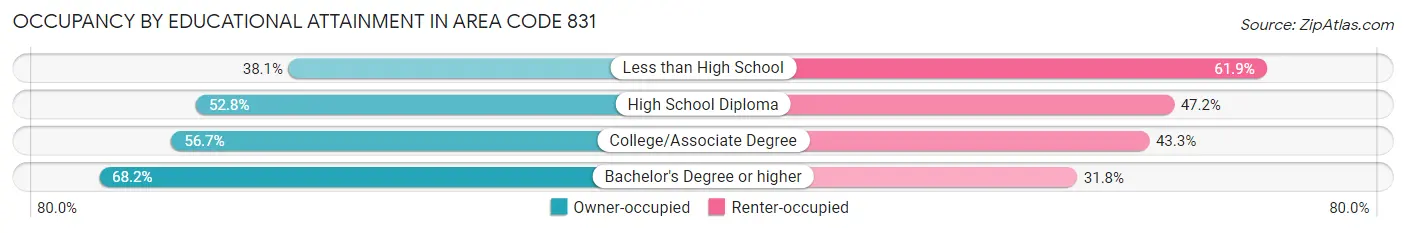
| Household Size | Owner-occupied | Renter-occupied |
| Less than High School | 14,951 (38.1%) | 24,301 (61.9%) |
| High School Diploma | 18,801 (52.8%) | 16,799 (47.2%) |
| College/Associate Degree | 38,885 (56.7%) | 29,659 (43.3%) |
| Bachelor's Degree or higher | 56,738 (68.2%) | 26,494 (31.8%) |
Occupancy by Age of Householder in Area Code 831
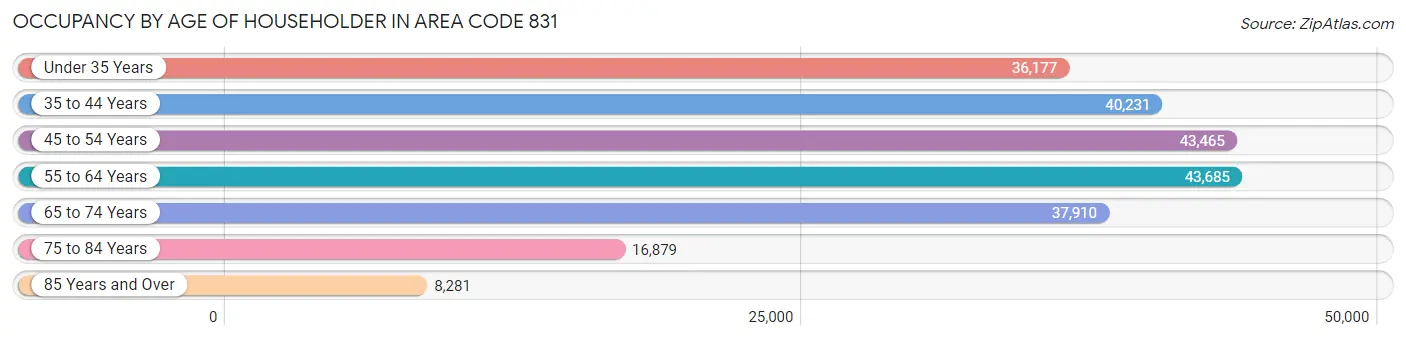
| Age Bracket | # Households | % Households |
| Under 35 Years | 36,177 | 16.0% |
| 35 to 44 Years | 40,231 | 17.7% |
| 45 to 54 Years | 43,465 | 19.2% |
| 55 to 64 Years | 43,685 | 19.3% |
| 65 to 74 Years | 37,910 | 16.7% |
| 75 to 84 Years | 16,879 | 7.4% |
| 85 Years and Over | 8,281 | 3.6% |
| Total | 226,628 | 100.0% |
Housing Finances in Area Code 831
Median Income by Occupancy in Area Code 831
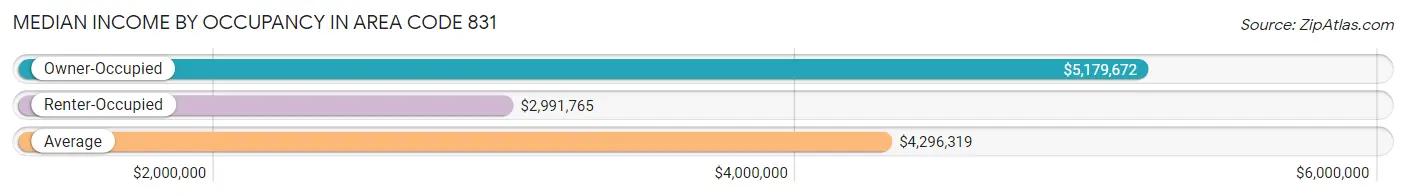
| Occupancy Type | # Households | Median Income |
| Owner-Occupied | 129,375 (57.1%) | $5,179,672 |
| Renter-Occupied | 97,253 (42.9%) | $2,991,765 |
| Average | 226,628 (100.0%) | $4,296,319 |
Occupancy by Householder Income Bracket in Area Code 831
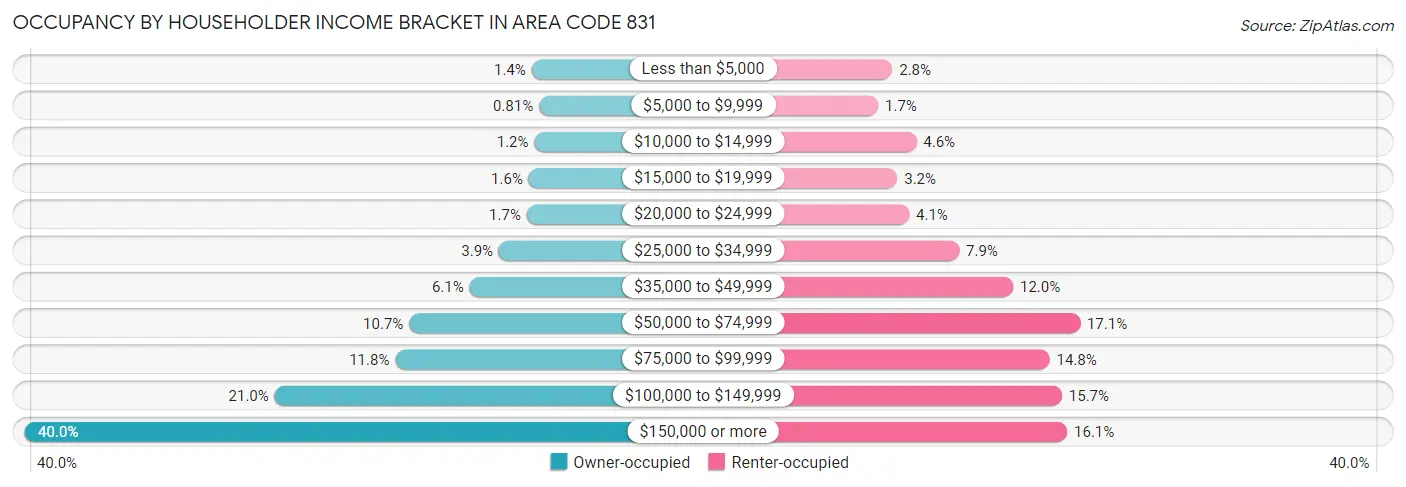
| Income Bracket | Owner-occupied | Renter-occupied |
| Less than $5,000 | 1,769 (1.4%) | 2,719 (2.8%) |
| $5,000 to $9,999 | 1,043 (0.8%) | 1,672 (1.7%) |
| $10,000 to $14,999 | 1,502 (1.2%) | 4,498 (4.6%) |
| $15,000 to $19,999 | 2,058 (1.6%) | 3,089 (3.2%) |
| $20,000 to $24,999 | 2,253 (1.7%) | 3,969 (4.1%) |
| $25,000 to $34,999 | 4,997 (3.9%) | 7,670 (7.9%) |
| $35,000 to $49,999 | 7,888 (6.1%) | 11,666 (12.0%) |
| $50,000 to $74,999 | 13,840 (10.7%) | 16,631 (17.1%) |
| $75,000 to $99,999 | 15,215 (11.8%) | 14,378 (14.8%) |
| $100,000 to $149,999 | 27,101 (20.9%) | 15,288 (15.7%) |
| $150,000 or more | 51,709 (40.0%) | 15,673 (16.1%) |
| Total | 129,375 (100.0%) | 97,253 (100.0%) |
Monthly Housing Cost Tiers in Area Code 831
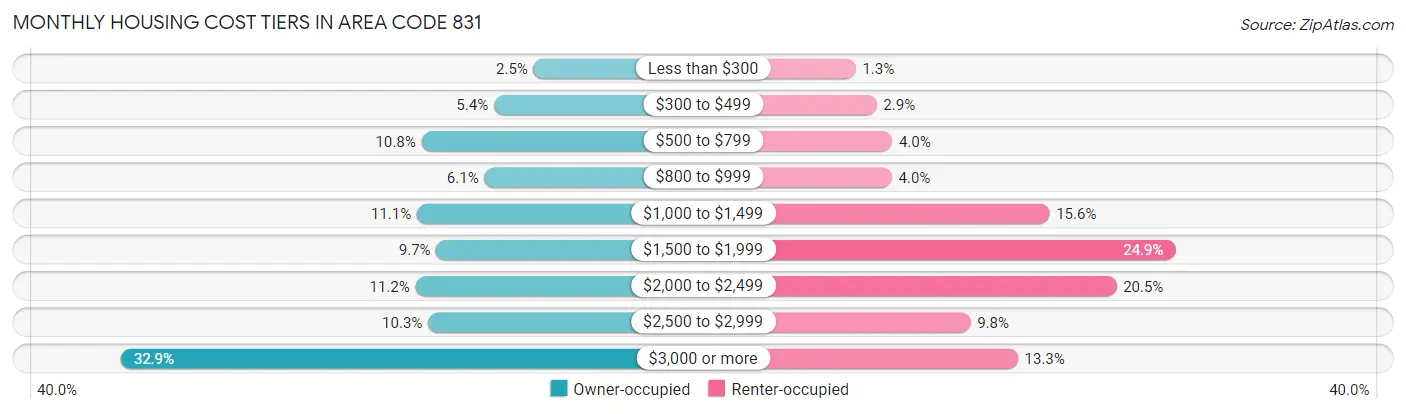
| Monthly Cost | Owner-occupied | Renter-occupied |
| Less than $300 | 3,246 (2.5%) | 1,291 (1.3%) |
| $300 to $499 | 7,021 (5.4%) | 2,790 (2.9%) |
| $500 to $799 | 13,933 (10.8%) | 3,906 (4.0%) |
| $800 to $999 | 7,925 (6.1%) | 3,885 (4.0%) |
| $1,000 to $1,499 | 14,357 (11.1%) | 15,167 (15.6%) |
| $1,500 to $1,999 | 12,510 (9.7%) | 24,200 (24.9%) |
| $2,000 to $2,499 | 14,501 (11.2%) | 19,968 (20.5%) |
| $2,500 to $2,999 | 13,305 (10.3%) | 9,510 (9.8%) |
| $3,000 or more | 42,577 (32.9%) | 12,905 (13.3%) |
| Total | 129,375 (100.0%) | 97,253 (100.0%) |
Physical Housing Characteristics in Area Code 831
Housing Structures in Area Code 831
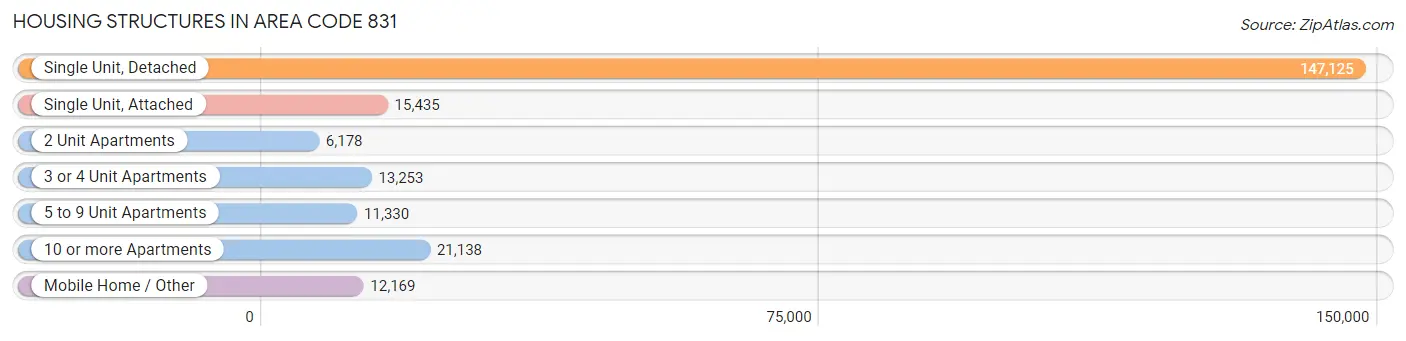
| Structure Type | # Housing Units | % Housing Units |
| Single Unit, Detached | 147,125 | 64.9% |
| Single Unit, Attached | 15,435 | 6.8% |
| 2 Unit Apartments | 6,178 | 2.7% |
| 3 or 4 Unit Apartments | 13,253 | 5.9% |
| 5 to 9 Unit Apartments | 11,330 | 5.0% |
| 10 or more Apartments | 21,138 | 9.3% |
| Mobile Home / Other | 12,169 | 5.4% |
| Total | 226,628 | 100.0% |
Housing Structures by Occupancy in Area Code 831
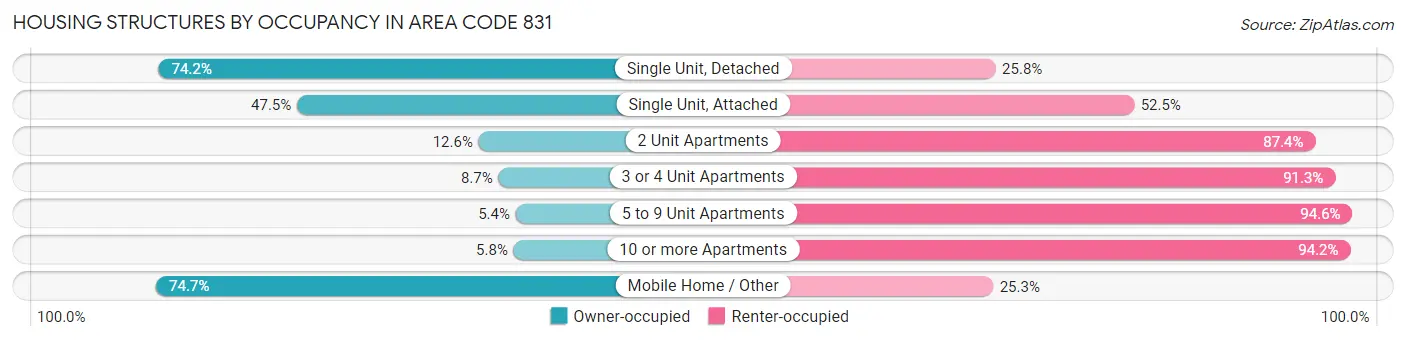
| Structure Type | Owner-occupied | Renter-occupied |
| Single Unit, Detached | 109,173 (74.2%) | 37,952 (25.8%) |
| Single Unit, Attached | 7,336 (47.5%) | 8,099 (52.5%) |
| 2 Unit Apartments | 776 (12.6%) | 5,402 (87.4%) |
| 3 or 4 Unit Apartments | 1,158 (8.7%) | 12,095 (91.3%) |
| 5 to 9 Unit Apartments | 615 (5.4%) | 10,715 (94.6%) |
| 10 or more Apartments | 1,231 (5.8%) | 19,907 (94.2%) |
| Mobile Home / Other | 9,086 (74.7%) | 3,083 (25.3%) |
| Total | 129,375 (57.1%) | 97,253 (42.9%) |
Housing Structures by Number of Rooms in Area Code 831
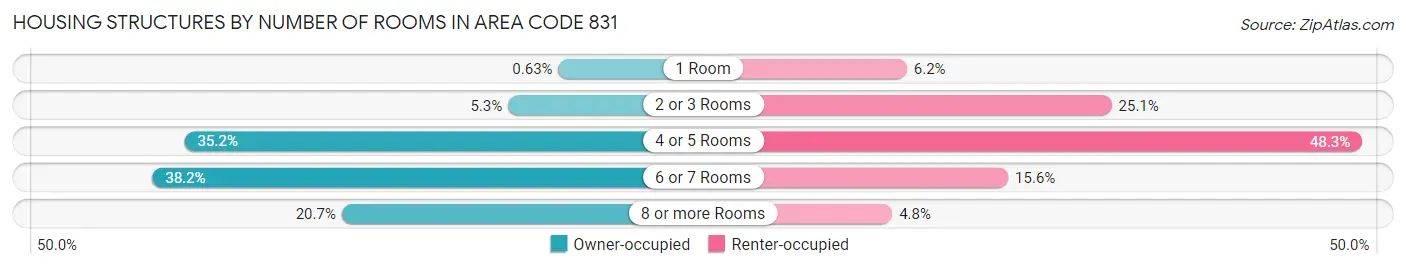
| Number of Rooms | Owner-occupied | Renter-occupied |
| 1 Room | 821 (0.6%) | 6,017 (6.2%) |
| 2 or 3 Rooms | 6,847 (5.3%) | 24,440 (25.1%) |
| 4 or 5 Rooms | 45,557 (35.2%) | 46,959 (48.3%) |
| 6 or 7 Rooms | 49,405 (38.2%) | 15,129 (15.6%) |
| 8 or more Rooms | 26,745 (20.7%) | 4,708 (4.8%) |
| Total | 129,375 (100.0%) | 97,253 (100.0%) |
Housing Structure by Heating Type in Area Code 831
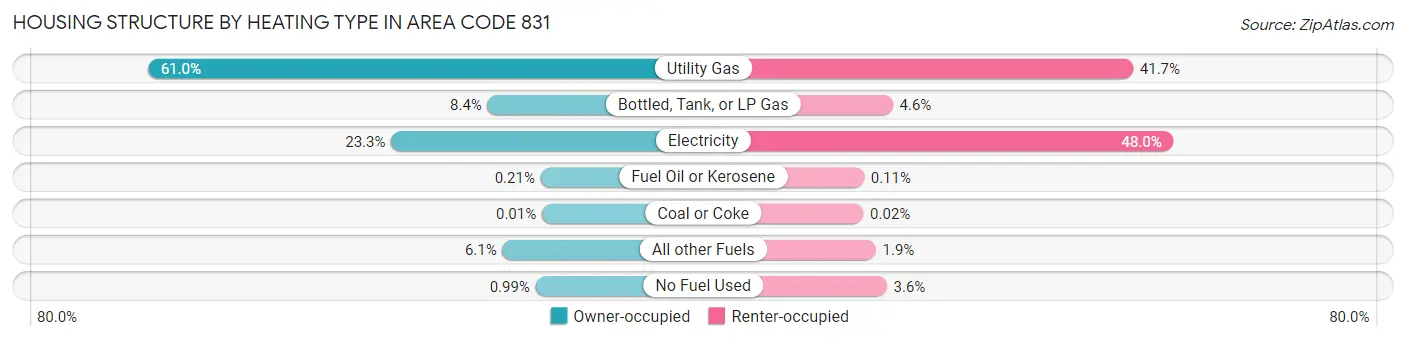
| Heating Type | Owner-occupied | Renter-occupied |
| Utility Gas | 78,871 (61.0%) | 40,568 (41.7%) |
| Bottled, Tank, or LP Gas | 10,882 (8.4%) | 4,446 (4.6%) |
| Electricity | 30,157 (23.3%) | 46,688 (48.0%) |
| Fuel Oil or Kerosene | 266 (0.2%) | 104 (0.1%) |
| Coal or Coke | 12 (0.0%) | 17 (0.0%) |
| All other Fuels | 7,901 (6.1%) | 1,889 (1.9%) |
| No Fuel Used | 1,286 (1.0%) | 3,541 (3.6%) |
| Total | 129,375 (100.0%) | 97,253 (100.0%) |
Household Vehicle Usage in Area Code 831
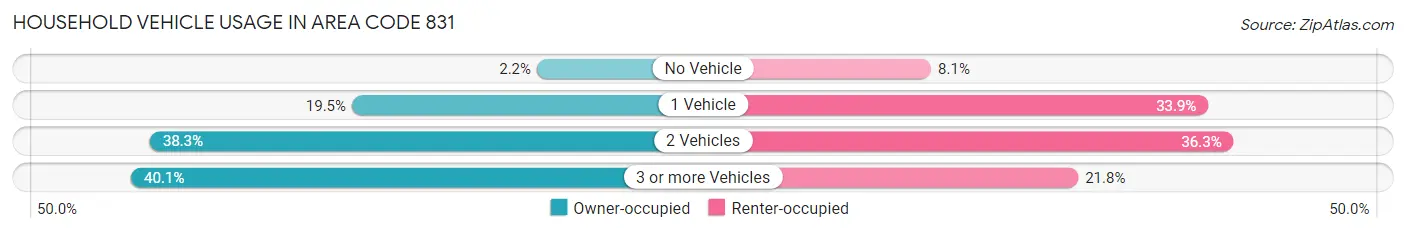
| Vehicles per Household | Owner-occupied | Renter-occupied |
| No Vehicle | 2,824 (2.2%) | 7,825 (8.1%) |
| 1 Vehicle | 25,159 (19.5%) | 32,979 (33.9%) |
| 2 Vehicles | 49,564 (38.3%) | 35,269 (36.3%) |
| 3 or more Vehicles | 51,828 (40.1%) | 21,180 (21.8%) |
| Total | 129,375 (100.0%) | 97,253 (100.0%) |
Real Estate & Mortgages in Area Code 831
Real Estate and Mortgage Overview in Area Code 831
| Characteristic | Without Mortgage | With Mortgage |
| Housing Units | 43,675 | 85,700 |
| Median Property Value | $28,744,900 | $33,707,701 |
| Median Household Income | $3,385,866 | $40,706 |
| Monthly Housing Costs | $31,070 | $41,710 |
| Real Estate Taxes | $147,312 | $1,187 |
Property Value by Mortgage Status in Area Code 831
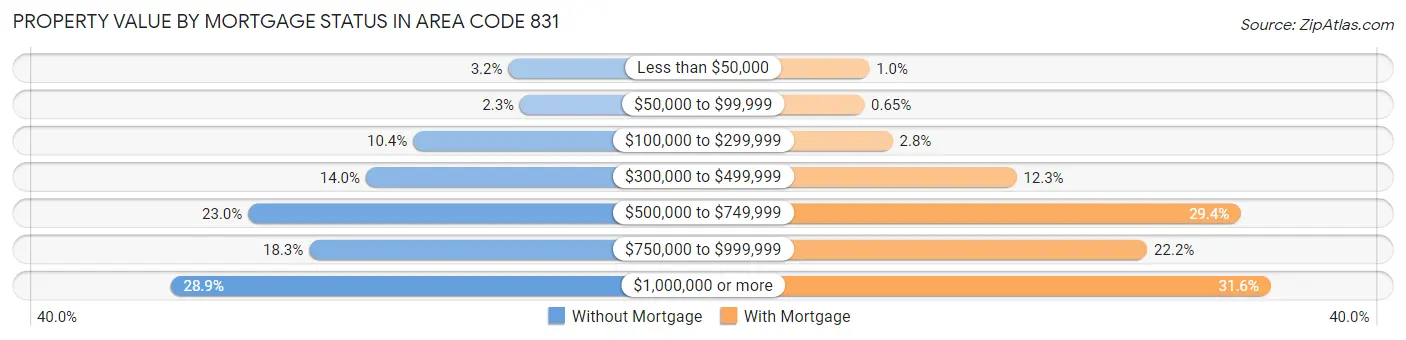
| Property Value | Without Mortgage | With Mortgage |
| Less than $50,000 | 1,374 (3.2%) | 887 (1.0%) |
| $50,000 to $99,999 | 989 (2.3%) | 555 (0.6%) |
| $100,000 to $299,999 | 4,544 (10.4%) | 2,420 (2.8%) |
| $300,000 to $499,999 | 6,114 (14.0%) | 10,504 (12.3%) |
| $500,000 to $749,999 | 10,034 (23.0%) | 25,176 (29.4%) |
| $750,000 to $999,999 | 8,006 (18.3%) | 19,046 (22.2%) |
| $1,000,000 or more | 12,614 (28.9%) | 27,112 (31.6%) |
| Total | 43,675 (100.0%) | 85,700 (100.0%) |
Household Income by Mortgage Status in Area Code 831
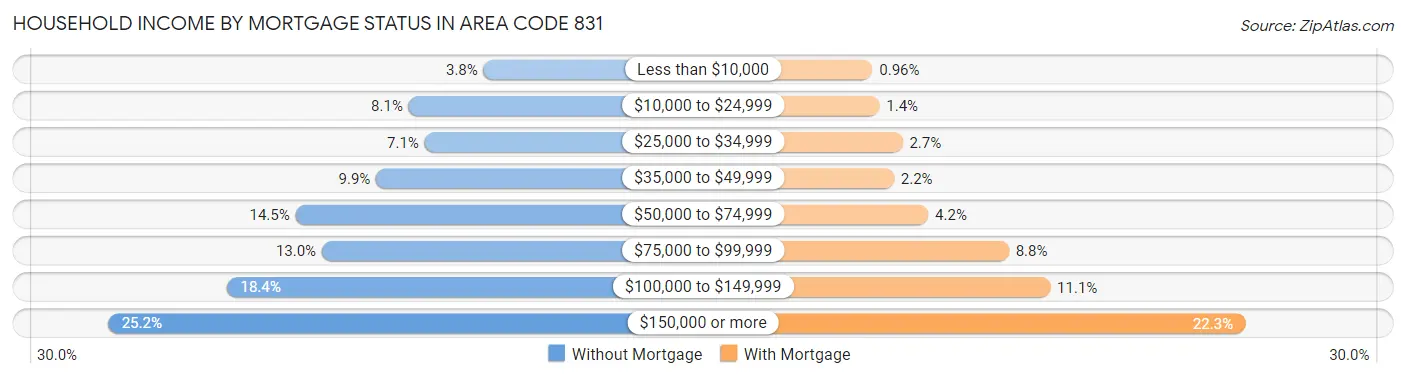
| Household Income | Without Mortgage | With Mortgage |
| Less than $10,000 | 1,647 (3.8%) | 820 (1.0%) |
| $10,000 to $24,999 | 3,517 (8.1%) | 1,165 (1.4%) |
| $25,000 to $34,999 | 3,118 (7.1%) | 2,296 (2.7%) |
| $35,000 to $49,999 | 4,330 (9.9%) | 1,879 (2.2%) |
| $50,000 to $74,999 | 6,342 (14.5%) | 3,558 (4.2%) |
| $75,000 to $99,999 | 5,683 (13.0%) | 7,498 (8.7%) |
| $100,000 to $149,999 | 8,035 (18.4%) | 9,532 (11.1%) |
| $150,000 or more | 11,003 (25.2%) | 19,066 (22.3%) |
| Total | 43,675 (100.0%) | 85,700 (100.0%) |
Property Value to Household Income Ratio in Area Code 831
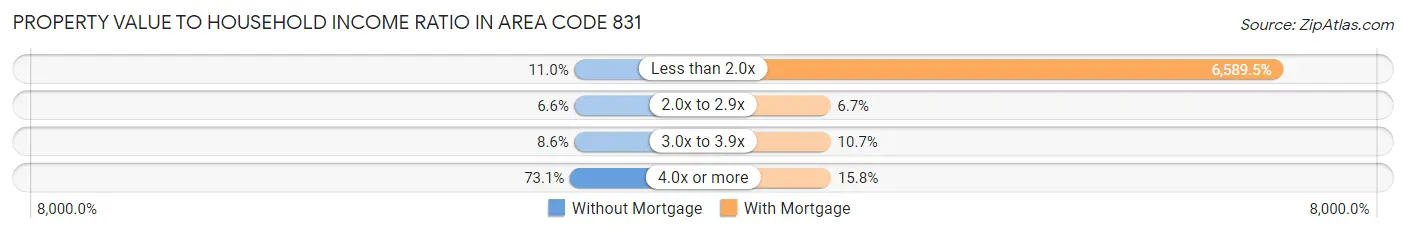
| Value-to-Income Ratio | Without Mortgage | With Mortgage |
| Less than 2.0x | 4,785 (11.0%) | 5,647,199 (6,589.5%) |
| 2.0x to 2.9x | 2,894 (6.6%) | 5,736 (6.7%) |
| 3.0x to 3.9x | 3,739 (8.6%) | 9,186 (10.7%) |
| 4.0x or more | 31,911 (73.1%) | 13,511 (15.8%) |
| Total | 43,675 (100.0%) | 85,700 (100.0%) |
Real Estate Taxes by Mortgage Status in Area Code 831
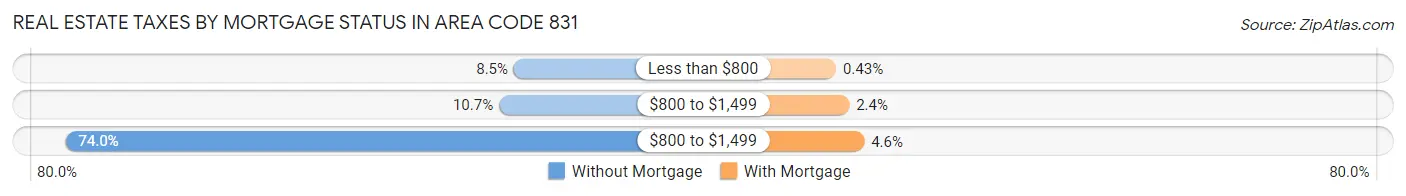
| Property Taxes | Without Mortgage | With Mortgage |
| Less than $800 | 3,716 (8.5%) | 365 (0.4%) |
| $800 to $1,499 | 4,663 (10.7%) | 2,019 (2.4%) |
| $800 to $1,499 | 32,331 (74.0%) | 3,904 (4.6%) |
| Total | 43,675 (100.0%) | 85,700 (100.0%) |
Health & Disability in Area Code 831
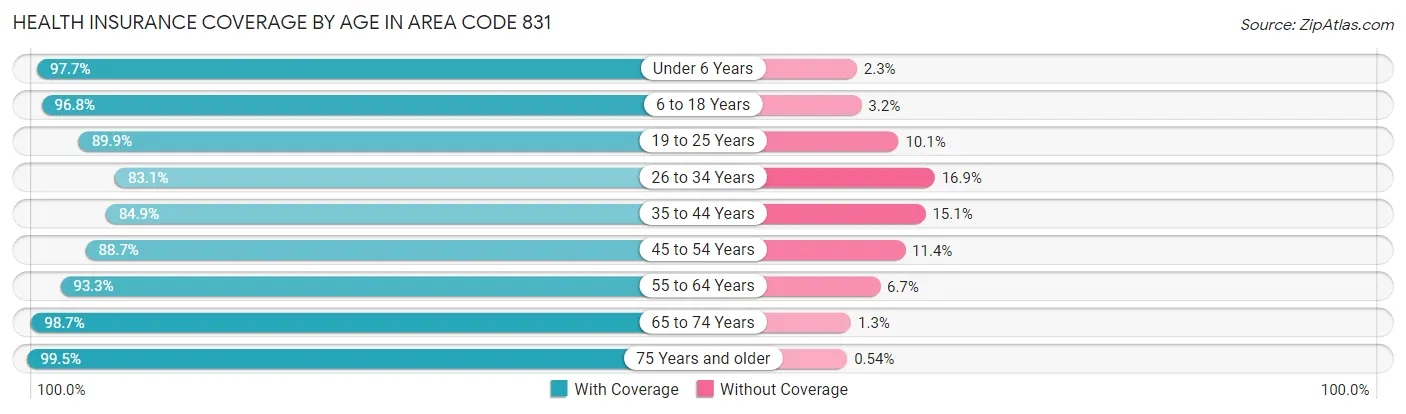
Health Insurance Coverage by Age in Area Code 831
| Age Bracket | With Coverage | Without Coverage |
| Under 6 Years | 50,102 (97.7%) | 1,200 (2.3%) |
| 6 to 18 Years | 125,847 (96.8%) | 4,149 (3.2%) |
| 19 to 25 Years | 67,979 (89.9%) | 7,639 (10.1%) |
| 26 to 34 Years | 67,690 (83.1%) | 13,725 (16.9%) |
| 35 to 44 Years | 75,936 (84.9%) | 13,543 (15.1%) |
| 45 to 54 Years | 74,286 (88.6%) | 9,513 (11.4%) |
| 55 to 64 Years | 76,943 (93.3%) | 5,493 (6.7%) |
| 65 to 74 Years | 64,015 (98.7%) | 826 (1.3%) |
| 75 Years and older | 41,094 (99.5%) | 222 (0.5%) |
| Total | 643,892 (92.0%) | 56,310 (8.0%) |
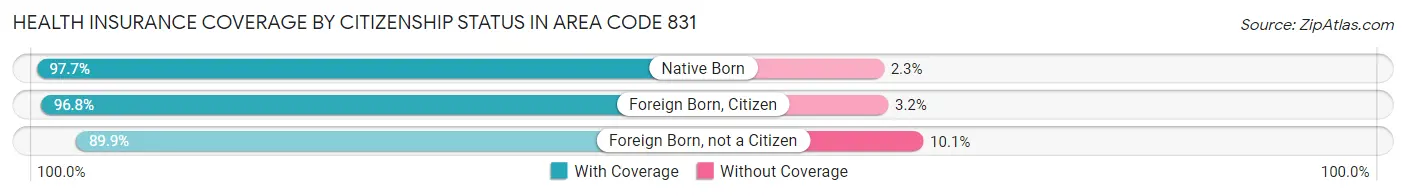
Health Insurance Coverage by Citizenship Status in Area Code 831
| Citizenship Status | With Coverage | Without Coverage |
| Native Born | 50,102 (97.7%) | 1,200 (2.3%) |
| Foreign Born, Citizen | 125,847 (96.8%) | 4,149 (3.2%) |
| Foreign Born, not a Citizen | 67,979 (89.9%) | 7,639 (10.1%) |
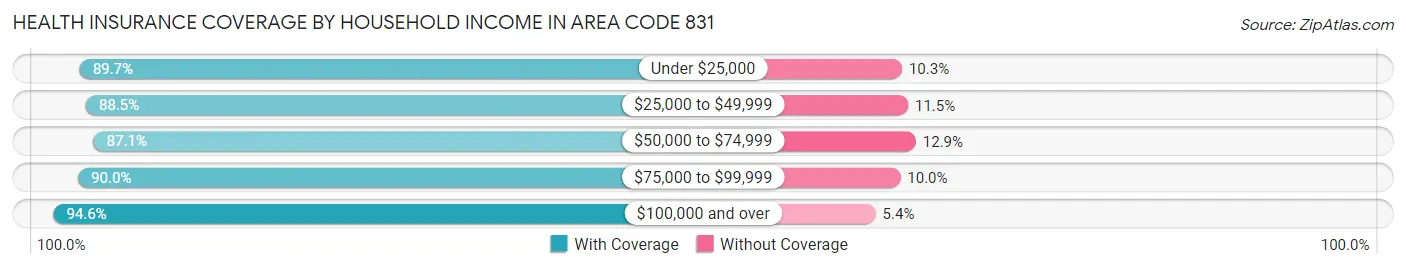
Health Insurance Coverage by Household Income in Area Code 831
| Household Income | With Coverage | Without Coverage |
| Under $25,000 | 43,432 (89.7%) | 5,011 (10.3%) |
| $25,000 to $49,999 | 73,615 (88.5%) | 9,544 (11.5%) |
| $50,000 to $74,999 | 78,670 (87.1%) | 11,690 (12.9%) |
| $75,000 to $99,999 | 82,635 (90.0%) | 9,224 (10.0%) |
| $100,000 and over | 349,514 (94.6%) | 19,974 (5.4%) |
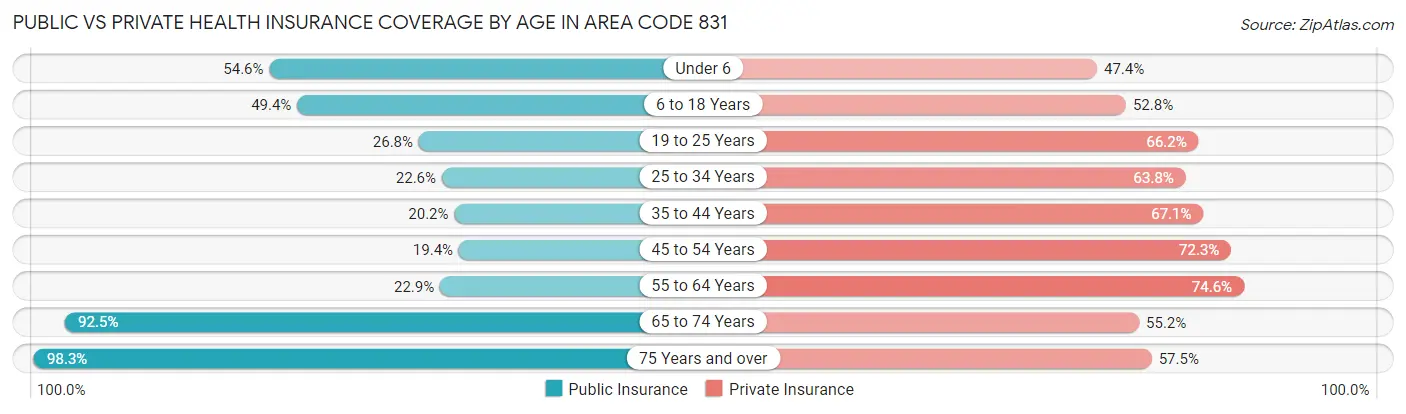
Public vs Private Health Insurance Coverage by Age in Area Code 831
| Age Bracket | Public Insurance | Private Insurance |
| Under 6 | 27,993 (54.6%) | 24,308 (47.4%) |
| 6 to 18 Years | 64,214 (49.4%) | 68,579 (52.7%) |
| 19 to 25 Years | 20,279 (26.8%) | 50,067 (66.2%) |
| 25 to 34 Years | 18,363 (22.6%) | 51,957 (63.8%) |
| 35 to 44 Years | 18,105 (20.2%) | 60,051 (67.1%) |
| 45 to 54 Years | 16,252 (19.4%) | 60,564 (72.3%) |
| 55 to 64 Years | 18,870 (22.9%) | 61,520 (74.6%) |
| 65 to 74 Years | 59,962 (92.5%) | 35,785 (55.2%) |
| 75 Years and over | 40,603 (98.3%) | 23,768 (57.5%) |
| Total | 284,641 (40.6%) | 436,599 (62.4%) |
Disability Status by Sex by Age in Area Code 831
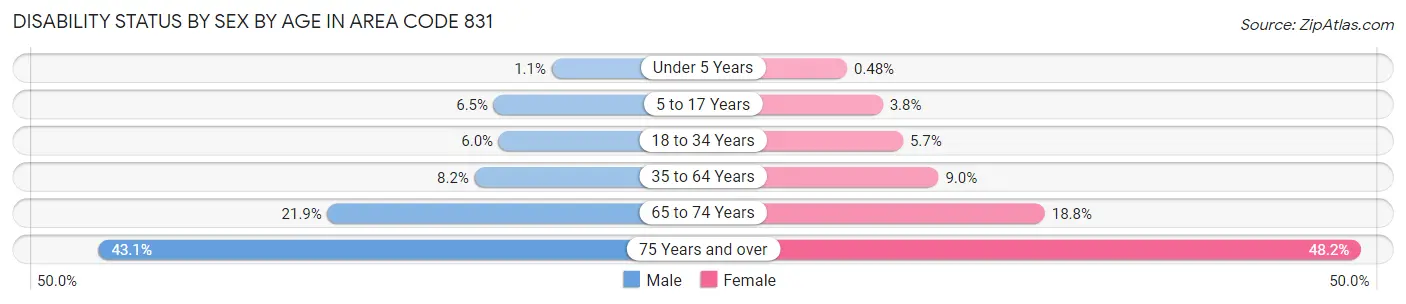
| Age Bracket | Male | Female |
| Under 5 Years | 232 (1.1%) | 102 (0.5%) |
| 5 to 17 Years | 4,141 (6.5%) | 2,321 (3.8%) |
| 18 to 34 Years | 5,133 (6.0%) | 4,791 (5.7%) |
| 35 to 64 Years | 10,688 (8.2%) | 11,288 (9.0%) |
| 65 to 74 Years | 6,879 (21.9%) | 6,293 (18.8%) |
| 75 Years and over | 7,523 (43.1%) | 11,510 (48.2%) |
Disability Class by Sex by Age in Area Code 831
Disability Class: Hearing Difficulty
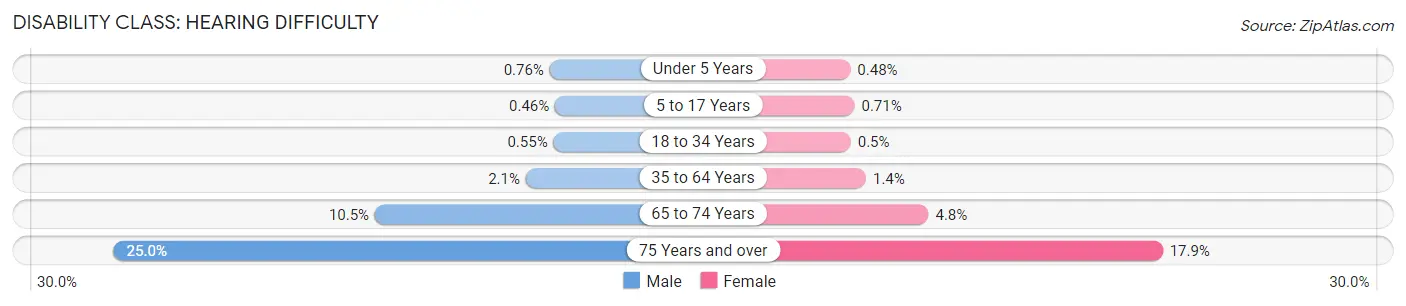
| Age Bracket | Male | Female |
| Under 5 Years | 164 (0.8%) | 102 (0.5%) |
| 5 to 17 Years | 297 (0.5%) | 435 (0.7%) |
| 18 to 34 Years | 475 (0.5%) | 422 (0.5%) |
| 35 to 64 Years | 2,708 (2.1%) | 1,695 (1.3%) |
| 65 to 74 Years | 3,297 (10.5%) | 1,614 (4.8%) |
| 75 Years and over | 4,366 (25.0%) | 4,266 (17.9%) |
Disability Class: Vision Difficulty
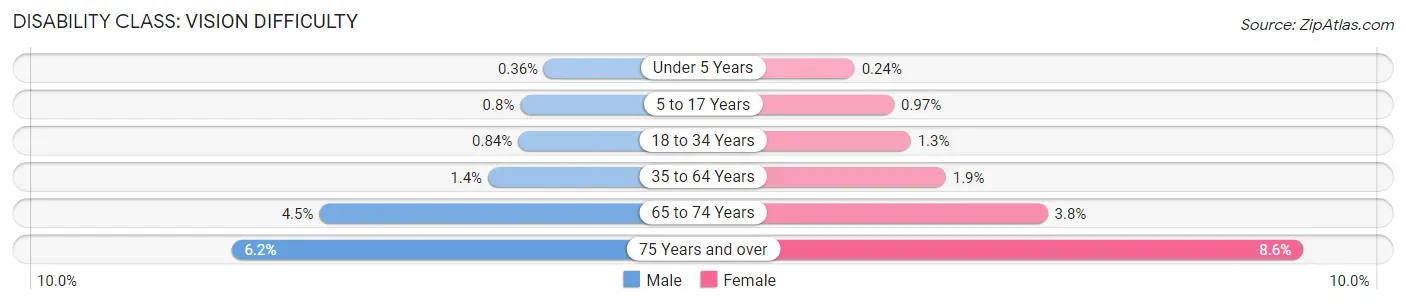
| Age Bracket | Male | Female |
| Under 5 Years | 77 (0.4%) | 52 (0.2%) |
| 5 to 17 Years | 513 (0.8%) | 592 (1.0%) |
| 18 to 34 Years | 721 (0.8%) | 1,080 (1.3%) |
| 35 to 64 Years | 1,814 (1.4%) | 2,427 (1.9%) |
| 65 to 74 Years | 1,424 (4.5%) | 1,277 (3.8%) |
| 75 Years and over | 1,074 (6.2%) | 2,044 (8.6%) |
Disability Class: Cognitive Difficulty
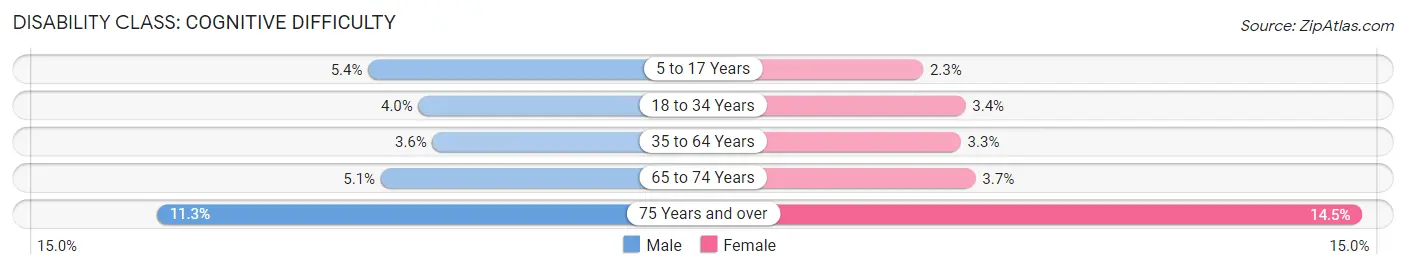
| Age Bracket | Male | Female |
| 5 to 17 Years | 3,486 (5.4%) | 1,381 (2.3%) |
| 18 to 34 Years | 3,457 (4.0%) | 2,902 (3.4%) |
| 35 to 64 Years | 4,728 (3.6%) | 4,169 (3.3%) |
| 65 to 74 Years | 1,598 (5.1%) | 1,244 (3.7%) |
| 75 Years and over | 1,973 (11.3%) | 3,461 (14.5%) |
Disability Class: Ambulatory Difficulty
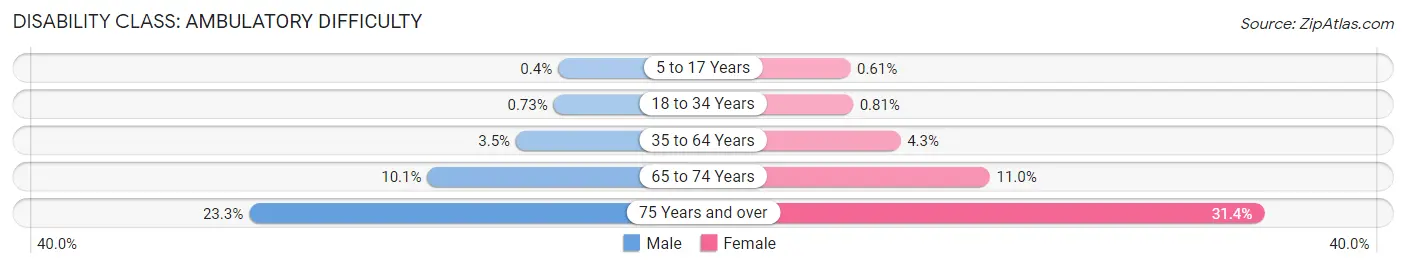
| Age Bracket | Male | Female |
| 5 to 17 Years | 255 (0.4%) | 375 (0.6%) |
| 18 to 34 Years | 628 (0.7%) | 680 (0.8%) |
| 35 to 64 Years | 4,574 (3.5%) | 5,465 (4.3%) |
| 65 to 74 Years | 3,174 (10.1%) | 3,665 (11.0%) |
| 75 Years and over | 4,069 (23.3%) | 7,485 (31.4%) |
Disability Class: Self-Care Difficulty
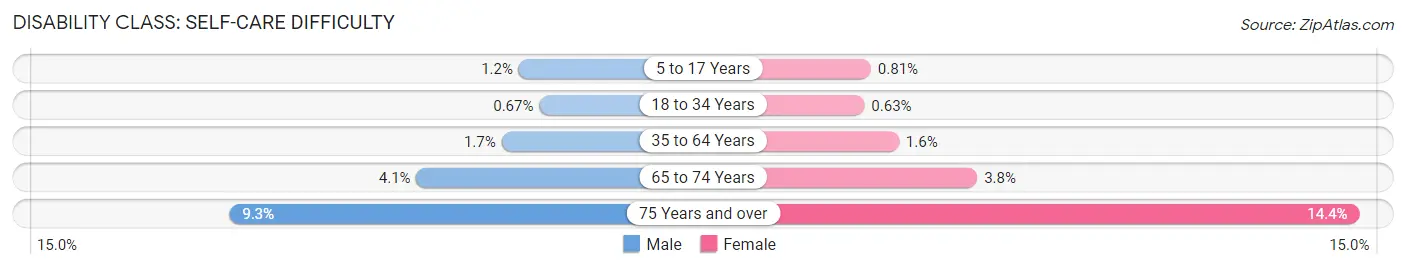
| Age Bracket | Male | Female |
| 5 to 17 Years | 798 (1.2%) | 494 (0.8%) |
| 18 to 34 Years | 577 (0.7%) | 529 (0.6%) |
| 35 to 64 Years | 2,234 (1.7%) | 1,997 (1.6%) |
| 65 to 74 Years | 1,285 (4.1%) | 1,261 (3.8%) |
| 75 Years and over | 1,621 (9.3%) | 3,441 (14.4%) |
Technology Access in Area Code 831
Computing Device Access in Area Code 831
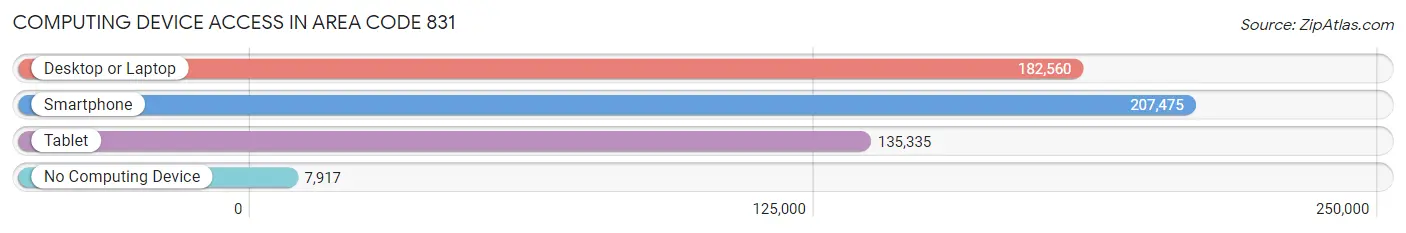
| Device Type | # Households | % Households |
| Desktop or Laptop | 182,560 | 80.5% |
| Smartphone | 207,475 | 91.5% |
| Tablet | 135,335 | 59.7% |
| No Computing Device | 7,917 | 3.5% |
| Total | 226,628 | 100.0% |
Internet Access in Area Code 831
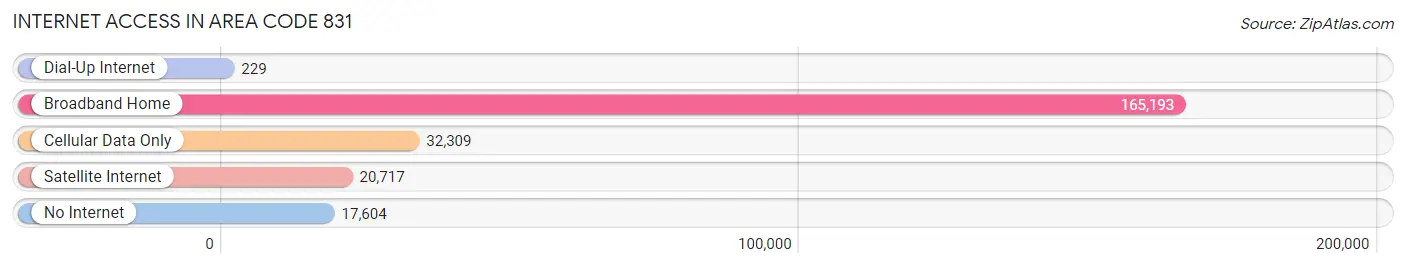
| Internet Type | # Households | % Households |
| Dial-Up Internet | 229 | 0.1% |
| Broadband Home | 165,193 | 72.9% |
| Cellular Data Only | 32,309 | 14.3% |
| Satellite Internet | 20,717 | 9.1% |
| No Internet | 17,604 | 7.8% |
| Total | 226,628 | 100.0% |
Area Code 831 Summary
Geography
Area code 831 is located in the state of California and covers the Monterey Bay area, including the cities of Salinas, Santa Cruz, and Monterey. It also covers parts of San Benito, Santa Clara, and San Luis Obispo counties.
Social
Area code 831 is home to a diverse population of people from all walks of life. The area is known for its beautiful beaches, stunning views, and vibrant culture. It is also home to a number of universities and colleges, including the University of California, Santa Cruz and California State University, Monterey Bay.
Economics
Area code 831 is a major economic hub in California. It is home to a number of large companies, including the agricultural giant Dole Food Company, the tech giant Apple, and the defense contractor Lockheed Martin. The area is also home to a number of smaller businesses, including wineries, restaurants, and retail stores.
Demographics
Area code 831 is home to a diverse population of people from all backgrounds. According to the U.S. Census Bureau, the population of the area is approximately 590,000 people. The population is predominantly Hispanic, with a large percentage of people of Mexican descent. The area also has a significant Asian population, with a large percentage of people of Chinese and Filipino descent.
Common Questions
What is Per Capita Income in Area Code 831?
Per Capita income in Area Code 831 is $50,209.
What is the Median Family Income in Area Code 831?
Median Family Income in Area Code 831 is $119,216.
What is the Median Household income in Area Code 831?
Median Household Income in Area Code 831 is $104,788.
What is Income or Wage Gap in Area Code 831?
Income or Wage Gap in Area Code 831 is 32.6%.
Women in Area Code 831 earn 67.4 cents for every dollar earned by a man.
What is Family Income Deficit in Area Code 831?
Family Income Deficit in Area Code 831 is $10,913.
Families that are below poverty line in Area Code 831 earn $10,913 less on average than the poverty threshold level.
What is Inequality or Gini Index in Area Code 831?
Inequality or Gini Index in Area Code 831 is 17.79.
What is the Total Population of Area Code 831?
Total Population of Area Code 831 is 713,666.
What is the Total Male Population of Area Code 831?
Total Male Population of Area Code 831 is 362,164.
What is the Total Female Population of Area Code 831?
Total Female Population of Area Code 831 is 351,502.
What is the Ratio of Males per 100 Females in Area Code 831?
There are 103.03 Males per 100 Females in Area Code 831.
What is the Ratio of Females per 100 Males in Area Code 831?
There are 97.06 Females per 100 Males in Area Code 831.
What is the Median Population Age in Area Code 831?
Median Population Age in Area Code 831 is 40.3 Years.
What is the Average Family Size in Area Code 831
Average Family Size in Area Code 831 is 3.3 People.
What is the Average Household Size in Area Code 831
Average Household Size in Area Code 831 is 2.9 People.
How Large is the Labor Force in Area Code 831?
There are 350,297 People in the Labor Forcein in Area Code 831.
What is the Percentage of People in the Labor Force in Area Code 831?
62.1% of People are in the Labor Force in Area Code 831.
What is the Unemployment Rate in Area Code 831?
Unemployment Rate in Area Code 831 is 5.6%.