Santa Clara County, CA Map & Demographics
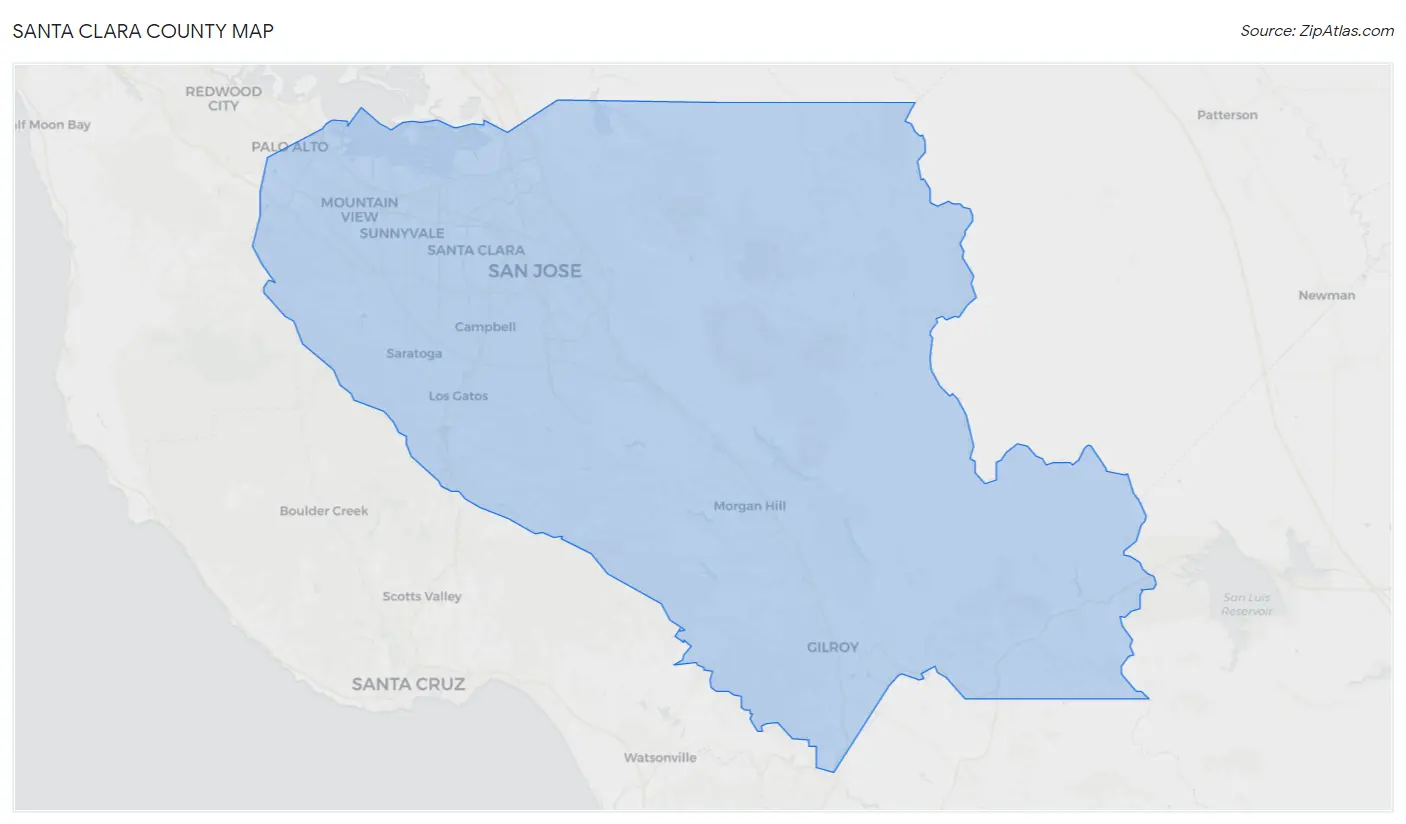
Santa Clara County Map
Santa Clara County Overview
$73,017
PER CAPITA INCOME
$174,855
AVG FAMILY INCOME
$153,792
AVG HOUSEHOLD INCOME
37.0%
WAGE / INCOME GAP [ % ]
63.0¢/ $1
WAGE / INCOME GAP [ $ ]
$11,061
FAMILY INCOME DEFICIT
0.47
INEQUALITY / GINI INDEX
1,916,831
TOTAL POPULATION
978,952
MALE POPULATION
937,879
FEMALE POPULATION
104.38
MALES / 100 FEMALES
95.80
FEMALES / 100 MALES
37.7
MEDIAN AGE
3.4
AVG FAMILY SIZE
2.9
AVG HOUSEHOLD SIZE
1,050,457
LABOR FORCE [ PEOPLE ]
67.4%
PERCENT IN LABOR FORCE
4.4%
UNEMPLOYMENT RATE
Income in Santa Clara County
Income Overview in Santa Clara County
Per Capita Income in Santa Clara County is $73,017, while median incomes of families and households are $174,855 and $153,792 respectively.
| Characteristic | Number | Measure |
| Per Capita Income | 1,916,831 | $73,017 |
| Median Family Income | 459,624 | $174,855 |
| Mean Family Income | 459,624 | $235,112 |
| Median Household Income | 650,352 | $153,792 |
| Mean Household Income | 650,352 | $210,349 |
| Income Deficit | 459,624 | $11,061 |
| Wage / Income Gap (%) | 1,916,831 | 37.03% |
| Wage / Income Gap ($) | 1,916,831 | 62.97¢ per $1 |
| Gini / Inequality Index | 1,916,831 | 0.47 |
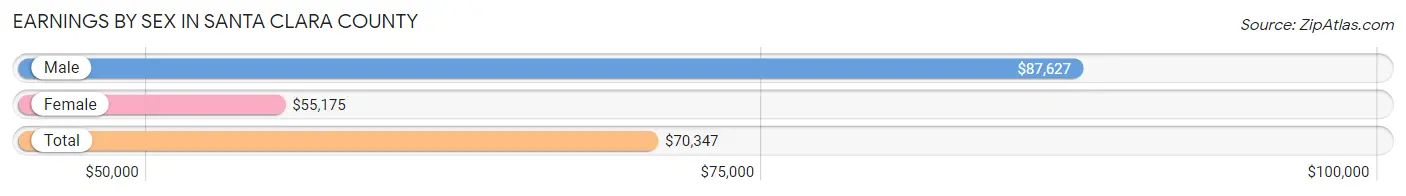
Earnings by Sex in Santa Clara County
Average Earnings in Santa Clara County are $70,347, $87,627 for men and $55,175 for women, a difference of 37.0%.
| Sex | Number | Average Earnings |
| Male | 602,370 (55.7%) | $87,627 |
| Female | 478,501 (44.3%) | $55,175 |
| Total | 1,080,871 (100.0%) | $70,347 |
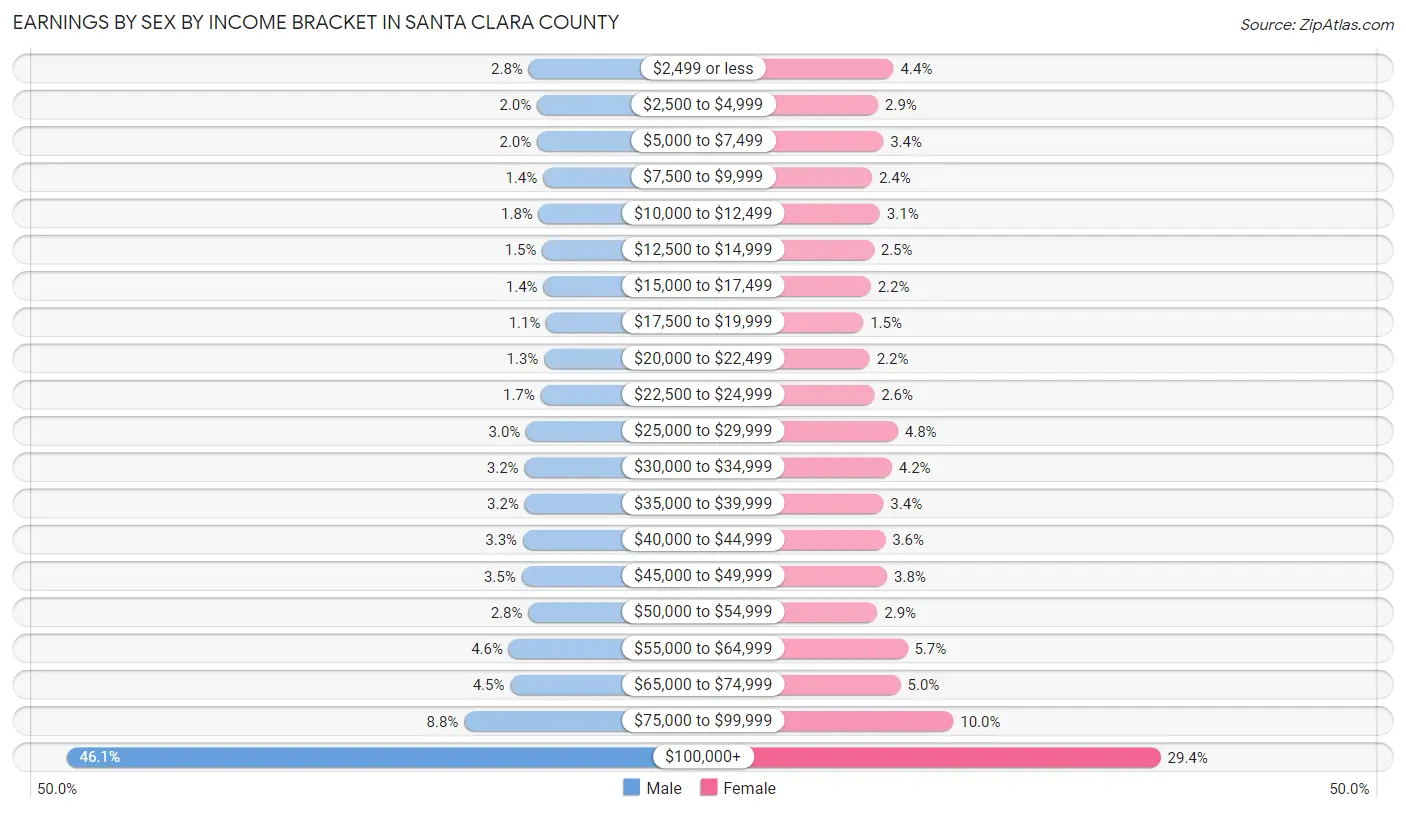
Earnings by Sex by Income Bracket in Santa Clara County
The most common earnings brackets in Santa Clara County are $100,000+ for men (277,486 | 46.1%) and $100,000+ for women (140,695 | 29.4%).
| Income | Male | Female |
| $2,499 or less | 16,733 (2.8%) | 21,015 (4.4%) |
| $2,500 to $4,999 | 12,004 (2.0%) | 14,029 (2.9%) |
| $5,000 to $7,499 | 12,015 (2.0%) | 16,300 (3.4%) |
| $7,500 to $9,999 | 8,598 (1.4%) | 11,301 (2.4%) |
| $10,000 to $12,499 | 11,086 (1.8%) | 14,834 (3.1%) |
| $12,500 to $14,999 | 9,039 (1.5%) | 12,124 (2.5%) |
| $15,000 to $17,499 | 8,411 (1.4%) | 10,721 (2.2%) |
| $17,500 to $19,999 | 6,815 (1.1%) | 7,363 (1.5%) |
| $20,000 to $22,499 | 8,029 (1.3%) | 10,273 (2.1%) |
| $22,500 to $24,999 | 9,972 (1.7%) | 12,305 (2.6%) |
| $25,000 to $29,999 | 18,141 (3.0%) | 22,876 (4.8%) |
| $30,000 to $34,999 | 19,126 (3.2%) | 20,214 (4.2%) |
| $35,000 to $39,999 | 18,995 (3.2%) | 16,397 (3.4%) |
| $40,000 to $44,999 | 20,013 (3.3%) | 17,222 (3.6%) |
| $45,000 to $49,999 | 20,769 (3.5%) | 18,074 (3.8%) |
| $50,000 to $54,999 | 16,954 (2.8%) | 13,677 (2.9%) |
| $55,000 to $64,999 | 27,955 (4.6%) | 27,198 (5.7%) |
| $65,000 to $74,999 | 27,093 (4.5%) | 24,135 (5.0%) |
| $75,000 to $99,999 | 53,136 (8.8%) | 47,748 (10.0%) |
| $100,000+ | 277,486 (46.1%) | 140,695 (29.4%) |
| Total | 602,370 (100.0%) | 478,501 (100.0%) |
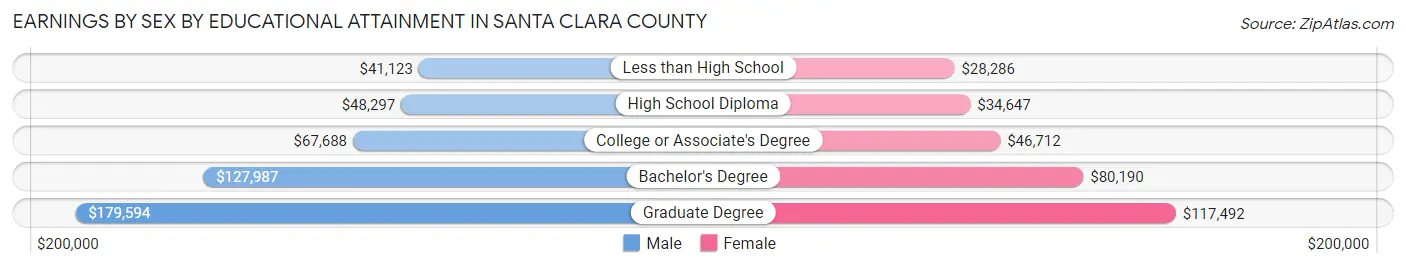
Earnings by Sex by Educational Attainment in Santa Clara County
Average earnings in Santa Clara County are $102,912 for men and $64,764 for women, a difference of 37.1%. Men with an educational attainment of graduate degree enjoy the highest average annual earnings of $179,594, while those with less than high school education earn the least with $41,123. Women with an educational attainment of graduate degree earn the most with the average annual earnings of $117,492, while those with less than high school education have the smallest earnings of $28,286.
| Educational Attainment | Male Income | Female Income |
| Less than High School | $41,123 | $28,286 |
| High School Diploma | $48,297 | $34,647 |
| College or Associate's Degree | $67,688 | $46,712 |
| Bachelor's Degree | $127,987 | $80,190 |
| Graduate Degree | $179,594 | $117,492 |
| Total | $102,912 | $64,764 |
Family Income in Santa Clara County
Family Income Brackets in Santa Clara County
According to the Santa Clara County family income data, there are 199,936 families falling into the $200,000+ income range, which is the most common income bracket and makes up 43.5% of all families. Conversely, the $10,000 to $14,999 income bracket is the least frequent group with only 3,217 families (0.7%) belonging to this category.
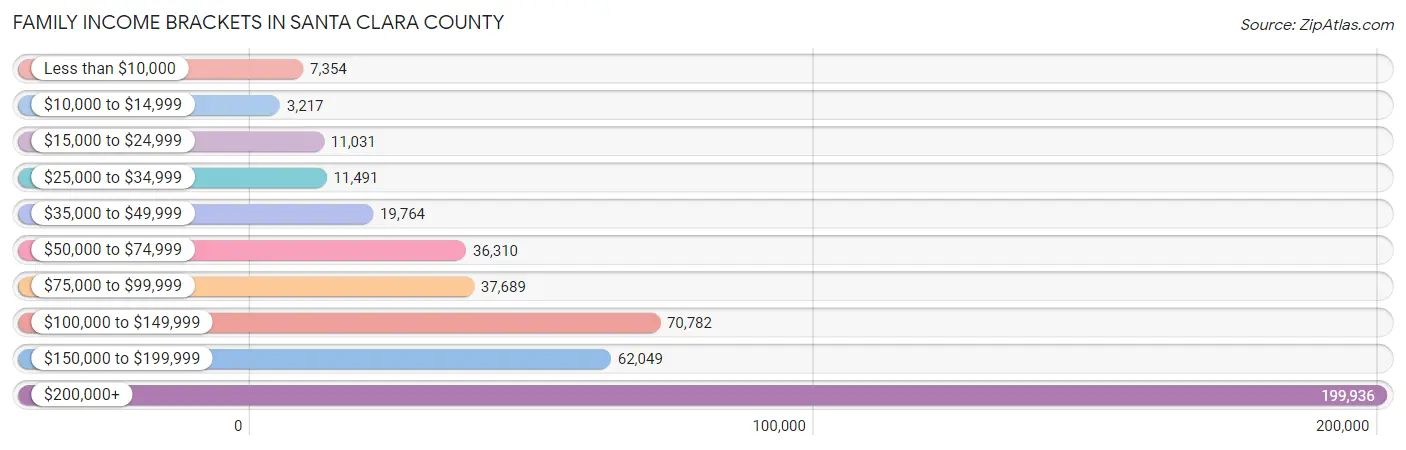
| Income Bracket | # Families | % Families |
| Less than $10,000 | 7,354 | 1.6% |
| $10,000 to $14,999 | 3,217 | 0.7% |
| $15,000 to $24,999 | 11,031 | 2.4% |
| $25,000 to $34,999 | 11,491 | 2.5% |
| $35,000 to $49,999 | 19,764 | 4.3% |
| $50,000 to $74,999 | 36,310 | 7.9% |
| $75,000 to $99,999 | 37,689 | 8.2% |
| $100,000 to $149,999 | 70,782 | 15.4% |
| $150,000 to $199,999 | 62,049 | 13.5% |
| $200,000+ | 199,936 | 43.5% |
Family Income by Famaliy Size in Santa Clara County
4-person families (105,029 | 22.9%) account for the highest median family income in Santa Clara County with $215,088 per family, while 2-person families (173,789 | 37.8%) have the highest median income of $73,366 per family member.
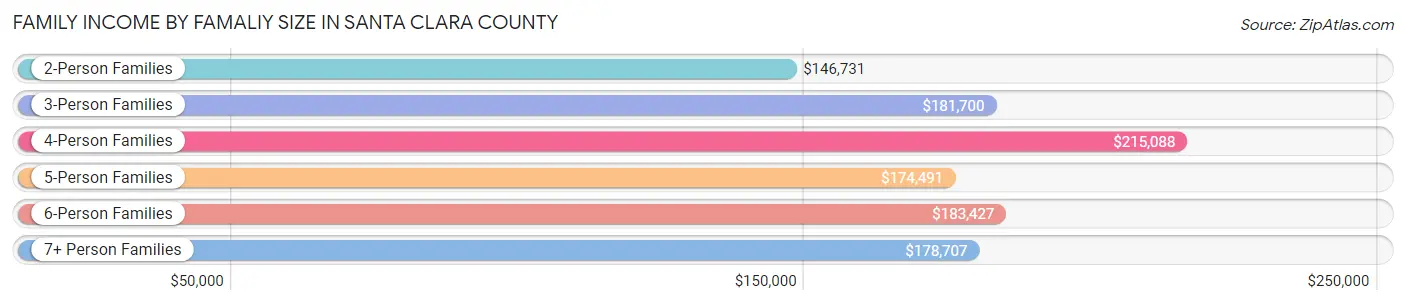
| Income Bracket | # Families | Median Income |
| 2-Person Families | 173,789 (37.8%) | $146,731 |
| 3-Person Families | 116,093 (25.3%) | $181,700 |
| 4-Person Families | 105,029 (22.9%) | $215,088 |
| 5-Person Families | 40,092 (8.7%) | $174,491 |
| 6-Person Families | 14,515 (3.2%) | $183,427 |
| 7+ Person Families | 10,106 (2.2%) | $178,707 |
| Total | 459,624 (100.0%) | $174,855 |
Family Income by Number of Earners in Santa Clara County
The median family income in Santa Clara County is $174,855, with families comprising 2 earners (207,867) having the highest median family income of $227,185, while families with no earners (45,278) have the lowest median family income of $66,714, accounting for 45.2% and 9.9% of families, respectively.
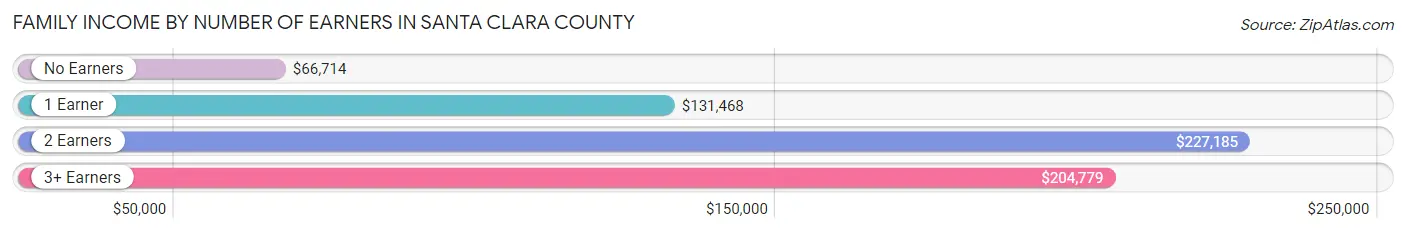
| Number of Earners | # Families | Median Income |
| No Earners | 45,278 (9.9%) | $66,714 |
| 1 Earner | 137,203 (29.8%) | $131,468 |
| 2 Earners | 207,867 (45.2%) | $227,185 |
| 3+ Earners | 69,276 (15.1%) | $204,779 |
| Total | 459,624 (100.0%) | $174,855 |
Household Income in Santa Clara County
Household Income Brackets in Santa Clara County
With 247,134 households falling in the category, the $200,000+ income range is the most frequent in Santa Clara County, accounting for 38.0% of all households. In contrast, only 12,357 households (1.9%) fall into the $10,000 to $14,999 income bracket, making it the least populous group.
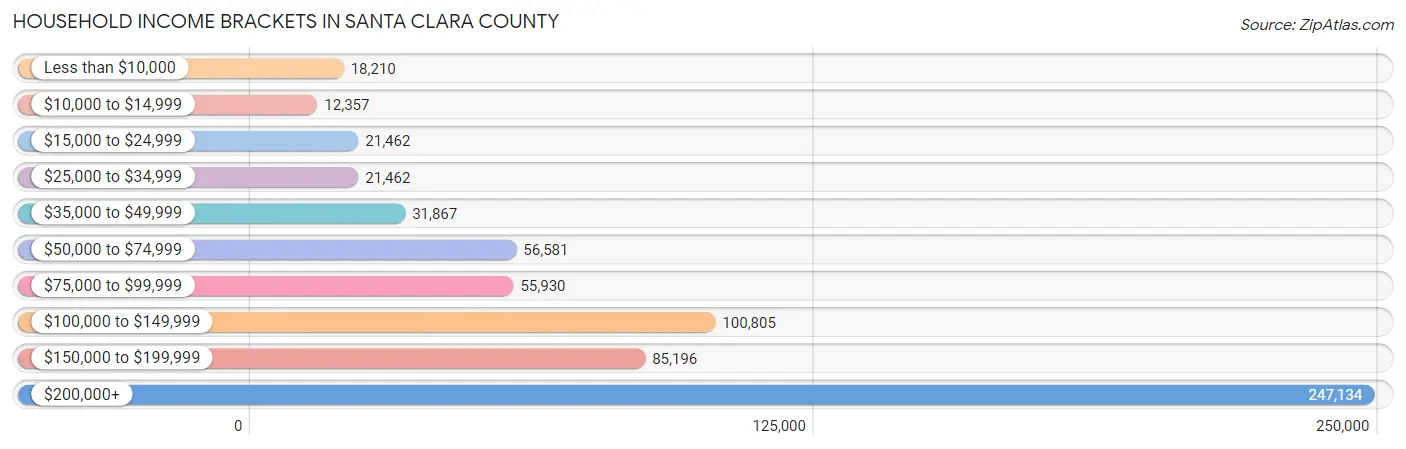
| Income Bracket | # Households | % Households |
| Less than $10,000 | 18,210 | 2.8% |
| $10,000 to $14,999 | 12,357 | 1.9% |
| $15,000 to $24,999 | 21,462 | 3.3% |
| $25,000 to $34,999 | 21,462 | 3.3% |
| $35,000 to $49,999 | 31,867 | 4.9% |
| $50,000 to $74,999 | 56,581 | 8.7% |
| $75,000 to $99,999 | 55,930 | 8.6% |
| $100,000 to $149,999 | 100,805 | 15.5% |
| $150,000 to $199,999 | 85,196 | 13.1% |
| $200,000+ | 247,134 | 38.0% |
Household Income by Householder Age in Santa Clara County
The median household income in Santa Clara County is $153,792, with the highest median household income of $181,845 found in the 25 to 44 years age bracket for the primary householder. A total of 244,651 households (37.6%) fall into this category. Meanwhile, the 15 to 24 years age bracket for the primary householder has the lowest median household income of $78,963, with 15,856 households (2.4%) in this group.
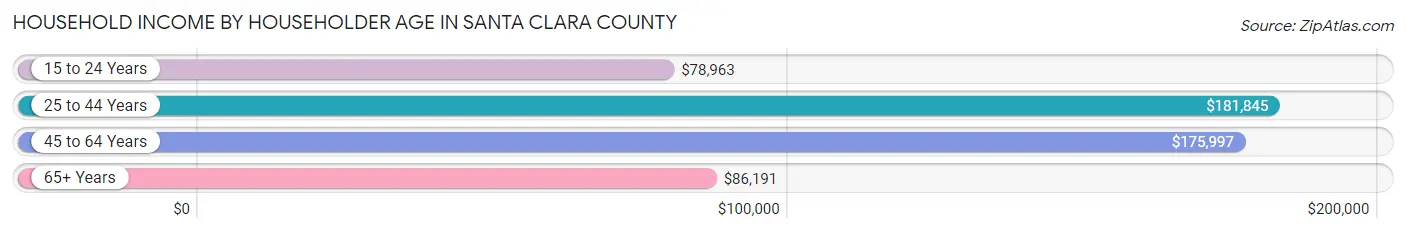
| Income Bracket | # Households | Median Income |
| 15 to 24 Years | 15,856 (2.4%) | $78,963 |
| 25 to 44 Years | 244,651 (37.6%) | $181,845 |
| 45 to 64 Years | 246,838 (38.0%) | $175,997 |
| 65+ Years | 143,007 (22.0%) | $86,191 |
| Total | 650,352 (100.0%) | $153,792 |
Poverty in Santa Clara County
Income Below Poverty by Sex and Age in Santa Clara County
With 6.2% poverty level for males and 7.6% for females among the residents of Santa Clara County, 18 to 24 year old males and 18 to 24 year old females are the most vulnerable to poverty, with 10,495 males (13.1%) and 11,248 females (15.3%) in their respective age groups living below the poverty level.
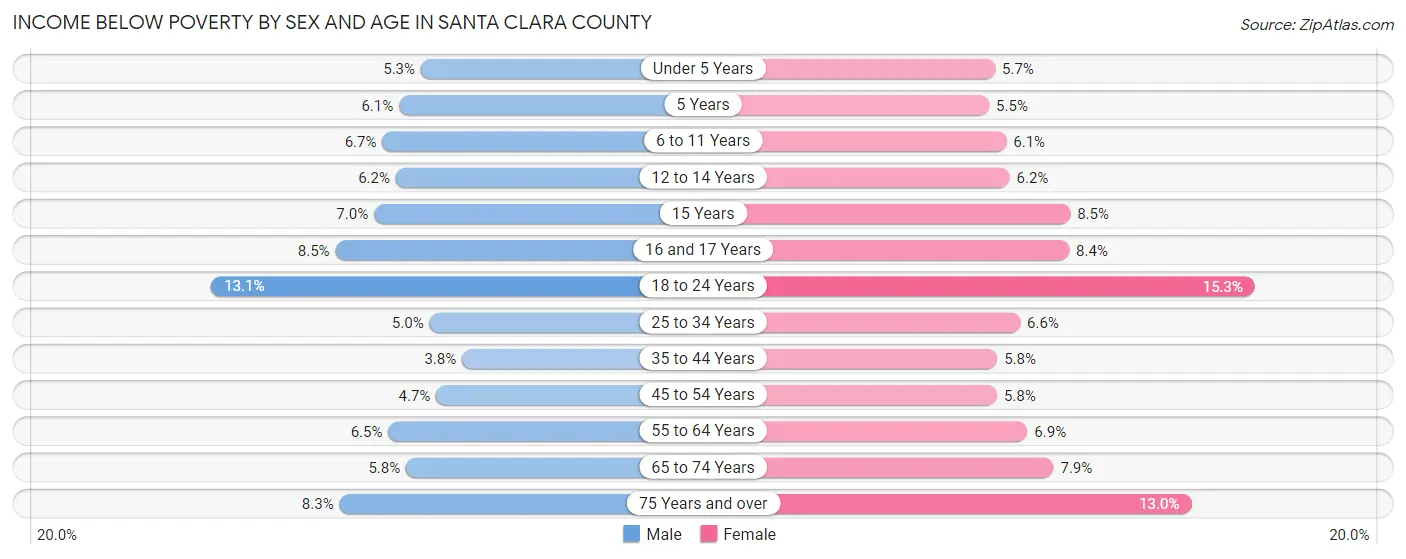
| Age Bracket | Male | Female |
| Under 5 Years | 2,804 (5.3%) | 2,832 (5.7%) |
| 5 Years | 656 (6.1%) | 545 (5.5%) |
| 6 to 11 Years | 4,601 (6.7%) | 3,945 (6.1%) |
| 12 to 14 Years | 2,340 (6.2%) | 2,208 (6.2%) |
| 15 Years | 878 (7.0%) | 1,001 (8.5%) |
| 16 and 17 Years | 2,043 (8.5%) | 1,943 (8.4%) |
| 18 to 24 Years | 10,495 (13.1%) | 11,248 (15.3%) |
| 25 to 34 Years | 8,149 (5.0%) | 9,224 (6.6%) |
| 35 to 44 Years | 5,422 (3.8%) | 7,600 (5.8%) |
| 45 to 54 Years | 6,238 (4.7%) | 7,269 (5.8%) |
| 55 to 64 Years | 7,595 (6.5%) | 7,731 (6.9%) |
| 65 to 74 Years | 4,124 (5.8%) | 6,206 (7.9%) |
| 75 Years and over | 4,045 (8.3%) | 8,692 (13.0%) |
| Total | 59,390 (6.2%) | 70,444 (7.6%) |
Income Above Poverty by Sex and Age in Santa Clara County
According to the poverty statistics in Santa Clara County, males aged 35 to 44 years and females aged 5 years are the age groups that are most secure financially, with 96.2% of males and 94.5% of females in these age groups living above the poverty line.
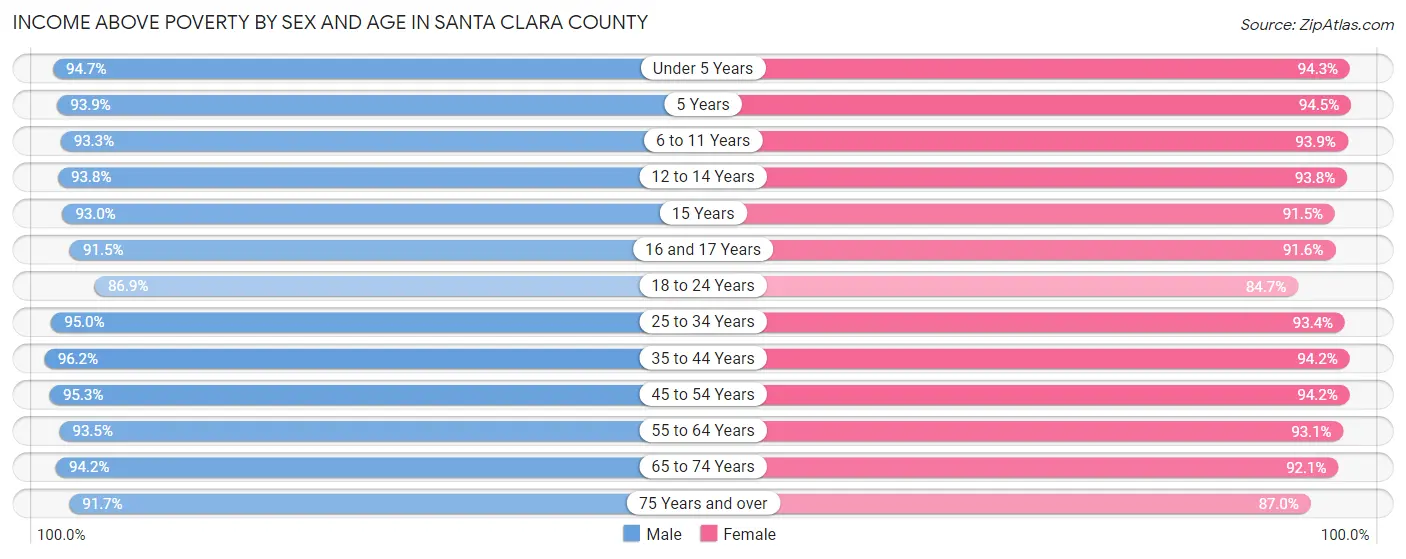
| Age Bracket | Male | Female |
| Under 5 Years | 50,250 (94.7%) | 46,967 (94.3%) |
| 5 Years | 10,100 (93.9%) | 9,419 (94.5%) |
| 6 to 11 Years | 63,908 (93.3%) | 60,631 (93.9%) |
| 12 to 14 Years | 35,301 (93.8%) | 33,255 (93.8%) |
| 15 Years | 11,606 (93.0%) | 10,799 (91.5%) |
| 16 and 17 Years | 22,095 (91.5%) | 21,084 (91.6%) |
| 18 to 24 Years | 69,825 (86.9%) | 62,141 (84.7%) |
| 25 to 34 Years | 155,777 (95.0%) | 130,047 (93.4%) |
| 35 to 44 Years | 138,742 (96.2%) | 124,081 (94.2%) |
| 45 to 54 Years | 125,921 (95.3%) | 118,924 (94.2%) |
| 55 to 64 Years | 109,181 (93.5%) | 104,463 (93.1%) |
| 65 to 74 Years | 66,519 (94.2%) | 72,710 (92.1%) |
| 75 Years and over | 44,642 (91.7%) | 58,340 (87.0%) |
| Total | 903,867 (93.8%) | 852,861 (92.4%) |
Income Below Poverty Among Married-Couple Families in Santa Clara County
The poverty statistics for married-couple families in Santa Clara County show that 2.7% or 9,734 of the total 361,639 families live below the poverty line. Families with 5 or more children have the highest poverty rate of 8.7%, comprising of 82 families. On the other hand, families with 1 or 2 children have the lowest poverty rate of 2.2%, which includes 3,364 families.
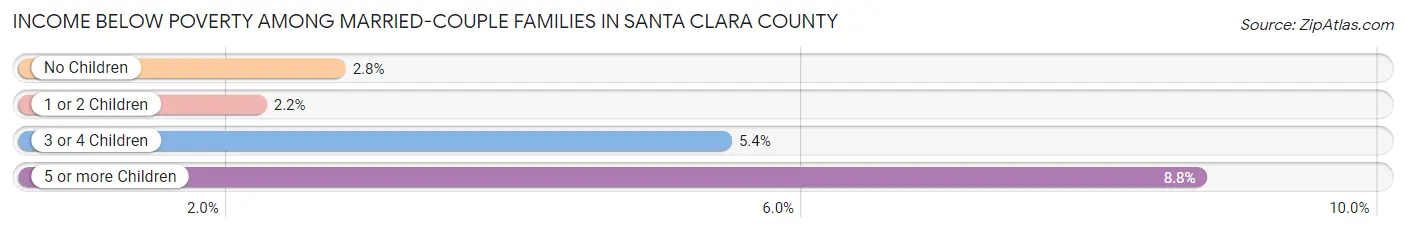
| Children | Above Poverty | Below Poverty |
| No Children | 181,529 (97.3%) | 5,141 (2.8%) |
| 1 or 2 Children | 149,568 (97.8%) | 3,364 (2.2%) |
| 3 or 4 Children | 19,953 (94.6%) | 1,147 (5.4%) |
| 5 or more Children | 855 (91.2%) | 82 (8.7%) |
| Total | 351,905 (97.3%) | 9,734 (2.7%) |
Income Below Poverty Among Single-Parent Households in Santa Clara County
According to the poverty data in Santa Clara County, 5.4% or 1,798 single-father households and 11.0% or 7,091 single-mother households are living below the poverty line. Among single-father households, those with 3 or 4 children have the highest poverty rate, with 333 households (20.3%) experiencing poverty. Likewise, among single-mother households, those with 5 or more children have the highest poverty rate, with 230 households (50.5%) falling below the poverty line.
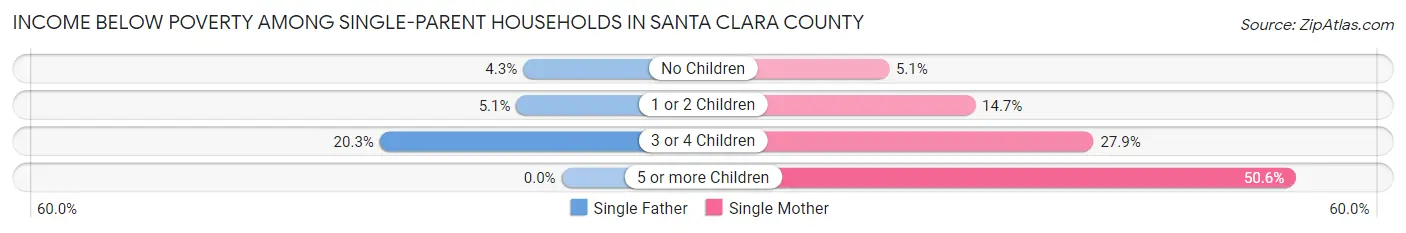
| Children | Single Father | Single Mother |
| No Children | 768 (4.3%) | 1,652 (5.1%) |
| 1 or 2 Children | 697 (5.1%) | 4,010 (14.7%) |
| 3 or 4 Children | 333 (20.3%) | 1,199 (27.9%) |
| 5 or more Children | 0 (0.0%) | 230 (50.5%) |
| Total | 1,798 (5.4%) | 7,091 (11.0%) |
Income Below Poverty Among Married-Couple vs Single-Parent Households in Santa Clara County
The poverty data for Santa Clara County shows that 9,734 of the married-couple family households (2.7%) and 8,889 of the single-parent households (9.1%) are living below the poverty level. Within the married-couple family households, those with 5 or more children have the highest poverty rate, with 82 households (8.7%) falling below the poverty line. Among the single-parent households, those with 5 or more children have the highest poverty rate, with 230 household (41.2%) living below poverty.
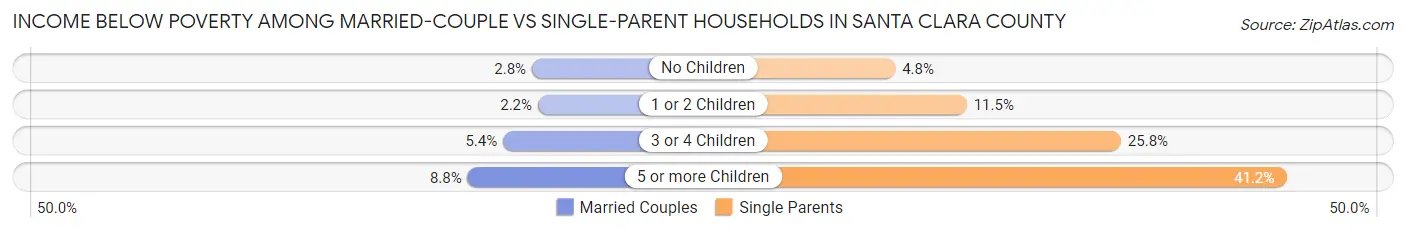
| Children | Married-Couple Families | Single-Parent Households |
| No Children | 5,141 (2.8%) | 2,420 (4.8%) |
| 1 or 2 Children | 3,364 (2.2%) | 4,707 (11.5%) |
| 3 or 4 Children | 1,147 (5.4%) | 1,532 (25.8%) |
| 5 or more Children | 82 (8.7%) | 230 (41.2%) |
| Total | 9,734 (2.7%) | 8,889 (9.1%) |
Race in Santa Clara County
The most populous races in Santa Clara County are Asian (746,381 | 38.9%), White / Caucasian (693,455 | 36.2%), and Hispanic or Latino (476,352 | 24.8%).
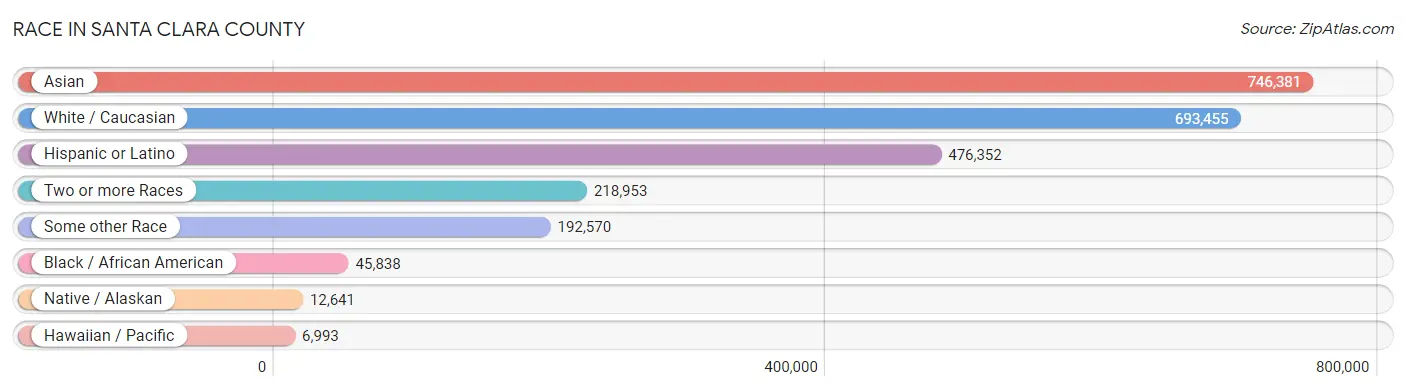
| Race | # Population | % Population |
| Asian | 746,381 | 38.9% |
| Black / African American | 45,838 | 2.4% |
| Hawaiian / Pacific | 6,993 | 0.4% |
| Hispanic or Latino | 476,352 | 24.8% |
| Native / Alaskan | 12,641 | 0.7% |
| White / Caucasian | 693,455 | 36.2% |
| Two or more Races | 218,953 | 11.4% |
| Some other Race | 192,570 | 10.1% |
| Total | 1,916,831 | 100.0% |
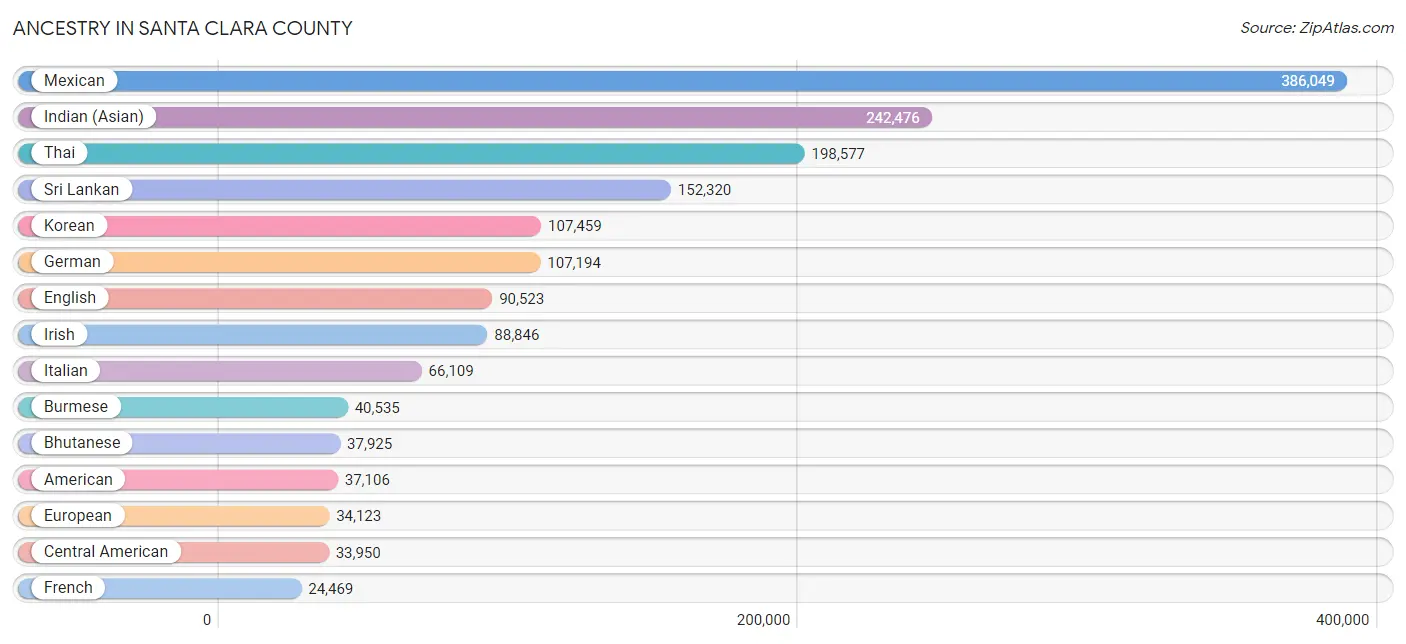
Ancestry in Santa Clara County
The most populous ancestries reported in Santa Clara County are Mexican (386,049 | 20.1%), Indian (Asian) (242,476 | 12.7%), Thai (198,577 | 10.4%), Sri Lankan (152,320 | 8.0%), and Korean (107,459 | 5.6%), together accounting for 56.7% of all Santa Clara County residents.
| Ancestry | # Population | % Population |
| Afghan | 841 | 0.0% |
| African | 4,176 | 0.2% |
| Alaska Native | 35 | 0.0% |
| Alaskan Athabascan | 21 | 0.0% |
| Albanian | 254 | 0.0% |
| Aleut | 2 | 0.0% |
| Alsatian | 42 | 0.0% |
| American | 37,106 | 1.9% |
| Apache | 1,645 | 0.1% |
| Arab | 14,646 | 0.8% |
| Argentinean | 2,902 | 0.2% |
| Armenian | 3,532 | 0.2% |
| Assyrian / Chaldean / Syriac | 3,418 | 0.2% |
| Australian | 1,300 | 0.1% |
| Austrian | 3,554 | 0.2% |
| Bahamian | 58 | 0.0% |
| Bangladeshi | 1,153 | 0.1% |
| Barbadian | 55 | 0.0% |
| Basque | 556 | 0.0% |
| Belgian | 1,103 | 0.1% |
| Belizean | 13 | 0.0% |
| Bhutanese | 37,925 | 2.0% |
| Blackfeet | 455 | 0.0% |
| Bolivian | 631 | 0.0% |
| Brazilian | 3,570 | 0.2% |
| British | 10,204 | 0.5% |
| British West Indian | 80 | 0.0% |
| Bulgarian | 907 | 0.1% |
| Burmese | 40,535 | 2.1% |
| Cajun | 190 | 0.0% |
| Cambodian | 668 | 0.0% |
| Canadian | 3,367 | 0.2% |
| Cape Verdean | 220 | 0.0% |
| Celtic | 287 | 0.0% |
| Central American | 33,950 | 1.8% |
| Central American Indian | 2,087 | 0.1% |
| Cherokee | 3,005 | 0.2% |
| Cheyenne | 10 | 0.0% |
| Chickasaw | 22 | 0.0% |
| Chilean | 2,349 | 0.1% |
| Chinese | 43 | 0.0% |
| Chippewa | 329 | 0.0% |
| Choctaw | 639 | 0.0% |
| Colombian | 5,974 | 0.3% |
| Colville | 19 | 0.0% |
| Comanche | 297 | 0.0% |
| Costa Rican | 1,174 | 0.1% |
| Cree | 8 | 0.0% |
| Creek | 217 | 0.0% |
| Croatian | 3,324 | 0.2% |
| Crow | 24 | 0.0% |
| Cuban | 3,284 | 0.2% |
| Cypriot | 173 | 0.0% |
| Czech | 3,542 | 0.2% |
| Czechoslovakian | 832 | 0.0% |
| Danish | 6,454 | 0.3% |
| Delaware | 29 | 0.0% |
| Dominican | 725 | 0.0% |
| Dutch | 11,559 | 0.6% |
| Dutch West Indian | 12 | 0.0% |
| Eastern European | 5,064 | 0.3% |
| Ecuadorian | 922 | 0.1% |
| Egyptian | 2,918 | 0.2% |
| English | 90,523 | 4.7% |
| Estonian | 168 | 0.0% |
| Ethiopian | 4,340 | 0.2% |
| European | 34,123 | 1.8% |
| Fijian | 4 | 0.0% |
| Filipino | 18,529 | 1.0% |
| Finnish | 2,705 | 0.1% |
| French | 24,469 | 1.3% |
| French American Indian | 32 | 0.0% |
| French Canadian | 3,957 | 0.2% |
| German | 107,194 | 5.6% |
| German Russian | 19 | 0.0% |
| Ghanaian | 374 | 0.0% |
| Greek | 6,200 | 0.3% |
| Guamanian / Chamorro | 2,185 | 0.1% |
| Guatemalan | 7,416 | 0.4% |
| Guyanese | 319 | 0.0% |
| Haitian | 262 | 0.0% |
| Honduran | 4,104 | 0.2% |
| Hopi | 36 | 0.0% |
| Houma | 53 | 0.0% |
| Hungarian | 4,458 | 0.2% |
| Icelander | 703 | 0.0% |
| Indian (Asian) | 242,476 | 12.7% |
| Indonesian | 1,770 | 0.1% |
| Inupiat | 431 | 0.0% |
| Iranian | 19,206 | 1.0% |
| Iraqi | 1,089 | 0.1% |
| Irish | 88,846 | 4.6% |
| Iroquois | 41 | 0.0% |
| Israeli | 3,413 | 0.2% |
| Italian | 66,109 | 3.5% |
| Jamaican | 978 | 0.1% |
| Japanese | 4,954 | 0.3% |
| Jordanian | 724 | 0.0% |
| Kenyan | 585 | 0.0% |
| Korean | 107,459 | 5.6% |
| Laotian | 2,615 | 0.1% |
| Latvian | 616 | 0.0% |
| Lebanese | 2,973 | 0.2% |
| Liberian | 17 | 0.0% |
| Lithuanian | 3,089 | 0.2% |
| Lumbee | 79 | 0.0% |
| Luxembourger | 78 | 0.0% |
| Macedonian | 210 | 0.0% |
| Malaysian | 2,727 | 0.1% |
| Maltese | 770 | 0.0% |
| Menominee | 5 | 0.0% |
| Mexican | 386,049 | 20.1% |
| Mexican American Indian | 7,592 | 0.4% |
| Mongolian | 818 | 0.0% |
| Moroccan | 740 | 0.0% |
| Native Hawaiian | 4,140 | 0.2% |
| Navajo | 1,030 | 0.1% |
| Nepalese | 37 | 0.0% |
| New Zealander | 200 | 0.0% |
| Nicaraguan | 4,713 | 0.3% |
| Nigerian | 1,647 | 0.1% |
| Northern European | 4,026 | 0.2% |
| Norwegian | 13,664 | 0.7% |
| Okinawan | 543 | 0.0% |
| Osage | 11 | 0.0% |
| Ottawa | 195 | 0.0% |
| Paiute | 109 | 0.0% |
| Pakistani | 2,950 | 0.2% |
| Palestinian | 1,753 | 0.1% |
| Panamanian | 845 | 0.0% |
| Paraguayan | 68 | 0.0% |
| Pennsylvania German | 154 | 0.0% |
| Peruvian | 5,402 | 0.3% |
| Pima | 75 | 0.0% |
| Polish | 20,141 | 1.1% |
| Portuguese | 20,689 | 1.1% |
| Potawatomi | 177 | 0.0% |
| Pueblo | 235 | 0.0% |
| Puerto Rican | 8,798 | 0.5% |
| Romanian | 3,083 | 0.2% |
| Russian | 19,978 | 1.0% |
| Salvadoran | 15,502 | 0.8% |
| Samoan | 2,355 | 0.1% |
| Scandinavian | 3,765 | 0.2% |
| Scotch-Irish | 6,409 | 0.3% |
| Scottish | 17,296 | 0.9% |
| Seminole | 48 | 0.0% |
| Senegalese | 333 | 0.0% |
| Serbian | 912 | 0.1% |
| Shoshone | 19 | 0.0% |
| Sierra Leonean | 289 | 0.0% |
| Sioux | 312 | 0.0% |
| Slavic | 718 | 0.0% |
| Slovak | 1,382 | 0.1% |
| Slovene | 482 | 0.0% |
| Somali | 429 | 0.0% |
| South African | 712 | 0.0% |
| South American | 20,031 | 1.1% |
| South American Indian | 490 | 0.0% |
| Spaniard | 8,164 | 0.4% |
| Spanish | 5,792 | 0.3% |
| Spanish American | 129 | 0.0% |
| Spanish American Indian | 82 | 0.0% |
| Sri Lankan | 152,320 | 8.0% |
| Subsaharan African | 13,977 | 0.7% |
| Sudanese | 158 | 0.0% |
| Swedish | 14,431 | 0.7% |
| Swiss | 5,391 | 0.3% |
| Syrian | 1,003 | 0.1% |
| Taiwanese | 281 | 0.0% |
| Thai | 198,577 | 10.4% |
| Tlingit-Haida | 37 | 0.0% |
| Tohono O'Odham | 196 | 0.0% |
| Tongan | 1,320 | 0.1% |
| Trinidadian and Tobagonian | 290 | 0.0% |
| Tsimshian | 159 | 0.0% |
| Turkish | 3,853 | 0.2% |
| Ugandan | 25 | 0.0% |
| Ukrainian | 7,809 | 0.4% |
| Uruguayan | 191 | 0.0% |
| Ute | 19 | 0.0% |
| Venezuelan | 1,454 | 0.1% |
| Vietnamese | 1,543 | 0.1% |
| Welsh | 5,099 | 0.3% |
| West Indian | 260 | 0.0% |
| Yakama | 7 | 0.0% |
| Yaqui | 633 | 0.0% |
| Yugoslavian | 2,213 | 0.1% |
| Yuman | 45 | 0.0% |
| Yup'ik | 56 | 0.0% |
| Zimbabwean | 14 | 0.0% | View All 191 Rows |
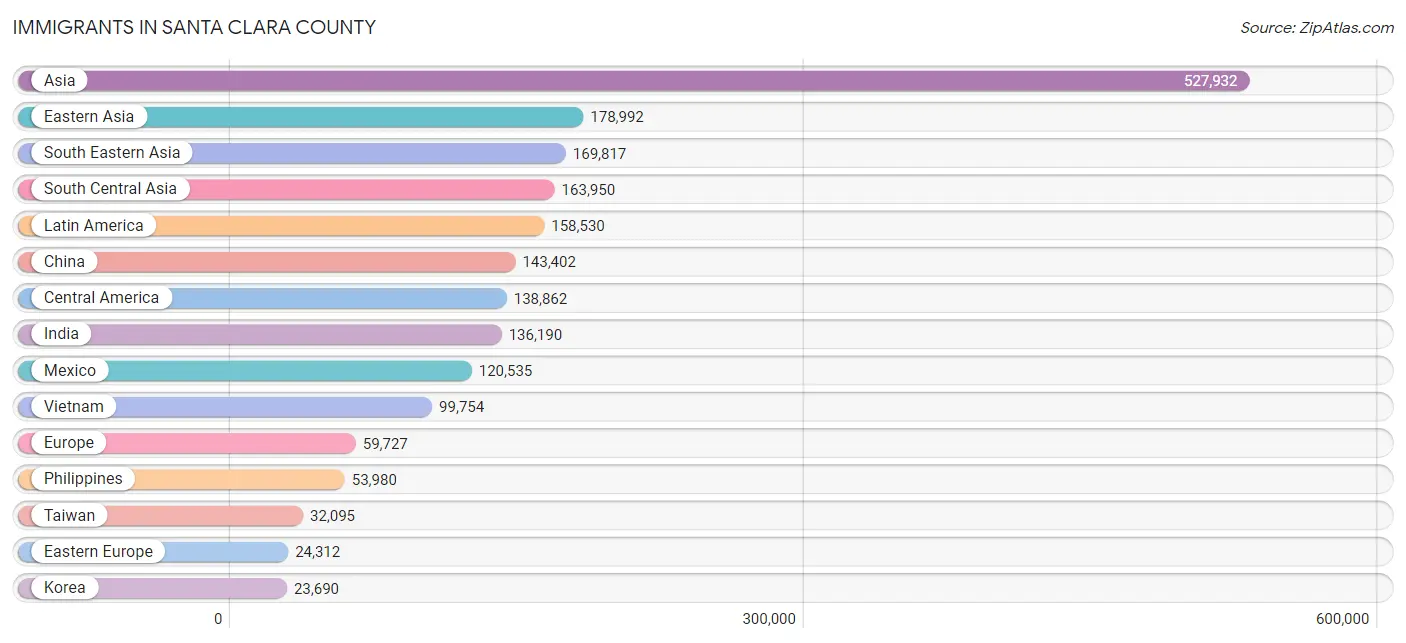
Immigrants in Santa Clara County
The most numerous immigrant groups reported in Santa Clara County came from Asia (527,932 | 27.5%), Eastern Asia (178,992 | 9.3%), South Eastern Asia (169,817 | 8.9%), South Central Asia (163,950 | 8.6%), and Latin America (158,530 | 8.3%), together accounting for 62.6% of all Santa Clara County residents.
| Immigration Origin | # Population | % Population |
| Afghanistan | 685 | 0.0% |
| Africa | 13,054 | 0.7% |
| Albania | 45 | 0.0% |
| Argentina | 2,019 | 0.1% |
| Armenia | 610 | 0.0% |
| Asia | 527,932 | 27.5% |
| Australia | 1,880 | 0.1% |
| Austria | 578 | 0.0% |
| Azores | 1,005 | 0.1% |
| Bangladesh | 1,316 | 0.1% |
| Barbados | 36 | 0.0% |
| Belarus | 1,237 | 0.1% |
| Belgium | 471 | 0.0% |
| Belize | 64 | 0.0% |
| Bolivia | 377 | 0.0% |
| Bosnia and Herzegovina | 1,274 | 0.1% |
| Brazil | 4,639 | 0.2% |
| Bulgaria | 579 | 0.0% |
| Cambodia | 2,213 | 0.1% |
| Cameroon | 392 | 0.0% |
| Canada | 9,875 | 0.5% |
| Caribbean | 1,645 | 0.1% |
| Central America | 138,862 | 7.2% |
| Chile | 1,512 | 0.1% |
| China | 143,402 | 7.5% |
| Colombia | 4,177 | 0.2% |
| Congo | 52 | 0.0% |
| Costa Rica | 249 | 0.0% |
| Croatia | 537 | 0.0% |
| Cuba | 749 | 0.0% |
| Czechoslovakia | 686 | 0.0% |
| Denmark | 415 | 0.0% |
| Dominica | 45 | 0.0% |
| Dominican Republic | 150 | 0.0% |
| Eastern Africa | 6,486 | 0.3% |
| Eastern Asia | 178,992 | 9.3% |
| Eastern Europe | 24,312 | 1.3% |
| Ecuador | 389 | 0.0% |
| Egypt | 1,675 | 0.1% |
| El Salvador | 8,010 | 0.4% |
| England | 2,826 | 0.2% |
| Eritrea | 1,036 | 0.1% |
| Ethiopia | 3,476 | 0.2% |
| Europe | 59,727 | 3.1% |
| Fiji | 1,303 | 0.1% |
| France | 4,221 | 0.2% |
| Germany | 6,323 | 0.3% |
| Ghana | 289 | 0.0% |
| Greece | 1,092 | 0.1% |
| Grenada | 9 | 0.0% |
| Guatemala | 3,948 | 0.2% |
| Guyana | 188 | 0.0% |
| Haiti | 34 | 0.0% |
| Honduras | 3,027 | 0.2% |
| Hong Kong | 11,846 | 0.6% |
| Hungary | 568 | 0.0% |
| India | 136,190 | 7.1% |
| Indonesia | 2,636 | 0.1% |
| Iran | 17,345 | 0.9% |
| Iraq | 1,117 | 0.1% |
| Ireland | 1,189 | 0.1% |
| Israel | 4,539 | 0.2% |
| Italy | 2,301 | 0.1% |
| Jamaica | 375 | 0.0% |
| Japan | 11,371 | 0.6% |
| Jordan | 874 | 0.1% |
| Kazakhstan | 633 | 0.0% |
| Kenya | 869 | 0.1% |
| Korea | 23,690 | 1.2% |
| Kuwait | 358 | 0.0% |
| Laos | 1,832 | 0.1% |
| Latin America | 158,530 | 8.3% |
| Latvia | 260 | 0.0% |
| Lebanon | 1,433 | 0.1% |
| Liberia | 31 | 0.0% |
| Lithuania | 448 | 0.0% |
| Malaysia | 3,464 | 0.2% |
| Mexico | 120,535 | 6.3% |
| Micronesia | 32 | 0.0% |
| Middle Africa | 548 | 0.0% |
| Moldova | 472 | 0.0% |
| Morocco | 316 | 0.0% |
| Nepal | 1,784 | 0.1% |
| Netherlands | 1,165 | 0.1% |
| Nicaragua | 2,567 | 0.1% |
| Nigeria | 812 | 0.0% |
| North Macedonia | 61 | 0.0% |
| Northern Africa | 2,552 | 0.1% |
| Northern Europe | 12,483 | 0.6% |
| Norway | 186 | 0.0% |
| Oceania | 4,531 | 0.2% |
| Pakistan | 4,046 | 0.2% |
| Panama | 398 | 0.0% |
| Peru | 3,263 | 0.2% |
| Philippines | 53,980 | 2.8% |
| Poland | 1,847 | 0.1% |
| Portugal | 4,086 | 0.2% |
| Romania | 1,272 | 0.1% |
| Russia | 8,282 | 0.4% |
| Saudi Arabia | 687 | 0.0% |
| Scotland | 354 | 0.0% |
| Senegal | 333 | 0.0% |
| Serbia | 423 | 0.0% |
| Sierra Leone | 336 | 0.0% |
| Singapore | 1,859 | 0.1% |
| Somalia | 455 | 0.0% |
| South Africa | 1,210 | 0.1% |
| South America | 18,023 | 0.9% |
| South Central Asia | 163,950 | 8.6% |
| South Eastern Asia | 169,817 | 8.9% |
| Southern Europe | 8,806 | 0.5% |
| Spain | 1,243 | 0.1% |
| Sri Lanka | 1,117 | 0.1% |
| Sudan | 185 | 0.0% |
| Sweden | 1,315 | 0.1% |
| Switzerland | 1,183 | 0.1% |
| Syria | 315 | 0.0% |
| Taiwan | 32,095 | 1.7% |
| Thailand | 2,264 | 0.1% |
| Trinidad and Tobago | 191 | 0.0% |
| Turkey | 2,400 | 0.1% |
| Uganda | 134 | 0.0% |
| Ukraine | 4,535 | 0.2% |
| Uruguay | 173 | 0.0% |
| Uzbekistan | 521 | 0.0% |
| Venezuela | 1,121 | 0.1% |
| Vietnam | 99,754 | 5.2% |
| Western Africa | 1,820 | 0.1% |
| Western Asia | 14,375 | 0.7% |
| Western Europe | 13,941 | 0.7% |
| Yemen | 32 | 0.0% |
| Zaire | 38 | 0.0% |
| Zimbabwe | 178 | 0.0% | View All 133 Rows |
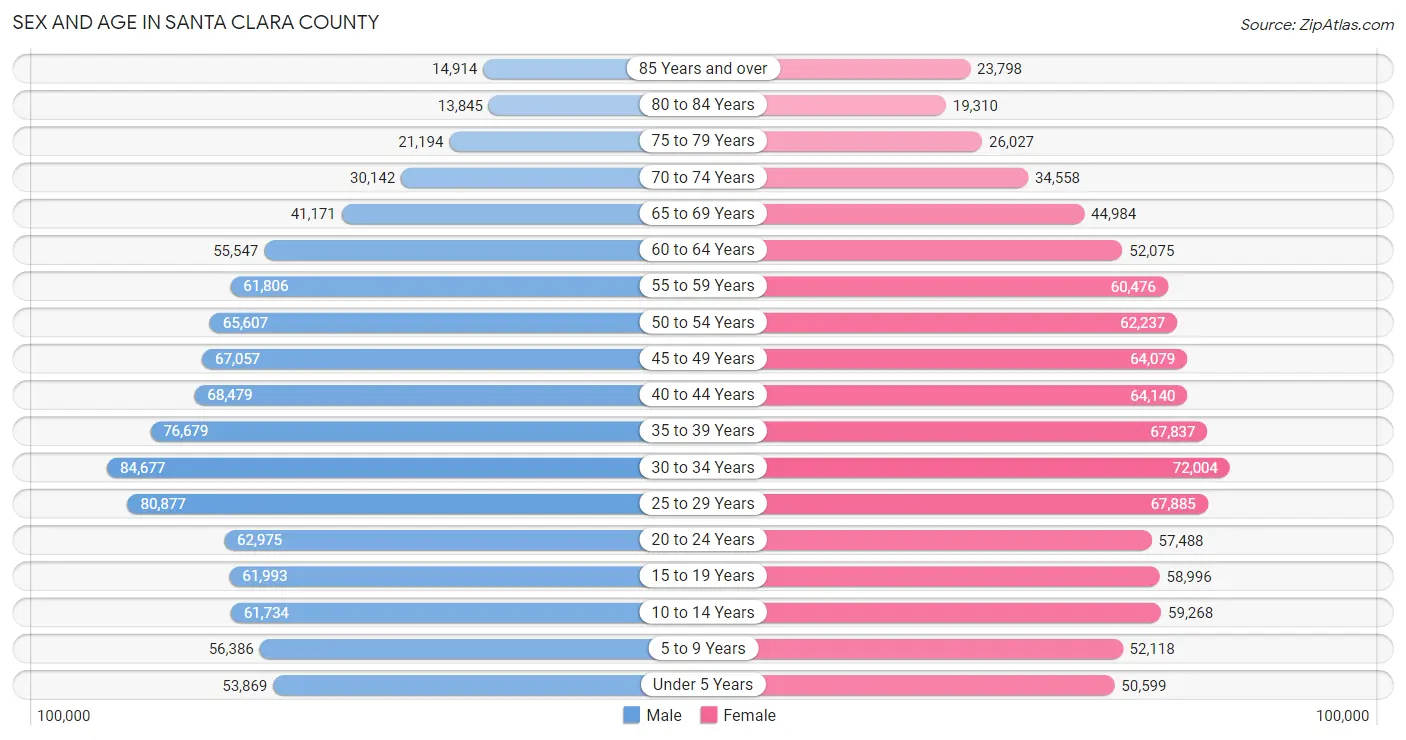
Sex and Age in Santa Clara County
Sex and Age in Santa Clara County
The most populous age groups in Santa Clara County are 30 to 34 Years (84,677 | 8.6%) for men and 30 to 34 Years (72,004 | 7.7%) for women.
| Age Bracket | Male | Female |
| Under 5 Years | 53,869 (5.5%) | 50,599 (5.4%) |
| 5 to 9 Years | 56,386 (5.8%) | 52,118 (5.6%) |
| 10 to 14 Years | 61,734 (6.3%) | 59,268 (6.3%) |
| 15 to 19 Years | 61,993 (6.3%) | 58,996 (6.3%) |
| 20 to 24 Years | 62,975 (6.4%) | 57,488 (6.1%) |
| 25 to 29 Years | 80,877 (8.3%) | 67,885 (7.2%) |
| 30 to 34 Years | 84,677 (8.6%) | 72,004 (7.7%) |
| 35 to 39 Years | 76,679 (7.8%) | 67,837 (7.2%) |
| 40 to 44 Years | 68,479 (7.0%) | 64,140 (6.8%) |
| 45 to 49 Years | 67,057 (6.9%) | 64,079 (6.8%) |
| 50 to 54 Years | 65,607 (6.7%) | 62,237 (6.6%) |
| 55 to 59 Years | 61,806 (6.3%) | 60,476 (6.5%) |
| 60 to 64 Years | 55,547 (5.7%) | 52,075 (5.6%) |
| 65 to 69 Years | 41,171 (4.2%) | 44,984 (4.8%) |
| 70 to 74 Years | 30,142 (3.1%) | 34,558 (3.7%) |
| 75 to 79 Years | 21,194 (2.2%) | 26,027 (2.8%) |
| 80 to 84 Years | 13,845 (1.4%) | 19,310 (2.1%) |
| 85 Years and over | 14,914 (1.5%) | 23,798 (2.5%) |
| Total | 978,952 (100.0%) | 937,879 (100.0%) |
Families and Households in Santa Clara County
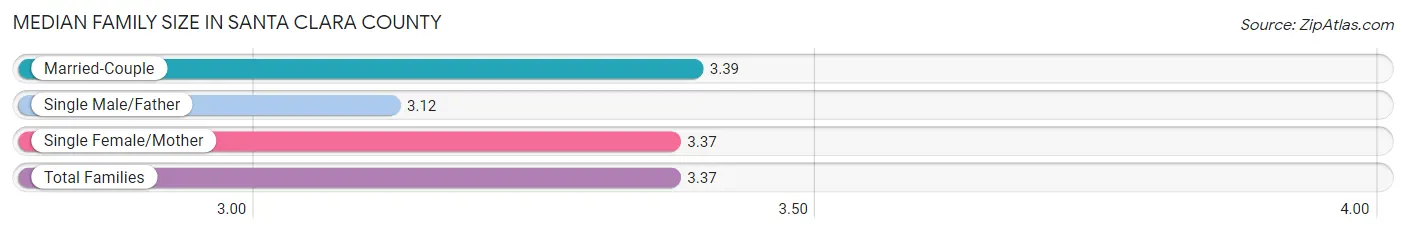
Median Family Size in Santa Clara County
The median family size in Santa Clara County is 3.37 persons per family, with married-couple families (361,639 | 78.7%) accounting for the largest median family size of 3.39 persons per family. On the other hand, single male/father families (33,390 | 7.3%) represent the smallest median family size with 3.12 persons per family.
| Family Type | # Families | Family Size |
| Married-Couple | 361,639 (78.7%) | 3.39 |
| Single Male/Father | 33,390 (7.3%) | 3.12 |
| Single Female/Mother | 64,595 (14.1%) | 3.37 |
| Total Families | 459,624 (100.0%) | 3.37 |
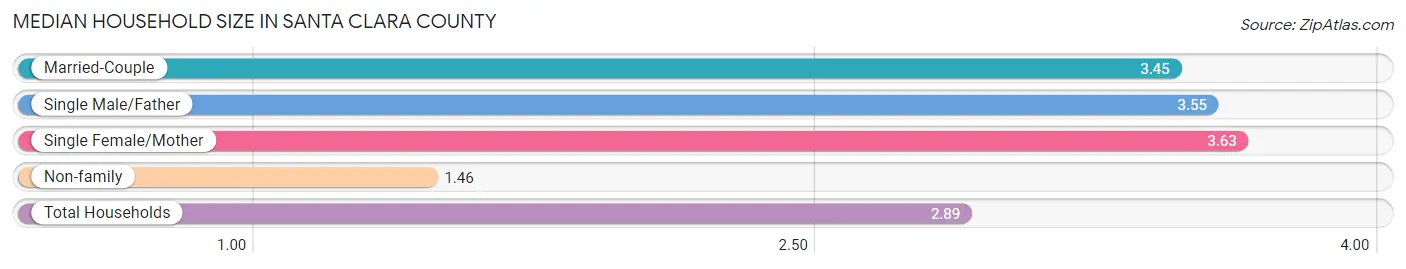
Median Household Size in Santa Clara County
The median household size in Santa Clara County is 2.89 persons per household, with single female/mother households (64,595 | 9.9%) accounting for the largest median household size of 3.63 persons per household. non-family households (190,728 | 29.3%) represent the smallest median household size with 1.46 persons per household.
| Household Type | # Households | Household Size |
| Married-Couple | 361,639 (55.6%) | 3.45 |
| Single Male/Father | 33,390 (5.1%) | 3.55 |
| Single Female/Mother | 64,595 (9.9%) | 3.63 |
| Non-family | 190,728 (29.3%) | 1.46 |
| Total Households | 650,352 (100.0%) | 2.89 |
Household Size by Marriage Status in Santa Clara County
Out of a total of 650,352 households in Santa Clara County, 459,624 (70.7%) are family households, while 190,728 (29.3%) are nonfamily households. The most numerous type of family households are 2-person households, comprising 160,953, and the most common type of nonfamily households are 1-person households, comprising 136,590.
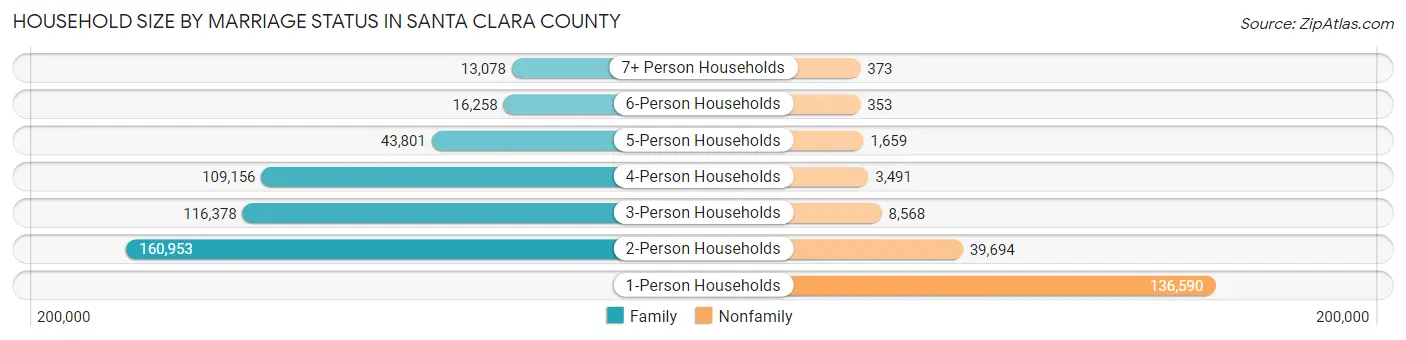
| Household Size | Family Households | Nonfamily Households |
| 1-Person Households | - | 136,590 (21.0%) |
| 2-Person Households | 160,953 (24.7%) | 39,694 (6.1%) |
| 3-Person Households | 116,378 (17.9%) | 8,568 (1.3%) |
| 4-Person Households | 109,156 (16.8%) | 3,491 (0.5%) |
| 5-Person Households | 43,801 (6.7%) | 1,659 (0.3%) |
| 6-Person Households | 16,258 (2.5%) | 353 (0.1%) |
| 7+ Person Households | 13,078 (2.0%) | 373 (0.1%) |
| Total | 459,624 (70.7%) | 190,728 (29.3%) |
Female Fertility in Santa Clara County
Fertility by Age in Santa Clara County
Average fertility rate in Santa Clara County is 44.0 births per 1,000 women. Women in the age bracket of 20 to 34 years have the highest fertility rate with 60.0 births per 1,000 women. Women in the age bracket of 20 to 34 years acount for 57.4% of all women with births.
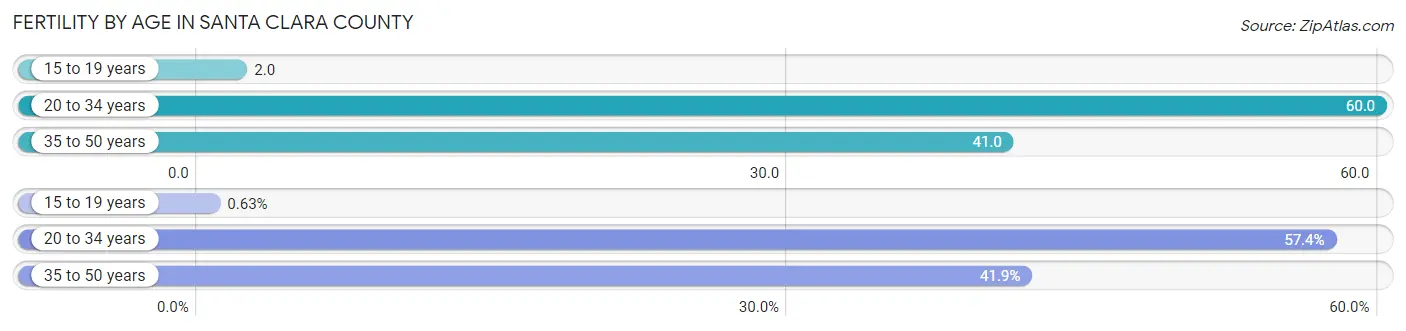
| Age Bracket | Women with Births | Births / 1,000 Women |
| 15 to 19 years | 130 (0.6%) | 2.0 |
| 20 to 34 years | 11,764 (57.4%) | 60.0 |
| 35 to 50 years | 8,591 (41.9%) | 41.0 |
| Total | 20,485 (100.0%) | 44.0 |
Fertility by Age by Marriage Status in Santa Clara County
83.2% of women with births (20,485) in Santa Clara County are married. The highest percentage of unmarried women with births falls into 15 to 19 years age bracket with 100.0% of them unmarried at the time of birth, while the lowest percentage of unmarried women with births belong to 35 to 50 years age bracket with 14.8% of them unmarried.
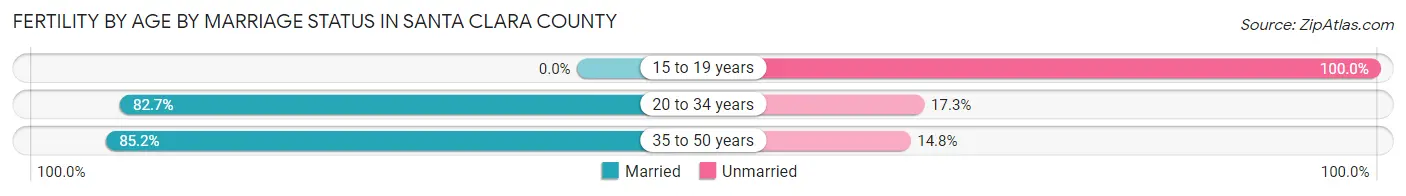
| Age Bracket | Married | Unmarried |
| 15 to 19 years | 0 (0.0%) | 130 (100.0%) |
| 20 to 34 years | 9,729 (82.7%) | 2,035 (17.3%) |
| 35 to 50 years | 7,320 (85.2%) | 1,271 (14.8%) |
| Total | 17,044 (83.2%) | 3,441 (16.8%) |
Fertility by Education in Santa Clara County
Average fertility rate in Santa Clara County is 44.0 births per 1,000 women. Women with the education attainment of graduate degree have the highest fertility rate of 60.0 births per 1,000 women, while women with the education attainment of less than high school have the lowest fertility at 22.0 births per 1,000 women. Women with the education attainment of graduate degree represent 32.1% of all women with births.
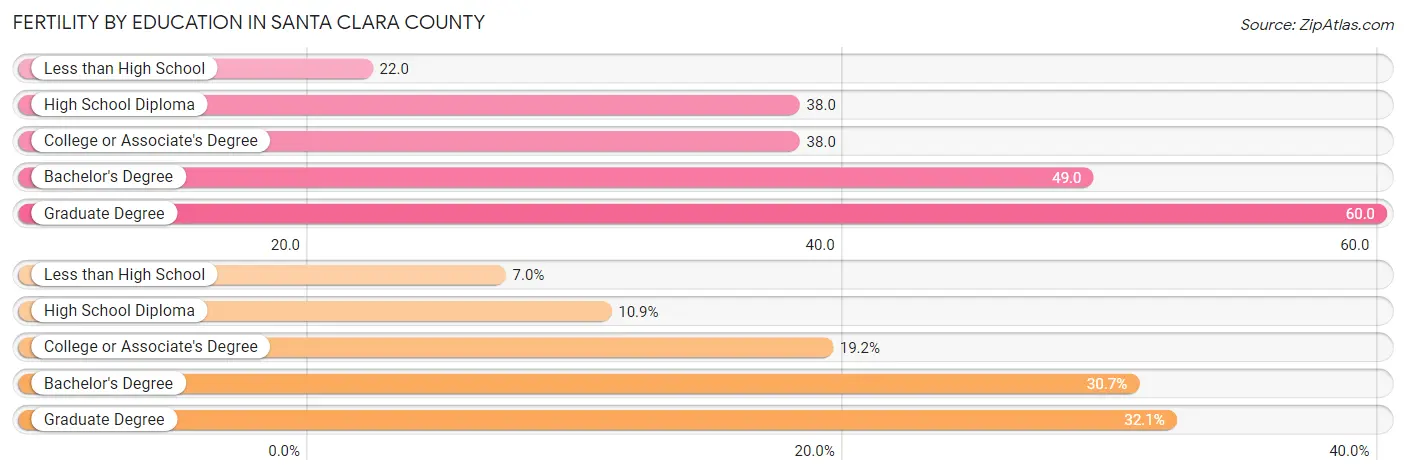
| Educational Attainment | Women with Births | Births / 1,000 Women |
| Less than High School | 1,430 (7.0%) | 22.0 |
| High School Diploma | 2,241 (10.9%) | 38.0 |
| College or Associate's Degree | 3,941 (19.2%) | 38.0 |
| Bachelor's Degree | 6,294 (30.7%) | 49.0 |
| Graduate Degree | 6,579 (32.1%) | 60.0 |
| Total | 20,485 (100.0%) | 44.0 |
Fertility by Education by Marriage Status in Santa Clara County
16.8% of women with births in Santa Clara County are unmarried. Women with the educational attainment of graduate degree are most likely to be married with 96.5% of them married at childbirth, while women with the educational attainment of high school diploma are least likely to be married with 45.9% of them unmarried at childbirth.
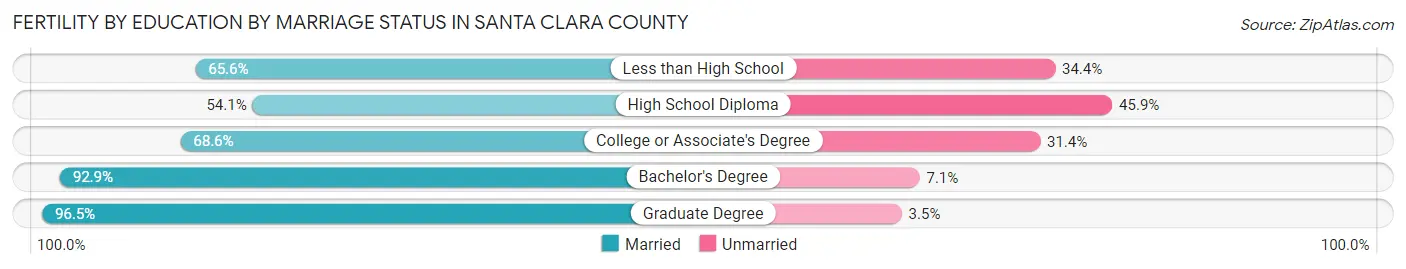
| Educational Attainment | Married | Unmarried |
| Less than High School | 938 (65.6%) | 492 (34.4%) |
| High School Diploma | 1,212 (54.1%) | 1,029 (45.9%) |
| College or Associate's Degree | 2,704 (68.6%) | 1,237 (31.4%) |
| Bachelor's Degree | 5,847 (92.9%) | 447 (7.1%) |
| Graduate Degree | 6,349 (96.5%) | 230 (3.5%) |
| Total | 17,044 (83.2%) | 3,441 (16.8%) |
Employment Characteristics in Santa Clara County
Employment by Class of Employer in Santa Clara County
Among the 975,427 employed individuals in Santa Clara County, private company employees (735,914 | 75.4%), not-for-profit organizations (66,177 | 6.8%), and local government employees (63,878 | 6.6%) make up the most common classes of employment.
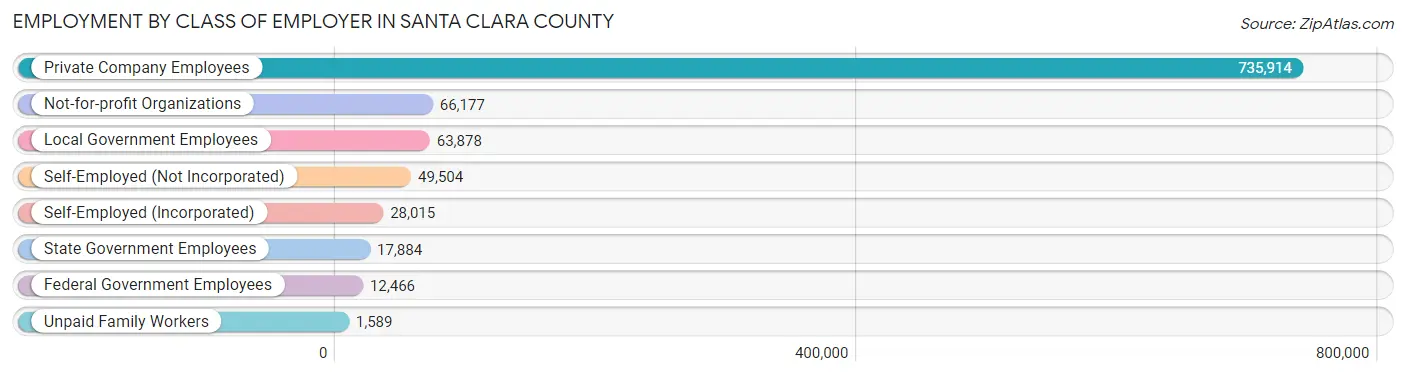
| Employer Class | # Employees | % Employees |
| Private Company Employees | 735,914 | 75.4% |
| Self-Employed (Incorporated) | 28,015 | 2.9% |
| Self-Employed (Not Incorporated) | 49,504 | 5.1% |
| Not-for-profit Organizations | 66,177 | 6.8% |
| Local Government Employees | 63,878 | 6.6% |
| State Government Employees | 17,884 | 1.8% |
| Federal Government Employees | 12,466 | 1.3% |
| Unpaid Family Workers | 1,589 | 0.2% |
| Total | 975,427 | 100.0% |
Employment Status by Age in Santa Clara County
According to the labor force statistics for Santa Clara County, out of the total population over 16 years of age (1,558,542), 67.4% or 1,050,457 individuals are in the labor force, with 4.4% or 46,220 of them unemployed. The age group with the highest labor force participation rate is 30 to 34 years, with 87.0% or 136,312 individuals in the labor force. Within the labor force, the 16 to 19 years age range has the highest percentage of unemployed individuals, with 11.2% or 3,097 of them being unemployed.
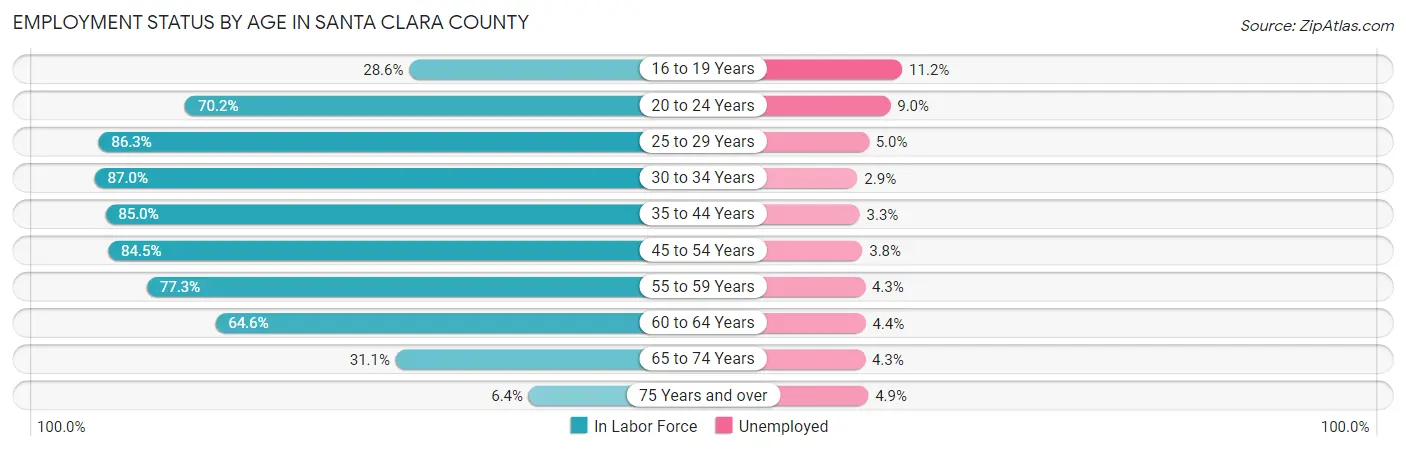
| Age Bracket | In Labor Force | Unemployed |
| 16 to 19 Years | 27,649 (28.6%) | 3,097 (11.2%) |
| 20 to 24 Years | 84,565 (70.2%) | 7,611 (9.0%) |
| 25 to 29 Years | 128,382 (86.3%) | 6,419 (5.0%) |
| 30 to 34 Years | 136,312 (87.0%) | 3,953 (2.9%) |
| 35 to 44 Years | 235,565 (85.0%) | 7,774 (3.3%) |
| 45 to 54 Years | 218,838 (84.5%) | 8,316 (3.8%) |
| 55 to 59 Years | 94,524 (77.3%) | 4,065 (4.3%) |
| 60 to 64 Years | 69,524 (64.6%) | 3,059 (4.4%) |
| 65 to 74 Years | 46,916 (31.1%) | 2,017 (4.3%) |
| 75 Years and over | 7,622 (6.4%) | 373 (4.9%) |
| Total | 1,050,457 (67.4%) | 46,220 (4.4%) |
Employment Status by Educational Attainment in Santa Clara County
According to labor force statistics for Santa Clara County, 82.4% of individuals (882,885) out of the total population between 25 and 64 years of age (1,071,462) are in the labor force, with 3.8% or 33,550 of them being unemployed. The group with the highest labor force participation rate are those with the educational attainment of bachelor's degree or higher, with 86.2% or 538,877 individuals in the labor force. Within the labor force, individuals with less than high school education have the highest percentage of unemployment, with 5.6% or 3,984 of them being unemployed.
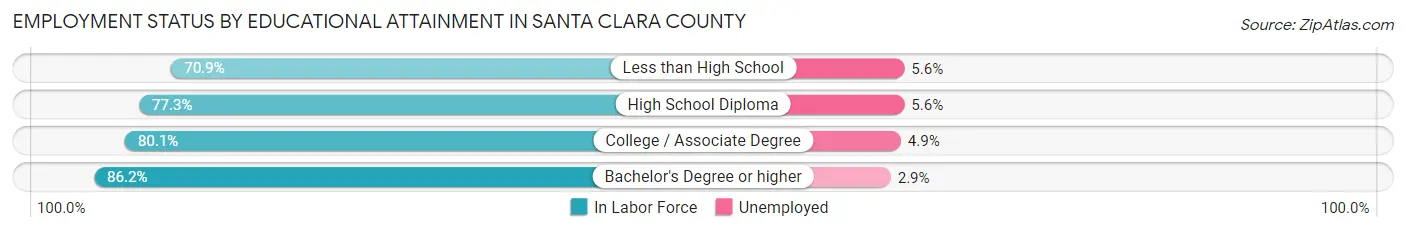
| Educational Attainment | In Labor Force | Unemployed |
| Less than High School | 71,141 (70.9%) | 5,619 (5.6%) |
| High School Diploma | 103,915 (77.3%) | 7,528 (5.6%) |
| College / Associate Degree | 169,447 (80.1%) | 10,366 (4.9%) |
| Bachelor's Degree or higher | 538,877 (86.2%) | 18,129 (2.9%) |
| Total | 882,885 (82.4%) | 40,716 (3.8%) |
Employment Occupations by Sex in Santa Clara County
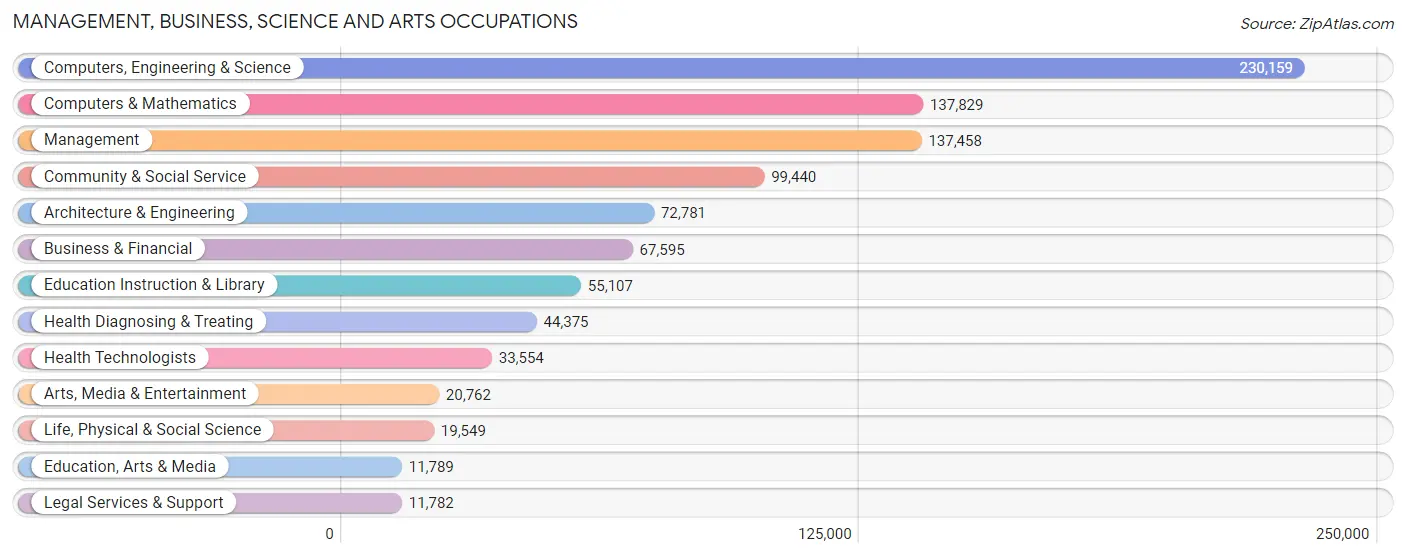
Management, Business, Science and Arts Occupations
The most common Management, Business, Science and Arts occupations in Santa Clara County are Computers, Engineering & Science (230,159 | 23.0%), Computers & Mathematics (137,829 | 13.8%), Management (137,458 | 13.7%), Community & Social Service (99,440 | 9.9%), and Architecture & Engineering (72,781 | 7.3%).
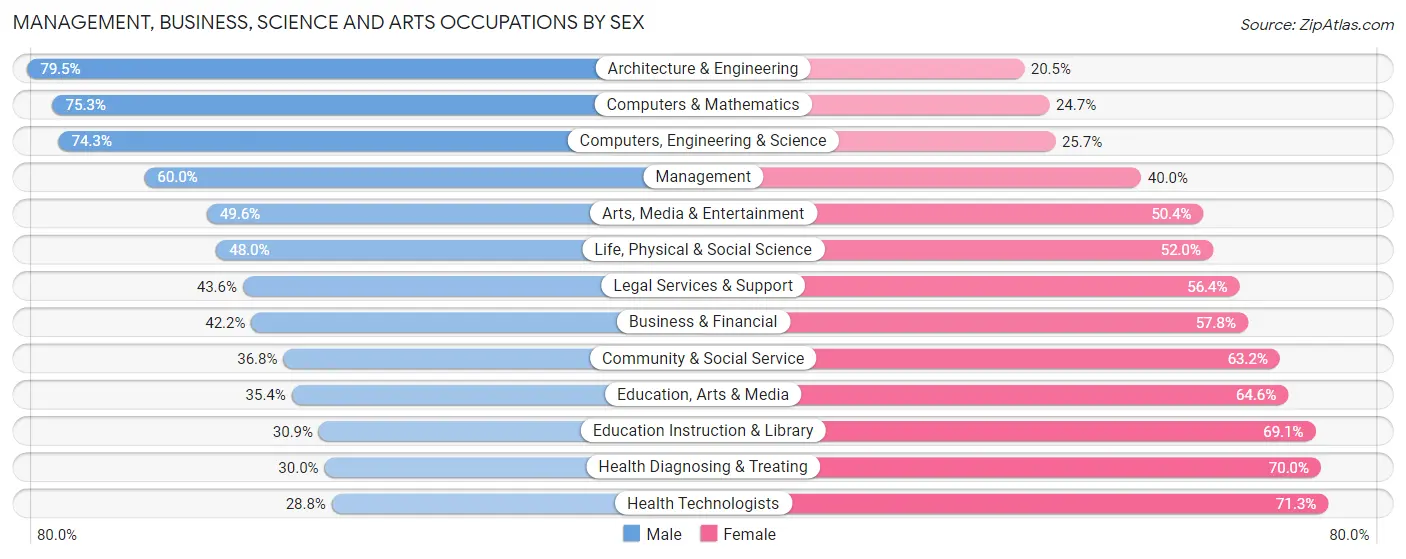
Management, Business, Science and Arts Occupations by Sex
Within the Management, Business, Science and Arts occupations in Santa Clara County, the most male-oriented occupations are Architecture & Engineering (79.5%), Computers & Mathematics (75.3%), and Computers, Engineering & Science (74.3%), while the most female-oriented occupations are Health Technologists (71.3%), Health Diagnosing & Treating (70.0%), and Education Instruction & Library (69.1%).
| Occupation | Male | Female |
| Management | 82,473 (60.0%) | 54,985 (40.0%) |
| Business & Financial | 28,502 (42.2%) | 39,093 (57.8%) |
| Computers, Engineering & Science | 171,084 (74.3%) | 59,075 (25.7%) |
| Computers & Mathematics | 103,813 (75.3%) | 34,016 (24.7%) |
| Architecture & Engineering | 57,887 (79.5%) | 14,894 (20.5%) |
| Life, Physical & Social Science | 9,384 (48.0%) | 10,165 (52.0%) |
| Community & Social Service | 36,624 (36.8%) | 62,816 (63.2%) |
| Education, Arts & Media | 4,178 (35.4%) | 7,611 (64.6%) |
| Legal Services & Support | 5,135 (43.6%) | 6,647 (56.4%) |
| Education Instruction & Library | 17,022 (30.9%) | 38,085 (69.1%) |
| Arts, Media & Entertainment | 10,289 (49.6%) | 10,473 (50.4%) |
| Health Diagnosing & Treating | 13,300 (30.0%) | 31,075 (70.0%) |
| Health Technologists | 9,646 (28.7%) | 23,908 (71.3%) |
| Total (Category) | 331,983 (57.3%) | 247,044 (42.7%) |
| Total (Overall) | 564,138 (56.3%) | 437,909 (43.7%) |
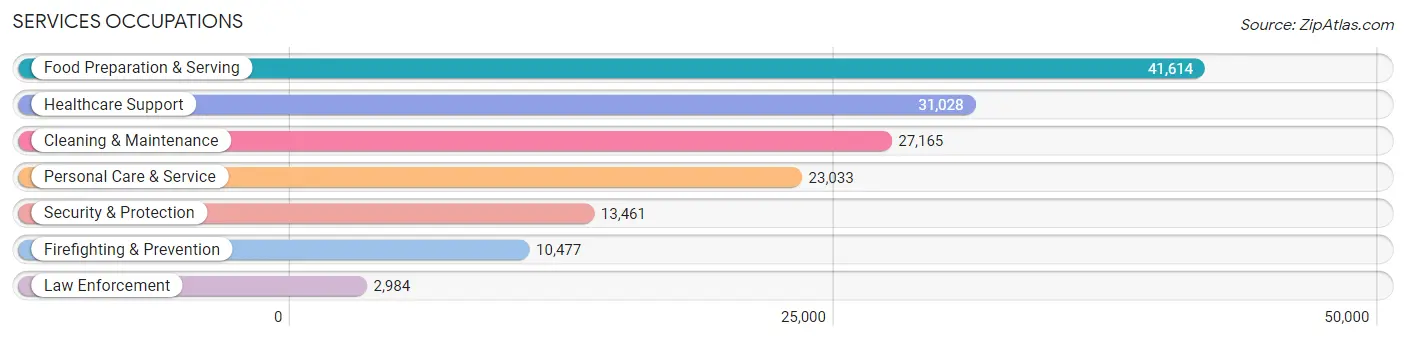
Services Occupations
The most common Services occupations in Santa Clara County are Food Preparation & Serving (41,614 | 4.2%), Healthcare Support (31,028 | 3.1%), Cleaning & Maintenance (27,165 | 2.7%), Personal Care & Service (23,033 | 2.3%), and Security & Protection (13,461 | 1.3%).
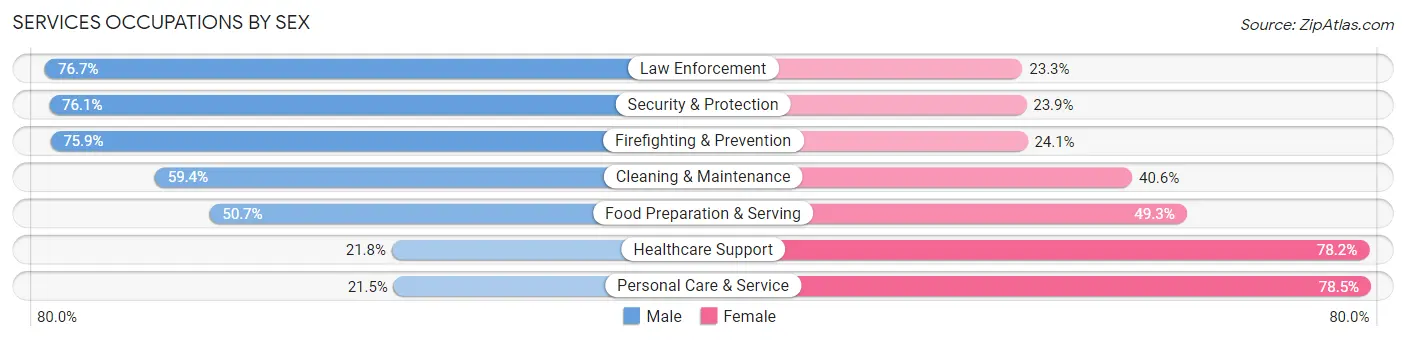
Services Occupations by Sex
Within the Services occupations in Santa Clara County, the most male-oriented occupations are Law Enforcement (76.7%), Security & Protection (76.1%), and Firefighting & Prevention (75.9%), while the most female-oriented occupations are Personal Care & Service (78.5%), Healthcare Support (78.2%), and Food Preparation & Serving (49.3%).
| Occupation | Male | Female |
| Healthcare Support | 6,773 (21.8%) | 24,255 (78.2%) |
| Security & Protection | 10,246 (76.1%) | 3,215 (23.9%) |
| Firefighting & Prevention | 7,956 (75.9%) | 2,521 (24.1%) |
| Law Enforcement | 2,290 (76.7%) | 694 (23.3%) |
| Food Preparation & Serving | 21,110 (50.7%) | 20,504 (49.3%) |
| Cleaning & Maintenance | 16,127 (59.4%) | 11,038 (40.6%) |
| Personal Care & Service | 4,958 (21.5%) | 18,075 (78.5%) |
| Total (Category) | 59,214 (43.4%) | 77,087 (56.6%) |
| Total (Overall) | 564,138 (56.3%) | 437,909 (43.7%) |
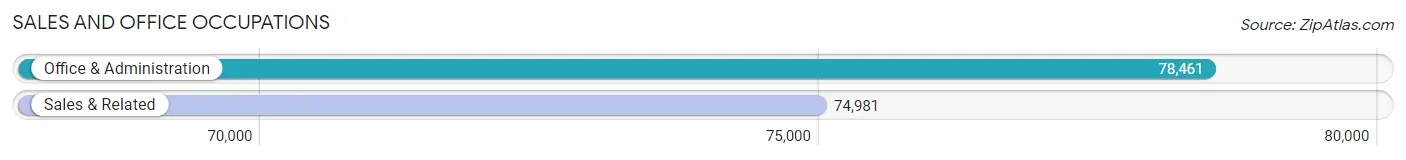
Sales and Office Occupations
The most common Sales and Office occupations in Santa Clara County are Office & Administration (78,461 | 7.8%), and Sales & Related (74,981 | 7.5%).
Sales and Office Occupations by Sex
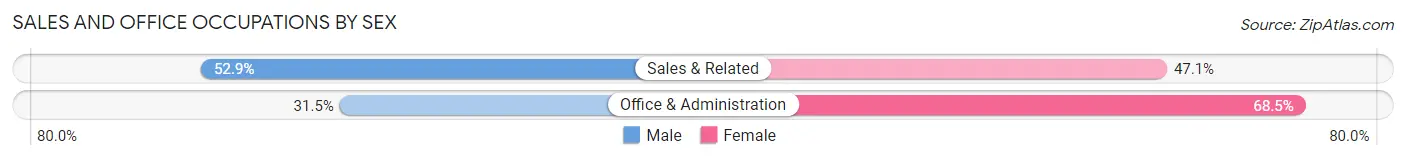
| Occupation | Male | Female |
| Sales & Related | 39,632 (52.9%) | 35,349 (47.1%) |
| Office & Administration | 24,741 (31.5%) | 53,720 (68.5%) |
| Total (Category) | 64,373 (41.9%) | 89,069 (58.1%) |
| Total (Overall) | 564,138 (56.3%) | 437,909 (43.7%) |
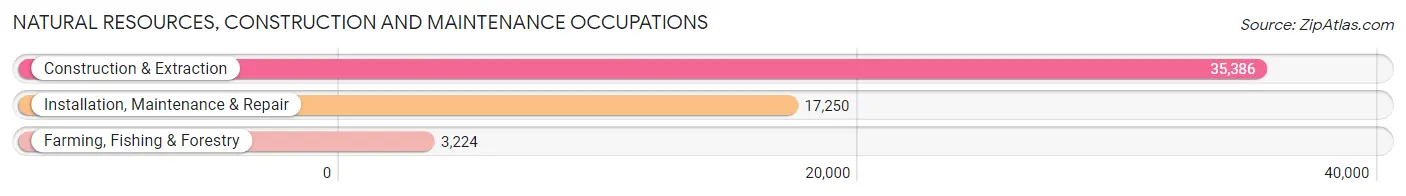
Natural Resources, Construction and Maintenance Occupations
The most common Natural Resources, Construction and Maintenance occupations in Santa Clara County are Construction & Extraction (35,386 | 3.5%), Installation, Maintenance & Repair (17,250 | 1.7%), and Farming, Fishing & Forestry (3,224 | 0.3%).
Natural Resources, Construction and Maintenance Occupations by Sex

| Occupation | Male | Female |
| Farming, Fishing & Forestry | 2,242 (69.5%) | 982 (30.5%) |
| Construction & Extraction | 34,634 (97.9%) | 752 (2.1%) |
| Installation, Maintenance & Repair | 16,448 (95.4%) | 802 (4.6%) |
| Total (Category) | 53,324 (95.5%) | 2,536 (4.5%) |
| Total (Overall) | 564,138 (56.3%) | 437,909 (43.7%) |
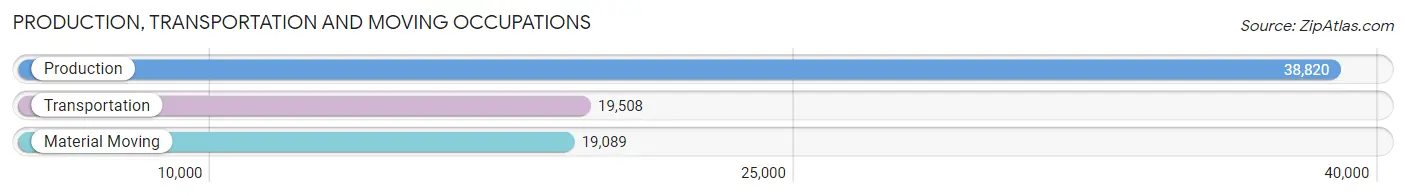
Production, Transportation and Moving Occupations
The most common Production, Transportation and Moving occupations in Santa Clara County are Production (38,820 | 3.9%), Transportation (19,508 | 1.9%), and Material Moving (19,089 | 1.9%).
Production, Transportation and Moving Occupations by Sex
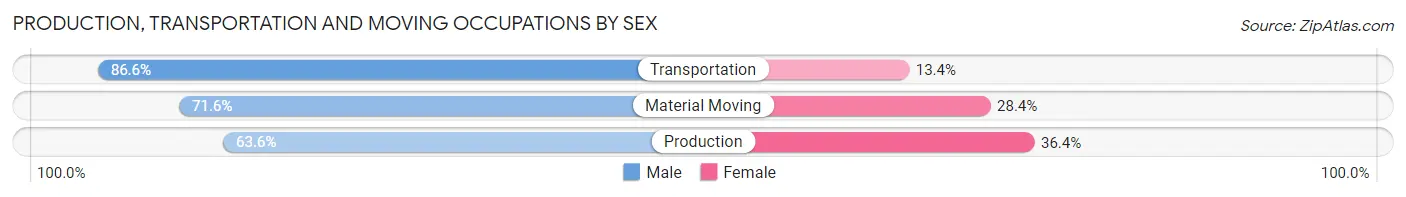
| Occupation | Male | Female |
| Production | 24,683 (63.6%) | 14,137 (36.4%) |
| Transportation | 16,886 (86.6%) | 2,622 (13.4%) |
| Material Moving | 13,675 (71.6%) | 5,414 (28.4%) |
| Total (Category) | 55,244 (71.4%) | 22,173 (28.6%) |
| Total (Overall) | 564,138 (56.3%) | 437,909 (43.7%) |
Employment Industries by Sex in Santa Clara County
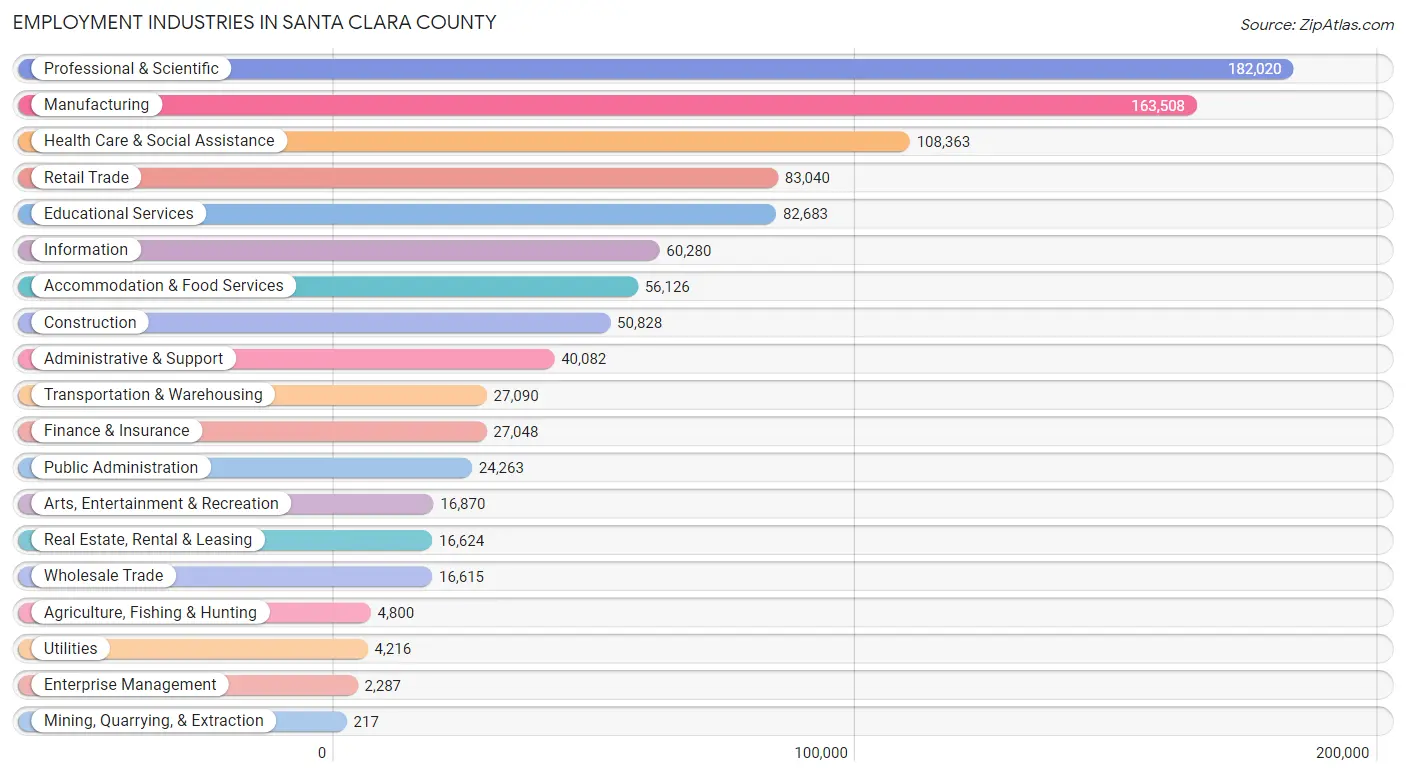
Employment Industries in Santa Clara County
The major employment industries in Santa Clara County include Professional & Scientific (182,020 | 18.2%), Manufacturing (163,508 | 16.3%), Health Care & Social Assistance (108,363 | 10.8%), Retail Trade (83,040 | 8.3%), and Educational Services (82,683 | 8.3%).
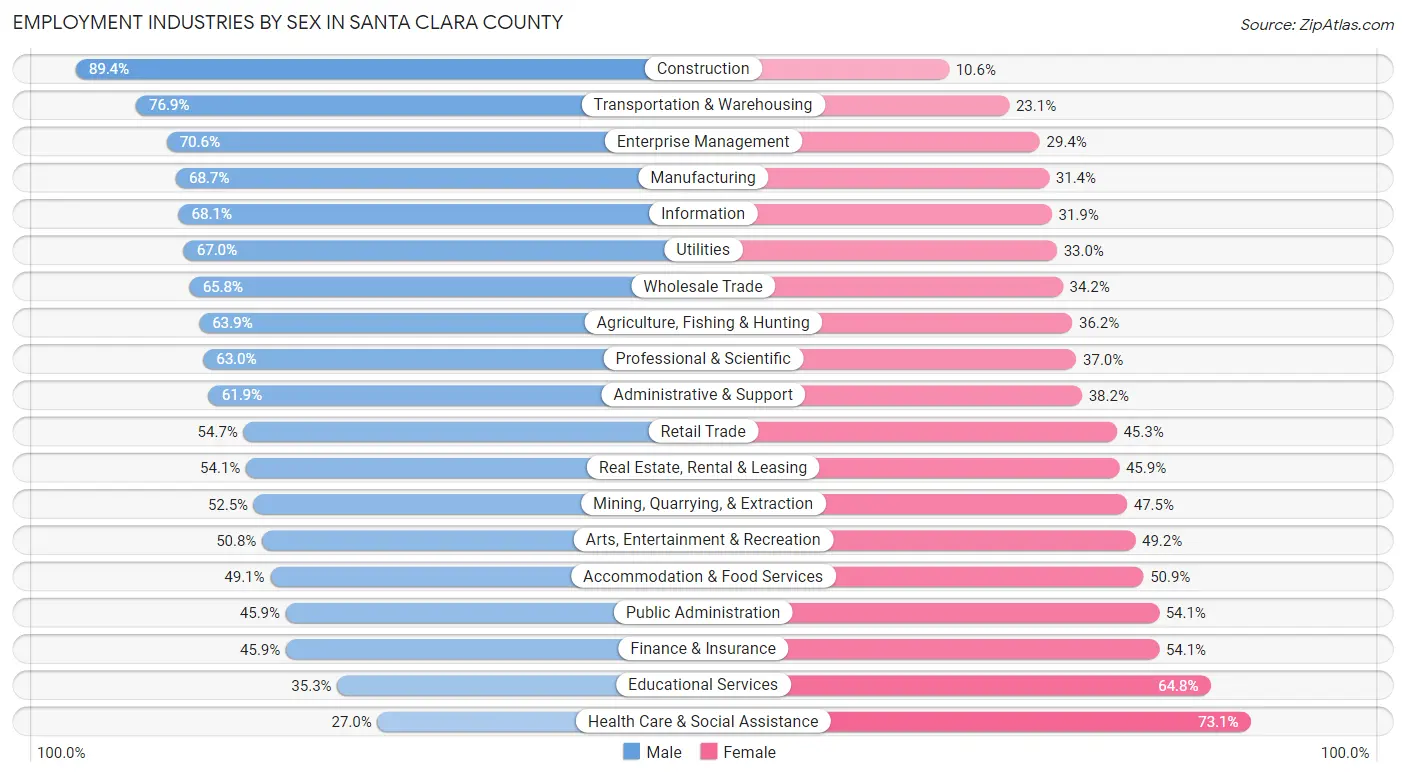
Employment Industries by Sex in Santa Clara County
The Santa Clara County industries that see more men than women are Construction (89.4%), Transportation & Warehousing (76.9%), and Enterprise Management (70.6%), whereas the industries that tend to have a higher number of women are Health Care & Social Assistance (73.1%), Educational Services (64.7%), and Finance & Insurance (54.1%).
| Industry | Male | Female |
| Agriculture, Fishing & Hunting | 3,065 (63.8%) | 1,735 (36.1%) |
| Mining, Quarrying, & Extraction | 114 (52.5%) | 103 (47.5%) |
| Construction | 45,428 (89.4%) | 5,400 (10.6%) |
| Manufacturing | 112,250 (68.6%) | 51,258 (31.4%) |
| Wholesale Trade | 10,936 (65.8%) | 5,679 (34.2%) |
| Retail Trade | 45,388 (54.7%) | 37,652 (45.3%) |
| Transportation & Warehousing | 20,836 (76.9%) | 6,254 (23.1%) |
| Utilities | 2,826 (67.0%) | 1,390 (33.0%) |
| Information | 41,048 (68.1%) | 19,232 (31.9%) |
| Finance & Insurance | 12,406 (45.9%) | 14,642 (54.1%) |
| Real Estate, Rental & Leasing | 9,000 (54.1%) | 7,624 (45.9%) |
| Professional & Scientific | 114,697 (63.0%) | 67,323 (37.0%) |
| Enterprise Management | 1,614 (70.6%) | 673 (29.4%) |
| Administrative & Support | 24,789 (61.9%) | 15,293 (38.2%) |
| Educational Services | 29,143 (35.2%) | 53,540 (64.7%) |
| Health Care & Social Assistance | 29,200 (27.0%) | 79,163 (73.1%) |
| Arts, Entertainment & Recreation | 8,573 (50.8%) | 8,297 (49.2%) |
| Accommodation & Food Services | 27,577 (49.1%) | 28,549 (50.9%) |
| Public Administration | 11,142 (45.9%) | 13,121 (54.1%) |
| Total | 564,138 (56.3%) | 437,909 (43.7%) |
Education in Santa Clara County
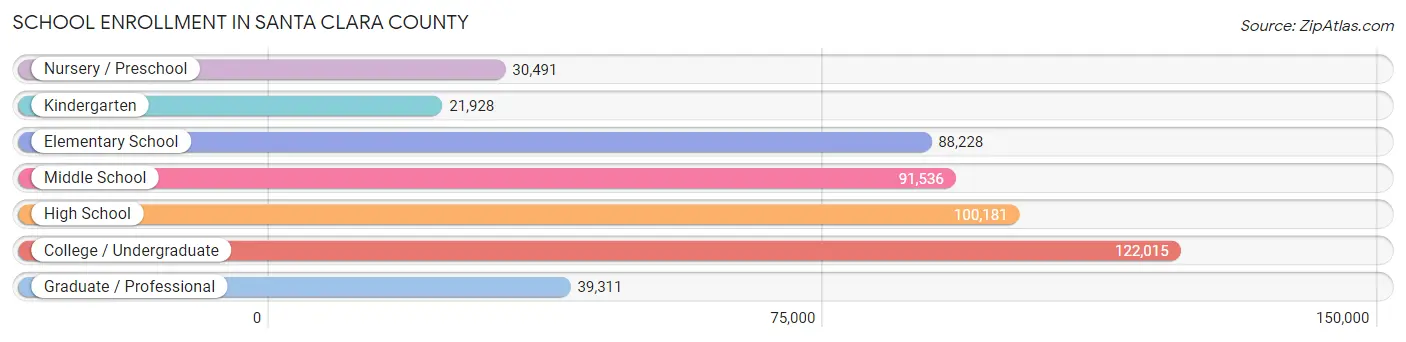
School Enrollment in Santa Clara County
The most common levels of schooling among the 493,690 students in Santa Clara County are college / undergraduate (122,015 | 24.7%), high school (100,181 | 20.3%), and middle school (91,536 | 18.5%).
| School Level | # Students | % Students |
| Nursery / Preschool | 30,491 | 6.2% |
| Kindergarten | 21,928 | 4.4% |
| Elementary School | 88,228 | 17.9% |
| Middle School | 91,536 | 18.5% |
| High School | 100,181 | 20.3% |
| College / Undergraduate | 122,015 | 24.7% |
| Graduate / Professional | 39,311 | 8.0% |
| Total | 493,690 | 100.0% |
School Enrollment by Age by Funding Source in Santa Clara County
Out of a total of 493,690 students who are enrolled in schools in Santa Clara County, 107,624 (21.8%) attend a private institution, while the remaining 386,066 (78.2%) are enrolled in public schools. The age group of 3 to 4 year olds has the highest likelihood of being enrolled in private schools, with 16,789 (65.5% in the age bracket) enrolled. Conversely, the age group of 10 to 14 year olds has the lowest likelihood of being enrolled in a private school, with 102,132 (85.5% in the age bracket) attending a public institution.
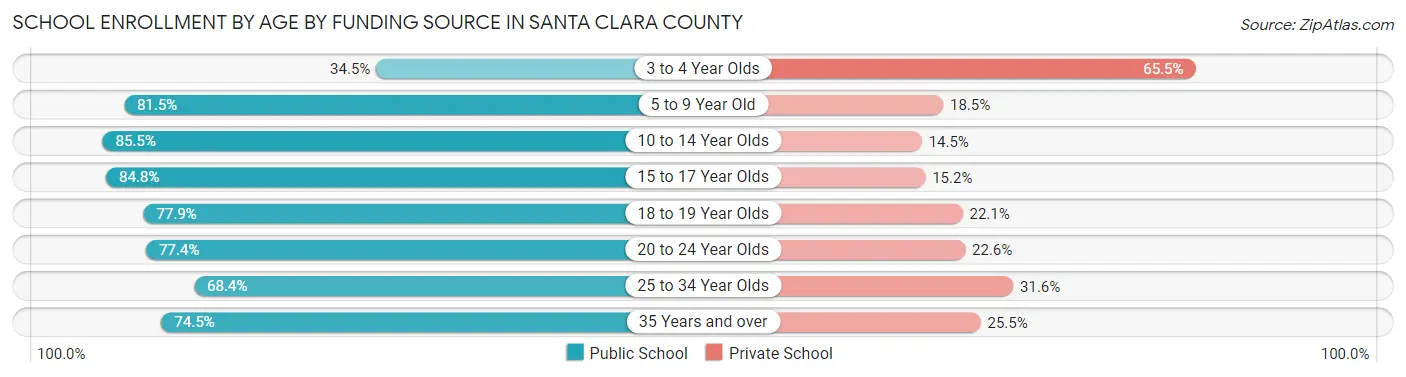
| Age Bracket | Public School | Private School |
| 3 to 4 Year Olds | 8,852 (34.5%) | 16,789 (65.5%) |
| 5 to 9 Year Old | 85,104 (81.5%) | 19,336 (18.5%) |
| 10 to 14 Year Olds | 102,132 (85.5%) | 17,368 (14.5%) |
| 15 to 17 Year Olds | 59,900 (84.8%) | 10,726 (15.2%) |
| 18 to 19 Year Olds | 33,375 (77.9%) | 9,492 (22.1%) |
| 20 to 24 Year Olds | 49,645 (77.4%) | 14,514 (22.6%) |
| 25 to 34 Year Olds | 27,430 (68.4%) | 12,646 (31.6%) |
| 35 Years and over | 19,657 (74.5%) | 6,724 (25.5%) |
| Total | 386,066 (78.2%) | 107,624 (21.8%) |
Educational Attainment by Field of Study in Santa Clara County
Engineering (191,585 | 24.2%), business (111,934 | 14.1%), computers & mathematics (100,373 | 12.7%), social sciences (58,421 | 7.4%), and science & technology (54,882 | 6.9%) are the most common fields of study among 791,584 individuals in Santa Clara County who have obtained a bachelor's degree or higher.
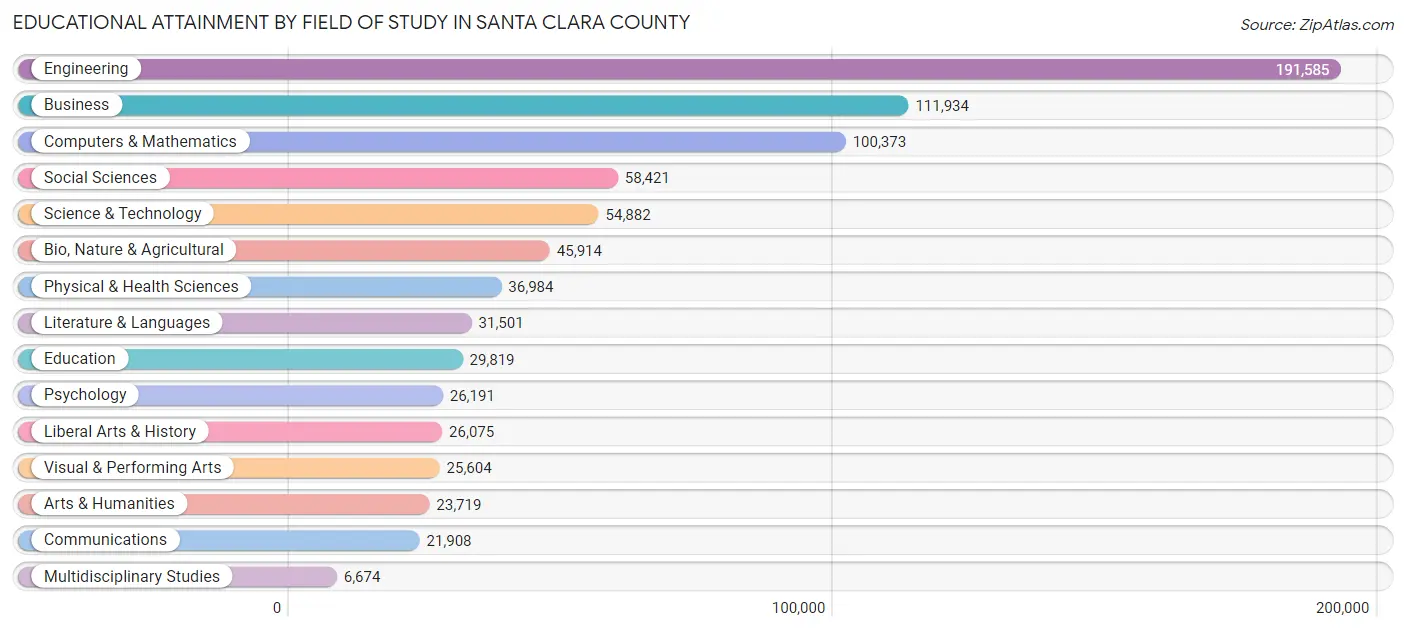
| Field of Study | # Graduates | % Graduates |
| Computers & Mathematics | 100,373 | 12.7% |
| Bio, Nature & Agricultural | 45,914 | 5.8% |
| Physical & Health Sciences | 36,984 | 4.7% |
| Psychology | 26,191 | 3.3% |
| Social Sciences | 58,421 | 7.4% |
| Engineering | 191,585 | 24.2% |
| Multidisciplinary Studies | 6,674 | 0.8% |
| Science & Technology | 54,882 | 6.9% |
| Business | 111,934 | 14.1% |
| Education | 29,819 | 3.8% |
| Literature & Languages | 31,501 | 4.0% |
| Liberal Arts & History | 26,075 | 3.3% |
| Visual & Performing Arts | 25,604 | 3.2% |
| Communications | 21,908 | 2.8% |
| Arts & Humanities | 23,719 | 3.0% |
| Total | 791,584 | 100.0% |
Transportation & Commute in Santa Clara County
Vehicle Availability by Sex in Santa Clara County
The most prevalent vehicle ownership categories in Santa Clara County are males with 2 vehicles (215,824, accounting for 39.4%) and females with 2 vehicles (163,573, making up 51.7%).
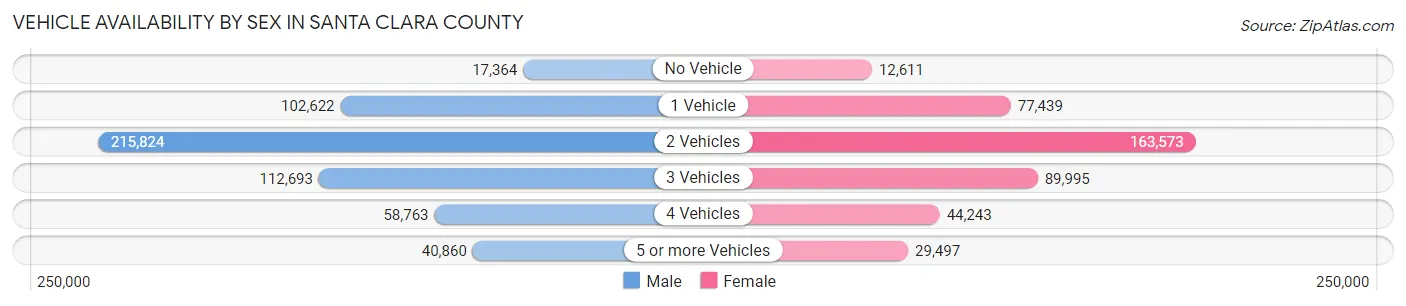
| Vehicles Available | Male | Female |
| No Vehicle | 17,364 (3.2%) | 12,611 (3.0%) |
| 1 Vehicle | 102,622 (18.7%) | 77,439 (18.5%) |
| 2 Vehicles | 215,824 (39.4%) | 163,573 (39.2%) |
| 3 Vehicles | 112,693 (20.6%) | 89,995 (21.6%) |
| 4 Vehicles | 58,763 (10.7%) | 44,243 (10.6%) |
| 5 or more Vehicles | 40,860 (7.4%) | 29,497 (7.1%) |
| Total | 548,126 (100.0%) | 417,358 (100.0%) |
Commute Time in Santa Clara County
The most frequently occuring commute durations in Santa Clara County are 20 to 24 minutes (133,860 commuters, 17.0%), 30 to 34 minutes (130,863 commuters, 16.7%), and 15 to 19 minutes (129,614 commuters, 16.5%).
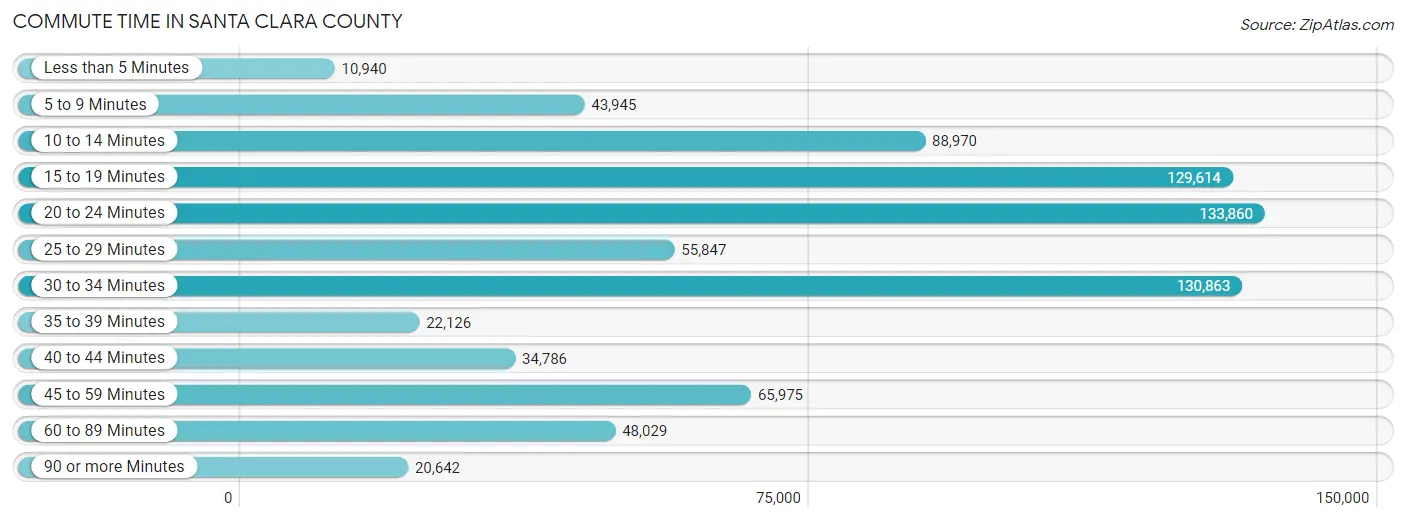
| Commute Time | # Commuters | % Commuters |
| Less than 5 Minutes | 10,940 | 1.4% |
| 5 to 9 Minutes | 43,945 | 5.6% |
| 10 to 14 Minutes | 88,970 | 11.3% |
| 15 to 19 Minutes | 129,614 | 16.5% |
| 20 to 24 Minutes | 133,860 | 17.0% |
| 25 to 29 Minutes | 55,847 | 7.1% |
| 30 to 34 Minutes | 130,863 | 16.7% |
| 35 to 39 Minutes | 22,126 | 2.8% |
| 40 to 44 Minutes | 34,786 | 4.4% |
| 45 to 59 Minutes | 65,975 | 8.4% |
| 60 to 89 Minutes | 48,029 | 6.1% |
| 90 or more Minutes | 20,642 | 2.6% |
Commute Time by Sex in Santa Clara County
The most common commute times in Santa Clara County are 20 to 24 minutes (76,947 commuters, 17.2%) for males and 15 to 19 minutes (57,706 commuters, 17.0%) for females.
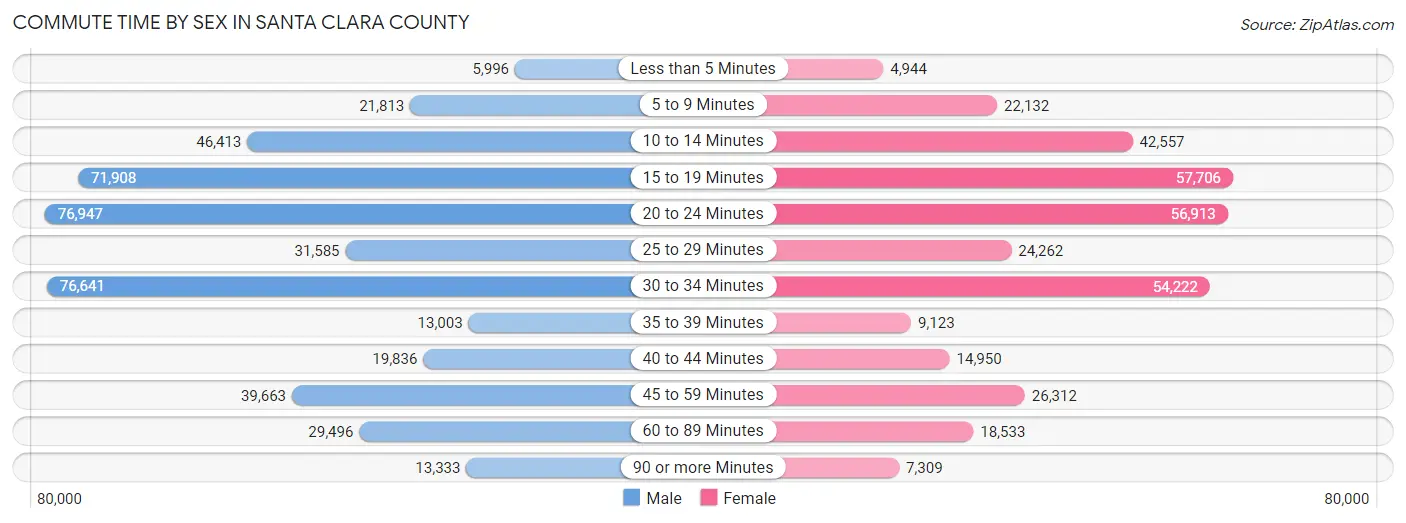
| Commute Time | Male | Female |
| Less than 5 Minutes | 5,996 (1.3%) | 4,944 (1.5%) |
| 5 to 9 Minutes | 21,813 (4.9%) | 22,132 (6.5%) |
| 10 to 14 Minutes | 46,413 (10.4%) | 42,557 (12.6%) |
| 15 to 19 Minutes | 71,908 (16.1%) | 57,706 (17.0%) |
| 20 to 24 Minutes | 76,947 (17.2%) | 56,913 (16.8%) |
| 25 to 29 Minutes | 31,585 (7.1%) | 24,262 (7.2%) |
| 30 to 34 Minutes | 76,641 (17.2%) | 54,222 (16.0%) |
| 35 to 39 Minutes | 13,003 (2.9%) | 9,123 (2.7%) |
| 40 to 44 Minutes | 19,836 (4.4%) | 14,950 (4.4%) |
| 45 to 59 Minutes | 39,663 (8.9%) | 26,312 (7.8%) |
| 60 to 89 Minutes | 29,496 (6.6%) | 18,533 (5.5%) |
| 90 or more Minutes | 13,333 (3.0%) | 7,309 (2.2%) |
Time of Departure to Work by Sex in Santa Clara County
The most frequent times of departure to work in Santa Clara County are 9:00 AM to 9:59 AM (67,649, 15.1%) for males and 8:00 AM to 8:29 AM (53,996, 15.9%) for females.
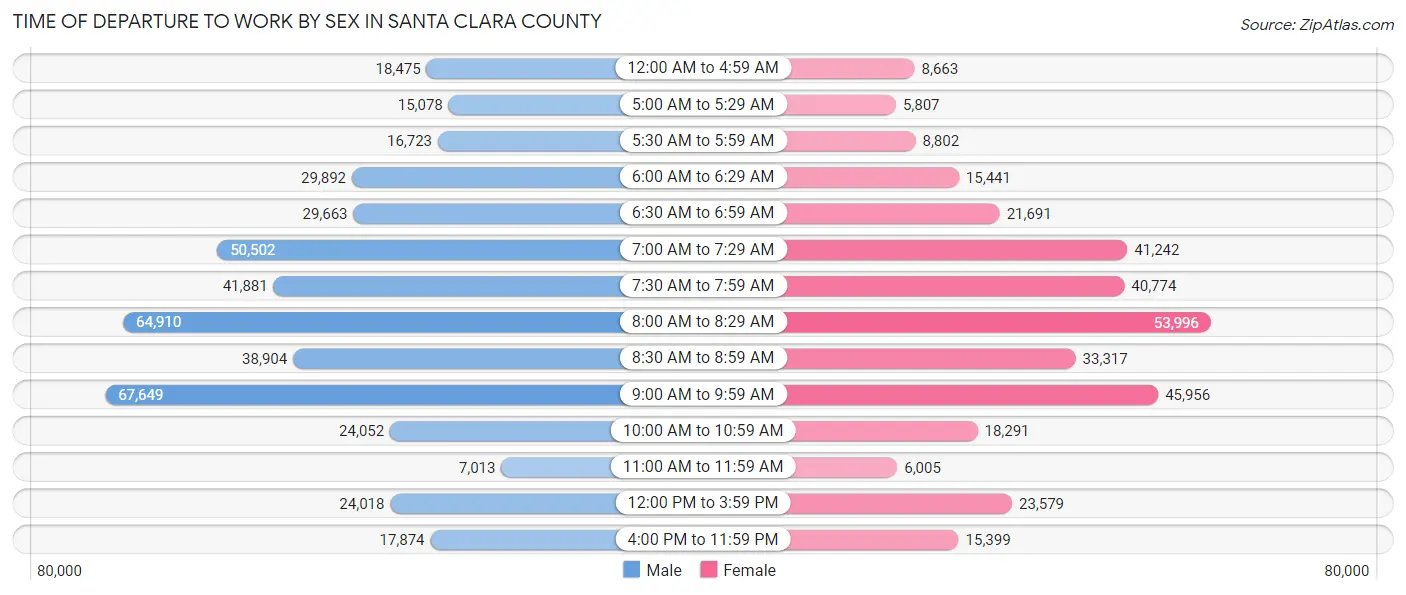
| Time of Departure | Male | Female |
| 12:00 AM to 4:59 AM | 18,475 (4.1%) | 8,663 (2.6%) |
| 5:00 AM to 5:29 AM | 15,078 (3.4%) | 5,807 (1.7%) |
| 5:30 AM to 5:59 AM | 16,723 (3.7%) | 8,802 (2.6%) |
| 6:00 AM to 6:29 AM | 29,892 (6.7%) | 15,441 (4.6%) |
| 6:30 AM to 6:59 AM | 29,663 (6.6%) | 21,691 (6.4%) |
| 7:00 AM to 7:29 AM | 50,502 (11.3%) | 41,242 (12.2%) |
| 7:30 AM to 7:59 AM | 41,881 (9.4%) | 40,774 (12.0%) |
| 8:00 AM to 8:29 AM | 64,910 (14.5%) | 53,996 (15.9%) |
| 8:30 AM to 8:59 AM | 38,904 (8.7%) | 33,317 (9.8%) |
| 9:00 AM to 9:59 AM | 67,649 (15.1%) | 45,956 (13.6%) |
| 10:00 AM to 10:59 AM | 24,052 (5.4%) | 18,291 (5.4%) |
| 11:00 AM to 11:59 AM | 7,013 (1.6%) | 6,005 (1.8%) |
| 12:00 PM to 3:59 PM | 24,018 (5.4%) | 23,579 (7.0%) |
| 4:00 PM to 11:59 PM | 17,874 (4.0%) | 15,399 (4.5%) |
| Total | 446,634 (100.0%) | 338,963 (100.0%) |
Housing Occupancy in Santa Clara County
Occupancy by Ownership in Santa Clara County
Of the total 650,352 dwellings in Santa Clara County, owner-occupied units account for 361,551 (55.6%), while renter-occupied units make up 288,801 (44.4%).
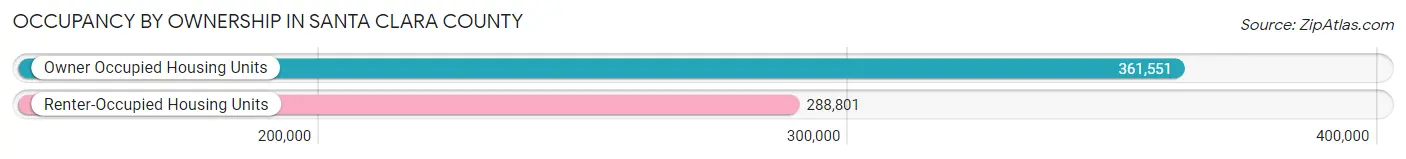
| Occupancy | # Housing Units | % Housing Units |
| Owner Occupied Housing Units | 361,551 | 55.6% |
| Renter-Occupied Housing Units | 288,801 | 44.4% |
| Total Occupied Housing Units | 650,352 | 100.0% |
Occupancy by Household Size in Santa Clara County
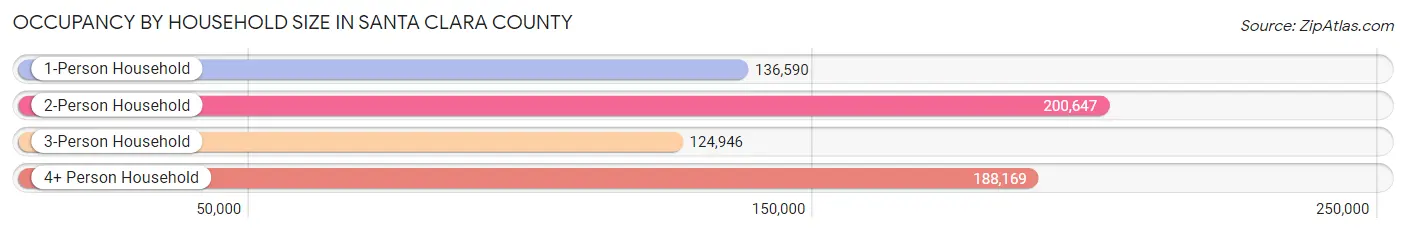
| Household Size | # Housing Units | % Housing Units |
| 1-Person Household | 136,590 | 21.0% |
| 2-Person Household | 200,647 | 30.8% |
| 3-Person Household | 124,946 | 19.2% |
| 4+ Person Household | 188,169 | 28.9% |
| Total Housing Units | 650,352 | 100.0% |
Occupancy by Ownership by Household Size in Santa Clara County
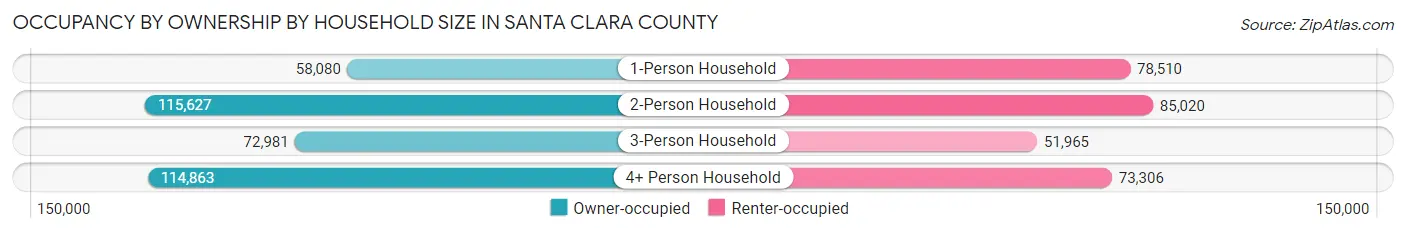
| Household Size | Owner-occupied | Renter-occupied |
| 1-Person Household | 58,080 (42.5%) | 78,510 (57.5%) |
| 2-Person Household | 115,627 (57.6%) | 85,020 (42.4%) |
| 3-Person Household | 72,981 (58.4%) | 51,965 (41.6%) |
| 4+ Person Household | 114,863 (61.0%) | 73,306 (39.0%) |
| Total Housing Units | 361,551 (55.6%) | 288,801 (44.4%) |
Occupancy by Educational Attainment in Santa Clara County
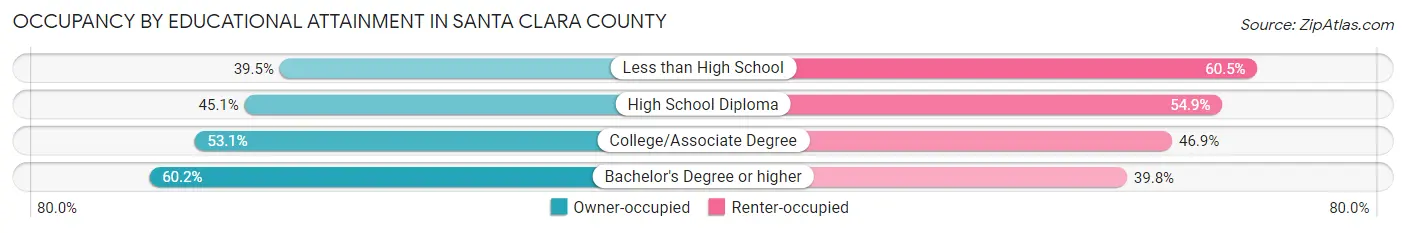
| Household Size | Owner-occupied | Renter-occupied |
| Less than High School | 19,785 (39.5%) | 30,270 (60.5%) |
| High School Diploma | 30,401 (45.1%) | 37,006 (54.9%) |
| College/Associate Degree | 71,052 (53.1%) | 62,842 (46.9%) |
| Bachelor's Degree or higher | 240,313 (60.2%) | 158,683 (39.8%) |
Occupancy by Age of Householder in Santa Clara County
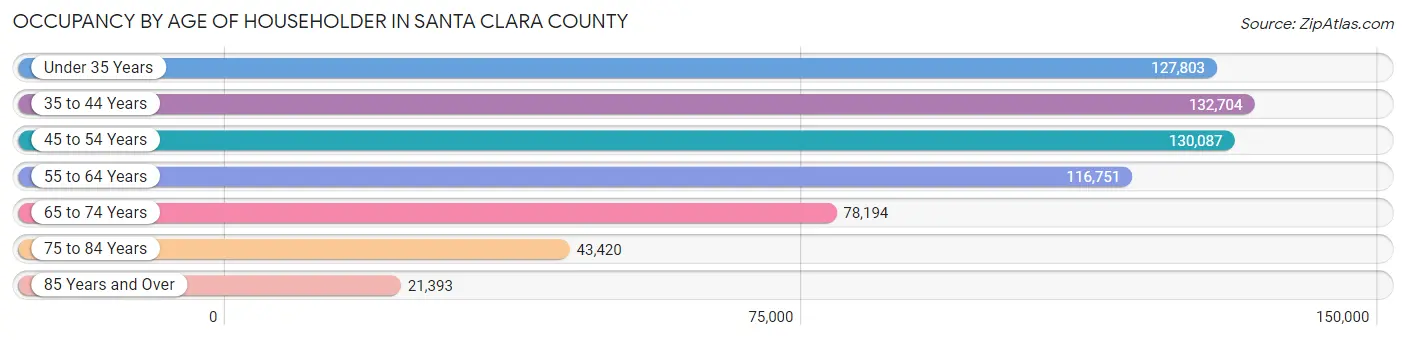
| Age Bracket | # Households | % Households |
| Under 35 Years | 127,803 | 19.7% |
| 35 to 44 Years | 132,704 | 20.4% |
| 45 to 54 Years | 130,087 | 20.0% |
| 55 to 64 Years | 116,751 | 17.9% |
| 65 to 74 Years | 78,194 | 12.0% |
| 75 to 84 Years | 43,420 | 6.7% |
| 85 Years and Over | 21,393 | 3.3% |
| Total | 650,352 | 100.0% |
Housing Finances in Santa Clara County
Median Income by Occupancy in Santa Clara County
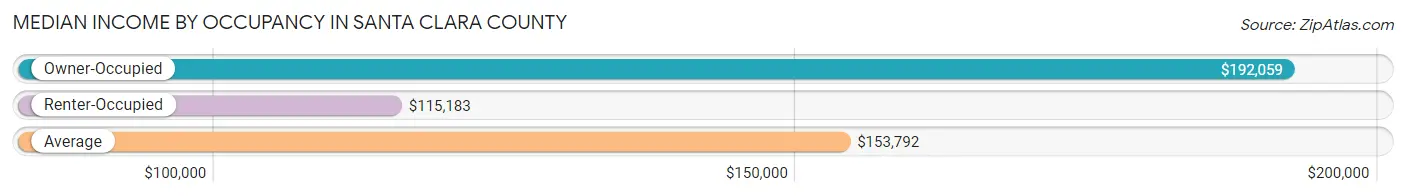
| Occupancy Type | # Households | Median Income |
| Owner-Occupied | 361,551 (55.6%) | $192,059 |
| Renter-Occupied | 288,801 (44.4%) | $115,183 |
| Average | 650,352 (100.0%) | $153,792 |
Occupancy by Householder Income Bracket in Santa Clara County
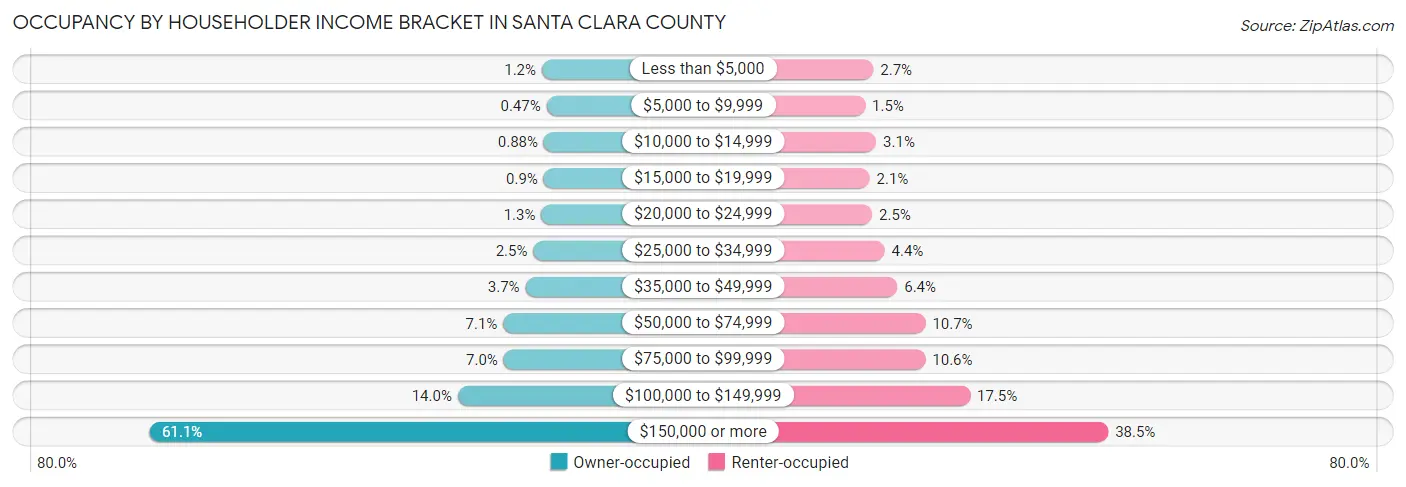
| Income Bracket | Owner-occupied | Renter-occupied |
| Less than $5,000 | 4,255 (1.2%) | 7,817 (2.7%) |
| $5,000 to $9,999 | 1,697 (0.5%) | 4,203 (1.5%) |
| $10,000 to $14,999 | 3,166 (0.9%) | 9,066 (3.1%) |
| $15,000 to $19,999 | 3,271 (0.9%) | 6,177 (2.1%) |
| $20,000 to $24,999 | 4,607 (1.3%) | 7,277 (2.5%) |
| $25,000 to $34,999 | 8,982 (2.5%) | 12,804 (4.4%) |
| $35,000 to $49,999 | 13,310 (3.7%) | 18,360 (6.4%) |
| $50,000 to $74,999 | 25,577 (7.1%) | 30,764 (10.6%) |
| $75,000 to $99,999 | 25,326 (7.0%) | 30,740 (10.6%) |
| $100,000 to $149,999 | 50,626 (14.0%) | 50,403 (17.4%) |
| $150,000 or more | 220,734 (61.1%) | 111,190 (38.5%) |
| Total | 361,551 (100.0%) | 288,801 (100.0%) |
Monthly Housing Cost Tiers in Santa Clara County
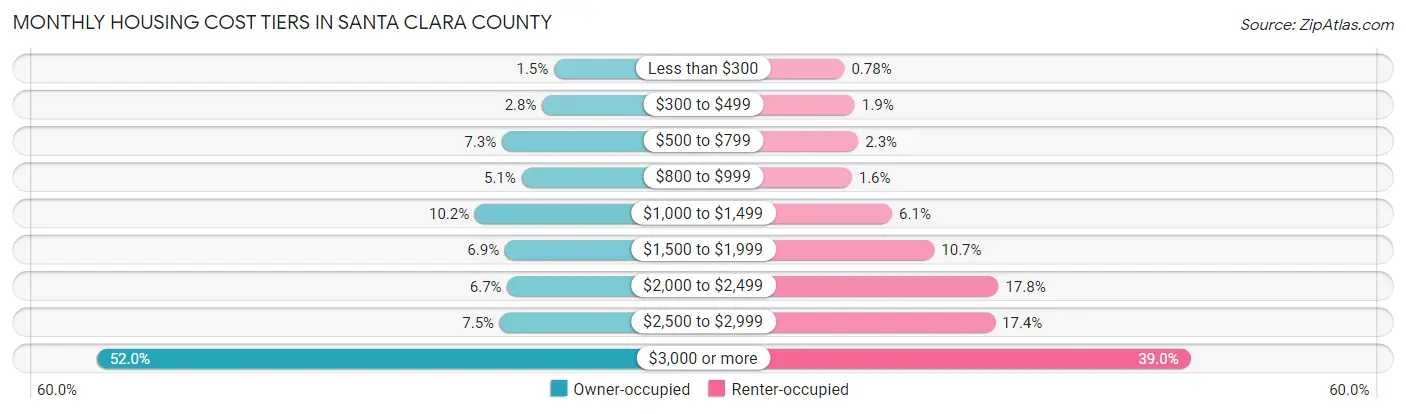
| Monthly Cost | Owner-occupied | Renter-occupied |
| Less than $300 | 5,426 (1.5%) | 2,261 (0.8%) |
| $300 to $499 | 10,160 (2.8%) | 5,573 (1.9%) |
| $500 to $799 | 26,220 (7.2%) | 6,666 (2.3%) |
| $800 to $999 | 18,402 (5.1%) | 4,601 (1.6%) |
| $1,000 to $1,499 | 37,038 (10.2%) | 17,470 (6.0%) |
| $1,500 to $1,999 | 25,038 (6.9%) | 30,924 (10.7%) |
| $2,000 to $2,499 | 24,066 (6.7%) | 51,388 (17.8%) |
| $2,500 to $2,999 | 27,095 (7.5%) | 50,321 (17.4%) |
| $3,000 or more | 188,106 (52.0%) | 112,639 (39.0%) |
| Total | 361,551 (100.0%) | 288,801 (100.0%) |
Physical Housing Characteristics in Santa Clara County
Housing Structures in Santa Clara County
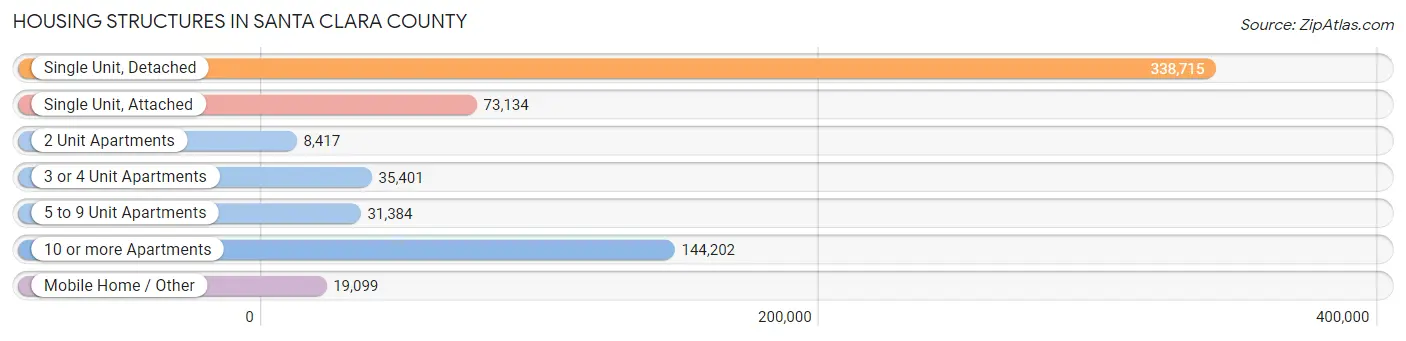
| Structure Type | # Housing Units | % Housing Units |
| Single Unit, Detached | 338,715 | 52.1% |
| Single Unit, Attached | 73,134 | 11.3% |
| 2 Unit Apartments | 8,417 | 1.3% |
| 3 or 4 Unit Apartments | 35,401 | 5.4% |
| 5 to 9 Unit Apartments | 31,384 | 4.8% |
| 10 or more Apartments | 144,202 | 22.2% |
| Mobile Home / Other | 19,099 | 2.9% |
| Total | 650,352 | 100.0% |
Housing Structures by Occupancy in Santa Clara County
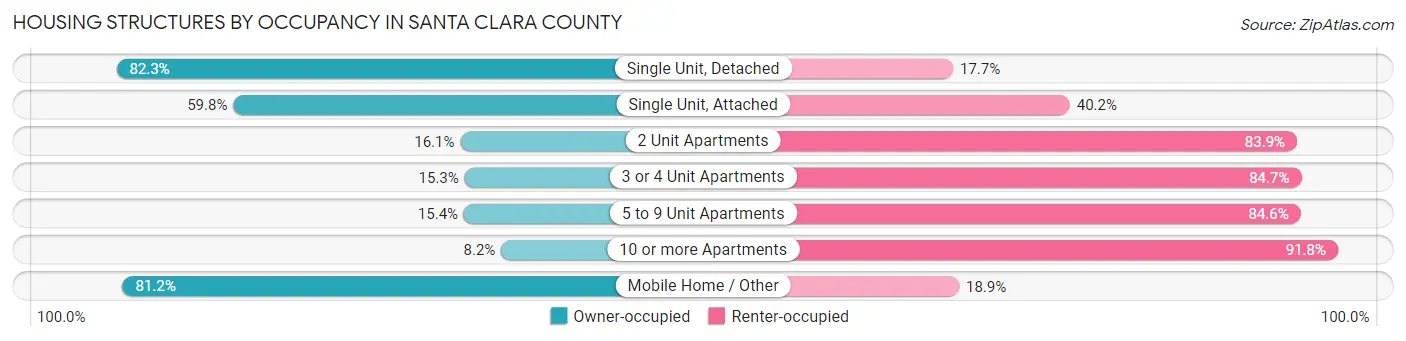
| Structure Type | Owner-occupied | Renter-occupied |
| Single Unit, Detached | 278,804 (82.3%) | 59,911 (17.7%) |
| Single Unit, Attached | 43,758 (59.8%) | 29,376 (40.2%) |
| 2 Unit Apartments | 1,356 (16.1%) | 7,061 (83.9%) |
| 3 or 4 Unit Apartments | 5,409 (15.3%) | 29,992 (84.7%) |
| 5 to 9 Unit Apartments | 4,840 (15.4%) | 26,544 (84.6%) |
| 10 or more Apartments | 11,885 (8.2%) | 132,317 (91.8%) |
| Mobile Home / Other | 15,499 (81.1%) | 3,600 (18.9%) |
| Total | 361,551 (55.6%) | 288,801 (44.4%) |
Housing Structures by Number of Rooms in Santa Clara County
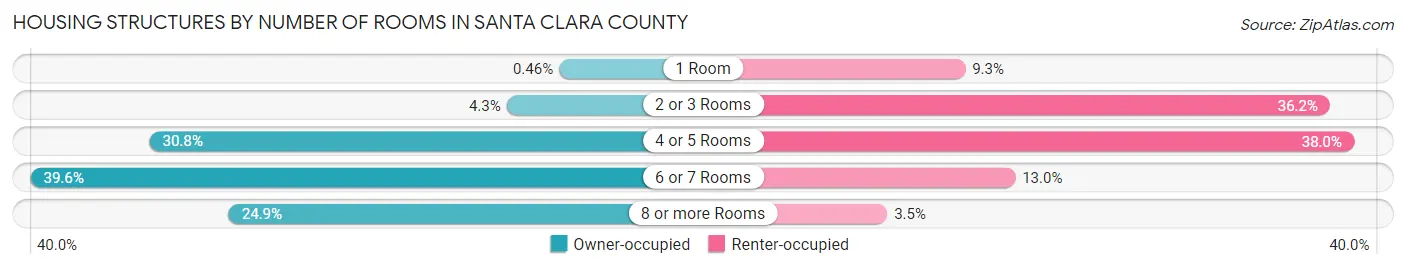
| Number of Rooms | Owner-occupied | Renter-occupied |
| 1 Room | 1,672 (0.5%) | 26,774 (9.3%) |
| 2 or 3 Rooms | 15,698 (4.3%) | 104,670 (36.2%) |
| 4 or 5 Rooms | 111,168 (30.7%) | 109,791 (38.0%) |
| 6 or 7 Rooms | 143,034 (39.6%) | 37,461 (13.0%) |
| 8 or more Rooms | 89,979 (24.9%) | 10,105 (3.5%) |
| Total | 361,551 (100.0%) | 288,801 (100.0%) |
Housing Structure by Heating Type in Santa Clara County
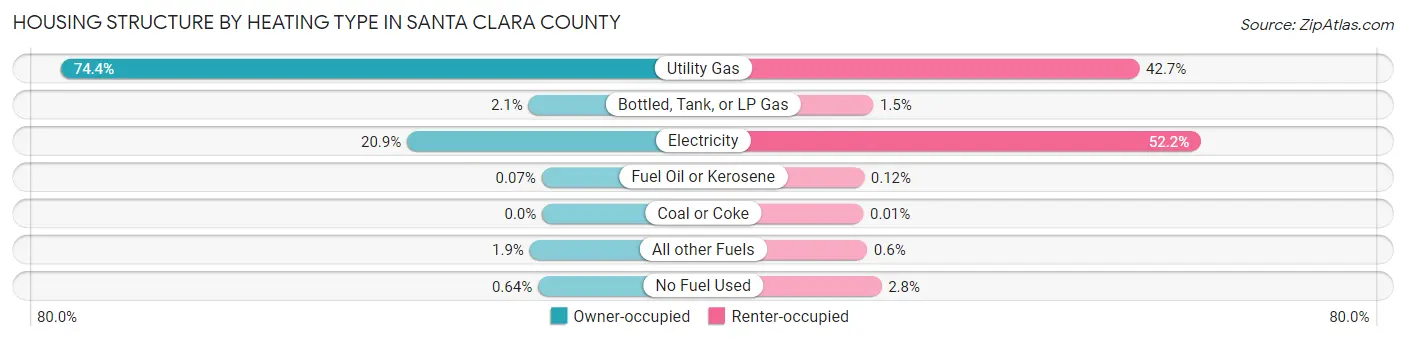
| Heating Type | Owner-occupied | Renter-occupied |
| Utility Gas | 268,976 (74.4%) | 123,256 (42.7%) |
| Bottled, Tank, or LP Gas | 7,560 (2.1%) | 4,413 (1.5%) |
| Electricity | 75,491 (20.9%) | 150,883 (52.2%) |
| Fuel Oil or Kerosene | 268 (0.1%) | 361 (0.1%) |
| Coal or Coke | 0 (0.0%) | 32 (0.0%) |
| All other Fuels | 6,954 (1.9%) | 1,741 (0.6%) |
| No Fuel Used | 2,302 (0.6%) | 8,115 (2.8%) |
| Total | 361,551 (100.0%) | 288,801 (100.0%) |
Household Vehicle Usage in Santa Clara County
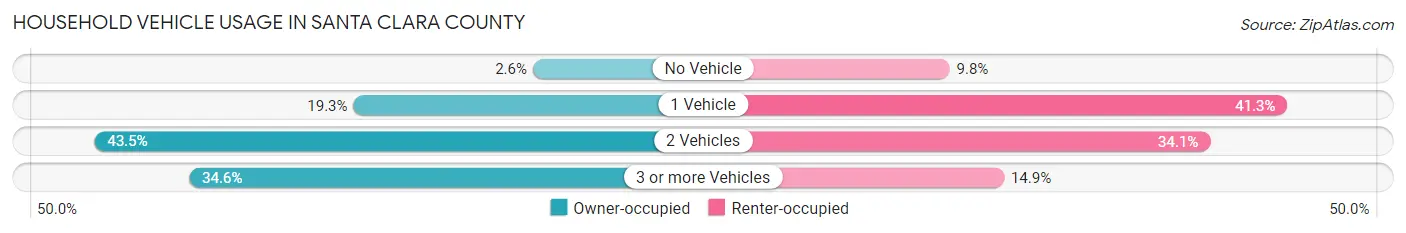
| Vehicles per Household | Owner-occupied | Renter-occupied |
| No Vehicle | 9,265 (2.6%) | 28,202 (9.8%) |
| 1 Vehicle | 69,806 (19.3%) | 119,247 (41.3%) |
| 2 Vehicles | 157,255 (43.5%) | 98,461 (34.1%) |
| 3 or more Vehicles | 125,225 (34.6%) | 42,891 (14.8%) |
| Total | 361,551 (100.0%) | 288,801 (100.0%) |
Real Estate & Mortgages in Santa Clara County
Real Estate and Mortgage Overview in Santa Clara County
| Characteristic | Without Mortgage | With Mortgage |
| Housing Units | 115,493 | 246,058 |
| Median Property Value | $1,246,300 | $1,342,600 |
| Median Household Income | $121,998 | $172,135 |
| Monthly Housing Costs | $1,012 | $183,706 |
| Real Estate Taxes | $6,094 | $2,732 |
Property Value by Mortgage Status in Santa Clara County
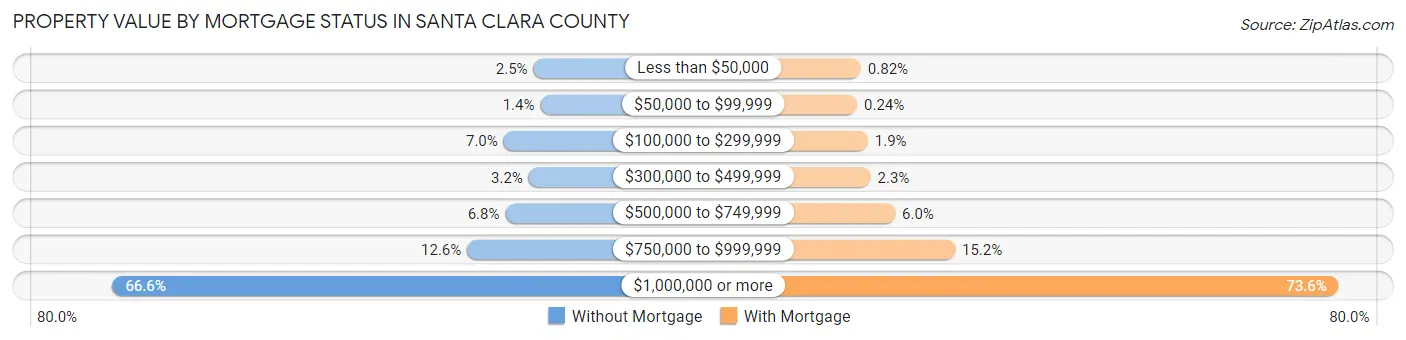
| Property Value | Without Mortgage | With Mortgage |
| Less than $50,000 | 2,841 (2.5%) | 2,006 (0.8%) |
| $50,000 to $99,999 | 1,643 (1.4%) | 590 (0.2%) |
| $100,000 to $299,999 | 8,101 (7.0%) | 4,615 (1.9%) |
| $300,000 to $499,999 | 3,681 (3.2%) | 5,641 (2.3%) |
| $500,000 to $749,999 | 7,801 (6.8%) | 14,834 (6.0%) |
| $750,000 to $999,999 | 14,512 (12.6%) | 37,292 (15.2%) |
| $1,000,000 or more | 76,914 (66.6%) | 181,080 (73.6%) |
| Total | 115,493 (100.0%) | 246,058 (100.0%) |
Household Income by Mortgage Status in Santa Clara County
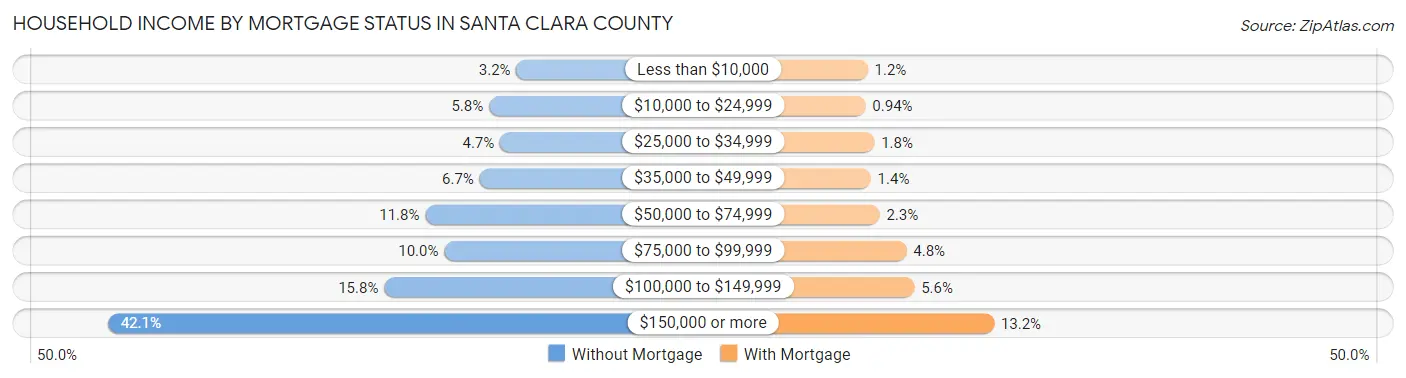
| Household Income | Without Mortgage | With Mortgage |
| Less than $10,000 | 3,650 (3.2%) | 2,837 (1.1%) |
| $10,000 to $24,999 | 6,669 (5.8%) | 2,302 (0.9%) |
| $25,000 to $34,999 | 5,439 (4.7%) | 4,375 (1.8%) |
| $35,000 to $49,999 | 7,695 (6.7%) | 3,543 (1.4%) |
| $50,000 to $74,999 | 13,671 (11.8%) | 5,615 (2.3%) |
| $75,000 to $99,999 | 11,582 (10.0%) | 11,906 (4.8%) |
| $100,000 to $149,999 | 18,188 (15.8%) | 13,744 (5.6%) |
| $150,000 or more | 48,599 (42.1%) | 32,438 (13.2%) |
| Total | 115,493 (100.0%) | 246,058 (100.0%) |
Property Value to Household Income Ratio in Santa Clara County
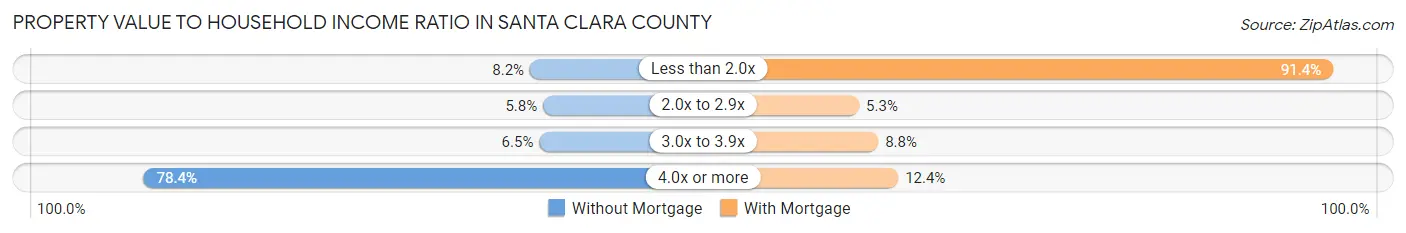
| Value-to-Income Ratio | Without Mortgage | With Mortgage |
| Less than 2.0x | 9,489 (8.2%) | 224,845 (91.4%) |
| 2.0x to 2.9x | 6,743 (5.8%) | 13,062 (5.3%) |
| 3.0x to 3.9x | 7,558 (6.5%) | 21,568 (8.8%) |
| 4.0x or more | 90,514 (78.4%) | 30,518 (12.4%) |
| Total | 115,493 (100.0%) | 246,058 (100.0%) |
Real Estate Taxes by Mortgage Status in Santa Clara County
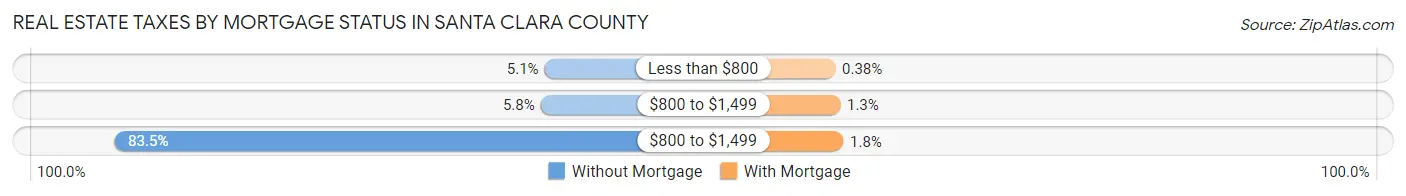
| Property Taxes | Without Mortgage | With Mortgage |
| Less than $800 | 5,828 (5.1%) | 937 (0.4%) |
| $800 to $1,499 | 6,648 (5.8%) | 3,139 (1.3%) |
| $800 to $1,499 | 96,403 (83.5%) | 4,538 (1.8%) |
| Total | 115,493 (100.0%) | 246,058 (100.0%) |
Health & Disability in Santa Clara County
Health Insurance Coverage by Age in Santa Clara County
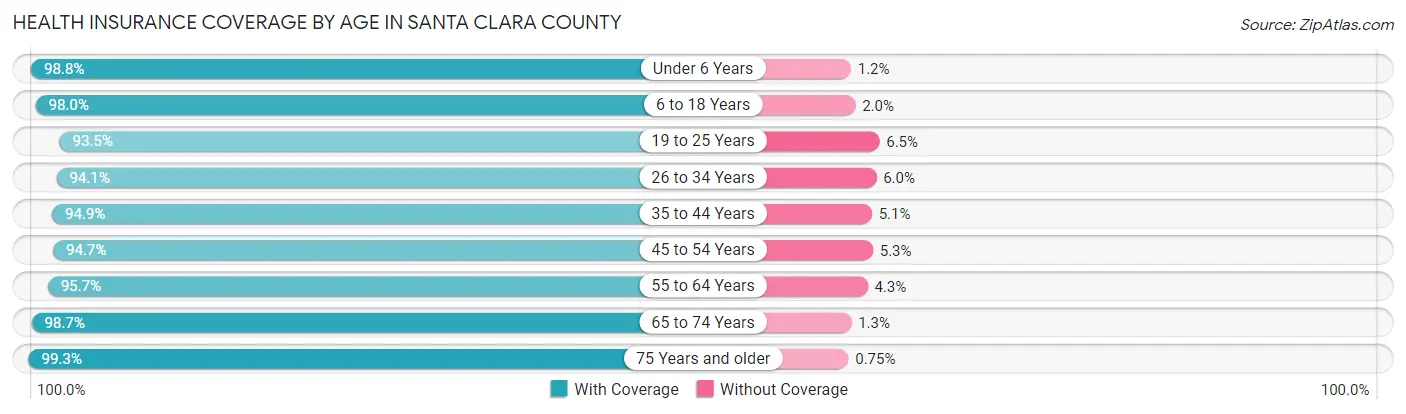
| Age Bracket | With Coverage | Without Coverage |
| Under 6 Years | 123,903 (98.8%) | 1,513 (1.2%) |
| 6 to 18 Years | 300,419 (98.0%) | 6,245 (2.0%) |
| 19 to 25 Years | 159,521 (93.5%) | 11,153 (6.5%) |
| 26 to 34 Years | 259,438 (94.1%) | 16,424 (5.9%) |
| 35 to 44 Years | 261,479 (94.9%) | 14,117 (5.1%) |
| 45 to 54 Years | 244,557 (94.7%) | 13,702 (5.3%) |
| 55 to 64 Years | 219,082 (95.7%) | 9,900 (4.3%) |
| 65 to 74 Years | 147,626 (98.7%) | 1,933 (1.3%) |
| 75 Years and older | 114,851 (99.3%) | 868 (0.7%) |
| Total | 1,830,876 (96.0%) | 75,855 (4.0%) |
Health Insurance Coverage by Citizenship Status in Santa Clara County
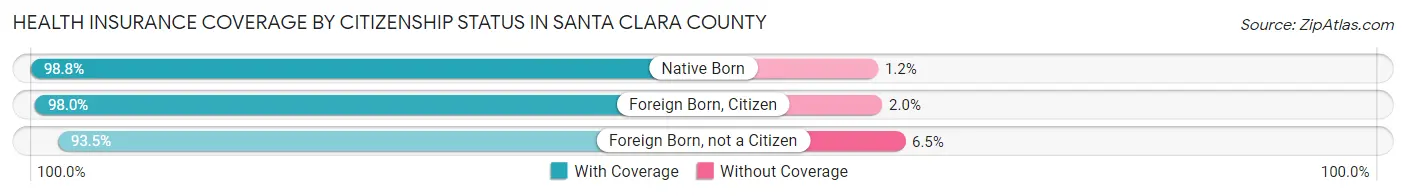
| Citizenship Status | With Coverage | Without Coverage |
| Native Born | 123,903 (98.8%) | 1,513 (1.2%) |
| Foreign Born, Citizen | 300,419 (98.0%) | 6,245 (2.0%) |
| Foreign Born, not a Citizen | 159,521 (93.5%) | 11,153 (6.5%) |
Health Insurance Coverage by Household Income in Santa Clara County
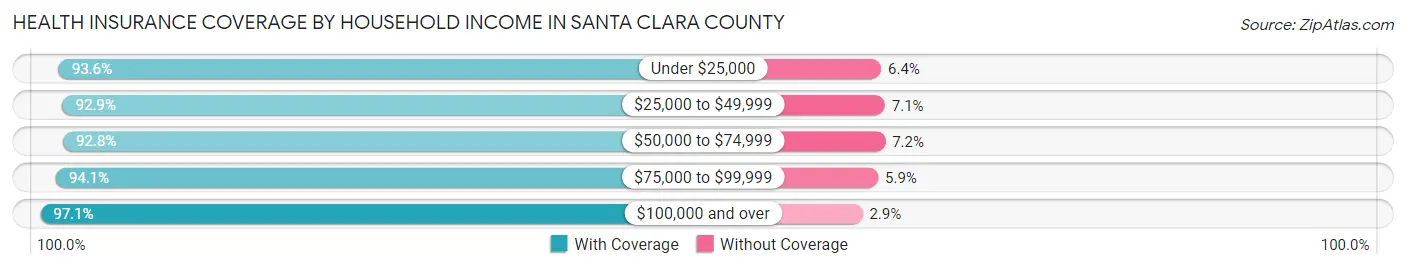
| Household Income | With Coverage | Without Coverage |
| Under $25,000 | 85,008 (93.6%) | 5,828 (6.4%) |
| $25,000 to $49,999 | 114,385 (92.9%) | 8,788 (7.1%) |
| $50,000 to $74,999 | 133,955 (92.8%) | 10,399 (7.2%) |
| $75,000 to $99,999 | 146,872 (94.1%) | 9,150 (5.9%) |
| $100,000 and over | 1,322,188 (97.1%) | 40,062 (2.9%) |
Public vs Private Health Insurance Coverage by Age in Santa Clara County
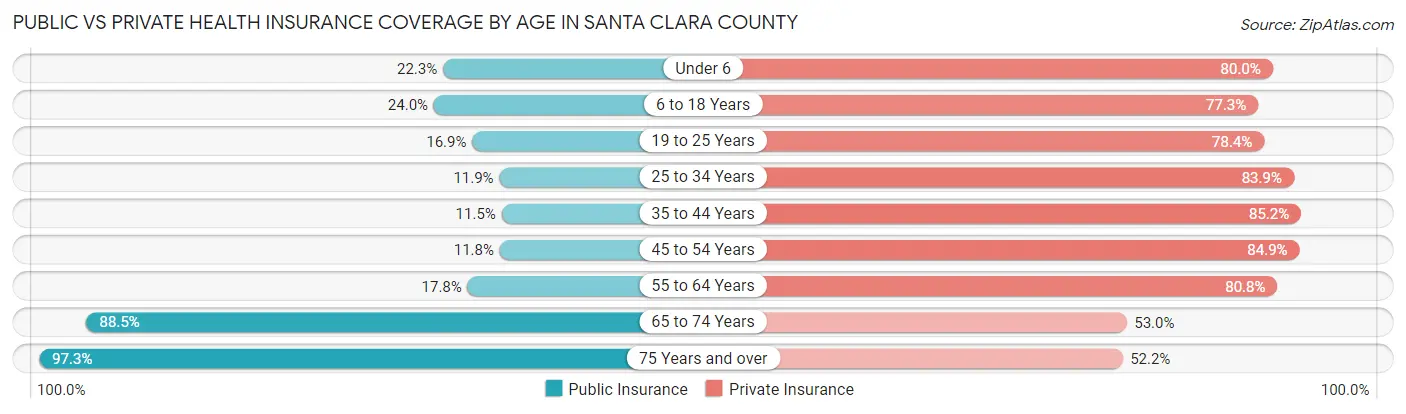
| Age Bracket | Public Insurance | Private Insurance |
| Under 6 | 28,008 (22.3%) | 100,300 (80.0%) |
| 6 to 18 Years | 73,702 (24.0%) | 236,957 (77.3%) |
| 19 to 25 Years | 28,848 (16.9%) | 133,795 (78.4%) |
| 25 to 34 Years | 32,724 (11.9%) | 231,384 (83.9%) |
| 35 to 44 Years | 31,561 (11.5%) | 234,906 (85.2%) |
| 45 to 54 Years | 30,485 (11.8%) | 219,332 (84.9%) |
| 55 to 64 Years | 40,683 (17.8%) | 185,093 (80.8%) |
| 65 to 74 Years | 132,397 (88.5%) | 79,251 (53.0%) |
| 75 Years and over | 112,618 (97.3%) | 60,441 (52.2%) |
| Total | 511,026 (26.8%) | 1,481,459 (77.7%) |
Disability Status by Sex by Age in Santa Clara County
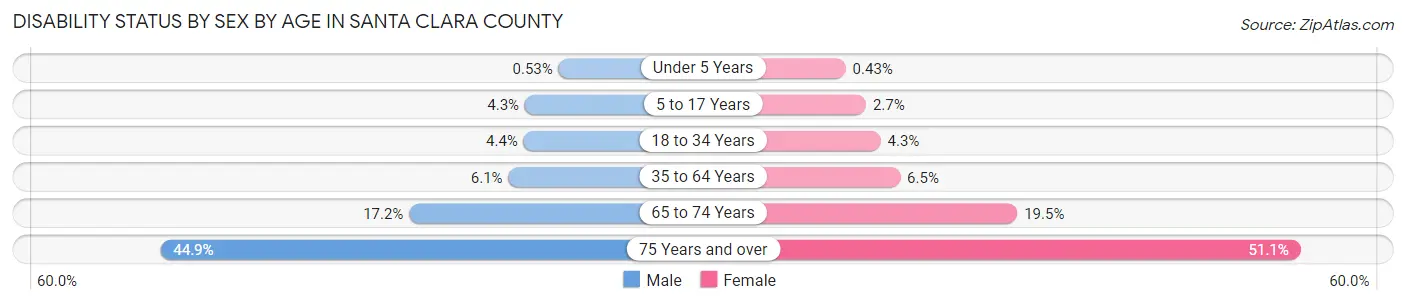
| Age Bracket | Male | Female |
| Under 5 Years | 284 (0.5%) | 220 (0.4%) |
| 5 to 17 Years | 6,631 (4.3%) | 3,943 (2.7%) |
| 18 to 34 Years | 11,147 (4.4%) | 9,551 (4.3%) |
| 35 to 64 Years | 24,024 (6.1%) | 24,054 (6.5%) |
| 65 to 74 Years | 12,128 (17.2%) | 15,418 (19.5%) |
| 75 Years and over | 21,853 (44.9%) | 34,251 (51.1%) |
Disability Class by Sex by Age in Santa Clara County
Disability Class: Hearing Difficulty
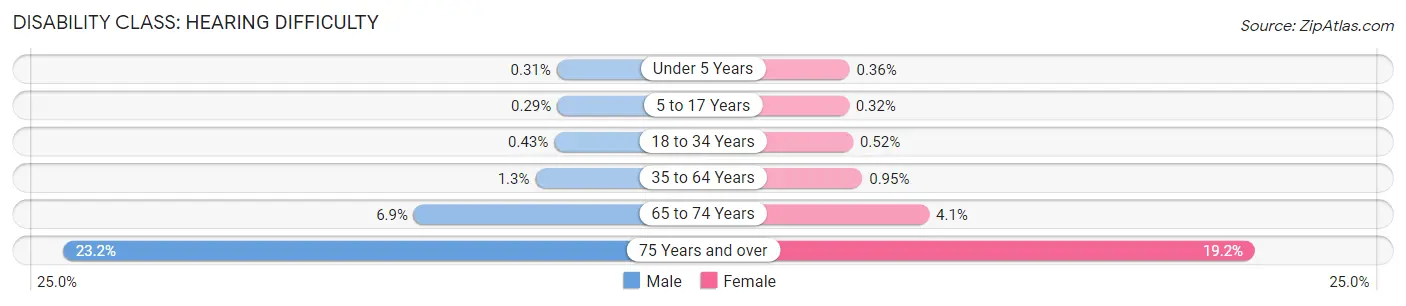
| Age Bracket | Male | Female |
| Under 5 Years | 166 (0.3%) | 183 (0.4%) |
| 5 to 17 Years | 443 (0.3%) | 473 (0.3%) |
| 18 to 34 Years | 1,074 (0.4%) | 1,148 (0.5%) |
| 35 to 64 Years | 5,125 (1.3%) | 3,505 (0.9%) |
| 65 to 74 Years | 4,905 (6.9%) | 3,196 (4.1%) |
| 75 Years and over | 11,312 (23.2%) | 12,847 (19.2%) |
Disability Class: Vision Difficulty
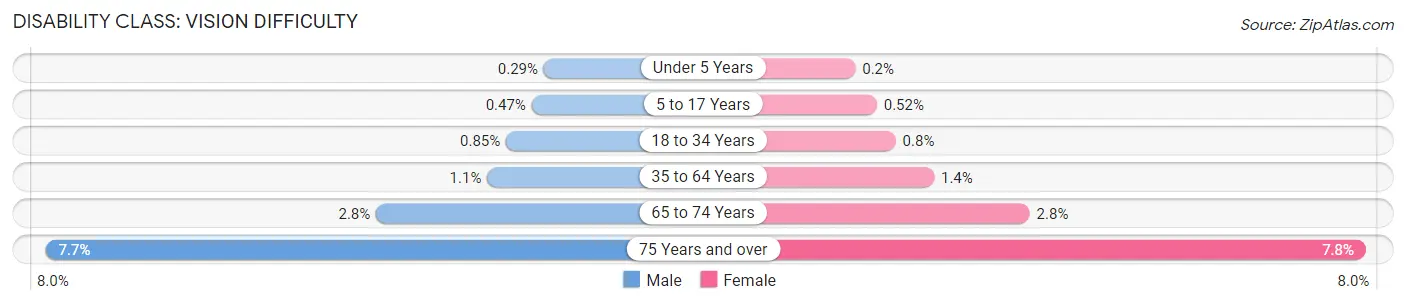
| Age Bracket | Male | Female |
| Under 5 Years | 158 (0.3%) | 100 (0.2%) |
| 5 to 17 Years | 722 (0.5%) | 754 (0.5%) |
| 18 to 34 Years | 2,140 (0.9%) | 1,764 (0.8%) |
| 35 to 64 Years | 4,447 (1.1%) | 5,059 (1.4%) |
| 65 to 74 Years | 1,965 (2.8%) | 2,198 (2.8%) |
| 75 Years and over | 3,743 (7.7%) | 5,215 (7.8%) |
Disability Class: Cognitive Difficulty
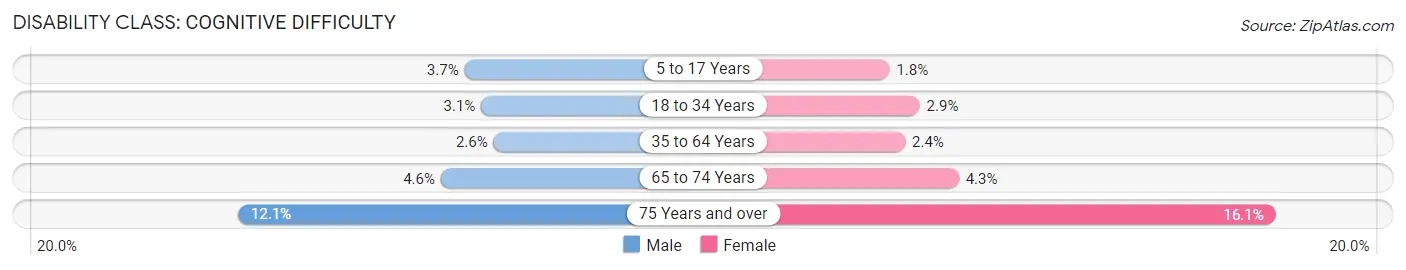
| Age Bracket | Male | Female |
| 5 to 17 Years | 5,676 (3.7%) | 2,583 (1.8%) |
| 18 to 34 Years | 7,678 (3.0%) | 6,384 (2.9%) |
| 35 to 64 Years | 10,186 (2.6%) | 8,705 (2.4%) |
| 65 to 74 Years | 3,217 (4.5%) | 3,423 (4.3%) |
| 75 Years and over | 5,879 (12.1%) | 10,795 (16.1%) |
Disability Class: Ambulatory Difficulty
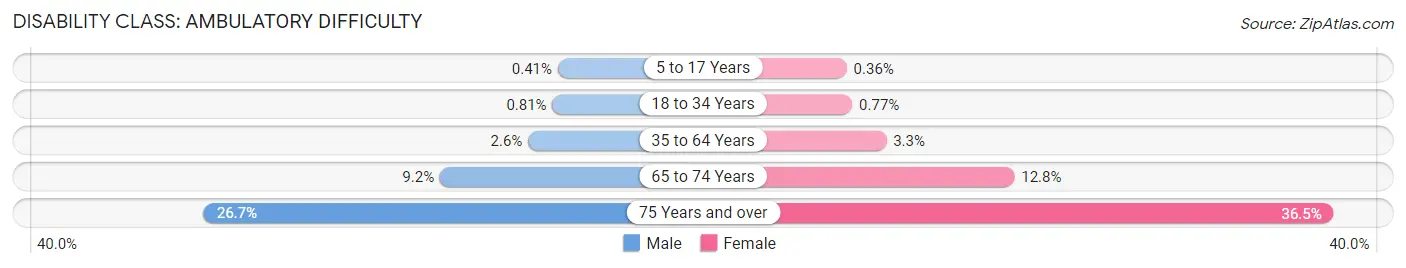
| Age Bracket | Male | Female |
| 5 to 17 Years | 642 (0.4%) | 520 (0.4%) |
| 18 to 34 Years | 2,046 (0.8%) | 1,694 (0.8%) |
| 35 to 64 Years | 10,241 (2.6%) | 12,209 (3.3%) |
| 65 to 74 Years | 6,471 (9.2%) | 10,111 (12.8%) |
| 75 Years and over | 12,993 (26.7%) | 24,474 (36.5%) |
Disability Class: Self-Care Difficulty
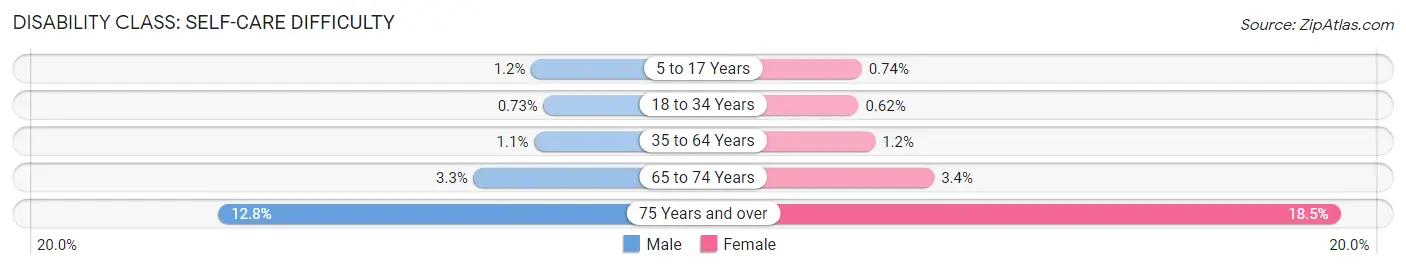
| Age Bracket | Male | Female |
| 5 to 17 Years | 1,848 (1.2%) | 1,080 (0.7%) |
| 18 to 34 Years | 1,833 (0.7%) | 1,366 (0.6%) |
| 35 to 64 Years | 4,250 (1.1%) | 4,585 (1.2%) |
| 65 to 74 Years | 2,353 (3.3%) | 2,710 (3.4%) |
| 75 Years and over | 6,239 (12.8%) | 12,410 (18.5%) |
Technology Access in Santa Clara County
Computing Device Access in Santa Clara County
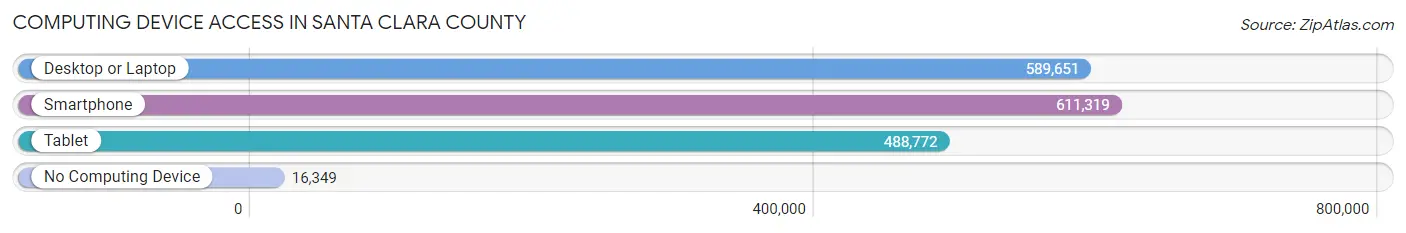
| Device Type | # Households | % Households |
| Desktop or Laptop | 589,651 | 90.7% |
| Smartphone | 611,319 | 94.0% |
| Tablet | 488,772 | 75.1% |
| No Computing Device | 16,349 | 2.5% |
| Total | 650,352 | 100.0% |
Internet Access in Santa Clara County
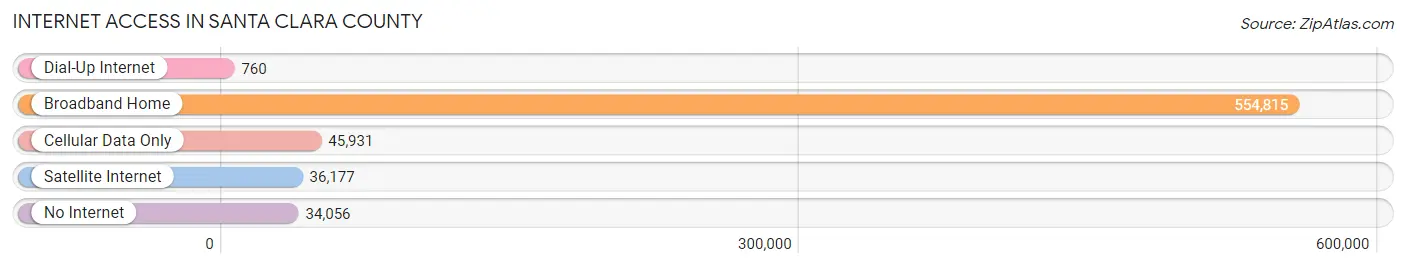
| Internet Type | # Households | % Households |
| Dial-Up Internet | 760 | 0.1% |
| Broadband Home | 554,815 | 85.3% |
| Cellular Data Only | 45,931 | 7.1% |
| Satellite Internet | 36,177 | 5.6% |
| No Internet | 34,056 | 5.2% |
| Total | 650,352 | 100.0% |
Santa Clara County Summary
Santa Clara County, located in the heart of California’s Silicon Valley, is one of the most populous and prosperous counties in the United States. With a population of 1.9 million people, Santa Clara County is the sixth most populous county in California and the 11th most populous county in the United States. The county is home to some of the world’s most innovative companies, including Apple, Google, and Intel, and is a major hub for technology, finance, and venture capital.
History
Santa Clara County was established in 1850 as one of the original 27 counties of California. The county was named after Mission Santa Clara de Asís, which was founded in 1777 and is the oldest operating mission in California. The county was originally part of the Rancho San Antonio land grant, which was granted to José Joaquín Estudillo in 1839.
The county experienced rapid growth in the late 19th and early 20th centuries, as the area became a major agricultural center and the population increased due to the arrival of immigrants from Europe and Asia. The county’s population continued to grow in the mid-20th century, as the area became a major center for technology and innovation.
Geography
Santa Clara County is located in the southern part of the San Francisco Bay Area, between San Francisco and San Jose. The county covers an area of 1,304 square miles and is bordered by San Mateo County to the north, Santa Cruz County to the south, and Alameda and San Joaquin Counties to the east. The county is home to several mountain ranges, including the Santa Cruz Mountains, Diablo Range, and Santa Lucia Range.
The county is divided into 15 cities and towns, including the cities of San Jose, Santa Clara, and Sunnyvale. The county also includes several unincorporated areas, such as Alviso, Cupertino, Los Altos, and Los Gatos.
Economy
Santa Clara County is one of the most prosperous counties in the United States. The county’s economy is driven by the technology industry, which is centered in Silicon Valley. The county is home to some of the world’s most innovative companies, including Apple, Google, and Intel. The county is also a major hub for venture capital and finance.
In addition to the technology industry, the county’s economy is also supported by agriculture, manufacturing, and tourism. The county is home to several wineries, and the Santa Clara Valley is one of the most important wine-producing regions in California.
Demographics
As of 2019, Santa Clara County had a population of 1.9 million people. The county is one of the most diverse counties in the United States, with a population that is 44.3% White, 28.2% Hispanic or Latino, 18.2% Asian, and 6.3% African American. The median household income in the county is $117,000, and the median home value is $1.2 million.
Conclusion
Santa Clara County is one of the most populous and prosperous counties in the United States. The county is home to some of the world’s most innovative companies, and its economy is driven by the technology industry. The county is also a major hub for venture capital and finance. The county is diverse, with a population that is 44.3% White, 28.2% Hispanic or Latino, 18.2% Asian, and 6.3% African American. The median household income in the county is $117,000, and the median home value is $1.2 million.
Common Questions
What is Per Capita Income in Santa Clara County?
Per Capita income in Santa Clara County is $73,017.
What is the Median Family Income in Santa Clara County?
Median Family Income in Santa Clara County is $174,855.
What is the Median Household income in Santa Clara County?
Median Household Income in Santa Clara County is $153,792.
What is Income or Wage Gap in Santa Clara County?
Income or Wage Gap in Santa Clara County is 37.0%.
Women in Santa Clara County earn 63.0 cents for every dollar earned by a man.
What is Family Income Deficit in Santa Clara County?
Family Income Deficit in Santa Clara County is $11,061.
Families that are below poverty line in Santa Clara County earn $11,061 less on average than the poverty threshold level.
What is Inequality or Gini Index in Santa Clara County?
Inequality or Gini Index in Santa Clara County is 0.47.
What is the Total Population of Santa Clara County?
Total Population of Santa Clara County is 1,916,831.
What is the Total Male Population of Santa Clara County?
Total Male Population of Santa Clara County is 978,952.
What is the Total Female Population of Santa Clara County?
Total Female Population of Santa Clara County is 937,879.
What is the Ratio of Males per 100 Females in Santa Clara County?
There are 104.38 Males per 100 Females in Santa Clara County.
What is the Ratio of Females per 100 Males in Santa Clara County?
There are 95.80 Females per 100 Males in Santa Clara County.
What is the Median Population Age in Santa Clara County?
Median Population Age in Santa Clara County is 37.7 Years.
What is the Average Family Size in Santa Clara County
Average Family Size in Santa Clara County is 3.4 People.
What is the Average Household Size in Santa Clara County
Average Household Size in Santa Clara County is 2.9 People.
How Large is the Labor Force in Santa Clara County?
There are 1,050,457 People in the Labor Forcein in Santa Clara County.
What is the Percentage of People in the Labor Force in Santa Clara County?
67.4% of People are in the Labor Force in Santa Clara County.
What is the Unemployment Rate in Santa Clara County?
Unemployment Rate in Santa Clara County is 4.4%.