Spring Mount, PA Map & Demographics
Spring Mount Map
Spring Mount Overview
$34,535
PER CAPITA INCOME
$102,308
AVG FAMILY INCOME
$86,538
AVG HOUSEHOLD INCOME
29.9%
WAGE / INCOME GAP [ % ]
70.1¢/ $1
WAGE / INCOME GAP [ $ ]
0.42
INEQUALITY / GINI INDEX
2,566
TOTAL POPULATION
1,271
MALE POPULATION
1,295
FEMALE POPULATION
98.15
MALES / 100 FEMALES
101.89
FEMALES / 100 MALES
34.3
MEDIAN AGE
3.1
AVG FAMILY SIZE
2.5
AVG HOUSEHOLD SIZE
1,366
LABOR FORCE [ PEOPLE ]
73.6%
PERCENT IN LABOR FORCE
9.5%
UNEMPLOYMENT RATE
Income in Spring Mount
Income Overview in Spring Mount
Per Capita Income in Spring Mount is $34,535, while median incomes of families and households are $102,308 and $86,538 respectively.
| Characteristic | Number | Measure |
| Per Capita Income | 2,566 | $34,535 |
| Median Family Income | 684 | $102,308 |
| Mean Family Income | 684 | $94,319 |
| Median Household Income | 1,028 | $86,538 |
| Mean Household Income | 1,028 | $87,186 |
| Income Deficit | 684 | $0 |
| Wage / Income Gap (%) | 2,566 | 29.93% |
| Wage / Income Gap ($) | 2,566 | 70.07¢ per $1 |
| Gini / Inequality Index | 2,566 | 0.42 |
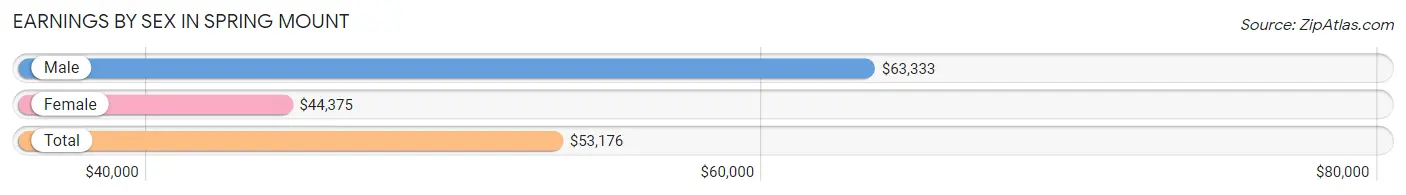
Earnings by Sex in Spring Mount
Average Earnings in Spring Mount are $53,176, $63,333 for men and $44,375 for women, a difference of 29.9%.
| Sex | Number | Average Earnings |
| Male | 648 (48.2%) | $63,333 |
| Female | 696 (51.8%) | $44,375 |
| Total | 1,344 (100.0%) | $53,176 |
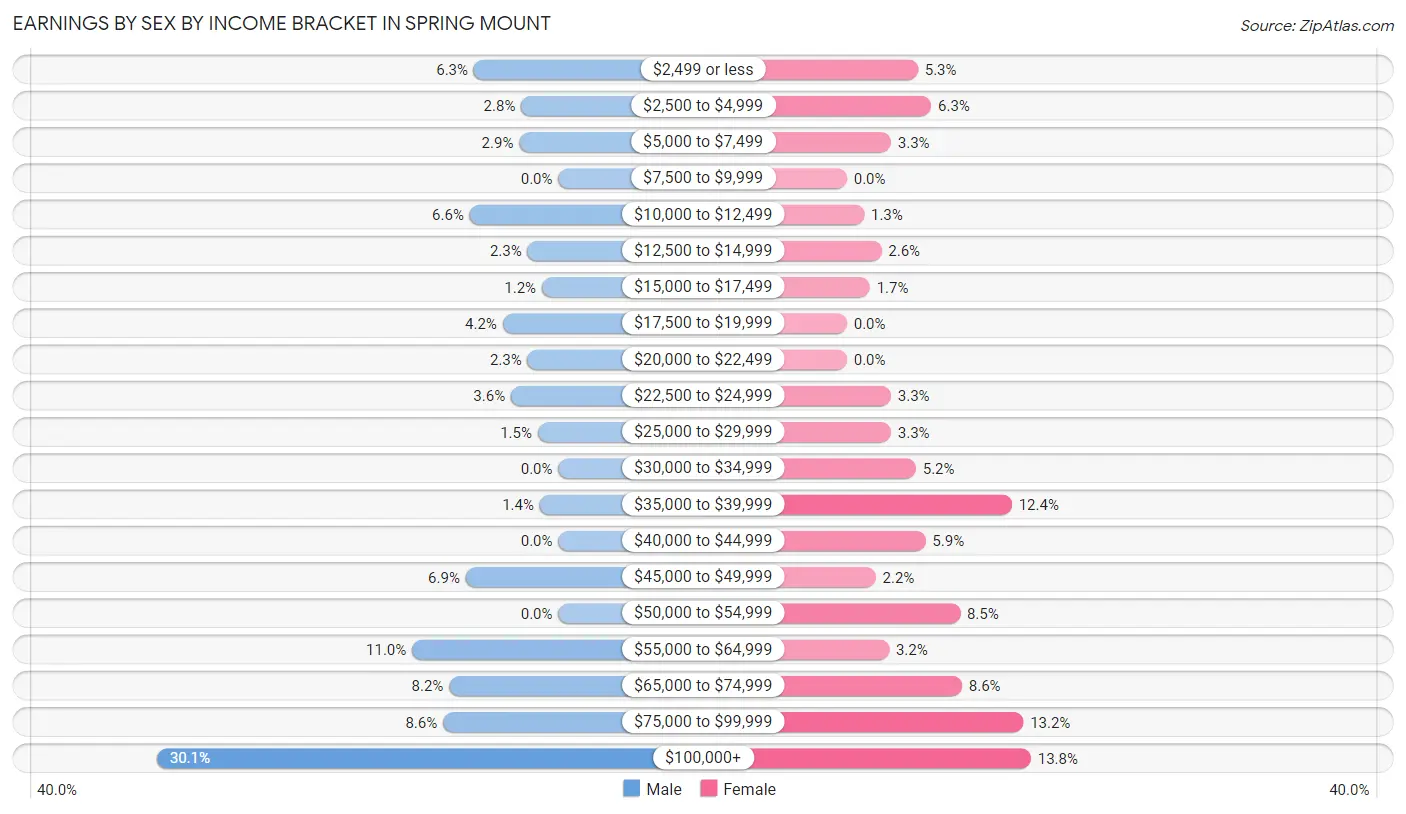
Earnings by Sex by Income Bracket in Spring Mount
The most common earnings brackets in Spring Mount are $100,000+ for men (195 | 30.1%) and $100,000+ for women (96 | 13.8%).
| Income | Male | Female |
| $2,499 or less | 41 (6.3%) | 37 (5.3%) |
| $2,500 to $4,999 | 18 (2.8%) | 44 (6.3%) |
| $5,000 to $7,499 | 19 (2.9%) | 23 (3.3%) |
| $7,500 to $9,999 | 0 (0.0%) | 0 (0.0%) |
| $10,000 to $12,499 | 43 (6.6%) | 9 (1.3%) |
| $12,500 to $14,999 | 15 (2.3%) | 18 (2.6%) |
| $15,000 to $17,499 | 8 (1.2%) | 12 (1.7%) |
| $17,500 to $19,999 | 27 (4.2%) | 0 (0.0%) |
| $20,000 to $22,499 | 15 (2.3%) | 0 (0.0%) |
| $22,500 to $24,999 | 23 (3.5%) | 23 (3.3%) |
| $25,000 to $29,999 | 10 (1.5%) | 23 (3.3%) |
| $30,000 to $34,999 | 0 (0.0%) | 36 (5.2%) |
| $35,000 to $39,999 | 9 (1.4%) | 86 (12.4%) |
| $40,000 to $44,999 | 0 (0.0%) | 41 (5.9%) |
| $45,000 to $49,999 | 45 (6.9%) | 15 (2.2%) |
| $50,000 to $54,999 | 0 (0.0%) | 59 (8.5%) |
| $55,000 to $64,999 | 71 (11.0%) | 22 (3.2%) |
| $65,000 to $74,999 | 53 (8.2%) | 60 (8.6%) |
| $75,000 to $99,999 | 56 (8.6%) | 92 (13.2%) |
| $100,000+ | 195 (30.1%) | 96 (13.8%) |
| Total | 648 (100.0%) | 696 (100.0%) |
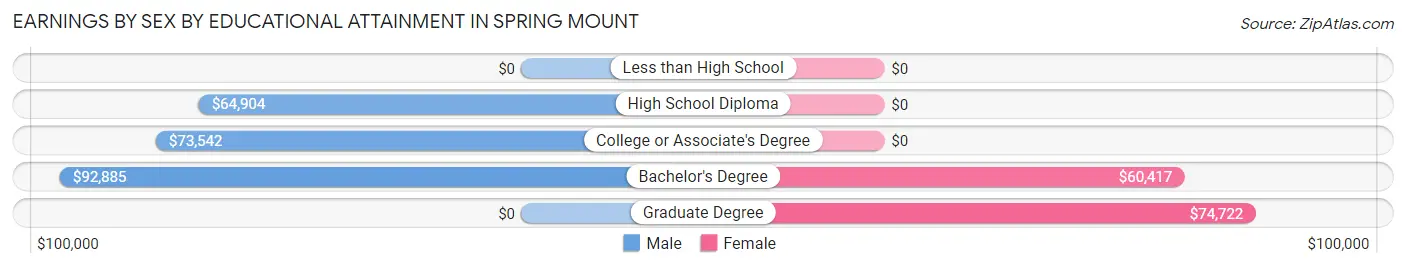
Earnings by Sex by Educational Attainment in Spring Mount
Average earnings in Spring Mount are $73,299 for men and $50,341 for women, a difference of 31.3%. Men with an educational attainment of bachelor's degree enjoy the highest average annual earnings of $92,885, while those with high school diploma education earn the least with $64,904. Women with an educational attainment of graduate degree earn the most with the average annual earnings of $74,722, while those with bachelor's degree education have the smallest earnings of $60,417.
| Educational Attainment | Male Income | Female Income |
| Less than High School | - | - |
| High School Diploma | $64,904 | $0 |
| College or Associate's Degree | $73,542 | $0 |
| Bachelor's Degree | $92,885 | $60,417 |
| Graduate Degree | - | - |
| Total | $73,299 | $50,341 |
Family Income in Spring Mount
Family Income Brackets in Spring Mount
According to the Spring Mount family income data, there are 261 families falling into the $100,000 to $149,999 income range, which is the most common income bracket and makes up 38.2% of all families.
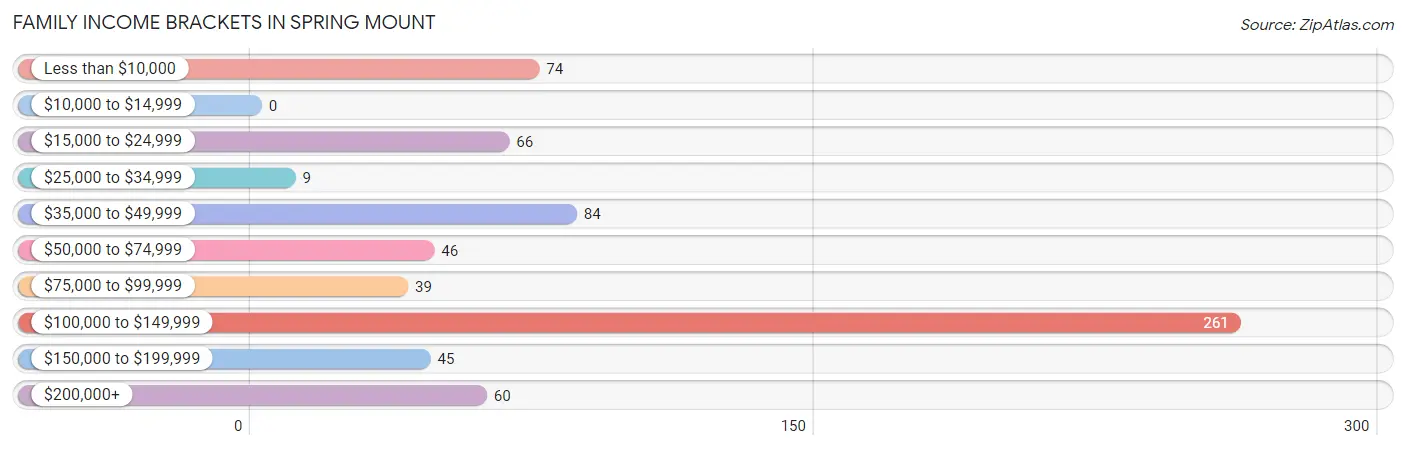
| Income Bracket | # Families | % Families |
| Less than $10,000 | 74 | 10.8% |
| $10,000 to $14,999 | 0 | 0.0% |
| $15,000 to $24,999 | 66 | 9.6% |
| $25,000 to $34,999 | 9 | 1.3% |
| $35,000 to $49,999 | 84 | 12.3% |
| $50,000 to $74,999 | 46 | 6.7% |
| $75,000 to $99,999 | 39 | 5.7% |
| $100,000 to $149,999 | 261 | 38.2% |
| $150,000 to $199,999 | 45 | 6.6% |
| $200,000+ | 60 | 8.8% |
Family Income by Famaliy Size in Spring Mount
3-person families (298 | 43.6%) account for the highest median family income in Spring Mount with $107,786 per family, while 2-person families (178 | 26.0%) have the highest median income of $51,406 per family member.
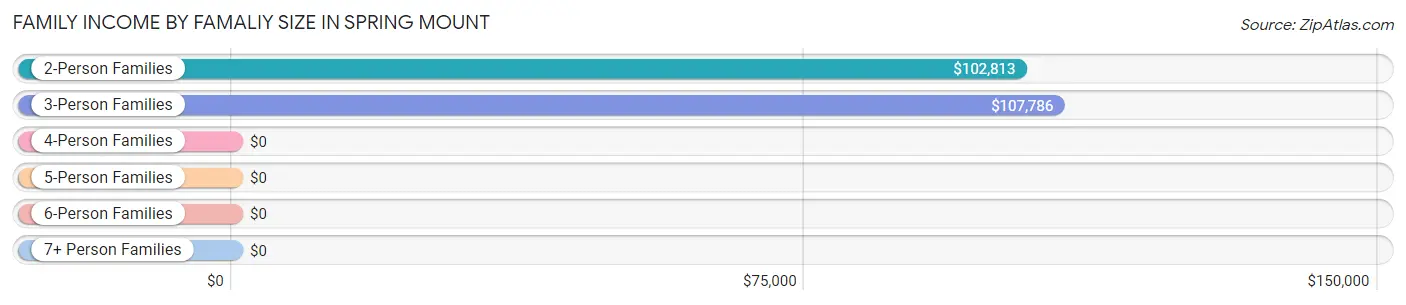
| Income Bracket | # Families | Median Income |
| 2-Person Families | 178 (26.0%) | $102,813 |
| 3-Person Families | 298 (43.6%) | $107,786 |
| 4-Person Families | 138 (20.2%) | $0 |
| 5-Person Families | 53 (7.7%) | $0 |
| 6-Person Families | 17 (2.5%) | $0 |
| 7+ Person Families | 0 (0.0%) | $0 |
| Total | 684 (100.0%) | $102,308 |
Family Income by Number of Earners in Spring Mount
The median family income in Spring Mount is $102,308, with families comprising 3+ earners (93) having the highest median family income of $163,625, while families with no earners (50) have the lowest median family income of $33,333, accounting for 13.6% and 7.3% of families, respectively.
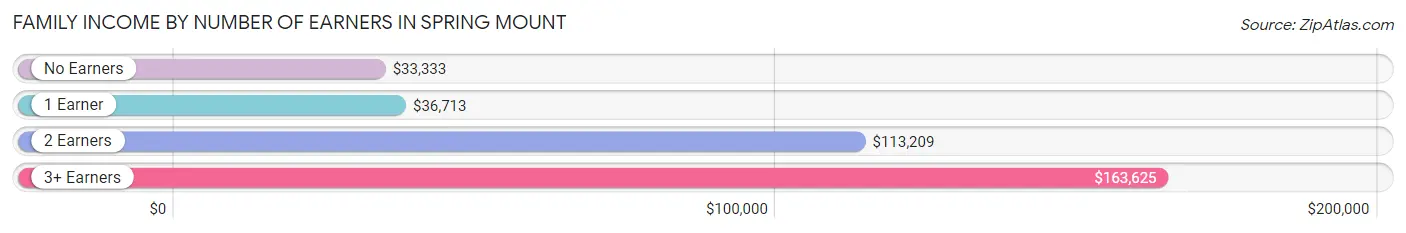
| Number of Earners | # Families | Median Income |
| No Earners | 50 (7.3%) | $33,333 |
| 1 Earner | 240 (35.1%) | $36,713 |
| 2 Earners | 301 (44.0%) | $113,209 |
| 3+ Earners | 93 (13.6%) | $163,625 |
| Total | 684 (100.0%) | $102,308 |
Household Income in Spring Mount
Household Income Brackets in Spring Mount
With 361 households falling in the category, the $100,000 to $149,999 income range is the most frequent in Spring Mount, accounting for 35.1% of all households. In contrast, only 9 households (0.9%) fall into the $10,000 to $14,999 income bracket, making it the least populous group.
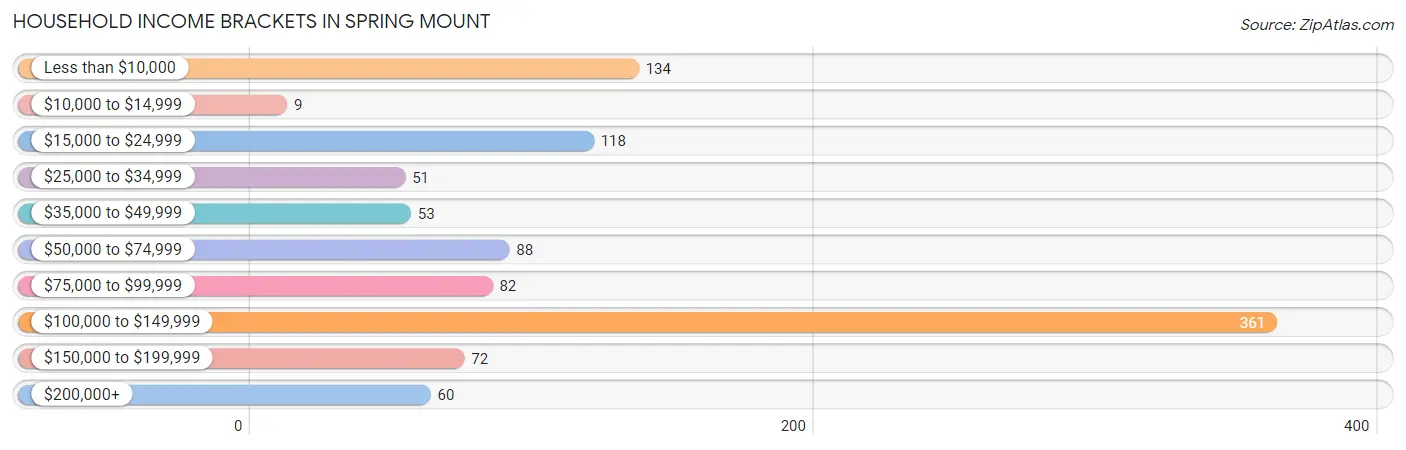
| Income Bracket | # Households | % Households |
| Less than $10,000 | 134 | 13.0% |
| $10,000 to $14,999 | 9 | 0.9% |
| $15,000 to $24,999 | 118 | 11.5% |
| $25,000 to $34,999 | 51 | 5.0% |
| $35,000 to $49,999 | 53 | 5.2% |
| $50,000 to $74,999 | 88 | 8.6% |
| $75,000 to $99,999 | 82 | 8.0% |
| $100,000 to $149,999 | 361 | 35.1% |
| $150,000 to $199,999 | 72 | 7.0% |
| $200,000+ | 60 | 5.8% |
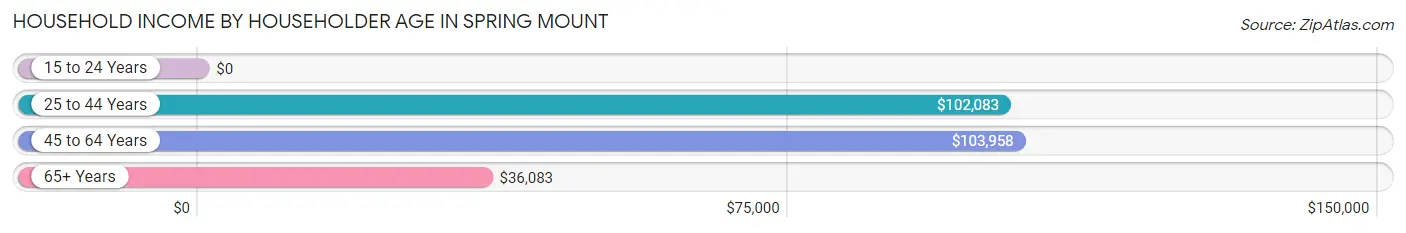
Household Income by Householder Age in Spring Mount
The median household income in Spring Mount is $86,538, with the highest median household income of $103,958 found in the 45 to 64 years age bracket for the primary householder. A total of 403 households (39.2%) fall into this category.
| Income Bracket | # Households | Median Income |
| 15 to 24 Years | 0 (0.0%) | $0 |
| 25 to 44 Years | 436 (42.4%) | $102,083 |
| 45 to 64 Years | 403 (39.2%) | $103,958 |
| 65+ Years | 189 (18.4%) | $36,083 |
| Total | 1,028 (100.0%) | $86,538 |
Poverty in Spring Mount
Income Below Poverty by Sex and Age in Spring Mount
With 16.8% poverty level for males and 21.4% for females among the residents of Spring Mount, under 5 year old males and under 5 year old females are the most vulnerable to poverty, with 47 males (42.7%) and 59 females (78.7%) in their respective age groups living below the poverty level.
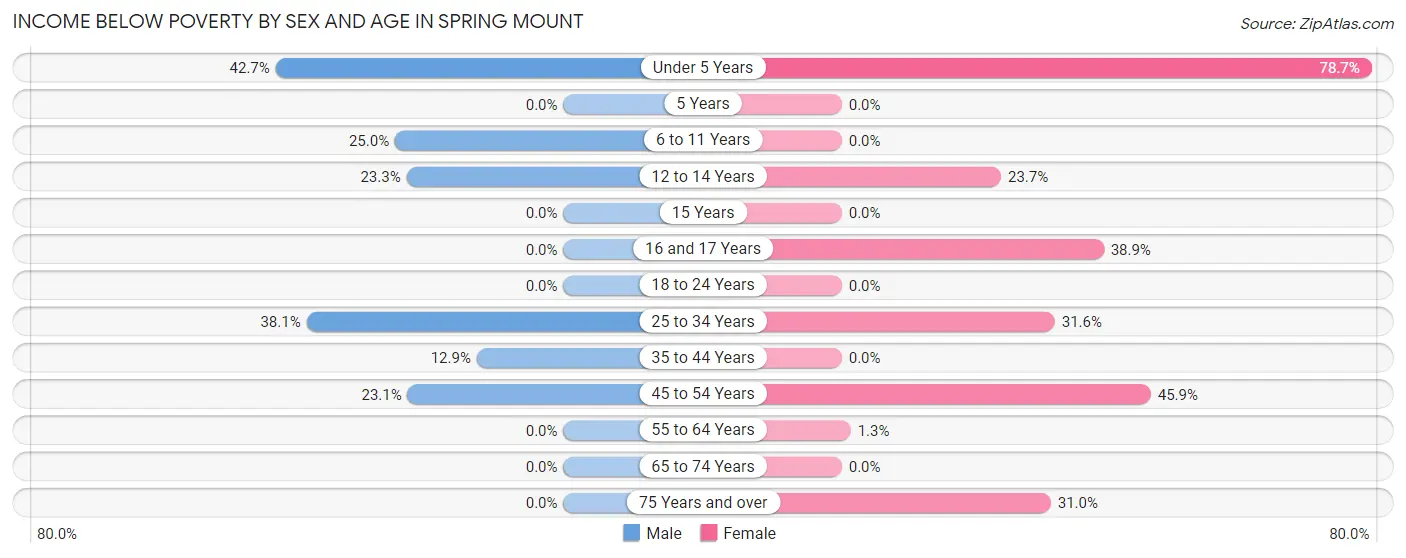
| Age Bracket | Male | Female |
| Under 5 Years | 47 (42.7%) | 59 (78.7%) |
| 5 Years | 0 (0.0%) | 0 (0.0%) |
| 6 to 11 Years | 43 (25.0%) | 0 (0.0%) |
| 12 to 14 Years | 17 (23.3%) | 35 (23.6%) |
| 15 Years | 0 (0.0%) | 0 (0.0%) |
| 16 and 17 Years | 0 (0.0%) | 21 (38.9%) |
| 18 to 24 Years | 0 (0.0%) | 0 (0.0%) |
| 25 to 34 Years | 45 (38.1%) | 62 (31.6%) |
| 35 to 44 Years | 27 (12.9%) | 0 (0.0%) |
| 45 to 54 Years | 34 (23.1%) | 89 (45.9%) |
| 55 to 64 Years | 0 (0.0%) | 2 (1.3%) |
| 65 to 74 Years | 0 (0.0%) | 0 (0.0%) |
| 75 Years and over | 0 (0.0%) | 9 (31.0%) |
| Total | 213 (16.8%) | 277 (21.4%) |
Income Above Poverty by Sex and Age in Spring Mount
According to the poverty statistics in Spring Mount, males aged 5 years and females aged 5 years are the age groups that are most secure financially, with 100.0% of males and 100.0% of females in these age groups living above the poverty line.
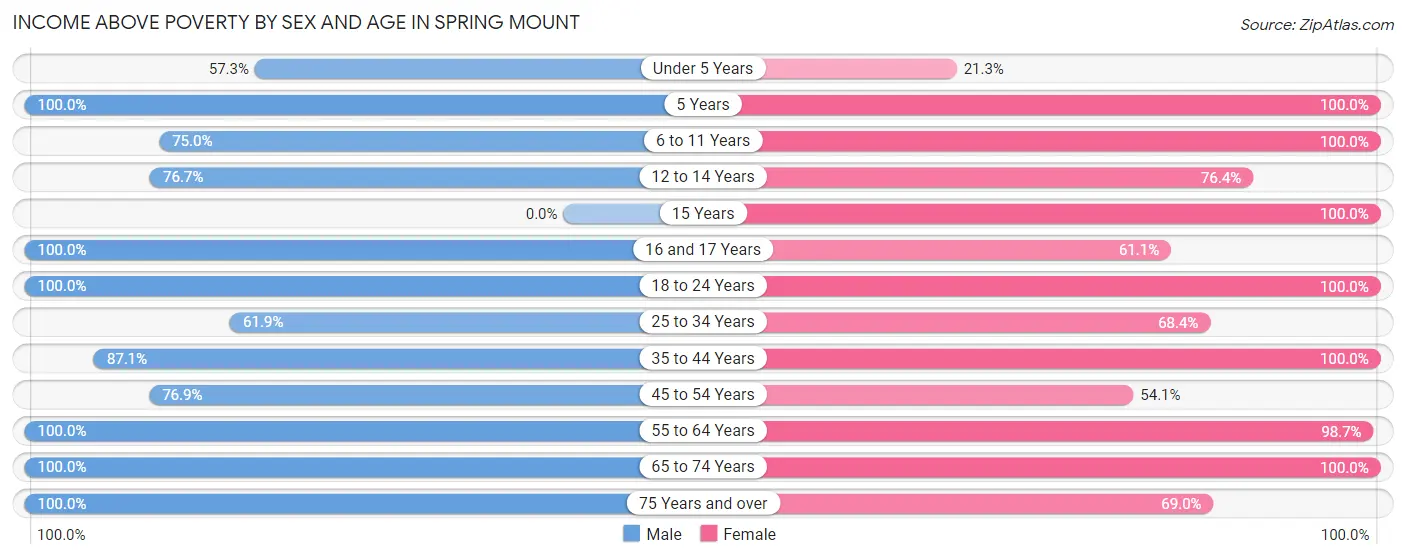
| Age Bracket | Male | Female |
| Under 5 Years | 63 (57.3%) | 16 (21.3%) |
| 5 Years | 12 (100.0%) | 12 (100.0%) |
| 6 to 11 Years | 129 (75.0%) | 94 (100.0%) |
| 12 to 14 Years | 56 (76.7%) | 113 (76.3%) |
| 15 Years | 0 (0.0%) | 14 (100.0%) |
| 16 and 17 Years | 68 (100.0%) | 33 (61.1%) |
| 18 to 24 Years | 136 (100.0%) | 21 (100.0%) |
| 25 to 34 Years | 73 (61.9%) | 134 (68.4%) |
| 35 to 44 Years | 183 (87.1%) | 179 (100.0%) |
| 45 to 54 Years | 113 (76.9%) | 105 (54.1%) |
| 55 to 64 Years | 113 (100.0%) | 150 (98.7%) |
| 65 to 74 Years | 85 (100.0%) | 127 (100.0%) |
| 75 Years and over | 27 (100.0%) | 20 (69.0%) |
| Total | 1,058 (83.2%) | 1,018 (78.6%) |
Income Below Poverty Among Married-Couple Families in Spring Mount
The poverty statistics for married-couple families in Spring Mount show that 9.4% or 35 of the total 372 families live below the poverty line. Families with 3 or 4 children have the highest poverty rate of 34.0%, comprising of 18 families. On the other hand, families with no children have the lowest poverty rate of 0.0%, which includes 0 families.
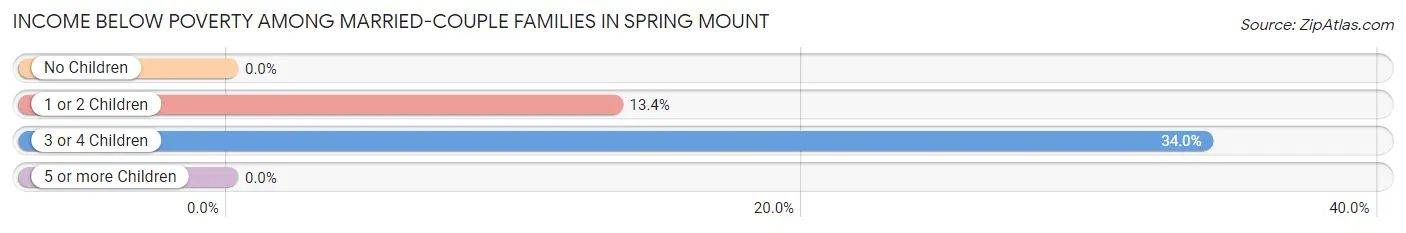
| Children | Above Poverty | Below Poverty |
| No Children | 192 (100.0%) | 0 (0.0%) |
| 1 or 2 Children | 110 (86.6%) | 17 (13.4%) |
| 3 or 4 Children | 35 (66.0%) | 18 (34.0%) |
| 5 or more Children | 0 (0.0%) | 0 (0.0%) |
| Total | 337 (90.6%) | 35 (9.4%) |
Income Below Poverty Among Single-Parent Households in Spring Mount
According to the poverty data in Spring Mount, 40.9% or 27 single-father households and 22.8% or 56 single-mother households are living below the poverty line. Among single-father households, those with 1 or 2 children have the highest poverty rate, with 27 households (100.0%) experiencing poverty. Likewise, among single-mother households, those with 1 or 2 children have the highest poverty rate, with 56 households (39.4%) falling below the poverty line.
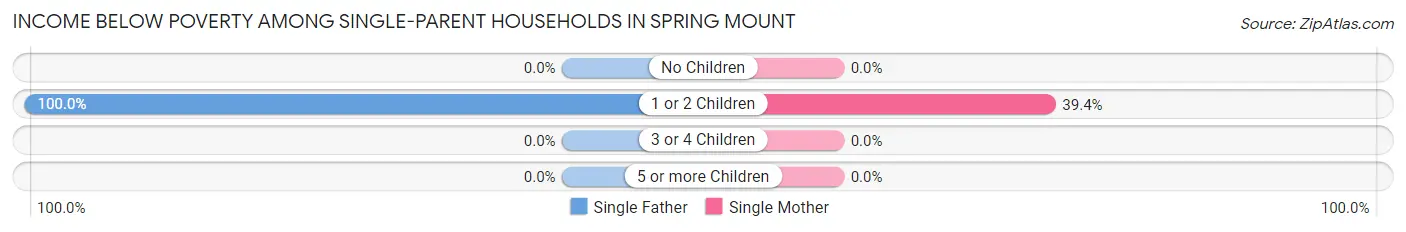
| Children | Single Father | Single Mother |
| No Children | 0 (0.0%) | 0 (0.0%) |
| 1 or 2 Children | 27 (100.0%) | 56 (39.4%) |
| 3 or 4 Children | 0 (0.0%) | 0 (0.0%) |
| 5 or more Children | 0 (0.0%) | 0 (0.0%) |
| Total | 27 (40.9%) | 56 (22.8%) |
Income Below Poverty Among Married-Couple vs Single-Parent Households in Spring Mount
The poverty data for Spring Mount shows that 35 of the married-couple family households (9.4%) and 83 of the single-parent households (26.6%) are living below the poverty level. Within the married-couple family households, those with 3 or 4 children have the highest poverty rate, with 18 households (34.0%) falling below the poverty line. Among the single-parent households, those with 1 or 2 children have the highest poverty rate, with 83 household (49.1%) living below poverty.
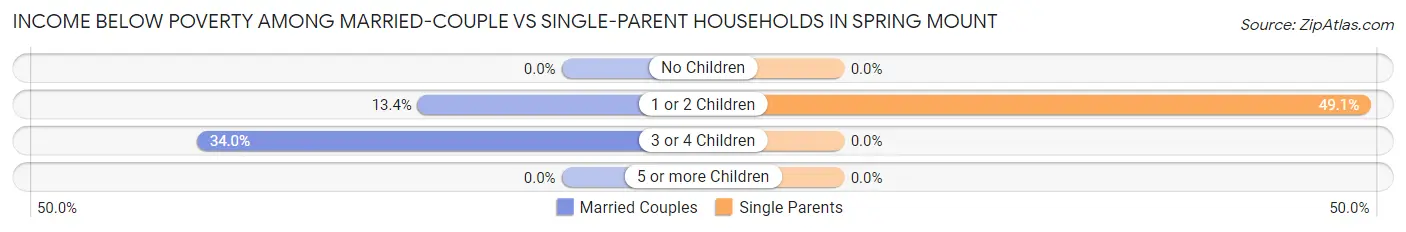
| Children | Married-Couple Families | Single-Parent Households |
| No Children | 0 (0.0%) | 0 (0.0%) |
| 1 or 2 Children | 17 (13.4%) | 83 (49.1%) |
| 3 or 4 Children | 18 (34.0%) | 0 (0.0%) |
| 5 or more Children | 0 (0.0%) | 0 (0.0%) |
| Total | 35 (9.4%) | 83 (26.6%) |
Race in Spring Mount
The most populous races in Spring Mount are White / Caucasian (2,404 | 93.7%), Black / African American (86 | 3.4%), and Hispanic or Latino (66 | 2.6%).
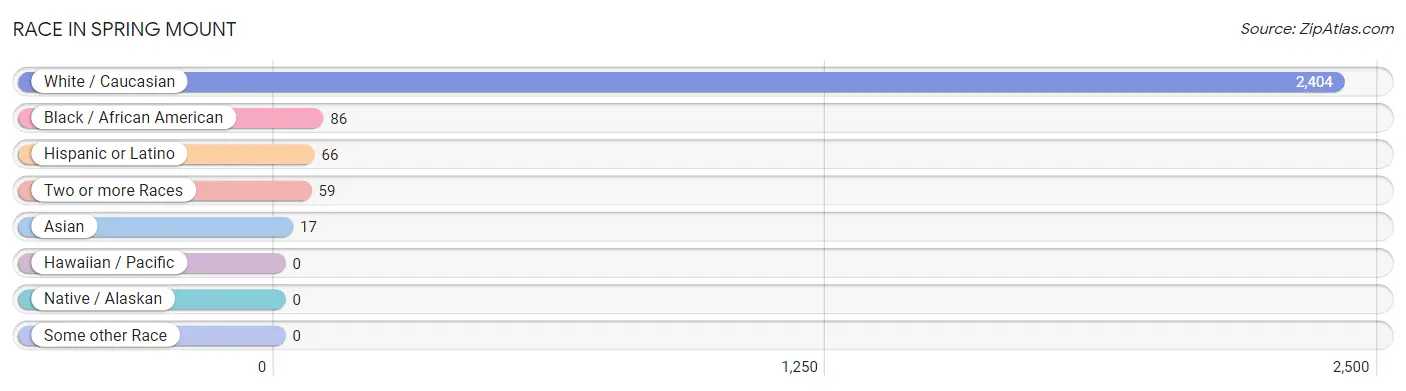
| Race | # Population | % Population |
| Asian | 17 | 0.7% |
| Black / African American | 86 | 3.4% |
| Hawaiian / Pacific | 0 | 0.0% |
| Hispanic or Latino | 66 | 2.6% |
| Native / Alaskan | 0 | 0.0% |
| White / Caucasian | 2,404 | 93.7% |
| Two or more Races | 59 | 2.3% |
| Some other Race | 0 | 0.0% |
| Total | 2,566 | 100.0% |
Ancestry in Spring Mount
The most populous ancestries reported in Spring Mount are German (1,187 | 46.3%), Irish (803 | 31.3%), Italian (706 | 27.5%), American (184 | 7.2%), and Polish (89 | 3.5%), together accounting for 115.7% of all Spring Mount residents.
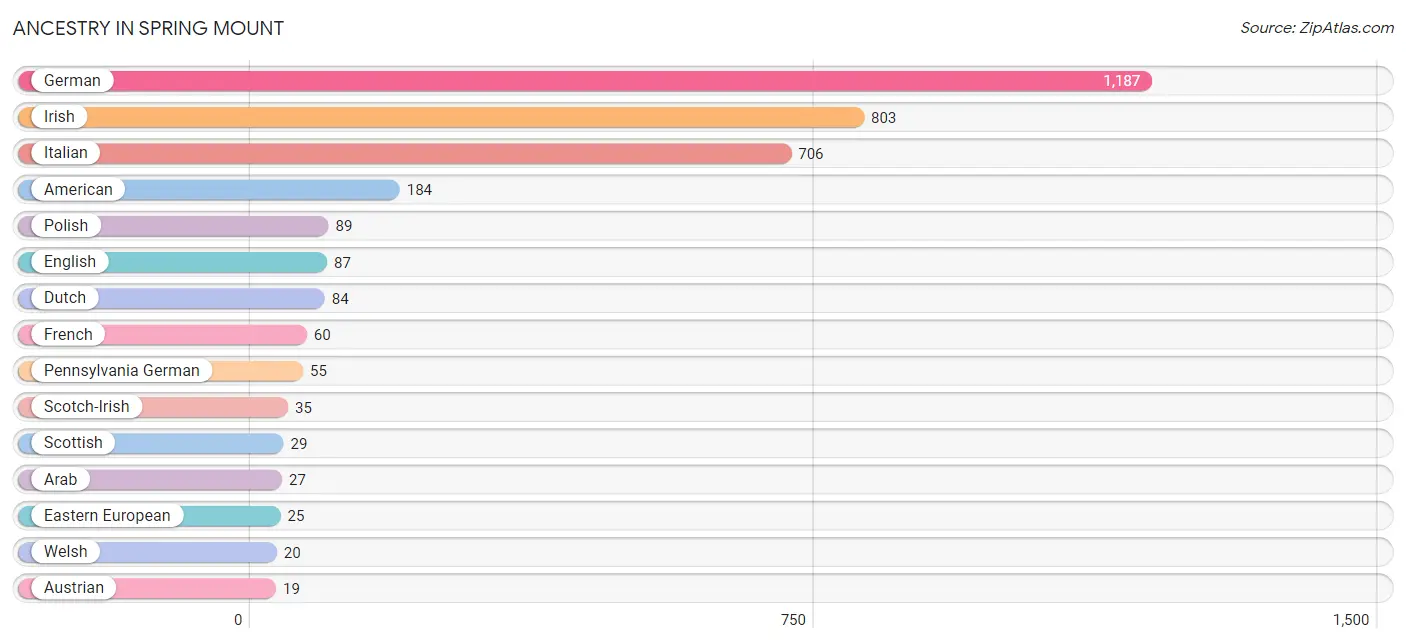
| Ancestry | # Population | % Population |
| American | 184 | 7.2% |
| Arab | 27 | 1.1% |
| Austrian | 19 | 0.7% |
| British | 12 | 0.5% |
| Canadian | 7 | 0.3% |
| Cherokee | 13 | 0.5% |
| Czechoslovakian | 8 | 0.3% |
| Danish | 17 | 0.7% |
| Dutch | 84 | 3.3% |
| Eastern European | 25 | 1.0% |
| English | 87 | 3.4% |
| European | 8 | 0.3% |
| French | 60 | 2.3% |
| German | 1,187 | 46.3% |
| Hungarian | 9 | 0.4% |
| Irish | 803 | 31.3% |
| Italian | 706 | 27.5% |
| Liberian | 9 | 0.4% |
| Lithuanian | 8 | 0.3% |
| Mexican | 12 | 0.5% |
| Norwegian | 9 | 0.4% |
| Pennsylvania German | 55 | 2.1% |
| Polish | 89 | 3.5% |
| Puerto Rican | 10 | 0.4% |
| Russian | 19 | 0.7% |
| Scandinavian | 10 | 0.4% |
| Scotch-Irish | 35 | 1.4% |
| Scottish | 29 | 1.1% |
| Spaniard | 13 | 0.5% |
| Sri Lankan | 17 | 0.7% |
| Subsaharan African | 9 | 0.4% |
| Swedish | 9 | 0.4% |
| Ukrainian | 10 | 0.4% |
| Welsh | 20 | 0.8% | View All 34 Rows |
Immigrants in Spring Mount
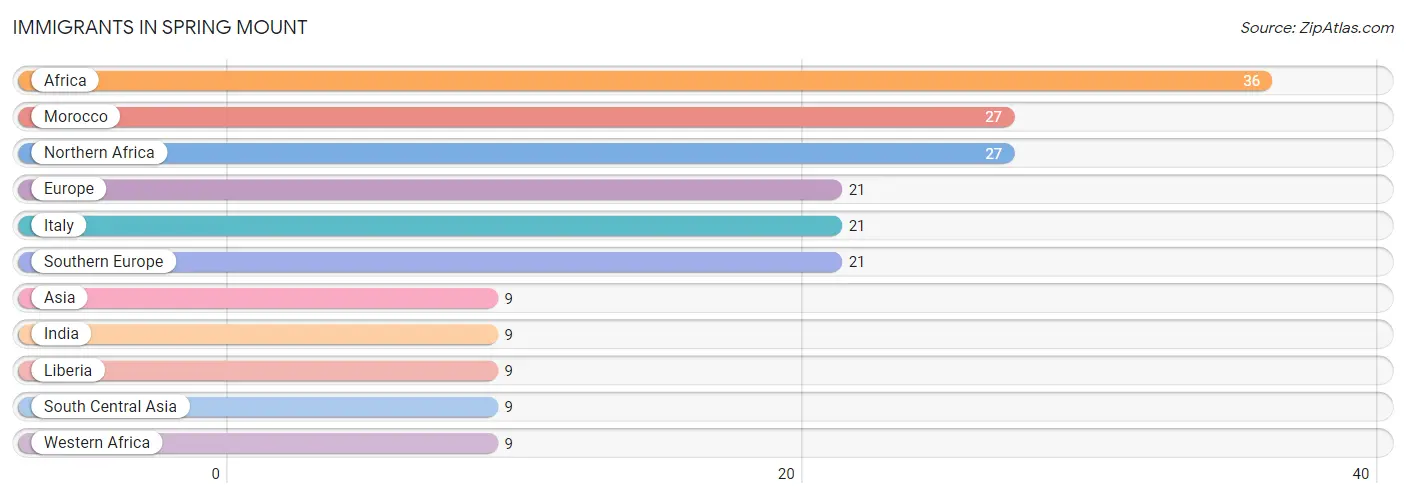
The most numerous immigrant groups reported in Spring Mount came from Africa (36 | 1.4%), Morocco (27 | 1.1%), Northern Africa (27 | 1.1%), Europe (21 | 0.8%), and Italy (21 | 0.8%), together accounting for 5.1% of all Spring Mount residents.
| Immigration Origin | # Population | % Population |
| Africa | 36 | 1.4% |
| Asia | 9 | 0.4% |
| Europe | 21 | 0.8% |
| India | 9 | 0.4% |
| Italy | 21 | 0.8% |
| Liberia | 9 | 0.4% |
| Morocco | 27 | 1.1% |
| Northern Africa | 27 | 1.1% |
| South Central Asia | 9 | 0.4% |
| Southern Europe | 21 | 0.8% |
| Western Africa | 9 | 0.4% | View All 11 Rows |
Sex and Age in Spring Mount
Sex and Age in Spring Mount
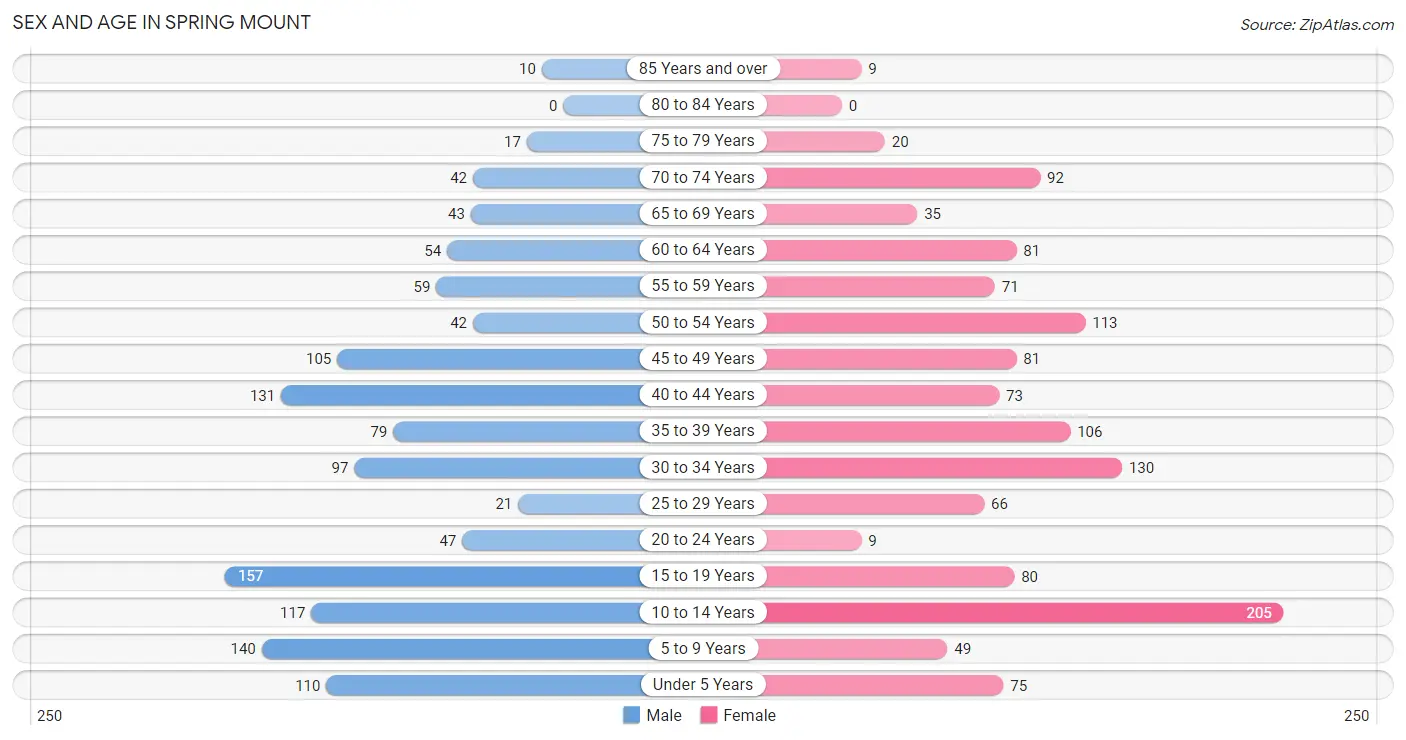
The most populous age groups in Spring Mount are 15 to 19 Years (157 | 12.3%) for men and 10 to 14 Years (205 | 15.8%) for women.
| Age Bracket | Male | Female |
| Under 5 Years | 110 (8.6%) | 75 (5.8%) |
| 5 to 9 Years | 140 (11.0%) | 49 (3.8%) |
| 10 to 14 Years | 117 (9.2%) | 205 (15.8%) |
| 15 to 19 Years | 157 (12.3%) | 80 (6.2%) |
| 20 to 24 Years | 47 (3.7%) | 9 (0.7%) |
| 25 to 29 Years | 21 (1.7%) | 66 (5.1%) |
| 30 to 34 Years | 97 (7.6%) | 130 (10.0%) |
| 35 to 39 Years | 79 (6.2%) | 106 (8.2%) |
| 40 to 44 Years | 131 (10.3%) | 73 (5.6%) |
| 45 to 49 Years | 105 (8.3%) | 81 (6.2%) |
| 50 to 54 Years | 42 (3.3%) | 113 (8.7%) |
| 55 to 59 Years | 59 (4.6%) | 71 (5.5%) |
| 60 to 64 Years | 54 (4.3%) | 81 (6.2%) |
| 65 to 69 Years | 43 (3.4%) | 35 (2.7%) |
| 70 to 74 Years | 42 (3.3%) | 92 (7.1%) |
| 75 to 79 Years | 17 (1.3%) | 20 (1.5%) |
| 80 to 84 Years | 0 (0.0%) | 0 (0.0%) |
| 85 Years and over | 10 (0.8%) | 9 (0.7%) |
| Total | 1,271 (100.0%) | 1,295 (100.0%) |
Families and Households in Spring Mount
Median Family Size in Spring Mount
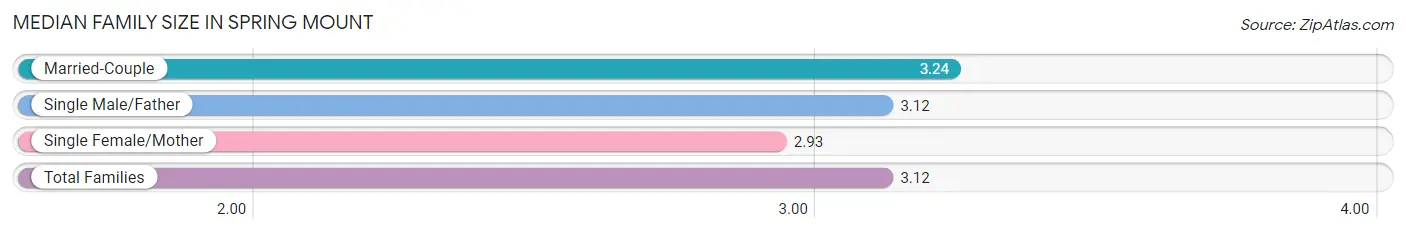
The median family size in Spring Mount is 3.12 persons per family, with married-couple families (372 | 54.4%) accounting for the largest median family size of 3.24 persons per family. On the other hand, single female/mother families (246 | 36.0%) represent the smallest median family size with 2.93 persons per family.
| Family Type | # Families | Family Size |
| Married-Couple | 372 (54.4%) | 3.24 |
| Single Male/Father | 66 (9.7%) | 3.12 |
| Single Female/Mother | 246 (36.0%) | 2.93 |
| Total Families | 684 (100.0%) | 3.12 |
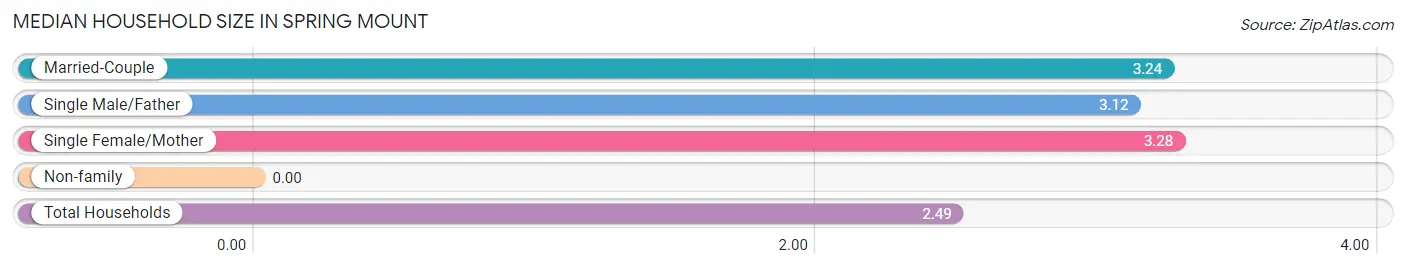
Median Household Size in Spring Mount
| Household Type | # Households | Household Size |
| Married-Couple | 372 (36.2%) | 3.24 |
| Single Male/Father | 66 (6.4%) | 3.12 |
| Single Female/Mother | 246 (23.9%) | 3.28 |
| Non-family | 344 (33.5%) | - |
| Total Households | 1,028 (100.0%) | 2.49 |
Household Size by Marriage Status in Spring Mount
Out of a total of 1,028 households in Spring Mount, 684 (66.5%) are family households, while 344 (33.5%) are nonfamily households. The most numerous type of family households are 3-person households, comprising 254, and the most common type of nonfamily households are 1-person households, comprising 344.
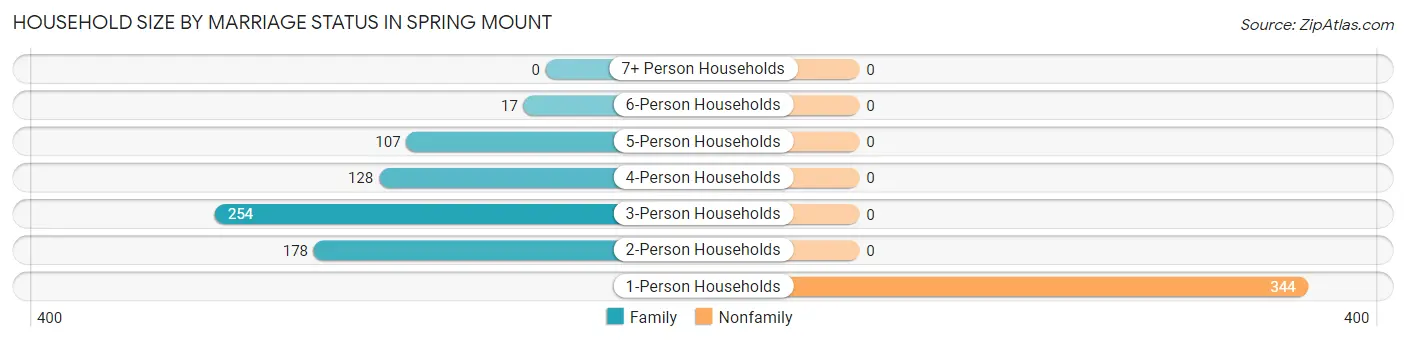
| Household Size | Family Households | Nonfamily Households |
| 1-Person Households | - | 344 (33.5%) |
| 2-Person Households | 178 (17.3%) | 0 (0.0%) |
| 3-Person Households | 254 (24.7%) | 0 (0.0%) |
| 4-Person Households | 128 (12.4%) | 0 (0.0%) |
| 5-Person Households | 107 (10.4%) | 0 (0.0%) |
| 6-Person Households | 17 (1.7%) | 0 (0.0%) |
| 7+ Person Households | 0 (0.0%) | 0 (0.0%) |
| Total | 684 (66.5%) | 344 (33.5%) |
Female Fertility in Spring Mount
Fertility by Age in Spring Mount
Average fertility rate in Spring Mount is 101.0 births per 1,000 women. Women in the age bracket of 20 to 34 years have the highest fertility rate with 273.0 births per 1,000 women. Women in the age bracket of 20 to 34 years acount for 100.0% of all women with births.
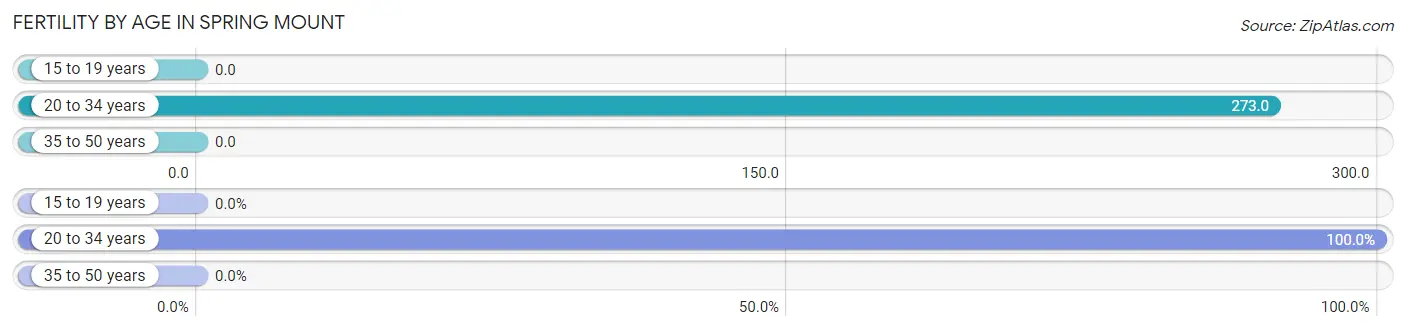
| Age Bracket | Women with Births | Births / 1,000 Women |
| 15 to 19 years | 0 (0.0%) | 0.0 |
| 20 to 34 years | 56 (100.0%) | 273.0 |
| 35 to 50 years | 0 (0.0%) | 0.0 |
| Total | 56 (100.0%) | 101.0 |
Fertility by Age by Marriage Status in Spring Mount
21.4% of women with births (56) in Spring Mount are married. The highest percentage of unmarried women with births falls into 20 to 34 years age bracket with 78.6% of them unmarried at the time of birth, while the lowest percentage of unmarried women with births belong to 20 to 34 years age bracket with 78.6% of them unmarried.
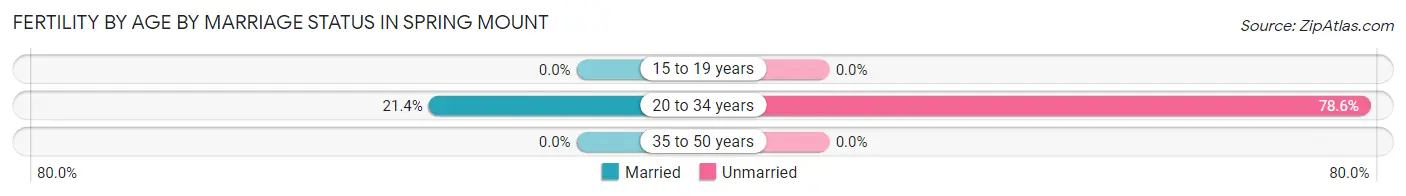
| Age Bracket | Married | Unmarried |
| 15 to 19 years | 0 (0.0%) | 0 (0.0%) |
| 20 to 34 years | 12 (21.4%) | 44 (78.6%) |
| 35 to 50 years | 0 (0.0%) | 0 (0.0%) |
| Total | 12 (21.4%) | 44 (78.6%) |
Fertility by Education in Spring Mount
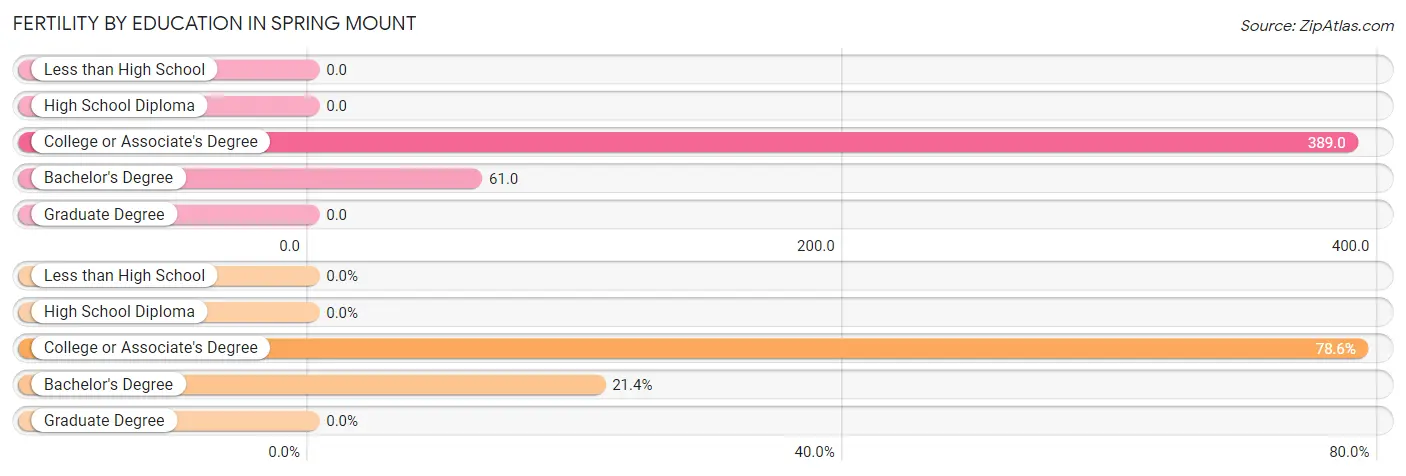
| Educational Attainment | Women with Births | Births / 1,000 Women |
| Less than High School | 0 (0.0%) | 0.0 |
| High School Diploma | 0 (0.0%) | 0.0 |
| College or Associate's Degree | 44 (78.6%) | 389.0 |
| Bachelor's Degree | 12 (21.4%) | 61.0 |
| Graduate Degree | 0 (0.0%) | 0.0 |
| Total | 56 (100.0%) | 101.0 |
Fertility by Education by Marriage Status in Spring Mount
78.6% of women with births in Spring Mount are unmarried. Women with the educational attainment of bachelor's degree are most likely to be married with 100.0% of them married at childbirth, while women with the educational attainment of college or associate's degree are least likely to be married with 100.0% of them unmarried at childbirth.
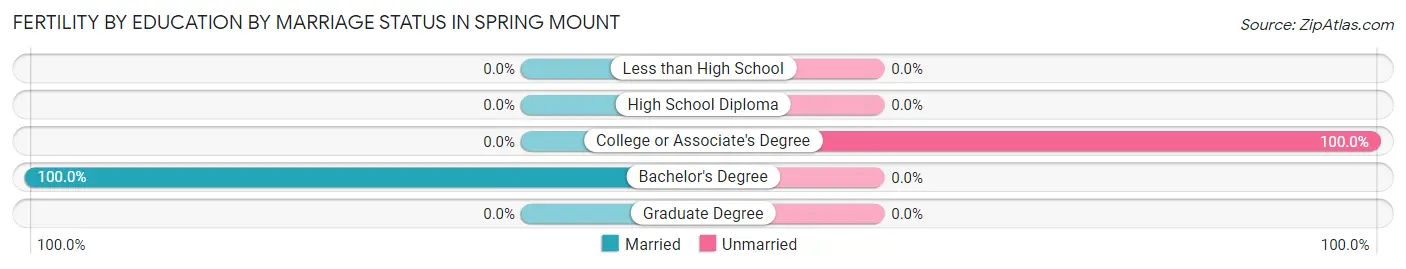
| Educational Attainment | Married | Unmarried |
| Less than High School | 0 (0.0%) | 0 (0.0%) |
| High School Diploma | 0 (0.0%) | 0 (0.0%) |
| College or Associate's Degree | 0 (0.0%) | 44 (100.0%) |
| Bachelor's Degree | 12 (100.0%) | 0 (0.0%) |
| Graduate Degree | 0 (0.0%) | 0 (0.0%) |
| Total | 12 (21.4%) | 44 (78.6%) |
Employment Characteristics in Spring Mount
Employment by Class of Employer in Spring Mount
Among the 1,219 employed individuals in Spring Mount, private company employees (897 | 73.6%), not-for-profit organizations (159 | 13.0%), and local government employees (70 | 5.7%) make up the most common classes of employment.
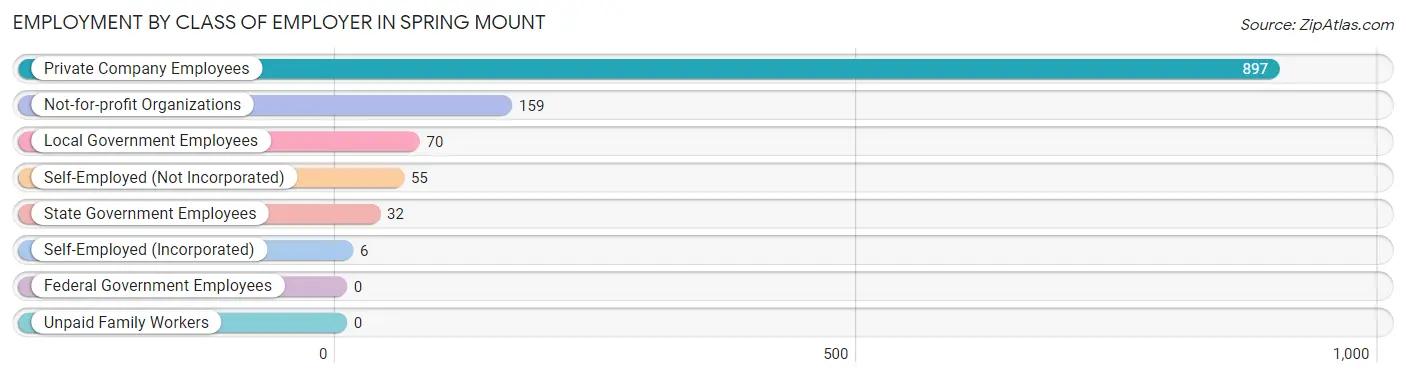
| Employer Class | # Employees | % Employees |
| Private Company Employees | 897 | 73.6% |
| Self-Employed (Incorporated) | 6 | 0.5% |
| Self-Employed (Not Incorporated) | 55 | 4.5% |
| Not-for-profit Organizations | 159 | 13.0% |
| Local Government Employees | 70 | 5.7% |
| State Government Employees | 32 | 2.6% |
| Federal Government Employees | 0 | 0.0% |
| Unpaid Family Workers | 0 | 0.0% |
| Total | 1,219 | 100.0% |
Employment Status by Age in Spring Mount
According to the labor force statistics for Spring Mount, out of the total population over 16 years of age (1,856), 73.6% or 1,366 individuals are in the labor force, with 9.5% or 130 of them unemployed. The age group with the highest labor force participation rate is 35 to 44 years, with 96.9% or 377 individuals in the labor force. Within the labor force, the 30 to 34 years age range has the highest percentage of unemployed individuals, with 21.5% or 45 of them being unemployed.
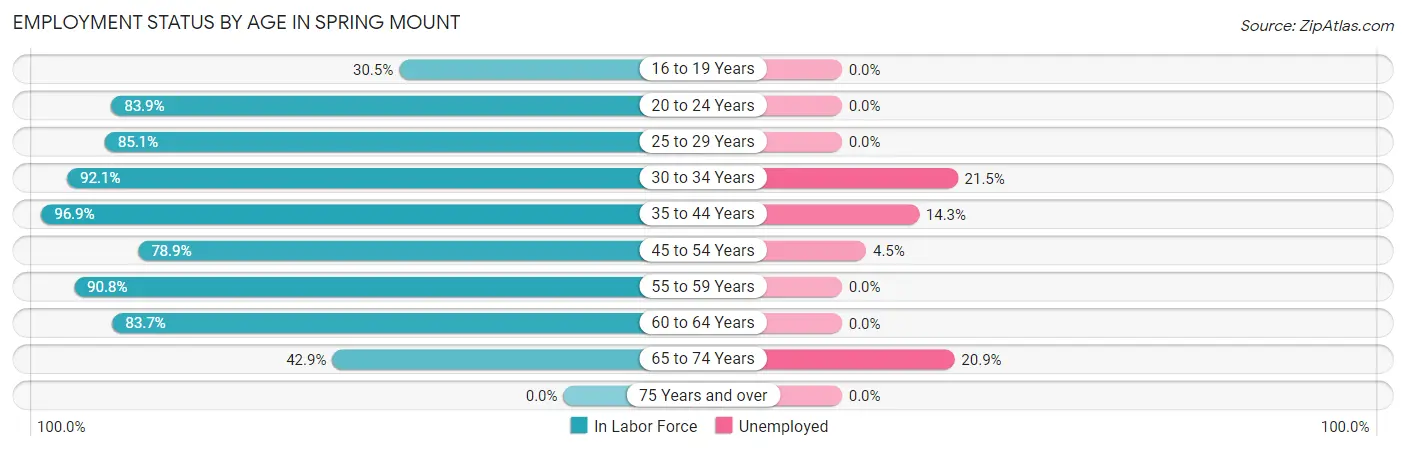
| Age Bracket | In Labor Force | Unemployed |
| 16 to 19 Years | 68 (30.5%) | 0 (0.0%) |
| 20 to 24 Years | 47 (83.9%) | 0 (0.0%) |
| 25 to 29 Years | 74 (85.1%) | 0 (0.0%) |
| 30 to 34 Years | 209 (92.1%) | 45 (21.5%) |
| 35 to 44 Years | 377 (96.9%) | 54 (14.3%) |
| 45 to 54 Years | 269 (78.9%) | 12 (4.5%) |
| 55 to 59 Years | 118 (90.8%) | 0 (0.0%) |
| 60 to 64 Years | 113 (83.7%) | 0 (0.0%) |
| 65 to 74 Years | 91 (42.9%) | 19 (20.9%) |
| 75 Years and over | 0 (0.0%) | 0 (0.0%) |
| Total | 1,366 (73.6%) | 130 (9.5%) |
Employment Status by Educational Attainment in Spring Mount
According to labor force statistics for Spring Mount, 88.6% of individuals (1,160) out of the total population between 25 and 64 years of age (1,309) are in the labor force, with 9.6% or 111 of them being unemployed. The group with the highest labor force participation rate are those with the educational attainment of college / associate degree, with 95.0% or 342 individuals in the labor force. Within the labor force, individuals with college / associate degree education have the highest percentage of unemployment, with 13.2% or 45 of them being unemployed.
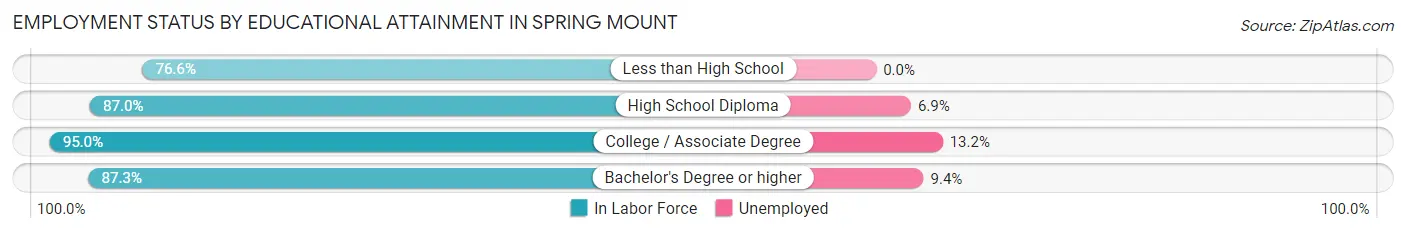
| Educational Attainment | In Labor Force | Unemployed |
| Less than High School | 72 (76.6%) | 0 (0.0%) |
| High School Diploma | 174 (87.0%) | 14 (6.9%) |
| College / Associate Degree | 342 (95.0%) | 48 (13.2%) |
| Bachelor's Degree or higher | 572 (87.3%) | 62 (9.4%) |
| Total | 1,160 (88.6%) | 126 (9.6%) |
Employment Occupations by Sex in Spring Mount
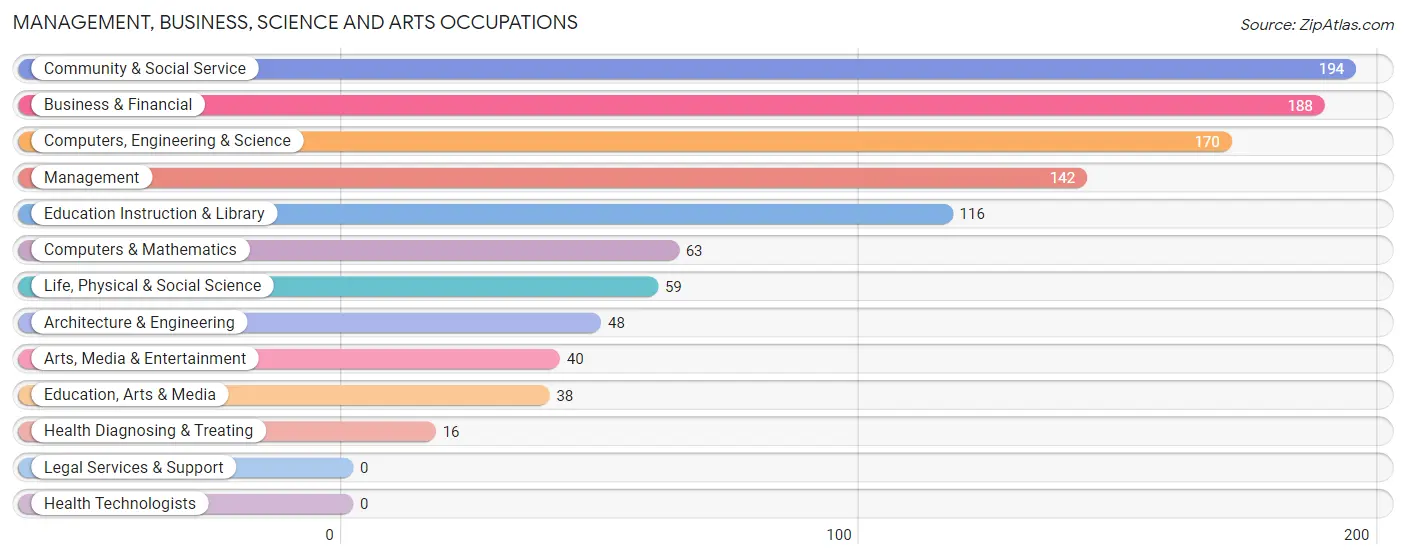
Management, Business, Science and Arts Occupations
The most common Management, Business, Science and Arts occupations in Spring Mount are Community & Social Service (194 | 15.7%), Business & Financial (188 | 15.2%), Computers, Engineering & Science (170 | 13.8%), Management (142 | 11.5%), and Education Instruction & Library (116 | 9.4%).
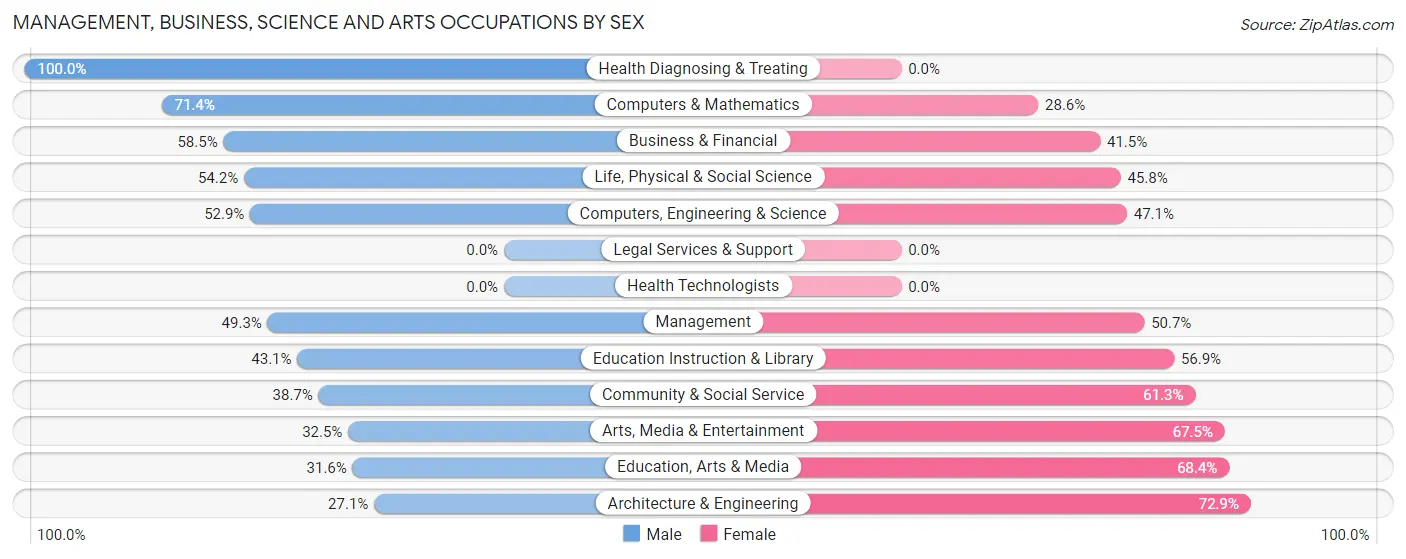
Management, Business, Science and Arts Occupations by Sex
Within the Management, Business, Science and Arts occupations in Spring Mount, the most male-oriented occupations are Health Diagnosing & Treating (100.0%), Computers & Mathematics (71.4%), and Business & Financial (58.5%), while the most female-oriented occupations are Architecture & Engineering (72.9%), Education, Arts & Media (68.4%), and Arts, Media & Entertainment (67.5%).
| Occupation | Male | Female |
| Management | 70 (49.3%) | 72 (50.7%) |
| Business & Financial | 110 (58.5%) | 78 (41.5%) |
| Computers, Engineering & Science | 90 (52.9%) | 80 (47.1%) |
| Computers & Mathematics | 45 (71.4%) | 18 (28.6%) |
| Architecture & Engineering | 13 (27.1%) | 35 (72.9%) |
| Life, Physical & Social Science | 32 (54.2%) | 27 (45.8%) |
| Community & Social Service | 75 (38.7%) | 119 (61.3%) |
| Education, Arts & Media | 12 (31.6%) | 26 (68.4%) |
| Legal Services & Support | 0 (0.0%) | 0 (0.0%) |
| Education Instruction & Library | 50 (43.1%) | 66 (56.9%) |
| Arts, Media & Entertainment | 13 (32.5%) | 27 (67.5%) |
| Health Diagnosing & Treating | 16 (100.0%) | 0 (0.0%) |
| Health Technologists | 0 (0.0%) | 0 (0.0%) |
| Total (Category) | 361 (50.8%) | 349 (49.1%) |
| Total (Overall) | 630 (51.0%) | 606 (49.0%) |
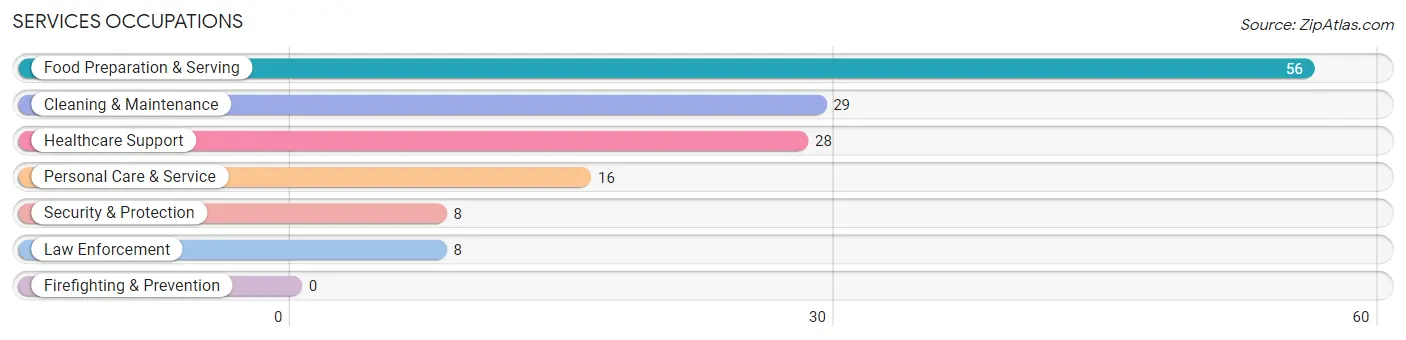
Services Occupations
The most common Services occupations in Spring Mount are Food Preparation & Serving (56 | 4.5%), Cleaning & Maintenance (29 | 2.4%), Healthcare Support (28 | 2.3%), Personal Care & Service (16 | 1.3%), and Security & Protection (8 | 0.6%).
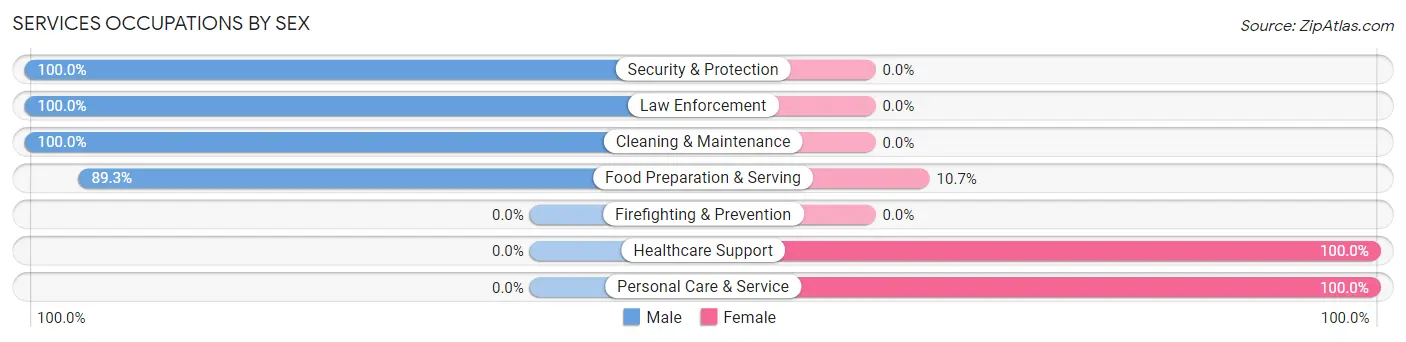
Services Occupations by Sex
Within the Services occupations in Spring Mount, the most male-oriented occupations are Security & Protection (100.0%), Law Enforcement (100.0%), and Cleaning & Maintenance (100.0%), while the most female-oriented occupations are Healthcare Support (100.0%), Personal Care & Service (100.0%), and Food Preparation & Serving (10.7%).
| Occupation | Male | Female |
| Healthcare Support | 0 (0.0%) | 28 (100.0%) |
| Security & Protection | 8 (100.0%) | 0 (0.0%) |
| Firefighting & Prevention | 0 (0.0%) | 0 (0.0%) |
| Law Enforcement | 8 (100.0%) | 0 (0.0%) |
| Food Preparation & Serving | 50 (89.3%) | 6 (10.7%) |
| Cleaning & Maintenance | 29 (100.0%) | 0 (0.0%) |
| Personal Care & Service | 0 (0.0%) | 16 (100.0%) |
| Total (Category) | 87 (63.5%) | 50 (36.5%) |
| Total (Overall) | 630 (51.0%) | 606 (49.0%) |
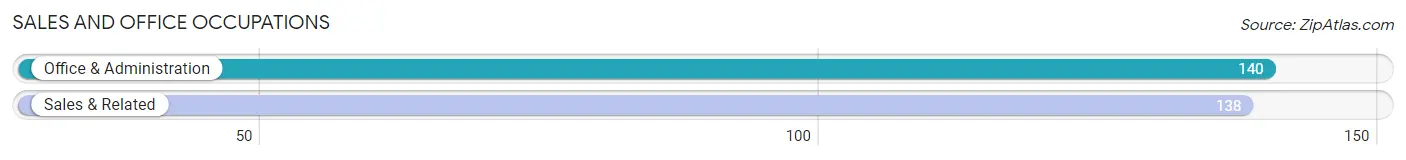
Sales and Office Occupations
The most common Sales and Office occupations in Spring Mount are Office & Administration (140 | 11.3%), and Sales & Related (138 | 11.2%).
Sales and Office Occupations by Sex
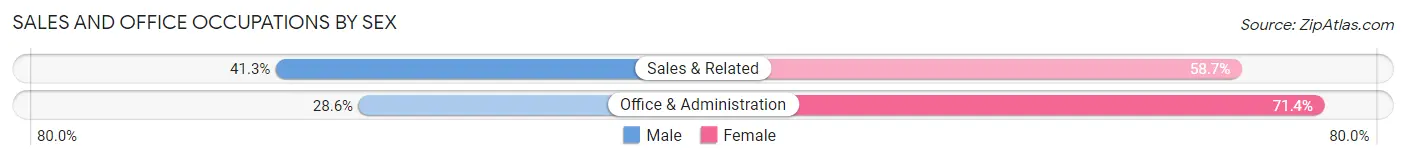
| Occupation | Male | Female |
| Sales & Related | 57 (41.3%) | 81 (58.7%) |
| Office & Administration | 40 (28.6%) | 100 (71.4%) |
| Total (Category) | 97 (34.9%) | 181 (65.1%) |
| Total (Overall) | 630 (51.0%) | 606 (49.0%) |
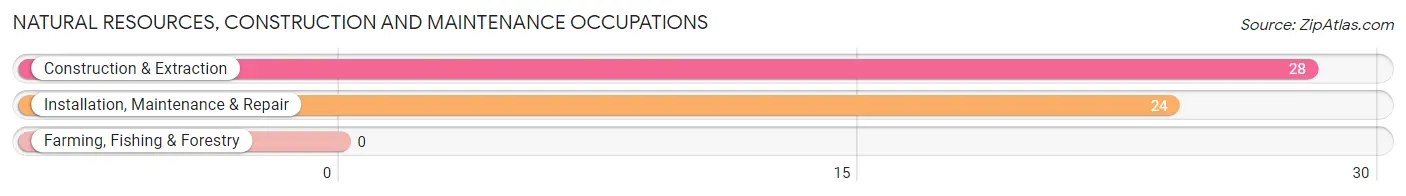
Natural Resources, Construction and Maintenance Occupations
The most common Natural Resources, Construction and Maintenance occupations in Spring Mount are Construction & Extraction (28 | 2.3%), and Installation, Maintenance & Repair (24 | 1.9%).
Natural Resources, Construction and Maintenance Occupations by Sex
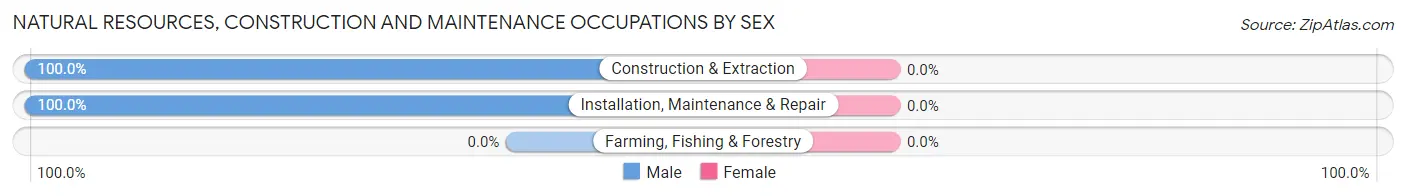
| Occupation | Male | Female |
| Farming, Fishing & Forestry | 0 (0.0%) | 0 (0.0%) |
| Construction & Extraction | 28 (100.0%) | 0 (0.0%) |
| Installation, Maintenance & Repair | 24 (100.0%) | 0 (0.0%) |
| Total (Category) | 52 (100.0%) | 0 (0.0%) |
| Total (Overall) | 630 (51.0%) | 606 (49.0%) |
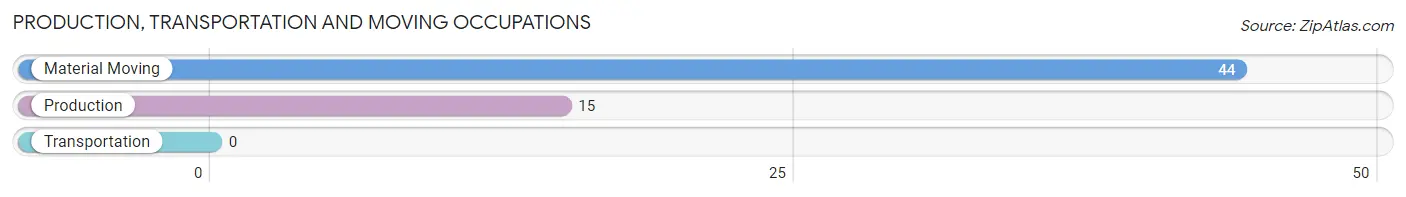
Production, Transportation and Moving Occupations
The most common Production, Transportation and Moving occupations in Spring Mount are Material Moving (44 | 3.6%), and Production (15 | 1.2%).
Production, Transportation and Moving Occupations by Sex
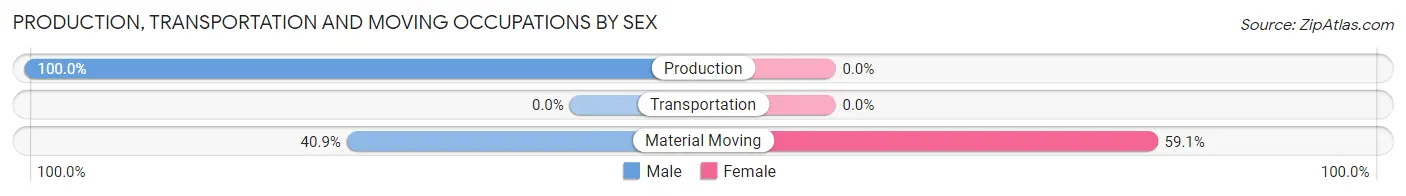
| Occupation | Male | Female |
| Production | 15 (100.0%) | 0 (0.0%) |
| Transportation | 0 (0.0%) | 0 (0.0%) |
| Material Moving | 18 (40.9%) | 26 (59.1%) |
| Total (Category) | 33 (55.9%) | 26 (44.1%) |
| Total (Overall) | 630 (51.0%) | 606 (49.0%) |
Employment Industries by Sex in Spring Mount
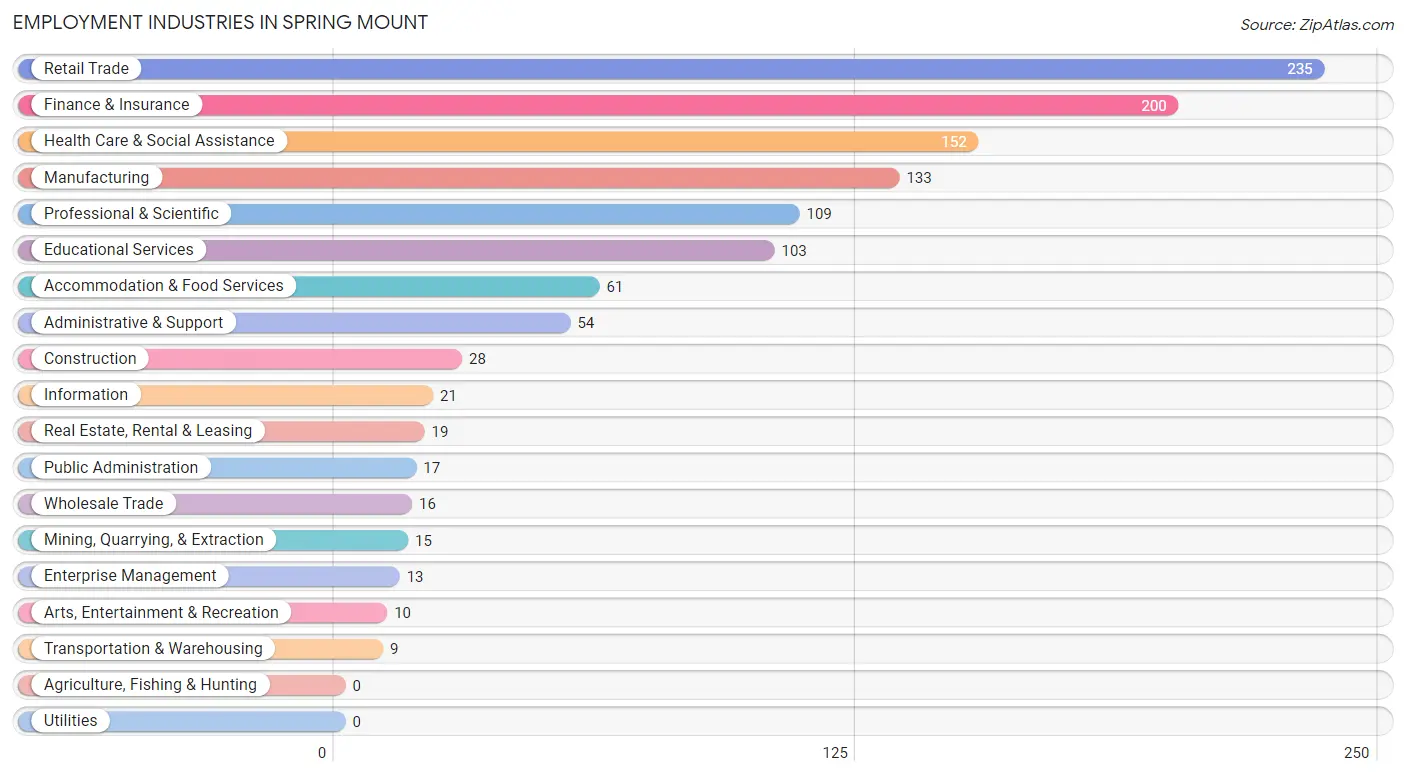
Employment Industries in Spring Mount
The major employment industries in Spring Mount include Retail Trade (235 | 19.0%), Finance & Insurance (200 | 16.2%), Health Care & Social Assistance (152 | 12.3%), Manufacturing (133 | 10.8%), and Professional & Scientific (109 | 8.8%).
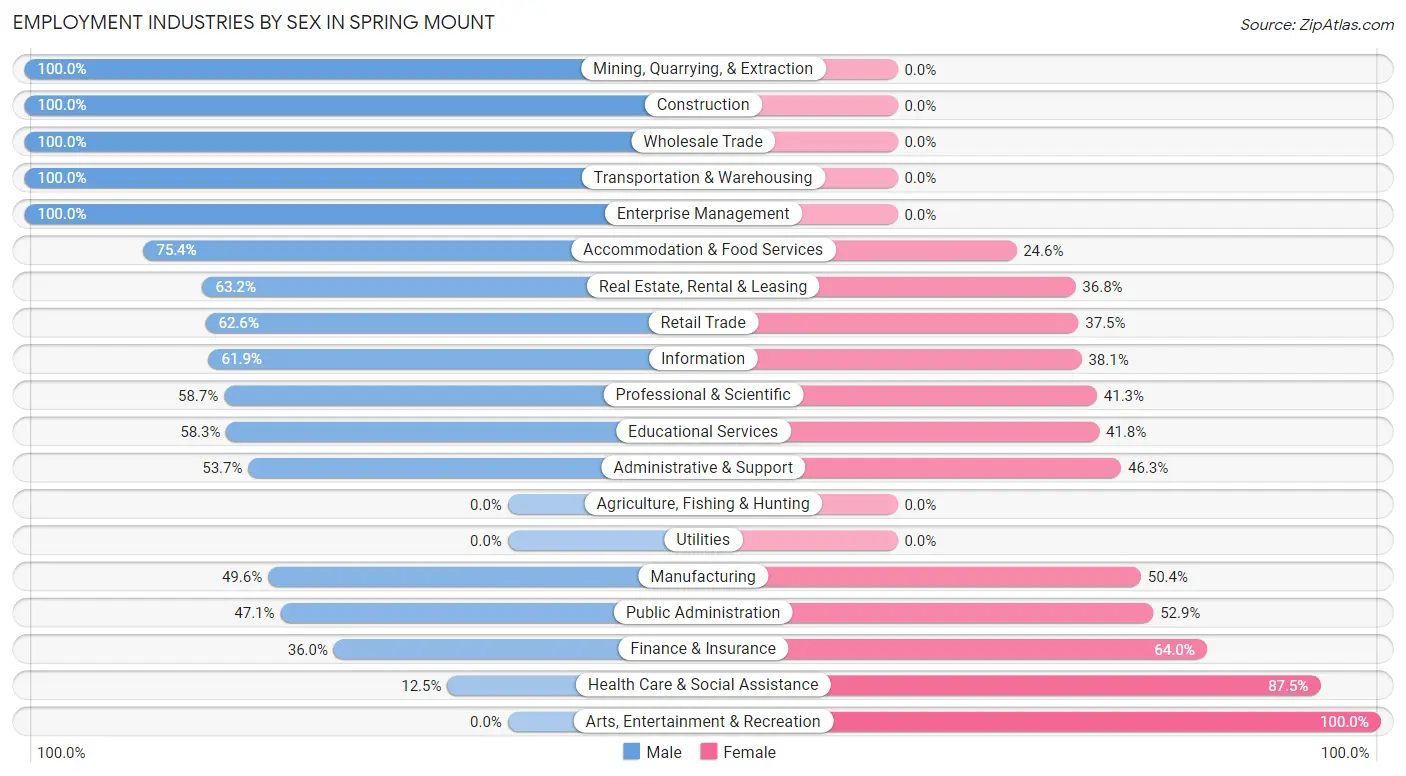
Employment Industries by Sex in Spring Mount
The Spring Mount industries that see more men than women are Mining, Quarrying, & Extraction (100.0%), Construction (100.0%), and Wholesale Trade (100.0%), whereas the industries that tend to have a higher number of women are Arts, Entertainment & Recreation (100.0%), Health Care & Social Assistance (87.5%), and Finance & Insurance (64.0%).
| Industry | Male | Female |
| Agriculture, Fishing & Hunting | 0 (0.0%) | 0 (0.0%) |
| Mining, Quarrying, & Extraction | 15 (100.0%) | 0 (0.0%) |
| Construction | 28 (100.0%) | 0 (0.0%) |
| Manufacturing | 66 (49.6%) | 67 (50.4%) |
| Wholesale Trade | 16 (100.0%) | 0 (0.0%) |
| Retail Trade | 147 (62.5%) | 88 (37.4%) |
| Transportation & Warehousing | 9 (100.0%) | 0 (0.0%) |
| Utilities | 0 (0.0%) | 0 (0.0%) |
| Information | 13 (61.9%) | 8 (38.1%) |
| Finance & Insurance | 72 (36.0%) | 128 (64.0%) |
| Real Estate, Rental & Leasing | 12 (63.2%) | 7 (36.8%) |
| Professional & Scientific | 64 (58.7%) | 45 (41.3%) |
| Enterprise Management | 13 (100.0%) | 0 (0.0%) |
| Administrative & Support | 29 (53.7%) | 25 (46.3%) |
| Educational Services | 60 (58.3%) | 43 (41.7%) |
| Health Care & Social Assistance | 19 (12.5%) | 133 (87.5%) |
| Arts, Entertainment & Recreation | 0 (0.0%) | 10 (100.0%) |
| Accommodation & Food Services | 46 (75.4%) | 15 (24.6%) |
| Public Administration | 8 (47.1%) | 9 (52.9%) |
| Total | 630 (51.0%) | 606 (49.0%) |
Education in Spring Mount
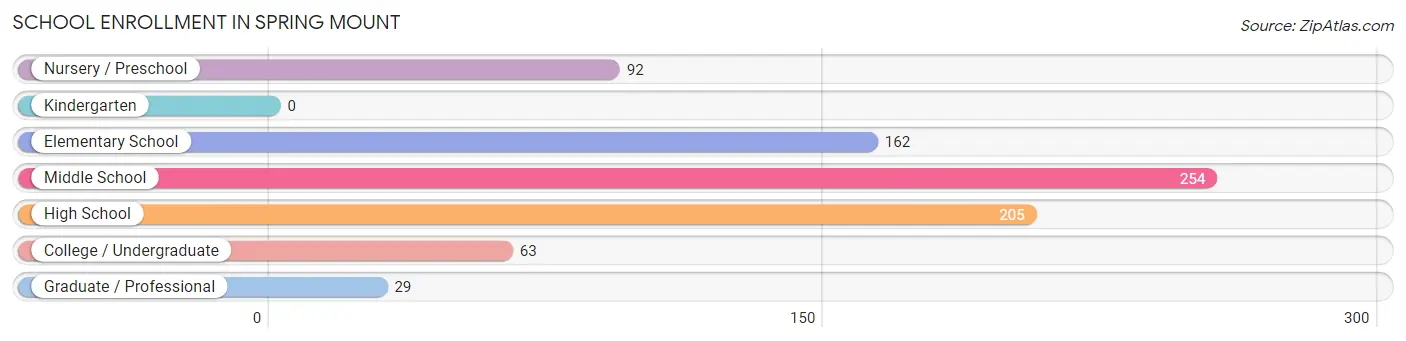
School Enrollment in Spring Mount
The most common levels of schooling among the 805 students in Spring Mount are middle school (254 | 31.6%), high school (205 | 25.5%), and elementary school (162 | 20.1%).
| School Level | # Students | % Students |
| Nursery / Preschool | 92 | 11.4% |
| Kindergarten | 0 | 0.0% |
| Elementary School | 162 | 20.1% |
| Middle School | 254 | 31.6% |
| High School | 205 | 25.5% |
| College / Undergraduate | 63 | 7.8% |
| Graduate / Professional | 29 | 3.6% |
| Total | 805 | 100.0% |
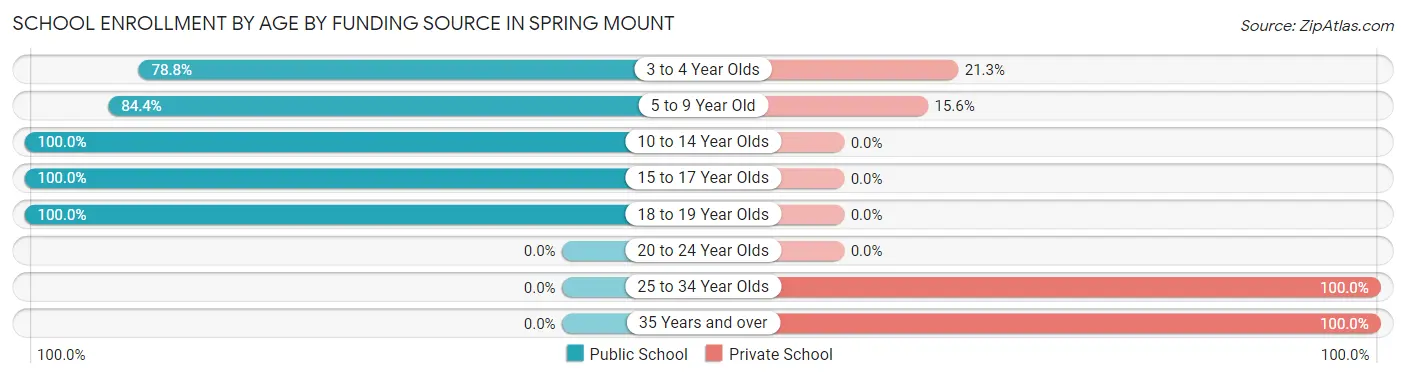
School Enrollment by Age by Funding Source in Spring Mount
Out of a total of 805 students who are enrolled in schools in Spring Mount, 83 (10.3%) attend a private institution, while the remaining 722 (89.7%) are enrolled in public schools. The age group of 25 to 34 year olds has the highest likelihood of being enrolled in private schools, with 15 (100.0% in the age bracket) enrolled. Conversely, the age group of 10 to 14 year olds has the lowest likelihood of being enrolled in a private school, with 287 (100.0% in the age bracket) attending a public institution.
| Age Bracket | Public School | Private School |
| 3 to 4 Year Olds | 63 (78.7%) | 17 (21.2%) |
| 5 to 9 Year Old | 135 (84.4%) | 25 (15.6%) |
| 10 to 14 Year Olds | 287 (100.0%) | 0 (0.0%) |
| 15 to 17 Year Olds | 136 (100.0%) | 0 (0.0%) |
| 18 to 19 Year Olds | 101 (100.0%) | 0 (0.0%) |
| 20 to 24 Year Olds | 0 (0.0%) | 0 (0.0%) |
| 25 to 34 Year Olds | 0 (0.0%) | 15 (100.0%) |
| 35 Years and over | 0 (0.0%) | 26 (100.0%) |
| Total | 722 (89.7%) | 83 (10.3%) |
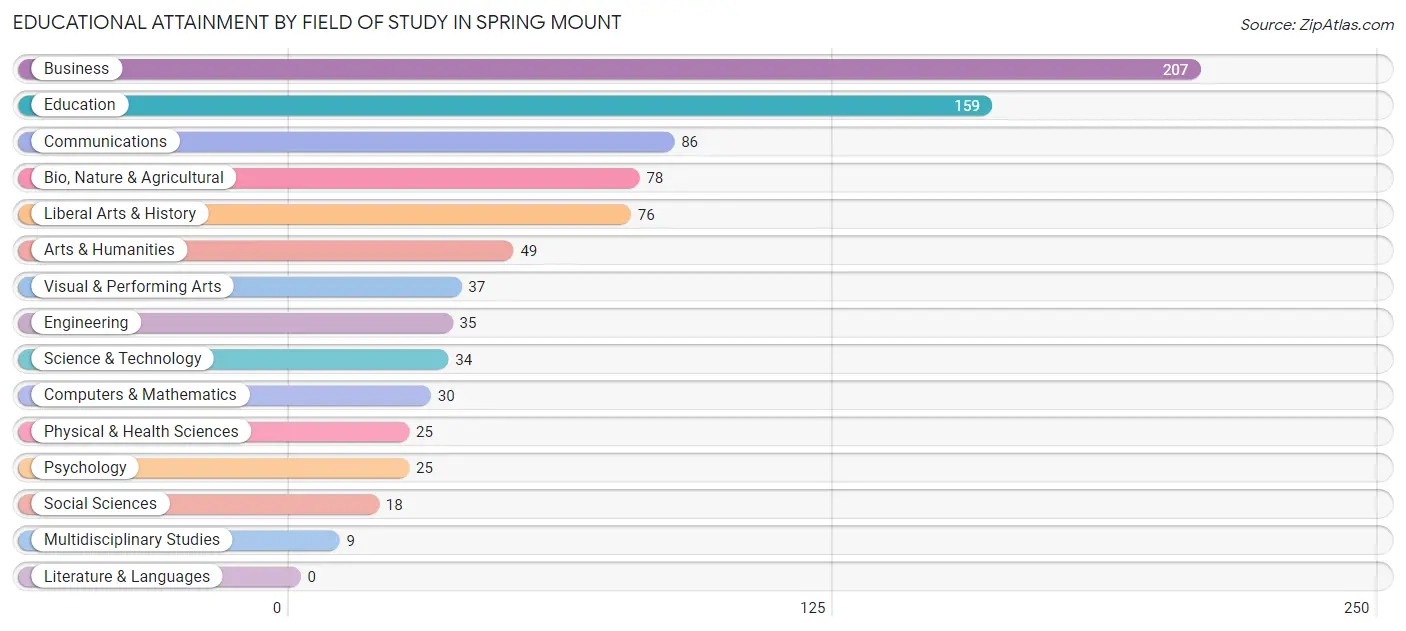
Educational Attainment by Field of Study in Spring Mount
Business (207 | 23.8%), education (159 | 18.3%), communications (86 | 9.9%), bio, nature & agricultural (78 | 9.0%), and liberal arts & history (76 | 8.8%) are the most common fields of study among 868 individuals in Spring Mount who have obtained a bachelor's degree or higher.
| Field of Study | # Graduates | % Graduates |
| Computers & Mathematics | 30 | 3.5% |
| Bio, Nature & Agricultural | 78 | 9.0% |
| Physical & Health Sciences | 25 | 2.9% |
| Psychology | 25 | 2.9% |
| Social Sciences | 18 | 2.1% |
| Engineering | 35 | 4.0% |
| Multidisciplinary Studies | 9 | 1.0% |
| Science & Technology | 34 | 3.9% |
| Business | 207 | 23.8% |
| Education | 159 | 18.3% |
| Literature & Languages | 0 | 0.0% |
| Liberal Arts & History | 76 | 8.8% |
| Visual & Performing Arts | 37 | 4.3% |
| Communications | 86 | 9.9% |
| Arts & Humanities | 49 | 5.7% |
| Total | 868 | 100.0% |
Transportation & Commute in Spring Mount
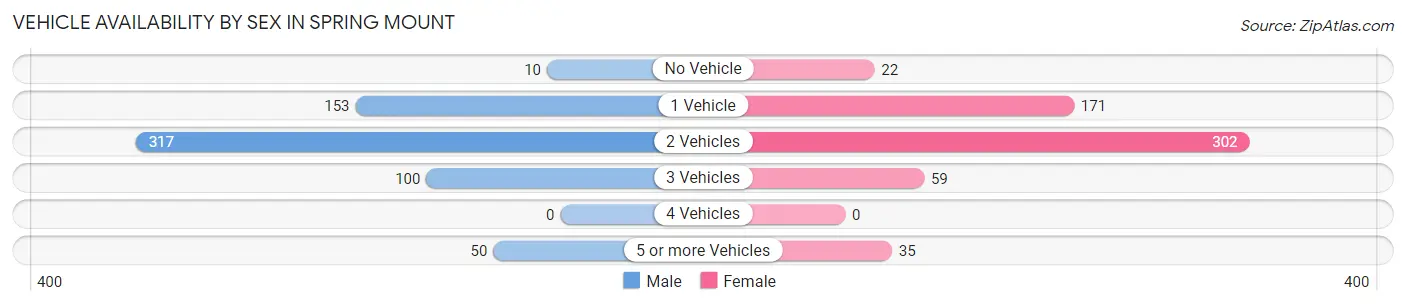
Vehicle Availability by Sex in Spring Mount
The most prevalent vehicle ownership categories in Spring Mount are males with 2 vehicles (317, accounting for 50.3%) and females with 2 vehicles (302, making up 53.8%).
| Vehicles Available | Male | Female |
| No Vehicle | 10 (1.6%) | 22 (3.7%) |
| 1 Vehicle | 153 (24.3%) | 171 (29.0%) |
| 2 Vehicles | 317 (50.3%) | 302 (51.3%) |
| 3 Vehicles | 100 (15.9%) | 59 (10.0%) |
| 4 Vehicles | 0 (0.0%) | 0 (0.0%) |
| 5 or more Vehicles | 50 (7.9%) | 35 (5.9%) |
| Total | 630 (100.0%) | 589 (100.0%) |
Commute Time in Spring Mount
The most frequently occuring commute durations in Spring Mount are 15 to 19 minutes (213 commuters, 19.5%), 45 to 59 minutes (156 commuters, 14.3%), and 30 to 34 minutes (117 commuters, 10.7%).
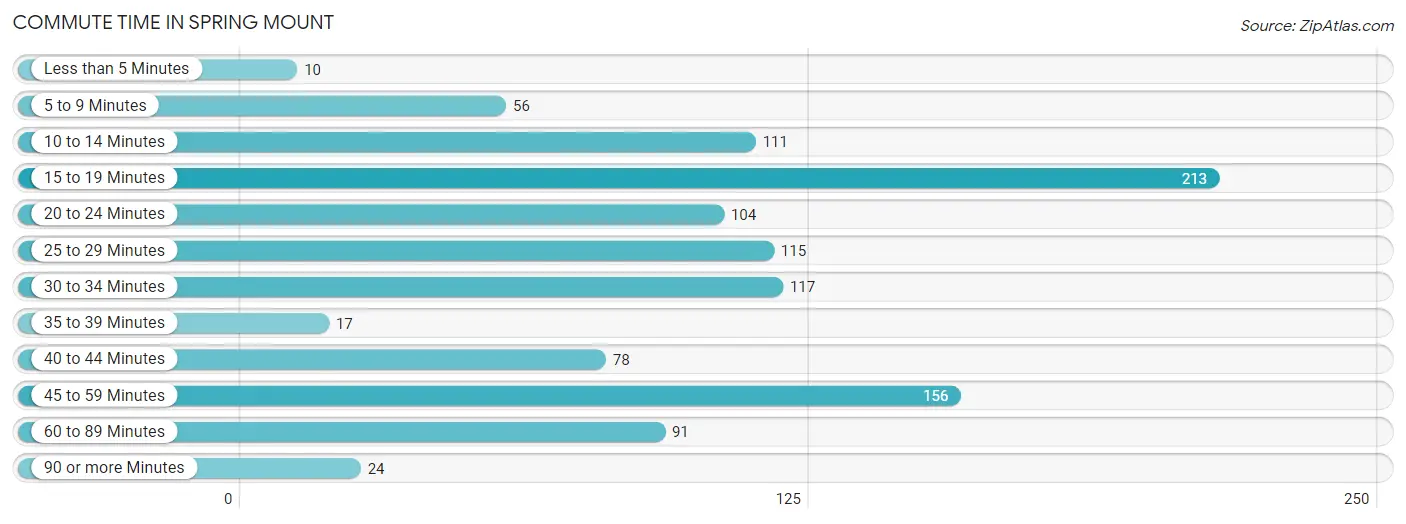
| Commute Time | # Commuters | % Commuters |
| Less than 5 Minutes | 10 | 0.9% |
| 5 to 9 Minutes | 56 | 5.1% |
| 10 to 14 Minutes | 111 | 10.2% |
| 15 to 19 Minutes | 213 | 19.5% |
| 20 to 24 Minutes | 104 | 9.5% |
| 25 to 29 Minutes | 115 | 10.5% |
| 30 to 34 Minutes | 117 | 10.7% |
| 35 to 39 Minutes | 17 | 1.6% |
| 40 to 44 Minutes | 78 | 7.1% |
| 45 to 59 Minutes | 156 | 14.3% |
| 60 to 89 Minutes | 91 | 8.3% |
| 90 or more Minutes | 24 | 2.2% |
Commute Time by Sex in Spring Mount
The most common commute times in Spring Mount are 45 to 59 minutes (108 commuters, 19.7%) for males and 15 to 19 minutes (124 commuters, 22.8%) for females.
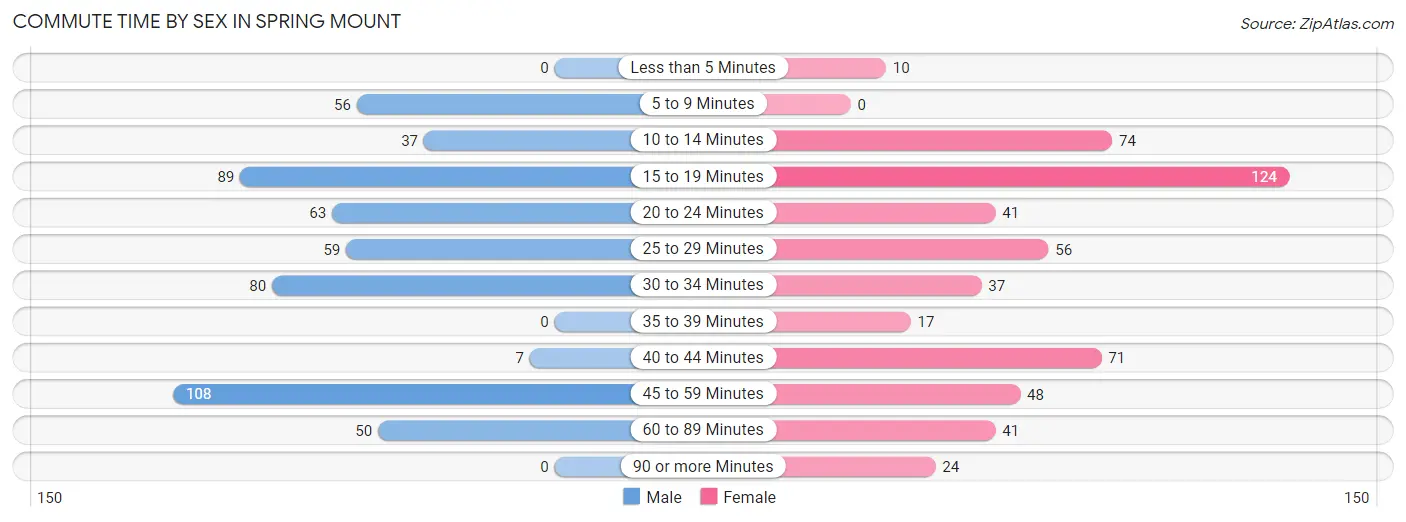
| Commute Time | Male | Female |
| Less than 5 Minutes | 0 (0.0%) | 10 (1.8%) |
| 5 to 9 Minutes | 56 (10.2%) | 0 (0.0%) |
| 10 to 14 Minutes | 37 (6.7%) | 74 (13.6%) |
| 15 to 19 Minutes | 89 (16.2%) | 124 (22.8%) |
| 20 to 24 Minutes | 63 (11.5%) | 41 (7.5%) |
| 25 to 29 Minutes | 59 (10.7%) | 56 (10.3%) |
| 30 to 34 Minutes | 80 (14.6%) | 37 (6.8%) |
| 35 to 39 Minutes | 0 (0.0%) | 17 (3.1%) |
| 40 to 44 Minutes | 7 (1.3%) | 71 (13.1%) |
| 45 to 59 Minutes | 108 (19.7%) | 48 (8.8%) |
| 60 to 89 Minutes | 50 (9.1%) | 41 (7.5%) |
| 90 or more Minutes | 0 (0.0%) | 24 (4.4%) |
Time of Departure to Work by Sex in Spring Mount
The most frequent times of departure to work in Spring Mount are 7:00 AM to 7:29 AM (85, 15.5%) for males and 8:00 AM to 8:29 AM (128, 23.6%) for females.
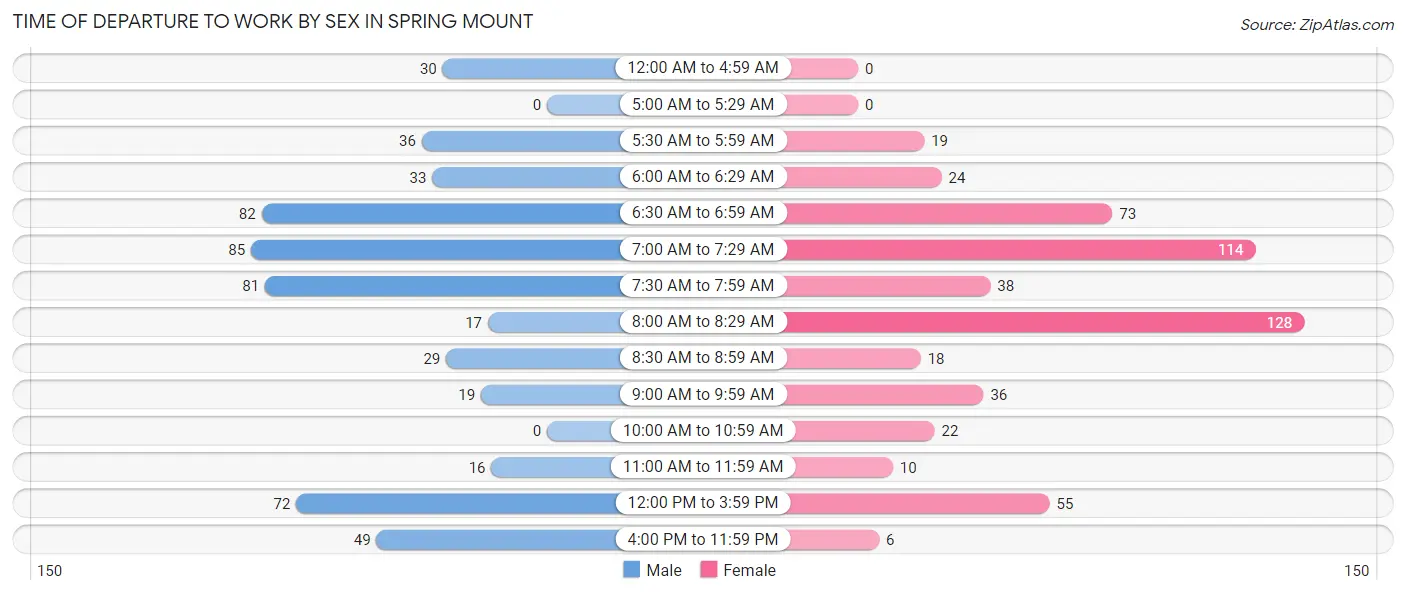
| Time of Departure | Male | Female |
| 12:00 AM to 4:59 AM | 30 (5.5%) | 0 (0.0%) |
| 5:00 AM to 5:29 AM | 0 (0.0%) | 0 (0.0%) |
| 5:30 AM to 5:59 AM | 36 (6.6%) | 19 (3.5%) |
| 6:00 AM to 6:29 AM | 33 (6.0%) | 24 (4.4%) |
| 6:30 AM to 6:59 AM | 82 (14.9%) | 73 (13.4%) |
| 7:00 AM to 7:29 AM | 85 (15.5%) | 114 (21.0%) |
| 7:30 AM to 7:59 AM | 81 (14.7%) | 38 (7.0%) |
| 8:00 AM to 8:29 AM | 17 (3.1%) | 128 (23.6%) |
| 8:30 AM to 8:59 AM | 29 (5.3%) | 18 (3.3%) |
| 9:00 AM to 9:59 AM | 19 (3.5%) | 36 (6.6%) |
| 10:00 AM to 10:59 AM | 0 (0.0%) | 22 (4.1%) |
| 11:00 AM to 11:59 AM | 16 (2.9%) | 10 (1.8%) |
| 12:00 PM to 3:59 PM | 72 (13.1%) | 55 (10.1%) |
| 4:00 PM to 11:59 PM | 49 (8.9%) | 6 (1.1%) |
| Total | 549 (100.0%) | 543 (100.0%) |
Housing Occupancy in Spring Mount
Occupancy by Ownership in Spring Mount
Of the total 1,028 dwellings in Spring Mount, owner-occupied units account for 801 (77.9%), while renter-occupied units make up 227 (22.1%).
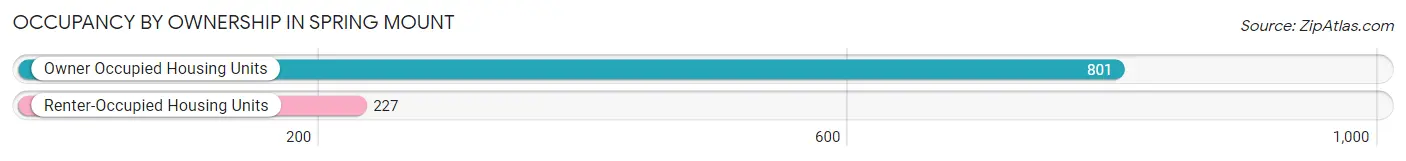
| Occupancy | # Housing Units | % Housing Units |
| Owner Occupied Housing Units | 801 | 77.9% |
| Renter-Occupied Housing Units | 227 | 22.1% |
| Total Occupied Housing Units | 1,028 | 100.0% |
Occupancy by Household Size in Spring Mount
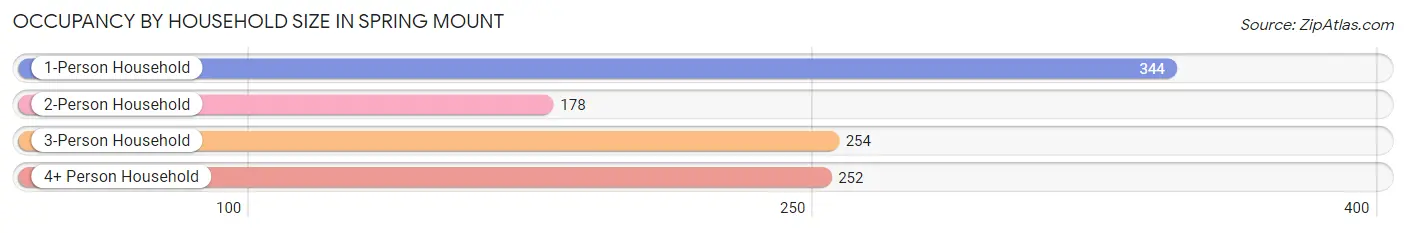
| Household Size | # Housing Units | % Housing Units |
| 1-Person Household | 344 | 33.5% |
| 2-Person Household | 178 | 17.3% |
| 3-Person Household | 254 | 24.7% |
| 4+ Person Household | 252 | 24.5% |
| Total Housing Units | 1,028 | 100.0% |
Occupancy by Ownership by Household Size in Spring Mount
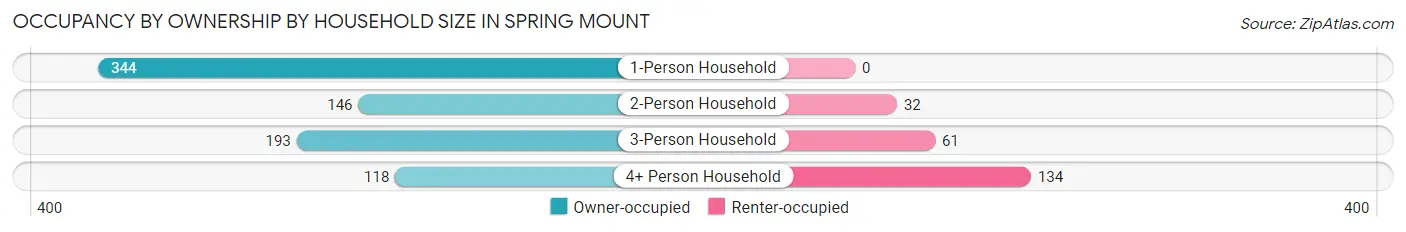
| Household Size | Owner-occupied | Renter-occupied |
| 1-Person Household | 344 (100.0%) | 0 (0.0%) |
| 2-Person Household | 146 (82.0%) | 32 (18.0%) |
| 3-Person Household | 193 (76.0%) | 61 (24.0%) |
| 4+ Person Household | 118 (46.8%) | 134 (53.2%) |
| Total Housing Units | 801 (77.9%) | 227 (22.1%) |
Occupancy by Educational Attainment in Spring Mount
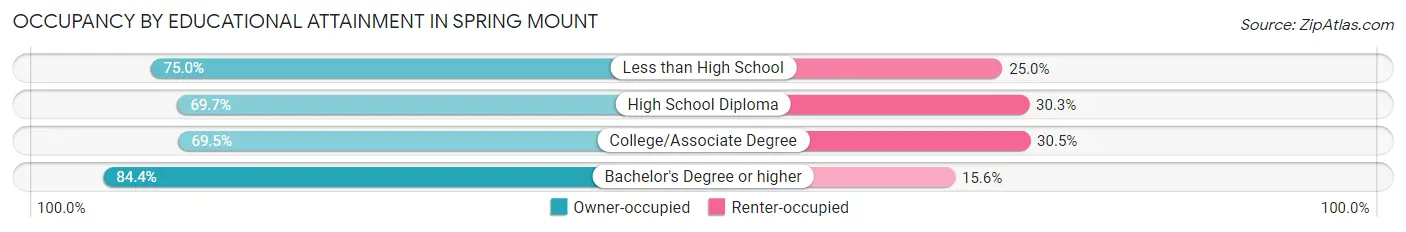
| Household Size | Owner-occupied | Renter-occupied |
| Less than High School | 36 (75.0%) | 12 (25.0%) |
| High School Diploma | 108 (69.7%) | 47 (30.3%) |
| College/Associate Degree | 182 (69.5%) | 80 (30.5%) |
| Bachelor's Degree or higher | 475 (84.4%) | 88 (15.6%) |
Occupancy by Age of Householder in Spring Mount
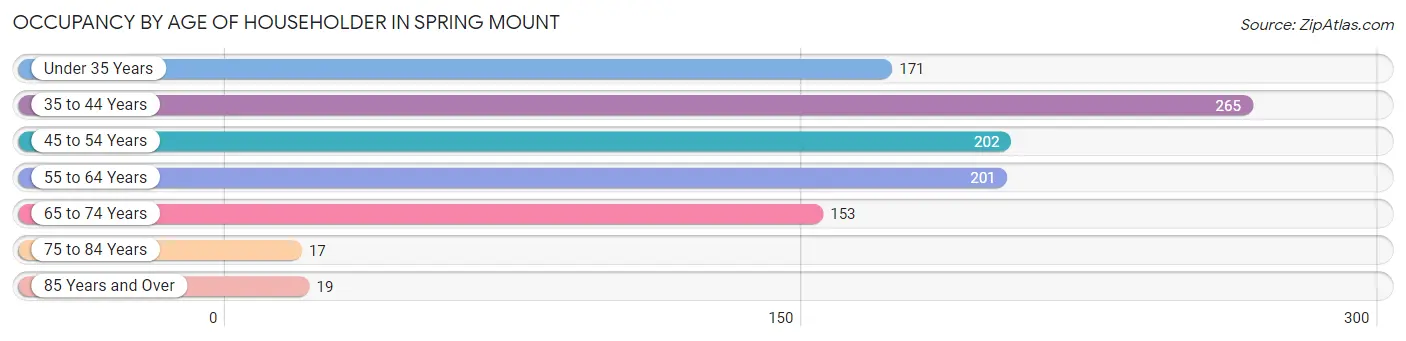
| Age Bracket | # Households | % Households |
| Under 35 Years | 171 | 16.6% |
| 35 to 44 Years | 265 | 25.8% |
| 45 to 54 Years | 202 | 19.7% |
| 55 to 64 Years | 201 | 19.6% |
| 65 to 74 Years | 153 | 14.9% |
| 75 to 84 Years | 17 | 1.7% |
| 85 Years and Over | 19 | 1.8% |
| Total | 1,028 | 100.0% |
Housing Finances in Spring Mount
Median Income by Occupancy in Spring Mount
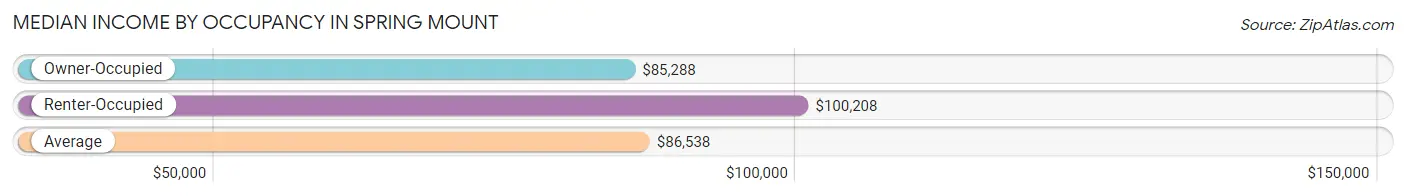
| Occupancy Type | # Households | Median Income |
| Owner-Occupied | 801 (77.9%) | $85,288 |
| Renter-Occupied | 227 (22.1%) | $100,208 |
| Average | 1,028 (100.0%) | $86,538 |
Occupancy by Householder Income Bracket in Spring Mount
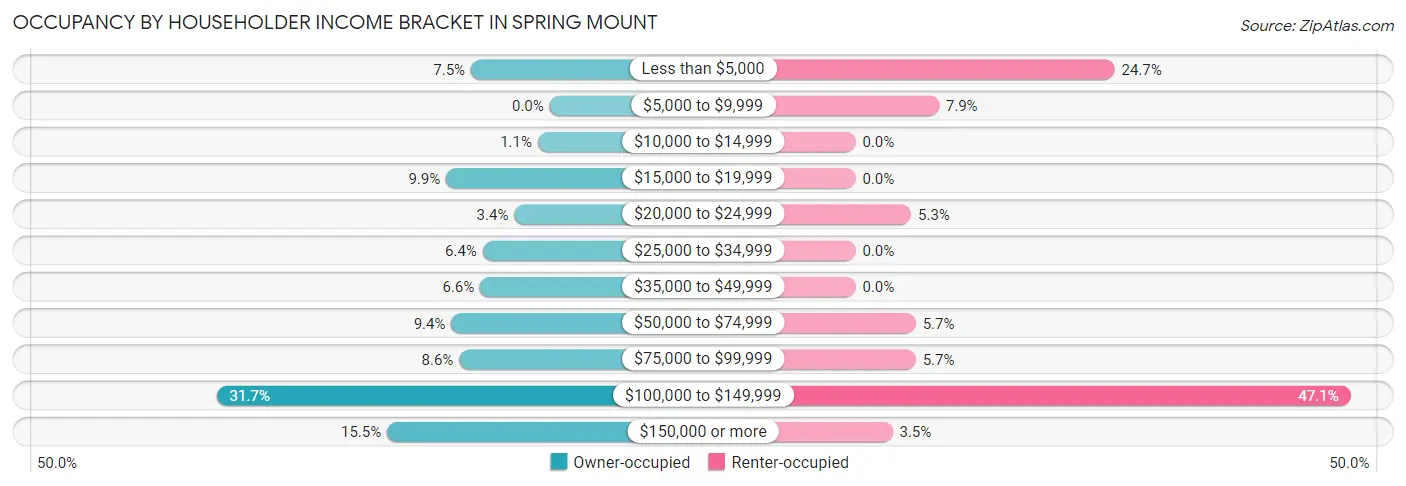
| Income Bracket | Owner-occupied | Renter-occupied |
| Less than $5,000 | 60 (7.5%) | 56 (24.7%) |
| $5,000 to $9,999 | 0 (0.0%) | 18 (7.9%) |
| $10,000 to $14,999 | 9 (1.1%) | 0 (0.0%) |
| $15,000 to $19,999 | 79 (9.9%) | 0 (0.0%) |
| $20,000 to $24,999 | 27 (3.4%) | 12 (5.3%) |
| $25,000 to $34,999 | 51 (6.4%) | 0 (0.0%) |
| $35,000 to $49,999 | 53 (6.6%) | 0 (0.0%) |
| $50,000 to $74,999 | 75 (9.4%) | 13 (5.7%) |
| $75,000 to $99,999 | 69 (8.6%) | 13 (5.7%) |
| $100,000 to $149,999 | 254 (31.7%) | 107 (47.1%) |
| $150,000 or more | 124 (15.5%) | 8 (3.5%) |
| Total | 801 (100.0%) | 227 (100.0%) |
Monthly Housing Cost Tiers in Spring Mount
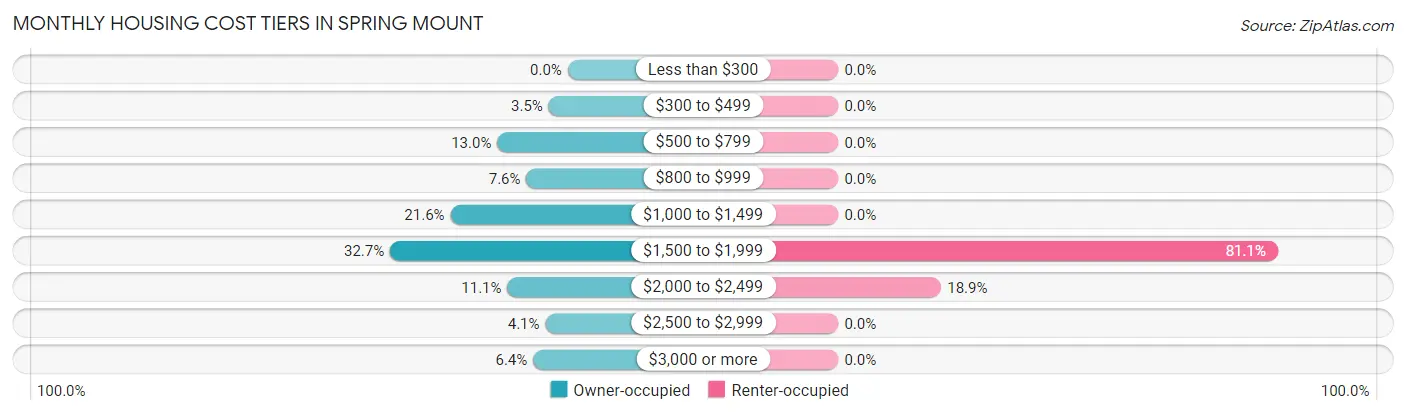
| Monthly Cost | Owner-occupied | Renter-occupied |
| Less than $300 | 0 (0.0%) | 0 (0.0%) |
| $300 to $499 | 28 (3.5%) | 0 (0.0%) |
| $500 to $799 | 104 (13.0%) | 0 (0.0%) |
| $800 to $999 | 61 (7.6%) | 0 (0.0%) |
| $1,000 to $1,499 | 173 (21.6%) | 0 (0.0%) |
| $1,500 to $1,999 | 262 (32.7%) | 184 (81.1%) |
| $2,000 to $2,499 | 89 (11.1%) | 43 (18.9%) |
| $2,500 to $2,999 | 33 (4.1%) | 0 (0.0%) |
| $3,000 or more | 51 (6.4%) | 0 (0.0%) |
| Total | 801 (100.0%) | 227 (100.0%) |
Physical Housing Characteristics in Spring Mount
Housing Structures in Spring Mount
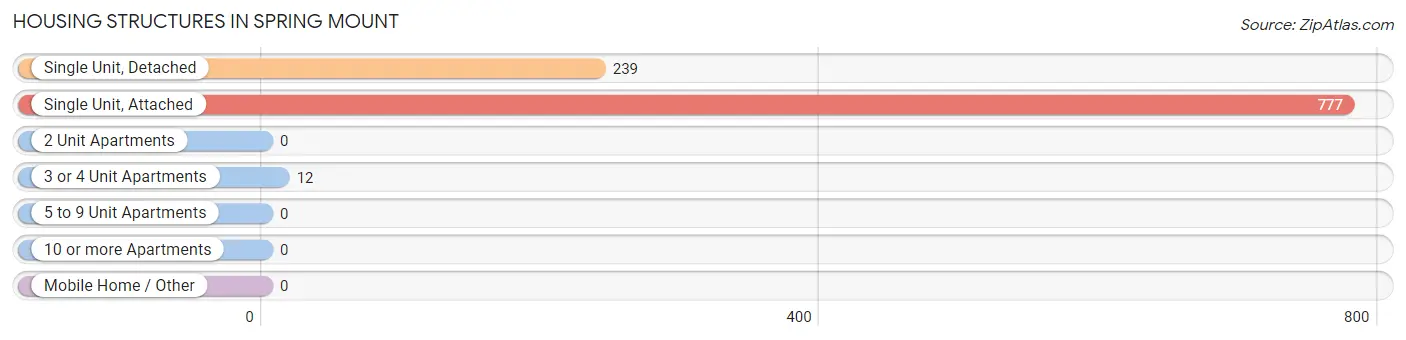
| Structure Type | # Housing Units | % Housing Units |
| Single Unit, Detached | 239 | 23.3% |
| Single Unit, Attached | 777 | 75.6% |
| 2 Unit Apartments | 0 | 0.0% |
| 3 or 4 Unit Apartments | 12 | 1.2% |
| 5 to 9 Unit Apartments | 0 | 0.0% |
| 10 or more Apartments | 0 | 0.0% |
| Mobile Home / Other | 0 | 0.0% |
| Total | 1,028 | 100.0% |
Housing Structures by Occupancy in Spring Mount
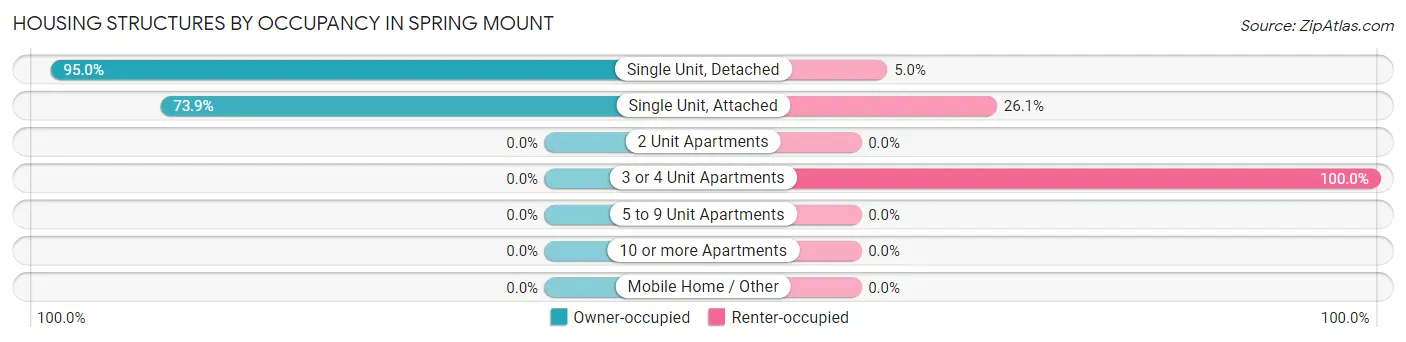
| Structure Type | Owner-occupied | Renter-occupied |
| Single Unit, Detached | 227 (95.0%) | 12 (5.0%) |
| Single Unit, Attached | 574 (73.9%) | 203 (26.1%) |
| 2 Unit Apartments | 0 (0.0%) | 0 (0.0%) |
| 3 or 4 Unit Apartments | 0 (0.0%) | 12 (100.0%) |
| 5 to 9 Unit Apartments | 0 (0.0%) | 0 (0.0%) |
| 10 or more Apartments | 0 (0.0%) | 0 (0.0%) |
| Mobile Home / Other | 0 (0.0%) | 0 (0.0%) |
| Total | 801 (77.9%) | 227 (22.1%) |
Housing Structures by Number of Rooms in Spring Mount
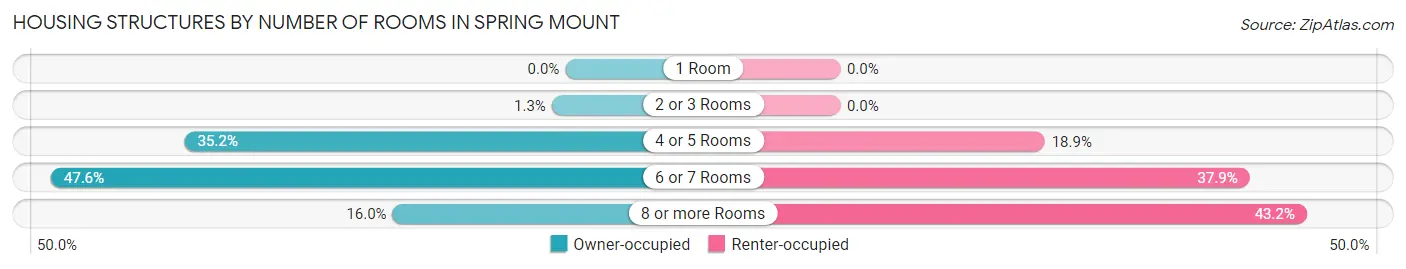
| Number of Rooms | Owner-occupied | Renter-occupied |
| 1 Room | 0 (0.0%) | 0 (0.0%) |
| 2 or 3 Rooms | 10 (1.3%) | 0 (0.0%) |
| 4 or 5 Rooms | 282 (35.2%) | 43 (18.9%) |
| 6 or 7 Rooms | 381 (47.6%) | 86 (37.9%) |
| 8 or more Rooms | 128 (16.0%) | 98 (43.2%) |
| Total | 801 (100.0%) | 227 (100.0%) |
Housing Structure by Heating Type in Spring Mount
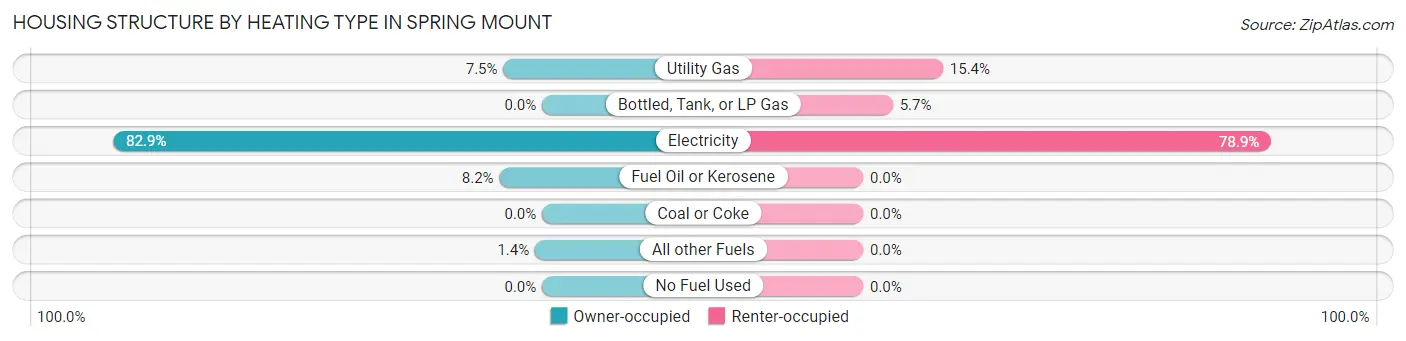
| Heating Type | Owner-occupied | Renter-occupied |
| Utility Gas | 60 (7.5%) | 35 (15.4%) |
| Bottled, Tank, or LP Gas | 0 (0.0%) | 13 (5.7%) |
| Electricity | 664 (82.9%) | 179 (78.8%) |
| Fuel Oil or Kerosene | 66 (8.2%) | 0 (0.0%) |
| Coal or Coke | 0 (0.0%) | 0 (0.0%) |
| All other Fuels | 11 (1.4%) | 0 (0.0%) |
| No Fuel Used | 0 (0.0%) | 0 (0.0%) |
| Total | 801 (100.0%) | 227 (100.0%) |
Household Vehicle Usage in Spring Mount
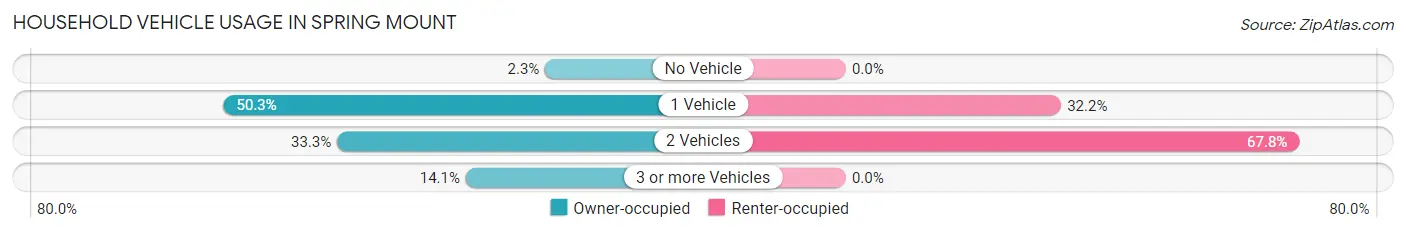
| Vehicles per Household | Owner-occupied | Renter-occupied |
| No Vehicle | 18 (2.2%) | 0 (0.0%) |
| 1 Vehicle | 403 (50.3%) | 73 (32.2%) |
| 2 Vehicles | 267 (33.3%) | 154 (67.8%) |
| 3 or more Vehicles | 113 (14.1%) | 0 (0.0%) |
| Total | 801 (100.0%) | 227 (100.0%) |
Real Estate & Mortgages in Spring Mount
Real Estate and Mortgage Overview in Spring Mount
| Characteristic | Without Mortgage | With Mortgage |
| Housing Units | 199 | 602 |
| Median Property Value | $240,000 | $230,900 |
| Median Household Income | $76,442 | $124 |
| Monthly Housing Costs | $666 | $51 |
| Real Estate Taxes | $4,541 | $0 |
Property Value by Mortgage Status in Spring Mount
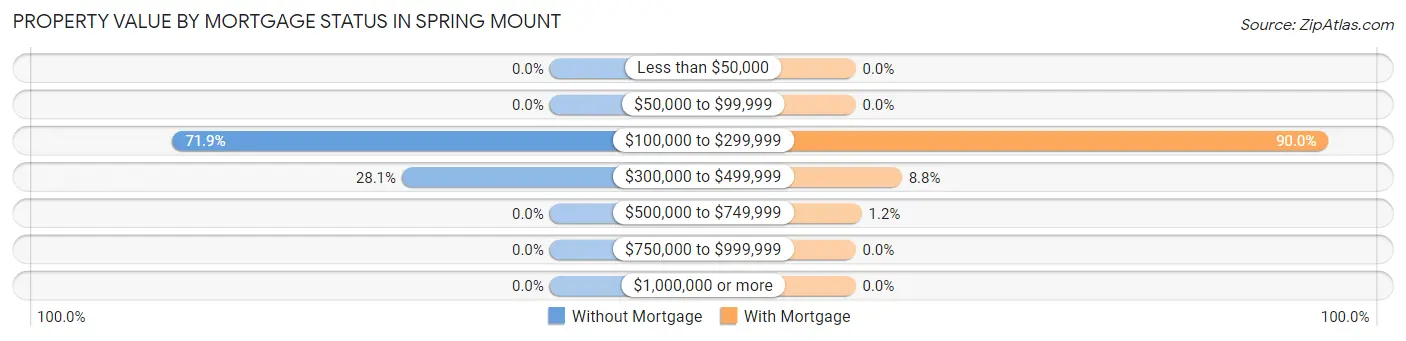
| Property Value | Without Mortgage | With Mortgage |
| Less than $50,000 | 0 (0.0%) | 0 (0.0%) |
| $50,000 to $99,999 | 0 (0.0%) | 0 (0.0%) |
| $100,000 to $299,999 | 143 (71.9%) | 542 (90.0%) |
| $300,000 to $499,999 | 56 (28.1%) | 53 (8.8%) |
| $500,000 to $749,999 | 0 (0.0%) | 7 (1.2%) |
| $750,000 to $999,999 | 0 (0.0%) | 0 (0.0%) |
| $1,000,000 or more | 0 (0.0%) | 0 (0.0%) |
| Total | 199 (100.0%) | 602 (100.0%) |
Household Income by Mortgage Status in Spring Mount
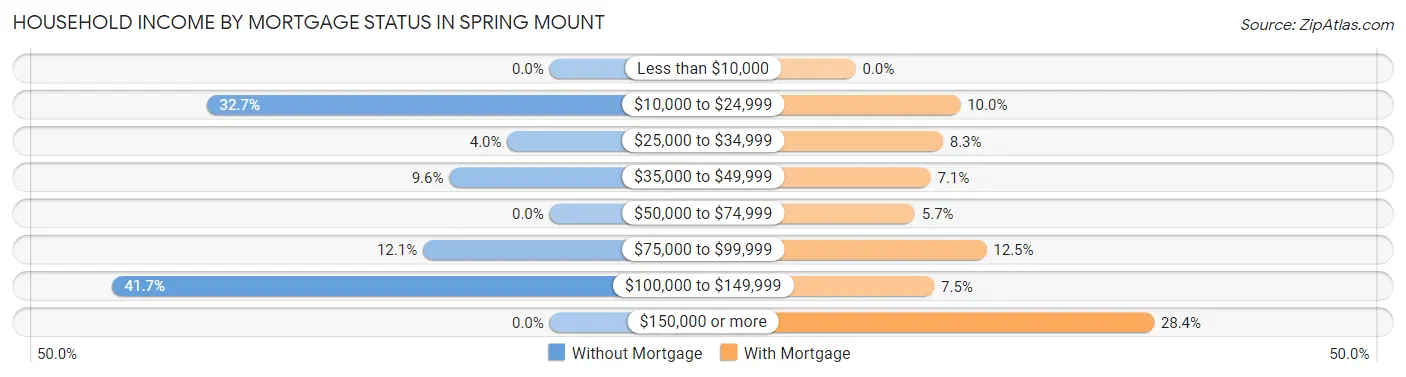
| Household Income | Without Mortgage | With Mortgage |
| Less than $10,000 | 0 (0.0%) | 0 (0.0%) |
| $10,000 to $24,999 | 65 (32.7%) | 60 (10.0%) |
| $25,000 to $34,999 | 8 (4.0%) | 50 (8.3%) |
| $35,000 to $49,999 | 19 (9.6%) | 43 (7.1%) |
| $50,000 to $74,999 | 0 (0.0%) | 34 (5.7%) |
| $75,000 to $99,999 | 24 (12.1%) | 75 (12.5%) |
| $100,000 to $149,999 | 83 (41.7%) | 45 (7.5%) |
| $150,000 or more | 0 (0.0%) | 171 (28.4%) |
| Total | 199 (100.0%) | 602 (100.0%) |
Property Value to Household Income Ratio in Spring Mount
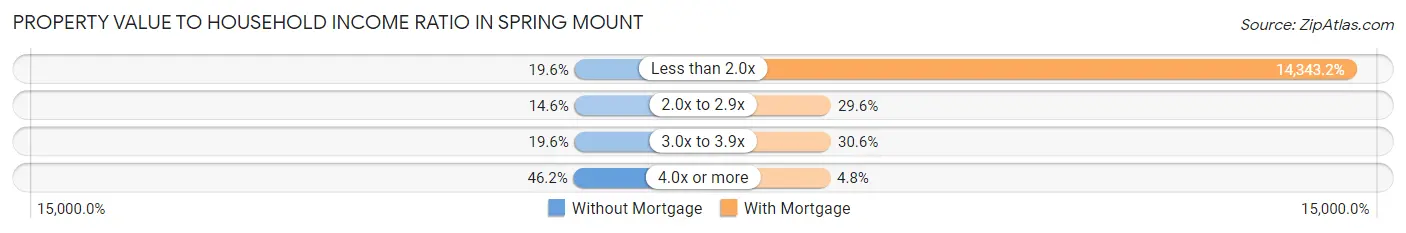
| Value-to-Income Ratio | Without Mortgage | With Mortgage |
| Less than 2.0x | 39 (19.6%) | 86,346 (14,343.2%) |
| 2.0x to 2.9x | 29 (14.6%) | 178 (29.6%) |
| 3.0x to 3.9x | 39 (19.6%) | 184 (30.6%) |
| 4.0x or more | 92 (46.2%) | 29 (4.8%) |
| Total | 199 (100.0%) | 602 (100.0%) |
Real Estate Taxes by Mortgage Status in Spring Mount
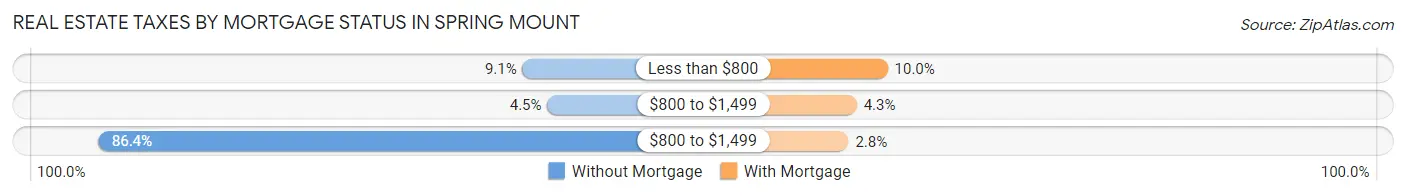
| Property Taxes | Without Mortgage | With Mortgage |
| Less than $800 | 18 (9.0%) | 60 (10.0%) |
| $800 to $1,499 | 9 (4.5%) | 26 (4.3%) |
| $800 to $1,499 | 172 (86.4%) | 17 (2.8%) |
| Total | 199 (100.0%) | 602 (100.0%) |
Health & Disability in Spring Mount
Health Insurance Coverage by Age in Spring Mount
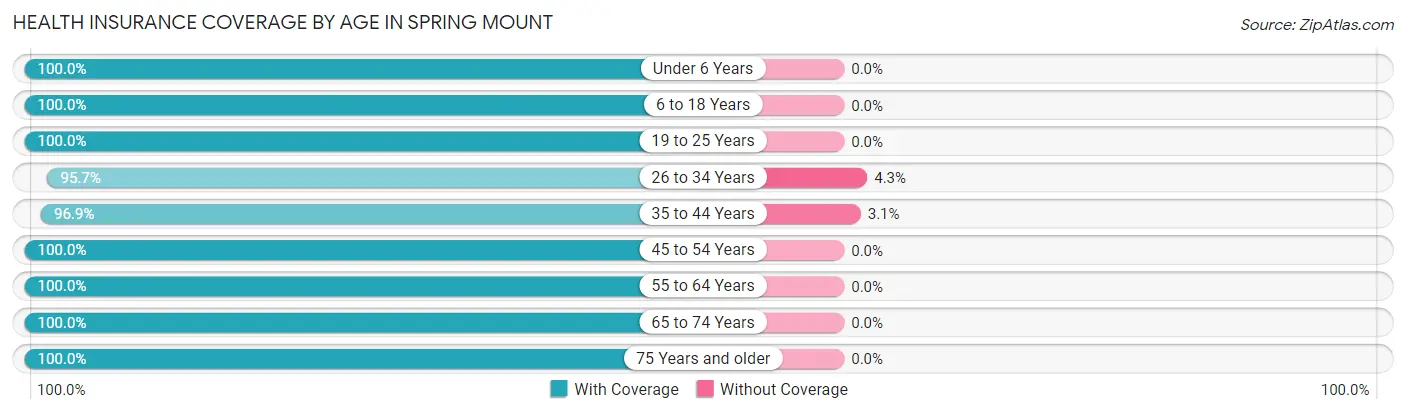
| Age Bracket | With Coverage | Without Coverage |
| Under 6 Years | 209 (100.0%) | 0 (0.0%) |
| 6 to 18 Years | 684 (100.0%) | 0 (0.0%) |
| 19 to 25 Years | 107 (100.0%) | 0 (0.0%) |
| 26 to 34 Years | 290 (95.7%) | 13 (4.3%) |
| 35 to 44 Years | 377 (96.9%) | 12 (3.1%) |
| 45 to 54 Years | 341 (100.0%) | 0 (0.0%) |
| 55 to 64 Years | 265 (100.0%) | 0 (0.0%) |
| 65 to 74 Years | 212 (100.0%) | 0 (0.0%) |
| 75 Years and older | 56 (100.0%) | 0 (0.0%) |
| Total | 2,541 (99.0%) | 25 (1.0%) |
Health Insurance Coverage by Citizenship Status in Spring Mount
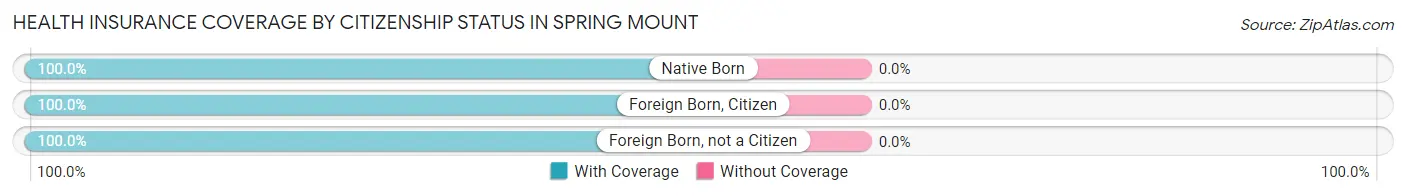
| Citizenship Status | With Coverage | Without Coverage |
| Native Born | 209 (100.0%) | 0 (0.0%) |
| Foreign Born, Citizen | 684 (100.0%) | 0 (0.0%) |
| Foreign Born, not a Citizen | 107 (100.0%) | 0 (0.0%) |
Health Insurance Coverage by Household Income in Spring Mount
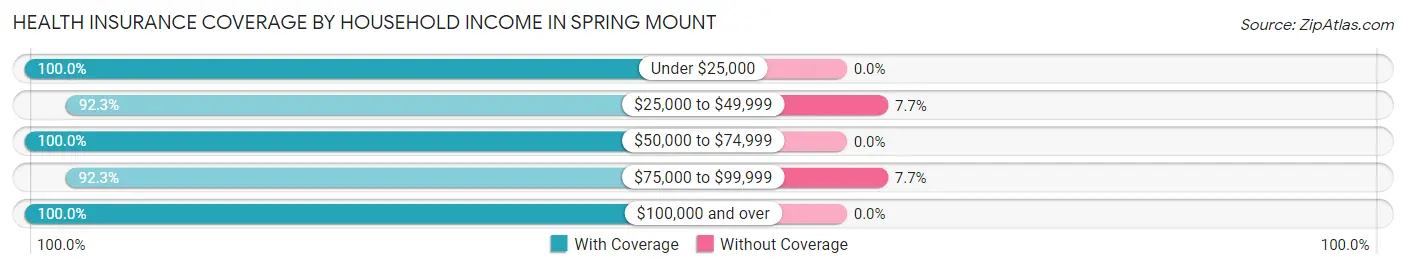
| Household Income | With Coverage | Without Coverage |
| Under $25,000 | 588 (100.0%) | 0 (0.0%) |
| $25,000 to $49,999 | 143 (92.3%) | 12 (7.7%) |
| $50,000 to $74,999 | 166 (100.0%) | 0 (0.0%) |
| $75,000 to $99,999 | 156 (92.3%) | 13 (7.7%) |
| $100,000 and over | 1,486 (100.0%) | 0 (0.0%) |
Public vs Private Health Insurance Coverage by Age in Spring Mount
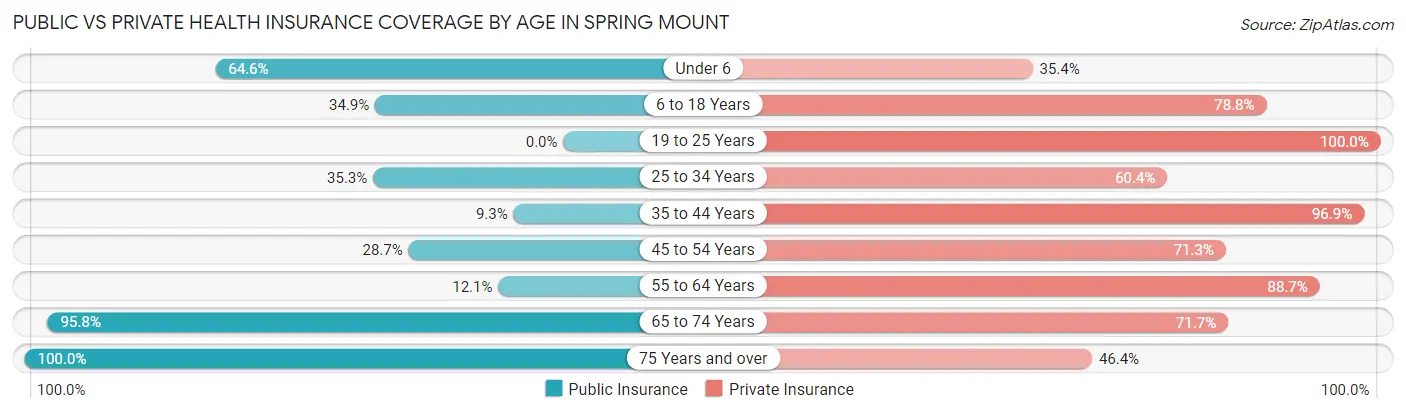
| Age Bracket | Public Insurance | Private Insurance |
| Under 6 | 135 (64.6%) | 74 (35.4%) |
| 6 to 18 Years | 239 (34.9%) | 539 (78.8%) |
| 19 to 25 Years | 0 (0.0%) | 107 (100.0%) |
| 25 to 34 Years | 107 (35.3%) | 183 (60.4%) |
| 35 to 44 Years | 36 (9.2%) | 377 (96.9%) |
| 45 to 54 Years | 98 (28.7%) | 243 (71.3%) |
| 55 to 64 Years | 32 (12.1%) | 235 (88.7%) |
| 65 to 74 Years | 203 (95.8%) | 152 (71.7%) |
| 75 Years and over | 56 (100.0%) | 26 (46.4%) |
| Total | 906 (35.3%) | 1,936 (75.4%) |
Disability Status by Sex by Age in Spring Mount
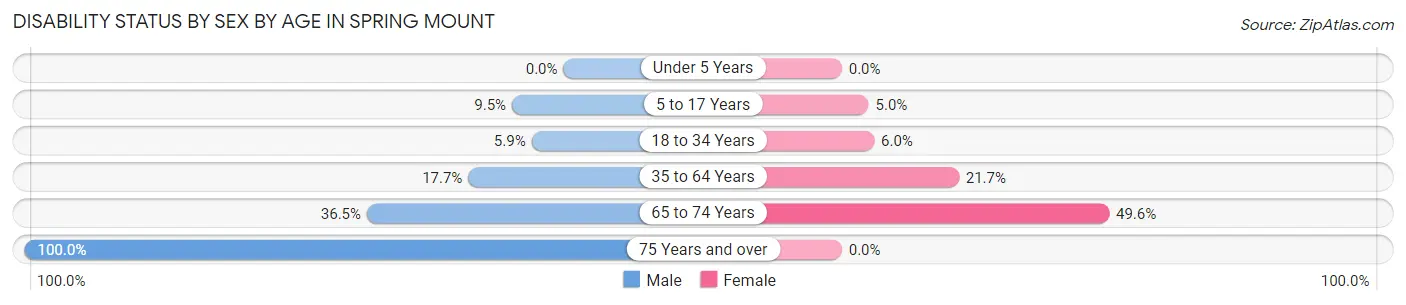
| Age Bracket | Male | Female |
| Under 5 Years | 0 (0.0%) | 0 (0.0%) |
| 5 to 17 Years | 31 (9.5%) | 16 (5.0%) |
| 18 to 34 Years | 15 (5.9%) | 13 (6.0%) |
| 35 to 64 Years | 83 (17.7%) | 114 (21.7%) |
| 65 to 74 Years | 31 (36.5%) | 63 (49.6%) |
| 75 Years and over | 27 (100.0%) | 0 (0.0%) |
Disability Class by Sex by Age in Spring Mount
Disability Class: Hearing Difficulty
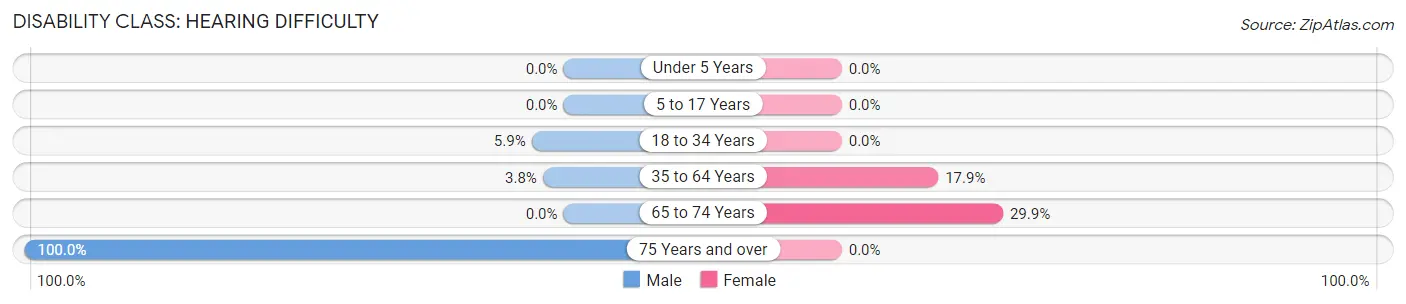
| Age Bracket | Male | Female |
| Under 5 Years | 0 (0.0%) | 0 (0.0%) |
| 5 to 17 Years | 0 (0.0%) | 0 (0.0%) |
| 18 to 34 Years | 15 (5.9%) | 0 (0.0%) |
| 35 to 64 Years | 18 (3.8%) | 94 (17.9%) |
| 65 to 74 Years | 0 (0.0%) | 38 (29.9%) |
| 75 Years and over | 27 (100.0%) | 0 (0.0%) |
Disability Class: Vision Difficulty
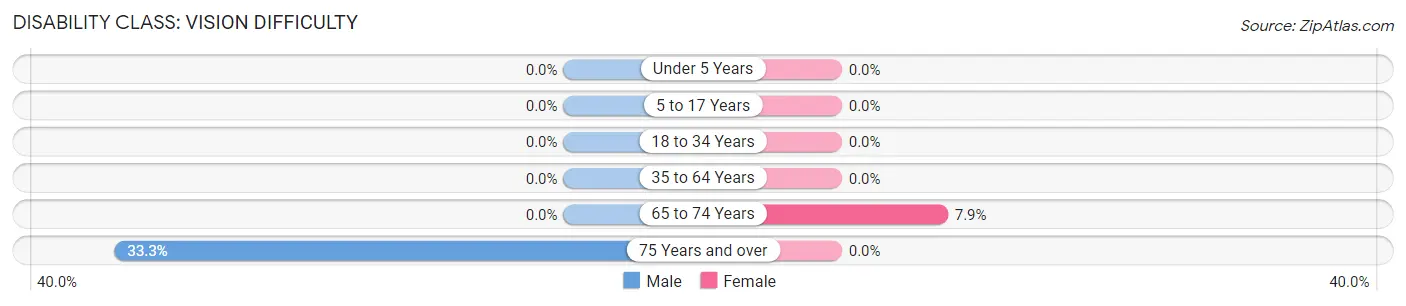
| Age Bracket | Male | Female |
| Under 5 Years | 0 (0.0%) | 0 (0.0%) |
| 5 to 17 Years | 0 (0.0%) | 0 (0.0%) |
| 18 to 34 Years | 0 (0.0%) | 0 (0.0%) |
| 35 to 64 Years | 0 (0.0%) | 0 (0.0%) |
| 65 to 74 Years | 0 (0.0%) | 10 (7.9%) |
| 75 Years and over | 9 (33.3%) | 0 (0.0%) |
Disability Class: Cognitive Difficulty
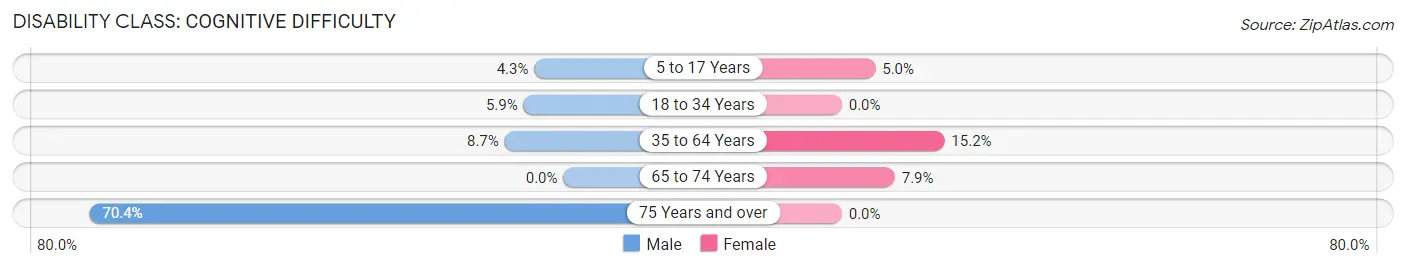
| Age Bracket | Male | Female |
| 5 to 17 Years | 14 (4.3%) | 16 (5.0%) |
| 18 to 34 Years | 15 (5.9%) | 0 (0.0%) |
| 35 to 64 Years | 41 (8.7%) | 80 (15.2%) |
| 65 to 74 Years | 0 (0.0%) | 10 (7.9%) |
| 75 Years and over | 19 (70.4%) | 0 (0.0%) |
Disability Class: Ambulatory Difficulty
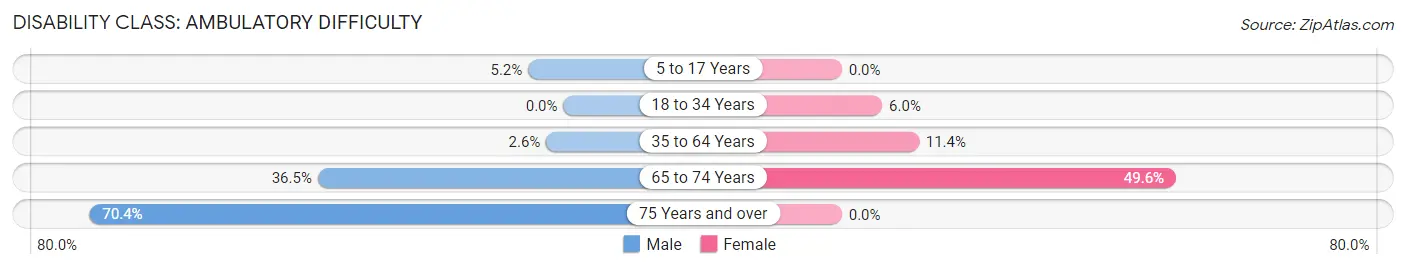
| Age Bracket | Male | Female |
| 5 to 17 Years | 17 (5.2%) | 0 (0.0%) |
| 18 to 34 Years | 0 (0.0%) | 13 (6.0%) |
| 35 to 64 Years | 12 (2.5%) | 60 (11.4%) |
| 65 to 74 Years | 31 (36.5%) | 63 (49.6%) |
| 75 Years and over | 19 (70.4%) | 0 (0.0%) |
Disability Class: Self-Care Difficulty
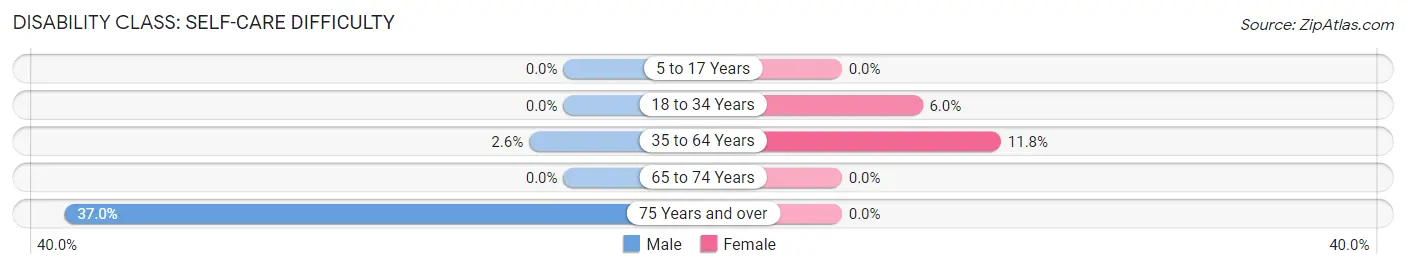
| Age Bracket | Male | Female |
| 5 to 17 Years | 0 (0.0%) | 0 (0.0%) |
| 18 to 34 Years | 0 (0.0%) | 13 (6.0%) |
| 35 to 64 Years | 12 (2.5%) | 62 (11.8%) |
| 65 to 74 Years | 0 (0.0%) | 0 (0.0%) |
| 75 Years and over | 10 (37.0%) | 0 (0.0%) |
Technology Access in Spring Mount
Computing Device Access in Spring Mount
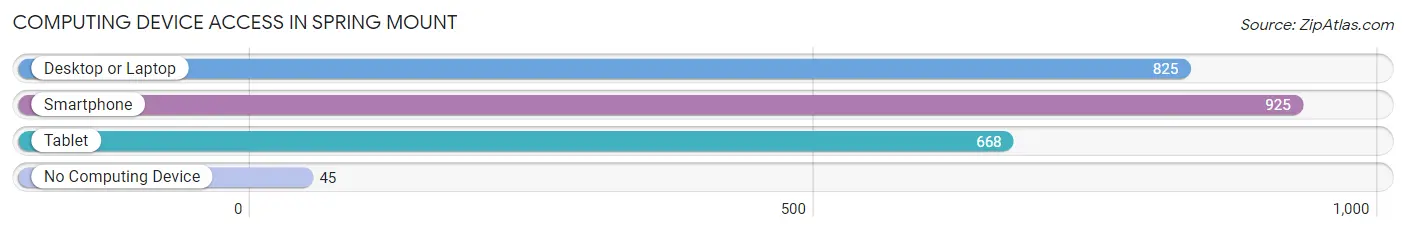
| Device Type | # Households | % Households |
| Desktop or Laptop | 825 | 80.2% |
| Smartphone | 925 | 90.0% |
| Tablet | 668 | 65.0% |
| No Computing Device | 45 | 4.4% |
| Total | 1,028 | 100.0% |
Internet Access in Spring Mount
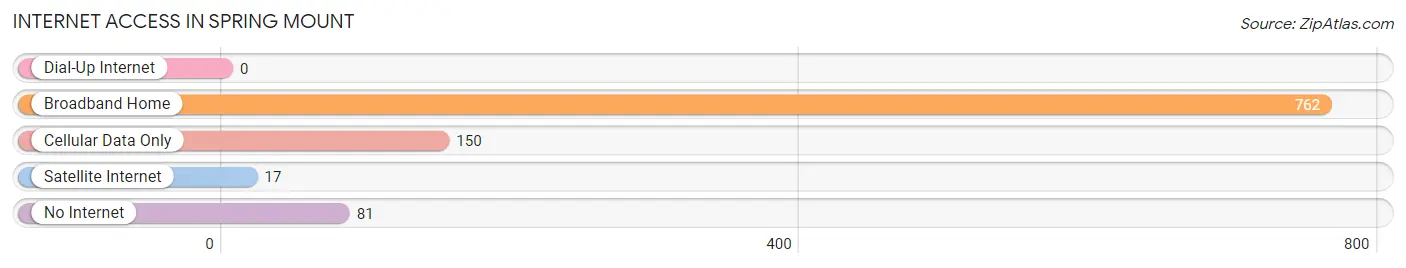
| Internet Type | # Households | % Households |
| Dial-Up Internet | 0 | 0.0% |
| Broadband Home | 762 | 74.1% |
| Cellular Data Only | 150 | 14.6% |
| Satellite Internet | 17 | 1.7% |
| No Internet | 81 | 7.9% |
| Total | 1,028 | 100.0% |
Spring Mount Summary
Mount Spring, Pennsylvania is a small borough located in Montgomery County, Pennsylvania. It is situated in the southeastern part of the state, approximately 20 miles northwest of Philadelphia. The population of Mount Spring was 2,845 as of the 2010 census.
History
Mount Spring was first settled in 1717 by a group of German immigrants. The town was originally known as “Spring Mount”, and was later changed to “Mount Spring”. The town was officially incorporated in 1845.
The town was originally a farming community, and the main crops grown were wheat, corn, and oats. In the late 19th century, the town began to industrialize, and several factories were built in the area. These factories included a paper mill, a brickyard, and a tannery.
Geography
Mount Spring is located in southeastern Pennsylvania, approximately 20 miles northwest of Philadelphia. The town is situated in the Perkiomen Valley, which is part of the Great Valley region of Pennsylvania. The town is bordered by the townships of Upper Salford, Lower Salford, and Franconia.
The town has a total area of 1.2 square miles, all of which is land. The town is located at an elevation of 441 feet above sea level.
Economy
The economy of Mount Spring is largely based on manufacturing and services. The town is home to several factories, including a paper mill, a brickyard, and a tannery. The town is also home to several small businesses, including restaurants, retail stores, and professional services.
The town is also home to several educational institutions, including a public school district and a community college.
Demographics
As of the 2010 census, the population of Mount Spring was 2,845. The racial makeup of the town was 94.3% White, 2.2% African American, 0.3% Native American, 0.7% Asian, 0.1% Pacific Islander, 1.2% from other races, and 1.3% from two or more races. Hispanic or Latino of any race were 3.2% of the population.
The median income for a household in the town was $50,972, and the median income for a family was $60,972. The per capita income for the town was $25,972. About 5.2% of families and 7.2% of the population were below the poverty line, including 8.2% of those under age 18 and 5.2% of those age 65 or over.
Common Questions
What is Per Capita Income in Spring Mount?
Per Capita income in Spring Mount is $34,535.
What is the Median Family Income in Spring Mount?
Median Family Income in Spring Mount is $102,308.
What is the Median Household income in Spring Mount?
Median Household Income in Spring Mount is $86,538.
What is Income or Wage Gap in Spring Mount?
Income or Wage Gap in Spring Mount is 29.9%.
Women in Spring Mount earn 70.1 cents for every dollar earned by a man.
What is Inequality or Gini Index in Spring Mount?
Inequality or Gini Index in Spring Mount is 0.42.
What is the Total Population of Spring Mount?
Total Population of Spring Mount is 2,566.
What is the Total Male Population of Spring Mount?
Total Male Population of Spring Mount is 1,271.
What is the Total Female Population of Spring Mount?
Total Female Population of Spring Mount is 1,295.
What is the Ratio of Males per 100 Females in Spring Mount?
There are 98.15 Males per 100 Females in Spring Mount.
What is the Ratio of Females per 100 Males in Spring Mount?
There are 101.89 Females per 100 Males in Spring Mount.
What is the Median Population Age in Spring Mount?
Median Population Age in Spring Mount is 34.3 Years.
What is the Average Family Size in Spring Mount
Average Family Size in Spring Mount is 3.1 People.
What is the Average Household Size in Spring Mount
Average Household Size in Spring Mount is 2.5 People.
How Large is the Labor Force in Spring Mount?
There are 1,366 People in the Labor Forcein in Spring Mount.
What is the Percentage of People in the Labor Force in Spring Mount?
73.6% of People are in the Labor Force in Spring Mount.
What is the Unemployment Rate in Spring Mount?
Unemployment Rate in Spring Mount is 9.5%.