Tylersburg, PA Map & Demographics
Tylersburg Map
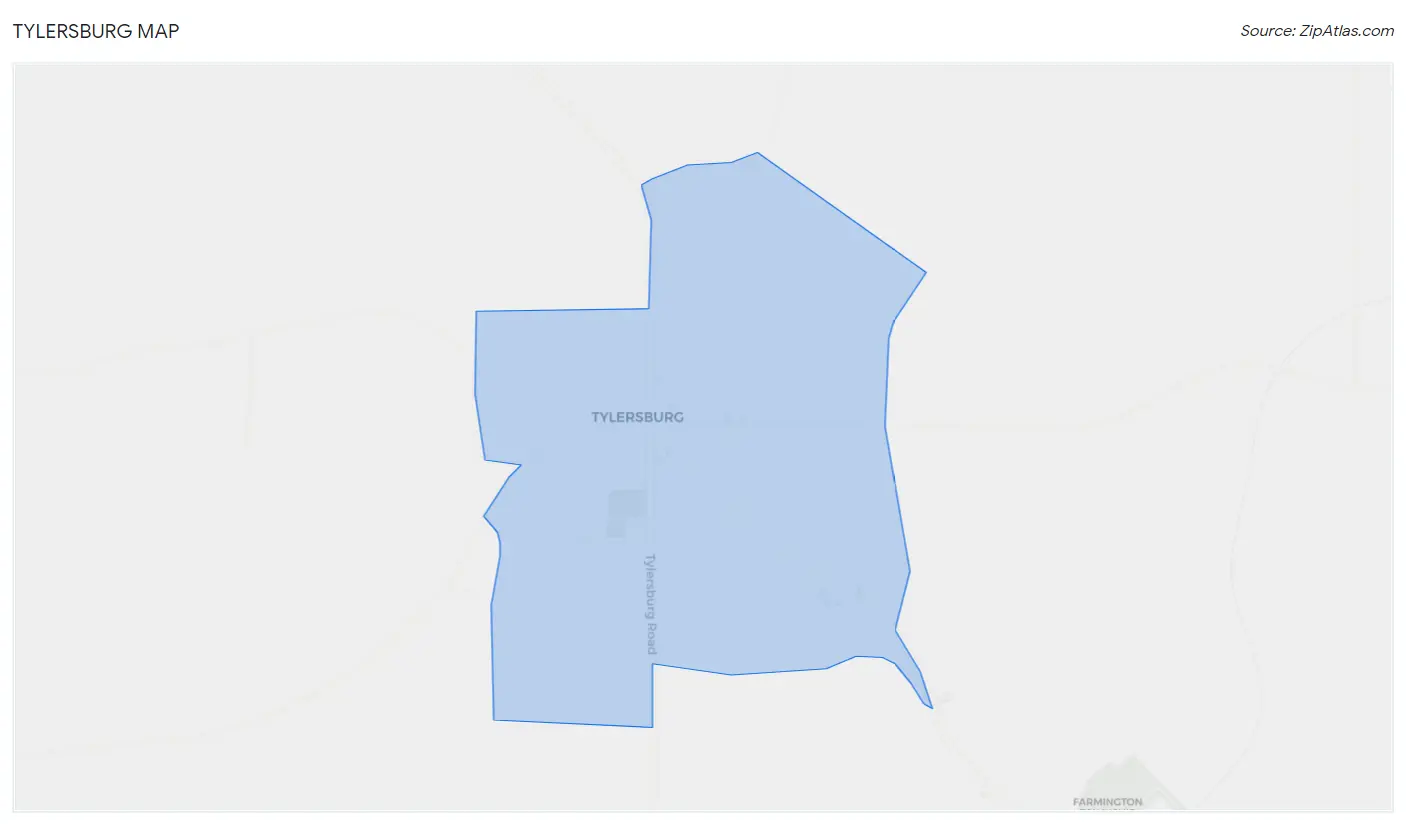
Tylersburg Overview
$47,271
PER CAPITA INCOME
$119,018
AVG FAMILY INCOME
$87,361
AVG HOUSEHOLD INCOME
5.4%
WAGE / INCOME GAP [ % ]
94.6¢/ $1
WAGE / INCOME GAP [ $ ]
0.29
INEQUALITY / GINI INDEX
97
TOTAL POPULATION
40
MALE POPULATION
57
FEMALE POPULATION
70.18
MALES / 100 FEMALES
142.50
FEMALES / 100 MALES
51.5
MEDIAN AGE
2.6
AVG FAMILY SIZE
1.8
AVG HOUSEHOLD SIZE
67
LABOR FORCE [ PEOPLE ]
69.1%
PERCENT IN LABOR FORCE
7.5%
UNEMPLOYMENT RATE
Tylersburg Zip Codes
Tylersburg Area Codes
Income in Tylersburg
Income Overview in Tylersburg
Per Capita Income in Tylersburg is $47,271, while median incomes of families and households are $119,018 and $87,361 respectively.
| Characteristic | Number | Measure |
| Per Capita Income | 97 | $47,271 |
| Median Family Income | 27 | $119,018 |
| Mean Family Income | 27 | $119,881 |
| Median Household Income | 55 | $87,361 |
| Mean Household Income | 55 | $83,395 |
| Income Deficit | 27 | $0 |
| Wage / Income Gap (%) | 97 | 5.43% |
| Wage / Income Gap ($) | 97 | 94.57¢ per $1 |
| Gini / Inequality Index | 97 | 0.29 |
Earnings by Sex in Tylersburg
Average Earnings in Tylersburg are $65,000, $67,188 for men and $63,542 for women, a difference of 5.4%.
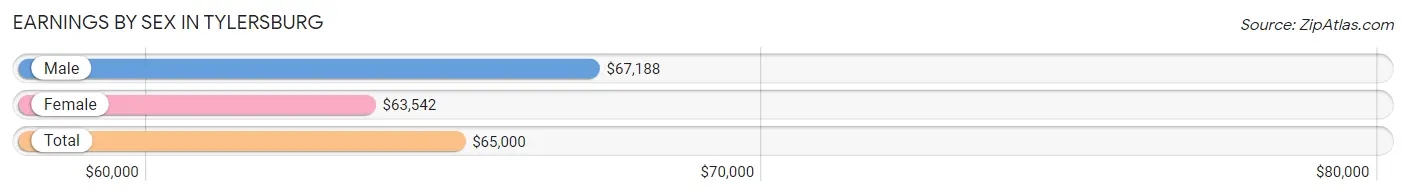
| Sex | Number | Average Earnings |
| Male | 35 (50.0%) | $67,188 |
| Female | 35 (50.0%) | $63,542 |
| Total | 70 (100.0%) | $65,000 |
Earnings by Sex by Income Bracket in Tylersburg
The most common earnings brackets in Tylersburg are $65,000 to $74,999 for men (18 | 51.4%) and $65,000 to $74,999 for women (14 | 40.0%).
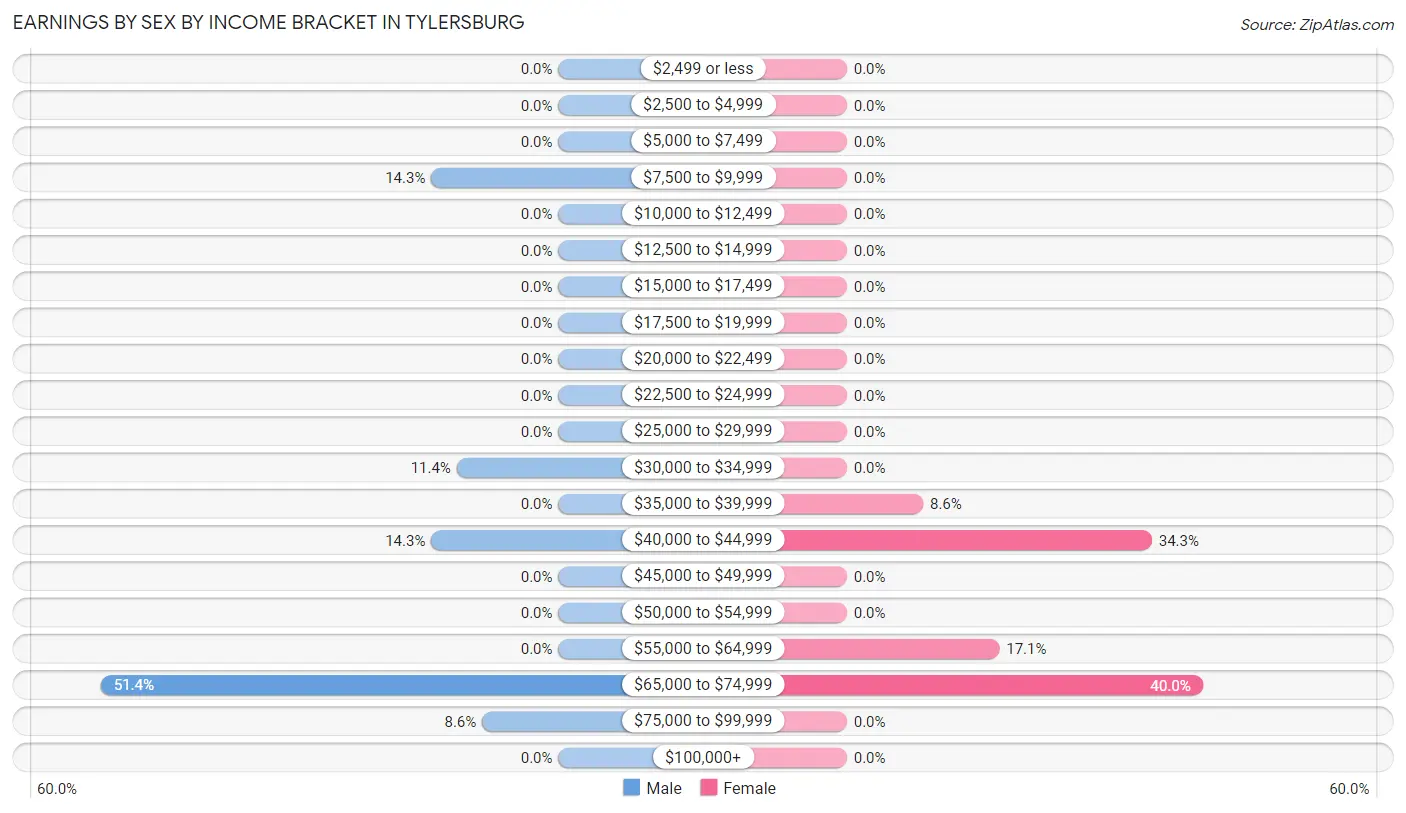
| Income | Male | Female |
| $2,499 or less | 0 (0.0%) | 0 (0.0%) |
| $2,500 to $4,999 | 0 (0.0%) | 0 (0.0%) |
| $5,000 to $7,499 | 0 (0.0%) | 0 (0.0%) |
| $7,500 to $9,999 | 5 (14.3%) | 0 (0.0%) |
| $10,000 to $12,499 | 0 (0.0%) | 0 (0.0%) |
| $12,500 to $14,999 | 0 (0.0%) | 0 (0.0%) |
| $15,000 to $17,499 | 0 (0.0%) | 0 (0.0%) |
| $17,500 to $19,999 | 0 (0.0%) | 0 (0.0%) |
| $20,000 to $22,499 | 0 (0.0%) | 0 (0.0%) |
| $22,500 to $24,999 | 0 (0.0%) | 0 (0.0%) |
| $25,000 to $29,999 | 0 (0.0%) | 0 (0.0%) |
| $30,000 to $34,999 | 4 (11.4%) | 0 (0.0%) |
| $35,000 to $39,999 | 0 (0.0%) | 3 (8.6%) |
| $40,000 to $44,999 | 5 (14.3%) | 12 (34.3%) |
| $45,000 to $49,999 | 0 (0.0%) | 0 (0.0%) |
| $50,000 to $54,999 | 0 (0.0%) | 0 (0.0%) |
| $55,000 to $64,999 | 0 (0.0%) | 6 (17.1%) |
| $65,000 to $74,999 | 18 (51.4%) | 14 (40.0%) |
| $75,000 to $99,999 | 3 (8.6%) | 0 (0.0%) |
| $100,000+ | 0 (0.0%) | 0 (0.0%) |
| Total | 35 (100.0%) | 35 (100.0%) |
Earnings by Sex by Educational Attainment in Tylersburg
Average earnings in Tylersburg are $67,188 for men and $63,542 for women, a difference of 5.4%. Men with an educational attainment of high school diploma enjoy the highest average annual earnings of $68,750, while those with high school diploma education earn the least with $68,750. Women with an educational attainment of high school diploma earn the most with the average annual earnings of $65,278, while those with high school diploma education have the smallest earnings of $65,278.
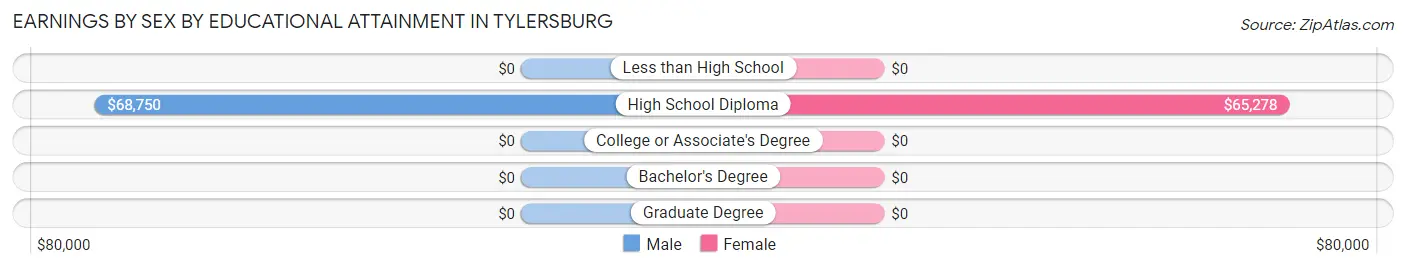
| Educational Attainment | Male Income | Female Income |
| Less than High School | - | - |
| High School Diploma | $68,750 | $65,278 |
| College or Associate's Degree | - | - |
| Bachelor's Degree | - | - |
| Graduate Degree | - | - |
| Total | $67,188 | $63,542 |
Family Income in Tylersburg
Family Income Brackets in Tylersburg
According to the Tylersburg family income data, there are 27 families falling into the $100,000 to $149,999 income range, which is the most common income bracket and makes up 100.0% of all families.
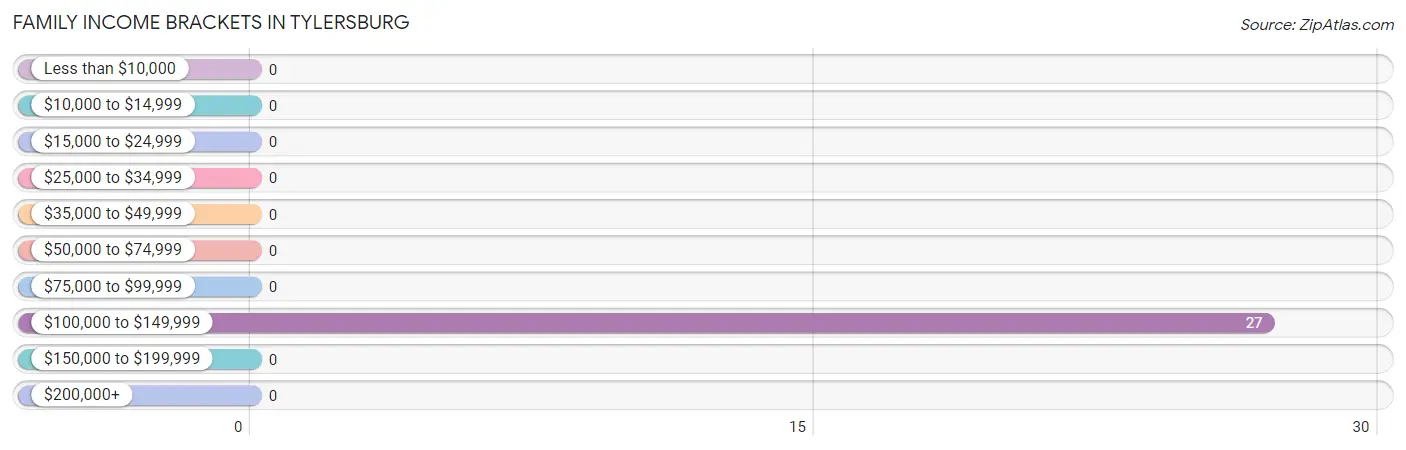
| Income Bracket | # Families | % Families |
| Less than $10,000 | 0 | 0.0% |
| $10,000 to $14,999 | 0 | 0.0% |
| $15,000 to $24,999 | 0 | 0.0% |
| $25,000 to $34,999 | 0 | 0.0% |
| $35,000 to $49,999 | 0 | 0.0% |
| $50,000 to $74,999 | 0 | 0.0% |
| $75,000 to $99,999 | 0 | 0.0% |
| $100,000 to $149,999 | 27 | 100.0% |
| $150,000 to $199,999 | 0 | 0.0% |
| $200,000+ | 0 | 0.0% |
Family Income by Famaliy Size in Tylersburg
2-person families (13 | 48.1%) account for the highest median family income in Tylersburg with $125,750 per family, while 2-person families (13 | 48.1%) have the highest median income of $62,875 per family member.
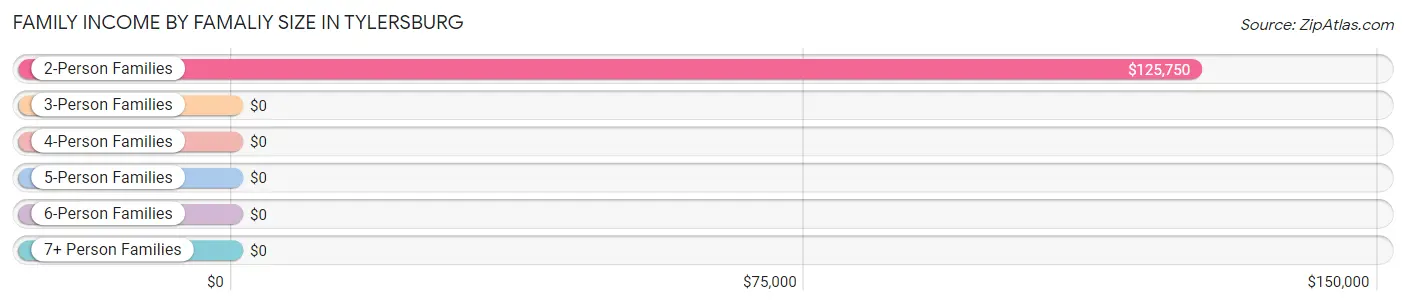
| Income Bracket | # Families | Median Income |
| 2-Person Families | 13 (48.1%) | $125,750 |
| 3-Person Families | 14 (51.8%) | $0 |
| 4-Person Families | 0 (0.0%) | $0 |
| 5-Person Families | 0 (0.0%) | $0 |
| 6-Person Families | 0 (0.0%) | $0 |
| 7+ Person Families | 0 (0.0%) | $0 |
| Total | 27 (100.0%) | $119,018 |
Family Income by Number of Earners in Tylersburg
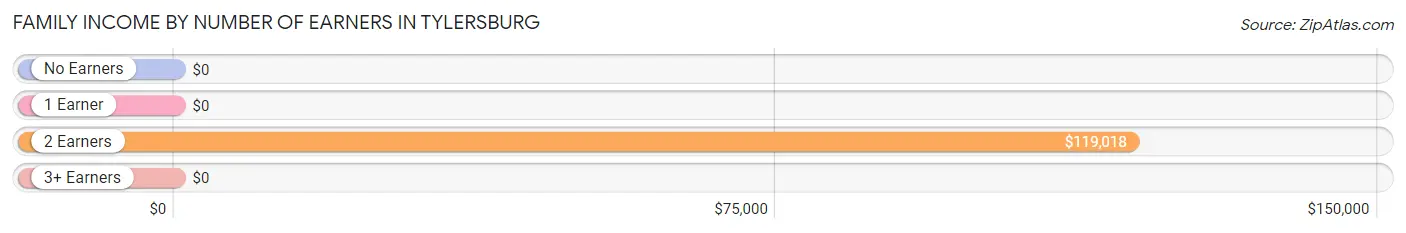
| Number of Earners | # Families | Median Income |
| No Earners | 0 (0.0%) | $0 |
| 1 Earner | 0 (0.0%) | $0 |
| 2 Earners | 27 (100.0%) | $119,018 |
| 3+ Earners | 0 (0.0%) | $0 |
| Total | 27 (100.0%) | $119,018 |
Household Income in Tylersburg
Household Income Brackets in Tylersburg
With 27 households falling in the category, the $100,000 to $149,999 income range is the most frequent in Tylersburg, accounting for 49.1% of all households.
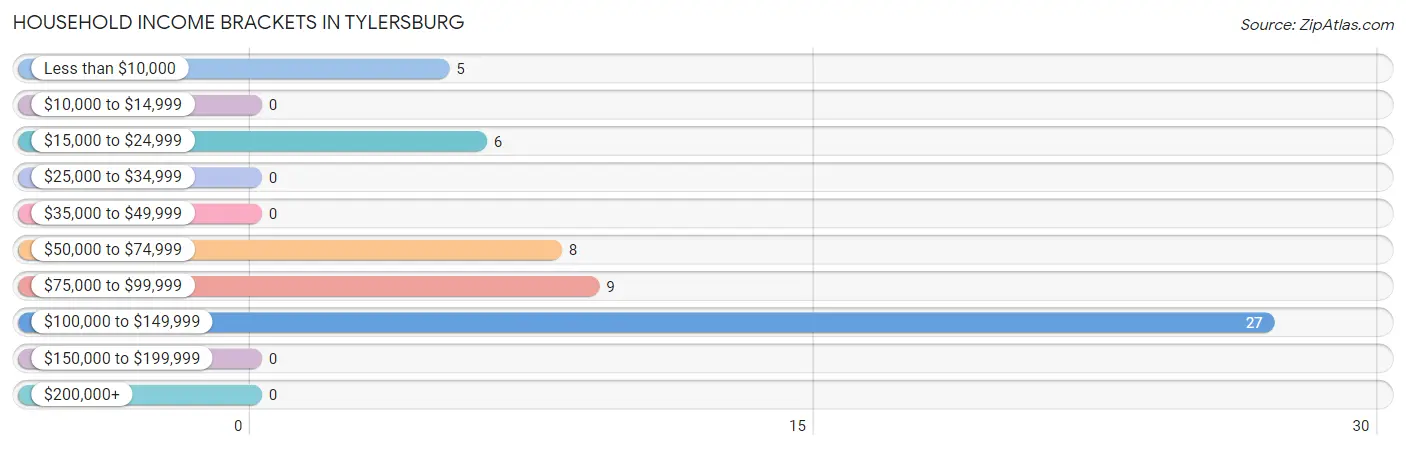
| Income Bracket | # Households | % Households |
| Less than $10,000 | 5 | 9.1% |
| $10,000 to $14,999 | 0 | 0.0% |
| $15,000 to $24,999 | 6 | 10.9% |
| $25,000 to $34,999 | 0 | 0.0% |
| $35,000 to $49,999 | 0 | 0.0% |
| $50,000 to $74,999 | 8 | 14.5% |
| $75,000 to $99,999 | 9 | 16.4% |
| $100,000 to $149,999 | 27 | 49.1% |
| $150,000 to $199,999 | 0 | 0.0% |
| $200,000+ | 0 | 0.0% |
Household Income by Householder Age in Tylersburg
The median household income in Tylersburg is $87,361, with the highest median household income of $117,857 found in the 45 to 64 years age bracket for the primary householder. A total of 40 households (72.7%) fall into this category.
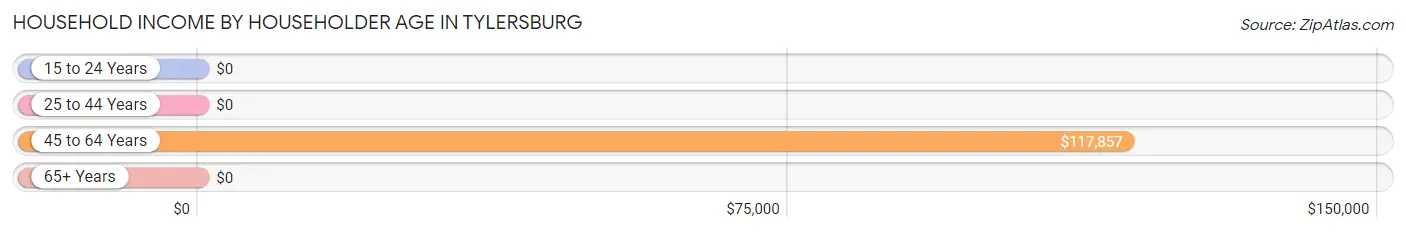
| Income Bracket | # Households | Median Income |
| 15 to 24 Years | 0 (0.0%) | $0 |
| 25 to 44 Years | 0 (0.0%) | $0 |
| 45 to 64 Years | 40 (72.7%) | $117,857 |
| 65+ Years | 15 (27.3%) | $0 |
| Total | 55 (100.0%) | $87,361 |
Poverty in Tylersburg
Income Below Poverty by Sex and Age in Tylersburg
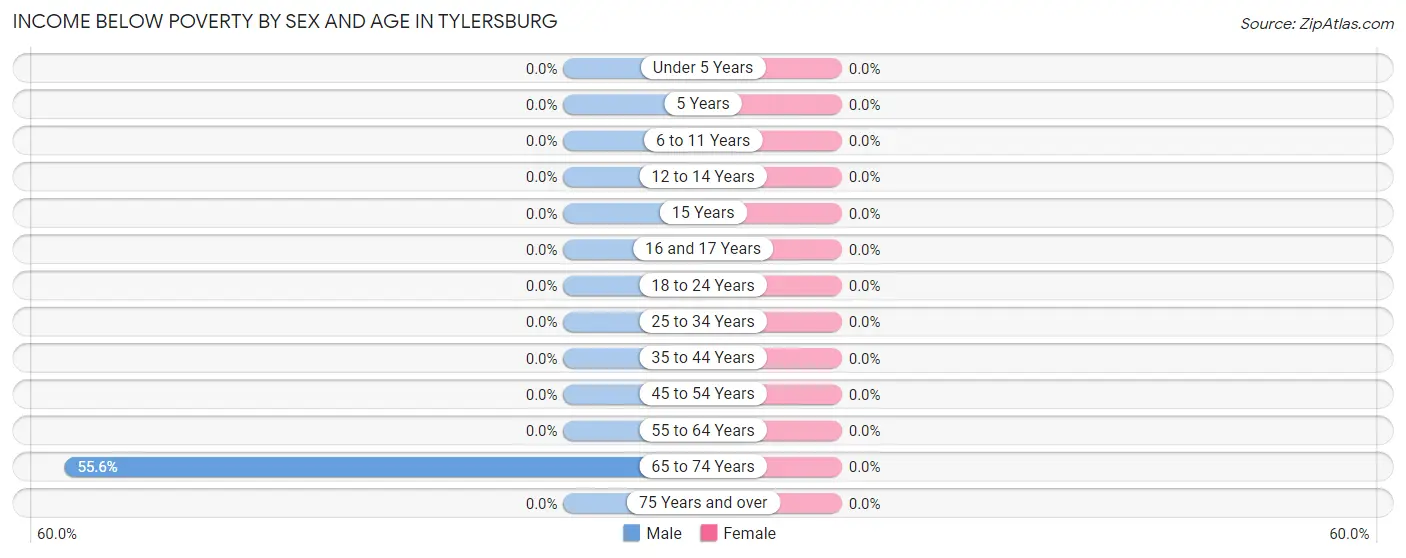
| Age Bracket | Male | Female |
| Under 5 Years | 0 (0.0%) | 0 (0.0%) |
| 5 Years | 0 (0.0%) | 0 (0.0%) |
| 6 to 11 Years | 0 (0.0%) | 0 (0.0%) |
| 12 to 14 Years | 0 (0.0%) | 0 (0.0%) |
| 15 Years | 0 (0.0%) | 0 (0.0%) |
| 16 and 17 Years | 0 (0.0%) | 0 (0.0%) |
| 18 to 24 Years | 0 (0.0%) | 0 (0.0%) |
| 25 to 34 Years | 0 (0.0%) | 0 (0.0%) |
| 35 to 44 Years | 0 (0.0%) | 0 (0.0%) |
| 45 to 54 Years | 0 (0.0%) | 0 (0.0%) |
| 55 to 64 Years | 0 (0.0%) | 0 (0.0%) |
| 65 to 74 Years | 5 (55.6%) | 0 (0.0%) |
| 75 Years and over | 0 (0.0%) | 0 (0.0%) |
| Total | 5 (12.5%) | 0 (0.0%) |
Income Above Poverty by Sex and Age in Tylersburg
According to the poverty statistics in Tylersburg, males aged 45 to 54 years and females aged 25 to 34 years are the age groups that are most secure financially, with 100.0% of males and 100.0% of females in these age groups living above the poverty line.
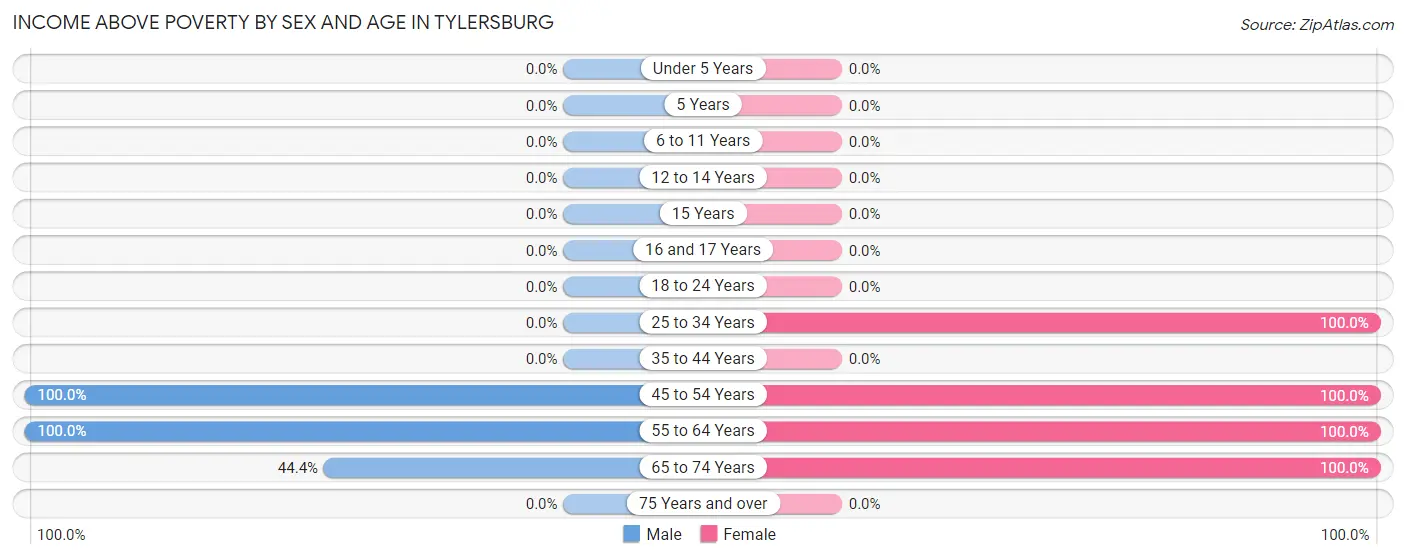
| Age Bracket | Male | Female |
| Under 5 Years | 0 (0.0%) | 0 (0.0%) |
| 5 Years | 0 (0.0%) | 0 (0.0%) |
| 6 to 11 Years | 0 (0.0%) | 0 (0.0%) |
| 12 to 14 Years | 0 (0.0%) | 0 (0.0%) |
| 15 Years | 0 (0.0%) | 0 (0.0%) |
| 16 and 17 Years | 0 (0.0%) | 0 (0.0%) |
| 18 to 24 Years | 0 (0.0%) | 0 (0.0%) |
| 25 to 34 Years | 0 (0.0%) | 16 (100.0%) |
| 35 to 44 Years | 0 (0.0%) | 0 (0.0%) |
| 45 to 54 Years | 19 (100.0%) | 21 (100.0%) |
| 55 to 64 Years | 12 (100.0%) | 14 (100.0%) |
| 65 to 74 Years | 4 (44.4%) | 6 (100.0%) |
| 75 Years and over | 0 (0.0%) | 0 (0.0%) |
| Total | 35 (87.5%) | 57 (100.0%) |
Income Below Poverty Among Married-Couple Families in Tylersburg
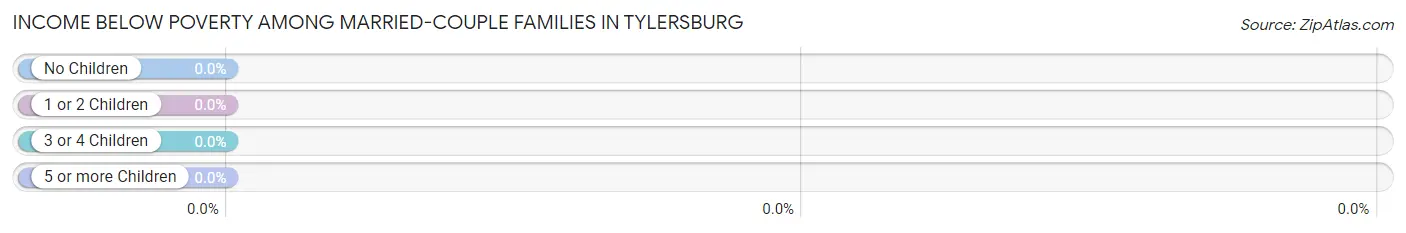
| Children | Above Poverty | Below Poverty |
| No Children | 27 (100.0%) | 0 (0.0%) |
| 1 or 2 Children | 0 (0.0%) | 0 (0.0%) |
| 3 or 4 Children | 0 (0.0%) | 0 (0.0%) |
| 5 or more Children | 0 (0.0%) | 0 (0.0%) |
| Total | 27 (100.0%) | 0 (0.0%) |
Income Below Poverty Among Single-Parent Households in Tylersburg
| Children | Single Father | Single Mother |
| No Children | 0 (0.0%) | 0 (0.0%) |
| 1 or 2 Children | 0 (0.0%) | 0 (0.0%) |
| 3 or 4 Children | 0 (0.0%) | 0 (0.0%) |
| 5 or more Children | 0 (0.0%) | 0 (0.0%) |
| Total | 0 (0.0%) | 0 (0.0%) |
Income Below Poverty Among Married-Couple vs Single-Parent Households in Tylersburg
| Children | Married-Couple Families | Single-Parent Households |
| No Children | 0 (0.0%) | 0 (0.0%) |
| 1 or 2 Children | 0 (0.0%) | 0 (0.0%) |
| 3 or 4 Children | 0 (0.0%) | 0 (0.0%) |
| 5 or more Children | 0 (0.0%) | 0 (0.0%) |
| Total | 0 (0.0%) | 0 (0.0%) |
Race in Tylersburg
The most populous races in Tylersburg are , and White / Caucasian (97 | 100.0%).
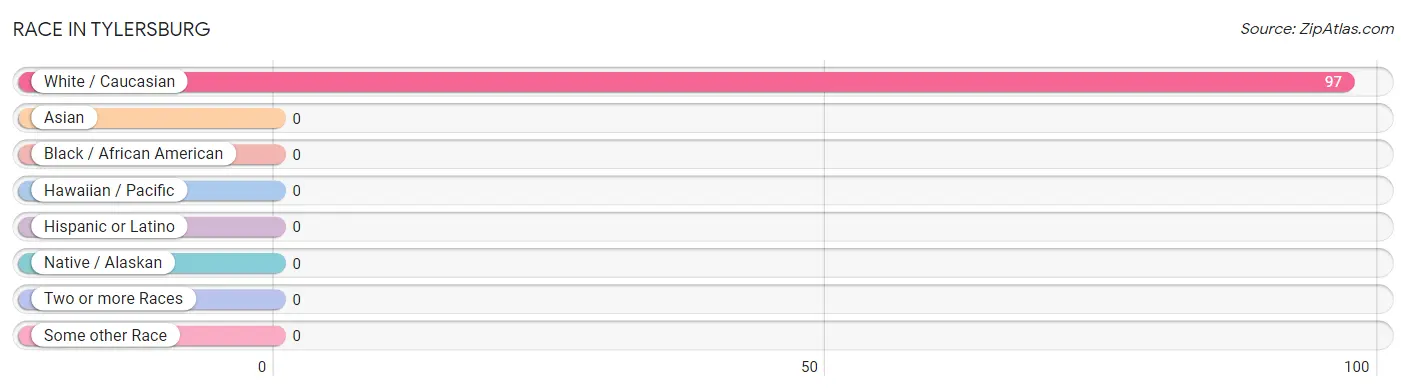
| Race | # Population | % Population |
| Asian | 0 | 0.0% |
| Black / African American | 0 | 0.0% |
| Hawaiian / Pacific | 0 | 0.0% |
| Hispanic or Latino | 0 | 0.0% |
| Native / Alaskan | 0 | 0.0% |
| White / Caucasian | 97 | 100.0% |
| Two or more Races | 0 | 0.0% |
| Some other Race | 0 | 0.0% |
| Total | 97 | 100.0% |
Ancestry in Tylersburg
The most populous ancestries reported in Tylersburg are German (36 | 37.1%), American (11 | 11.3%), Hungarian (6 | 6.2%), Irish (5 | 5.1%), and Slovak (4 | 4.1%), together accounting for 63.9% of all Tylersburg residents.
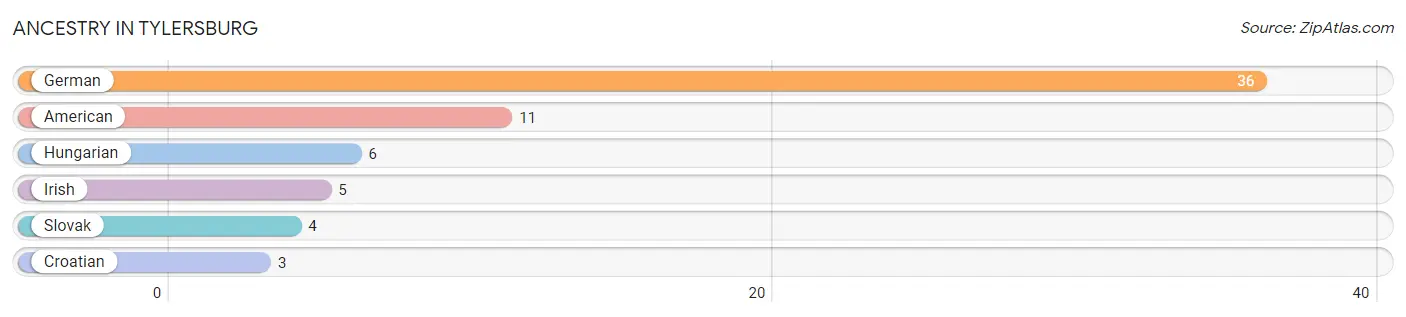
| Ancestry | # Population | % Population |
| American | 11 | 11.3% |
| Croatian | 3 | 3.1% |
| German | 36 | 37.1% |
| Hungarian | 6 | 6.2% |
| Irish | 5 | 5.1% |
| Slovak | 4 | 4.1% | View All 6 Rows |
Immigrants in Tylersburg

| Immigration Origin | # Population | % Population | View All 0 Rows |
Sex and Age in Tylersburg
Sex and Age in Tylersburg
The most populous age groups in Tylersburg are 50 to 54 Years (14 | 35.0%) for men and 25 to 29 Years (16 | 28.1%) for women.
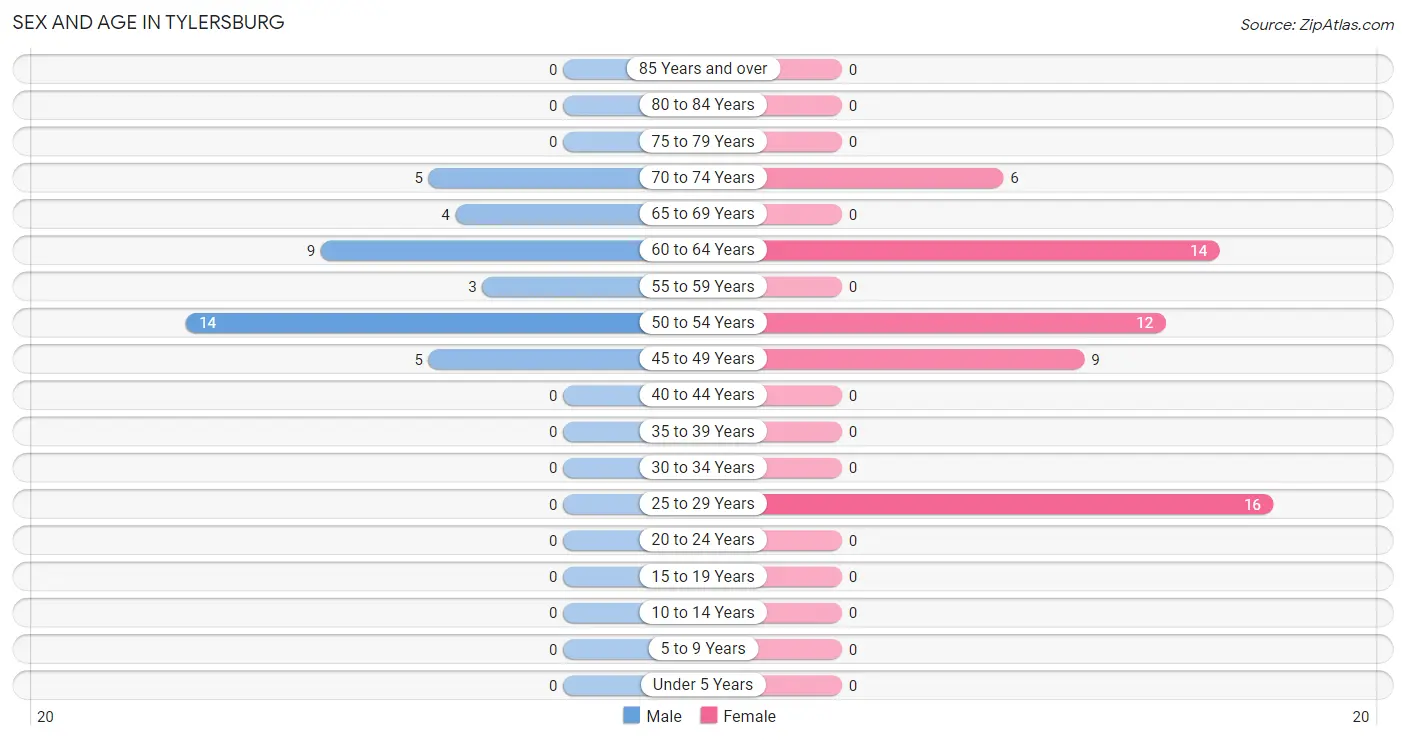
| Age Bracket | Male | Female |
| Under 5 Years | 0 (0.0%) | 0 (0.0%) |
| 5 to 9 Years | 0 (0.0%) | 0 (0.0%) |
| 10 to 14 Years | 0 (0.0%) | 0 (0.0%) |
| 15 to 19 Years | 0 (0.0%) | 0 (0.0%) |
| 20 to 24 Years | 0 (0.0%) | 0 (0.0%) |
| 25 to 29 Years | 0 (0.0%) | 16 (28.1%) |
| 30 to 34 Years | 0 (0.0%) | 0 (0.0%) |
| 35 to 39 Years | 0 (0.0%) | 0 (0.0%) |
| 40 to 44 Years | 0 (0.0%) | 0 (0.0%) |
| 45 to 49 Years | 5 (12.5%) | 9 (15.8%) |
| 50 to 54 Years | 14 (35.0%) | 12 (21.0%) |
| 55 to 59 Years | 3 (7.5%) | 0 (0.0%) |
| 60 to 64 Years | 9 (22.5%) | 14 (24.6%) |
| 65 to 69 Years | 4 (10.0%) | 0 (0.0%) |
| 70 to 74 Years | 5 (12.5%) | 6 (10.5%) |
| 75 to 79 Years | 0 (0.0%) | 0 (0.0%) |
| 80 to 84 Years | 0 (0.0%) | 0 (0.0%) |
| 85 Years and over | 0 (0.0%) | 0 (0.0%) |
| Total | 40 (100.0%) | 57 (100.0%) |
Families and Households in Tylersburg
Median Family Size in Tylersburg
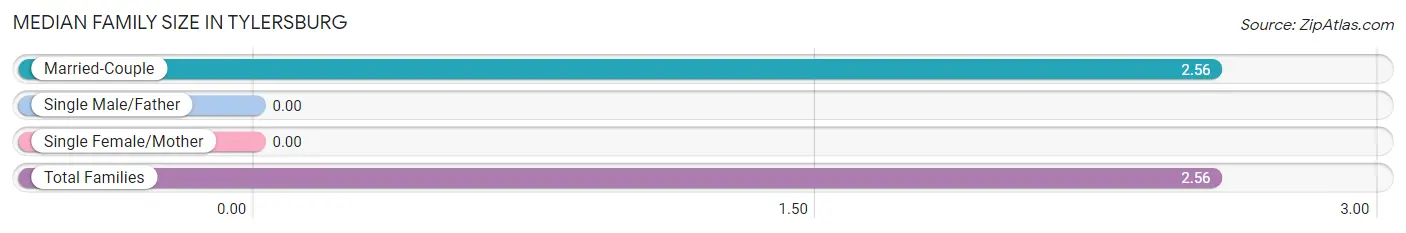
| Family Type | # Families | Family Size |
| Married-Couple | 27 (100.0%) | 2.56 |
| Single Male/Father | 0 (0.0%) | - |
| Single Female/Mother | 0 (0.0%) | - |
| Total Families | 27 (100.0%) | 2.56 |
Median Household Size in Tylersburg
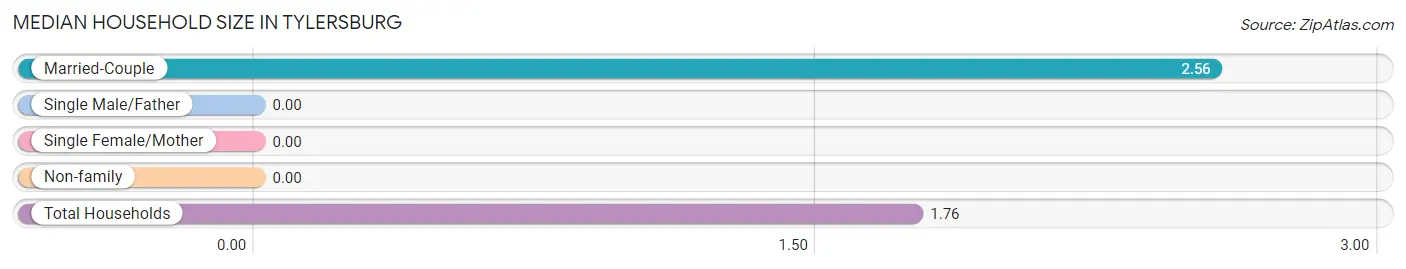
| Household Type | # Households | Household Size |
| Married-Couple | 27 (49.1%) | 2.56 |
| Single Male/Father | 0 (0.0%) | - |
| Single Female/Mother | 0 (0.0%) | - |
| Non-family | 28 (50.9%) | - |
| Total Households | 55 (100.0%) | 1.76 |
Household Size by Marriage Status in Tylersburg
Out of a total of 55 households in Tylersburg, 27 (49.1%) are family households, while 28 (50.9%) are nonfamily households. The most numerous type of family households are 3-person households, comprising 14, and the most common type of nonfamily households are 1-person households, comprising 28.
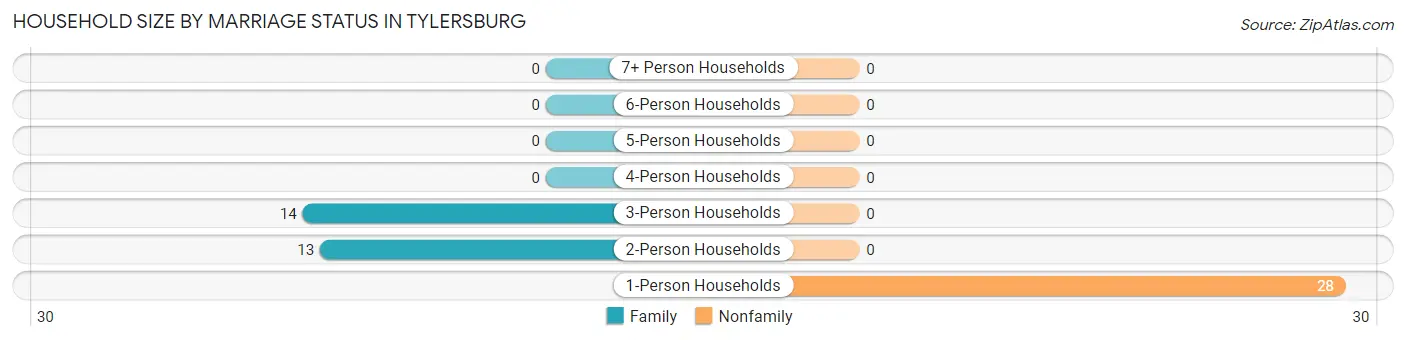
| Household Size | Family Households | Nonfamily Households |
| 1-Person Households | - | 28 (50.9%) |
| 2-Person Households | 13 (23.6%) | 0 (0.0%) |
| 3-Person Households | 14 (25.5%) | 0 (0.0%) |
| 4-Person Households | 0 (0.0%) | 0 (0.0%) |
| 5-Person Households | 0 (0.0%) | 0 (0.0%) |
| 6-Person Households | 0 (0.0%) | 0 (0.0%) |
| 7+ Person Households | 0 (0.0%) | 0 (0.0%) |
| Total | 27 (49.1%) | 28 (50.9%) |
Female Fertility in Tylersburg
Fertility by Age in Tylersburg
| Age Bracket | Women with Births | Births / 1,000 Women |
| 15 to 19 years | 0 (0.0%) | 0.0 |
| 20 to 34 years | 0 (0.0%) | 0.0 |
| 35 to 50 years | 0 (0.0%) | 0.0 |
| Total | 0 (0.0%) | 0.0 |
Fertility by Age by Marriage Status in Tylersburg
| Age Bracket | Married | Unmarried |
| 15 to 19 years | 0 (0.0%) | 0 (0.0%) |
| 20 to 34 years | 0 (0.0%) | 0 (0.0%) |
| 35 to 50 years | 0 (0.0%) | 0 (0.0%) |
| Total | 0 (0.0%) | 0 (0.0%) |
Fertility by Education in Tylersburg
| Educational Attainment | Women with Births | Births / 1,000 Women |
| Less than High School | 0 (0.0%) | 0.0 |
| High School Diploma | 0 (0.0%) | 0.0 |
| College or Associate's Degree | 0 (0.0%) | 0.0 |
| Bachelor's Degree | 0 (0.0%) | 0.0 |
| Graduate Degree | 0 (0.0%) | 0.0 |
| Total | 0 (0.0%) | 0.0 |
Fertility by Education by Marriage Status in Tylersburg
| Educational Attainment | Married | Unmarried |
| Less than High School | 0 (0.0%) | 0 (0.0%) |
| High School Diploma | 0 (0.0%) | 0 (0.0%) |
| College or Associate's Degree | 0 (0.0%) | 0 (0.0%) |
| Bachelor's Degree | 0 (0.0%) | 0 (0.0%) |
| Graduate Degree | 0 (0.0%) | 0 (0.0%) |
| Total | 0 (0.0%) | 0 (0.0%) |
Employment Characteristics in Tylersburg
Employment by Class of Employer in Tylersburg
Among the 49 employed individuals in Tylersburg, private company employees (23 | 46.9%), state government employees (18 | 36.7%), and not-for-profit organizations (5 | 10.2%) make up the most common classes of employment.
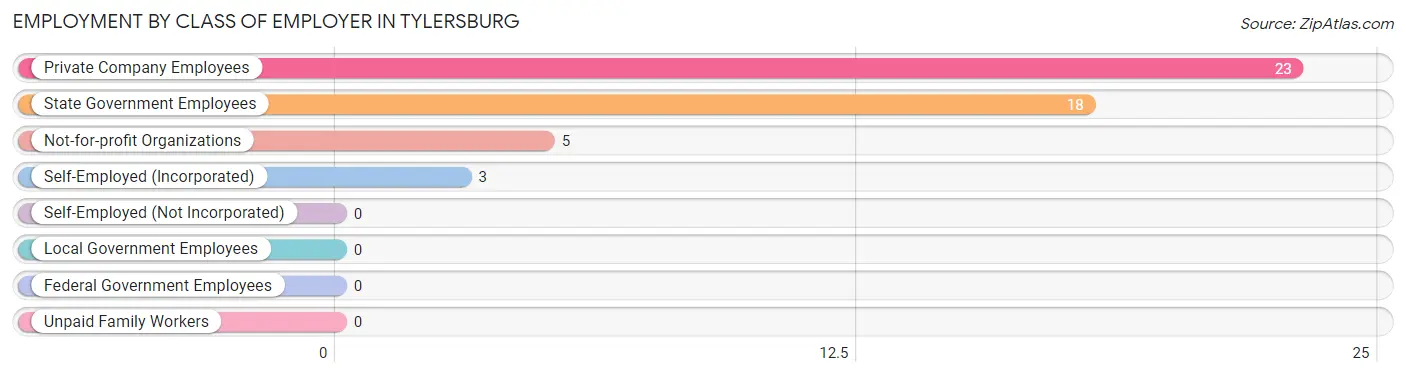
| Employer Class | # Employees | % Employees |
| Private Company Employees | 23 | 46.9% |
| Self-Employed (Incorporated) | 3 | 6.1% |
| Self-Employed (Not Incorporated) | 0 | 0.0% |
| Not-for-profit Organizations | 5 | 10.2% |
| Local Government Employees | 0 | 0.0% |
| State Government Employees | 18 | 36.7% |
| Federal Government Employees | 0 | 0.0% |
| Unpaid Family Workers | 0 | 0.0% |
| Total | 49 | 100.0% |
Employment Status by Age in Tylersburg
According to the labor force statistics for Tylersburg, out of the total population over 16 years of age (97), 69.1% or 67 individuals are in the labor force, with 7.5% or 5 of them unemployed. The age group with the highest labor force participation rate is 45 to 54 years, with 100.0% or 40 individuals in the labor force. Within the labor force, the 60 to 64 years age range has the highest percentage of unemployed individuals, with 21.7% or 5 of them being unemployed.
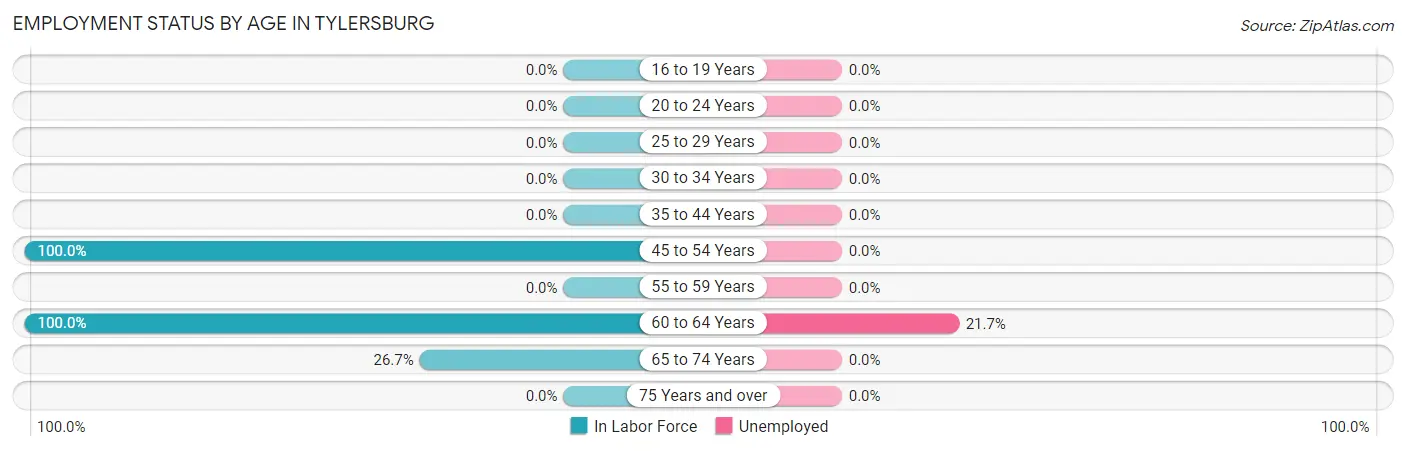
| Age Bracket | In Labor Force | Unemployed |
| 16 to 19 Years | 0 (0.0%) | 0 (0.0%) |
| 20 to 24 Years | 0 (0.0%) | 0 (0.0%) |
| 25 to 29 Years | 0 (0.0%) | 0 (0.0%) |
| 30 to 34 Years | 0 (0.0%) | 0 (0.0%) |
| 35 to 44 Years | 0 (0.0%) | 0 (0.0%) |
| 45 to 54 Years | 40 (100.0%) | 0 (0.0%) |
| 55 to 59 Years | 0 (0.0%) | 0 (0.0%) |
| 60 to 64 Years | 23 (100.0%) | 5 (21.7%) |
| 65 to 74 Years | 4 (26.7%) | 0 (0.0%) |
| 75 Years and over | 0 (0.0%) | 0 (0.0%) |
| Total | 67 (69.1%) | 5 (7.5%) |
Employment Status by Educational Attainment in Tylersburg
According to labor force statistics for Tylersburg, 76.8% of individuals (63) out of the total population between 25 and 64 years of age (82) are in the labor force, with 7.9% or 5 of them being unemployed. The group with the highest labor force participation rate are those with the educational attainment of bachelor's degree or higher, with 100.0% or 6 individuals in the labor force. Within the labor force, individuals with high school diploma education have the highest percentage of unemployment, with 9.3% or 5 of them being unemployed.
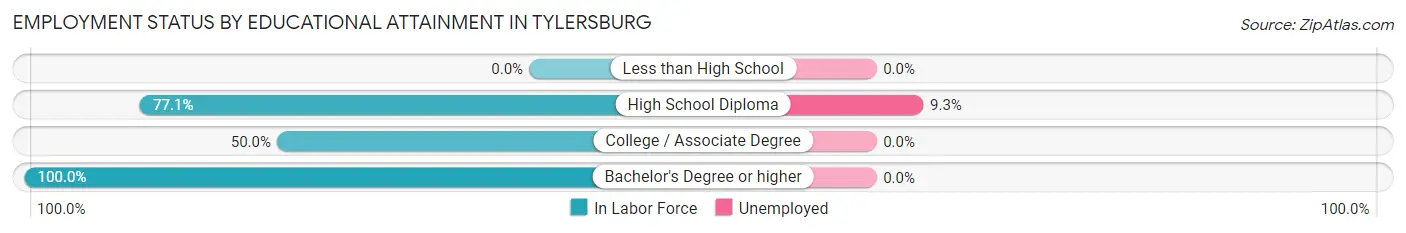
| Educational Attainment | In Labor Force | Unemployed |
| Less than High School | 0 (0.0%) | 0 (0.0%) |
| High School Diploma | 54 (77.1%) | 7 (9.3%) |
| College / Associate Degree | 3 (50.0%) | 0 (0.0%) |
| Bachelor's Degree or higher | 6 (100.0%) | 0 (0.0%) |
| Total | 63 (76.8%) | 6 (7.9%) |
Employment Occupations by Sex in Tylersburg
Management, Business, Science and Arts Occupations
The most common Management, Business, Science and Arts occupations in Tylersburg are Computers, Engineering & Science (6 | 9.7%), Life, Physical & Social Science (6 | 9.7%), and Management (3 | 4.8%).
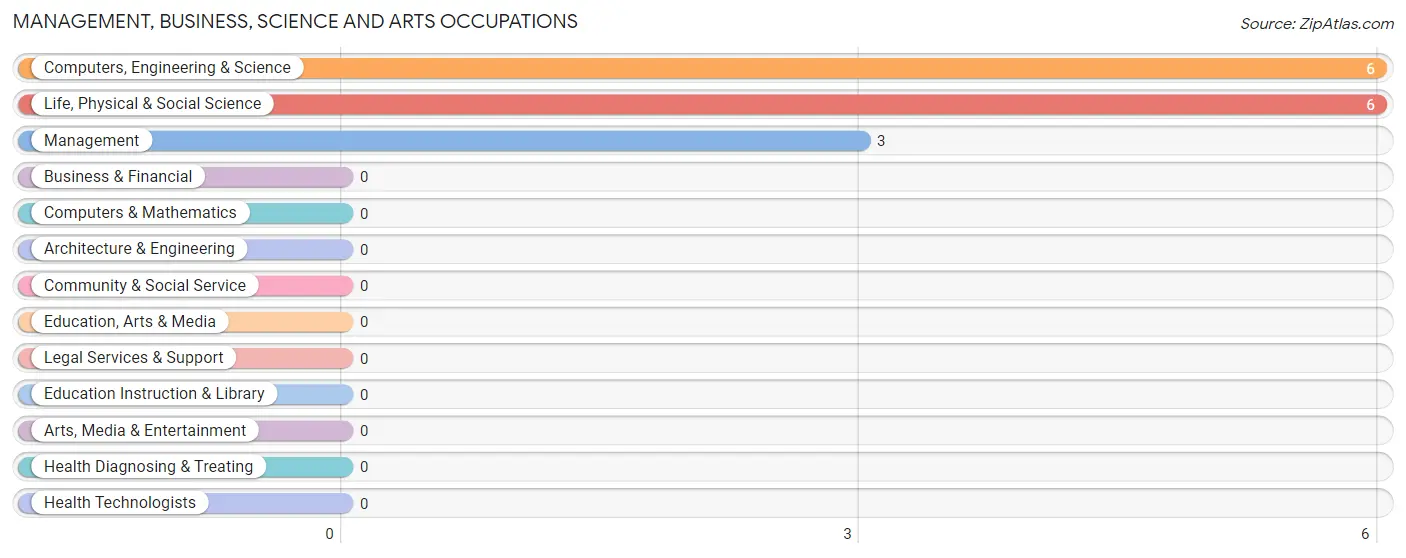
Management, Business, Science and Arts Occupations by Sex
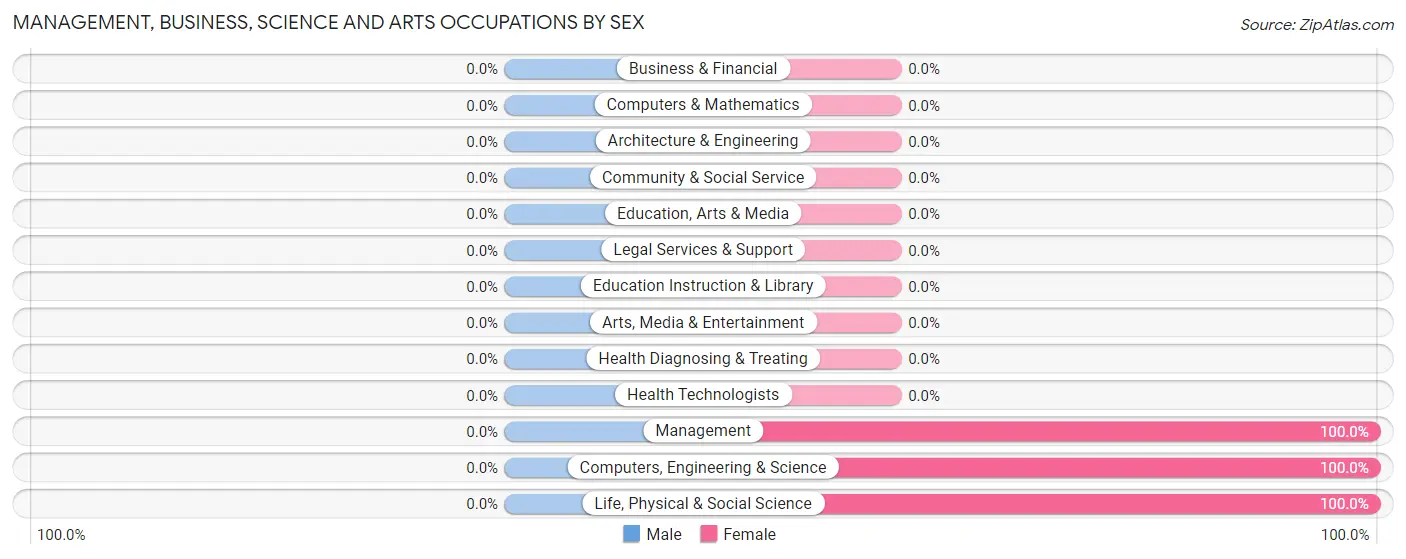
| Occupation | Male | Female |
| Management | 0 (0.0%) | 3 (100.0%) |
| Business & Financial | 0 (0.0%) | 0 (0.0%) |
| Computers, Engineering & Science | 0 (0.0%) | 6 (100.0%) |
| Computers & Mathematics | 0 (0.0%) | 0 (0.0%) |
| Architecture & Engineering | 0 (0.0%) | 0 (0.0%) |
| Life, Physical & Social Science | 0 (0.0%) | 6 (100.0%) |
| Community & Social Service | 0 (0.0%) | 0 (0.0%) |
| Education, Arts & Media | 0 (0.0%) | 0 (0.0%) |
| Legal Services & Support | 0 (0.0%) | 0 (0.0%) |
| Education Instruction & Library | 0 (0.0%) | 0 (0.0%) |
| Arts, Media & Entertainment | 0 (0.0%) | 0 (0.0%) |
| Health Diagnosing & Treating | 0 (0.0%) | 0 (0.0%) |
| Health Technologists | 0 (0.0%) | 0 (0.0%) |
| Total (Category) | 0 (0.0%) | 9 (100.0%) |
| Total (Overall) | 27 (43.5%) | 35 (56.5%) |
Services Occupations
The most common Services occupations in Tylersburg are , and Healthcare Support (12 | 19.4%).
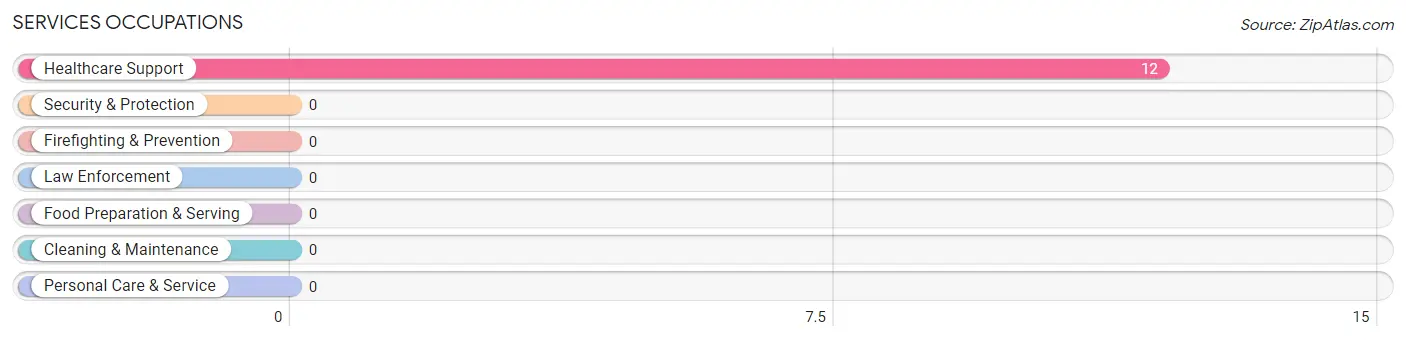
Services Occupations by Sex
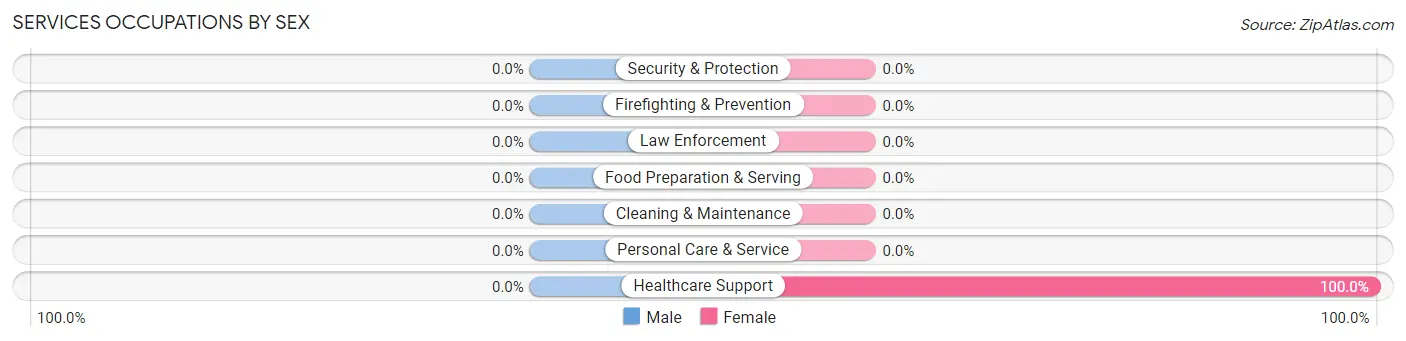
| Occupation | Male | Female |
| Healthcare Support | 0 (0.0%) | 12 (100.0%) |
| Security & Protection | 0 (0.0%) | 0 (0.0%) |
| Firefighting & Prevention | 0 (0.0%) | 0 (0.0%) |
| Law Enforcement | 0 (0.0%) | 0 (0.0%) |
| Food Preparation & Serving | 0 (0.0%) | 0 (0.0%) |
| Cleaning & Maintenance | 0 (0.0%) | 0 (0.0%) |
| Personal Care & Service | 0 (0.0%) | 0 (0.0%) |
| Total (Category) | 0 (0.0%) | 12 (100.0%) |
| Total (Overall) | 27 (43.5%) | 35 (56.5%) |
Sales and Office Occupations
The most common Sales and Office occupations in Tylersburg are , and Office & Administration (14 | 22.6%).
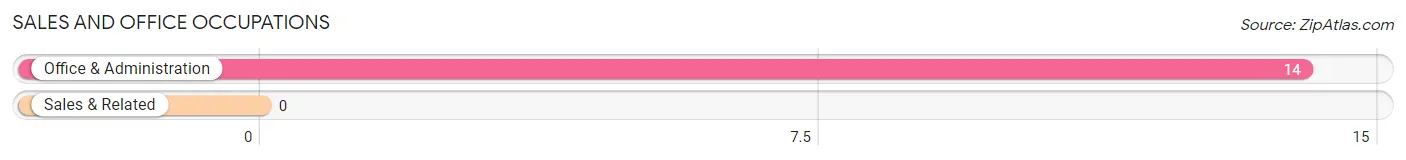
Sales and Office Occupations by Sex
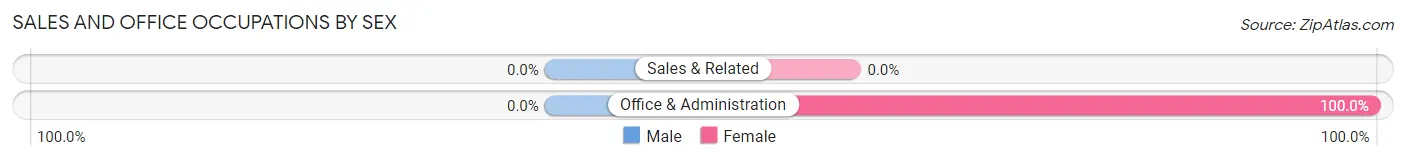
| Occupation | Male | Female |
| Sales & Related | 0 (0.0%) | 0 (0.0%) |
| Office & Administration | 0 (0.0%) | 14 (100.0%) |
| Total (Category) | 0 (0.0%) | 14 (100.0%) |
| Total (Overall) | 27 (43.5%) | 35 (56.5%) |
Natural Resources, Construction and Maintenance Occupations
The most common Natural Resources, Construction and Maintenance occupations in Tylersburg are , and Installation, Maintenance & Repair (22 | 35.5%).
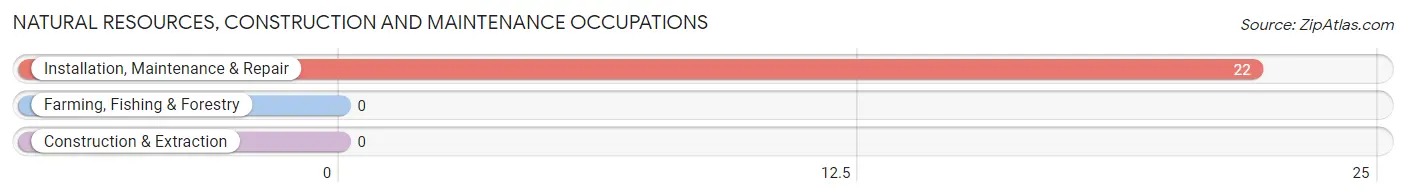
Natural Resources, Construction and Maintenance Occupations by Sex
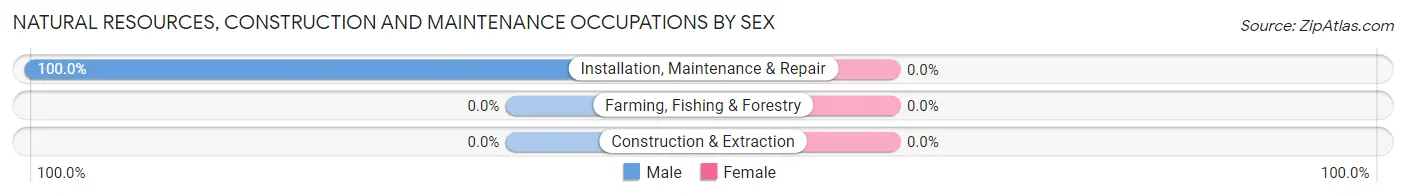
| Occupation | Male | Female |
| Farming, Fishing & Forestry | 0 (0.0%) | 0 (0.0%) |
| Construction & Extraction | 0 (0.0%) | 0 (0.0%) |
| Installation, Maintenance & Repair | 22 (100.0%) | 0 (0.0%) |
| Total (Category) | 22 (100.0%) | 0 (0.0%) |
| Total (Overall) | 27 (43.5%) | 35 (56.5%) |
Production, Transportation and Moving Occupations
The most common Production, Transportation and Moving occupations in Tylersburg are , and Production (5 | 8.1%).
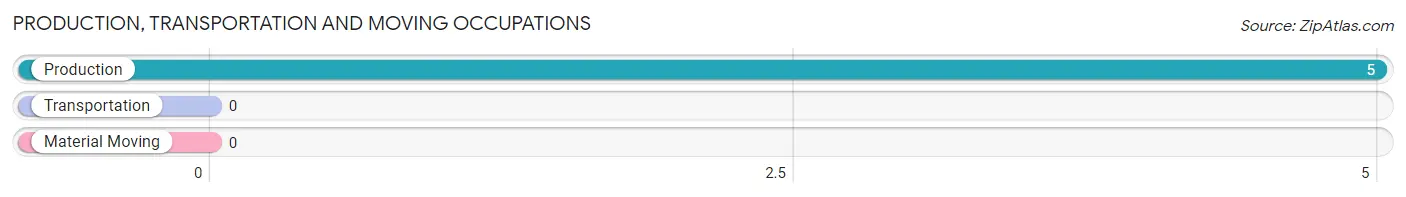
Production, Transportation and Moving Occupations by Sex
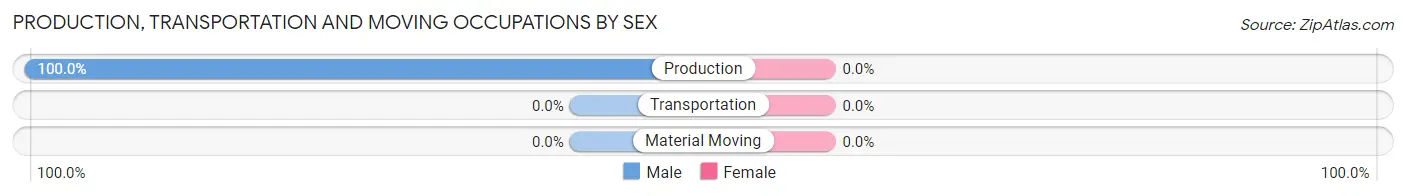
| Occupation | Male | Female |
| Production | 5 (100.0%) | 0 (0.0%) |
| Transportation | 0 (0.0%) | 0 (0.0%) |
| Material Moving | 0 (0.0%) | 0 (0.0%) |
| Total (Category) | 5 (100.0%) | 0 (0.0%) |
| Total (Overall) | 27 (43.5%) | 35 (56.5%) |
Employment Industries by Sex in Tylersburg
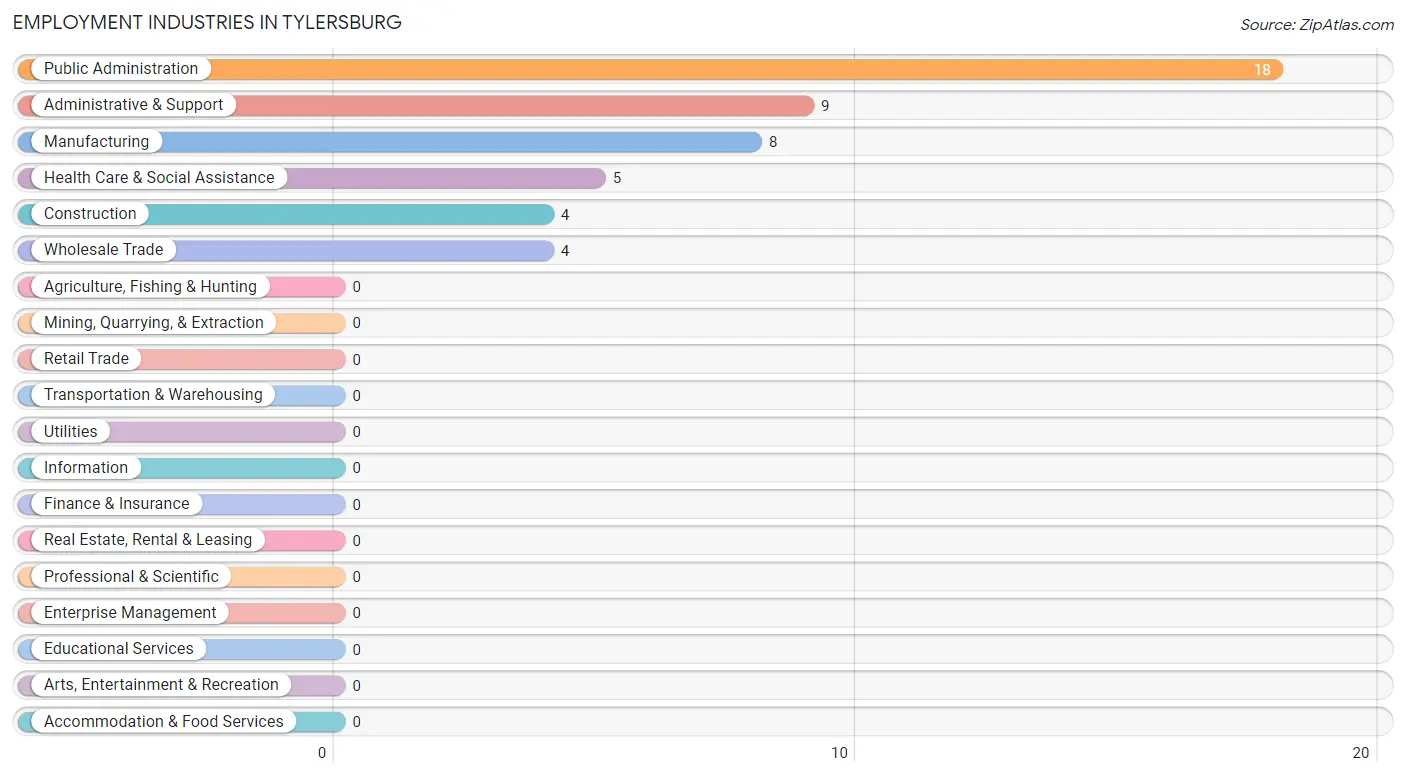
Employment Industries in Tylersburg
The major employment industries in Tylersburg include Public Administration (18 | 29.0%), Administrative & Support (9 | 14.5%), Manufacturing (8 | 12.9%), Health Care & Social Assistance (5 | 8.1%), and Construction (4 | 6.5%).
Employment Industries by Sex in Tylersburg
The Tylersburg industries that see more men than women are Construction (100.0%), Wholesale Trade (100.0%), and Manufacturing (62.5%), whereas the industries that tend to have a higher number of women are Administrative & Support (100.0%), Health Care & Social Assistance (100.0%), and Public Administration (100.0%).
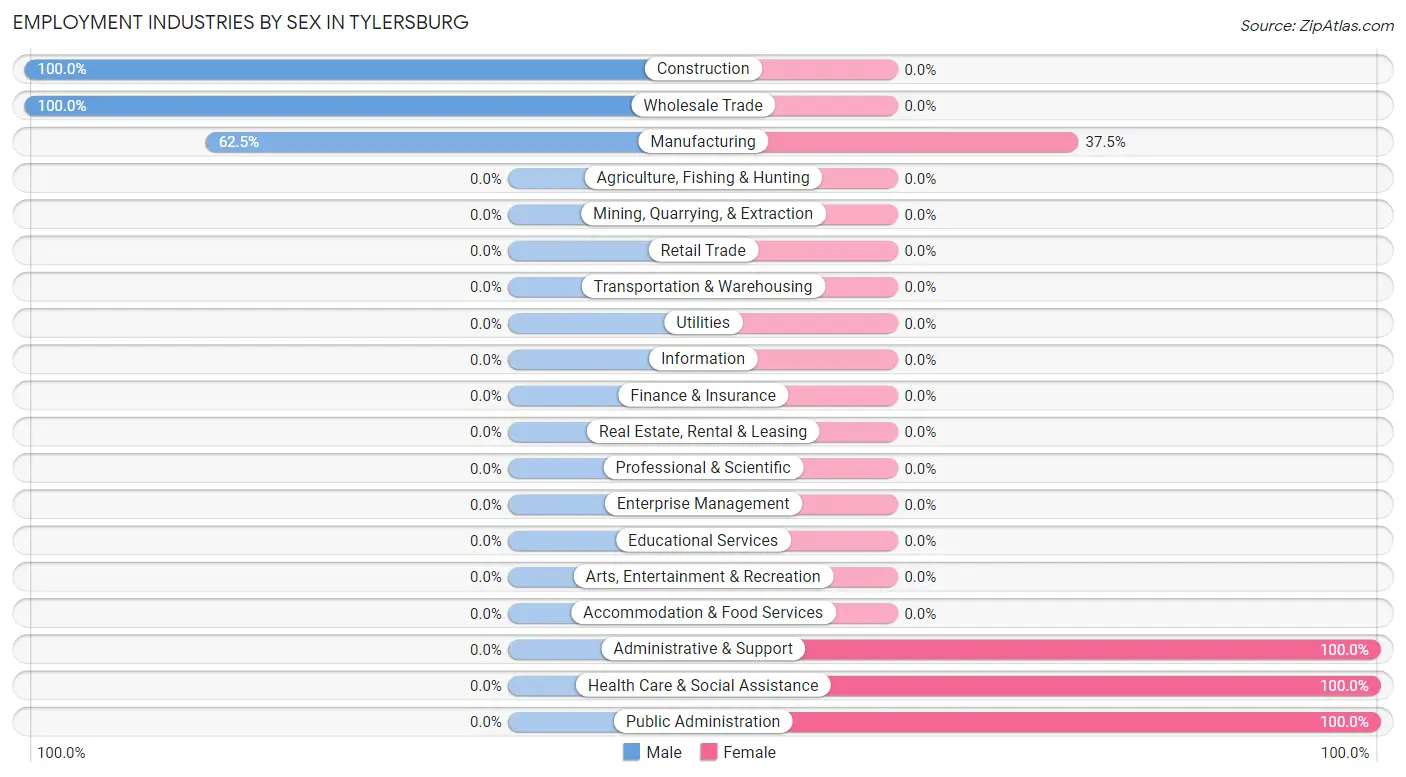
| Industry | Male | Female |
| Agriculture, Fishing & Hunting | 0 (0.0%) | 0 (0.0%) |
| Mining, Quarrying, & Extraction | 0 (0.0%) | 0 (0.0%) |
| Construction | 4 (100.0%) | 0 (0.0%) |
| Manufacturing | 5 (62.5%) | 3 (37.5%) |
| Wholesale Trade | 4 (100.0%) | 0 (0.0%) |
| Retail Trade | 0 (0.0%) | 0 (0.0%) |
| Transportation & Warehousing | 0 (0.0%) | 0 (0.0%) |
| Utilities | 0 (0.0%) | 0 (0.0%) |
| Information | 0 (0.0%) | 0 (0.0%) |
| Finance & Insurance | 0 (0.0%) | 0 (0.0%) |
| Real Estate, Rental & Leasing | 0 (0.0%) | 0 (0.0%) |
| Professional & Scientific | 0 (0.0%) | 0 (0.0%) |
| Enterprise Management | 0 (0.0%) | 0 (0.0%) |
| Administrative & Support | 0 (0.0%) | 9 (100.0%) |
| Educational Services | 0 (0.0%) | 0 (0.0%) |
| Health Care & Social Assistance | 0 (0.0%) | 5 (100.0%) |
| Arts, Entertainment & Recreation | 0 (0.0%) | 0 (0.0%) |
| Accommodation & Food Services | 0 (0.0%) | 0 (0.0%) |
| Public Administration | 0 (0.0%) | 18 (100.0%) |
| Total | 27 (43.5%) | 35 (56.5%) |
Education in Tylersburg
School Enrollment in Tylersburg
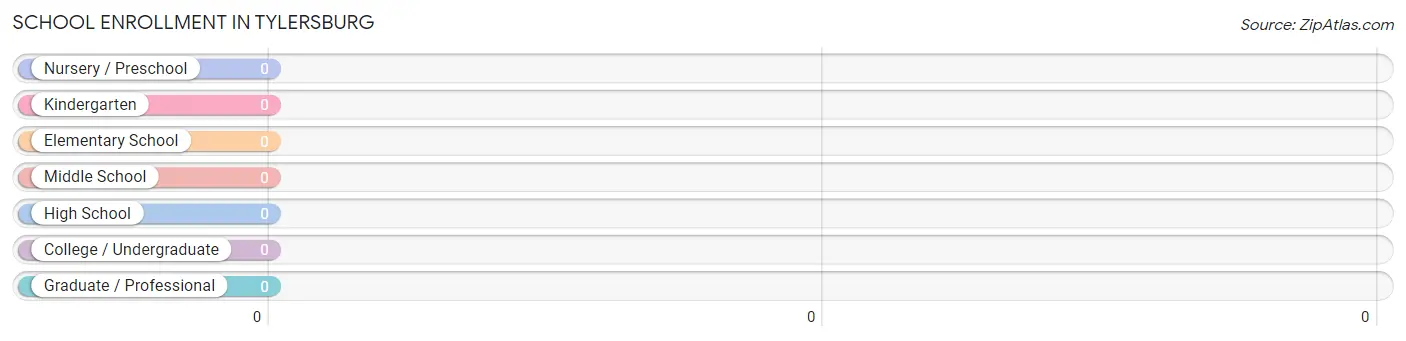
| School Level | # Students | % Students |
| Nursery / Preschool | 0 | 0.0% |
| Kindergarten | 0 | 0.0% |
| Elementary School | 0 | 0.0% |
| Middle School | 0 | 0.0% |
| High School | 0 | 0.0% |
| College / Undergraduate | 0 | 0.0% |
| Graduate / Professional | 0 | 0.0% |
| Total | 0 | 0.0% |
School Enrollment by Age by Funding Source in Tylersburg
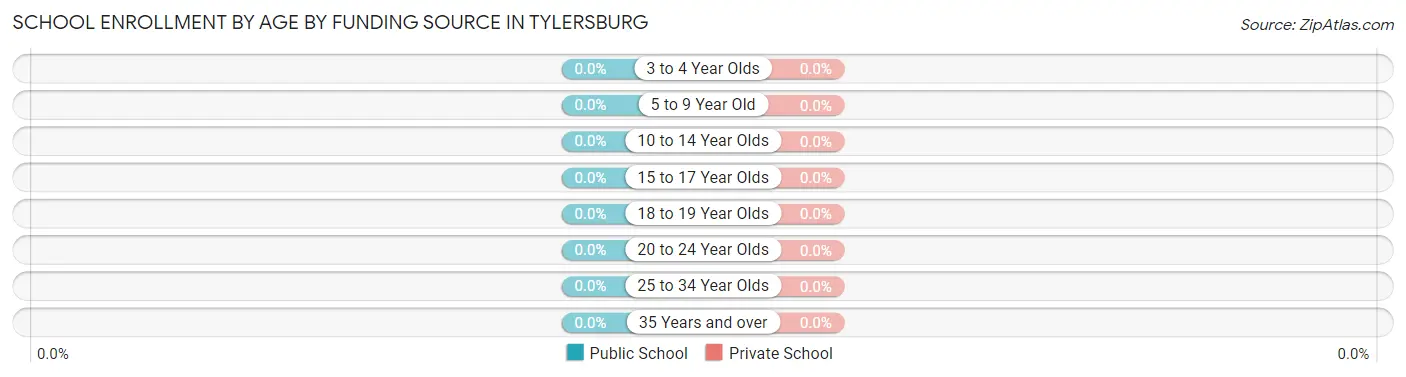
| Age Bracket | Public School | Private School |
| 3 to 4 Year Olds | 0 (0.0%) | 0 (0.0%) |
| 5 to 9 Year Old | 0 (0.0%) | 0 (0.0%) |
| 10 to 14 Year Olds | 0 (0.0%) | 0 (0.0%) |
| 15 to 17 Year Olds | 0 (0.0%) | 0 (0.0%) |
| 18 to 19 Year Olds | 0 (0.0%) | 0 (0.0%) |
| 20 to 24 Year Olds | 0 (0.0%) | 0 (0.0%) |
| 25 to 34 Year Olds | 0 (0.0%) | 0 (0.0%) |
| 35 Years and over | 0 (0.0%) | 0 (0.0%) |
| Total | 0 (0.0%) | 0 (0.0%) |
Educational Attainment by Field of Study in Tylersburg
, and communications (6 | 100.0%) are the most common fields of study among 6 individuals in Tylersburg who have obtained a bachelor's degree or higher.
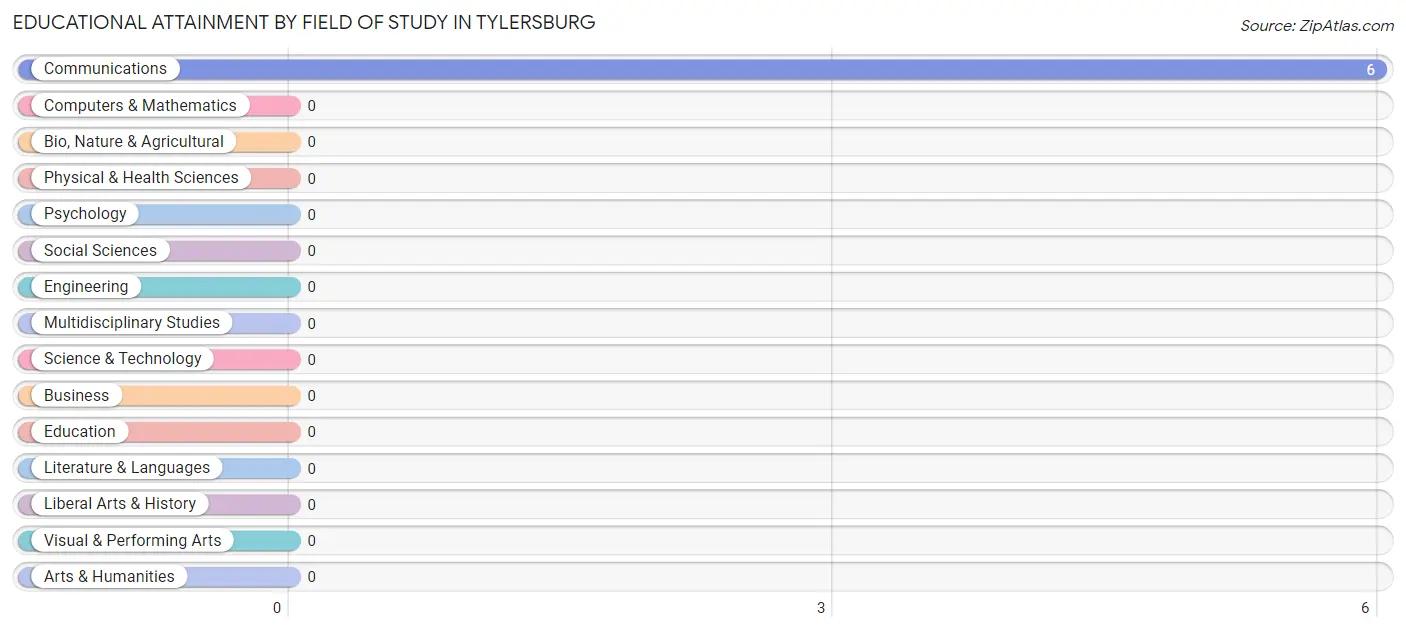
| Field of Study | # Graduates | % Graduates |
| Computers & Mathematics | 0 | 0.0% |
| Bio, Nature & Agricultural | 0 | 0.0% |
| Physical & Health Sciences | 0 | 0.0% |
| Psychology | 0 | 0.0% |
| Social Sciences | 0 | 0.0% |
| Engineering | 0 | 0.0% |
| Multidisciplinary Studies | 0 | 0.0% |
| Science & Technology | 0 | 0.0% |
| Business | 0 | 0.0% |
| Education | 0 | 0.0% |
| Literature & Languages | 0 | 0.0% |
| Liberal Arts & History | 0 | 0.0% |
| Visual & Performing Arts | 0 | 0.0% |
| Communications | 6 | 100.0% |
| Arts & Humanities | 0 | 0.0% |
| Total | 6 | 100.0% |
Transportation & Commute in Tylersburg
Vehicle Availability by Sex in Tylersburg
The most prevalent vehicle ownership categories in Tylersburg are males with 3 vehicles (19, accounting for 82.6%) and females with 3 vehicles (18, making up 73.1%).
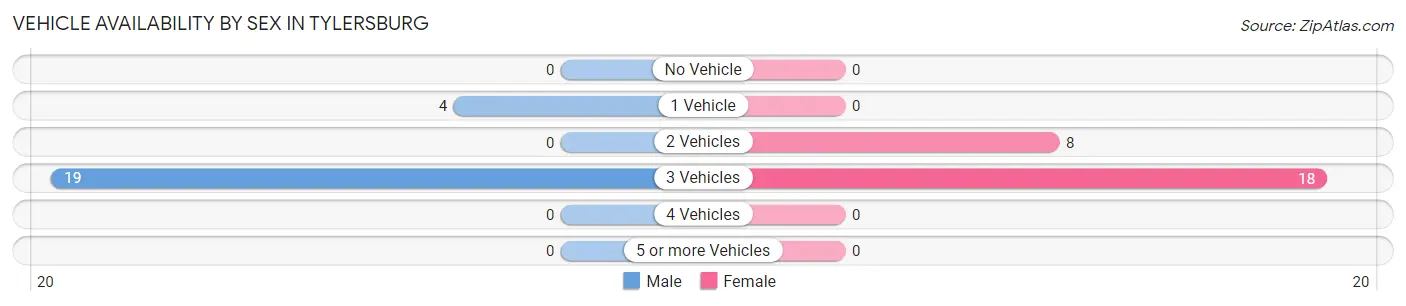
| Vehicles Available | Male | Female |
| No Vehicle | 0 (0.0%) | 0 (0.0%) |
| 1 Vehicle | 4 (17.4%) | 0 (0.0%) |
| 2 Vehicles | 0 (0.0%) | 8 (30.8%) |
| 3 Vehicles | 19 (82.6%) | 18 (69.2%) |
| 4 Vehicles | 0 (0.0%) | 0 (0.0%) |
| 5 or more Vehicles | 0 (0.0%) | 0 (0.0%) |
| Total | 23 (100.0%) | 26 (100.0%) |
Commute Time in Tylersburg
The most frequently occuring commute durations in Tylersburg are 20 to 24 minutes (26 commuters, 57.8%), 60 to 89 minutes (6 commuters, 13.3%), and 5 to 9 minutes (5 commuters, 11.1%).
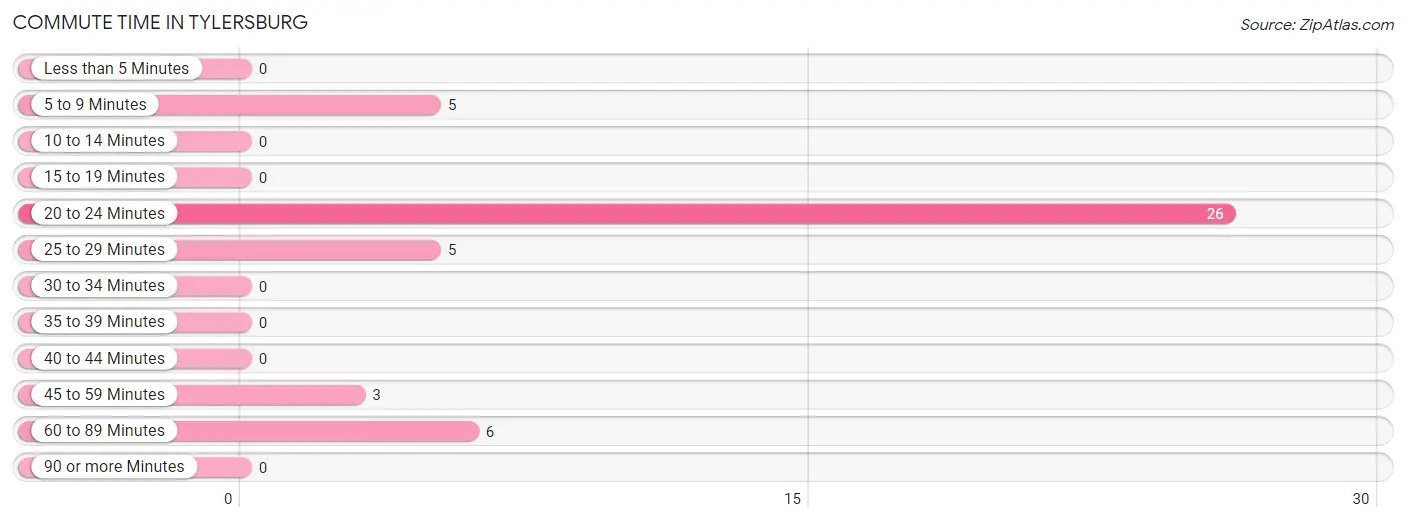
| Commute Time | # Commuters | % Commuters |
| Less than 5 Minutes | 0 | 0.0% |
| 5 to 9 Minutes | 5 | 11.1% |
| 10 to 14 Minutes | 0 | 0.0% |
| 15 to 19 Minutes | 0 | 0.0% |
| 20 to 24 Minutes | 26 | 57.8% |
| 25 to 29 Minutes | 5 | 11.1% |
| 30 to 34 Minutes | 0 | 0.0% |
| 35 to 39 Minutes | 0 | 0.0% |
| 40 to 44 Minutes | 0 | 0.0% |
| 45 to 59 Minutes | 3 | 6.7% |
| 60 to 89 Minutes | 6 | 13.3% |
| 90 or more Minutes | 0 | 0.0% |
Commute Time by Sex in Tylersburg
The most common commute times in Tylersburg are 20 to 24 minutes (14 commuters, 73.7%) for males and 20 to 24 minutes (12 commuters, 46.2%) for females.
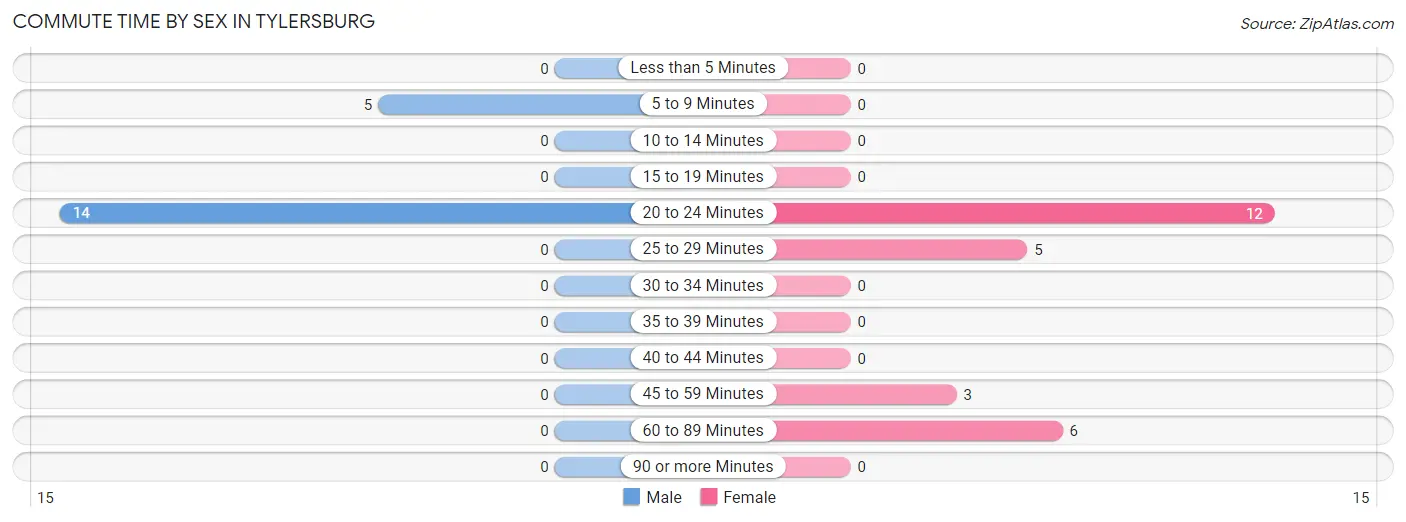
| Commute Time | Male | Female |
| Less than 5 Minutes | 0 (0.0%) | 0 (0.0%) |
| 5 to 9 Minutes | 5 (26.3%) | 0 (0.0%) |
| 10 to 14 Minutes | 0 (0.0%) | 0 (0.0%) |
| 15 to 19 Minutes | 0 (0.0%) | 0 (0.0%) |
| 20 to 24 Minutes | 14 (73.7%) | 12 (46.2%) |
| 25 to 29 Minutes | 0 (0.0%) | 5 (19.2%) |
| 30 to 34 Minutes | 0 (0.0%) | 0 (0.0%) |
| 35 to 39 Minutes | 0 (0.0%) | 0 (0.0%) |
| 40 to 44 Minutes | 0 (0.0%) | 0 (0.0%) |
| 45 to 59 Minutes | 0 (0.0%) | 3 (11.5%) |
| 60 to 89 Minutes | 0 (0.0%) | 6 (23.1%) |
| 90 or more Minutes | 0 (0.0%) | 0 (0.0%) |
Time of Departure to Work by Sex in Tylersburg
The most frequent times of departure to work in Tylersburg are 6:00 AM to 6:29 AM (19, 100.0%) for males and 12:00 PM to 3:59 PM (12, 46.2%) for females.
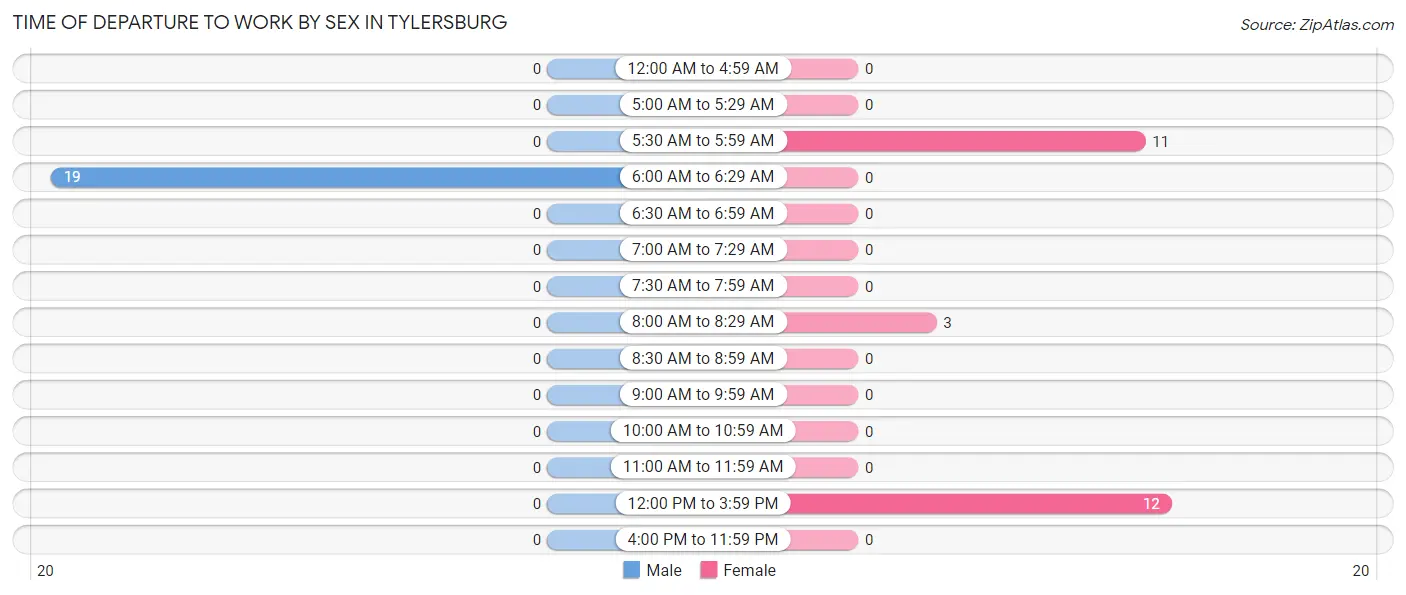
| Time of Departure | Male | Female |
| 12:00 AM to 4:59 AM | 0 (0.0%) | 0 (0.0%) |
| 5:00 AM to 5:29 AM | 0 (0.0%) | 0 (0.0%) |
| 5:30 AM to 5:59 AM | 0 (0.0%) | 11 (42.3%) |
| 6:00 AM to 6:29 AM | 19 (100.0%) | 0 (0.0%) |
| 6:30 AM to 6:59 AM | 0 (0.0%) | 0 (0.0%) |
| 7:00 AM to 7:29 AM | 0 (0.0%) | 0 (0.0%) |
| 7:30 AM to 7:59 AM | 0 (0.0%) | 0 (0.0%) |
| 8:00 AM to 8:29 AM | 0 (0.0%) | 3 (11.5%) |
| 8:30 AM to 8:59 AM | 0 (0.0%) | 0 (0.0%) |
| 9:00 AM to 9:59 AM | 0 (0.0%) | 0 (0.0%) |
| 10:00 AM to 10:59 AM | 0 (0.0%) | 0 (0.0%) |
| 11:00 AM to 11:59 AM | 0 (0.0%) | 0 (0.0%) |
| 12:00 PM to 3:59 PM | 0 (0.0%) | 12 (46.2%) |
| 4:00 PM to 11:59 PM | 0 (0.0%) | 0 (0.0%) |
| Total | 19 (100.0%) | 26 (100.0%) |
Housing Occupancy in Tylersburg
Occupancy by Ownership in Tylersburg
Of the total 55 dwellings in Tylersburg, owner-occupied units account for 49 (89.1%), while renter-occupied units make up 6 (10.9%).
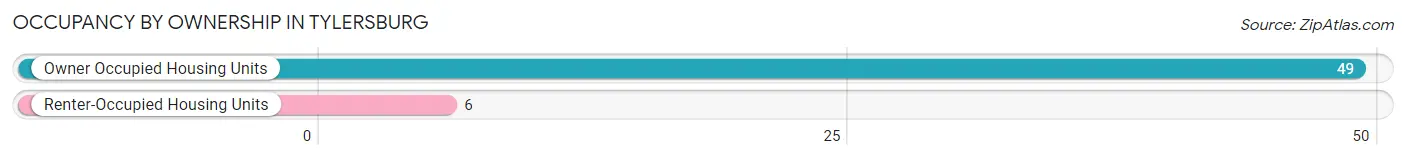
| Occupancy | # Housing Units | % Housing Units |
| Owner Occupied Housing Units | 49 | 89.1% |
| Renter-Occupied Housing Units | 6 | 10.9% |
| Total Occupied Housing Units | 55 | 100.0% |
Occupancy by Household Size in Tylersburg
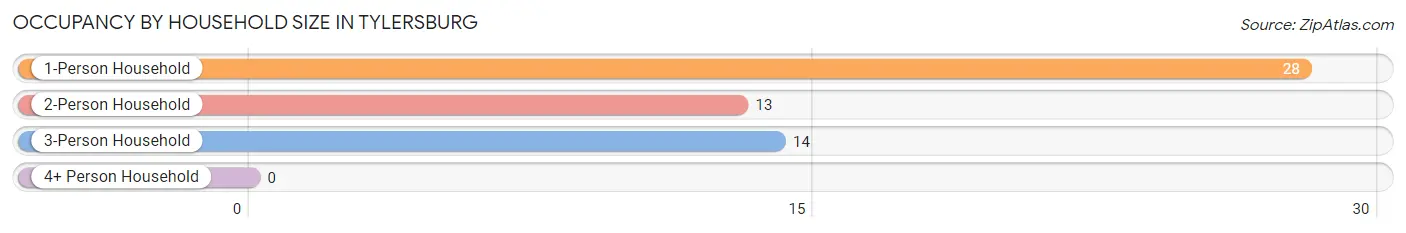
| Household Size | # Housing Units | % Housing Units |
| 1-Person Household | 28 | 50.9% |
| 2-Person Household | 13 | 23.6% |
| 3-Person Household | 14 | 25.5% |
| 4+ Person Household | 0 | 0.0% |
| Total Housing Units | 55 | 100.0% |
Occupancy by Ownership by Household Size in Tylersburg
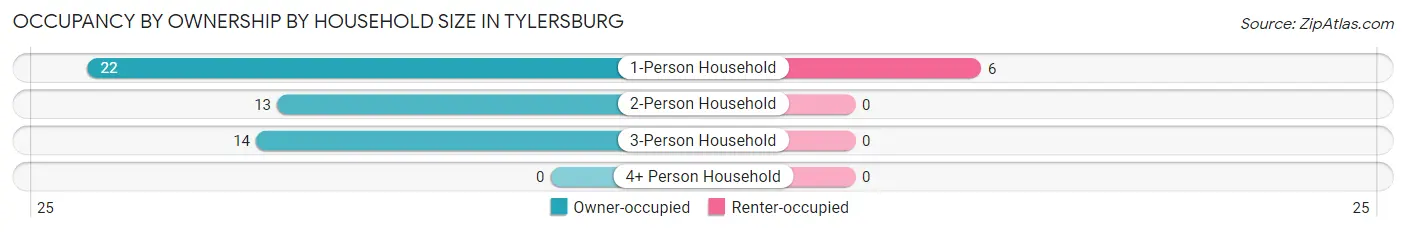
| Household Size | Owner-occupied | Renter-occupied |
| 1-Person Household | 22 (78.6%) | 6 (21.4%) |
| 2-Person Household | 13 (100.0%) | 0 (0.0%) |
| 3-Person Household | 14 (100.0%) | 0 (0.0%) |
| 4+ Person Household | 0 (0.0%) | 0 (0.0%) |
| Total Housing Units | 49 (89.1%) | 6 (10.9%) |
Occupancy by Educational Attainment in Tylersburg
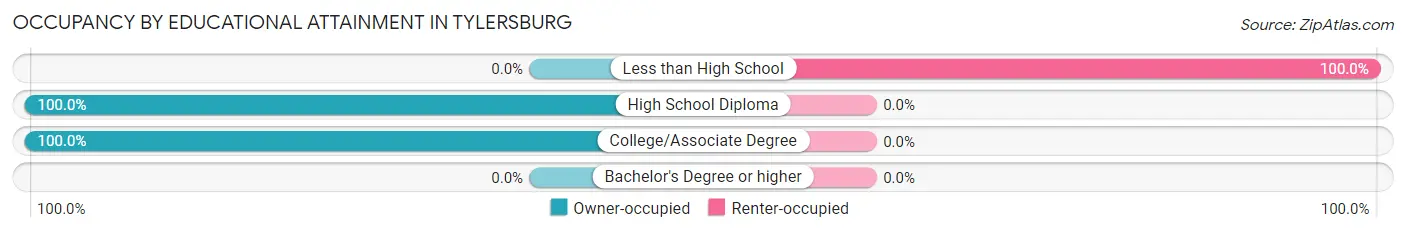
| Household Size | Owner-occupied | Renter-occupied |
| Less than High School | 0 (0.0%) | 6 (100.0%) |
| High School Diploma | 42 (100.0%) | 0 (0.0%) |
| College/Associate Degree | 7 (100.0%) | 0 (0.0%) |
| Bachelor's Degree or higher | 0 (0.0%) | 0 (0.0%) |
Occupancy by Age of Householder in Tylersburg
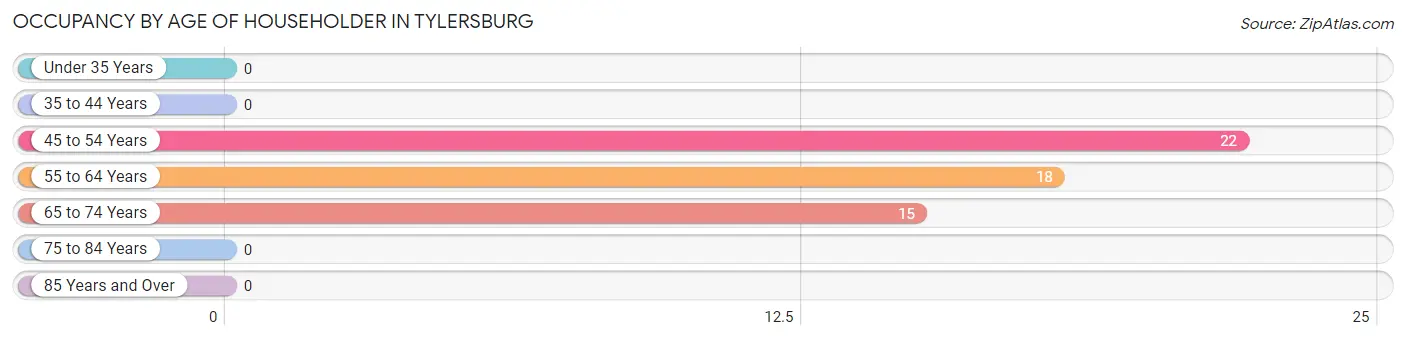
| Age Bracket | # Households | % Households |
| Under 35 Years | 0 | 0.0% |
| 35 to 44 Years | 0 | 0.0% |
| 45 to 54 Years | 22 | 40.0% |
| 55 to 64 Years | 18 | 32.7% |
| 65 to 74 Years | 15 | 27.3% |
| 75 to 84 Years | 0 | 0.0% |
| 85 Years and Over | 0 | 0.0% |
| Total | 55 | 100.0% |
Housing Finances in Tylersburg
Median Income by Occupancy in Tylersburg
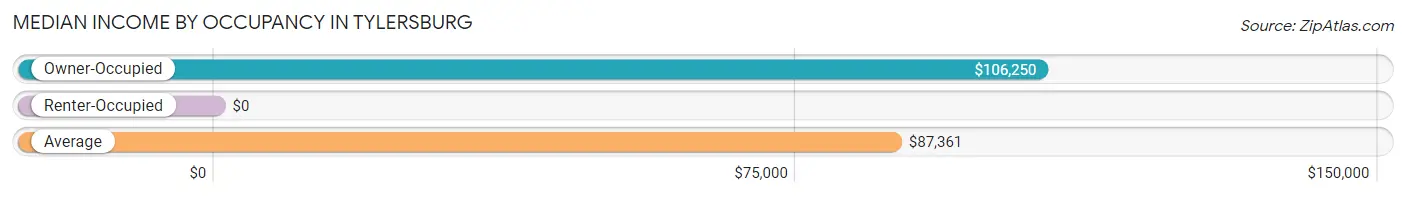
| Occupancy Type | # Households | Median Income |
| Owner-Occupied | 49 (89.1%) | $106,250 |
| Renter-Occupied | 6 (10.9%) | $0 |
| Average | 55 (100.0%) | $87,361 |
Occupancy by Householder Income Bracket in Tylersburg
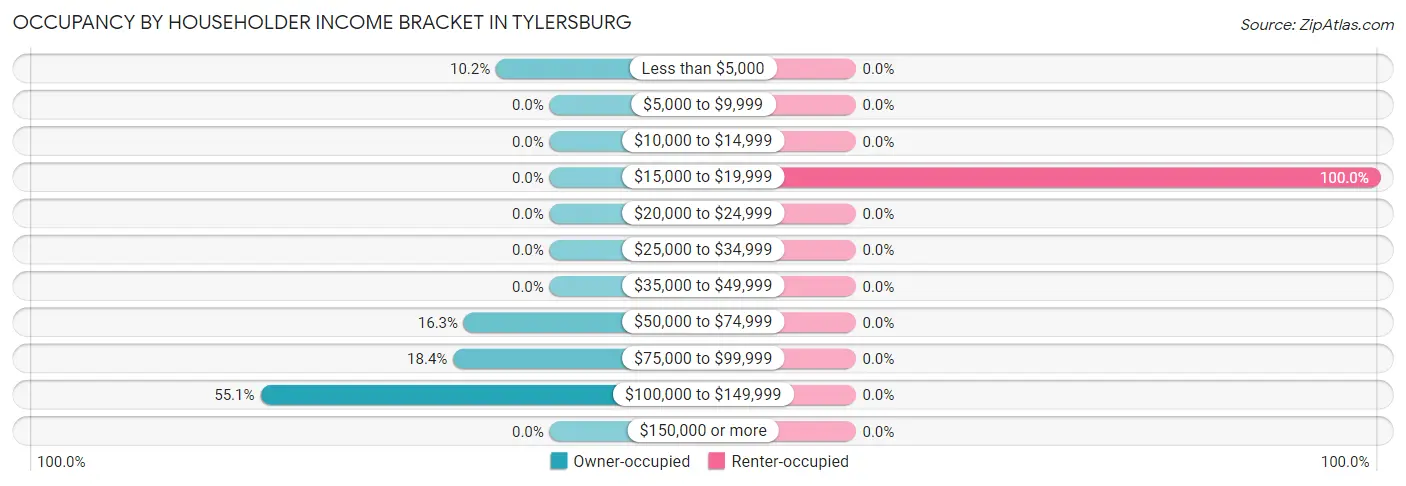
| Income Bracket | Owner-occupied | Renter-occupied |
| Less than $5,000 | 5 (10.2%) | 0 (0.0%) |
| $5,000 to $9,999 | 0 (0.0%) | 0 (0.0%) |
| $10,000 to $14,999 | 0 (0.0%) | 0 (0.0%) |
| $15,000 to $19,999 | 0 (0.0%) | 6 (100.0%) |
| $20,000 to $24,999 | 0 (0.0%) | 0 (0.0%) |
| $25,000 to $34,999 | 0 (0.0%) | 0 (0.0%) |
| $35,000 to $49,999 | 0 (0.0%) | 0 (0.0%) |
| $50,000 to $74,999 | 8 (16.3%) | 0 (0.0%) |
| $75,000 to $99,999 | 9 (18.4%) | 0 (0.0%) |
| $100,000 to $149,999 | 27 (55.1%) | 0 (0.0%) |
| $150,000 or more | 0 (0.0%) | 0 (0.0%) |
| Total | 49 (100.0%) | 6 (100.0%) |
Monthly Housing Cost Tiers in Tylersburg
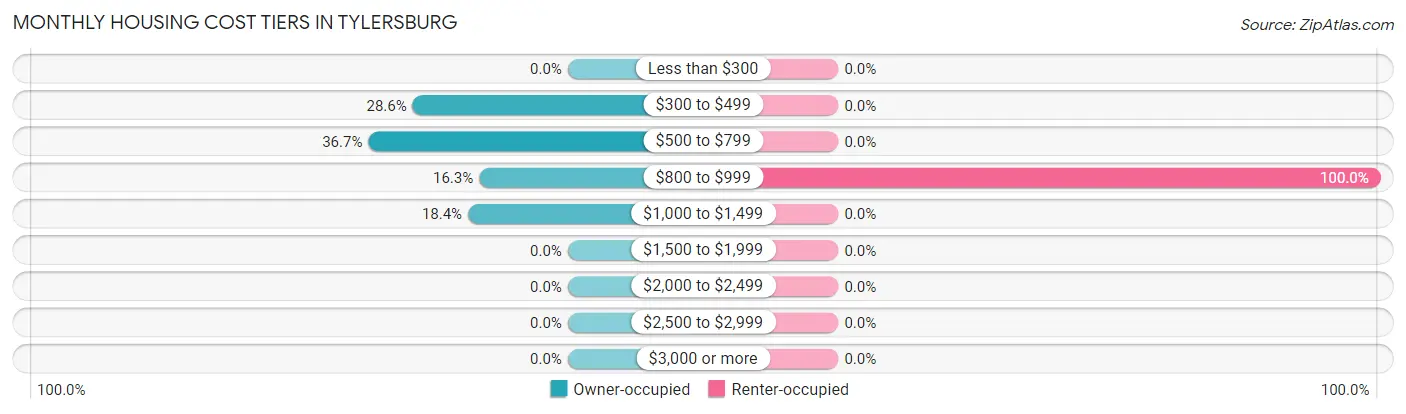
| Monthly Cost | Owner-occupied | Renter-occupied |
| Less than $300 | 0 (0.0%) | 0 (0.0%) |
| $300 to $499 | 14 (28.6%) | 0 (0.0%) |
| $500 to $799 | 18 (36.7%) | 0 (0.0%) |
| $800 to $999 | 8 (16.3%) | 6 (100.0%) |
| $1,000 to $1,499 | 9 (18.4%) | 0 (0.0%) |
| $1,500 to $1,999 | 0 (0.0%) | 0 (0.0%) |
| $2,000 to $2,499 | 0 (0.0%) | 0 (0.0%) |
| $2,500 to $2,999 | 0 (0.0%) | 0 (0.0%) |
| $3,000 or more | 0 (0.0%) | 0 (0.0%) |
| Total | 49 (100.0%) | 6 (100.0%) |
Physical Housing Characteristics in Tylersburg
Housing Structures in Tylersburg
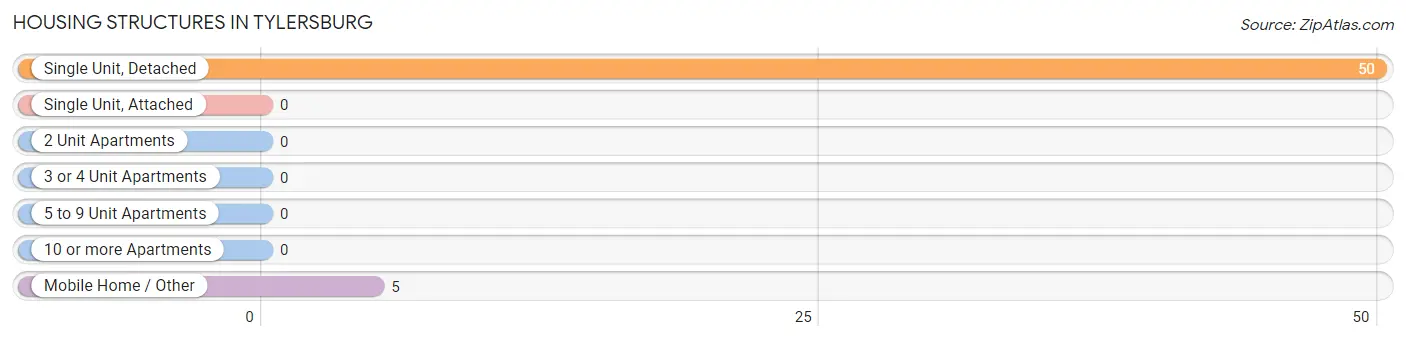
| Structure Type | # Housing Units | % Housing Units |
| Single Unit, Detached | 50 | 90.9% |
| Single Unit, Attached | 0 | 0.0% |
| 2 Unit Apartments | 0 | 0.0% |
| 3 or 4 Unit Apartments | 0 | 0.0% |
| 5 to 9 Unit Apartments | 0 | 0.0% |
| 10 or more Apartments | 0 | 0.0% |
| Mobile Home / Other | 5 | 9.1% |
| Total | 55 | 100.0% |
Housing Structures by Occupancy in Tylersburg
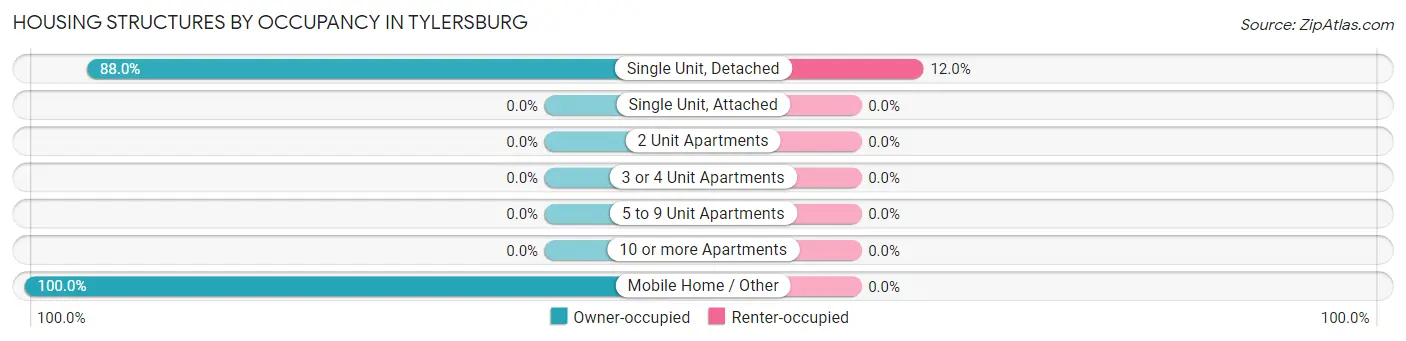
| Structure Type | Owner-occupied | Renter-occupied |
| Single Unit, Detached | 44 (88.0%) | 6 (12.0%) |
| Single Unit, Attached | 0 (0.0%) | 0 (0.0%) |
| 2 Unit Apartments | 0 (0.0%) | 0 (0.0%) |
| 3 or 4 Unit Apartments | 0 (0.0%) | 0 (0.0%) |
| 5 to 9 Unit Apartments | 0 (0.0%) | 0 (0.0%) |
| 10 or more Apartments | 0 (0.0%) | 0 (0.0%) |
| Mobile Home / Other | 5 (100.0%) | 0 (0.0%) |
| Total | 49 (89.1%) | 6 (10.9%) |
Housing Structures by Number of Rooms in Tylersburg
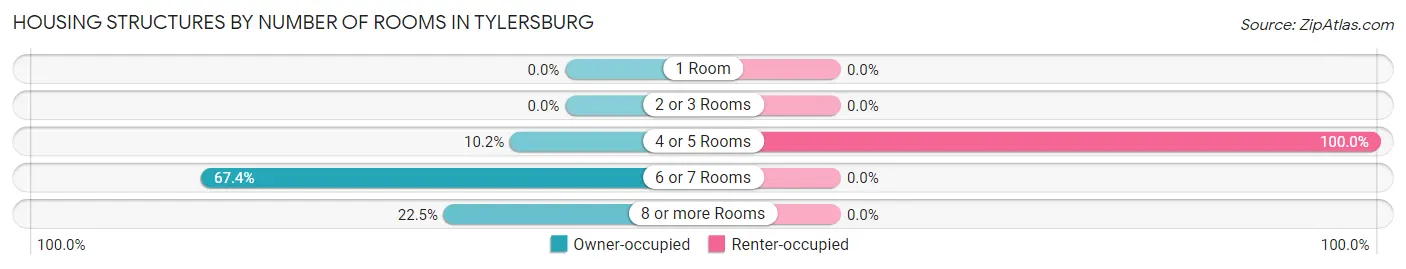
| Number of Rooms | Owner-occupied | Renter-occupied |
| 1 Room | 0 (0.0%) | 0 (0.0%) |
| 2 or 3 Rooms | 0 (0.0%) | 0 (0.0%) |
| 4 or 5 Rooms | 5 (10.2%) | 6 (100.0%) |
| 6 or 7 Rooms | 33 (67.3%) | 0 (0.0%) |
| 8 or more Rooms | 11 (22.5%) | 0 (0.0%) |
| Total | 49 (100.0%) | 6 (100.0%) |
Housing Structure by Heating Type in Tylersburg
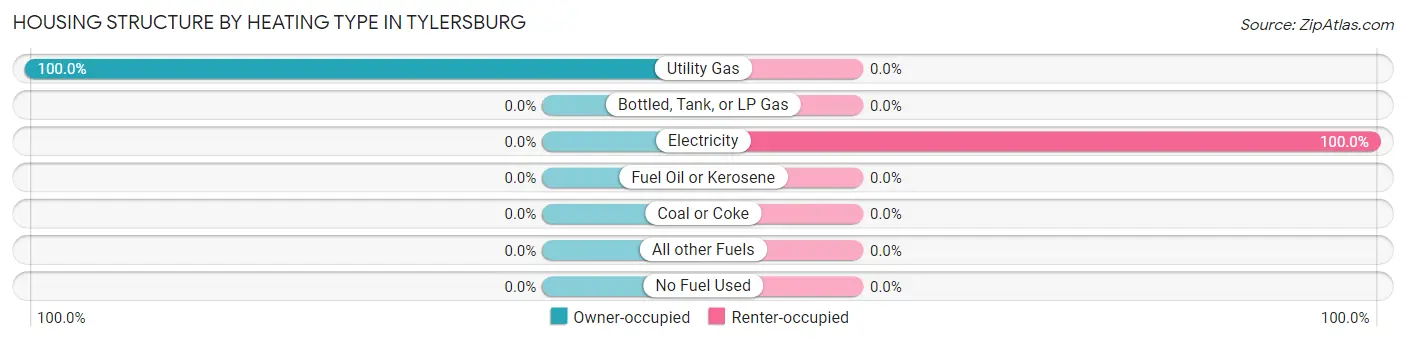
| Heating Type | Owner-occupied | Renter-occupied |
| Utility Gas | 49 (100.0%) | 0 (0.0%) |
| Bottled, Tank, or LP Gas | 0 (0.0%) | 0 (0.0%) |
| Electricity | 0 (0.0%) | 6 (100.0%) |
| Fuel Oil or Kerosene | 0 (0.0%) | 0 (0.0%) |
| Coal or Coke | 0 (0.0%) | 0 (0.0%) |
| All other Fuels | 0 (0.0%) | 0 (0.0%) |
| No Fuel Used | 0 (0.0%) | 0 (0.0%) |
| Total | 49 (100.0%) | 6 (100.0%) |
Household Vehicle Usage in Tylersburg
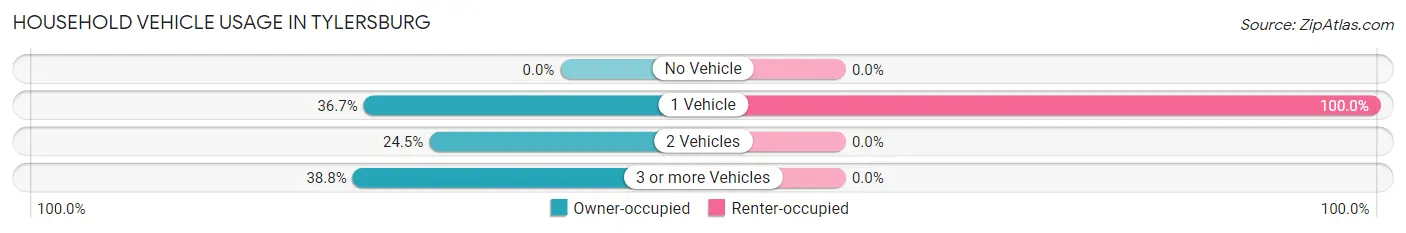
| Vehicles per Household | Owner-occupied | Renter-occupied |
| No Vehicle | 0 (0.0%) | 0 (0.0%) |
| 1 Vehicle | 18 (36.7%) | 6 (100.0%) |
| 2 Vehicles | 12 (24.5%) | 0 (0.0%) |
| 3 or more Vehicles | 19 (38.8%) | 0 (0.0%) |
| Total | 49 (100.0%) | 6 (100.0%) |
Real Estate & Mortgages in Tylersburg
Real Estate and Mortgage Overview in Tylersburg
| Characteristic | Without Mortgage | With Mortgage |
| Housing Units | 30 | 19 |
| Median Property Value | - | - |
| Median Household Income | $118,750 | $0 |
| Monthly Housing Costs | $633 | $0 |
| Real Estate Taxes | $1,239 | $0 |
Property Value by Mortgage Status in Tylersburg
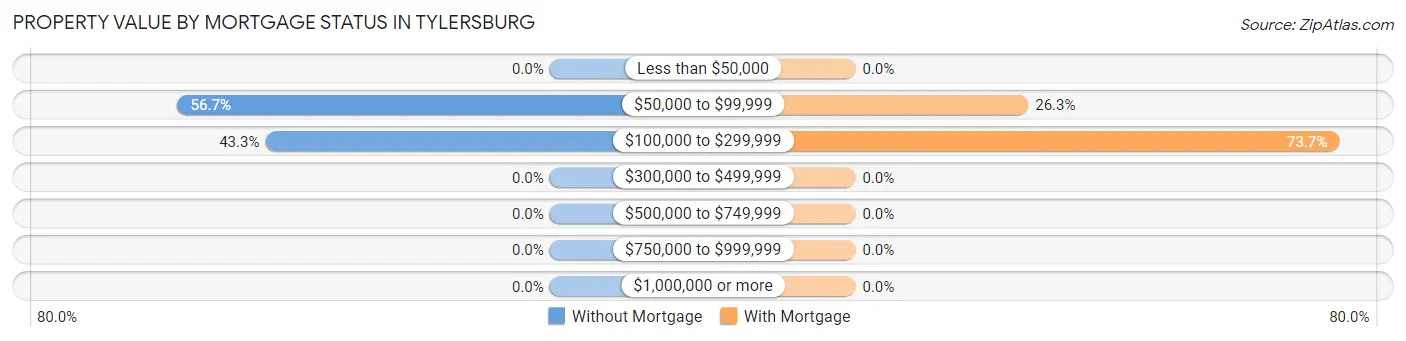
| Property Value | Without Mortgage | With Mortgage |
| Less than $50,000 | 0 (0.0%) | 0 (0.0%) |
| $50,000 to $99,999 | 17 (56.7%) | 5 (26.3%) |
| $100,000 to $299,999 | 13 (43.3%) | 14 (73.7%) |
| $300,000 to $499,999 | 0 (0.0%) | 0 (0.0%) |
| $500,000 to $749,999 | 0 (0.0%) | 0 (0.0%) |
| $750,000 to $999,999 | 0 (0.0%) | 0 (0.0%) |
| $1,000,000 or more | 0 (0.0%) | 0 (0.0%) |
| Total | 30 (100.0%) | 19 (100.0%) |
Household Income by Mortgage Status in Tylersburg
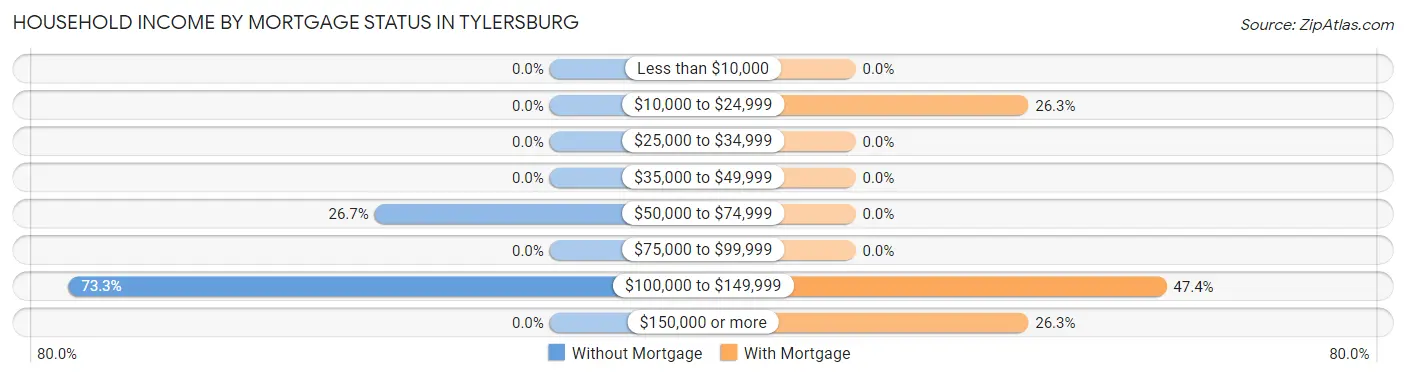
| Household Income | Without Mortgage | With Mortgage |
| Less than $10,000 | 0 (0.0%) | 0 (0.0%) |
| $10,000 to $24,999 | 0 (0.0%) | 5 (26.3%) |
| $25,000 to $34,999 | 0 (0.0%) | 0 (0.0%) |
| $35,000 to $49,999 | 0 (0.0%) | 0 (0.0%) |
| $50,000 to $74,999 | 8 (26.7%) | 0 (0.0%) |
| $75,000 to $99,999 | 0 (0.0%) | 0 (0.0%) |
| $100,000 to $149,999 | 22 (73.3%) | 9 (47.4%) |
| $150,000 or more | 0 (0.0%) | 5 (26.3%) |
| Total | 30 (100.0%) | 19 (100.0%) |
Property Value to Household Income Ratio in Tylersburg
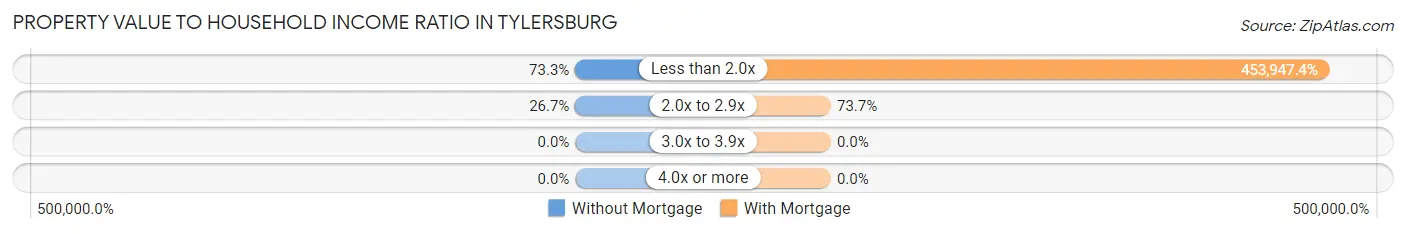
| Value-to-Income Ratio | Without Mortgage | With Mortgage |
| Less than 2.0x | 22 (73.3%) | 86,250 (453,947.4%) |
| 2.0x to 2.9x | 8 (26.7%) | 14 (73.7%) |
| 3.0x to 3.9x | 0 (0.0%) | 0 (0.0%) |
| 4.0x or more | 0 (0.0%) | 0 (0.0%) |
| Total | 30 (100.0%) | 19 (100.0%) |
Real Estate Taxes by Mortgage Status in Tylersburg
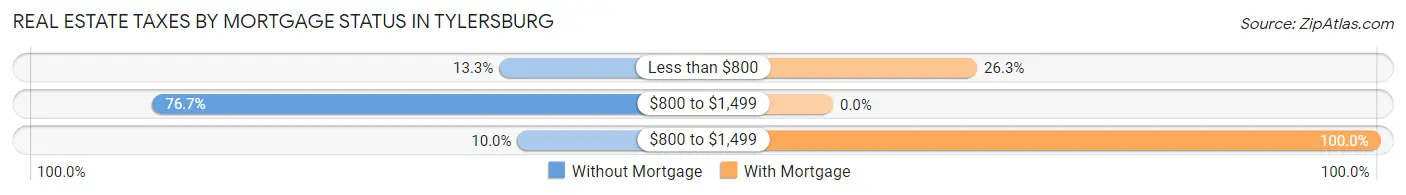
| Property Taxes | Without Mortgage | With Mortgage |
| Less than $800 | 4 (13.3%) | 5 (26.3%) |
| $800 to $1,499 | 23 (76.7%) | 0 (0.0%) |
| $800 to $1,499 | 3 (10.0%) | 19 (100.0%) |
| Total | 30 (100.0%) | 19 (100.0%) |
Health & Disability in Tylersburg
Health Insurance Coverage by Age in Tylersburg
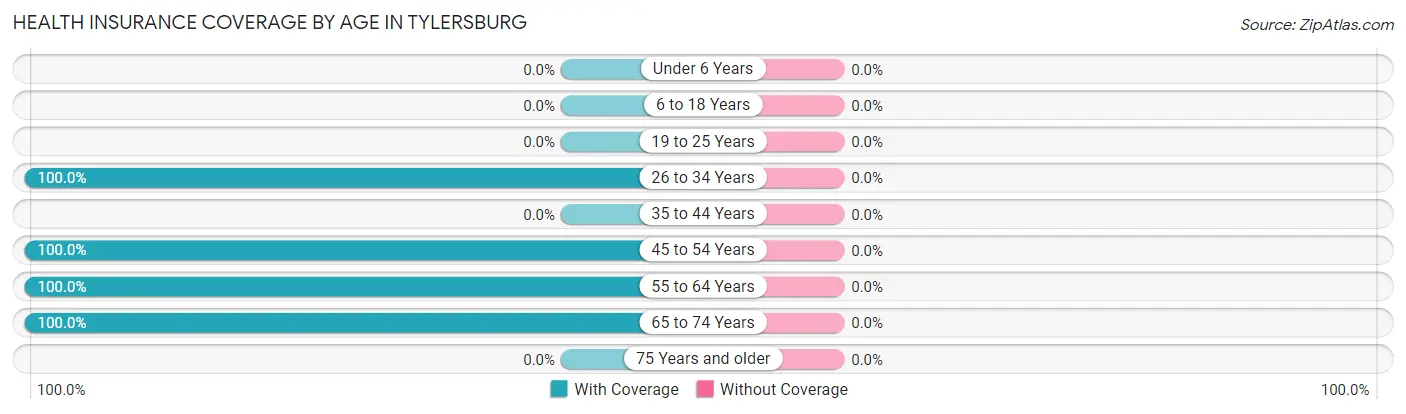
| Age Bracket | With Coverage | Without Coverage |
| Under 6 Years | 0 (0.0%) | 0 (0.0%) |
| 6 to 18 Years | 0 (0.0%) | 0 (0.0%) |
| 19 to 25 Years | 0 (0.0%) | 0 (0.0%) |
| 26 to 34 Years | 16 (100.0%) | 0 (0.0%) |
| 35 to 44 Years | 0 (0.0%) | 0 (0.0%) |
| 45 to 54 Years | 40 (100.0%) | 0 (0.0%) |
| 55 to 64 Years | 26 (100.0%) | 0 (0.0%) |
| 65 to 74 Years | 15 (100.0%) | 0 (0.0%) |
| 75 Years and older | 0 (0.0%) | 0 (0.0%) |
| Total | 97 (100.0%) | 0 (0.0%) |
Health Insurance Coverage by Citizenship Status in Tylersburg
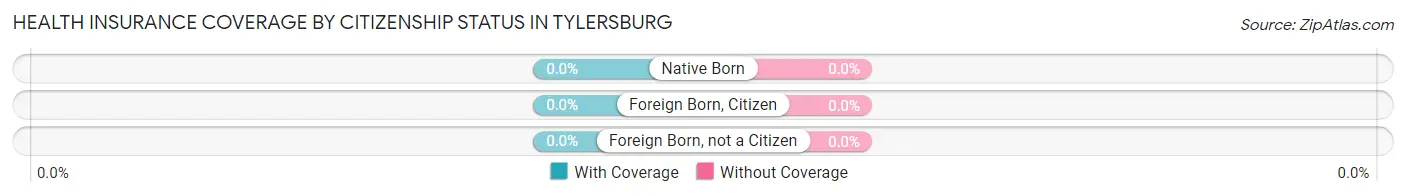
| Citizenship Status | With Coverage | Without Coverage |
| Native Born | 0 (0.0%) | 0 (0.0%) |
| Foreign Born, Citizen | 0 (0.0%) | 0 (0.0%) |
| Foreign Born, not a Citizen | 0 (0.0%) | 0 (0.0%) |
Health Insurance Coverage by Household Income in Tylersburg
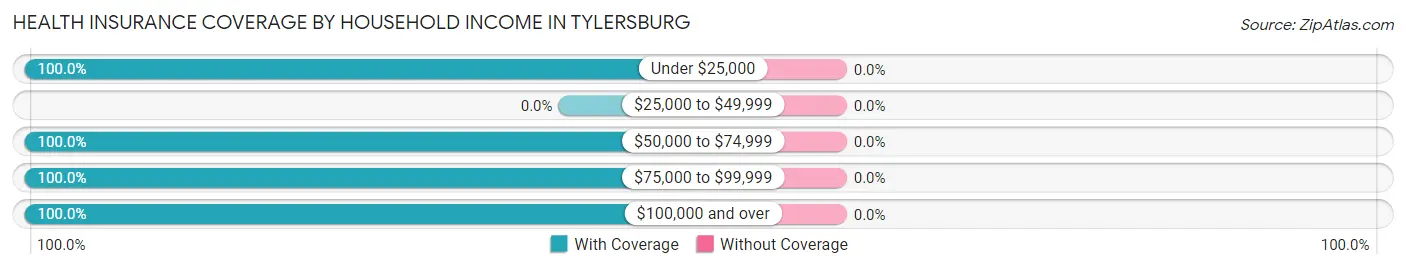
| Household Income | With Coverage | Without Coverage |
| Under $25,000 | 11 (100.0%) | 0 (0.0%) |
| $25,000 to $49,999 | 0 (0.0%) | 0 (0.0%) |
| $50,000 to $74,999 | 8 (100.0%) | 0 (0.0%) |
| $75,000 to $99,999 | 9 (100.0%) | 0 (0.0%) |
| $100,000 and over | 69 (100.0%) | 0 (0.0%) |
Public vs Private Health Insurance Coverage by Age in Tylersburg
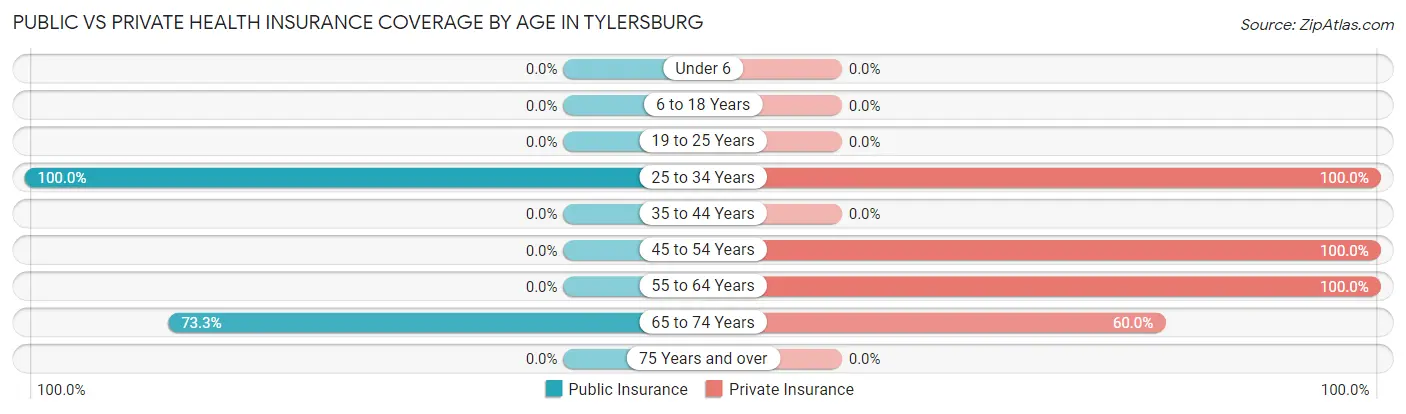
| Age Bracket | Public Insurance | Private Insurance |
| Under 6 | 0 (0.0%) | 0 (0.0%) |
| 6 to 18 Years | 0 (0.0%) | 0 (0.0%) |
| 19 to 25 Years | 0 (0.0%) | 0 (0.0%) |
| 25 to 34 Years | 16 (100.0%) | 16 (100.0%) |
| 35 to 44 Years | 0 (0.0%) | 0 (0.0%) |
| 45 to 54 Years | 0 (0.0%) | 40 (100.0%) |
| 55 to 64 Years | 0 (0.0%) | 26 (100.0%) |
| 65 to 74 Years | 11 (73.3%) | 9 (60.0%) |
| 75 Years and over | 0 (0.0%) | 0 (0.0%) |
| Total | 27 (27.8%) | 91 (93.8%) |
Disability Status by Sex by Age in Tylersburg
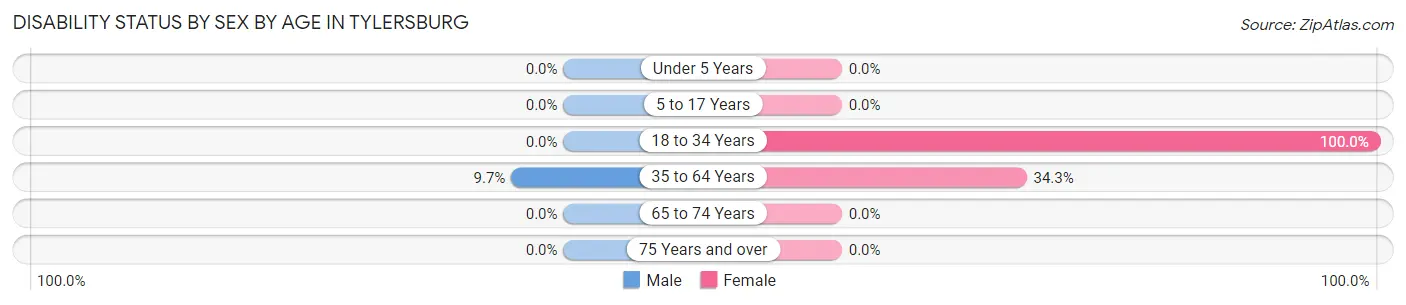
| Age Bracket | Male | Female |
| Under 5 Years | 0 (0.0%) | 0 (0.0%) |
| 5 to 17 Years | 0 (0.0%) | 0 (0.0%) |
| 18 to 34 Years | 0 (0.0%) | 16 (100.0%) |
| 35 to 64 Years | 3 (9.7%) | 12 (34.3%) |
| 65 to 74 Years | 0 (0.0%) | 0 (0.0%) |
| 75 Years and over | 0 (0.0%) | 0 (0.0%) |
Disability Class by Sex by Age in Tylersburg
Disability Class: Hearing Difficulty
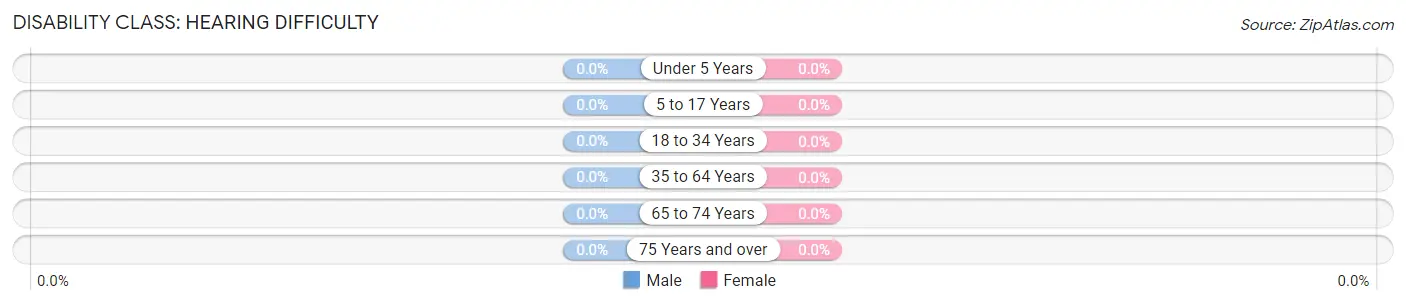
| Age Bracket | Male | Female |
| Under 5 Years | 0 (0.0%) | 0 (0.0%) |
| 5 to 17 Years | 0 (0.0%) | 0 (0.0%) |
| 18 to 34 Years | 0 (0.0%) | 0 (0.0%) |
| 35 to 64 Years | 0 (0.0%) | 0 (0.0%) |
| 65 to 74 Years | 0 (0.0%) | 0 (0.0%) |
| 75 Years and over | 0 (0.0%) | 0 (0.0%) |
Disability Class: Vision Difficulty
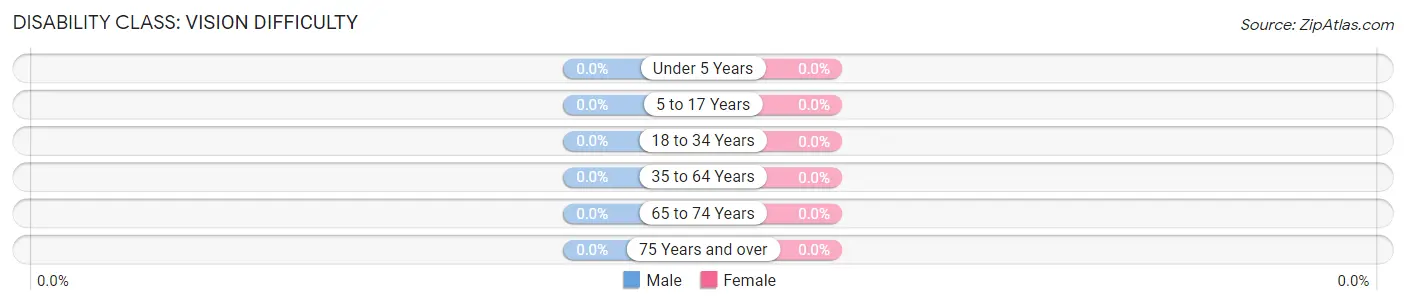
| Age Bracket | Male | Female |
| Under 5 Years | 0 (0.0%) | 0 (0.0%) |
| 5 to 17 Years | 0 (0.0%) | 0 (0.0%) |
| 18 to 34 Years | 0 (0.0%) | 0 (0.0%) |
| 35 to 64 Years | 0 (0.0%) | 0 (0.0%) |
| 65 to 74 Years | 0 (0.0%) | 0 (0.0%) |
| 75 Years and over | 0 (0.0%) | 0 (0.0%) |
Disability Class: Cognitive Difficulty
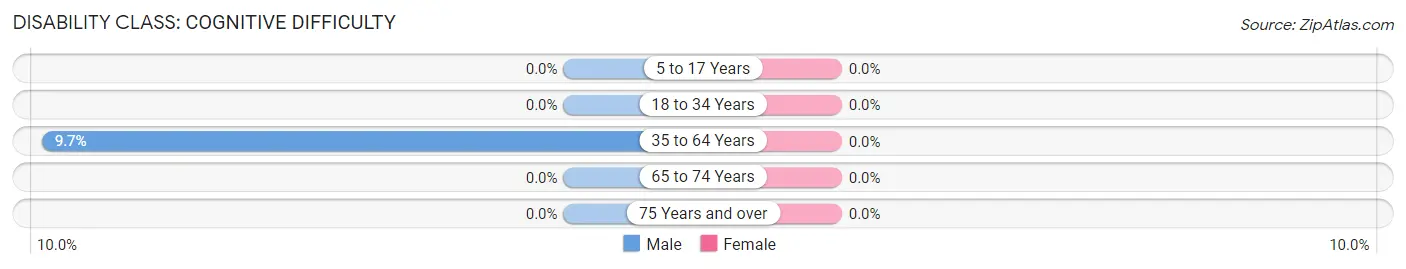
| Age Bracket | Male | Female |
| 5 to 17 Years | 0 (0.0%) | 0 (0.0%) |
| 18 to 34 Years | 0 (0.0%) | 0 (0.0%) |
| 35 to 64 Years | 3 (9.7%) | 0 (0.0%) |
| 65 to 74 Years | 0 (0.0%) | 0 (0.0%) |
| 75 Years and over | 0 (0.0%) | 0 (0.0%) |
Disability Class: Ambulatory Difficulty
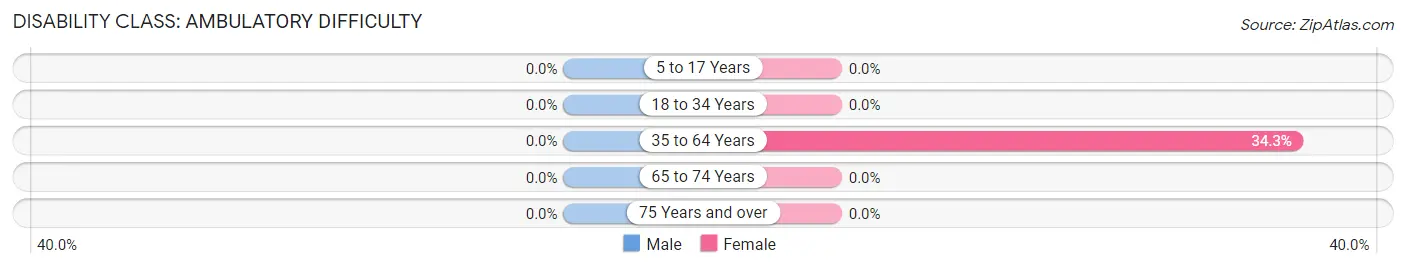
| Age Bracket | Male | Female |
| 5 to 17 Years | 0 (0.0%) | 0 (0.0%) |
| 18 to 34 Years | 0 (0.0%) | 0 (0.0%) |
| 35 to 64 Years | 0 (0.0%) | 12 (34.3%) |
| 65 to 74 Years | 0 (0.0%) | 0 (0.0%) |
| 75 Years and over | 0 (0.0%) | 0 (0.0%) |
Disability Class: Self-Care Difficulty
| Age Bracket | Male | Female |
| 5 to 17 Years | 0 (0.0%) | 0 (0.0%) |
| 18 to 34 Years | 0 (0.0%) | 0 (0.0%) |
| 35 to 64 Years | 0 (0.0%) | 0 (0.0%) |
| 65 to 74 Years | 0 (0.0%) | 0 (0.0%) |
| 75 Years and over | 0 (0.0%) | 0 (0.0%) |
Technology Access in Tylersburg
Computing Device Access in Tylersburg
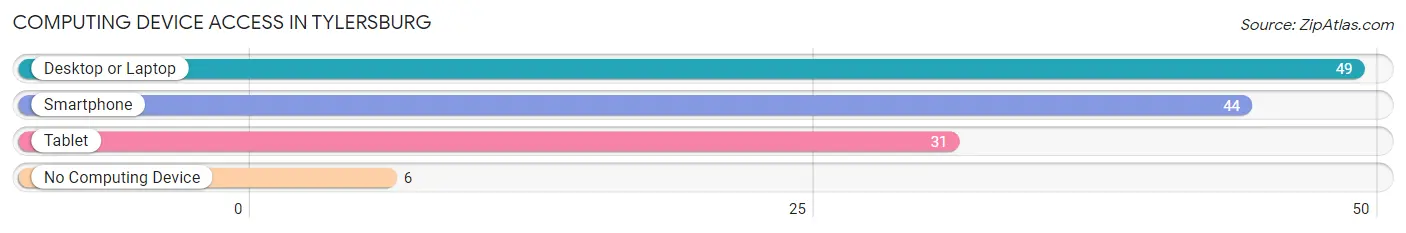
| Device Type | # Households | % Households |
| Desktop or Laptop | 49 | 89.1% |
| Smartphone | 44 | 80.0% |
| Tablet | 31 | 56.4% |
| No Computing Device | 6 | 10.9% |
| Total | 55 | 100.0% |
Internet Access in Tylersburg
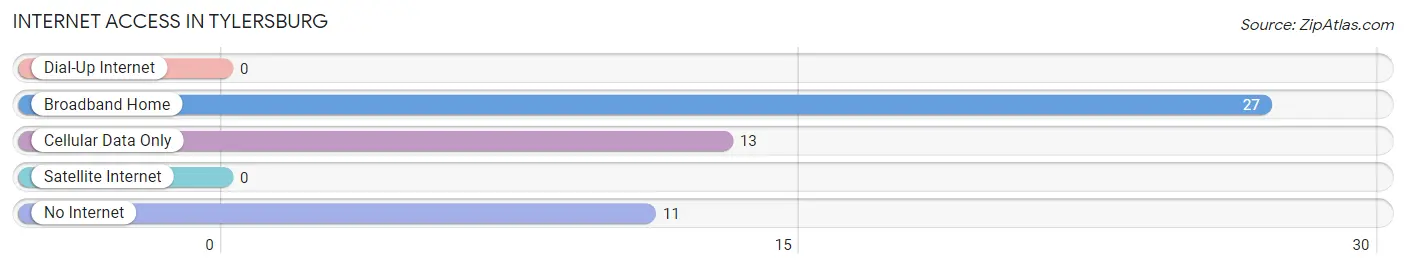
| Internet Type | # Households | % Households |
| Dial-Up Internet | 0 | 0.0% |
| Broadband Home | 27 | 49.1% |
| Cellular Data Only | 13 | 23.6% |
| Satellite Internet | 0 | 0.0% |
| No Internet | 11 | 20.0% |
| Total | 55 | 100.0% |
Tylersburg Summary
Tylersburg is a small unincorporated community located in Clarion County, Pennsylvania. It is situated in the northwestern part of the state, approximately 50 miles northeast of Pittsburgh. The community is located in the foothills of the Allegheny Mountains and is surrounded by rolling hills and forests.
History
Tylersburg was founded in 1820 by William Tyler, a Revolutionary War veteran. Tyler purchased the land from the Commonwealth of Pennsylvania and named the settlement after himself. The town was originally a farming community, but it soon became a center for the lumber industry. The lumber industry was a major source of employment for the town, and it helped to fuel the local economy.
In the late 19th century, Tylersburg was a thriving community with a population of over 1,000 people. The town had several stores, a post office, a hotel, a bank, and a school. The town also had a railroad station, which connected it to the larger cities of Pittsburgh and Erie.
Geography
Tylersburg is located in the northwestern part of Clarion County, Pennsylvania. It is situated in the foothills of the Allegheny Mountains and is surrounded by rolling hills and forests. The town is located along the Clarion River, which flows through the area. The town is also located near the Allegheny National Forest, which provides a variety of recreational activities.
The climate in Tylersburg is generally mild, with cold winters and warm summers. The average temperature in the summer is around 75 degrees Fahrenheit, while the average temperature in the winter is around 30 degrees Fahrenheit.
Economy
The economy of Tylersburg is largely based on the lumber industry. The town is home to several sawmills and lumber companies, which provide employment for many of the town's residents. The lumber industry is also a major source of revenue for the town, as it provides timber for the construction of homes and other buildings.
In addition to the lumber industry, Tylersburg also has a thriving tourism industry. The town is home to several bed and breakfasts, as well as a variety of outdoor activities such as fishing, hunting, and camping. The town also has several restaurants and bars, which attract visitors from all over the region.
Demographics
As of the 2010 census, the population of Tylersburg was 1,093. The population is largely white, with a small percentage of African Americans and Native Americans. The median household income in Tylersburg is $37,500, and the median age is 44. The town has a high rate of homeownership, with over 80% of the population owning their own homes.
Tylersburg is a small, rural community with a strong sense of community and a rich history. The town is home to a variety of businesses and industries, and it provides a variety of recreational activities for its residents. The town is also home to a variety of cultural and historical attractions, which attract visitors from all over the region.
Common Questions
What is Per Capita Income in Tylersburg?
Per Capita income in Tylersburg is $47,271.
What is the Median Family Income in Tylersburg?
Median Family Income in Tylersburg is $119,018.
What is the Median Household income in Tylersburg?
Median Household Income in Tylersburg is $87,361.
What is Income or Wage Gap in Tylersburg?
Income or Wage Gap in Tylersburg is 5.4%.
Women in Tylersburg earn 94.6 cents for every dollar earned by a man.
What is Inequality or Gini Index in Tylersburg?
Inequality or Gini Index in Tylersburg is 0.29.
What is the Total Population of Tylersburg?
Total Population of Tylersburg is 97.
What is the Total Male Population of Tylersburg?
Total Male Population of Tylersburg is 40.
What is the Total Female Population of Tylersburg?
Total Female Population of Tylersburg is 57.
What is the Ratio of Males per 100 Females in Tylersburg?
There are 70.18 Males per 100 Females in Tylersburg.
What is the Ratio of Females per 100 Males in Tylersburg?
There are 142.50 Females per 100 Males in Tylersburg.
What is the Median Population Age in Tylersburg?
Median Population Age in Tylersburg is 51.5 Years.
What is the Average Family Size in Tylersburg
Average Family Size in Tylersburg is 2.6 People.
What is the Average Household Size in Tylersburg
Average Household Size in Tylersburg is 1.8 People.
How Large is the Labor Force in Tylersburg?
There are 67 People in the Labor Forcein in Tylersburg.
What is the Percentage of People in the Labor Force in Tylersburg?
69.1% of People are in the Labor Force in Tylersburg.
What is the Unemployment Rate in Tylersburg?
Unemployment Rate in Tylersburg is 7.5%.