Swarthmore borough, PA Map & Demographics
Swarthmore borough Overview
$66,598
PER CAPITA INCOME
$214,609
AVG FAMILY INCOME
$138,679
AVG HOUSEHOLD INCOME
46.6%
WAGE / INCOME GAP [ % ]
53.4¢/ $1
WAGE / INCOME GAP [ $ ]
0.47
INEQUALITY / GINI INDEX
6,507
TOTAL POPULATION
3,195
MALE POPULATION
3,312
FEMALE POPULATION
96.47
MALES / 100 FEMALES
103.66
FEMALES / 100 MALES
34.8
MEDIAN AGE
3.0
AVG FAMILY SIZE
2.3
AVG HOUSEHOLD SIZE
3,121
LABOR FORCE [ PEOPLE ]
57.8%
PERCENT IN LABOR FORCE
11.1%
UNEMPLOYMENT RATE
Income in Swarthmore borough
Income Overview in Swarthmore borough
Per Capita Income in Swarthmore borough is $66,598, while median incomes of families and households are $214,609 and $138,679 respectively.
| Characteristic | Number | Measure |
| Per Capita Income | 6,507 | $66,598 |
| Median Family Income | 1,395 | $214,609 |
| Mean Family Income | 1,395 | $253,667 |
| Median Household Income | 2,151 | $138,679 |
| Mean Household Income | 2,151 | $193,238 |
| Income Deficit | 1,395 | $0 |
| Wage / Income Gap (%) | 6,507 | 46.60% |
| Wage / Income Gap ($) | 6,507 | 53.40¢ per $1 |
| Gini / Inequality Index | 6,507 | 0.47 |
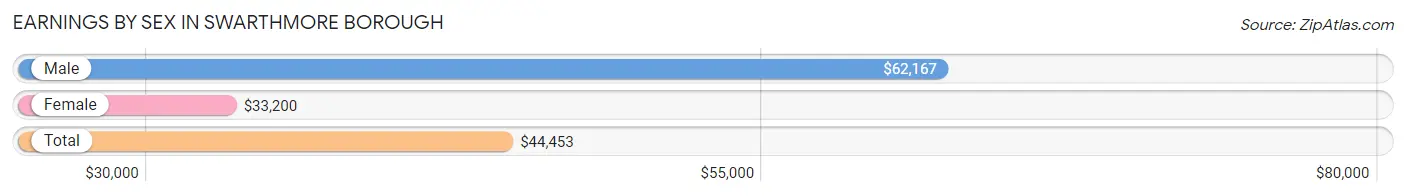
Earnings by Sex in Swarthmore borough
Average Earnings in Swarthmore borough are $44,453, $62,167 for men and $33,200 for women, a difference of 46.6%.
| Sex | Number | Average Earnings |
| Male | 1,894 (50.7%) | $62,167 |
| Female | 1,842 (49.3%) | $33,200 |
| Total | 3,736 (100.0%) | $44,453 |
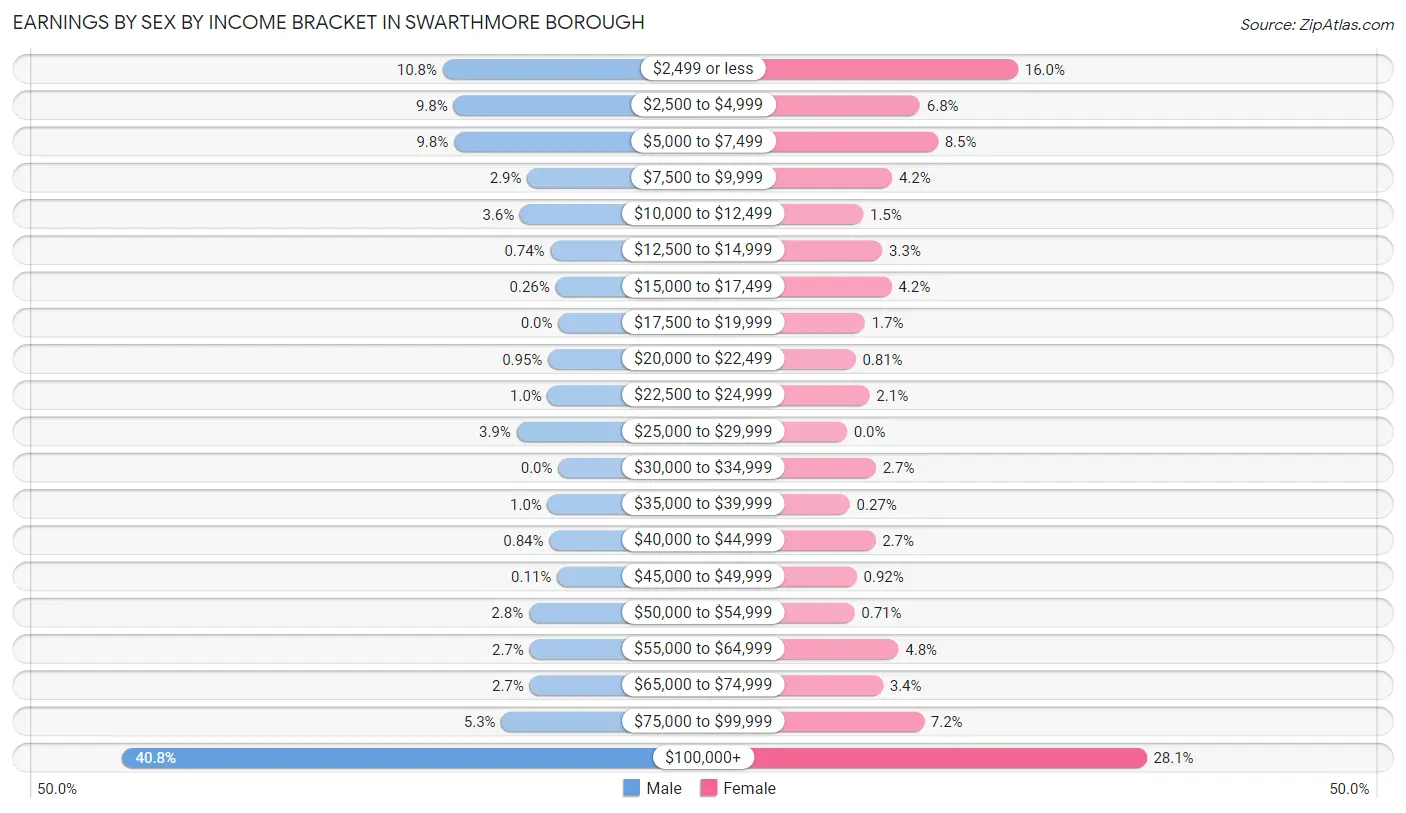
Earnings by Sex by Income Bracket in Swarthmore borough
The most common earnings brackets in Swarthmore borough are $100,000+ for men (773 | 40.8%) and $100,000+ for women (517 | 28.1%).
| Income | Male | Female |
| $2,499 or less | 205 (10.8%) | 295 (16.0%) |
| $2,500 to $4,999 | 186 (9.8%) | 126 (6.8%) |
| $5,000 to $7,499 | 185 (9.8%) | 157 (8.5%) |
| $7,500 to $9,999 | 55 (2.9%) | 78 (4.2%) |
| $10,000 to $12,499 | 68 (3.6%) | 28 (1.5%) |
| $12,500 to $14,999 | 14 (0.7%) | 61 (3.3%) |
| $15,000 to $17,499 | 5 (0.3%) | 77 (4.2%) |
| $17,500 to $19,999 | 0 (0.0%) | 31 (1.7%) |
| $20,000 to $22,499 | 18 (0.9%) | 15 (0.8%) |
| $22,500 to $24,999 | 19 (1.0%) | 39 (2.1%) |
| $25,000 to $29,999 | 74 (3.9%) | 0 (0.0%) |
| $30,000 to $34,999 | 0 (0.0%) | 50 (2.7%) |
| $35,000 to $39,999 | 19 (1.0%) | 5 (0.3%) |
| $40,000 to $44,999 | 16 (0.8%) | 49 (2.7%) |
| $45,000 to $49,999 | 2 (0.1%) | 17 (0.9%) |
| $50,000 to $54,999 | 52 (2.8%) | 13 (0.7%) |
| $55,000 to $64,999 | 51 (2.7%) | 89 (4.8%) |
| $65,000 to $74,999 | 51 (2.7%) | 62 (3.4%) |
| $75,000 to $99,999 | 101 (5.3%) | 133 (7.2%) |
| $100,000+ | 773 (40.8%) | 517 (28.1%) |
| Total | 1,894 (100.0%) | 1,842 (100.0%) |
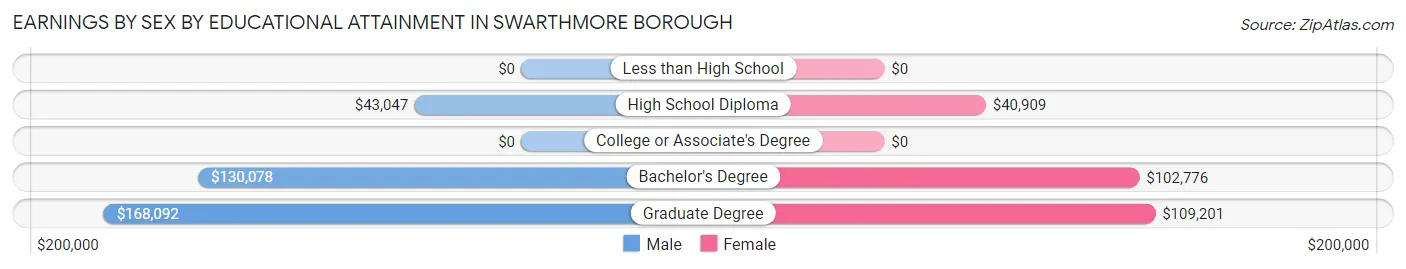
Earnings by Sex by Educational Attainment in Swarthmore borough
Average earnings in Swarthmore borough are $132,704 for men and $95,353 for women, a difference of 28.1%. Men with an educational attainment of graduate degree enjoy the highest average annual earnings of $168,092, while those with high school diploma education earn the least with $43,047. Women with an educational attainment of graduate degree earn the most with the average annual earnings of $109,201, while those with high school diploma education have the smallest earnings of $40,909.
| Educational Attainment | Male Income | Female Income |
| Less than High School | - | - |
| High School Diploma | $43,047 | $40,909 |
| College or Associate's Degree | - | - |
| Bachelor's Degree | $130,078 | $102,776 |
| Graduate Degree | $168,092 | $109,201 |
| Total | $132,704 | $95,353 |
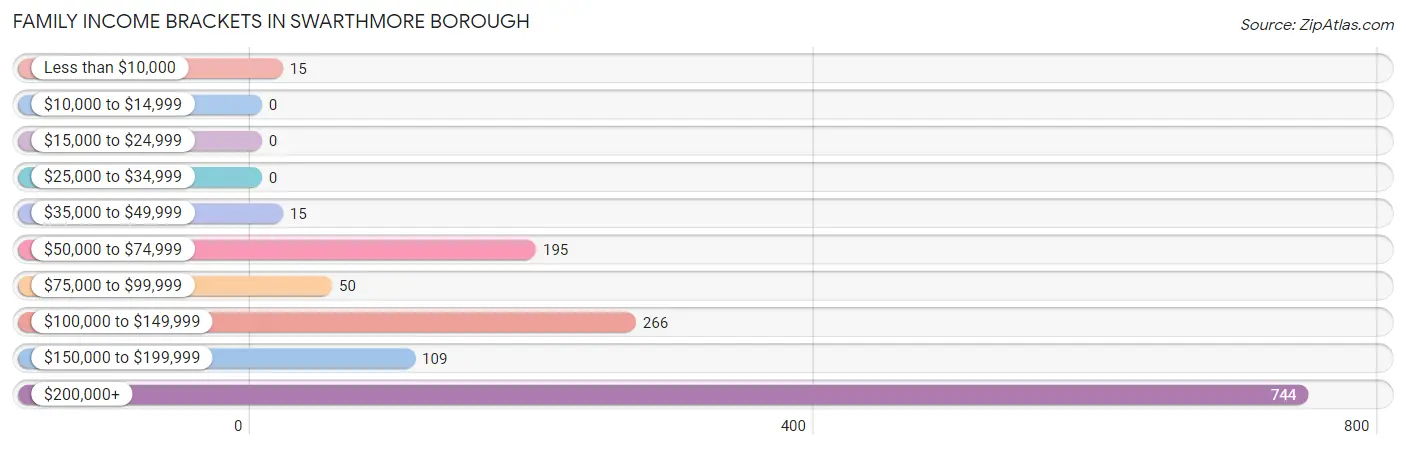
Family Income in Swarthmore borough
Family Income Brackets in Swarthmore borough
According to the Swarthmore borough family income data, there are 744 families falling into the $200,000+ income range, which is the most common income bracket and makes up 53.3% of all families.
| Income Bracket | # Families | % Families |
| Less than $10,000 | 15 | 1.1% |
| $10,000 to $14,999 | 0 | 0.0% |
| $15,000 to $24,999 | 0 | 0.0% |
| $25,000 to $34,999 | 0 | 0.0% |
| $35,000 to $49,999 | 15 | 1.1% |
| $50,000 to $74,999 | 195 | 14.0% |
| $75,000 to $99,999 | 50 | 3.6% |
| $100,000 to $149,999 | 266 | 19.1% |
| $150,000 to $199,999 | 109 | 7.8% |
| $200,000+ | 744 | 53.3% |
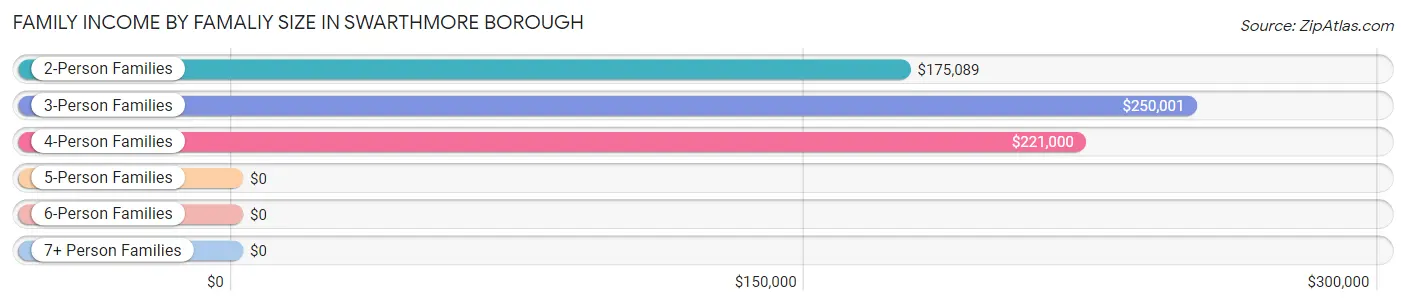
Family Income by Famaliy Size in Swarthmore borough
3-person families (293 | 21.0%) account for the highest median family income in Swarthmore borough with $250,001 per family, while 2-person families (607 | 43.5%) have the highest median income of $87,544 per family member.
| Income Bracket | # Families | Median Income |
| 2-Person Families | 607 (43.5%) | $175,089 |
| 3-Person Families | 293 (21.0%) | $250,001 |
| 4-Person Families | 412 (29.5%) | $221,000 |
| 5-Person Families | 61 (4.4%) | $0 |
| 6-Person Families | 22 (1.6%) | $0 |
| 7+ Person Families | 0 (0.0%) | $0 |
| Total | 1,395 (100.0%) | $214,609 |
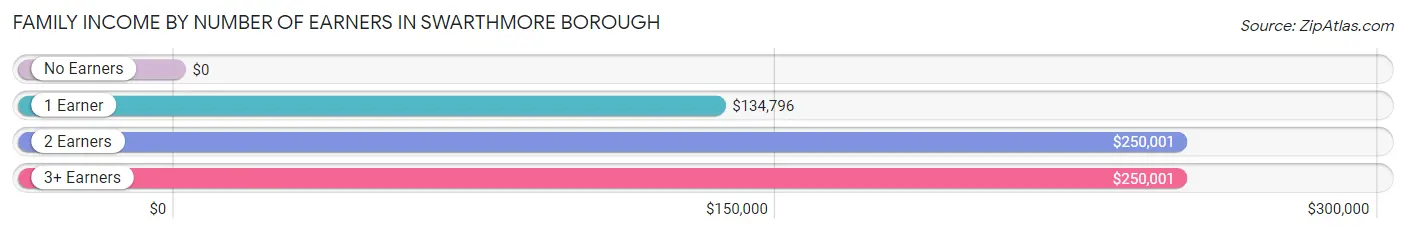
Family Income by Number of Earners in Swarthmore borough
| Number of Earners | # Families | Median Income |
| No Earners | 141 (10.1%) | $0 |
| 1 Earner | 546 (39.1%) | $134,796 |
| 2 Earners | 583 (41.8%) | $250,001 |
| 3+ Earners | 125 (9.0%) | $250,001 |
| Total | 1,395 (100.0%) | $214,609 |
Household Income in Swarthmore borough
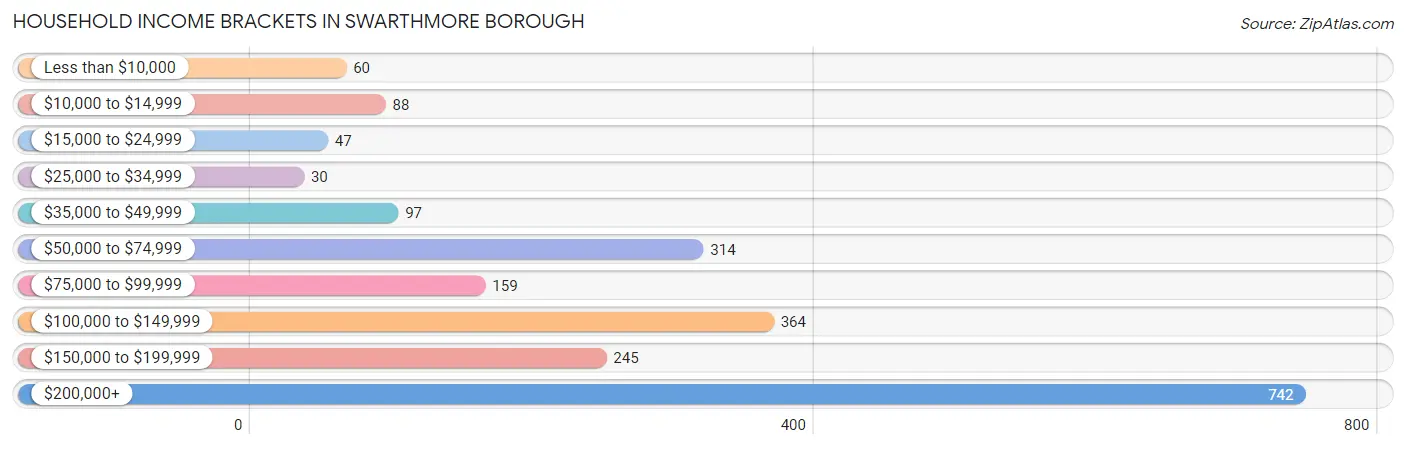
Household Income Brackets in Swarthmore borough
With 742 households falling in the category, the $200,000+ income range is the most frequent in Swarthmore borough, accounting for 34.5% of all households. In contrast, only 30 households (1.4%) fall into the $25,000 to $34,999 income bracket, making it the least populous group.
| Income Bracket | # Households | % Households |
| Less than $10,000 | 60 | 2.8% |
| $10,000 to $14,999 | 88 | 4.1% |
| $15,000 to $24,999 | 47 | 2.2% |
| $25,000 to $34,999 | 30 | 1.4% |
| $35,000 to $49,999 | 97 | 4.5% |
| $50,000 to $74,999 | 314 | 14.6% |
| $75,000 to $99,999 | 159 | 7.4% |
| $100,000 to $149,999 | 364 | 16.9% |
| $150,000 to $199,999 | 245 | 11.4% |
| $200,000+ | 742 | 34.5% |
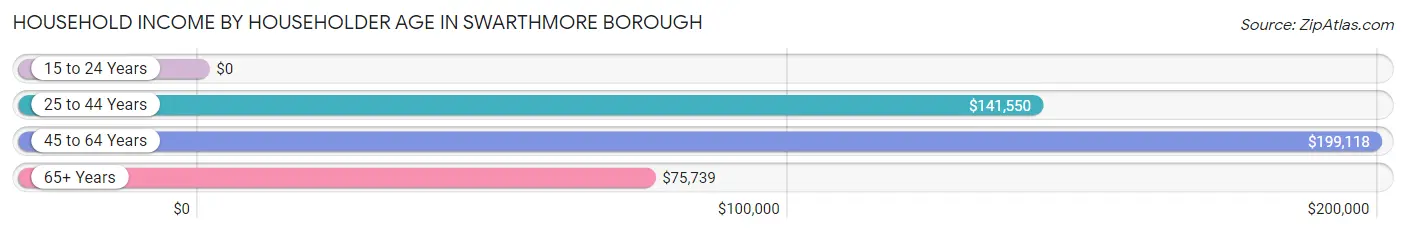
Household Income by Householder Age in Swarthmore borough
The median household income in Swarthmore borough is $138,679, with the highest median household income of $199,118 found in the 45 to 64 years age bracket for the primary householder. A total of 852 households (39.6%) fall into this category.
| Income Bracket | # Households | Median Income |
| 15 to 24 Years | 0 (0.0%) | $0 |
| 25 to 44 Years | 543 (25.2%) | $141,550 |
| 45 to 64 Years | 852 (39.6%) | $199,118 |
| 65+ Years | 756 (35.1%) | $75,739 |
| Total | 2,151 (100.0%) | $138,679 |
Poverty in Swarthmore borough
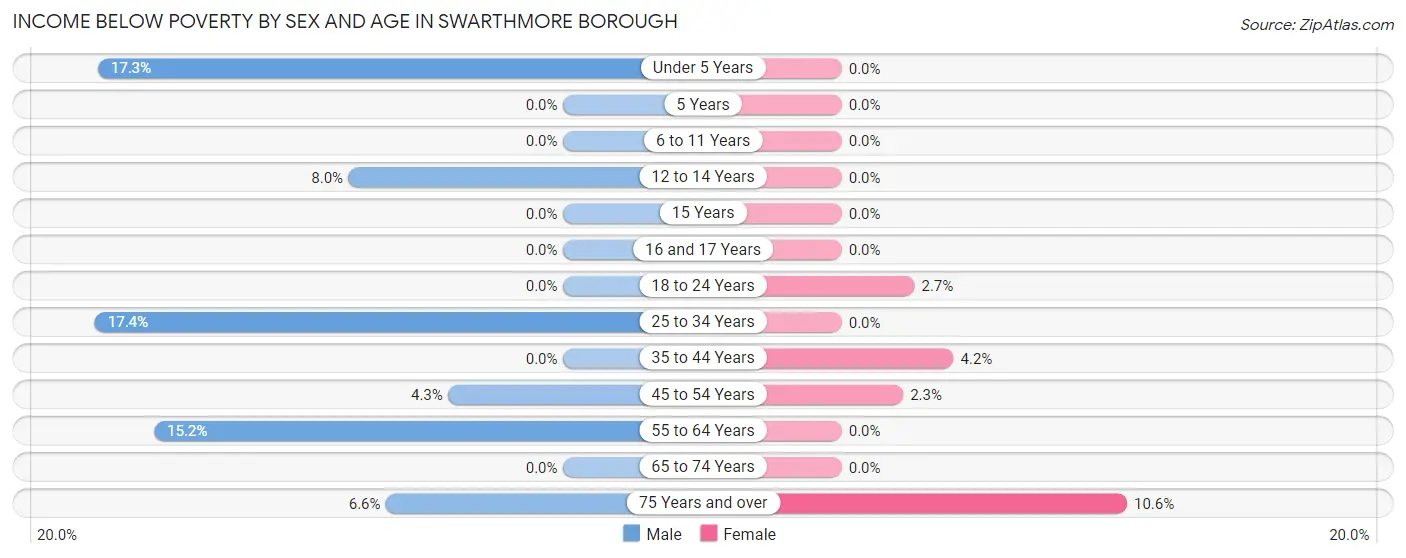
Income Below Poverty by Sex and Age in Swarthmore borough
With 5.9% poverty level for males and 2.6% for females among the residents of Swarthmore borough, 25 to 34 year old males and 75 year old and over females are the most vulnerable to poverty, with 32 males (17.4%) and 41 females (10.6%) in their respective age groups living below the poverty level.
| Age Bracket | Male | Female |
| Under 5 Years | 14 (17.3%) | 0 (0.0%) |
| 5 Years | 0 (0.0%) | 0 (0.0%) |
| 6 to 11 Years | 0 (0.0%) | 0 (0.0%) |
| 12 to 14 Years | 16 (8.0%) | 0 (0.0%) |
| 15 Years | 0 (0.0%) | 0 (0.0%) |
| 16 and 17 Years | 0 (0.0%) | 0 (0.0%) |
| 18 to 24 Years | 0 (0.0%) | 2 (2.7%) |
| 25 to 34 Years | 32 (17.4%) | 0 (0.0%) |
| 35 to 44 Years | 0 (0.0%) | 16 (4.2%) |
| 45 to 54 Years | 16 (4.3%) | 7 (2.3%) |
| 55 to 64 Years | 55 (15.2%) | 0 (0.0%) |
| 65 to 74 Years | 0 (0.0%) | 0 (0.0%) |
| 75 Years and over | 13 (6.6%) | 41 (10.6%) |
| Total | 146 (5.9%) | 66 (2.6%) |
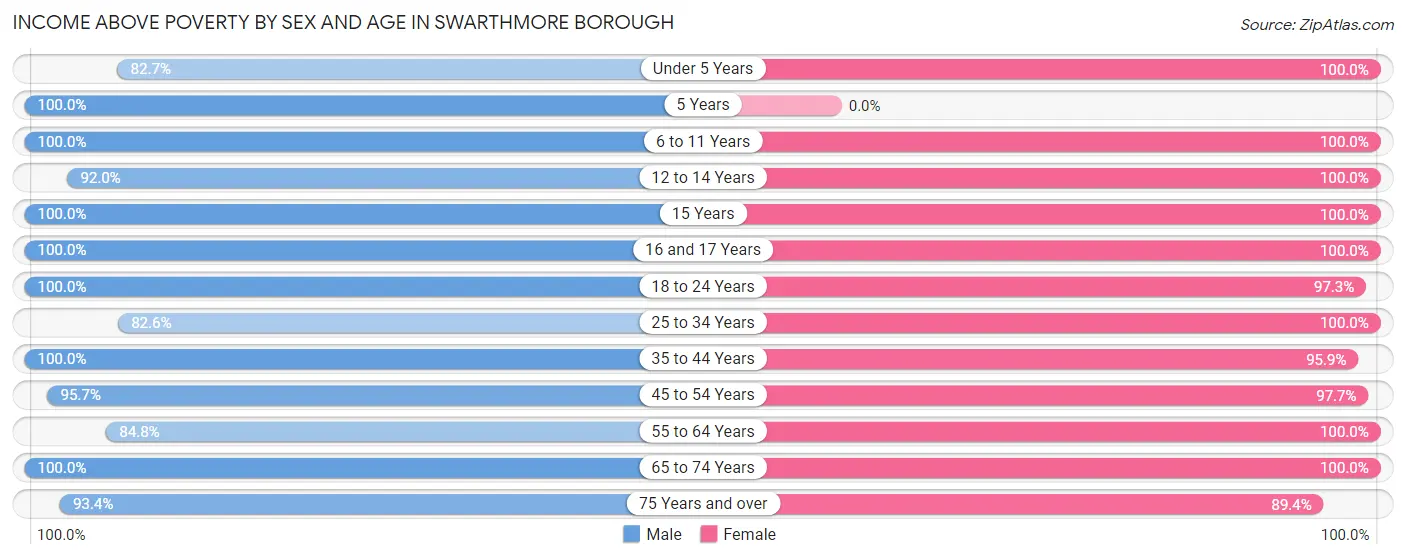
Income Above Poverty by Sex and Age in Swarthmore borough
According to the poverty statistics in Swarthmore borough, males aged 5 years and females aged under 5 years are the age groups that are most secure financially, with 100.0% of males and 100.0% of females in these age groups living above the poverty line.
| Age Bracket | Male | Female |
| Under 5 Years | 67 (82.7%) | 197 (100.0%) |
| 5 Years | 58 (100.0%) | 0 (0.0%) |
| 6 to 11 Years | 190 (100.0%) | 146 (100.0%) |
| 12 to 14 Years | 185 (92.0%) | 109 (100.0%) |
| 15 Years | 80 (100.0%) | 26 (100.0%) |
| 16 and 17 Years | 72 (100.0%) | 52 (100.0%) |
| 18 to 24 Years | 104 (100.0%) | 72 (97.3%) |
| 25 to 34 Years | 152 (82.6%) | 197 (100.0%) |
| 35 to 44 Years | 338 (100.0%) | 370 (95.9%) |
| 45 to 54 Years | 360 (95.7%) | 300 (97.7%) |
| 55 to 64 Years | 307 (84.8%) | 347 (100.0%) |
| 65 to 74 Years | 219 (100.0%) | 317 (100.0%) |
| 75 Years and over | 185 (93.4%) | 346 (89.4%) |
| Total | 2,317 (94.1%) | 2,479 (97.4%) |
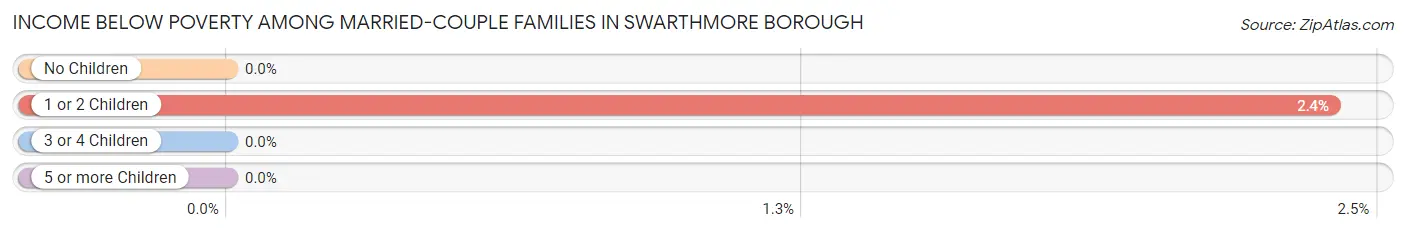
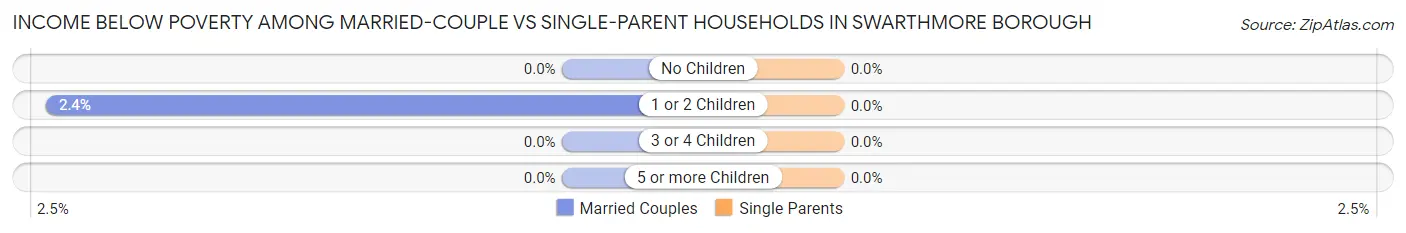
Income Below Poverty Among Married-Couple Families in Swarthmore borough
The poverty statistics for married-couple families in Swarthmore borough show that 1.3% or 16 of the total 1,248 families live below the poverty line. Families with 1 or 2 children have the highest poverty rate of 2.4%, comprising of 16 families. On the other hand, families with no children have the lowest poverty rate of 0.0%, which includes 0 families.
| Children | Above Poverty | Below Poverty |
| No Children | 536 (100.0%) | 0 (0.0%) |
| 1 or 2 Children | 650 (97.6%) | 16 (2.4%) |
| 3 or 4 Children | 46 (100.0%) | 0 (0.0%) |
| 5 or more Children | 0 (0.0%) | 0 (0.0%) |
| Total | 1,232 (98.7%) | 16 (1.3%) |
Income Below Poverty Among Single-Parent Households in Swarthmore borough
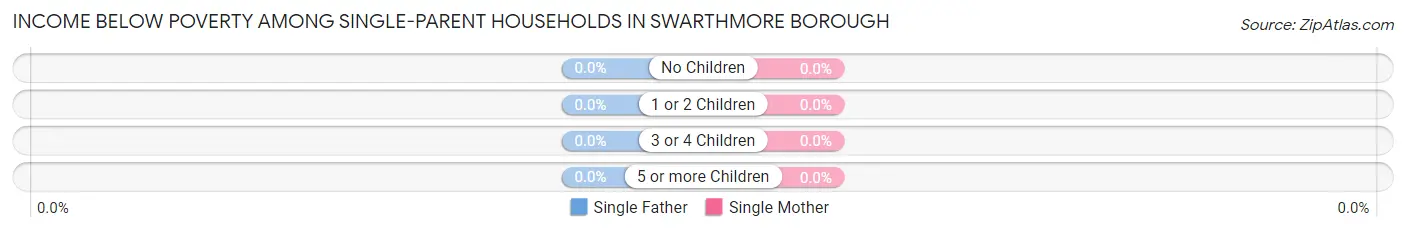
| Children | Single Father | Single Mother |
| No Children | 0 (0.0%) | 0 (0.0%) |
| 1 or 2 Children | 0 (0.0%) | 0 (0.0%) |
| 3 or 4 Children | 0 (0.0%) | 0 (0.0%) |
| 5 or more Children | 0 (0.0%) | 0 (0.0%) |
| Total | 0 (0.0%) | 0 (0.0%) |
Income Below Poverty Among Married-Couple vs Single-Parent Households in Swarthmore borough
| Children | Married-Couple Families | Single-Parent Households |
| No Children | 0 (0.0%) | 0 (0.0%) |
| 1 or 2 Children | 16 (2.4%) | 0 (0.0%) |
| 3 or 4 Children | 0 (0.0%) | 0 (0.0%) |
| 5 or more Children | 0 (0.0%) | 0 (0.0%) |
| Total | 16 (1.3%) | 0 (0.0%) |
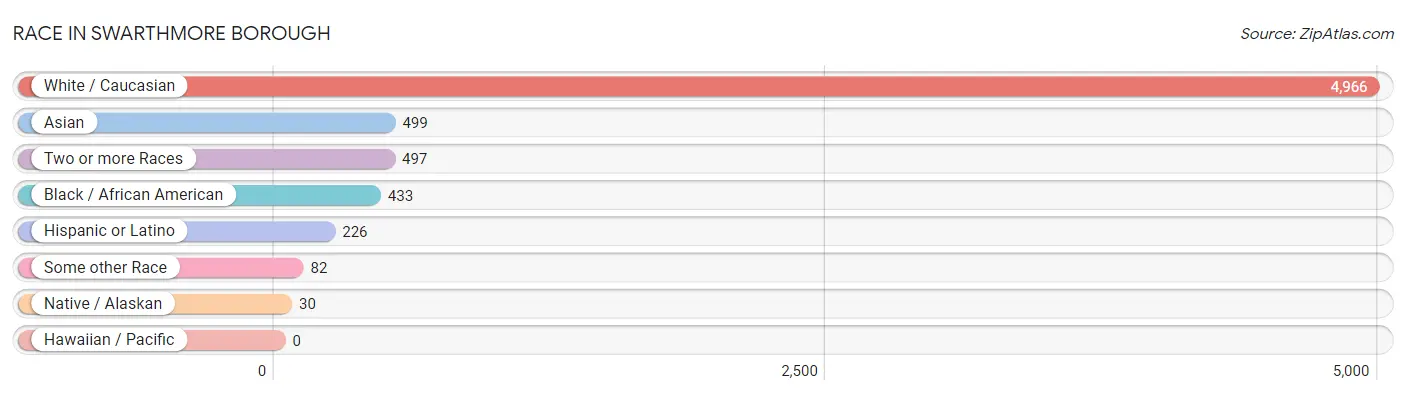
Race in Swarthmore borough
The most populous races in Swarthmore borough are White / Caucasian (4,966 | 76.3%), Asian (499 | 7.7%), and Two or more Races (497 | 7.6%).
| Race | # Population | % Population |
| Asian | 499 | 7.7% |
| Black / African American | 433 | 6.7% |
| Hawaiian / Pacific | 0 | 0.0% |
| Hispanic or Latino | 226 | 3.5% |
| Native / Alaskan | 30 | 0.5% |
| White / Caucasian | 4,966 | 76.3% |
| Two or more Races | 497 | 7.6% |
| Some other Race | 82 | 1.3% |
| Total | 6,507 | 100.0% |
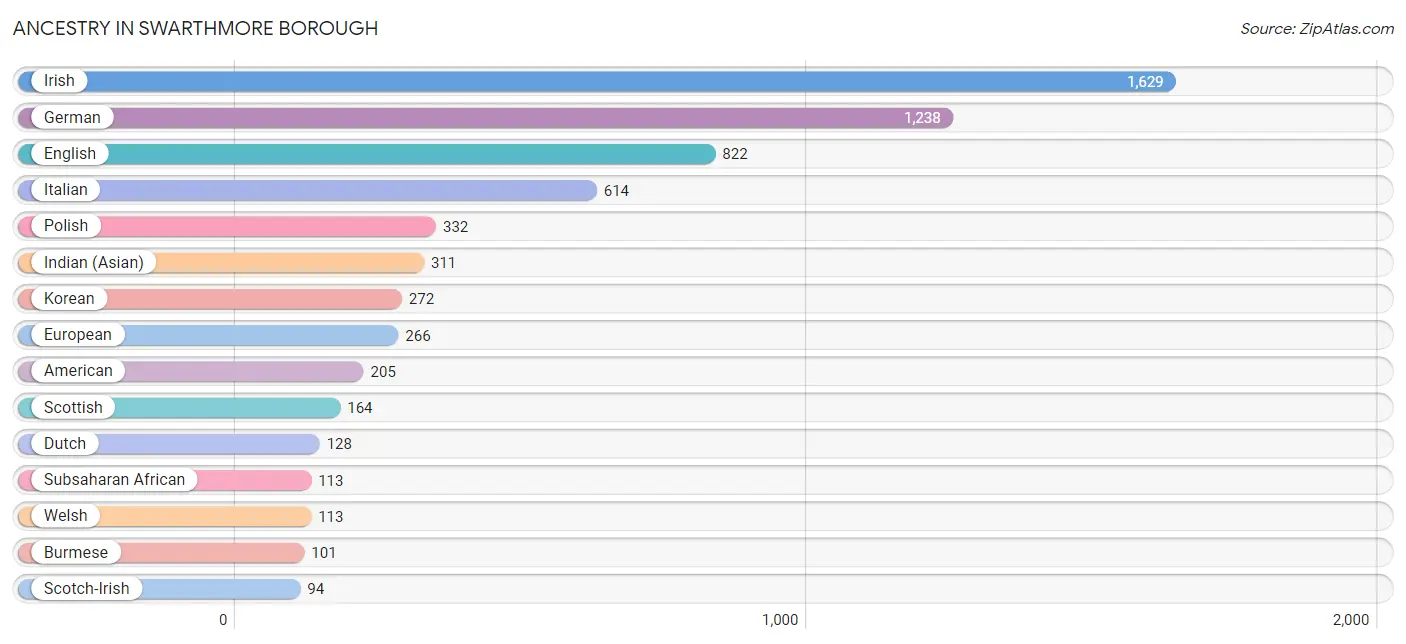
Ancestry in Swarthmore borough
The most populous ancestries reported in Swarthmore borough are Irish (1,629 | 25.0%), German (1,238 | 19.0%), English (822 | 12.6%), Italian (614 | 9.4%), and Polish (332 | 5.1%), together accounting for 71.2% of all Swarthmore borough residents.
| Ancestry | # Population | % Population |
| African | 10 | 0.2% |
| American | 205 | 3.2% |
| Armenian | 65 | 1.0% |
| Australian | 14 | 0.2% |
| Austrian | 28 | 0.4% |
| British | 30 | 0.5% |
| Burmese | 101 | 1.5% |
| Central American | 8 | 0.1% |
| Cheyenne | 30 | 0.5% |
| Colombian | 12 | 0.2% |
| Danish | 24 | 0.4% |
| Dominican | 1 | 0.0% |
| Dutch | 128 | 2.0% |
| Eastern European | 49 | 0.7% |
| English | 822 | 12.6% |
| Ethiopian | 4 | 0.1% |
| European | 266 | 4.1% |
| Filipino | 13 | 0.2% |
| French | 68 | 1.1% |
| German | 1,238 | 19.0% |
| Greek | 83 | 1.3% |
| Guatemalan | 1 | 0.0% |
| Hungarian | 33 | 0.5% |
| Indian (Asian) | 311 | 4.8% |
| Irish | 1,629 | 25.0% |
| Italian | 614 | 9.4% |
| Korean | 272 | 4.2% |
| Latvian | 15 | 0.2% |
| Lithuanian | 56 | 0.9% |
| Mexican | 64 | 1.0% |
| Mongolian | 4 | 0.1% |
| New Zealander | 34 | 0.5% |
| Nicaraguan | 7 | 0.1% |
| Nigerian | 39 | 0.6% |
| Northern European | 41 | 0.6% |
| Norwegian | 13 | 0.2% |
| Peruvian | 12 | 0.2% |
| Polish | 332 | 5.1% |
| Puerto Rican | 81 | 1.2% |
| Russian | 31 | 0.5% |
| Scandinavian | 39 | 0.6% |
| Scotch-Irish | 94 | 1.4% |
| Scottish | 164 | 2.5% |
| Serbian | 47 | 0.7% |
| Slovak | 30 | 0.5% |
| South American | 35 | 0.5% |
| Sri Lankan | 42 | 0.6% |
| Subsaharan African | 113 | 1.7% |
| Swedish | 65 | 1.0% |
| Swiss | 18 | 0.3% |
| Thai | 90 | 1.4% |
| Ukrainian | 16 | 0.3% |
| Venezuelan | 11 | 0.2% |
| Welsh | 113 | 1.7% |
| West Indian | 3 | 0.1% |
| Yugoslavian | 16 | 0.3% | View All 56 Rows |
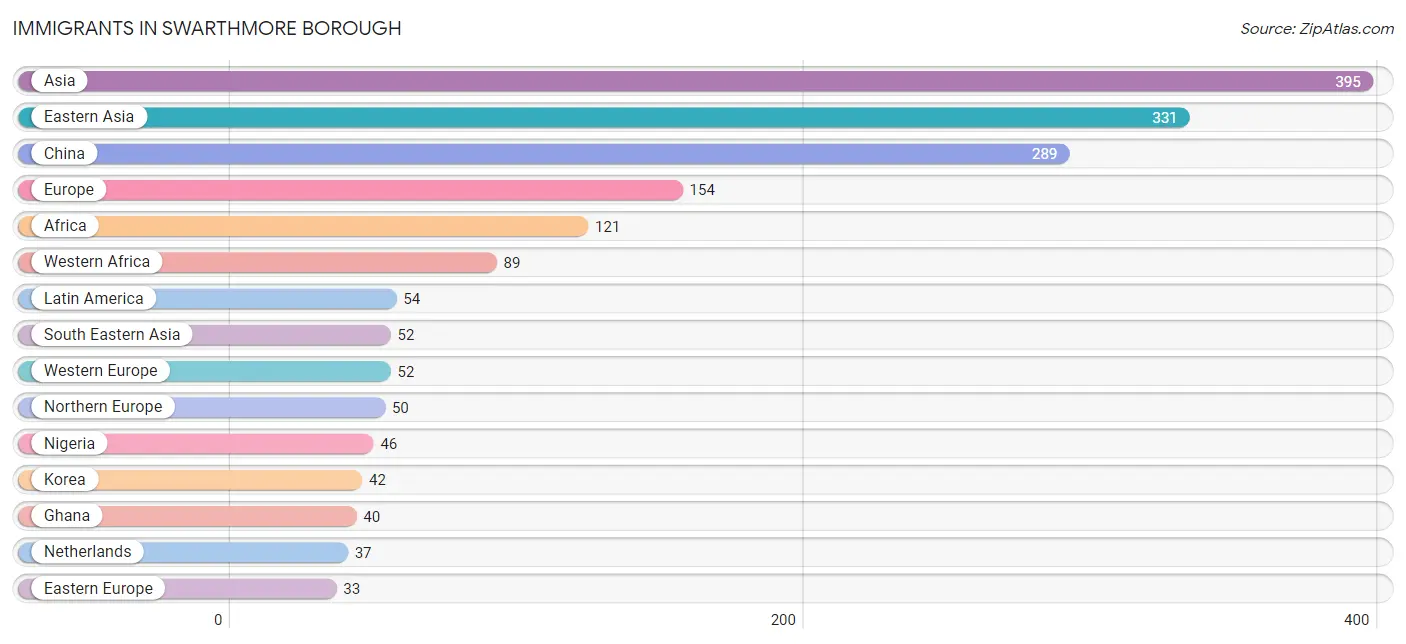
Immigrants in Swarthmore borough
The most numerous immigrant groups reported in Swarthmore borough came from Asia (395 | 6.1%), Eastern Asia (331 | 5.1%), China (289 | 4.4%), Europe (154 | 2.4%), and Africa (121 | 1.9%), together accounting for 19.8% of all Swarthmore borough residents.
| Immigration Origin | # Population | % Population |
| Africa | 121 | 1.9% |
| Asia | 395 | 6.1% |
| Australia | 14 | 0.2% |
| Barbados | 14 | 0.2% |
| Bosnia and Herzegovina | 17 | 0.3% |
| Cameroon | 31 | 0.5% |
| Canada | 8 | 0.1% |
| Caribbean | 30 | 0.5% |
| Central America | 12 | 0.2% |
| China | 289 | 4.4% |
| Colombia | 12 | 0.2% |
| Eastern Africa | 1 | 0.0% |
| Eastern Asia | 331 | 5.1% |
| Eastern Europe | 33 | 0.5% |
| England | 19 | 0.3% |
| Europe | 154 | 2.4% |
| Germany | 15 | 0.2% |
| Ghana | 40 | 0.6% |
| Greece | 19 | 0.3% |
| Guatemala | 5 | 0.1% |
| Haiti | 9 | 0.1% |
| Korea | 42 | 0.6% |
| Latin America | 54 | 0.8% |
| Liberia | 3 | 0.1% |
| Middle Africa | 31 | 0.5% |
| Netherlands | 37 | 0.6% |
| Nicaragua | 7 | 0.1% |
| Nigeria | 46 | 0.7% |
| Northern Europe | 50 | 0.8% |
| Oceania | 30 | 0.5% |
| Pakistan | 12 | 0.2% |
| Philippines | 30 | 0.5% |
| Scotland | 15 | 0.2% |
| Serbia | 16 | 0.3% |
| Singapore | 5 | 0.1% |
| South America | 12 | 0.2% |
| South Central Asia | 12 | 0.2% |
| South Eastern Asia | 52 | 0.8% |
| Southern Europe | 19 | 0.3% |
| Taiwan | 15 | 0.2% |
| Trinidad and Tobago | 4 | 0.1% |
| Vietnam | 17 | 0.3% |
| Western Africa | 89 | 1.4% |
| Western Europe | 52 | 0.8% | View All 44 Rows |
Sex and Age in Swarthmore borough
Sex and Age in Swarthmore borough
The most populous age groups in Swarthmore borough are 15 to 19 Years (580 | 18.1%) for men and 15 to 19 Years (508 | 15.3%) for women.
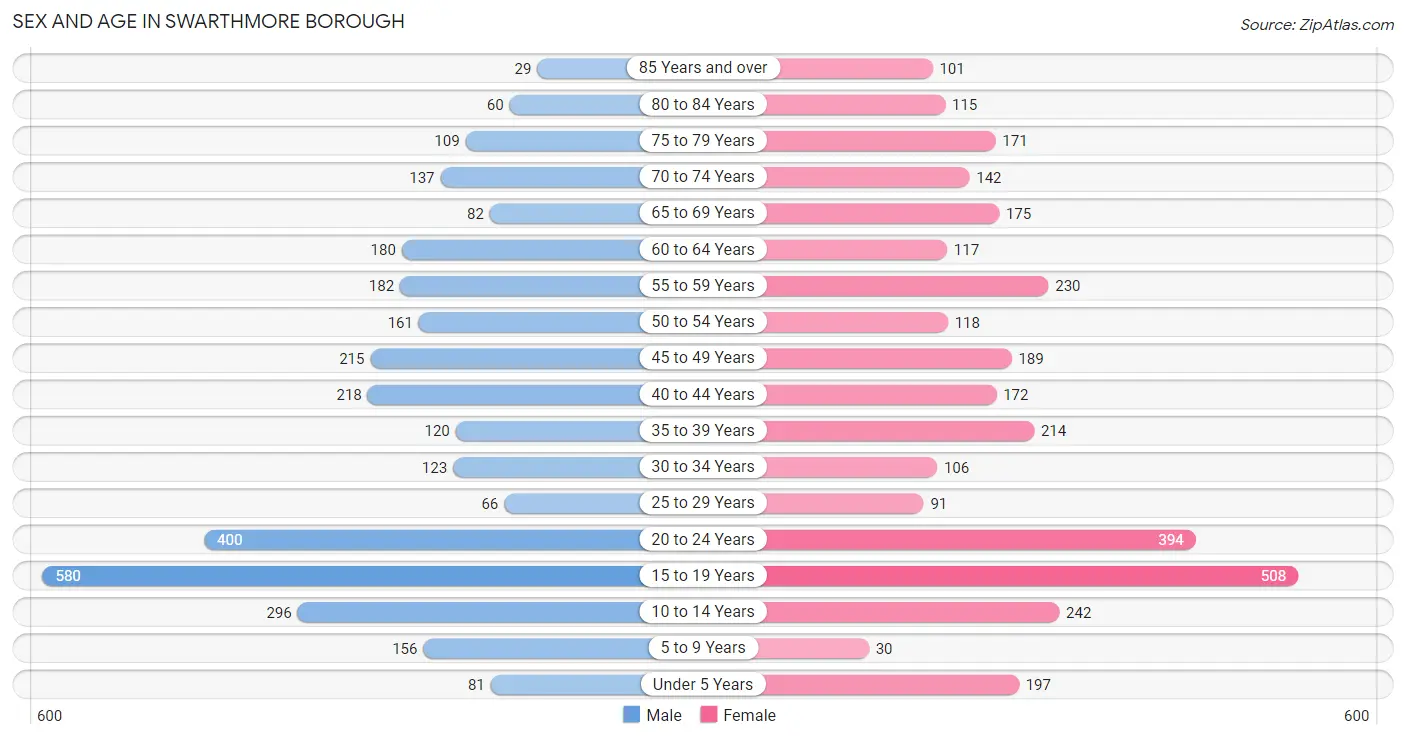
| Age Bracket | Male | Female |
| Under 5 Years | 81 (2.5%) | 197 (5.9%) |
| 5 to 9 Years | 156 (4.9%) | 30 (0.9%) |
| 10 to 14 Years | 296 (9.3%) | 242 (7.3%) |
| 15 to 19 Years | 580 (18.1%) | 508 (15.3%) |
| 20 to 24 Years | 400 (12.5%) | 394 (11.9%) |
| 25 to 29 Years | 66 (2.1%) | 91 (2.8%) |
| 30 to 34 Years | 123 (3.8%) | 106 (3.2%) |
| 35 to 39 Years | 120 (3.8%) | 214 (6.5%) |
| 40 to 44 Years | 218 (6.8%) | 172 (5.2%) |
| 45 to 49 Years | 215 (6.7%) | 189 (5.7%) |
| 50 to 54 Years | 161 (5.0%) | 118 (3.6%) |
| 55 to 59 Years | 182 (5.7%) | 230 (6.9%) |
| 60 to 64 Years | 180 (5.6%) | 117 (3.5%) |
| 65 to 69 Years | 82 (2.6%) | 175 (5.3%) |
| 70 to 74 Years | 137 (4.3%) | 142 (4.3%) |
| 75 to 79 Years | 109 (3.4%) | 171 (5.2%) |
| 80 to 84 Years | 60 (1.9%) | 115 (3.5%) |
| 85 Years and over | 29 (0.9%) | 101 (3.0%) |
| Total | 3,195 (100.0%) | 3,312 (100.0%) |
Families and Households in Swarthmore borough
Median Family Size in Swarthmore borough
The median family size in Swarthmore borough is 2.95 persons per family, with married-couple families (1,248 | 89.5%) accounting for the largest median family size of 3.04 persons per family. On the other hand, single female/mother families (99 | 7.1%) represent the smallest median family size with 2.15 persons per family.
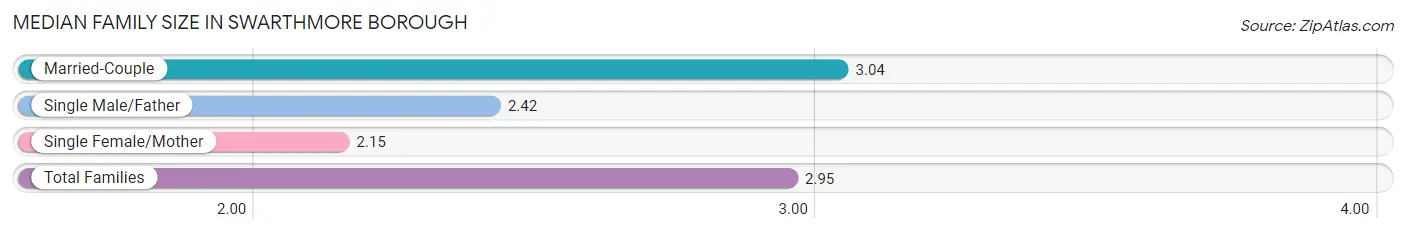
| Family Type | # Families | Family Size |
| Married-Couple | 1,248 (89.5%) | 3.04 |
| Single Male/Father | 48 (3.4%) | 2.42 |
| Single Female/Mother | 99 (7.1%) | 2.15 |
| Total Families | 1,395 (100.0%) | 2.95 |
Median Household Size in Swarthmore borough
The median household size in Swarthmore borough is 2.32 persons per household, with married-couple households (1,248 | 58.0%) accounting for the largest median household size of 3.04 persons per household. non-family households (756 | 35.1%) represent the smallest median household size with 1.13 persons per household.
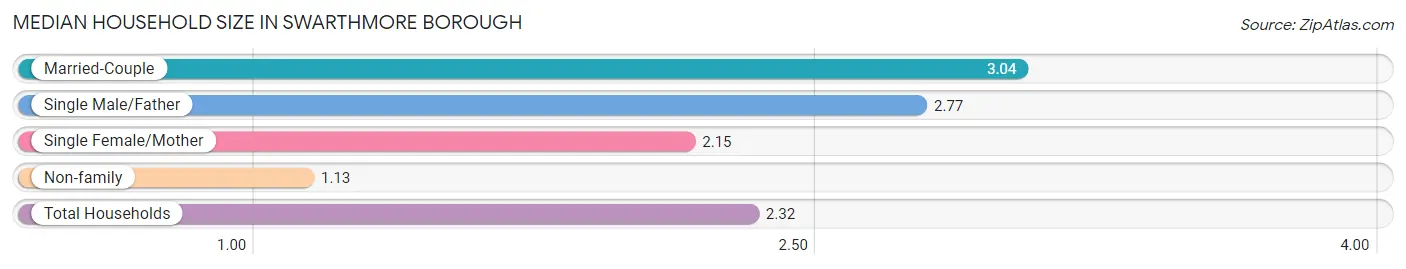
| Household Type | # Households | Household Size |
| Married-Couple | 1,248 (58.0%) | 3.04 |
| Single Male/Father | 48 (2.2%) | 2.77 |
| Single Female/Mother | 99 (4.6%) | 2.15 |
| Non-family | 756 (35.1%) | 1.13 |
| Total Households | 2,151 (100.0%) | 2.32 |
Household Size by Marriage Status in Swarthmore borough
Out of a total of 2,151 households in Swarthmore borough, 1,395 (64.8%) are family households, while 756 (35.1%) are nonfamily households. The most numerous type of family households are 2-person households, comprising 590, and the most common type of nonfamily households are 1-person households, comprising 674.
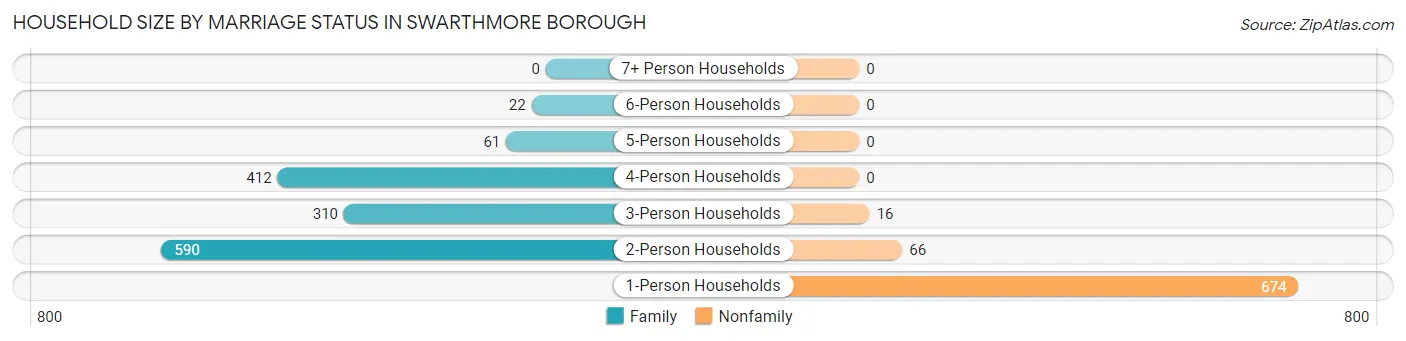
| Household Size | Family Households | Nonfamily Households |
| 1-Person Households | - | 674 (31.3%) |
| 2-Person Households | 590 (27.4%) | 66 (3.1%) |
| 3-Person Households | 310 (14.4%) | 16 (0.7%) |
| 4-Person Households | 412 (19.2%) | 0 (0.0%) |
| 5-Person Households | 61 (2.8%) | 0 (0.0%) |
| 6-Person Households | 22 (1.0%) | 0 (0.0%) |
| 7+ Person Households | 0 (0.0%) | 0 (0.0%) |
| Total | 1,395 (64.8%) | 756 (35.1%) |
Female Fertility in Swarthmore borough
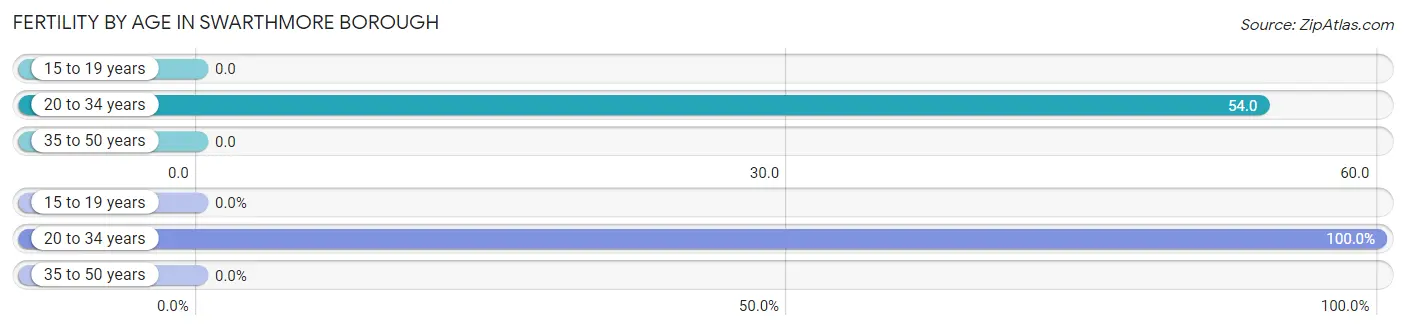
Fertility by Age in Swarthmore borough
Average fertility rate in Swarthmore borough is 18.0 births per 1,000 women. Women in the age bracket of 20 to 34 years have the highest fertility rate with 54.0 births per 1,000 women. Women in the age bracket of 20 to 34 years acount for 100.0% of all women with births.
| Age Bracket | Women with Births | Births / 1,000 Women |
| 15 to 19 years | 0 (0.0%) | 0.0 |
| 20 to 34 years | 32 (100.0%) | 54.0 |
| 35 to 50 years | 0 (0.0%) | 0.0 |
| Total | 32 (100.0%) | 18.0 |
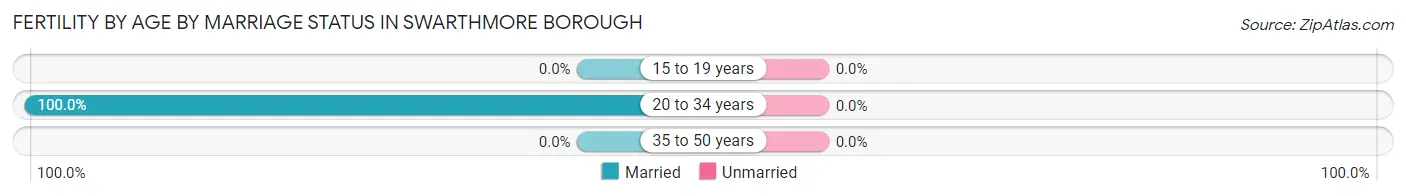
Fertility by Age by Marriage Status in Swarthmore borough
| Age Bracket | Married | Unmarried |
| 15 to 19 years | 0 (0.0%) | 0 (0.0%) |
| 20 to 34 years | 32 (100.0%) | 0 (0.0%) |
| 35 to 50 years | 0 (0.0%) | 0 (0.0%) |
| Total | 32 (100.0%) | 0 (0.0%) |
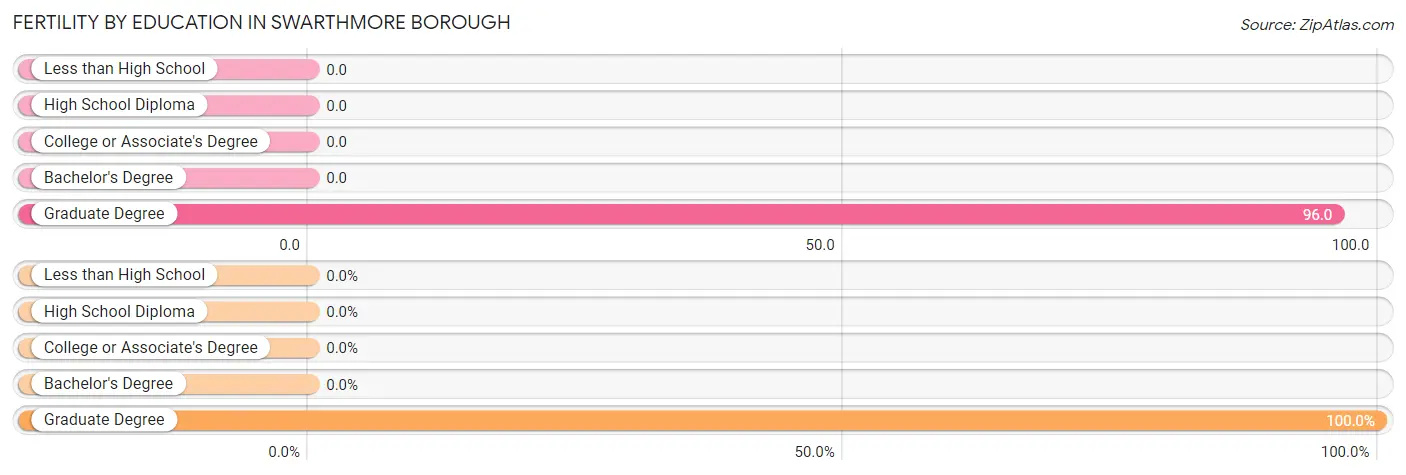
Fertility by Education in Swarthmore borough
| Educational Attainment | Women with Births | Births / 1,000 Women |
| Less than High School | 0 (0.0%) | 0.0 |
| High School Diploma | 0 (0.0%) | 0.0 |
| College or Associate's Degree | 0 (0.0%) | 0.0 |
| Bachelor's Degree | 0 (0.0%) | 0.0 |
| Graduate Degree | 32 (100.0%) | 96.0 |
| Total | 32 (100.0%) | 18.0 |
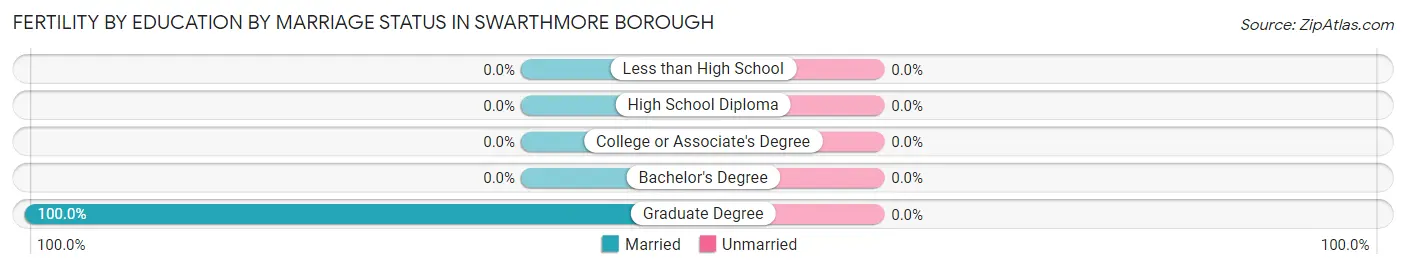
Fertility by Education by Marriage Status in Swarthmore borough
| Educational Attainment | Married | Unmarried |
| Less than High School | 0 (0.0%) | 0 (0.0%) |
| High School Diploma | 0 (0.0%) | 0 (0.0%) |
| College or Associate's Degree | 0 (0.0%) | 0 (0.0%) |
| Bachelor's Degree | 0 (0.0%) | 0 (0.0%) |
| Graduate Degree | 32 (100.0%) | 0 (0.0%) |
| Total | 32 (100.0%) | 0 (0.0%) |
Employment Characteristics in Swarthmore borough
Employment by Class of Employer in Swarthmore borough
Among the 2,711 employed individuals in Swarthmore borough, private company employees (1,387 | 51.2%), not-for-profit organizations (625 | 23.1%), and federal government employees (294 | 10.8%) make up the most common classes of employment.
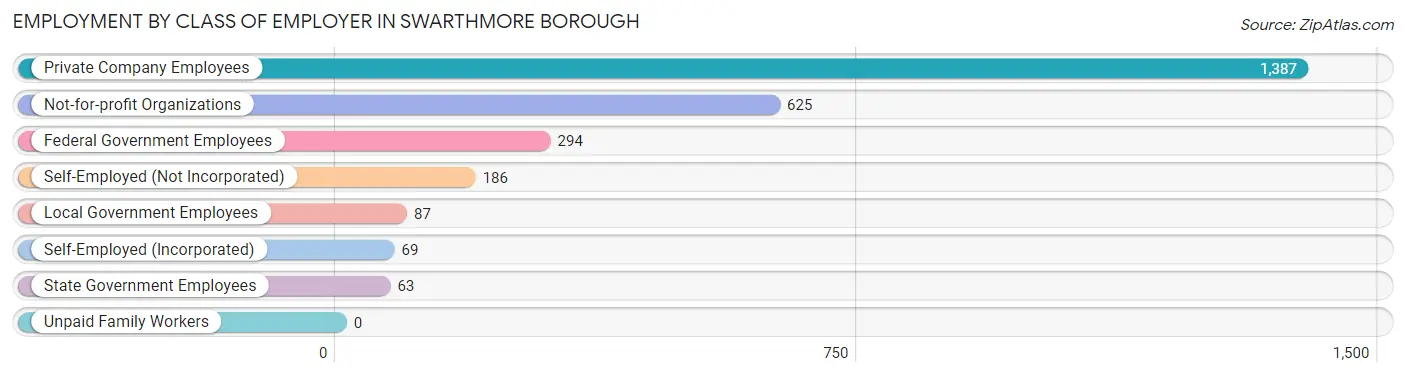
| Employer Class | # Employees | % Employees |
| Private Company Employees | 1,387 | 51.2% |
| Self-Employed (Incorporated) | 69 | 2.5% |
| Self-Employed (Not Incorporated) | 186 | 6.9% |
| Not-for-profit Organizations | 625 | 23.1% |
| Local Government Employees | 87 | 3.2% |
| State Government Employees | 63 | 2.3% |
| Federal Government Employees | 294 | 10.8% |
| Unpaid Family Workers | 0 | 0.0% |
| Total | 2,711 | 100.0% |
Employment Status by Age in Swarthmore borough
According to the labor force statistics for Swarthmore borough, out of the total population over 16 years of age (5,399), 57.8% or 3,121 individuals are in the labor force, with 11.1% or 346 of them unemployed. The age group with the highest labor force participation rate is 45 to 54 years, with 92.8% or 634 individuals in the labor force. Within the labor force, the 25 to 29 years age range has the highest percentage of unemployed individuals, with 40.3% or 52 of them being unemployed.
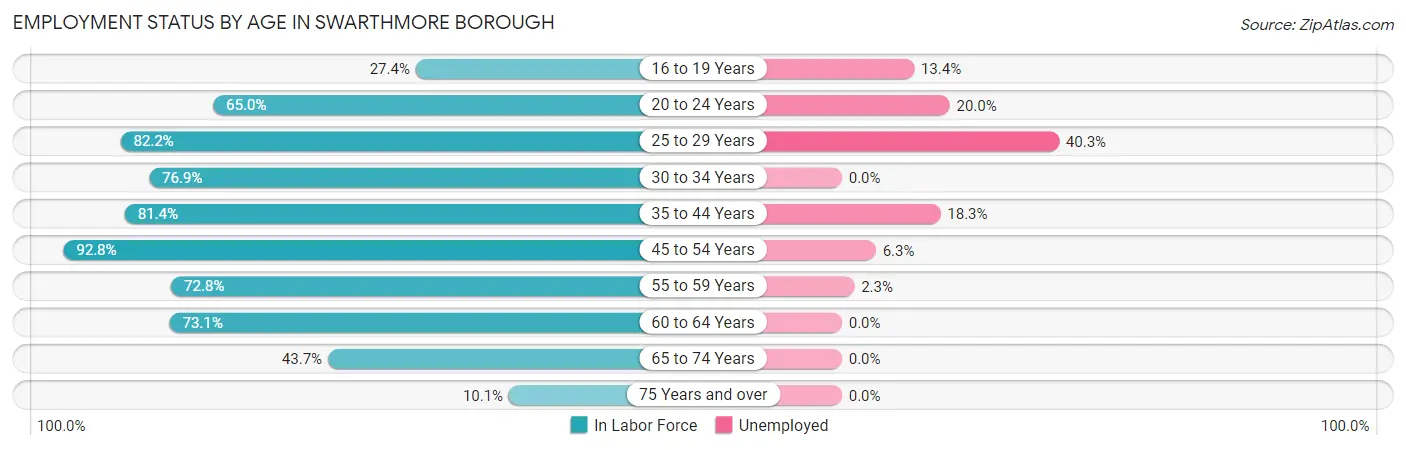
| Age Bracket | In Labor Force | Unemployed |
| 16 to 19 Years | 269 (27.4%) | 36 (13.4%) |
| 20 to 24 Years | 516 (65.0%) | 103 (20.0%) |
| 25 to 29 Years | 129 (82.2%) | 52 (40.3%) |
| 30 to 34 Years | 176 (76.9%) | 0 (0.0%) |
| 35 to 44 Years | 589 (81.4%) | 108 (18.3%) |
| 45 to 54 Years | 634 (92.8%) | 40 (6.3%) |
| 55 to 59 Years | 300 (72.8%) | 7 (2.3%) |
| 60 to 64 Years | 217 (73.1%) | 0 (0.0%) |
| 65 to 74 Years | 234 (43.7%) | 0 (0.0%) |
| 75 Years and over | 59 (10.1%) | 0 (0.0%) |
| Total | 3,121 (57.8%) | 346 (11.1%) |
Employment Status by Educational Attainment in Swarthmore borough
According to labor force statistics for Swarthmore borough, 81.7% of individuals (2,044) out of the total population between 25 and 64 years of age (2,502) are in the labor force, with 10.1% or 206 of them being unemployed. The group with the highest labor force participation rate are those with the educational attainment of bachelor's degree or higher, with 84.6% or 1,647 individuals in the labor force. Within the labor force, individuals with college / associate degree education have the highest percentage of unemployment, with 56.9% or 148 of them being unemployed.
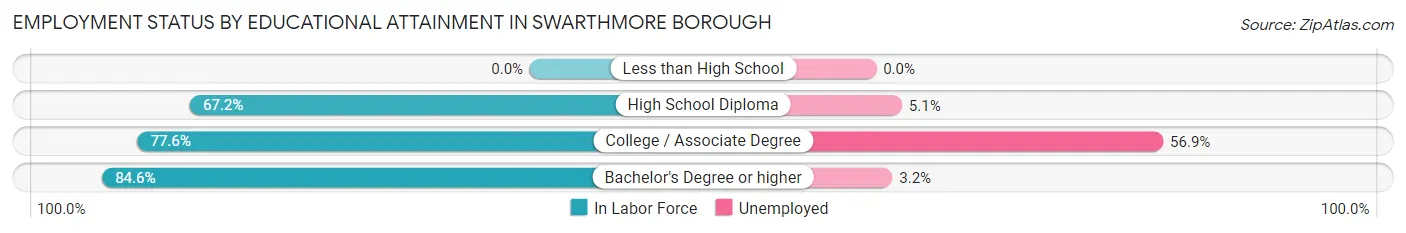
| Educational Attainment | In Labor Force | Unemployed |
| Less than High School | 0 (0.0%) | 0 (0.0%) |
| High School Diploma | 137 (67.2%) | 10 (5.1%) |
| College / Associate Degree | 260 (77.6%) | 191 (56.9%) |
| Bachelor's Degree or higher | 1,647 (84.6%) | 62 (3.2%) |
| Total | 2,044 (81.7%) | 253 (10.1%) |
Employment Occupations by Sex in Swarthmore borough
Management, Business, Science and Arts Occupations
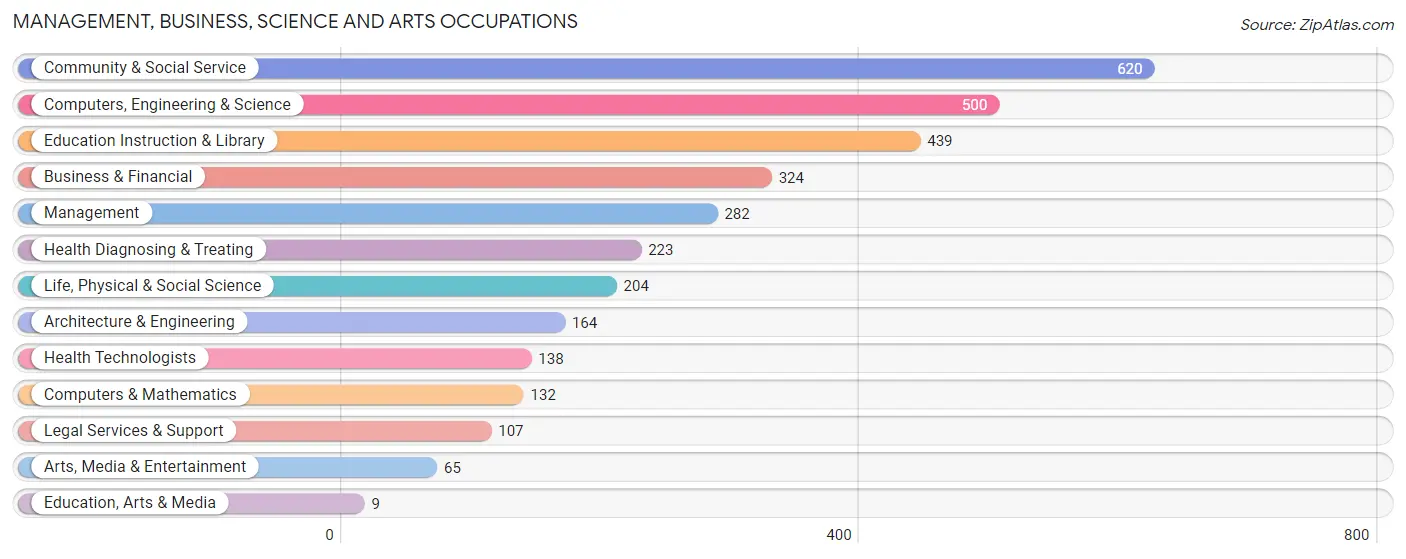
The most common Management, Business, Science and Arts occupations in Swarthmore borough are Community & Social Service (620 | 22.3%), Computers, Engineering & Science (500 | 18.0%), Education Instruction & Library (439 | 15.8%), Business & Financial (324 | 11.7%), and Management (282 | 10.2%).
Management, Business, Science and Arts Occupations by Sex
Within the Management, Business, Science and Arts occupations in Swarthmore borough, the most male-oriented occupations are Legal Services & Support (100.0%), Architecture & Engineering (82.3%), and Computers & Mathematics (77.3%), while the most female-oriented occupations are Education, Arts & Media (100.0%), Health Diagnosing & Treating (86.1%), and Health Technologists (77.5%).
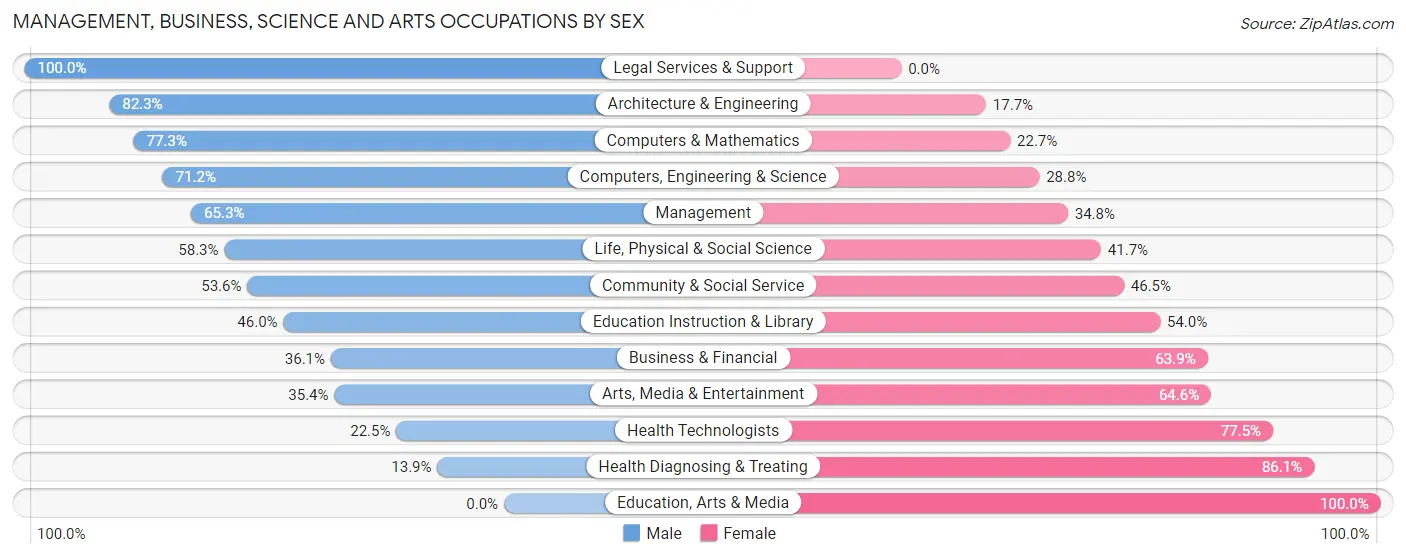
| Occupation | Male | Female |
| Management | 184 (65.2%) | 98 (34.7%) |
| Business & Financial | 117 (36.1%) | 207 (63.9%) |
| Computers, Engineering & Science | 356 (71.2%) | 144 (28.8%) |
| Computers & Mathematics | 102 (77.3%) | 30 (22.7%) |
| Architecture & Engineering | 135 (82.3%) | 29 (17.7%) |
| Life, Physical & Social Science | 119 (58.3%) | 85 (41.7%) |
| Community & Social Service | 332 (53.5%) | 288 (46.5%) |
| Education, Arts & Media | 0 (0.0%) | 9 (100.0%) |
| Legal Services & Support | 107 (100.0%) | 0 (0.0%) |
| Education Instruction & Library | 202 (46.0%) | 237 (54.0%) |
| Arts, Media & Entertainment | 23 (35.4%) | 42 (64.6%) |
| Health Diagnosing & Treating | 31 (13.9%) | 192 (86.1%) |
| Health Technologists | 31 (22.5%) | 107 (77.5%) |
| Total (Category) | 1,020 (52.3%) | 929 (47.7%) |
| Total (Overall) | 1,345 (48.4%) | 1,432 (51.6%) |
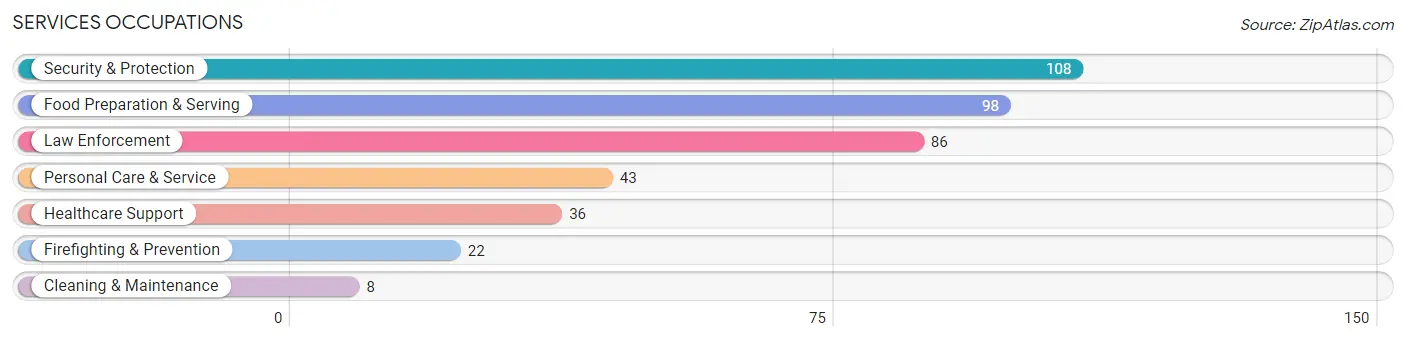
Services Occupations
The most common Services occupations in Swarthmore borough are Security & Protection (108 | 3.9%), Food Preparation & Serving (98 | 3.5%), Law Enforcement (86 | 3.1%), Personal Care & Service (43 | 1.5%), and Healthcare Support (36 | 1.3%).
Services Occupations by Sex
Within the Services occupations in Swarthmore borough, the most male-oriented occupations are Firefighting & Prevention (100.0%), Personal Care & Service (58.1%), and Food Preparation & Serving (44.9%), while the most female-oriented occupations are Law Enforcement (100.0%), Cleaning & Maintenance (100.0%), and Security & Protection (79.6%).
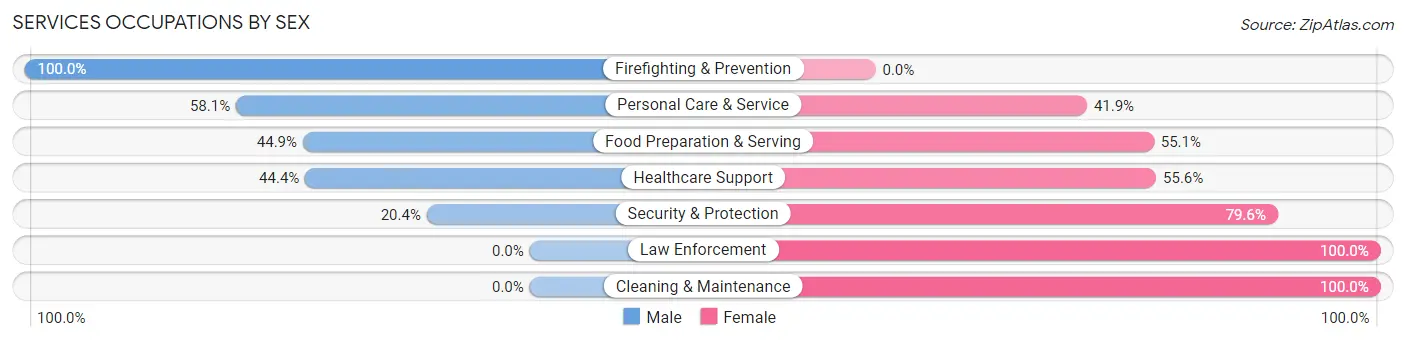
| Occupation | Male | Female |
| Healthcare Support | 16 (44.4%) | 20 (55.6%) |
| Security & Protection | 22 (20.4%) | 86 (79.6%) |
| Firefighting & Prevention | 22 (100.0%) | 0 (0.0%) |
| Law Enforcement | 0 (0.0%) | 86 (100.0%) |
| Food Preparation & Serving | 44 (44.9%) | 54 (55.1%) |
| Cleaning & Maintenance | 0 (0.0%) | 8 (100.0%) |
| Personal Care & Service | 25 (58.1%) | 18 (41.9%) |
| Total (Category) | 107 (36.5%) | 186 (63.5%) |
| Total (Overall) | 1,345 (48.4%) | 1,432 (51.6%) |
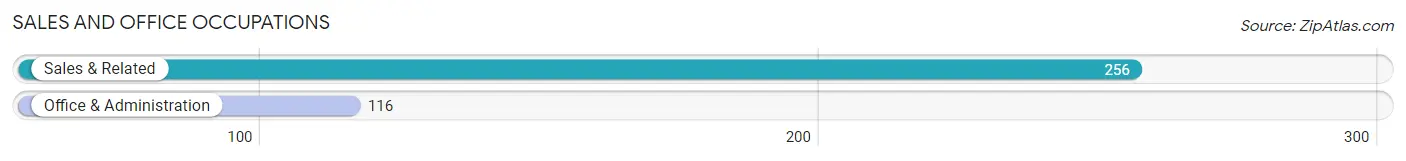
Sales and Office Occupations
The most common Sales and Office occupations in Swarthmore borough are Sales & Related (256 | 9.2%), and Office & Administration (116 | 4.2%).
Sales and Office Occupations by Sex
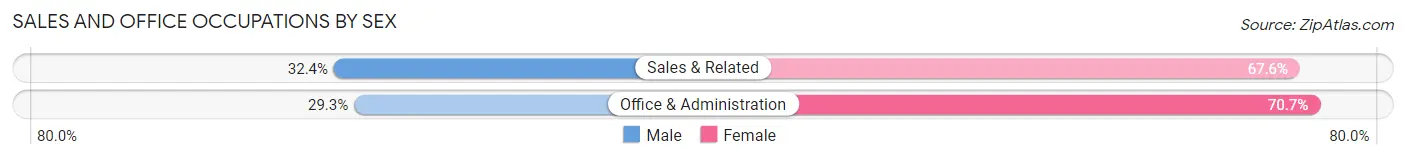
| Occupation | Male | Female |
| Sales & Related | 83 (32.4%) | 173 (67.6%) |
| Office & Administration | 34 (29.3%) | 82 (70.7%) |
| Total (Category) | 117 (31.5%) | 255 (68.5%) |
| Total (Overall) | 1,345 (48.4%) | 1,432 (51.6%) |
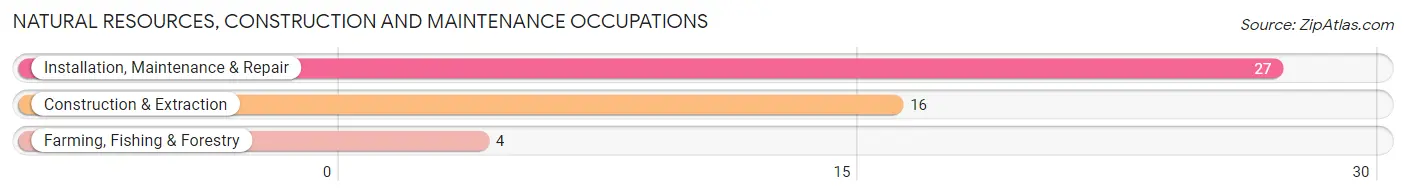
Natural Resources, Construction and Maintenance Occupations
The most common Natural Resources, Construction and Maintenance occupations in Swarthmore borough are Installation, Maintenance & Repair (27 | 1.0%), Construction & Extraction (16 | 0.6%), and Farming, Fishing & Forestry (4 | 0.1%).
Natural Resources, Construction and Maintenance Occupations by Sex
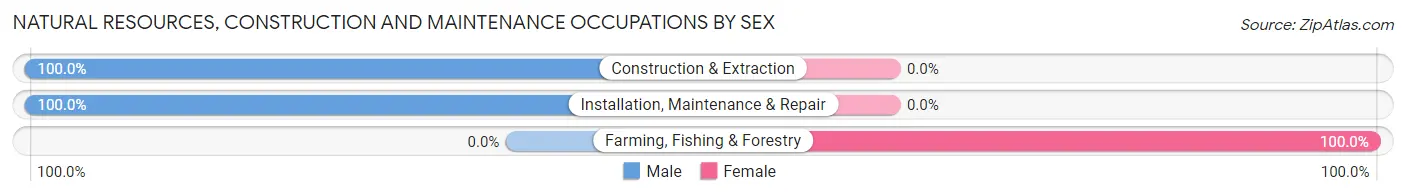
| Occupation | Male | Female |
| Farming, Fishing & Forestry | 0 (0.0%) | 4 (100.0%) |
| Construction & Extraction | 16 (100.0%) | 0 (0.0%) |
| Installation, Maintenance & Repair | 27 (100.0%) | 0 (0.0%) |
| Total (Category) | 43 (91.5%) | 4 (8.5%) |
| Total (Overall) | 1,345 (48.4%) | 1,432 (51.6%) |
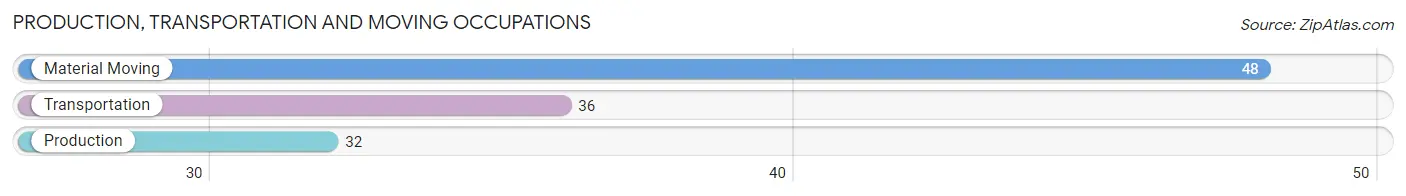
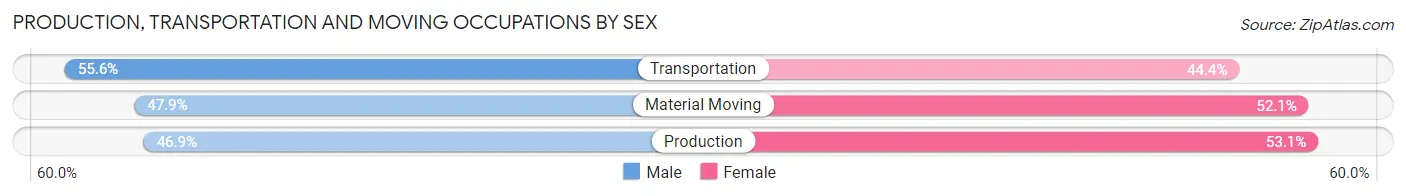
Production, Transportation and Moving Occupations
The most common Production, Transportation and Moving occupations in Swarthmore borough are Material Moving (48 | 1.7%), Transportation (36 | 1.3%), and Production (32 | 1.1%).
Production, Transportation and Moving Occupations by Sex
| Occupation | Male | Female |
| Production | 15 (46.9%) | 17 (53.1%) |
| Transportation | 20 (55.6%) | 16 (44.4%) |
| Material Moving | 23 (47.9%) | 25 (52.1%) |
| Total (Category) | 58 (50.0%) | 58 (50.0%) |
| Total (Overall) | 1,345 (48.4%) | 1,432 (51.6%) |
Employment Industries by Sex in Swarthmore borough
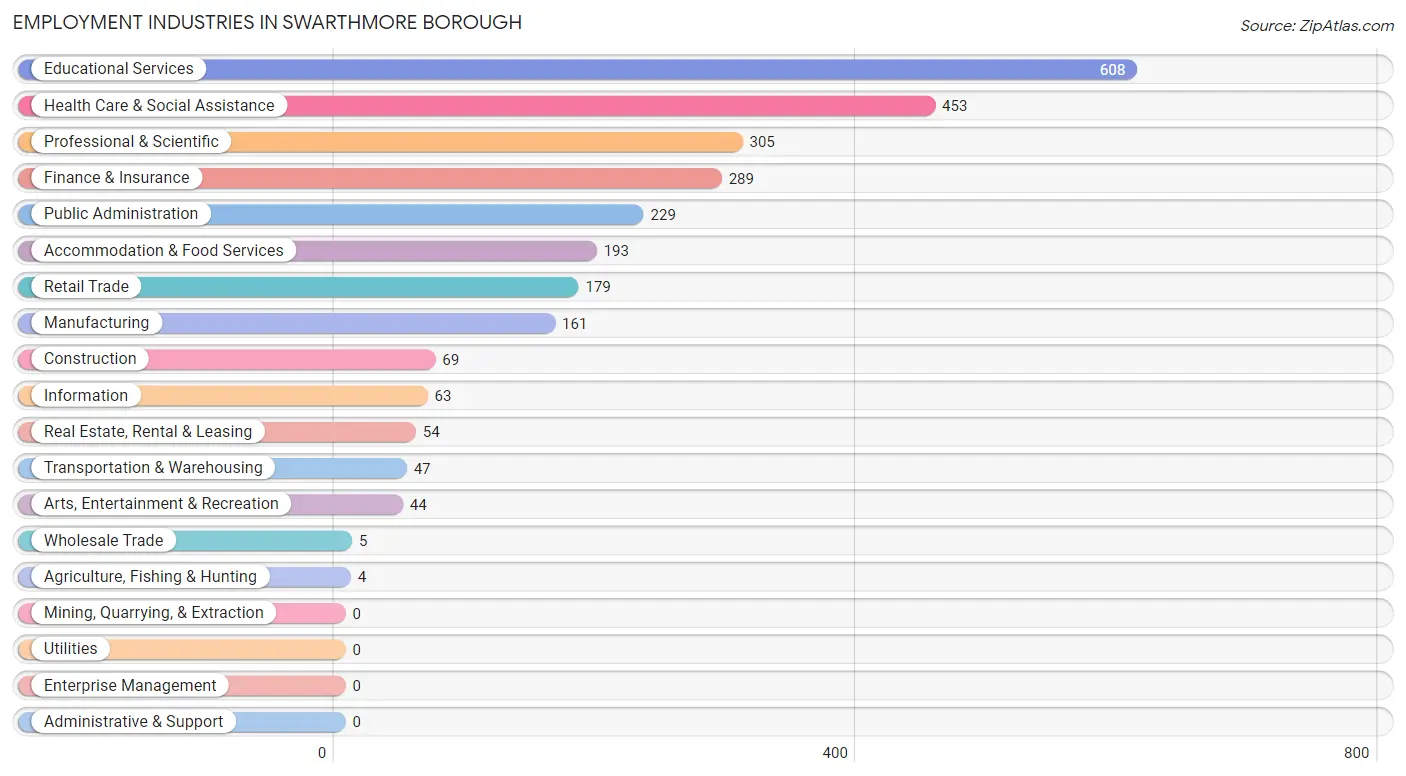
Employment Industries in Swarthmore borough
The major employment industries in Swarthmore borough include Educational Services (608 | 21.9%), Health Care & Social Assistance (453 | 16.3%), Professional & Scientific (305 | 11.0%), Finance & Insurance (289 | 10.4%), and Public Administration (229 | 8.3%).
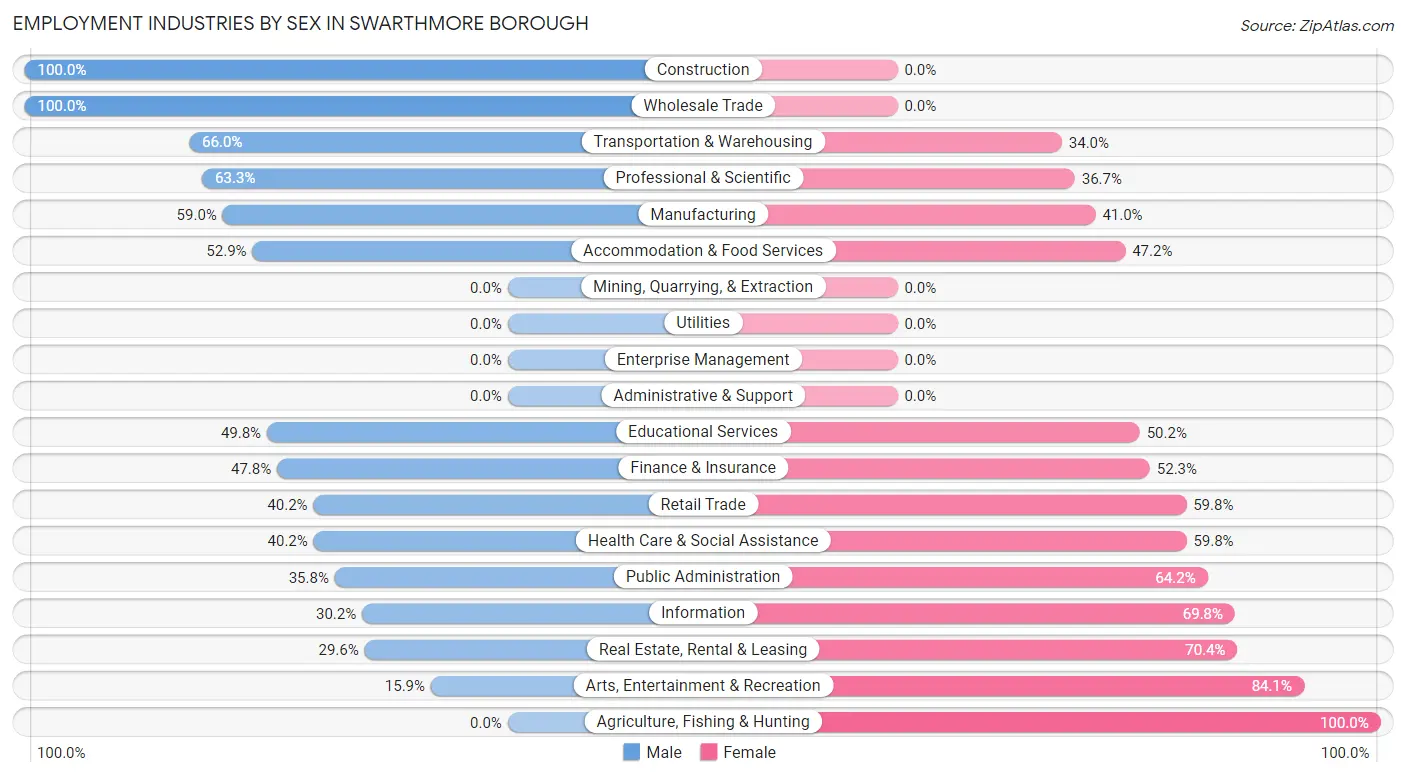
Employment Industries by Sex in Swarthmore borough
The Swarthmore borough industries that see more men than women are Construction (100.0%), Wholesale Trade (100.0%), and Transportation & Warehousing (66.0%), whereas the industries that tend to have a higher number of women are Agriculture, Fishing & Hunting (100.0%), Arts, Entertainment & Recreation (84.1%), and Real Estate, Rental & Leasing (70.4%).
| Industry | Male | Female |
| Agriculture, Fishing & Hunting | 0 (0.0%) | 4 (100.0%) |
| Mining, Quarrying, & Extraction | 0 (0.0%) | 0 (0.0%) |
| Construction | 69 (100.0%) | 0 (0.0%) |
| Manufacturing | 95 (59.0%) | 66 (41.0%) |
| Wholesale Trade | 5 (100.0%) | 0 (0.0%) |
| Retail Trade | 72 (40.2%) | 107 (59.8%) |
| Transportation & Warehousing | 31 (66.0%) | 16 (34.0%) |
| Utilities | 0 (0.0%) | 0 (0.0%) |
| Information | 19 (30.2%) | 44 (69.8%) |
| Finance & Insurance | 138 (47.7%) | 151 (52.2%) |
| Real Estate, Rental & Leasing | 16 (29.6%) | 38 (70.4%) |
| Professional & Scientific | 193 (63.3%) | 112 (36.7%) |
| Enterprise Management | 0 (0.0%) | 0 (0.0%) |
| Administrative & Support | 0 (0.0%) | 0 (0.0%) |
| Educational Services | 303 (49.8%) | 305 (50.2%) |
| Health Care & Social Assistance | 182 (40.2%) | 271 (59.8%) |
| Arts, Entertainment & Recreation | 7 (15.9%) | 37 (84.1%) |
| Accommodation & Food Services | 102 (52.8%) | 91 (47.1%) |
| Public Administration | 82 (35.8%) | 147 (64.2%) |
| Total | 1,345 (48.4%) | 1,432 (51.6%) |
Education in Swarthmore borough
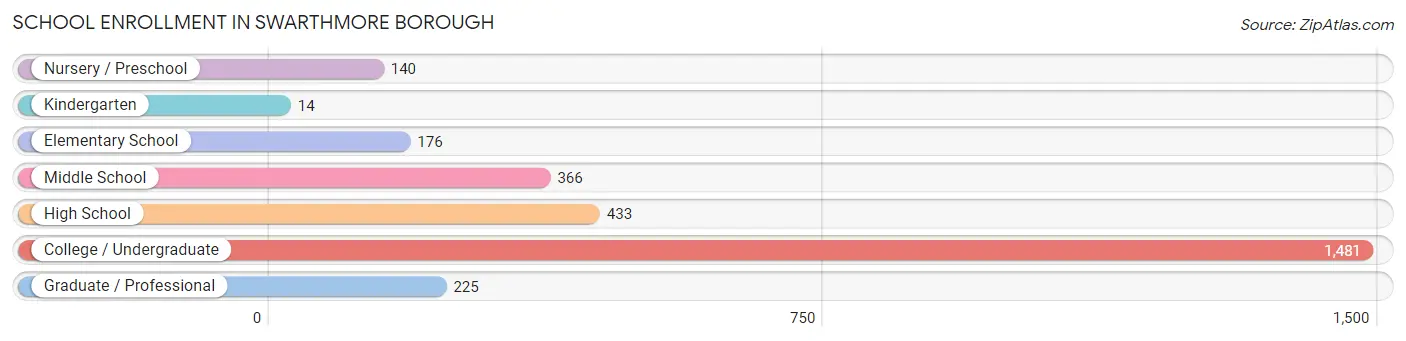
School Enrollment in Swarthmore borough
The most common levels of schooling among the 2,835 students in Swarthmore borough are college / undergraduate (1,481 | 52.2%), high school (433 | 15.3%), and middle school (366 | 12.9%).
| School Level | # Students | % Students |
| Nursery / Preschool | 140 | 4.9% |
| Kindergarten | 14 | 0.5% |
| Elementary School | 176 | 6.2% |
| Middle School | 366 | 12.9% |
| High School | 433 | 15.3% |
| College / Undergraduate | 1,481 | 52.2% |
| Graduate / Professional | 225 | 7.9% |
| Total | 2,835 | 100.0% |
School Enrollment by Age by Funding Source in Swarthmore borough
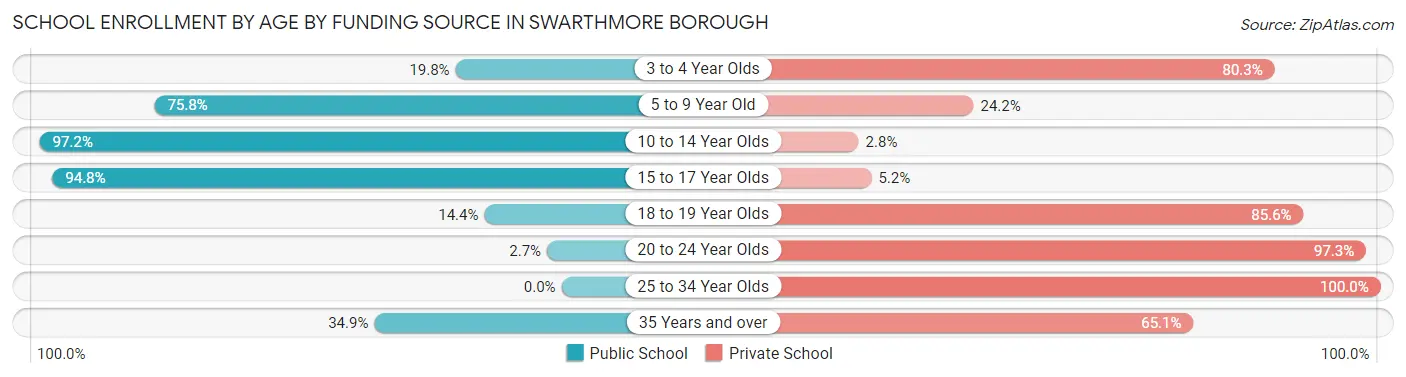
Out of a total of 2,835 students who are enrolled in schools in Swarthmore borough, 1,732 (61.1%) attend a private institution, while the remaining 1,103 (38.9%) are enrolled in public schools. The age group of 25 to 34 year olds has the highest likelihood of being enrolled in private schools, with 55 (100.0% in the age bracket) enrolled. Conversely, the age group of 10 to 14 year olds has the lowest likelihood of being enrolled in a private school, with 523 (97.2% in the age bracket) attending a public institution.
| Age Bracket | Public School | Private School |
| 3 to 4 Year Olds | 16 (19.8%) | 65 (80.2%) |
| 5 to 9 Year Old | 141 (75.8%) | 45 (24.2%) |
| 10 to 14 Year Olds | 523 (97.2%) | 15 (2.8%) |
| 15 to 17 Year Olds | 238 (94.8%) | 13 (5.2%) |
| 18 to 19 Year Olds | 118 (14.4%) | 703 (85.6%) |
| 20 to 24 Year Olds | 21 (2.7%) | 753 (97.3%) |
| 25 to 34 Year Olds | 0 (0.0%) | 55 (100.0%) |
| 35 Years and over | 45 (34.9%) | 84 (65.1%) |
| Total | 1,103 (38.9%) | 1,732 (61.1%) |
Educational Attainment by Field of Study in Swarthmore borough
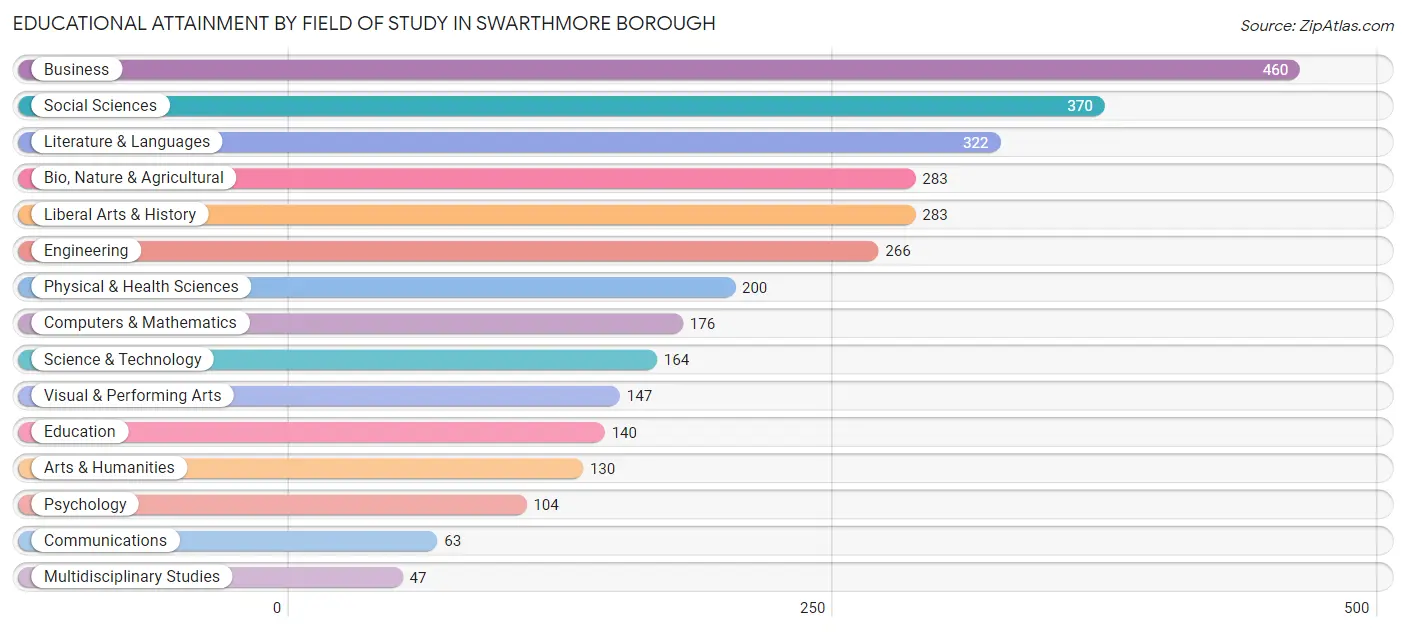
Business (460 | 14.6%), social sciences (370 | 11.7%), literature & languages (322 | 10.2%), bio, nature & agricultural (283 | 9.0%), and liberal arts & history (283 | 9.0%) are the most common fields of study among 3,155 individuals in Swarthmore borough who have obtained a bachelor's degree or higher.
| Field of Study | # Graduates | % Graduates |
| Computers & Mathematics | 176 | 5.6% |
| Bio, Nature & Agricultural | 283 | 9.0% |
| Physical & Health Sciences | 200 | 6.3% |
| Psychology | 104 | 3.3% |
| Social Sciences | 370 | 11.7% |
| Engineering | 266 | 8.4% |
| Multidisciplinary Studies | 47 | 1.5% |
| Science & Technology | 164 | 5.2% |
| Business | 460 | 14.6% |
| Education | 140 | 4.4% |
| Literature & Languages | 322 | 10.2% |
| Liberal Arts & History | 283 | 9.0% |
| Visual & Performing Arts | 147 | 4.7% |
| Communications | 63 | 2.0% |
| Arts & Humanities | 130 | 4.1% |
| Total | 3,155 | 100.0% |
Transportation & Commute in Swarthmore borough
Vehicle Availability by Sex in Swarthmore borough
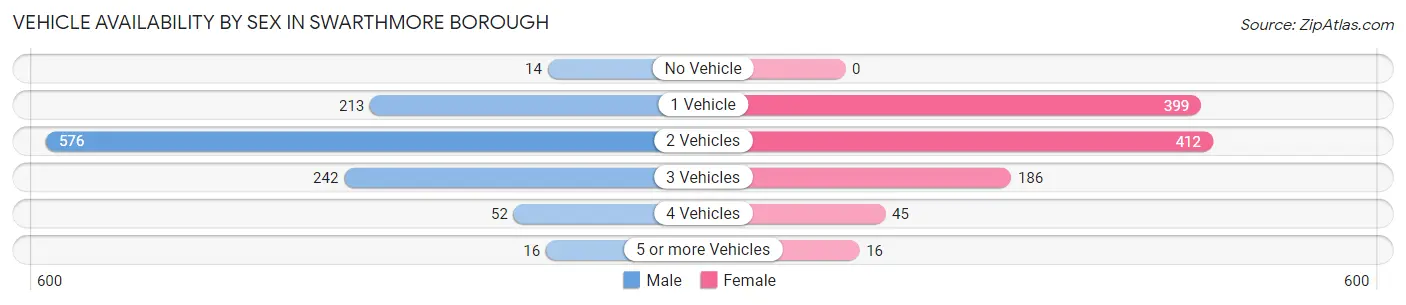
The most prevalent vehicle ownership categories in Swarthmore borough are males with 2 vehicles (576, accounting for 51.7%) and females with 2 vehicles (412, making up 54.4%).
| Vehicles Available | Male | Female |
| No Vehicle | 14 (1.3%) | 0 (0.0%) |
| 1 Vehicle | 213 (19.1%) | 399 (37.7%) |
| 2 Vehicles | 576 (51.7%) | 412 (38.9%) |
| 3 Vehicles | 242 (21.7%) | 186 (17.6%) |
| 4 Vehicles | 52 (4.7%) | 45 (4.3%) |
| 5 or more Vehicles | 16 (1.4%) | 16 (1.5%) |
| Total | 1,113 (100.0%) | 1,058 (100.0%) |
Commute Time in Swarthmore borough
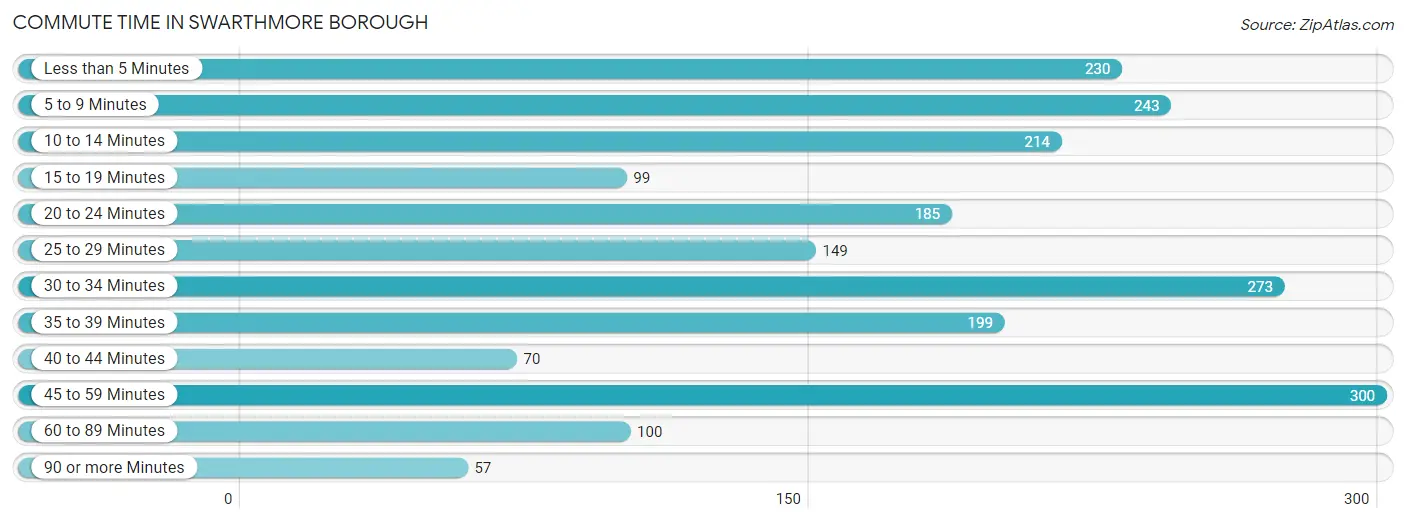
The most frequently occuring commute durations in Swarthmore borough are 45 to 59 minutes (300 commuters, 14.2%), 30 to 34 minutes (273 commuters, 12.9%), and 5 to 9 minutes (243 commuters, 11.5%).
| Commute Time | # Commuters | % Commuters |
| Less than 5 Minutes | 230 | 10.8% |
| 5 to 9 Minutes | 243 | 11.5% |
| 10 to 14 Minutes | 214 | 10.1% |
| 15 to 19 Minutes | 99 | 4.7% |
| 20 to 24 Minutes | 185 | 8.7% |
| 25 to 29 Minutes | 149 | 7.0% |
| 30 to 34 Minutes | 273 | 12.9% |
| 35 to 39 Minutes | 199 | 9.4% |
| 40 to 44 Minutes | 70 | 3.3% |
| 45 to 59 Minutes | 300 | 14.2% |
| 60 to 89 Minutes | 100 | 4.7% |
| 90 or more Minutes | 57 | 2.7% |
Commute Time by Sex in Swarthmore borough
The most common commute times in Swarthmore borough are 30 to 34 minutes (188 commuters, 17.7%) for males and less than 5 minutes (215 commuters, 20.3%) for females.
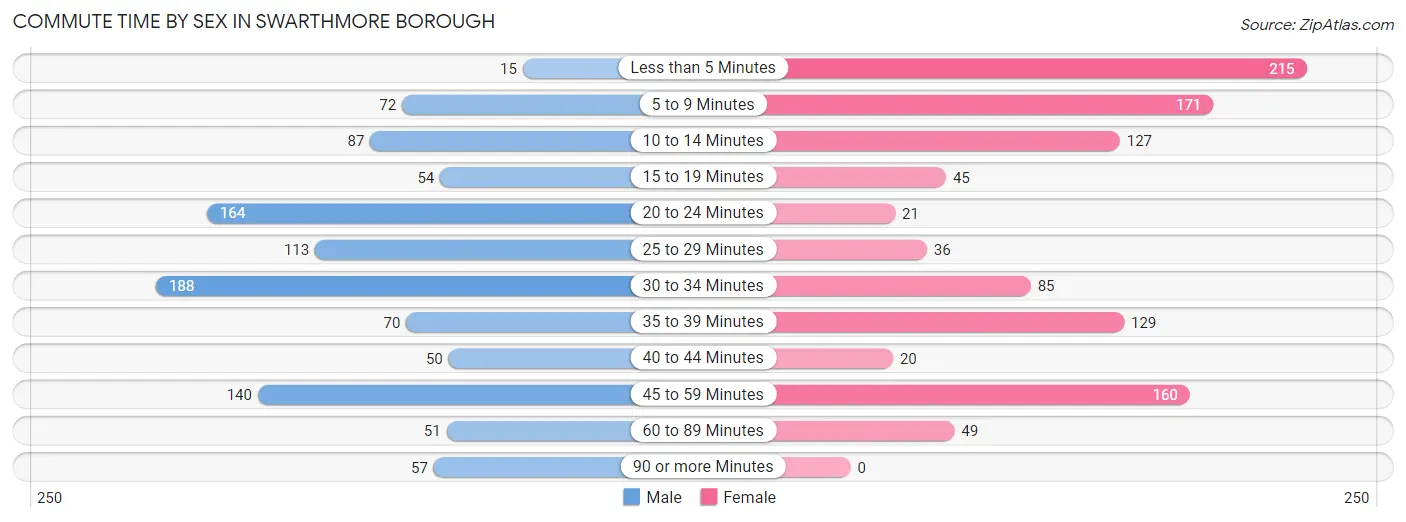
| Commute Time | Male | Female |
| Less than 5 Minutes | 15 (1.4%) | 215 (20.3%) |
| 5 to 9 Minutes | 72 (6.8%) | 171 (16.2%) |
| 10 to 14 Minutes | 87 (8.2%) | 127 (12.0%) |
| 15 to 19 Minutes | 54 (5.1%) | 45 (4.3%) |
| 20 to 24 Minutes | 164 (15.5%) | 21 (2.0%) |
| 25 to 29 Minutes | 113 (10.6%) | 36 (3.4%) |
| 30 to 34 Minutes | 188 (17.7%) | 85 (8.0%) |
| 35 to 39 Minutes | 70 (6.6%) | 129 (12.2%) |
| 40 to 44 Minutes | 50 (4.7%) | 20 (1.9%) |
| 45 to 59 Minutes | 140 (13.2%) | 160 (15.1%) |
| 60 to 89 Minutes | 51 (4.8%) | 49 (4.6%) |
| 90 or more Minutes | 57 (5.4%) | 0 (0.0%) |
Time of Departure to Work by Sex in Swarthmore borough
The most frequent times of departure to work in Swarthmore borough are 7:00 AM to 7:29 AM (189, 17.8%) for males and 8:00 AM to 8:29 AM (382, 36.1%) for females.
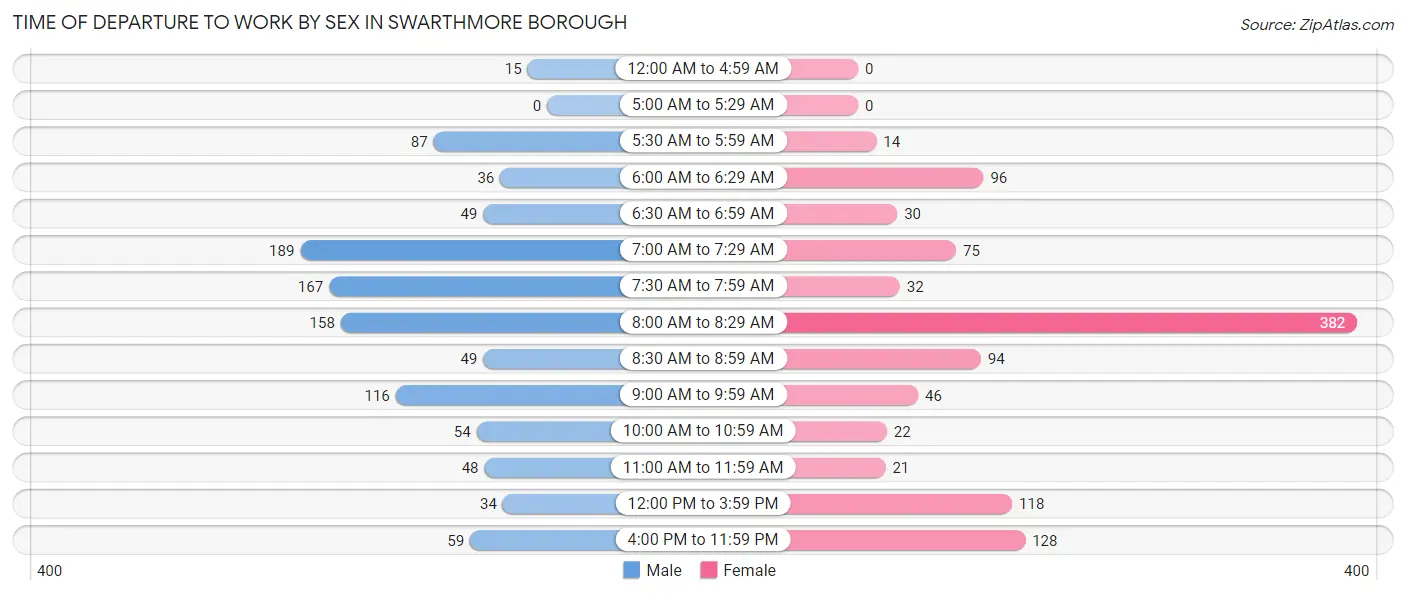
| Time of Departure | Male | Female |
| 12:00 AM to 4:59 AM | 15 (1.4%) | 0 (0.0%) |
| 5:00 AM to 5:29 AM | 0 (0.0%) | 0 (0.0%) |
| 5:30 AM to 5:59 AM | 87 (8.2%) | 14 (1.3%) |
| 6:00 AM to 6:29 AM | 36 (3.4%) | 96 (9.1%) |
| 6:30 AM to 6:59 AM | 49 (4.6%) | 30 (2.8%) |
| 7:00 AM to 7:29 AM | 189 (17.8%) | 75 (7.1%) |
| 7:30 AM to 7:59 AM | 167 (15.7%) | 32 (3.0%) |
| 8:00 AM to 8:29 AM | 158 (14.9%) | 382 (36.1%) |
| 8:30 AM to 8:59 AM | 49 (4.6%) | 94 (8.9%) |
| 9:00 AM to 9:59 AM | 116 (10.9%) | 46 (4.3%) |
| 10:00 AM to 10:59 AM | 54 (5.1%) | 22 (2.1%) |
| 11:00 AM to 11:59 AM | 48 (4.5%) | 21 (2.0%) |
| 12:00 PM to 3:59 PM | 34 (3.2%) | 118 (11.2%) |
| 4:00 PM to 11:59 PM | 59 (5.6%) | 128 (12.1%) |
| Total | 1,061 (100.0%) | 1,058 (100.0%) |
Housing Occupancy in Swarthmore borough
Occupancy by Ownership in Swarthmore borough
Of the total 2,151 dwellings in Swarthmore borough, owner-occupied units account for 1,671 (77.7%), while renter-occupied units make up 480 (22.3%).
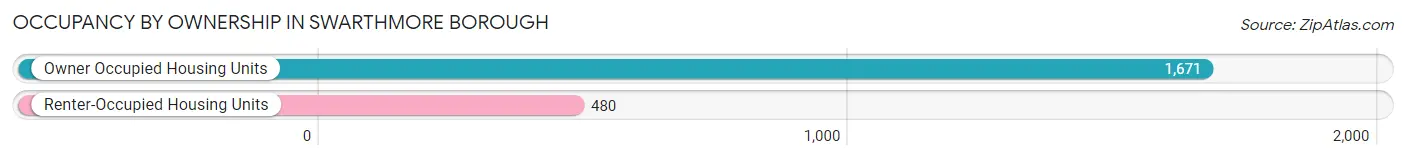
| Occupancy | # Housing Units | % Housing Units |
| Owner Occupied Housing Units | 1,671 | 77.7% |
| Renter-Occupied Housing Units | 480 | 22.3% |
| Total Occupied Housing Units | 2,151 | 100.0% |
Occupancy by Household Size in Swarthmore borough
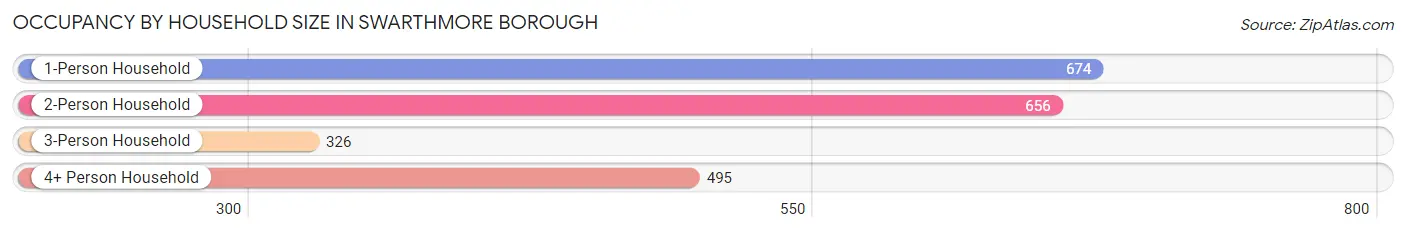
| Household Size | # Housing Units | % Housing Units |
| 1-Person Household | 674 | 31.3% |
| 2-Person Household | 656 | 30.5% |
| 3-Person Household | 326 | 15.2% |
| 4+ Person Household | 495 | 23.0% |
| Total Housing Units | 2,151 | 100.0% |
Occupancy by Ownership by Household Size in Swarthmore borough
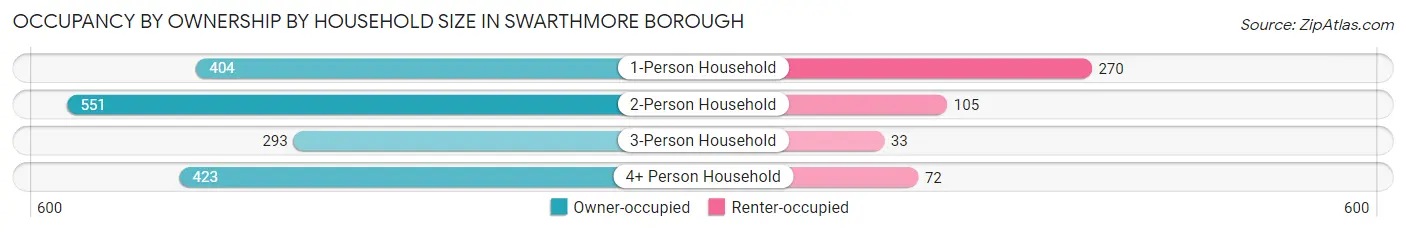
| Household Size | Owner-occupied | Renter-occupied |
| 1-Person Household | 404 (59.9%) | 270 (40.1%) |
| 2-Person Household | 551 (84.0%) | 105 (16.0%) |
| 3-Person Household | 293 (89.9%) | 33 (10.1%) |
| 4+ Person Household | 423 (85.5%) | 72 (14.5%) |
| Total Housing Units | 1,671 (77.7%) | 480 (22.3%) |
Occupancy by Educational Attainment in Swarthmore borough
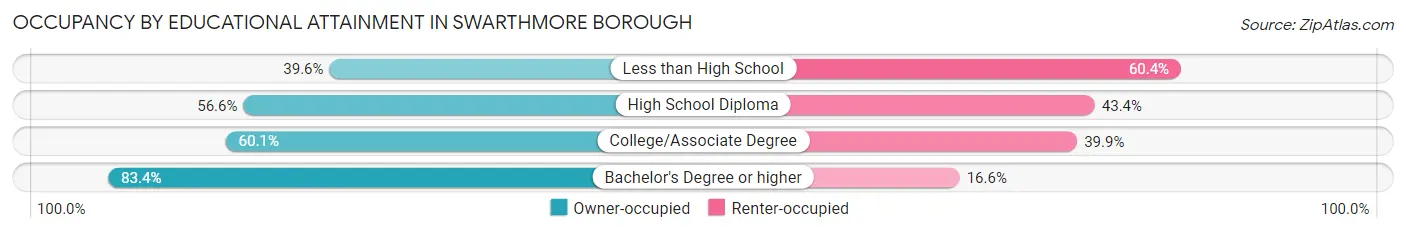
| Household Size | Owner-occupied | Renter-occupied |
| Less than High School | 19 (39.6%) | 29 (60.4%) |
| High School Diploma | 81 (56.6%) | 62 (43.4%) |
| College/Associate Degree | 166 (60.1%) | 110 (39.9%) |
| Bachelor's Degree or higher | 1,405 (83.4%) | 279 (16.6%) |
Occupancy by Age of Householder in Swarthmore borough
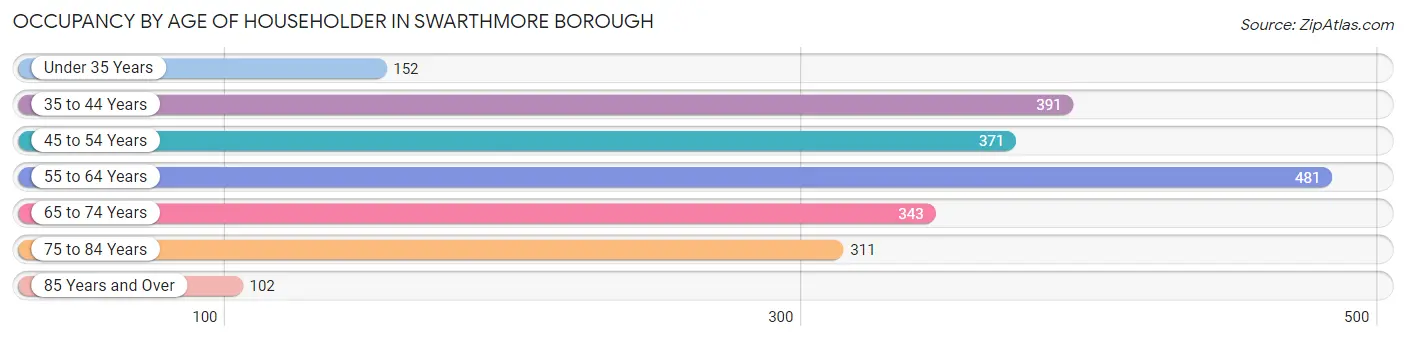
| Age Bracket | # Households | % Households |
| Under 35 Years | 152 | 7.1% |
| 35 to 44 Years | 391 | 18.2% |
| 45 to 54 Years | 371 | 17.2% |
| 55 to 64 Years | 481 | 22.4% |
| 65 to 74 Years | 343 | 16.0% |
| 75 to 84 Years | 311 | 14.5% |
| 85 Years and Over | 102 | 4.7% |
| Total | 2,151 | 100.0% |
Housing Finances in Swarthmore borough
Median Income by Occupancy in Swarthmore borough
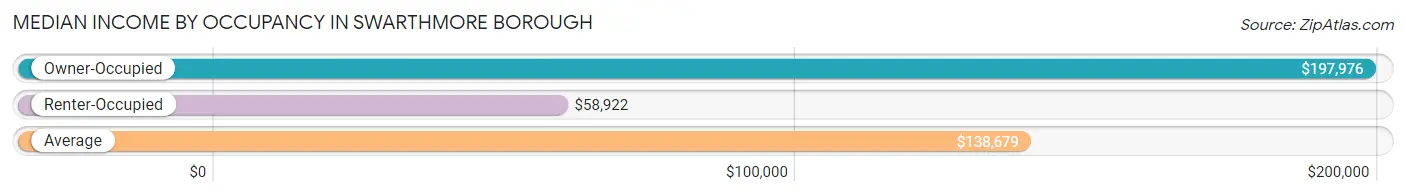
| Occupancy Type | # Households | Median Income |
| Owner-Occupied | 1,671 (77.7%) | $197,976 |
| Renter-Occupied | 480 (22.3%) | $58,922 |
| Average | 2,151 (100.0%) | $138,679 |
Occupancy by Householder Income Bracket in Swarthmore borough
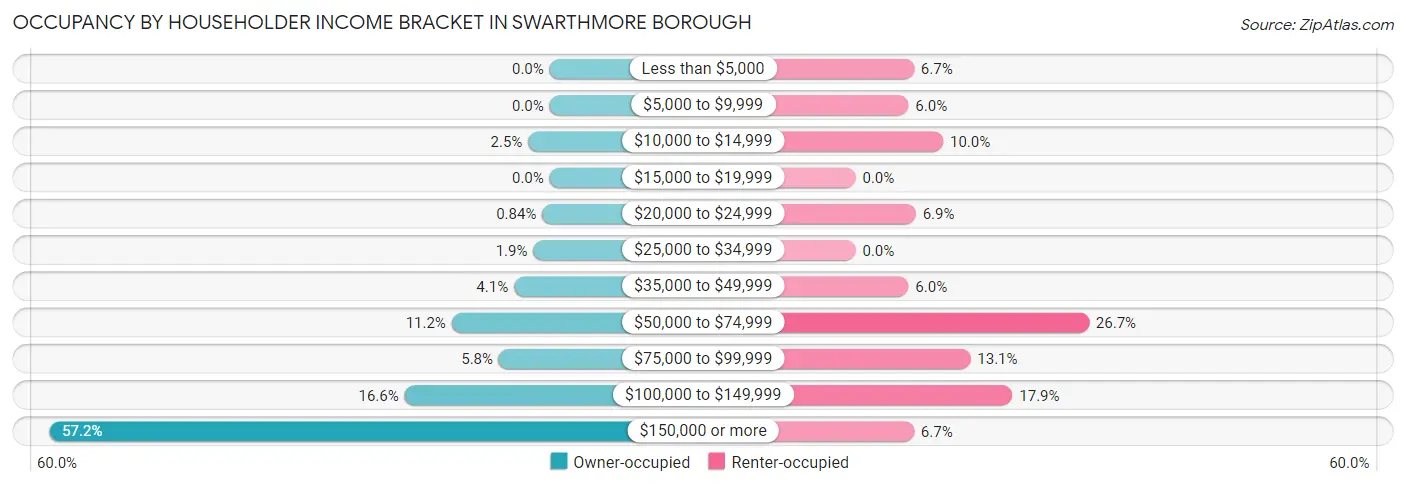
| Income Bracket | Owner-occupied | Renter-occupied |
| Less than $5,000 | 0 (0.0%) | 32 (6.7%) |
| $5,000 to $9,999 | 0 (0.0%) | 29 (6.0%) |
| $10,000 to $14,999 | 41 (2.5%) | 48 (10.0%) |
| $15,000 to $19,999 | 0 (0.0%) | 0 (0.0%) |
| $20,000 to $24,999 | 14 (0.8%) | 33 (6.9%) |
| $25,000 to $34,999 | 31 (1.9%) | 0 (0.0%) |
| $35,000 to $49,999 | 68 (4.1%) | 29 (6.0%) |
| $50,000 to $74,999 | 187 (11.2%) | 128 (26.7%) |
| $75,000 to $99,999 | 97 (5.8%) | 63 (13.1%) |
| $100,000 to $149,999 | 277 (16.6%) | 86 (17.9%) |
| $150,000 or more | 956 (57.2%) | 32 (6.7%) |
| Total | 1,671 (100.0%) | 480 (100.0%) |
Monthly Housing Cost Tiers in Swarthmore borough
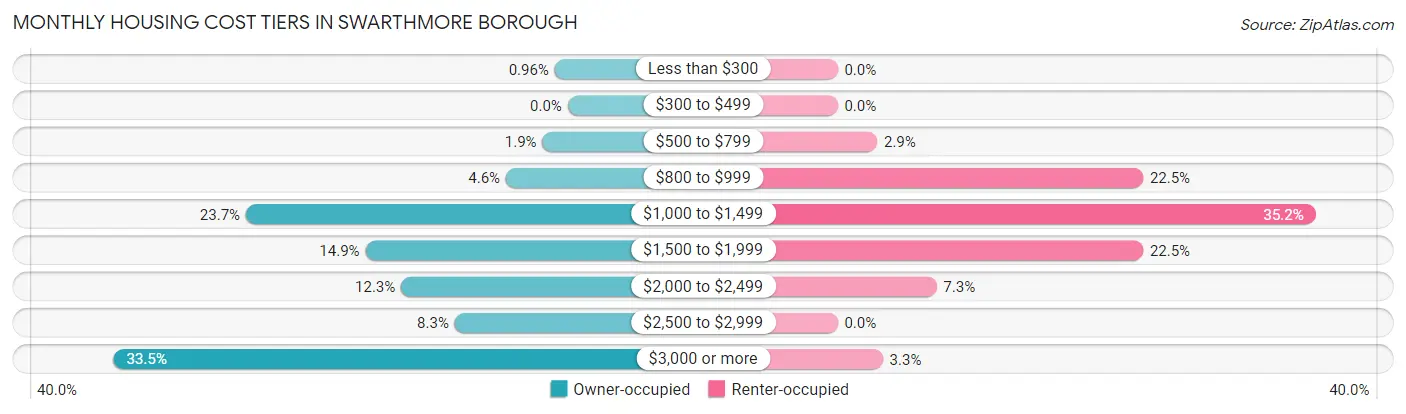
| Monthly Cost | Owner-occupied | Renter-occupied |
| Less than $300 | 16 (1.0%) | 0 (0.0%) |
| $300 to $499 | 0 (0.0%) | 0 (0.0%) |
| $500 to $799 | 31 (1.9%) | 14 (2.9%) |
| $800 to $999 | 76 (4.5%) | 108 (22.5%) |
| $1,000 to $1,499 | 396 (23.7%) | 169 (35.2%) |
| $1,500 to $1,999 | 249 (14.9%) | 108 (22.5%) |
| $2,000 to $2,499 | 205 (12.3%) | 35 (7.3%) |
| $2,500 to $2,999 | 139 (8.3%) | 0 (0.0%) |
| $3,000 or more | 559 (33.5%) | 16 (3.3%) |
| Total | 1,671 (100.0%) | 480 (100.0%) |
Physical Housing Characteristics in Swarthmore borough
Housing Structures in Swarthmore borough
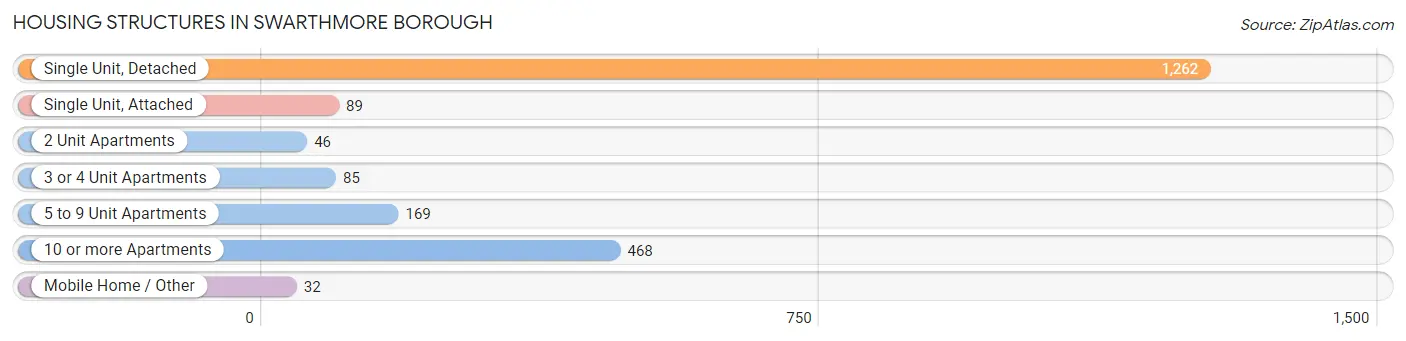
| Structure Type | # Housing Units | % Housing Units |
| Single Unit, Detached | 1,262 | 58.7% |
| Single Unit, Attached | 89 | 4.1% |
| 2 Unit Apartments | 46 | 2.1% |
| 3 or 4 Unit Apartments | 85 | 4.0% |
| 5 to 9 Unit Apartments | 169 | 7.9% |
| 10 or more Apartments | 468 | 21.8% |
| Mobile Home / Other | 32 | 1.5% |
| Total | 2,151 | 100.0% |
Housing Structures by Occupancy in Swarthmore borough
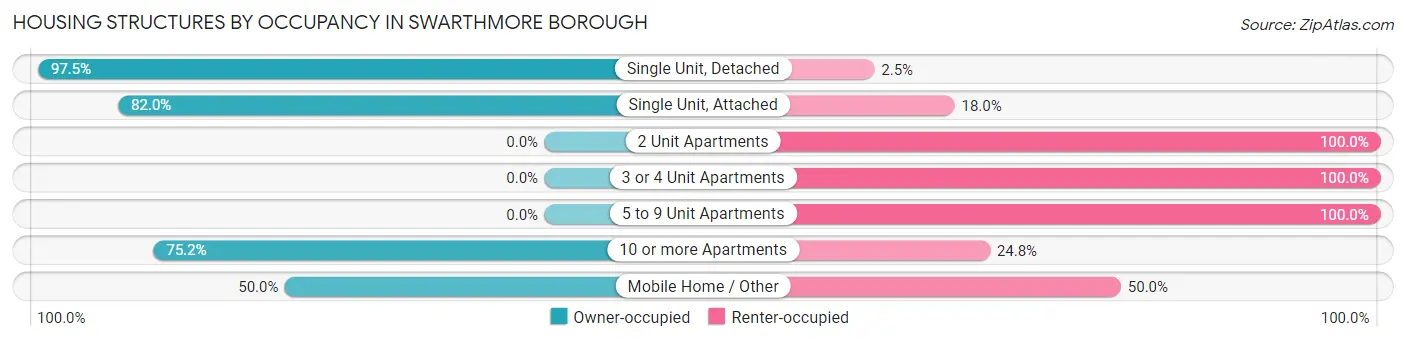
| Structure Type | Owner-occupied | Renter-occupied |
| Single Unit, Detached | 1,230 (97.5%) | 32 (2.5%) |
| Single Unit, Attached | 73 (82.0%) | 16 (18.0%) |
| 2 Unit Apartments | 0 (0.0%) | 46 (100.0%) |
| 3 or 4 Unit Apartments | 0 (0.0%) | 85 (100.0%) |
| 5 to 9 Unit Apartments | 0 (0.0%) | 169 (100.0%) |
| 10 or more Apartments | 352 (75.2%) | 116 (24.8%) |
| Mobile Home / Other | 16 (50.0%) | 16 (50.0%) |
| Total | 1,671 (77.7%) | 480 (22.3%) |
Housing Structures by Number of Rooms in Swarthmore borough
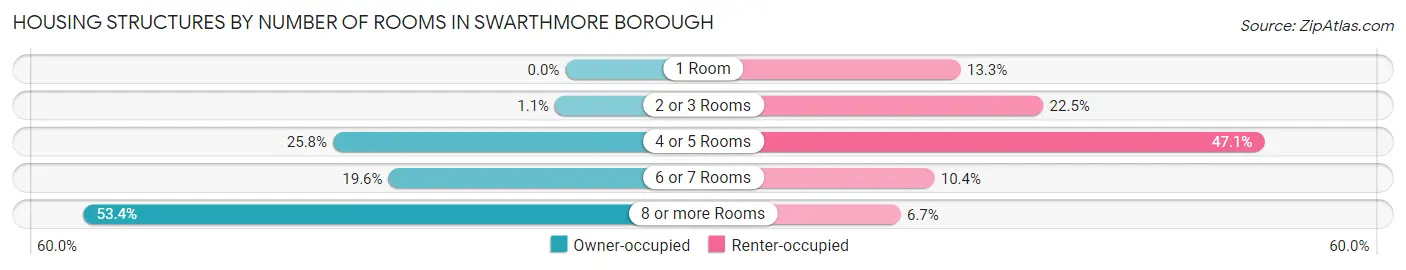
| Number of Rooms | Owner-occupied | Renter-occupied |
| 1 Room | 0 (0.0%) | 64 (13.3%) |
| 2 or 3 Rooms | 19 (1.1%) | 108 (22.5%) |
| 4 or 5 Rooms | 431 (25.8%) | 226 (47.1%) |
| 6 or 7 Rooms | 328 (19.6%) | 50 (10.4%) |
| 8 or more Rooms | 893 (53.4%) | 32 (6.7%) |
| Total | 1,671 (100.0%) | 480 (100.0%) |
Housing Structure by Heating Type in Swarthmore borough
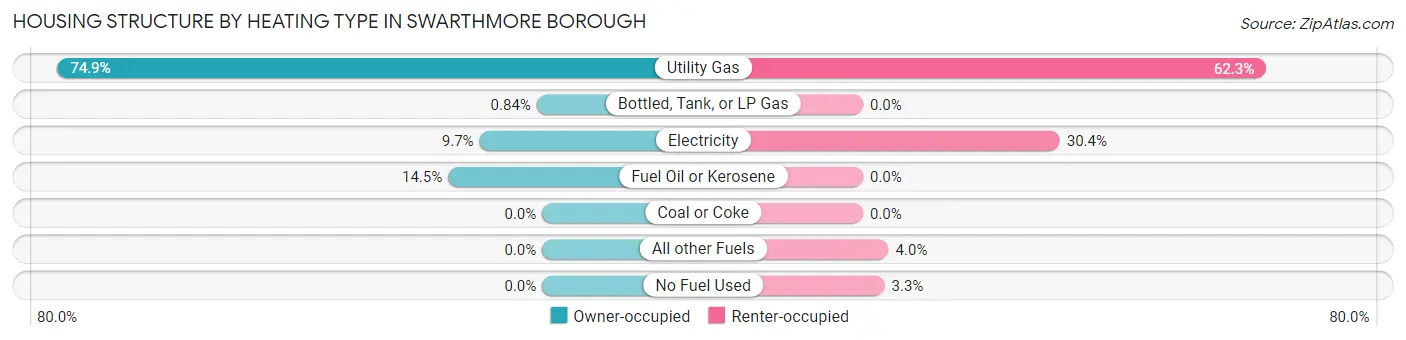
| Heating Type | Owner-occupied | Renter-occupied |
| Utility Gas | 1,252 (74.9%) | 299 (62.3%) |
| Bottled, Tank, or LP Gas | 14 (0.8%) | 0 (0.0%) |
| Electricity | 162 (9.7%) | 146 (30.4%) |
| Fuel Oil or Kerosene | 243 (14.5%) | 0 (0.0%) |
| Coal or Coke | 0 (0.0%) | 0 (0.0%) |
| All other Fuels | 0 (0.0%) | 19 (4.0%) |
| No Fuel Used | 0 (0.0%) | 16 (3.3%) |
| Total | 1,671 (100.0%) | 480 (100.0%) |
Household Vehicle Usage in Swarthmore borough
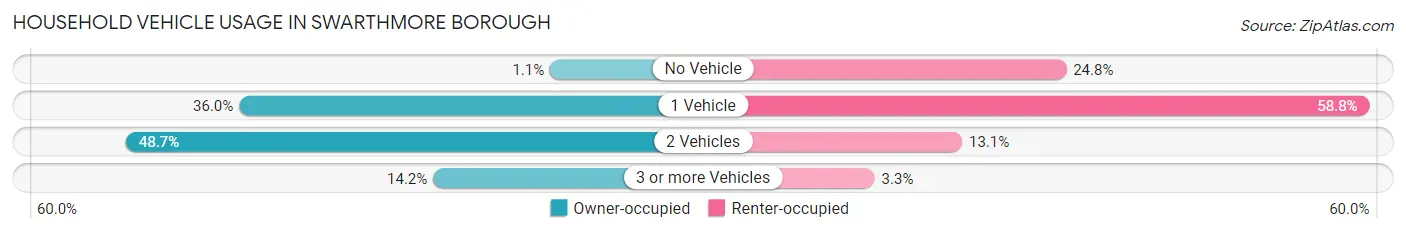
| Vehicles per Household | Owner-occupied | Renter-occupied |
| No Vehicle | 19 (1.1%) | 119 (24.8%) |
| 1 Vehicle | 601 (36.0%) | 282 (58.8%) |
| 2 Vehicles | 813 (48.6%) | 63 (13.1%) |
| 3 or more Vehicles | 238 (14.2%) | 16 (3.3%) |
| Total | 1,671 (100.0%) | 480 (100.0%) |
Real Estate & Mortgages in Swarthmore borough
Real Estate and Mortgage Overview in Swarthmore borough
| Characteristic | Without Mortgage | With Mortgage |
| Housing Units | 888 | 783 |
| Median Property Value | $422,400 | $568,600 |
| Median Household Income | $117,917 | $556 |
| Monthly Housing Costs | $1,376 | $527 |
| Real Estate Taxes | $9,792 | $0 |
Property Value by Mortgage Status in Swarthmore borough
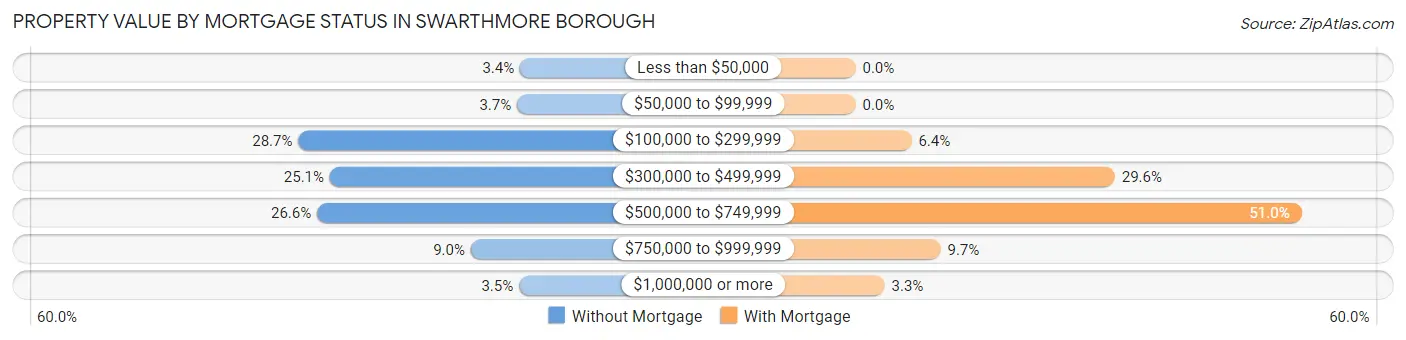
| Property Value | Without Mortgage | With Mortgage |
| Less than $50,000 | 30 (3.4%) | 0 (0.0%) |
| $50,000 to $99,999 | 33 (3.7%) | 0 (0.0%) |
| $100,000 to $299,999 | 255 (28.7%) | 50 (6.4%) |
| $300,000 to $499,999 | 223 (25.1%) | 232 (29.6%) |
| $500,000 to $749,999 | 236 (26.6%) | 399 (51.0%) |
| $750,000 to $999,999 | 80 (9.0%) | 76 (9.7%) |
| $1,000,000 or more | 31 (3.5%) | 26 (3.3%) |
| Total | 888 (100.0%) | 783 (100.0%) |
Household Income by Mortgage Status in Swarthmore borough
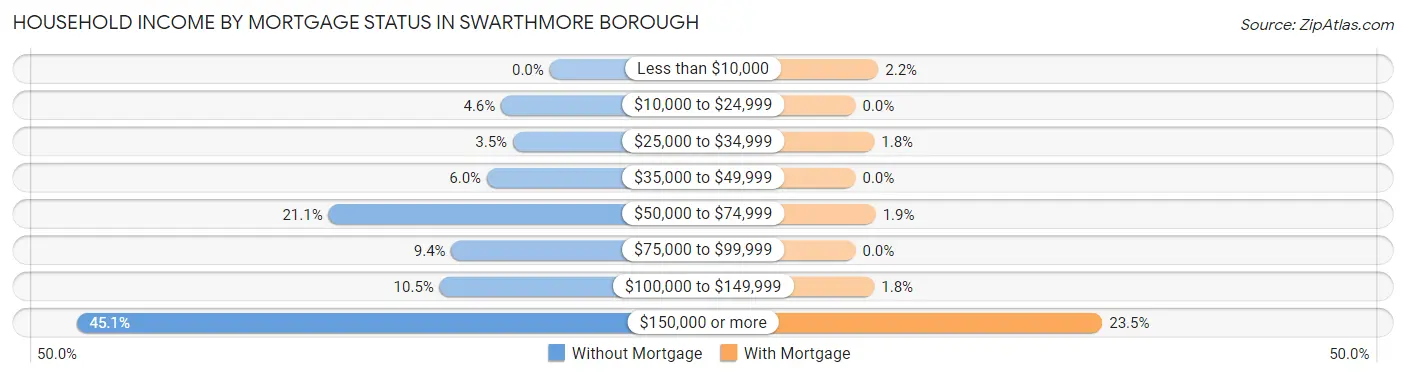
| Household Income | Without Mortgage | With Mortgage |
| Less than $10,000 | 0 (0.0%) | 17 (2.2%) |
| $10,000 to $24,999 | 41 (4.6%) | 0 (0.0%) |
| $25,000 to $34,999 | 31 (3.5%) | 14 (1.8%) |
| $35,000 to $49,999 | 53 (6.0%) | 0 (0.0%) |
| $50,000 to $74,999 | 187 (21.1%) | 15 (1.9%) |
| $75,000 to $99,999 | 83 (9.3%) | 0 (0.0%) |
| $100,000 to $149,999 | 93 (10.5%) | 14 (1.8%) |
| $150,000 or more | 400 (45.1%) | 184 (23.5%) |
| Total | 888 (100.0%) | 783 (100.0%) |
Property Value to Household Income Ratio in Swarthmore borough
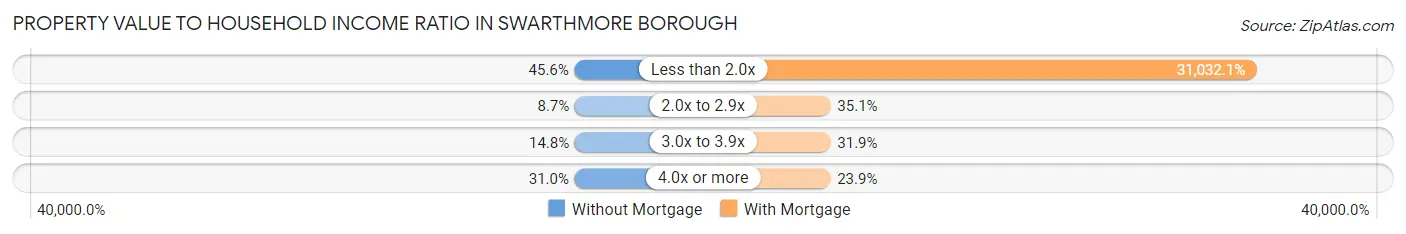
| Value-to-Income Ratio | Without Mortgage | With Mortgage |
| Less than 2.0x | 405 (45.6%) | 242,981 (31,032.1%) |
| 2.0x to 2.9x | 77 (8.7%) | 275 (35.1%) |
| 3.0x to 3.9x | 131 (14.7%) | 250 (31.9%) |
| 4.0x or more | 275 (31.0%) | 187 (23.9%) |
| Total | 888 (100.0%) | 783 (100.0%) |
Real Estate Taxes by Mortgage Status in Swarthmore borough
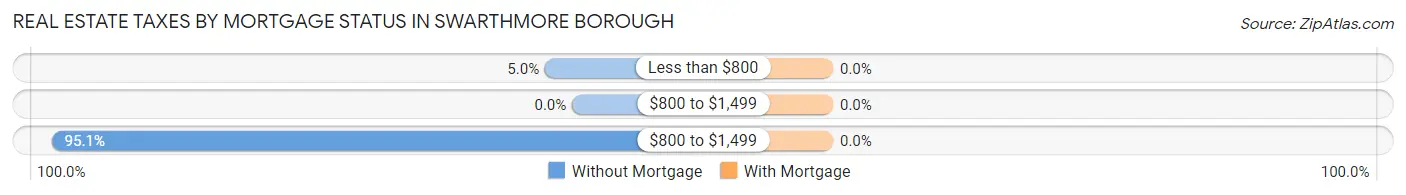
| Property Taxes | Without Mortgage | With Mortgage |
| Less than $800 | 44 (5.0%) | 0 (0.0%) |
| $800 to $1,499 | 0 (0.0%) | 0 (0.0%) |
| $800 to $1,499 | 844 (95.1%) | 0 (0.0%) |
| Total | 888 (100.0%) | 783 (100.0%) |
Health & Disability in Swarthmore borough
Health Insurance Coverage by Age in Swarthmore borough
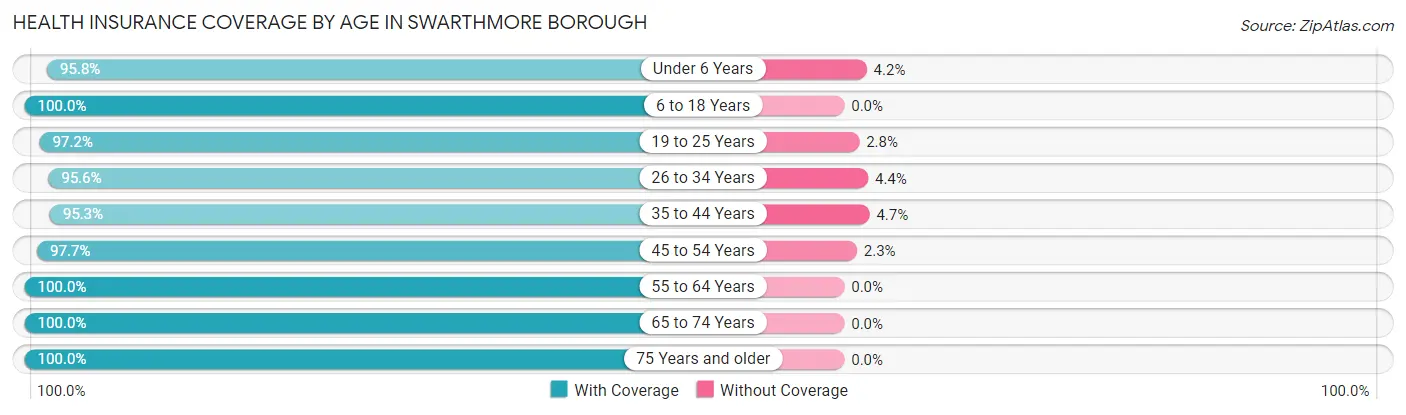
| Age Bracket | With Coverage | Without Coverage |
| Under 6 Years | 322 (95.8%) | 14 (4.2%) |
| 6 to 18 Years | 1,276 (100.0%) | 0 (0.0%) |
| 19 to 25 Years | 1,261 (97.2%) | 36 (2.8%) |
| 26 to 34 Years | 345 (95.6%) | 16 (4.4%) |
| 35 to 44 Years | 690 (95.3%) | 34 (4.7%) |
| 45 to 54 Years | 667 (97.7%) | 16 (2.3%) |
| 55 to 64 Years | 709 (100.0%) | 0 (0.0%) |
| 65 to 74 Years | 536 (100.0%) | 0 (0.0%) |
| 75 Years and older | 585 (100.0%) | 0 (0.0%) |
| Total | 6,391 (98.2%) | 116 (1.8%) |
Health Insurance Coverage by Citizenship Status in Swarthmore borough
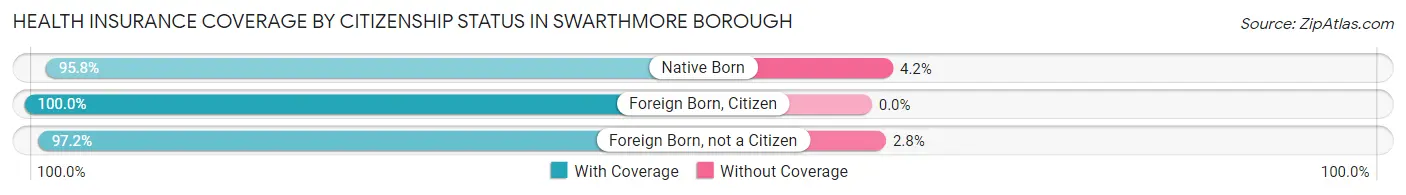
| Citizenship Status | With Coverage | Without Coverage |
| Native Born | 322 (95.8%) | 14 (4.2%) |
| Foreign Born, Citizen | 1,276 (100.0%) | 0 (0.0%) |
| Foreign Born, not a Citizen | 1,261 (97.2%) | 36 (2.8%) |
Health Insurance Coverage by Household Income in Swarthmore borough
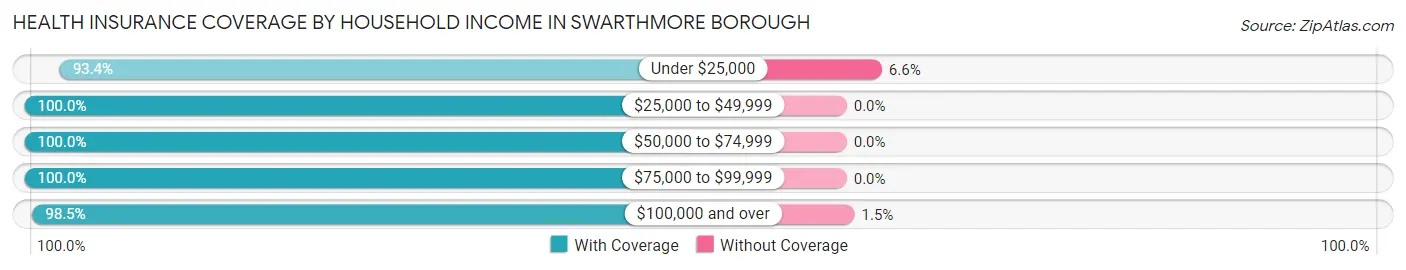
| Household Income | With Coverage | Without Coverage |
| Under $25,000 | 227 (93.4%) | 16 (6.6%) |
| $25,000 to $49,999 | 146 (100.0%) | 0 (0.0%) |
| $50,000 to $74,999 | 549 (100.0%) | 0 (0.0%) |
| $75,000 to $99,999 | 288 (100.0%) | 0 (0.0%) |
| $100,000 and over | 3,712 (98.5%) | 55 (1.5%) |
Public vs Private Health Insurance Coverage by Age in Swarthmore borough
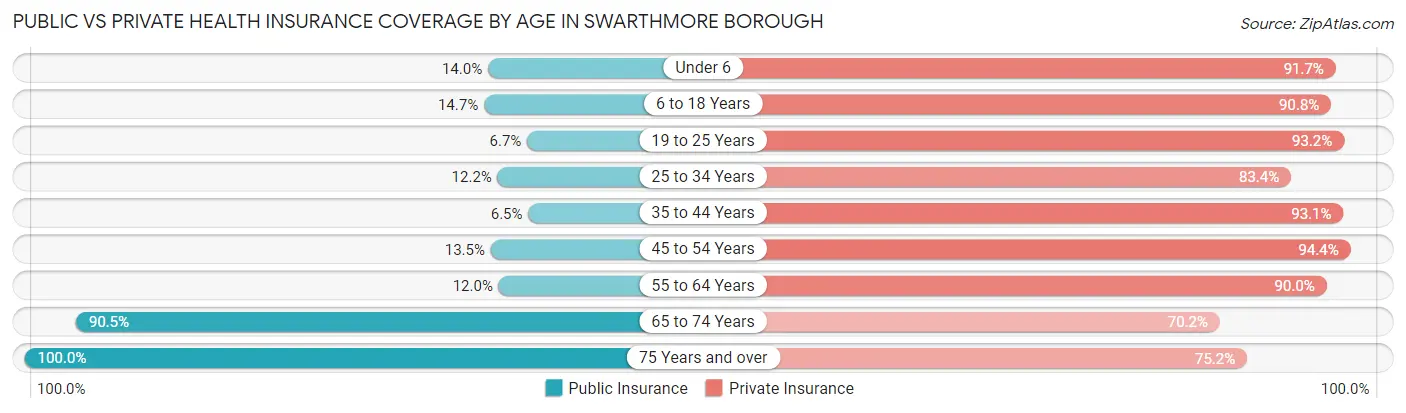
| Age Bracket | Public Insurance | Private Insurance |
| Under 6 | 47 (14.0%) | 308 (91.7%) |
| 6 to 18 Years | 188 (14.7%) | 1,159 (90.8%) |
| 19 to 25 Years | 87 (6.7%) | 1,209 (93.2%) |
| 25 to 34 Years | 44 (12.2%) | 301 (83.4%) |
| 35 to 44 Years | 47 (6.5%) | 674 (93.1%) |
| 45 to 54 Years | 92 (13.5%) | 645 (94.4%) |
| 55 to 64 Years | 85 (12.0%) | 638 (90.0%) |
| 65 to 74 Years | 485 (90.5%) | 376 (70.2%) |
| 75 Years and over | 585 (100.0%) | 440 (75.2%) |
| Total | 1,660 (25.5%) | 5,750 (88.4%) |
Disability Status by Sex by Age in Swarthmore borough
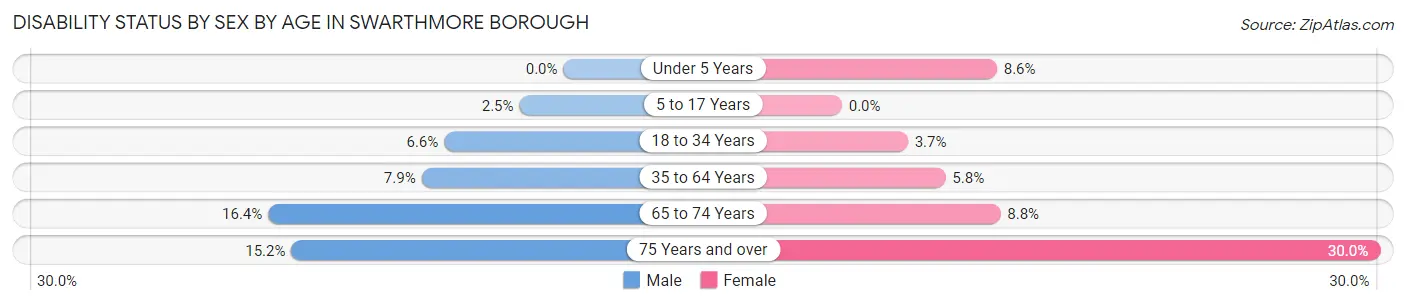
| Age Bracket | Male | Female |
| Under 5 Years | 0 (0.0%) | 17 (8.6%) |
| 5 to 17 Years | 15 (2.5%) | 0 (0.0%) |
| 18 to 34 Years | 67 (6.6%) | 37 (3.7%) |
| 35 to 64 Years | 85 (7.9%) | 60 (5.8%) |
| 65 to 74 Years | 36 (16.4%) | 28 (8.8%) |
| 75 Years and over | 30 (15.1%) | 116 (30.0%) |
Disability Class by Sex by Age in Swarthmore borough
Disability Class: Hearing Difficulty
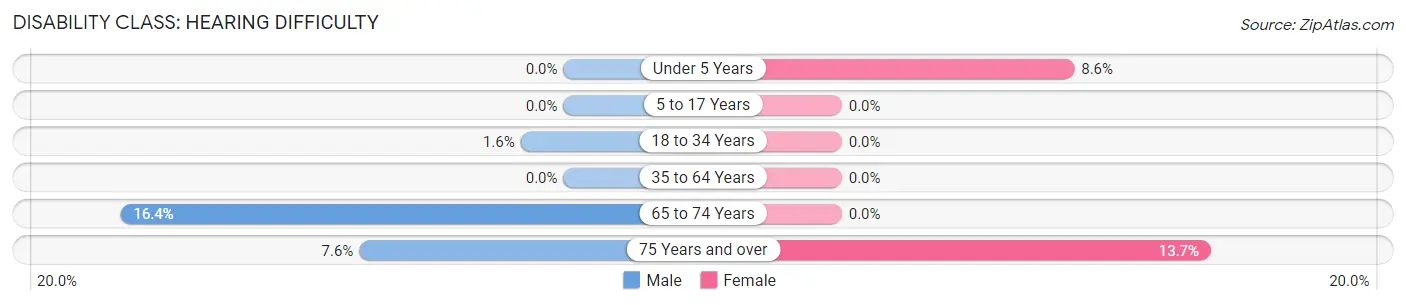
| Age Bracket | Male | Female |
| Under 5 Years | 0 (0.0%) | 17 (8.6%) |
| 5 to 17 Years | 0 (0.0%) | 0 (0.0%) |
| 18 to 34 Years | 16 (1.6%) | 0 (0.0%) |
| 35 to 64 Years | 0 (0.0%) | 0 (0.0%) |
| 65 to 74 Years | 36 (16.4%) | 0 (0.0%) |
| 75 Years and over | 15 (7.6%) | 53 (13.7%) |
Disability Class: Vision Difficulty
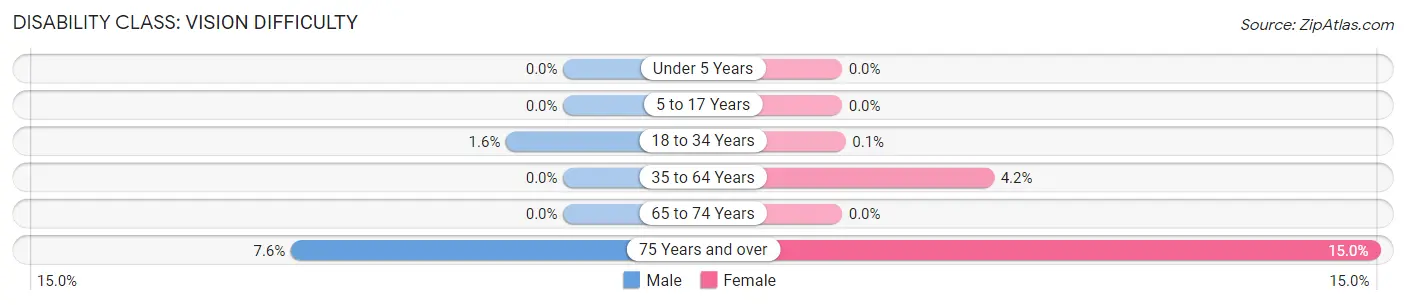
| Age Bracket | Male | Female |
| Under 5 Years | 0 (0.0%) | 0 (0.0%) |
| 5 to 17 Years | 0 (0.0%) | 0 (0.0%) |
| 18 to 34 Years | 16 (1.6%) | 1 (0.1%) |
| 35 to 64 Years | 0 (0.0%) | 44 (4.2%) |
| 65 to 74 Years | 0 (0.0%) | 0 (0.0%) |
| 75 Years and over | 15 (7.6%) | 58 (15.0%) |
Disability Class: Cognitive Difficulty
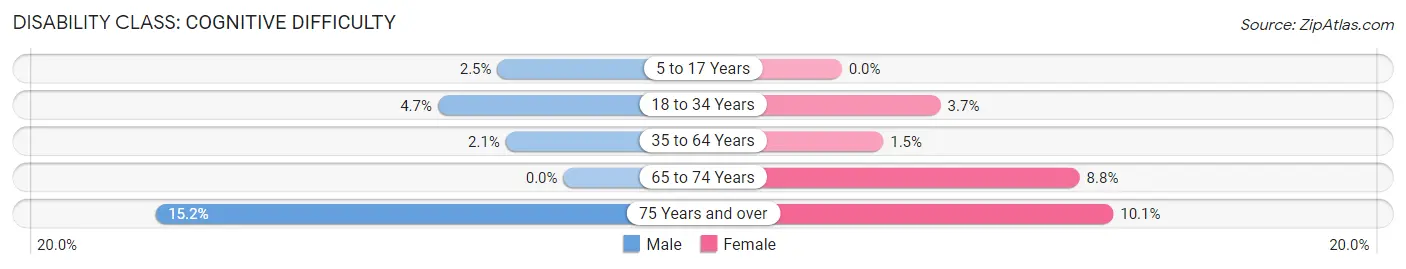
| Age Bracket | Male | Female |
| 5 to 17 Years | 15 (2.5%) | 0 (0.0%) |
| 18 to 34 Years | 47 (4.7%) | 37 (3.7%) |
| 35 to 64 Years | 23 (2.1%) | 16 (1.5%) |
| 65 to 74 Years | 0 (0.0%) | 28 (8.8%) |
| 75 Years and over | 30 (15.1%) | 39 (10.1%) |
Disability Class: Ambulatory Difficulty
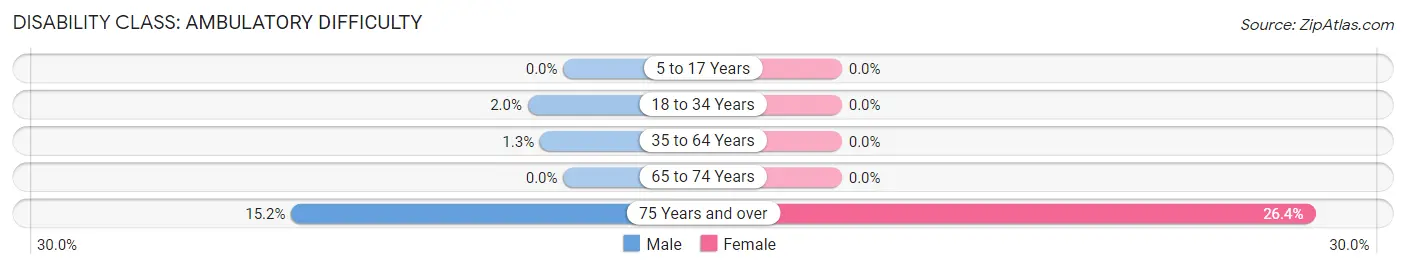
| Age Bracket | Male | Female |
| 5 to 17 Years | 0 (0.0%) | 0 (0.0%) |
| 18 to 34 Years | 20 (2.0%) | 0 (0.0%) |
| 35 to 64 Years | 14 (1.3%) | 0 (0.0%) |
| 65 to 74 Years | 0 (0.0%) | 0 (0.0%) |
| 75 Years and over | 30 (15.1%) | 102 (26.4%) |
Disability Class: Self-Care Difficulty
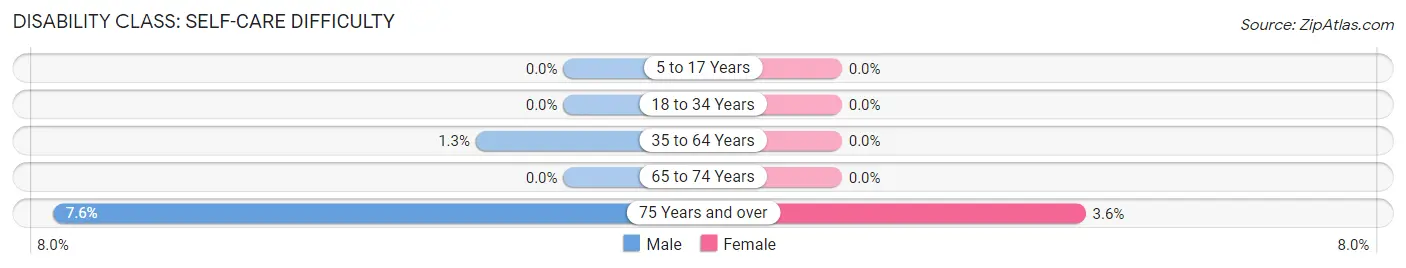
| Age Bracket | Male | Female |
| 5 to 17 Years | 0 (0.0%) | 0 (0.0%) |
| 18 to 34 Years | 0 (0.0%) | 0 (0.0%) |
| 35 to 64 Years | 14 (1.3%) | 0 (0.0%) |
| 65 to 74 Years | 0 (0.0%) | 0 (0.0%) |
| 75 Years and over | 15 (7.6%) | 14 (3.6%) |
Technology Access in Swarthmore borough
Computing Device Access in Swarthmore borough
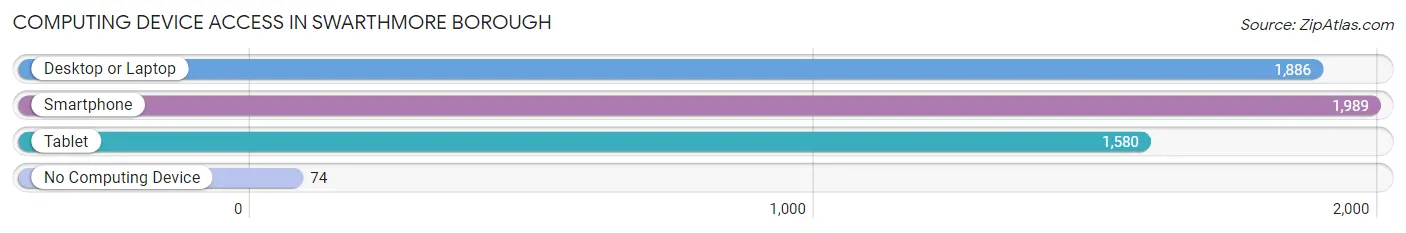
| Device Type | # Households | % Households |
| Desktop or Laptop | 1,886 | 87.7% |
| Smartphone | 1,989 | 92.5% |
| Tablet | 1,580 | 73.5% |
| No Computing Device | 74 | 3.4% |
| Total | 2,151 | 100.0% |
Internet Access in Swarthmore borough
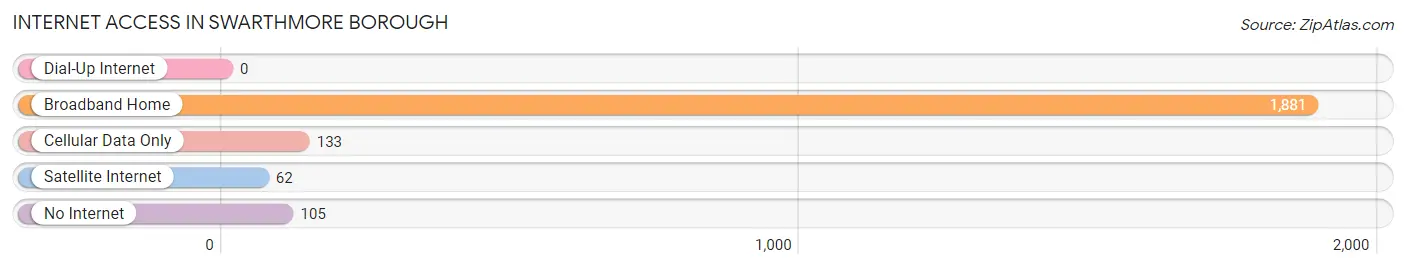
| Internet Type | # Households | % Households |
| Dial-Up Internet | 0 | 0.0% |
| Broadband Home | 1,881 | 87.5% |
| Cellular Data Only | 133 | 6.2% |
| Satellite Internet | 62 | 2.9% |
| No Internet | 105 | 4.9% |
| Total | 2,151 | 100.0% |
Swarthmore borough Summary
Swarthmore Borough is a small borough located in Delaware County, Pennsylvania. It is situated approximately 13 miles southwest of Philadelphia and is part of the Philadelphia metropolitan area. The borough is home to Swarthmore College, a private liberal arts college, and is known for its small-town charm and vibrant community.
History
Swarthmore Borough was founded in 1864 by a group of Quakers who had purchased the land from the Lenni Lenape Native Americans. The borough was named after Swarthmoor Hall, a manor house in Lancashire, England, which was the home of the Quaker leader George Fox. The borough was incorporated in 1881 and has since grown to a population of 6,194 as of the 2010 census.
Geography
Swarthmore Borough is located in southeastern Pennsylvania, approximately 13 miles southwest of Philadelphia. It is situated in Delaware County and is bordered by Nether Providence Township to the north, Springfield Township to the east, Ridley Township to the south, and Edgmont Township to the west. The borough covers an area of 1.3 square miles and is home to Swarthmore College, a private liberal arts college.
Economy
Swarthmore Borough has a vibrant economy that is largely driven by the presence of Swarthmore College. The college is the largest employer in the borough and provides jobs for faculty, staff, and students. Other major employers in the borough include the Swarthmore Co-op, a grocery store, and the Swarthmore Public Library. The borough also has a number of small businesses, including restaurants, shops, and professional services.
Demographics
As of the 2010 census, Swarthmore Borough had a population of 6,194. The racial makeup of the borough was 87.3% White, 5.2% Asian, 3.2% African American, 0.3% Native American, 0.1% Pacific Islander, and 3.9% from other races. The median household income was $90,945 and the median family income was $118,945. The per capita income was $45,945.
Conclusion
Swarthmore Borough is a small borough located in Delaware County, Pennsylvania. It is situated approximately 13 miles southwest of Philadelphia and is part of the Philadelphia metropolitan area. The borough is home to Swarthmore College, a private liberal arts college, and is known for its small-town charm and vibrant community. The borough has a vibrant economy that is largely driven by the presence of Swarthmore College and a number of small businesses. As of the 2010 census, Swarthmore Borough had a population of 6,194 and a median household income of $90,945.
Common Questions
What is Per Capita Income in Swarthmore borough?
Per Capita income in Swarthmore borough is $66,598.
What is the Median Family Income in Swarthmore borough?
Median Family Income in Swarthmore borough is $214,609.
What is the Median Household income in Swarthmore borough?
Median Household Income in Swarthmore borough is $138,679.
What is Income or Wage Gap in Swarthmore borough?
Income or Wage Gap in Swarthmore borough is 46.6%.
Women in Swarthmore borough earn 53.4 cents for every dollar earned by a man.
What is Inequality or Gini Index in Swarthmore borough?
Inequality or Gini Index in Swarthmore borough is 0.47.
What is the Total Population of Swarthmore borough?
Total Population of Swarthmore borough is 6,507.
What is the Total Male Population of Swarthmore borough?
Total Male Population of Swarthmore borough is 3,195.
What is the Total Female Population of Swarthmore borough?
Total Female Population of Swarthmore borough is 3,312.
What is the Ratio of Males per 100 Females in Swarthmore borough?
There are 96.47 Males per 100 Females in Swarthmore borough.
What is the Ratio of Females per 100 Males in Swarthmore borough?
There are 103.66 Females per 100 Males in Swarthmore borough.
What is the Median Population Age in Swarthmore borough?
Median Population Age in Swarthmore borough is 34.8 Years.
What is the Average Family Size in Swarthmore borough
Average Family Size in Swarthmore borough is 3.0 People.
What is the Average Household Size in Swarthmore borough
Average Household Size in Swarthmore borough is 2.3 People.
How Large is the Labor Force in Swarthmore borough?
There are 3,121 People in the Labor Forcein in Swarthmore borough.
What is the Percentage of People in the Labor Force in Swarthmore borough?
57.8% of People are in the Labor Force in Swarthmore borough.
What is the Unemployment Rate in Swarthmore borough?
Unemployment Rate in Swarthmore borough is 11.1%.