Callimont borough, PA Map & Demographics
Callimont borough Overview
$33,235
PER CAPITA INCOME
$96,250
AVG FAMILY INCOME
$86,875
AVG HOUSEHOLD INCOME
49.3%
WAGE / INCOME GAP [ % ]
50.7¢/ $1
WAGE / INCOME GAP [ $ ]
0.24
INEQUALITY / GINI INDEX
52
TOTAL POPULATION
24
MALE POPULATION
28
FEMALE POPULATION
85.71
MALES / 100 FEMALES
116.67
FEMALES / 100 MALES
34.8
MEDIAN AGE
2.5
AVG FAMILY SIZE
2.5
AVG HOUSEHOLD SIZE
22
LABOR FORCE [ PEOPLE ]
53.7%
PERCENT IN LABOR FORCE
Income in Callimont borough
Income Overview in Callimont borough
Per Capita Income in Callimont borough is $33,235, while median incomes of families and households are $96,250 and $86,875 respectively.
| Characteristic | Number | Measure |
| Per Capita Income | 52 | $33,235 |
| Median Family Income | 20 | $96,250 |
| Mean Family Income | 20 | $83,595 |
| Median Household Income | 21 | $86,875 |
| Mean Household Income | 21 | $82,429 |
| Income Deficit | 20 | $0 |
| Wage / Income Gap (%) | 52 | 49.32% |
| Wage / Income Gap ($) | 52 | 50.68¢ per $1 |
| Gini / Inequality Index | 52 | 0.24 |
Earnings by Sex in Callimont borough
Average Earnings in Callimont borough are $36,964, $70,469 for men and $35,714 for women, a difference of 49.3%.
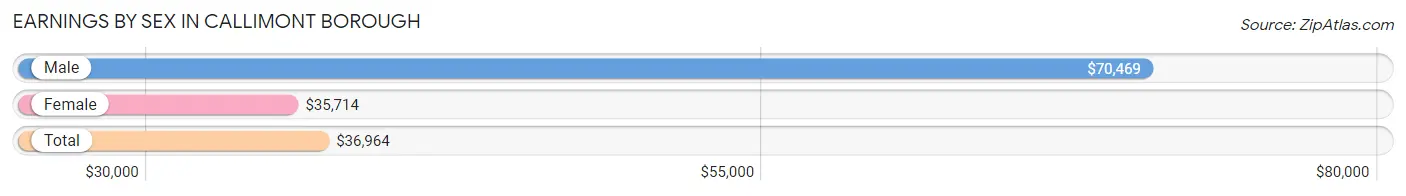
| Sex | Number | Average Earnings |
| Male | 15 (55.6%) | $70,469 |
| Female | 12 (44.4%) | $35,714 |
| Total | 27 (100.0%) | $36,964 |
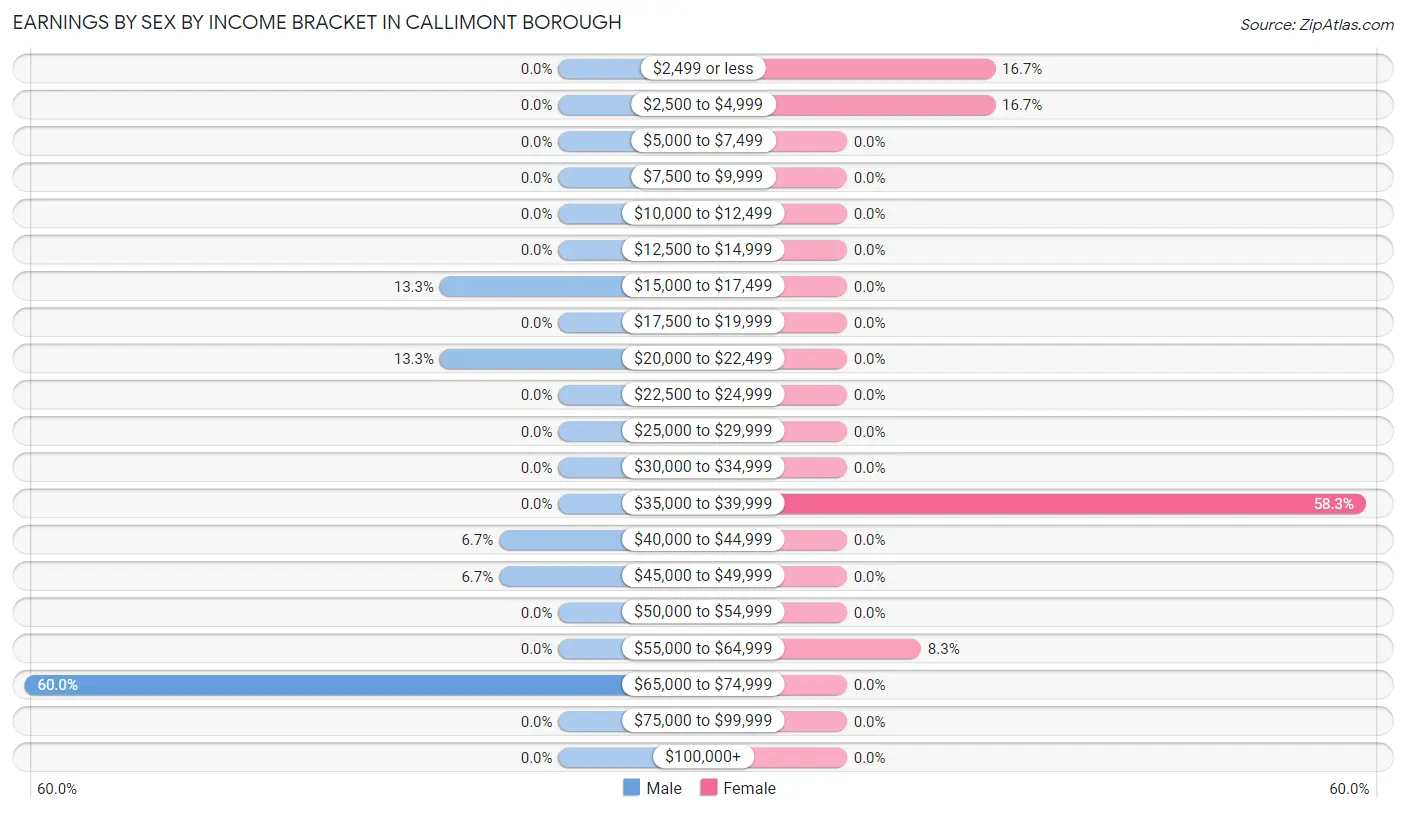
Earnings by Sex by Income Bracket in Callimont borough
The most common earnings brackets in Callimont borough are $65,000 to $74,999 for men (9 | 60.0%) and $35,000 to $39,999 for women (7 | 58.3%).
| Income | Male | Female |
| $2,499 or less | 0 (0.0%) | 2 (16.7%) |
| $2,500 to $4,999 | 0 (0.0%) | 2 (16.7%) |
| $5,000 to $7,499 | 0 (0.0%) | 0 (0.0%) |
| $7,500 to $9,999 | 0 (0.0%) | 0 (0.0%) |
| $10,000 to $12,499 | 0 (0.0%) | 0 (0.0%) |
| $12,500 to $14,999 | 0 (0.0%) | 0 (0.0%) |
| $15,000 to $17,499 | 2 (13.3%) | 0 (0.0%) |
| $17,500 to $19,999 | 0 (0.0%) | 0 (0.0%) |
| $20,000 to $22,499 | 2 (13.3%) | 0 (0.0%) |
| $22,500 to $24,999 | 0 (0.0%) | 0 (0.0%) |
| $25,000 to $29,999 | 0 (0.0%) | 0 (0.0%) |
| $30,000 to $34,999 | 0 (0.0%) | 0 (0.0%) |
| $35,000 to $39,999 | 0 (0.0%) | 7 (58.3%) |
| $40,000 to $44,999 | 1 (6.7%) | 0 (0.0%) |
| $45,000 to $49,999 | 1 (6.7%) | 0 (0.0%) |
| $50,000 to $54,999 | 0 (0.0%) | 0 (0.0%) |
| $55,000 to $64,999 | 0 (0.0%) | 1 (8.3%) |
| $65,000 to $74,999 | 9 (60.0%) | 0 (0.0%) |
| $75,000 to $99,999 | 0 (0.0%) | 0 (0.0%) |
| $100,000+ | 0 (0.0%) | 0 (0.0%) |
| Total | 15 (100.0%) | 12 (100.0%) |
Earnings by Sex by Educational Attainment in Callimont borough
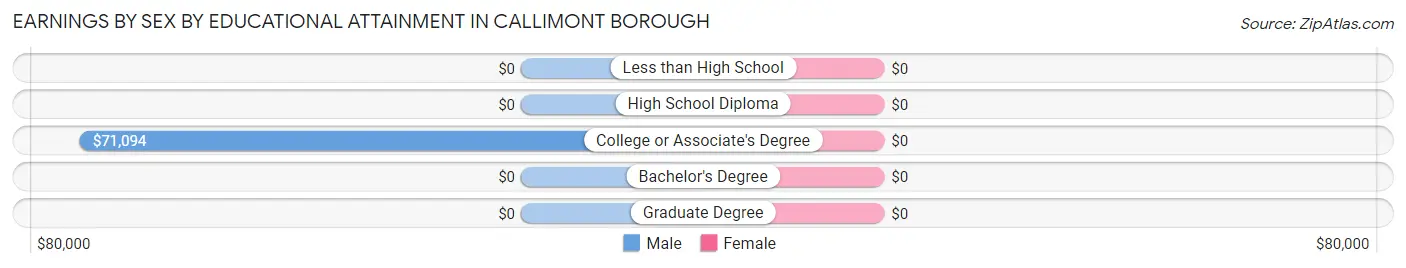
| Educational Attainment | Male Income | Female Income |
| Less than High School | - | - |
| High School Diploma | - | - |
| College or Associate's Degree | $71,094 | $0 |
| Bachelor's Degree | - | - |
| Graduate Degree | - | - |
| Total | $70,469 | $36,071 |
Family Income in Callimont borough
Family Income Brackets in Callimont borough
According to the Callimont borough family income data, there are 9 families falling into the $100,000 to $149,999 income range, which is the most common income bracket and makes up 45.0% of all families.
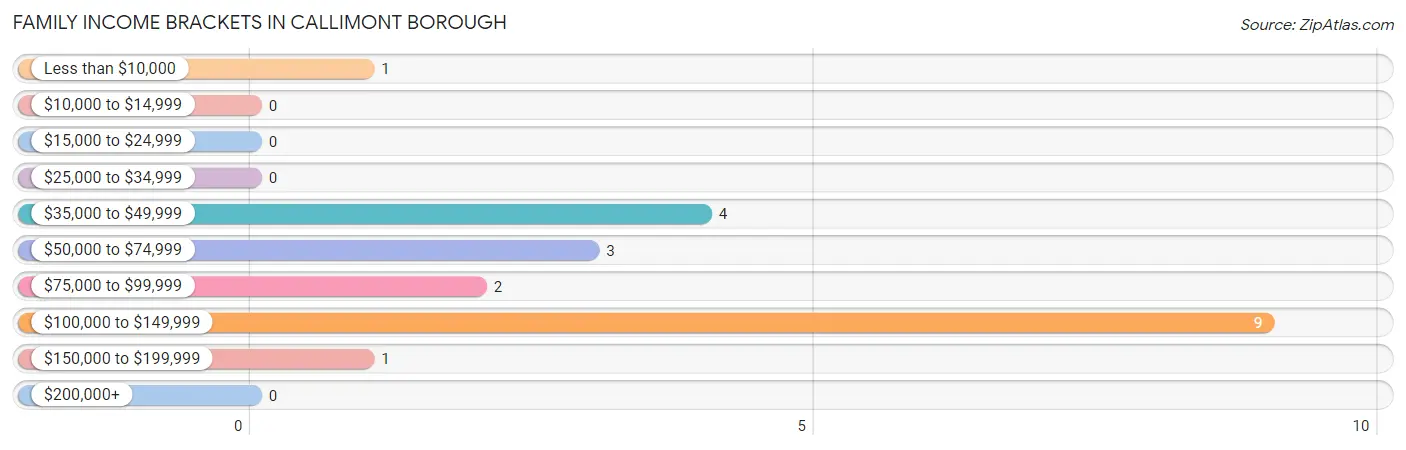
| Income Bracket | # Families | % Families |
| Less than $10,000 | 1 | 5.0% |
| $10,000 to $14,999 | 0 | 0.0% |
| $15,000 to $24,999 | 0 | 0.0% |
| $25,000 to $34,999 | 0 | 0.0% |
| $35,000 to $49,999 | 4 | 20.0% |
| $50,000 to $74,999 | 3 | 15.0% |
| $75,000 to $99,999 | 2 | 10.0% |
| $100,000 to $149,999 | 9 | 45.0% |
| $150,000 to $199,999 | 1 | 5.0% |
| $200,000+ | 0 | 0.0% |
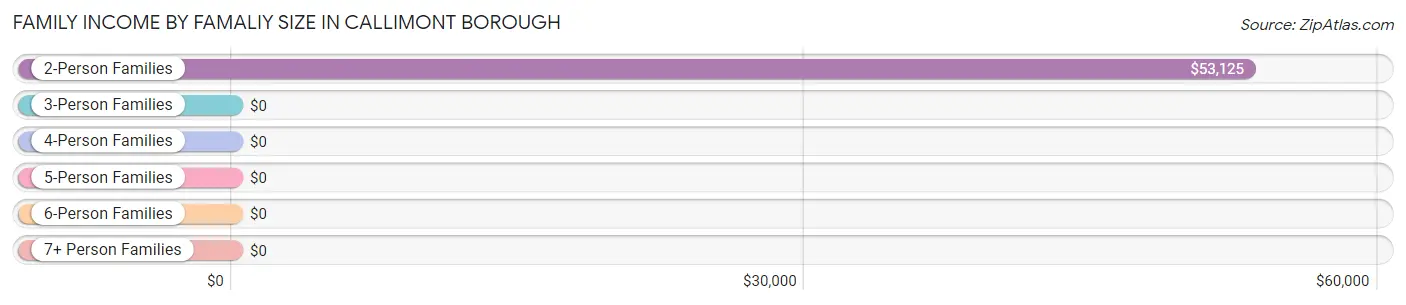
Family Income by Famaliy Size in Callimont borough
2-person families (11 | 55.0%) account for the highest median family income in Callimont borough with $53,125 per family, while 2-person families (11 | 55.0%) have the highest median income of $26,562 per family member.
| Income Bracket | # Families | Median Income |
| 2-Person Families | 11 (55.0%) | $53,125 |
| 3-Person Families | 8 (40.0%) | $0 |
| 4-Person Families | 1 (5.0%) | $0 |
| 5-Person Families | 0 (0.0%) | $0 |
| 6-Person Families | 0 (0.0%) | $0 |
| 7+ Person Families | 0 (0.0%) | $0 |
| Total | 20 (100.0%) | $96,250 |
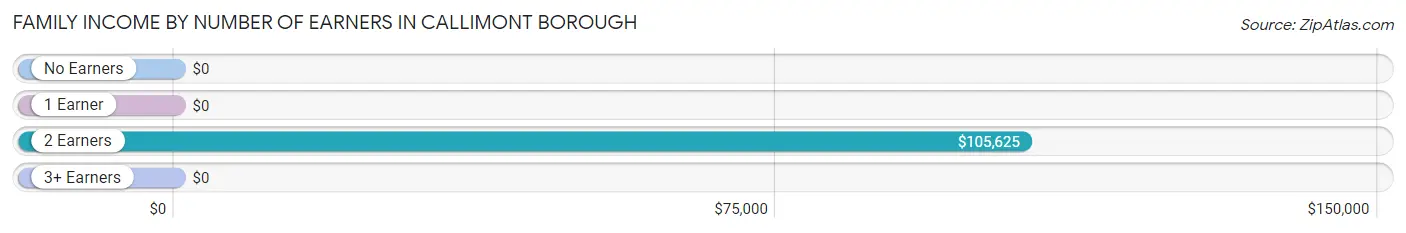
Family Income by Number of Earners in Callimont borough
| Number of Earners | # Families | Median Income |
| No Earners | 4 (20.0%) | $0 |
| 1 Earner | 4 (20.0%) | $0 |
| 2 Earners | 12 (60.0%) | $105,625 |
| 3+ Earners | 0 (0.0%) | $0 |
| Total | 20 (100.0%) | $96,250 |
Household Income in Callimont borough
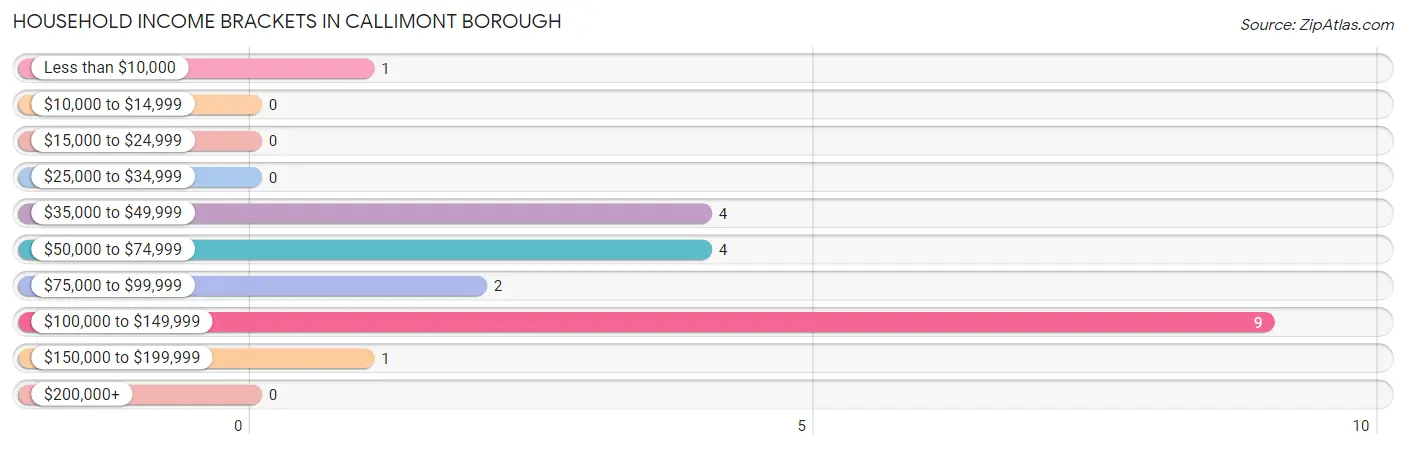
Household Income Brackets in Callimont borough
With 9 households falling in the category, the $100,000 to $149,999 income range is the most frequent in Callimont borough, accounting for 42.9% of all households.
| Income Bracket | # Households | % Households |
| Less than $10,000 | 1 | 4.8% |
| $10,000 to $14,999 | 0 | 0.0% |
| $15,000 to $24,999 | 0 | 0.0% |
| $25,000 to $34,999 | 0 | 0.0% |
| $35,000 to $49,999 | 4 | 19.0% |
| $50,000 to $74,999 | 4 | 19.0% |
| $75,000 to $99,999 | 2 | 9.5% |
| $100,000 to $149,999 | 9 | 42.9% |
| $150,000 to $199,999 | 1 | 4.8% |
| $200,000+ | 0 | 0.0% |
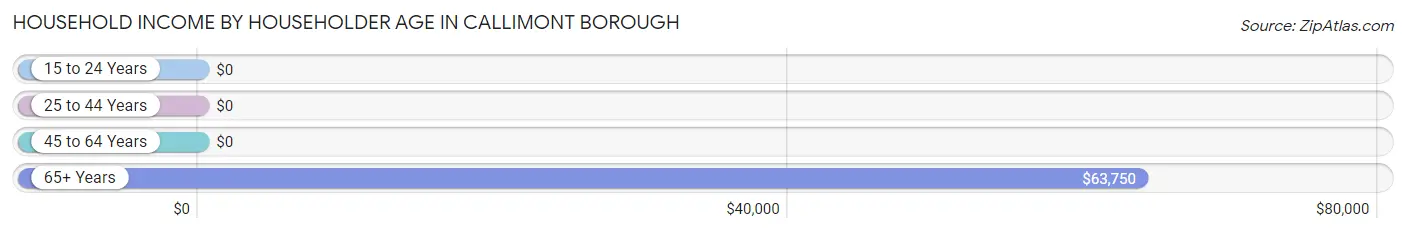
Household Income by Householder Age in Callimont borough
The median household income in Callimont borough is $86,875, with the highest median household income of $63,750 found in the 65+ years age bracket for the primary householder. A total of 9 households (42.9%) fall into this category. Meanwhile, the 15 to 24 years age bracket for the primary householder has the lowest median household income of $0, with 2 households (9.5%) in this group.
| Income Bracket | # Households | Median Income |
| 15 to 24 Years | 2 (9.5%) | $0 |
| 25 to 44 Years | 8 (38.1%) | $0 |
| 45 to 64 Years | 2 (9.5%) | $0 |
| 65+ Years | 9 (42.9%) | $63,750 |
| Total | 21 (100.0%) | $86,875 |
Poverty in Callimont borough
Income Below Poverty by Sex and Age in Callimont borough
With 4.2% poverty level for males and 3.6% for females among the residents of Callimont borough, 65 to 74 year old males and 65 to 74 year old females are the most vulnerable to poverty, with 1 males (20.0%) and 1 females (25.0%) in their respective age groups living below the poverty level.
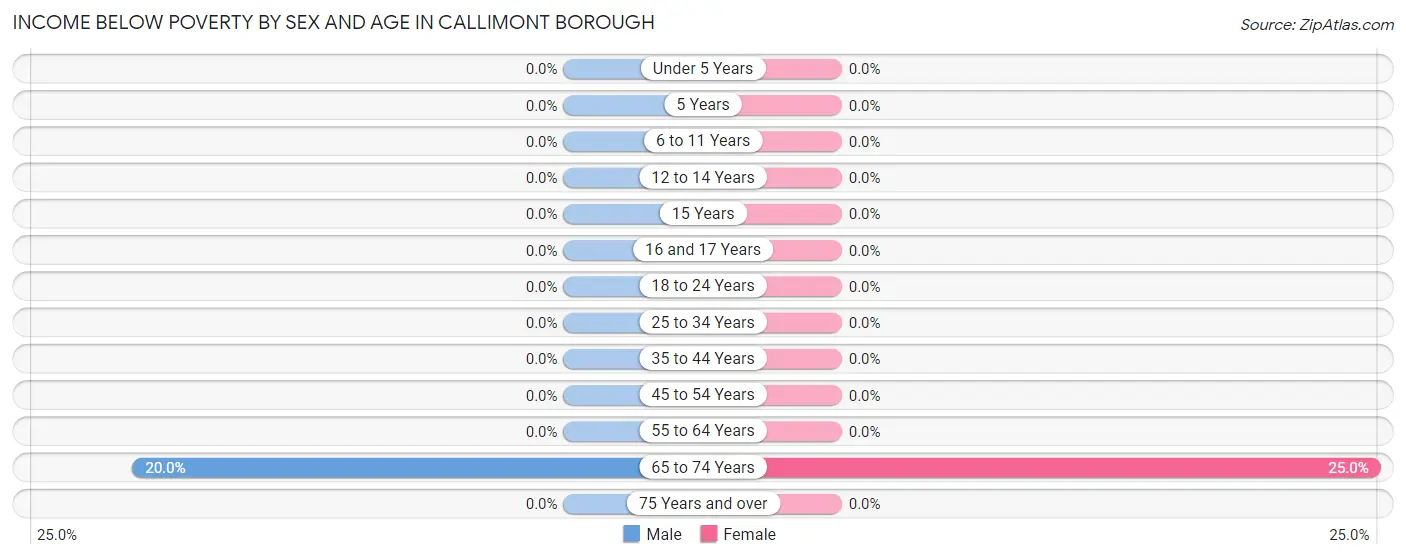
| Age Bracket | Male | Female |
| Under 5 Years | 0 (0.0%) | 0 (0.0%) |
| 5 Years | 0 (0.0%) | 0 (0.0%) |
| 6 to 11 Years | 0 (0.0%) | 0 (0.0%) |
| 12 to 14 Years | 0 (0.0%) | 0 (0.0%) |
| 15 Years | 0 (0.0%) | 0 (0.0%) |
| 16 and 17 Years | 0 (0.0%) | 0 (0.0%) |
| 18 to 24 Years | 0 (0.0%) | 0 (0.0%) |
| 25 to 34 Years | 0 (0.0%) | 0 (0.0%) |
| 35 to 44 Years | 0 (0.0%) | 0 (0.0%) |
| 45 to 54 Years | 0 (0.0%) | 0 (0.0%) |
| 55 to 64 Years | 0 (0.0%) | 0 (0.0%) |
| 65 to 74 Years | 1 (20.0%) | 1 (25.0%) |
| 75 Years and over | 0 (0.0%) | 0 (0.0%) |
| Total | 1 (4.2%) | 1 (3.6%) |
Income Above Poverty by Sex and Age in Callimont borough
According to the poverty statistics in Callimont borough, males aged under 5 years and females aged under 5 years are the age groups that are most secure financially, with 100.0% of males and 100.0% of females in these age groups living above the poverty line.
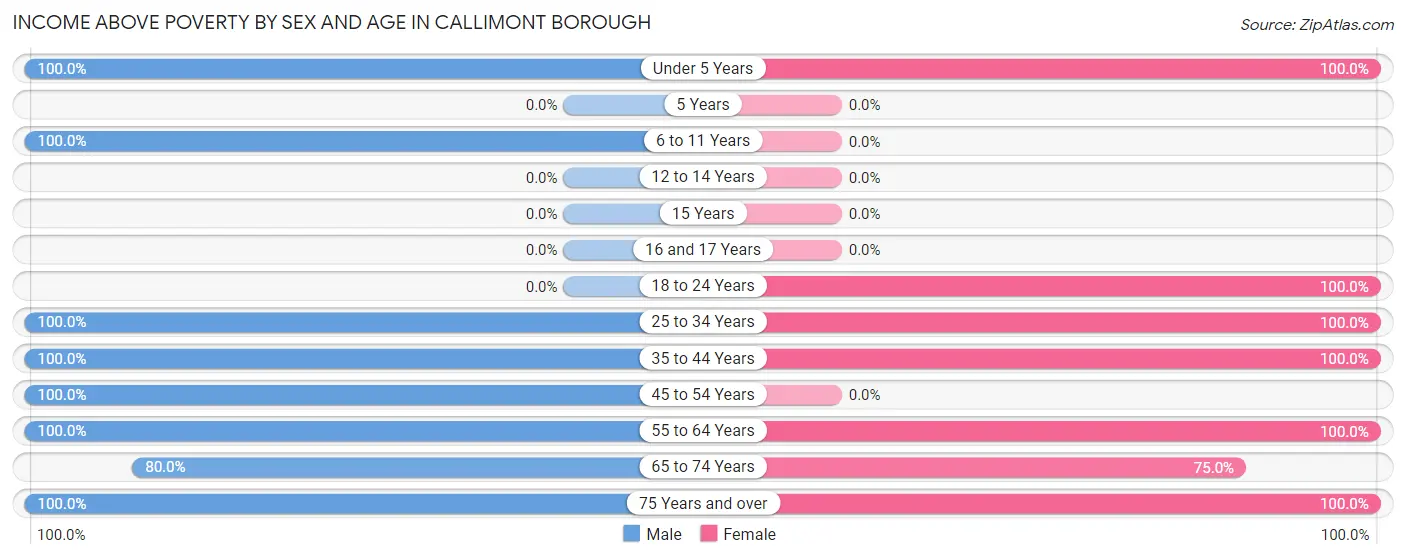
| Age Bracket | Male | Female |
| Under 5 Years | 1 (100.0%) | 9 (100.0%) |
| 5 Years | 0 (0.0%) | 0 (0.0%) |
| 6 to 11 Years | 1 (100.0%) | 0 (0.0%) |
| 12 to 14 Years | 0 (0.0%) | 0 (0.0%) |
| 15 Years | 0 (0.0%) | 0 (0.0%) |
| 16 and 17 Years | 0 (0.0%) | 0 (0.0%) |
| 18 to 24 Years | 0 (0.0%) | 2 (100.0%) |
| 25 to 34 Years | 8 (100.0%) | 7 (100.0%) |
| 35 to 44 Years | 2 (100.0%) | 1 (100.0%) |
| 45 to 54 Years | 1 (100.0%) | 0 (0.0%) |
| 55 to 64 Years | 2 (100.0%) | 2 (100.0%) |
| 65 to 74 Years | 4 (80.0%) | 3 (75.0%) |
| 75 Years and over | 4 (100.0%) | 3 (100.0%) |
| Total | 23 (95.8%) | 27 (96.4%) |
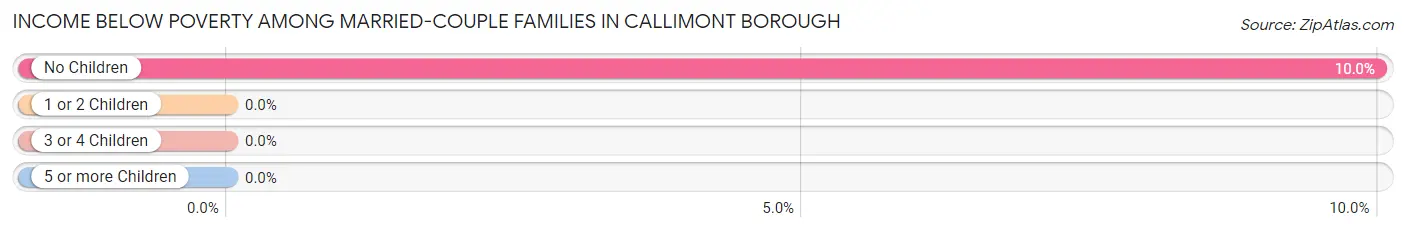
Income Below Poverty Among Married-Couple Families in Callimont borough
The poverty statistics for married-couple families in Callimont borough show that 5.6% or 1 of the total 18 families live below the poverty line. Families with no children have the highest poverty rate of 10.0%, comprising of 1 families. On the other hand, families with 1 or 2 children have the lowest poverty rate of 0.0%, which includes 0 families.
| Children | Above Poverty | Below Poverty |
| No Children | 9 (90.0%) | 1 (10.0%) |
| 1 or 2 Children | 8 (100.0%) | 0 (0.0%) |
| 3 or 4 Children | 0 (0.0%) | 0 (0.0%) |
| 5 or more Children | 0 (0.0%) | 0 (0.0%) |
| Total | 17 (94.4%) | 1 (5.6%) |
Income Below Poverty Among Single-Parent Households in Callimont borough
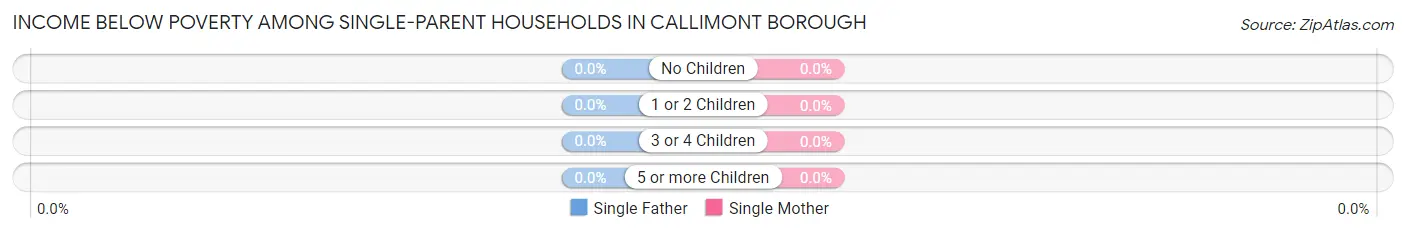
| Children | Single Father | Single Mother |
| No Children | 0 (0.0%) | 0 (0.0%) |
| 1 or 2 Children | 0 (0.0%) | 0 (0.0%) |
| 3 or 4 Children | 0 (0.0%) | 0 (0.0%) |
| 5 or more Children | 0 (0.0%) | 0 (0.0%) |
| Total | 0 (0.0%) | 0 (0.0%) |
Income Below Poverty Among Married-Couple vs Single-Parent Households in Callimont borough
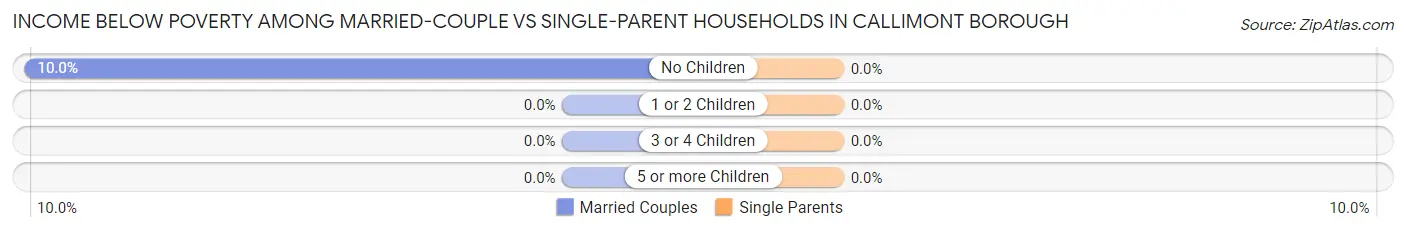
| Children | Married-Couple Families | Single-Parent Households |
| No Children | 1 (10.0%) | 0 (0.0%) |
| 1 or 2 Children | 0 (0.0%) | 0 (0.0%) |
| 3 or 4 Children | 0 (0.0%) | 0 (0.0%) |
| 5 or more Children | 0 (0.0%) | 0 (0.0%) |
| Total | 1 (5.6%) | 0 (0.0%) |
Race in Callimont borough
The most populous races in Callimont borough are , and White / Caucasian (52 | 100.0%).
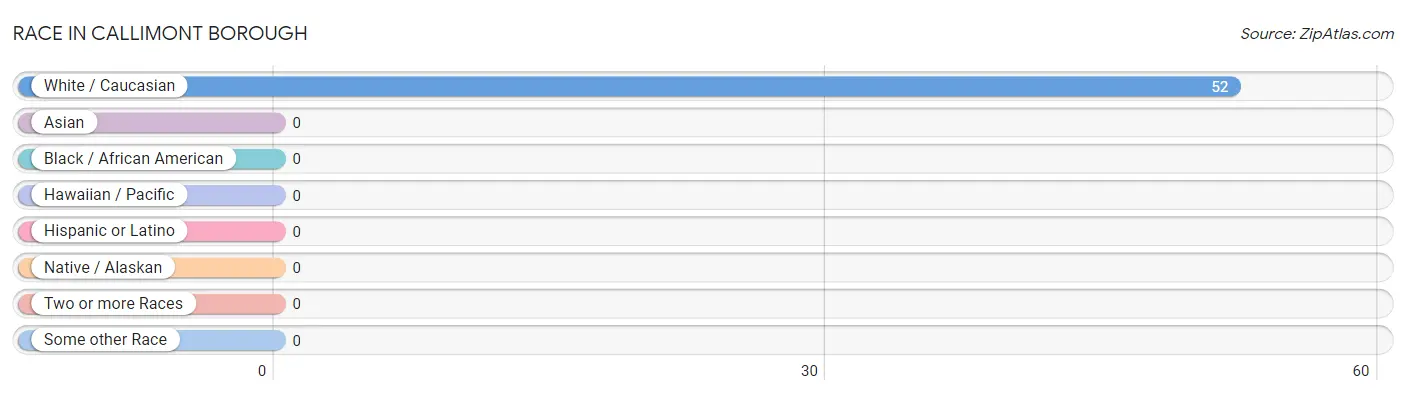
| Race | # Population | % Population |
| Asian | 0 | 0.0% |
| Black / African American | 0 | 0.0% |
| Hawaiian / Pacific | 0 | 0.0% |
| Hispanic or Latino | 0 | 0.0% |
| Native / Alaskan | 0 | 0.0% |
| White / Caucasian | 52 | 100.0% |
| Two or more Races | 0 | 0.0% |
| Some other Race | 0 | 0.0% |
| Total | 52 | 100.0% |
Ancestry in Callimont borough
The most populous ancestries reported in Callimont borough are German (31 | 59.6%), Irish (5 | 9.6%), French (3 | 5.8%), Czechoslovakian (2 | 3.8%), and English (2 | 3.8%), together accounting for 82.7% of all Callimont borough residents.
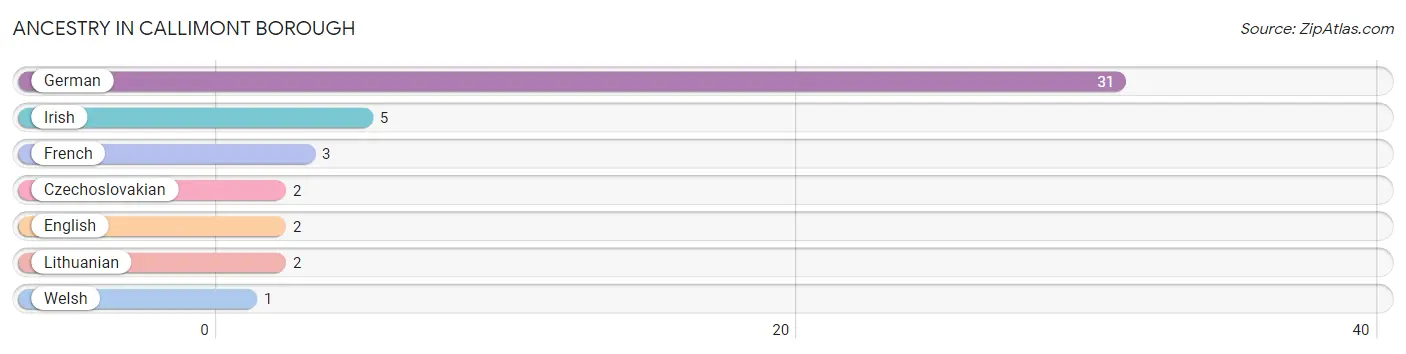
| Ancestry | # Population | % Population |
| Czechoslovakian | 2 | 3.8% |
| English | 2 | 3.8% |
| French | 3 | 5.8% |
| German | 31 | 59.6% |
| Irish | 5 | 9.6% |
| Lithuanian | 2 | 3.8% |
| Welsh | 1 | 1.9% | View All 7 Rows |
Immigrants in Callimont borough

| Immigration Origin | # Population | % Population | View All 0 Rows |
Sex and Age in Callimont borough
Sex and Age in Callimont borough
The most populous age groups in Callimont borough are 30 to 34 Years (8 | 33.3%) for men and Under 5 Years (9 | 32.1%) for women.
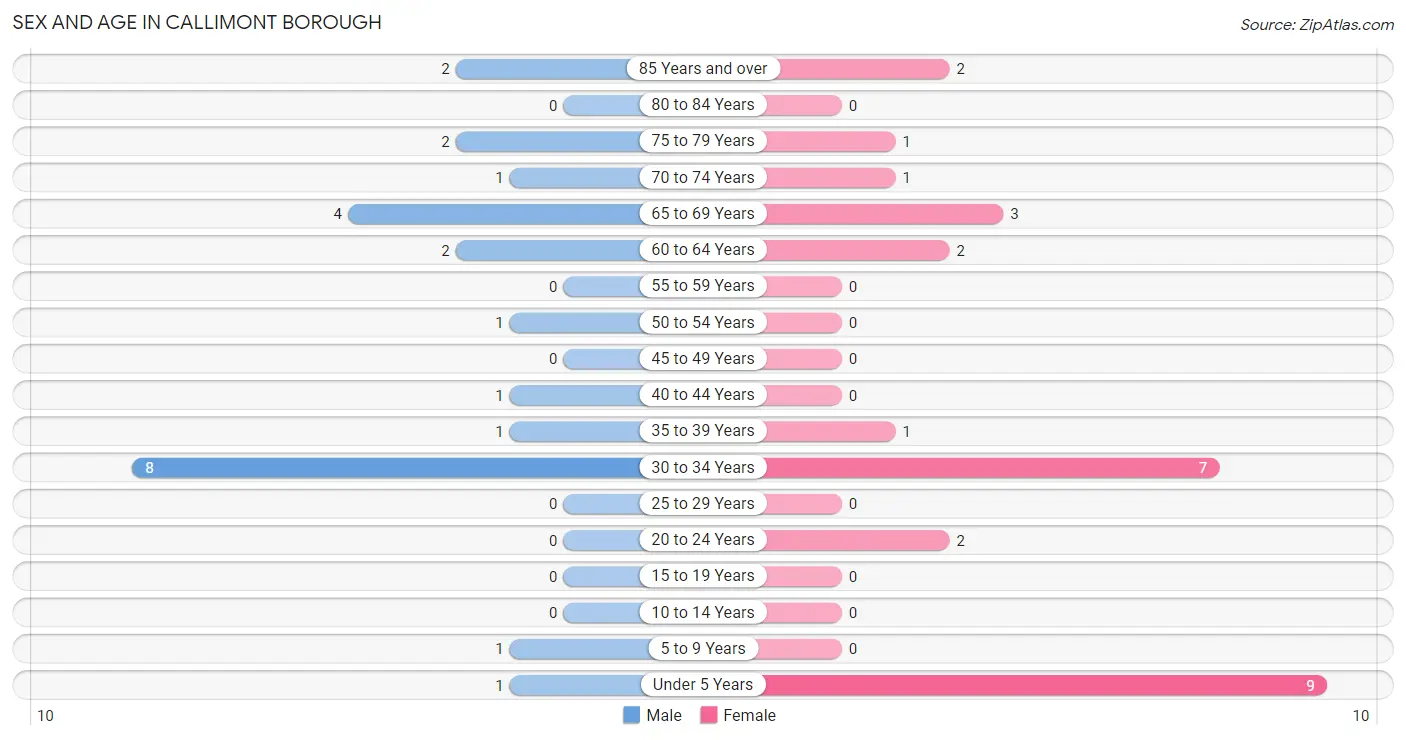
| Age Bracket | Male | Female |
| Under 5 Years | 1 (4.2%) | 9 (32.1%) |
| 5 to 9 Years | 1 (4.2%) | 0 (0.0%) |
| 10 to 14 Years | 0 (0.0%) | 0 (0.0%) |
| 15 to 19 Years | 0 (0.0%) | 0 (0.0%) |
| 20 to 24 Years | 0 (0.0%) | 2 (7.1%) |
| 25 to 29 Years | 0 (0.0%) | 0 (0.0%) |
| 30 to 34 Years | 8 (33.3%) | 7 (25.0%) |
| 35 to 39 Years | 1 (4.2%) | 1 (3.6%) |
| 40 to 44 Years | 1 (4.2%) | 0 (0.0%) |
| 45 to 49 Years | 0 (0.0%) | 0 (0.0%) |
| 50 to 54 Years | 1 (4.2%) | 0 (0.0%) |
| 55 to 59 Years | 0 (0.0%) | 0 (0.0%) |
| 60 to 64 Years | 2 (8.3%) | 2 (7.1%) |
| 65 to 69 Years | 4 (16.7%) | 3 (10.7%) |
| 70 to 74 Years | 1 (4.2%) | 1 (3.6%) |
| 75 to 79 Years | 2 (8.3%) | 1 (3.6%) |
| 80 to 84 Years | 0 (0.0%) | 0 (0.0%) |
| 85 Years and over | 2 (8.3%) | 2 (7.1%) |
| Total | 24 (100.0%) | 28 (100.0%) |
Families and Households in Callimont borough
Median Family Size in Callimont borough
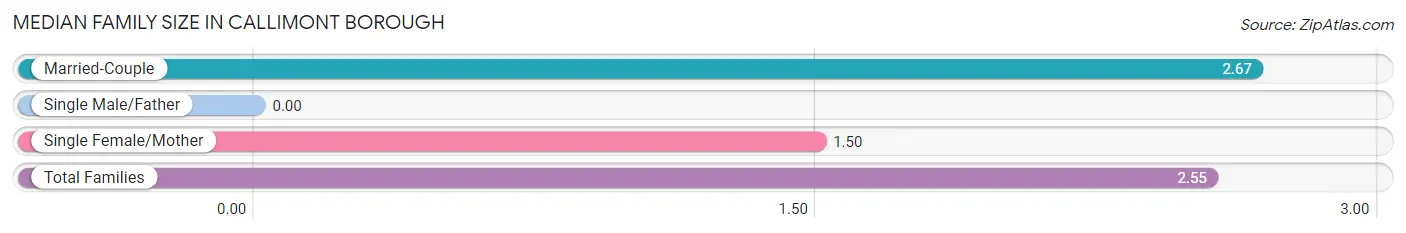
| Family Type | # Families | Family Size |
| Married-Couple | 18 (90.0%) | 2.67 |
| Single Male/Father | 0 (0.0%) | - |
| Single Female/Mother | 2 (10.0%) | 1.50 |
| Total Families | 20 (100.0%) | 2.55 |
Median Household Size in Callimont borough
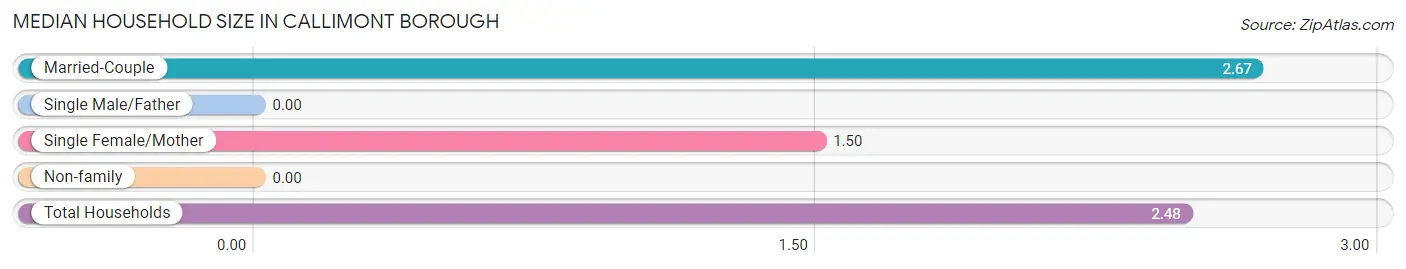
| Household Type | # Households | Household Size |
| Married-Couple | 18 (85.7%) | 2.67 |
| Single Male/Father | 0 (0.0%) | - |
| Single Female/Mother | 2 (9.5%) | 1.50 |
| Non-family | 1 (4.8%) | - |
| Total Households | 21 (100.0%) | 2.48 |
Household Size by Marriage Status in Callimont borough
Out of a total of 21 households in Callimont borough, 20 (95.2%) are family households, while 1 (4.8%) are nonfamily households. The most numerous type of family households are 2-person households, comprising 11, and the most common type of nonfamily households are 1-person households, comprising 1.
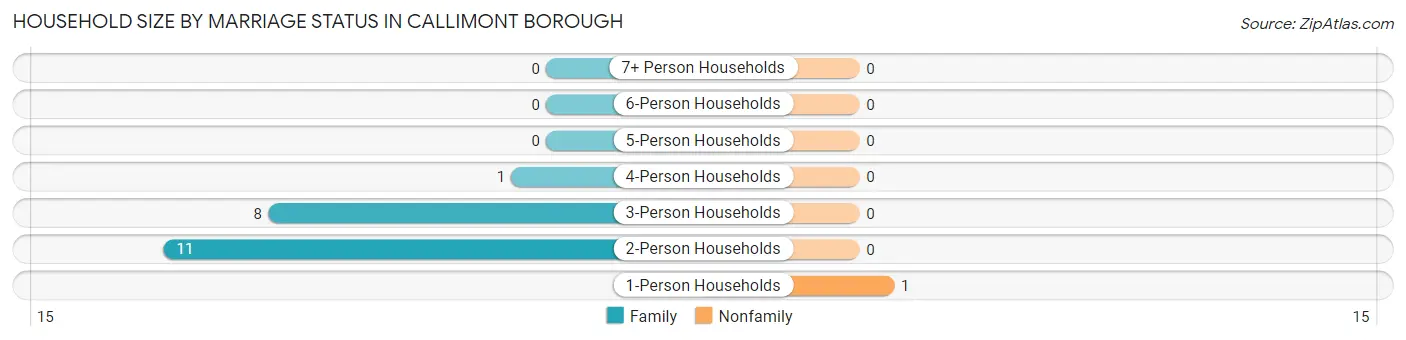
| Household Size | Family Households | Nonfamily Households |
| 1-Person Households | - | 1 (4.8%) |
| 2-Person Households | 11 (52.4%) | 0 (0.0%) |
| 3-Person Households | 8 (38.1%) | 0 (0.0%) |
| 4-Person Households | 1 (4.8%) | 0 (0.0%) |
| 5-Person Households | 0 (0.0%) | 0 (0.0%) |
| 6-Person Households | 0 (0.0%) | 0 (0.0%) |
| 7+ Person Households | 0 (0.0%) | 0 (0.0%) |
| Total | 20 (95.2%) | 1 (4.8%) |
Female Fertility in Callimont borough
Fertility by Age in Callimont borough
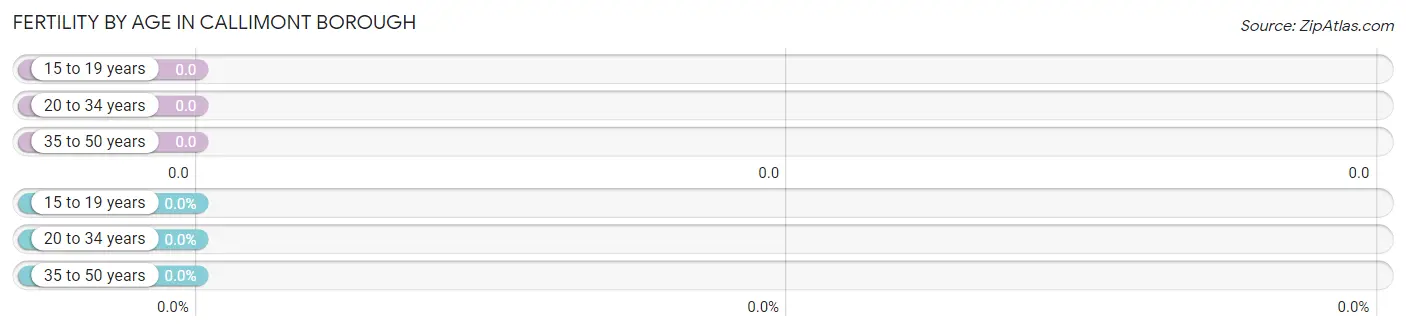
| Age Bracket | Women with Births | Births / 1,000 Women |
| 15 to 19 years | 0 (0.0%) | 0.0 |
| 20 to 34 years | 0 (0.0%) | 0.0 |
| 35 to 50 years | 0 (0.0%) | 0.0 |
| Total | 0 (0.0%) | 0.0 |
Fertility by Age by Marriage Status in Callimont borough
| Age Bracket | Married | Unmarried |
| 15 to 19 years | 0 (0.0%) | 0 (0.0%) |
| 20 to 34 years | 0 (0.0%) | 0 (0.0%) |
| 35 to 50 years | 0 (0.0%) | 0 (0.0%) |
| Total | 0 (0.0%) | 0 (0.0%) |
Fertility by Education in Callimont borough
| Educational Attainment | Women with Births | Births / 1,000 Women |
| Less than High School | 0 (0.0%) | 0.0 |
| High School Diploma | 0 (0.0%) | 0.0 |
| College or Associate's Degree | 0 (0.0%) | 0.0 |
| Bachelor's Degree | 0 (0.0%) | 0.0 |
| Graduate Degree | 0 (0.0%) | 0.0 |
| Total | 0 (0.0%) | 0.0 |
Fertility by Education by Marriage Status in Callimont borough
| Educational Attainment | Married | Unmarried |
| Less than High School | 0 (0.0%) | 0 (0.0%) |
| High School Diploma | 0 (0.0%) | 0 (0.0%) |
| College or Associate's Degree | 0 (0.0%) | 0 (0.0%) |
| Bachelor's Degree | 0 (0.0%) | 0 (0.0%) |
| Graduate Degree | 0 (0.0%) | 0 (0.0%) |
| Total | 0 (0.0%) | 0 (0.0%) |
Employment Characteristics in Callimont borough
Employment by Class of Employer in Callimont borough
Among the 22 employed individuals in Callimont borough, private company employees (17 | 77.3%), and local government employees (5 | 22.7%) make up the most common classes of employment.
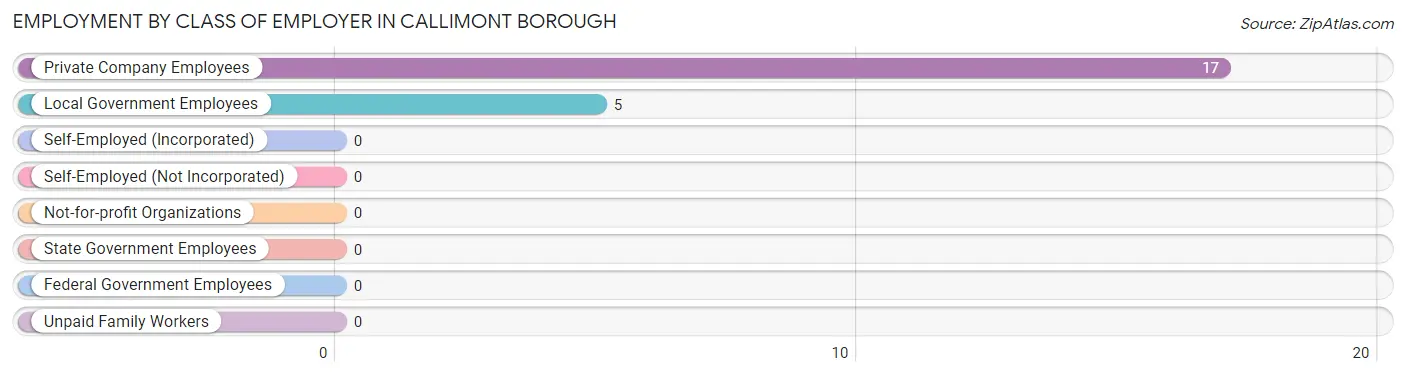
| Employer Class | # Employees | % Employees |
| Private Company Employees | 17 | 77.3% |
| Self-Employed (Incorporated) | 0 | 0.0% |
| Self-Employed (Not Incorporated) | 0 | 0.0% |
| Not-for-profit Organizations | 0 | 0.0% |
| Local Government Employees | 5 | 22.7% |
| State Government Employees | 0 | 0.0% |
| Federal Government Employees | 0 | 0.0% |
| Unpaid Family Workers | 0 | 0.0% |
| Total | 22 | 100.0% |
Employment Status by Age in Callimont borough
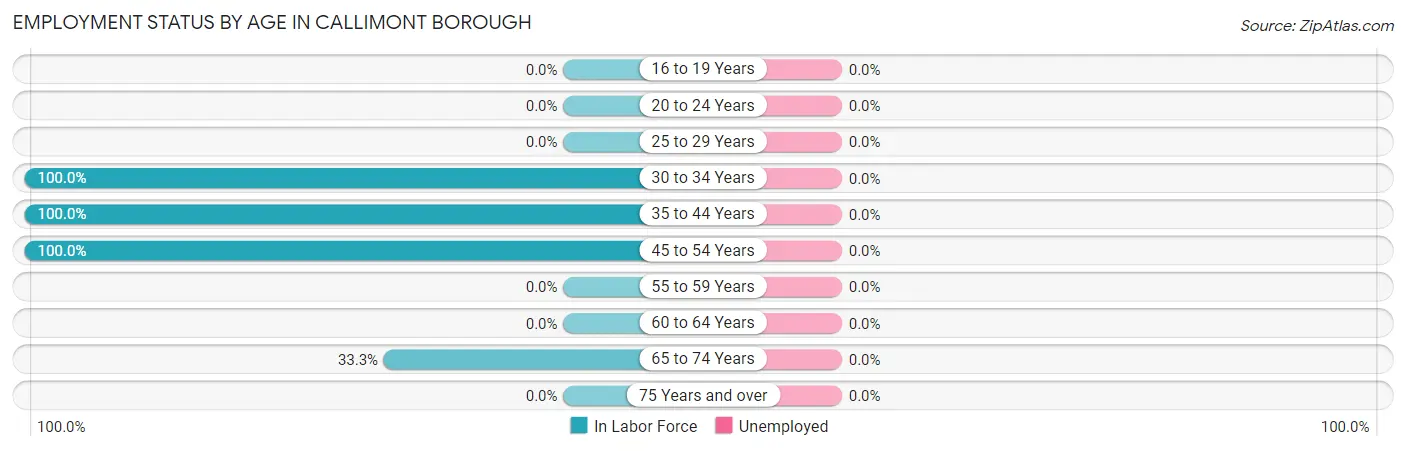
| Age Bracket | In Labor Force | Unemployed |
| 16 to 19 Years | 0 (0.0%) | 0 (0.0%) |
| 20 to 24 Years | 0 (0.0%) | 0 (0.0%) |
| 25 to 29 Years | 0 (0.0%) | 0 (0.0%) |
| 30 to 34 Years | 15 (100.0%) | 0 (0.0%) |
| 35 to 44 Years | 3 (100.0%) | 0 (0.0%) |
| 45 to 54 Years | 1 (100.0%) | 0 (0.0%) |
| 55 to 59 Years | 0 (0.0%) | 0 (0.0%) |
| 60 to 64 Years | 0 (0.0%) | 0 (0.0%) |
| 65 to 74 Years | 3 (33.3%) | 0 (0.0%) |
| 75 Years and over | 0 (0.0%) | 0 (0.0%) |
| Total | 22 (53.7%) | 0 (0.0%) |
Employment Status by Educational Attainment in Callimont borough
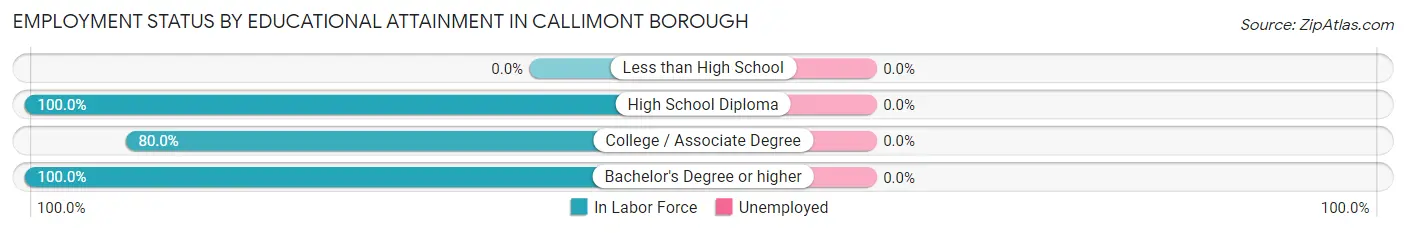
| Educational Attainment | In Labor Force | Unemployed |
| Less than High School | 0 (0.0%) | 0 (0.0%) |
| High School Diploma | 1 (100.0%) | 0 (0.0%) |
| College / Associate Degree | 16 (80.0%) | 0 (0.0%) |
| Bachelor's Degree or higher | 2 (100.0%) | 0 (0.0%) |
| Total | 19 (82.6%) | 0 (0.0%) |
Employment Occupations by Sex in Callimont borough
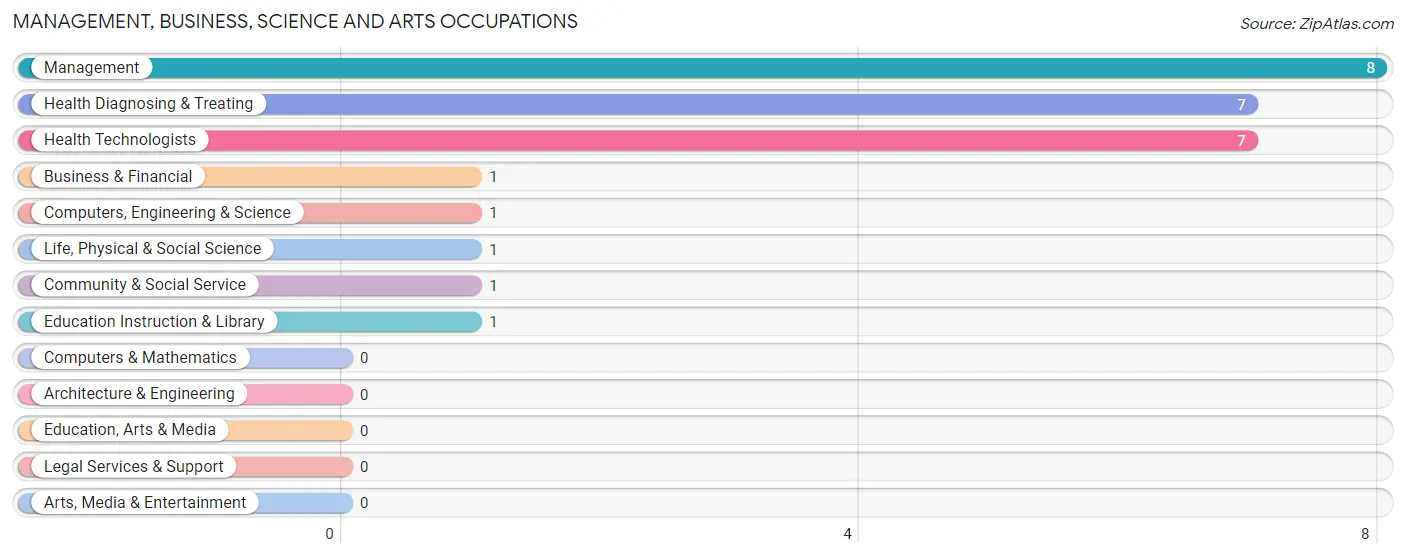
Management, Business, Science and Arts Occupations
The most common Management, Business, Science and Arts occupations in Callimont borough are Management (8 | 36.4%), Health Diagnosing & Treating (7 | 31.8%), Health Technologists (7 | 31.8%), Business & Financial (1 | 4.5%), and Computers, Engineering & Science (1 | 4.5%).
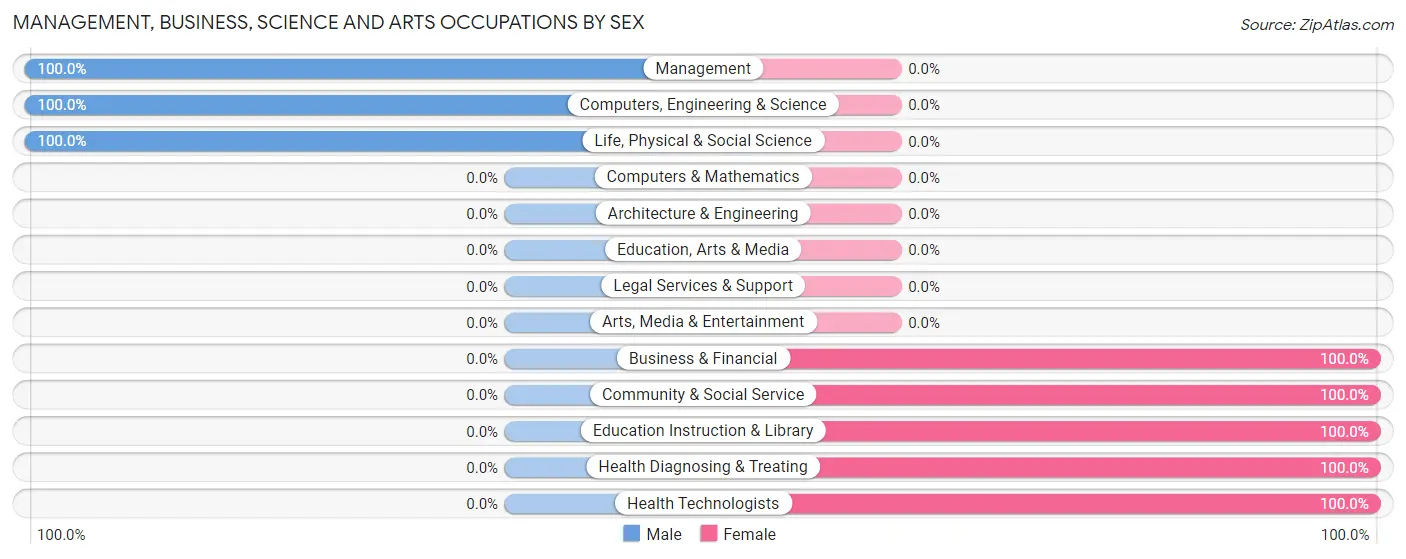
Management, Business, Science and Arts Occupations by Sex
Within the Management, Business, Science and Arts occupations in Callimont borough, the most male-oriented occupations are Management (100.0%), Computers, Engineering & Science (100.0%), and Life, Physical & Social Science (100.0%), while the most female-oriented occupations are Business & Financial (100.0%), Community & Social Service (100.0%), and Education Instruction & Library (100.0%).
| Occupation | Male | Female |
| Management | 8 (100.0%) | 0 (0.0%) |
| Business & Financial | 0 (0.0%) | 1 (100.0%) |
| Computers, Engineering & Science | 1 (100.0%) | 0 (0.0%) |
| Computers & Mathematics | 0 (0.0%) | 0 (0.0%) |
| Architecture & Engineering | 0 (0.0%) | 0 (0.0%) |
| Life, Physical & Social Science | 1 (100.0%) | 0 (0.0%) |
| Community & Social Service | 0 (0.0%) | 1 (100.0%) |
| Education, Arts & Media | 0 (0.0%) | 0 (0.0%) |
| Legal Services & Support | 0 (0.0%) | 0 (0.0%) |
| Education Instruction & Library | 0 (0.0%) | 1 (100.0%) |
| Arts, Media & Entertainment | 0 (0.0%) | 0 (0.0%) |
| Health Diagnosing & Treating | 0 (0.0%) | 7 (100.0%) |
| Health Technologists | 0 (0.0%) | 7 (100.0%) |
| Total (Category) | 9 (50.0%) | 9 (50.0%) |
| Total (Overall) | 13 (59.1%) | 9 (40.9%) |
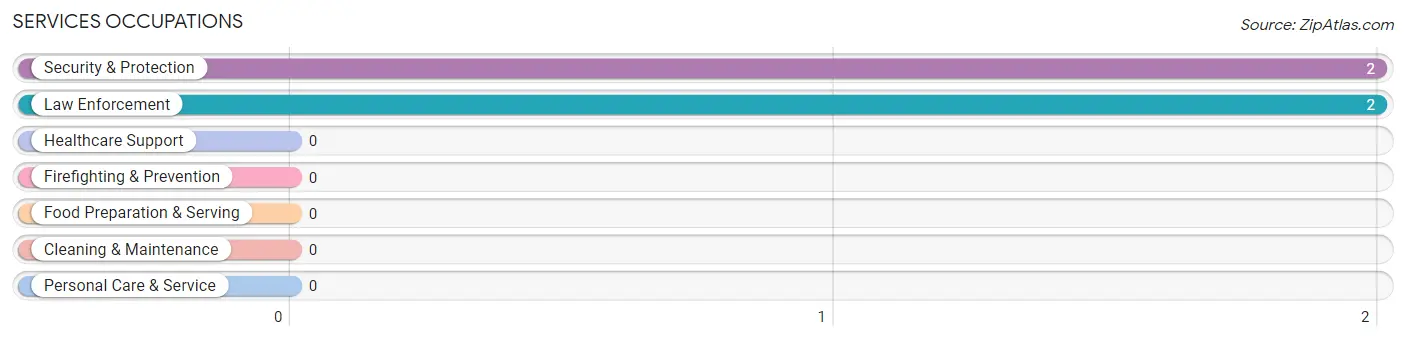
Services Occupations
The most common Services occupations in Callimont borough are Security & Protection (2 | 9.1%), and Law Enforcement (2 | 9.1%).
Services Occupations by Sex
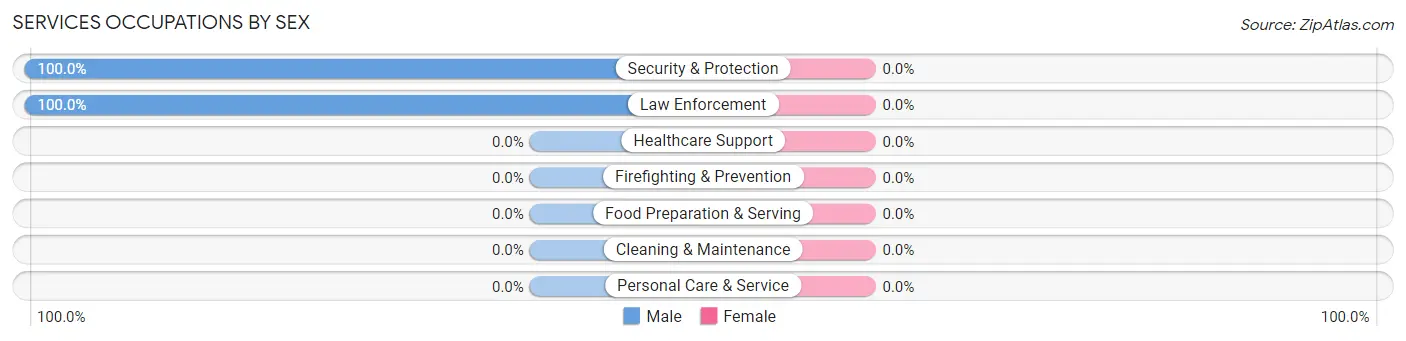
| Occupation | Male | Female |
| Healthcare Support | 0 (0.0%) | 0 (0.0%) |
| Security & Protection | 2 (100.0%) | 0 (0.0%) |
| Firefighting & Prevention | 0 (0.0%) | 0 (0.0%) |
| Law Enforcement | 2 (100.0%) | 0 (0.0%) |
| Food Preparation & Serving | 0 (0.0%) | 0 (0.0%) |
| Cleaning & Maintenance | 0 (0.0%) | 0 (0.0%) |
| Personal Care & Service | 0 (0.0%) | 0 (0.0%) |
| Total (Category) | 2 (100.0%) | 0 (0.0%) |
| Total (Overall) | 13 (59.1%) | 9 (40.9%) |
Sales and Office Occupations
Sales and Office Occupations by Sex
| Occupation | Male | Female |
| Sales & Related | 0 (0.0%) | 0 (0.0%) |
| Office & Administration | 0 (0.0%) | 0 (0.0%) |
| Total (Category) | 0 (0.0%) | 0 (0.0%) |
| Total (Overall) | 13 (59.1%) | 9 (40.9%) |
Natural Resources, Construction and Maintenance Occupations
The most common Natural Resources, Construction and Maintenance occupations in Callimont borough are , and Installation, Maintenance & Repair (1 | 4.5%).
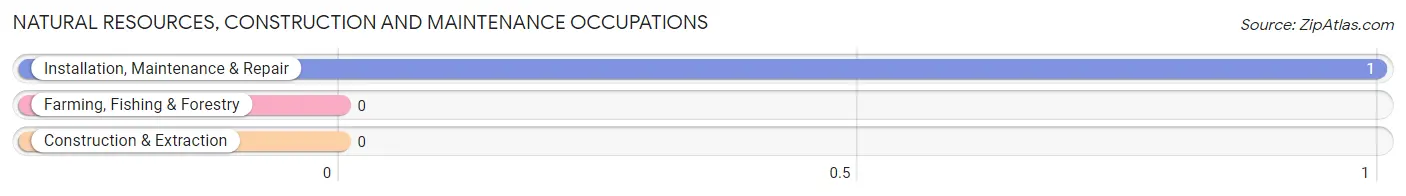
Natural Resources, Construction and Maintenance Occupations by Sex
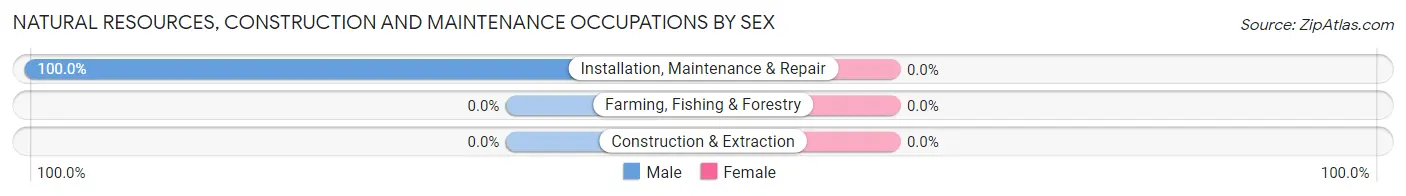
| Occupation | Male | Female |
| Farming, Fishing & Forestry | 0 (0.0%) | 0 (0.0%) |
| Construction & Extraction | 0 (0.0%) | 0 (0.0%) |
| Installation, Maintenance & Repair | 1 (100.0%) | 0 (0.0%) |
| Total (Category) | 1 (100.0%) | 0 (0.0%) |
| Total (Overall) | 13 (59.1%) | 9 (40.9%) |
Production, Transportation and Moving Occupations
The most common Production, Transportation and Moving occupations in Callimont borough are , and Production (1 | 4.5%).
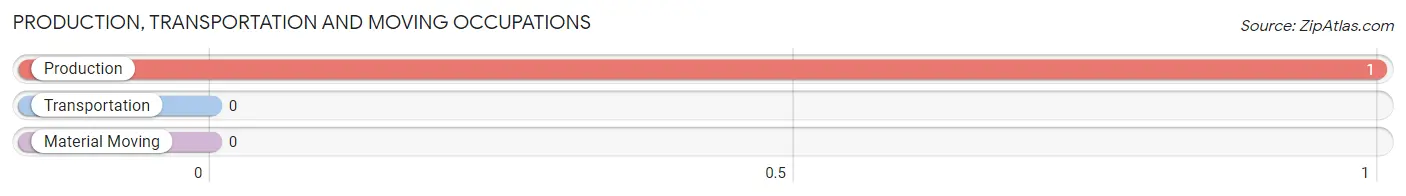
Production, Transportation and Moving Occupations by Sex
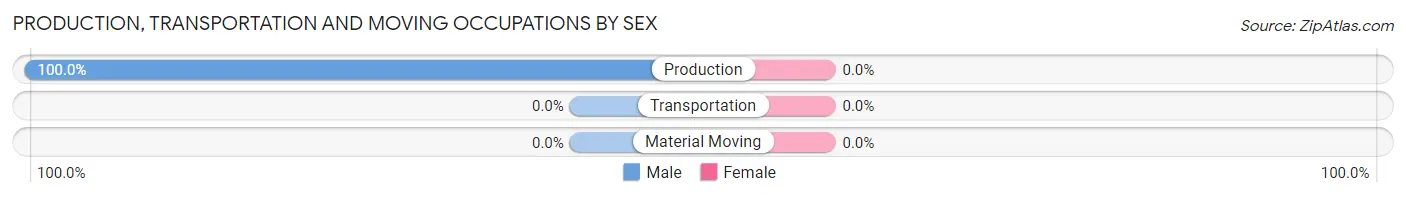
| Occupation | Male | Female |
| Production | 1 (100.0%) | 0 (0.0%) |
| Transportation | 0 (0.0%) | 0 (0.0%) |
| Material Moving | 0 (0.0%) | 0 (0.0%) |
| Total (Category) | 1 (100.0%) | 0 (0.0%) |
| Total (Overall) | 13 (59.1%) | 9 (40.9%) |
Employment Industries by Sex in Callimont borough
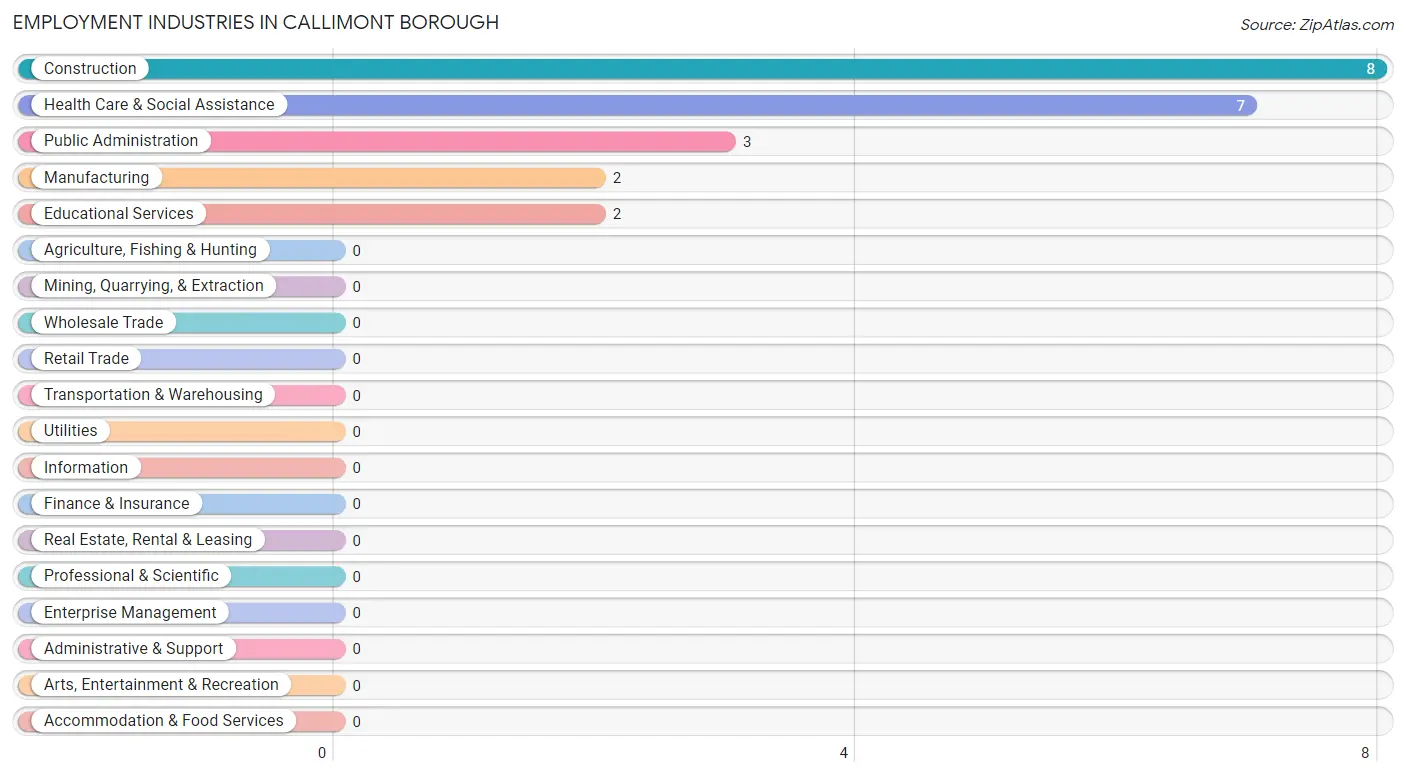
Employment Industries in Callimont borough
The major employment industries in Callimont borough include Construction (8 | 36.4%), Health Care & Social Assistance (7 | 31.8%), Public Administration (3 | 13.6%), Manufacturing (2 | 9.1%), and Educational Services (2 | 9.1%).
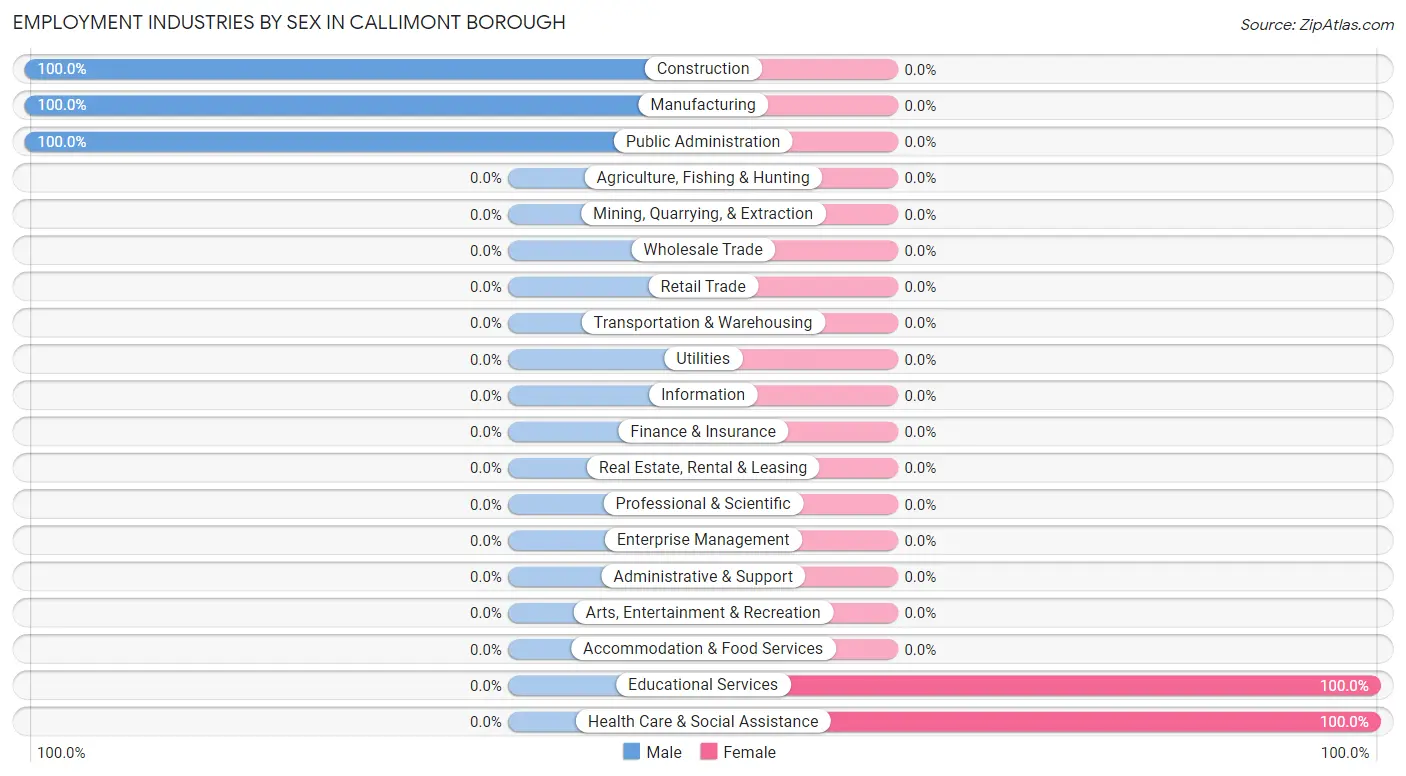
Employment Industries by Sex in Callimont borough
The Callimont borough industries that see more men than women are Construction (100.0%), Manufacturing (100.0%), and Public Administration (100.0%), whereas the industries that tend to have a higher number of women are Educational Services (100.0%), and Health Care & Social Assistance (100.0%).
| Industry | Male | Female |
| Agriculture, Fishing & Hunting | 0 (0.0%) | 0 (0.0%) |
| Mining, Quarrying, & Extraction | 0 (0.0%) | 0 (0.0%) |
| Construction | 8 (100.0%) | 0 (0.0%) |
| Manufacturing | 2 (100.0%) | 0 (0.0%) |
| Wholesale Trade | 0 (0.0%) | 0 (0.0%) |
| Retail Trade | 0 (0.0%) | 0 (0.0%) |
| Transportation & Warehousing | 0 (0.0%) | 0 (0.0%) |
| Utilities | 0 (0.0%) | 0 (0.0%) |
| Information | 0 (0.0%) | 0 (0.0%) |
| Finance & Insurance | 0 (0.0%) | 0 (0.0%) |
| Real Estate, Rental & Leasing | 0 (0.0%) | 0 (0.0%) |
| Professional & Scientific | 0 (0.0%) | 0 (0.0%) |
| Enterprise Management | 0 (0.0%) | 0 (0.0%) |
| Administrative & Support | 0 (0.0%) | 0 (0.0%) |
| Educational Services | 0 (0.0%) | 2 (100.0%) |
| Health Care & Social Assistance | 0 (0.0%) | 7 (100.0%) |
| Arts, Entertainment & Recreation | 0 (0.0%) | 0 (0.0%) |
| Accommodation & Food Services | 0 (0.0%) | 0 (0.0%) |
| Public Administration | 3 (100.0%) | 0 (0.0%) |
| Total | 13 (59.1%) | 9 (40.9%) |
Education in Callimont borough
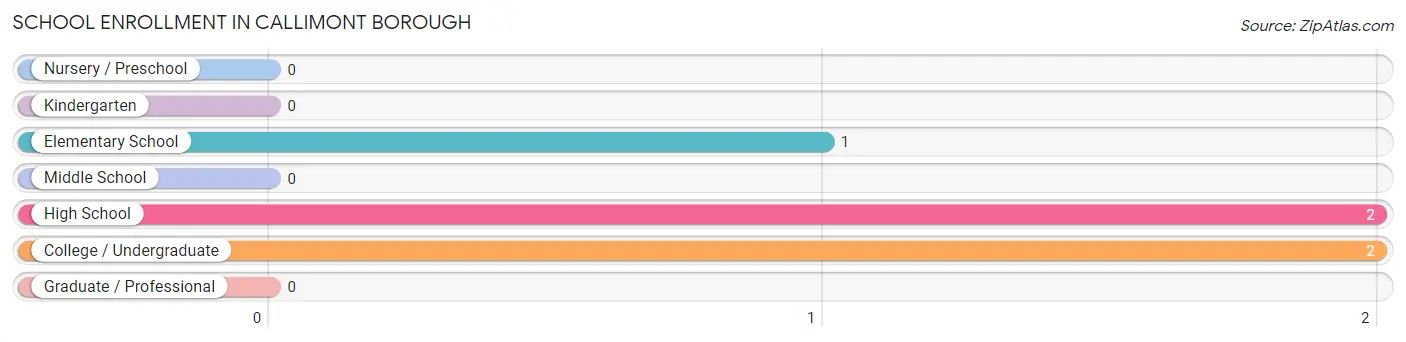
School Enrollment in Callimont borough
The most common levels of schooling among the 5 students in Callimont borough are high school (2 | 40.0%), college / undergraduate (2 | 40.0%), and elementary school (1 | 20.0%).
| School Level | # Students | % Students |
| Nursery / Preschool | 0 | 0.0% |
| Kindergarten | 0 | 0.0% |
| Elementary School | 1 | 20.0% |
| Middle School | 0 | 0.0% |
| High School | 2 | 40.0% |
| College / Undergraduate | 2 | 40.0% |
| Graduate / Professional | 0 | 0.0% |
| Total | 5 | 100.0% |
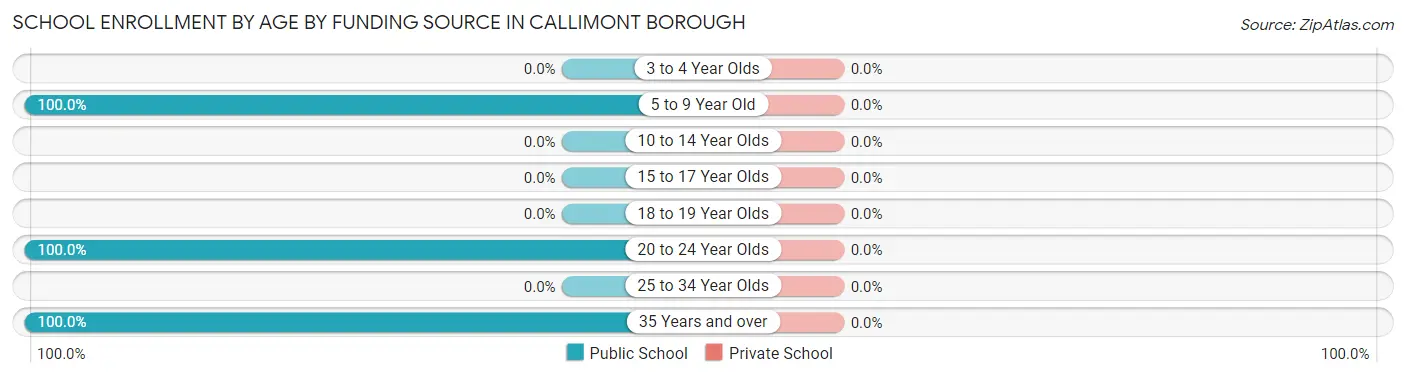
School Enrollment by Age by Funding Source in Callimont borough
| Age Bracket | Public School | Private School |
| 3 to 4 Year Olds | 0 (0.0%) | 0 (0.0%) |
| 5 to 9 Year Old | 1 (100.0%) | 0 (0.0%) |
| 10 to 14 Year Olds | 0 (0.0%) | 0 (0.0%) |
| 15 to 17 Year Olds | 0 (0.0%) | 0 (0.0%) |
| 18 to 19 Year Olds | 0 (0.0%) | 0 (0.0%) |
| 20 to 24 Year Olds | 2 (100.0%) | 0 (0.0%) |
| 25 to 34 Year Olds | 0 (0.0%) | 0 (0.0%) |
| 35 Years and over | 2 (100.0%) | 0 (0.0%) |
| Total | 5 (100.0%) | 0 (0.0%) |
Educational Attainment by Field of Study in Callimont borough
Physical & health sciences (3 | 25.0%), bio, nature & agricultural (2 | 16.7%), social sciences (2 | 16.7%), science & technology (2 | 16.7%), and psychology (1 | 8.3%) are the most common fields of study among 12 individuals in Callimont borough who have obtained a bachelor's degree or higher.
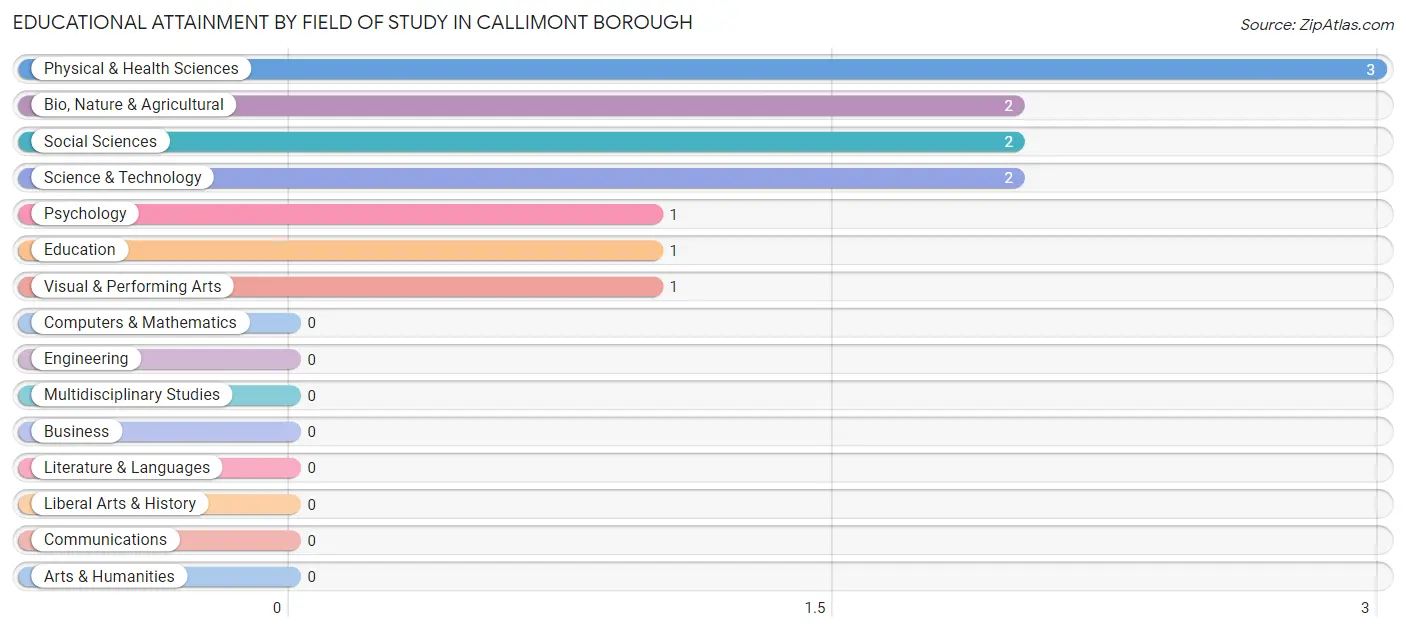
| Field of Study | # Graduates | % Graduates |
| Computers & Mathematics | 0 | 0.0% |
| Bio, Nature & Agricultural | 2 | 16.7% |
| Physical & Health Sciences | 3 | 25.0% |
| Psychology | 1 | 8.3% |
| Social Sciences | 2 | 16.7% |
| Engineering | 0 | 0.0% |
| Multidisciplinary Studies | 0 | 0.0% |
| Science & Technology | 2 | 16.7% |
| Business | 0 | 0.0% |
| Education | 1 | 8.3% |
| Literature & Languages | 0 | 0.0% |
| Liberal Arts & History | 0 | 0.0% |
| Visual & Performing Arts | 1 | 8.3% |
| Communications | 0 | 0.0% |
| Arts & Humanities | 0 | 0.0% |
| Total | 12 | 100.0% |
Transportation & Commute in Callimont borough
Vehicle Availability by Sex in Callimont borough
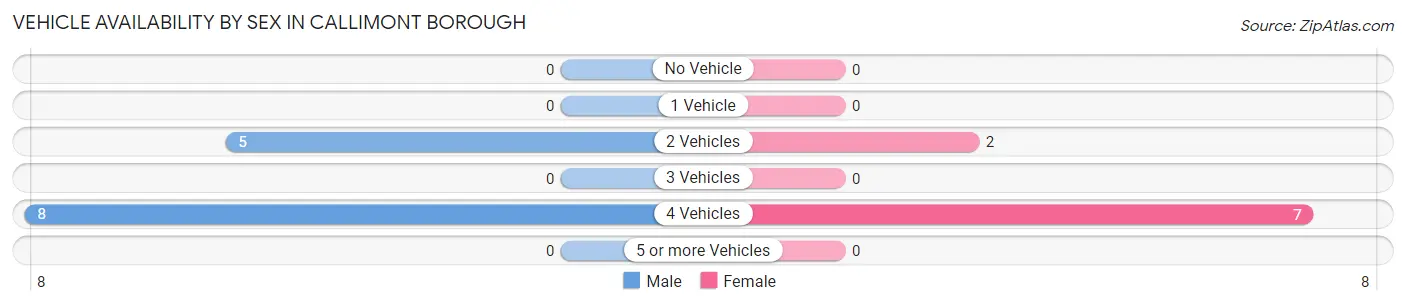
The most prevalent vehicle ownership categories in Callimont borough are males with 4 vehicles (8, accounting for 61.5%) and females with 4 vehicles (7, making up 88.9%).
| Vehicles Available | Male | Female |
| No Vehicle | 0 (0.0%) | 0 (0.0%) |
| 1 Vehicle | 0 (0.0%) | 0 (0.0%) |
| 2 Vehicles | 5 (38.5%) | 2 (22.2%) |
| 3 Vehicles | 0 (0.0%) | 0 (0.0%) |
| 4 Vehicles | 8 (61.5%) | 7 (77.8%) |
| 5 or more Vehicles | 0 (0.0%) | 0 (0.0%) |
| Total | 13 (100.0%) | 9 (100.0%) |
Commute Time in Callimont borough
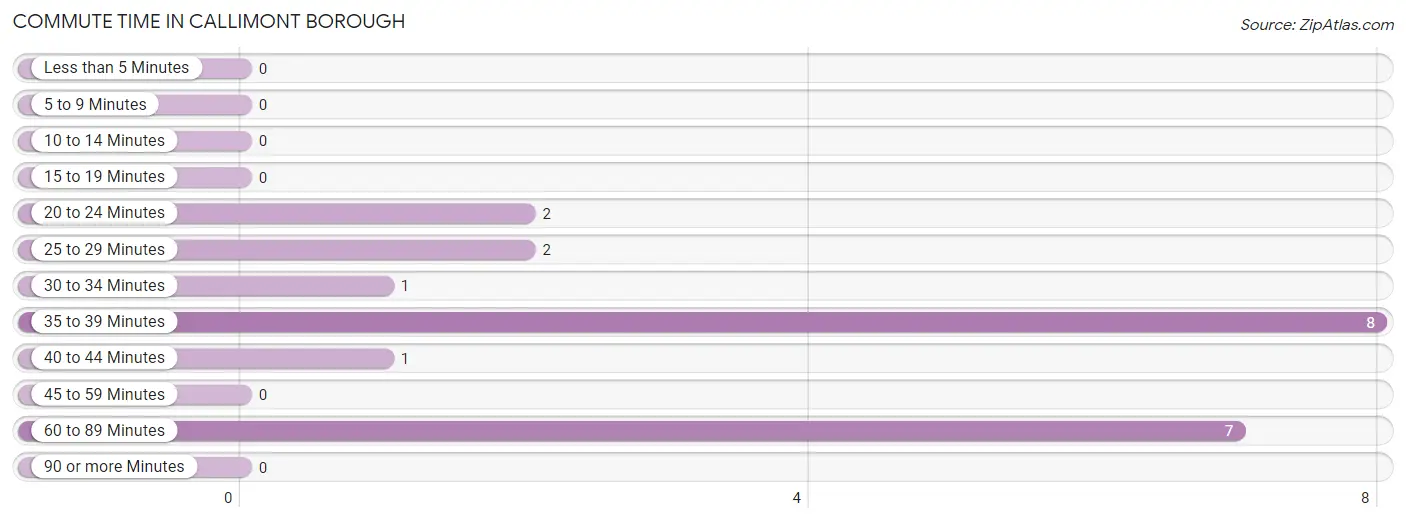
The most frequently occuring commute durations in Callimont borough are 35 to 39 minutes (8 commuters, 38.1%), 60 to 89 minutes (7 commuters, 33.3%), and 20 to 24 minutes (2 commuters, 9.5%).
| Commute Time | # Commuters | % Commuters |
| Less than 5 Minutes | 0 | 0.0% |
| 5 to 9 Minutes | 0 | 0.0% |
| 10 to 14 Minutes | 0 | 0.0% |
| 15 to 19 Minutes | 0 | 0.0% |
| 20 to 24 Minutes | 2 | 9.5% |
| 25 to 29 Minutes | 2 | 9.5% |
| 30 to 34 Minutes | 1 | 4.8% |
| 35 to 39 Minutes | 8 | 38.1% |
| 40 to 44 Minutes | 1 | 4.8% |
| 45 to 59 Minutes | 0 | 0.0% |
| 60 to 89 Minutes | 7 | 33.3% |
| 90 or more Minutes | 0 | 0.0% |
Commute Time by Sex in Callimont borough
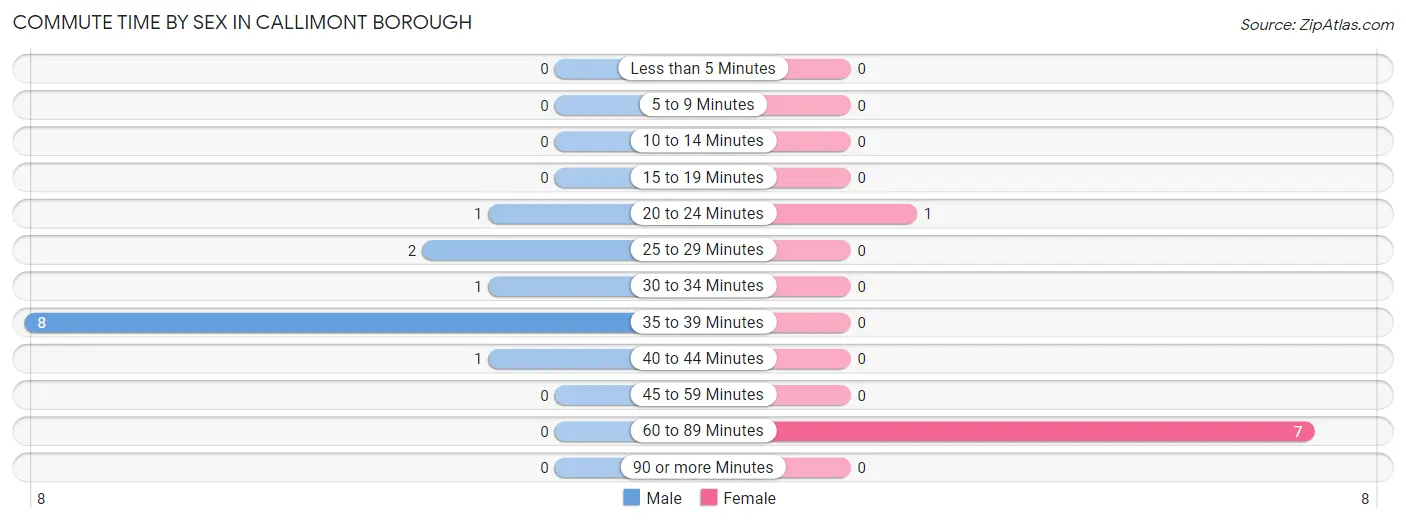
The most common commute times in Callimont borough are 35 to 39 minutes (8 commuters, 61.5%) for males and 60 to 89 minutes (7 commuters, 87.5%) for females.
| Commute Time | Male | Female |
| Less than 5 Minutes | 0 (0.0%) | 0 (0.0%) |
| 5 to 9 Minutes | 0 (0.0%) | 0 (0.0%) |
| 10 to 14 Minutes | 0 (0.0%) | 0 (0.0%) |
| 15 to 19 Minutes | 0 (0.0%) | 0 (0.0%) |
| 20 to 24 Minutes | 1 (7.7%) | 1 (12.5%) |
| 25 to 29 Minutes | 2 (15.4%) | 0 (0.0%) |
| 30 to 34 Minutes | 1 (7.7%) | 0 (0.0%) |
| 35 to 39 Minutes | 8 (61.5%) | 0 (0.0%) |
| 40 to 44 Minutes | 1 (7.7%) | 0 (0.0%) |
| 45 to 59 Minutes | 0 (0.0%) | 0 (0.0%) |
| 60 to 89 Minutes | 0 (0.0%) | 7 (87.5%) |
| 90 or more Minutes | 0 (0.0%) | 0 (0.0%) |
Time of Departure to Work by Sex in Callimont borough
The most frequent times of departure to work in Callimont borough are 6:00 AM to 6:29 AM (9, 69.2%) for males and 4:00 PM to 11:59 PM (7, 87.5%) for females.
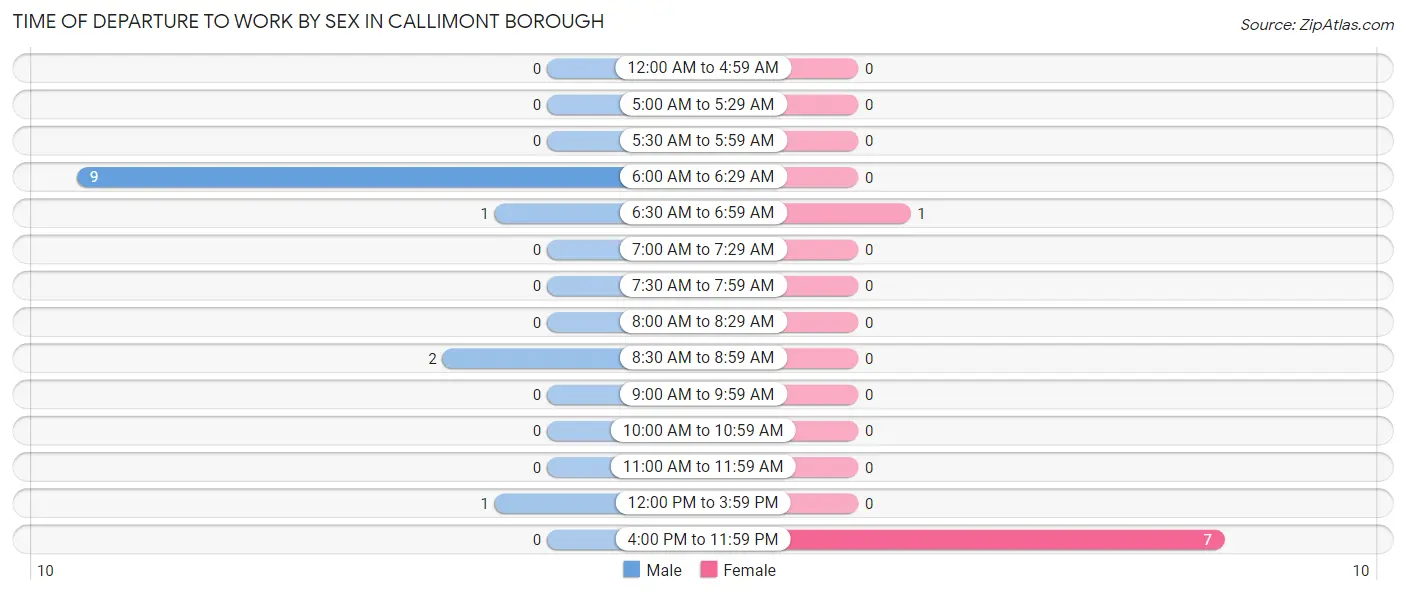
| Time of Departure | Male | Female |
| 12:00 AM to 4:59 AM | 0 (0.0%) | 0 (0.0%) |
| 5:00 AM to 5:29 AM | 0 (0.0%) | 0 (0.0%) |
| 5:30 AM to 5:59 AM | 0 (0.0%) | 0 (0.0%) |
| 6:00 AM to 6:29 AM | 9 (69.2%) | 0 (0.0%) |
| 6:30 AM to 6:59 AM | 1 (7.7%) | 1 (12.5%) |
| 7:00 AM to 7:29 AM | 0 (0.0%) | 0 (0.0%) |
| 7:30 AM to 7:59 AM | 0 (0.0%) | 0 (0.0%) |
| 8:00 AM to 8:29 AM | 0 (0.0%) | 0 (0.0%) |
| 8:30 AM to 8:59 AM | 2 (15.4%) | 0 (0.0%) |
| 9:00 AM to 9:59 AM | 0 (0.0%) | 0 (0.0%) |
| 10:00 AM to 10:59 AM | 0 (0.0%) | 0 (0.0%) |
| 11:00 AM to 11:59 AM | 0 (0.0%) | 0 (0.0%) |
| 12:00 PM to 3:59 PM | 1 (7.7%) | 0 (0.0%) |
| 4:00 PM to 11:59 PM | 0 (0.0%) | 7 (87.5%) |
| Total | 13 (100.0%) | 8 (100.0%) |
Housing Occupancy in Callimont borough
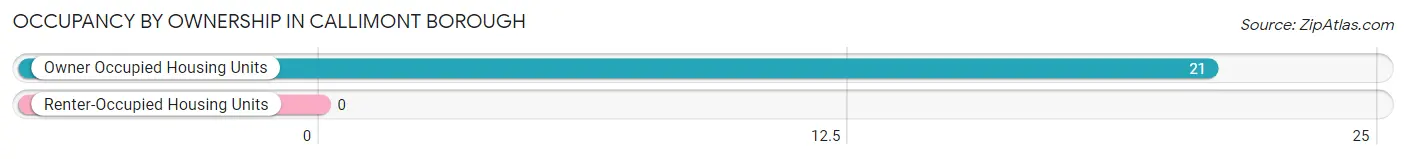
Occupancy by Ownership in Callimont borough
Of the total 21 dwellings in Callimont borough, owner-occupied units account for 21 (100.0%), while renter-occupied units make up 0 (0.0%).
| Occupancy | # Housing Units | % Housing Units |
| Owner Occupied Housing Units | 21 | 100.0% |
| Renter-Occupied Housing Units | 0 | 0.0% |
| Total Occupied Housing Units | 21 | 100.0% |
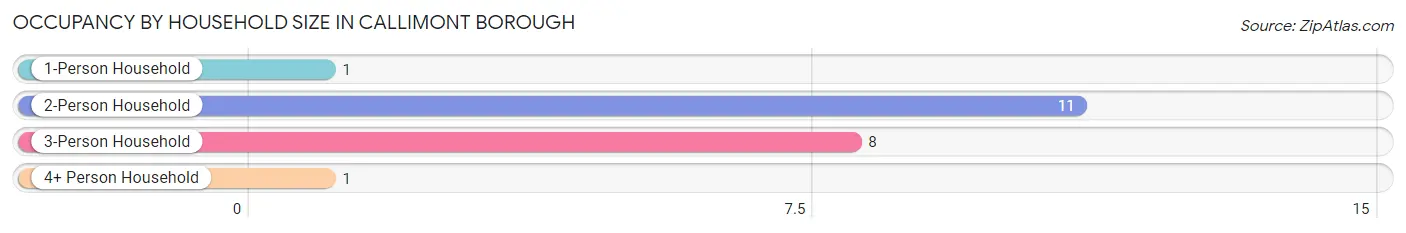
Occupancy by Household Size in Callimont borough
| Household Size | # Housing Units | % Housing Units |
| 1-Person Household | 1 | 4.8% |
| 2-Person Household | 11 | 52.4% |
| 3-Person Household | 8 | 38.1% |
| 4+ Person Household | 1 | 4.8% |
| Total Housing Units | 21 | 100.0% |
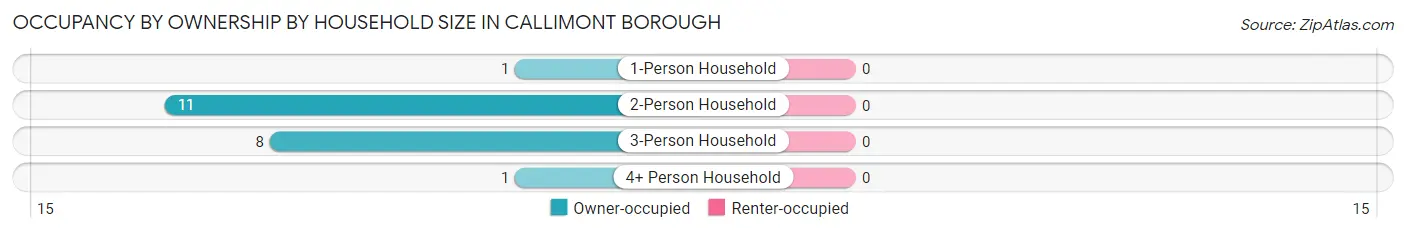
Occupancy by Ownership by Household Size in Callimont borough
| Household Size | Owner-occupied | Renter-occupied |
| 1-Person Household | 1 (100.0%) | 0 (0.0%) |
| 2-Person Household | 11 (100.0%) | 0 (0.0%) |
| 3-Person Household | 8 (100.0%) | 0 (0.0%) |
| 4+ Person Household | 1 (100.0%) | 0 (0.0%) |
| Total Housing Units | 21 (100.0%) | 0 (0.0%) |
Occupancy by Educational Attainment in Callimont borough
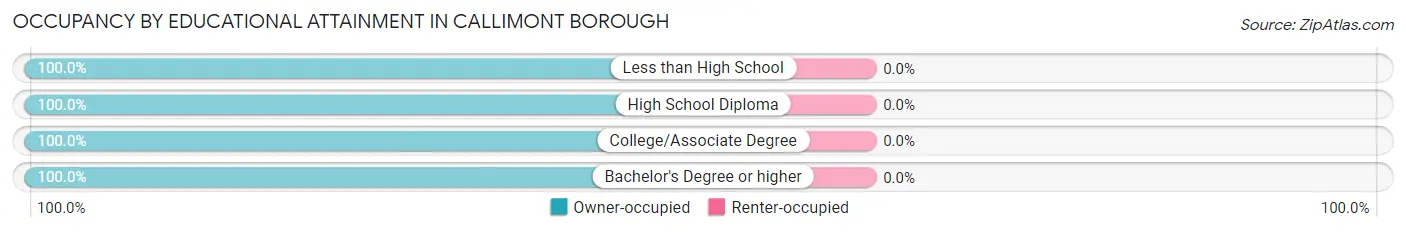
| Household Size | Owner-occupied | Renter-occupied |
| Less than High School | 2 (100.0%) | 0 (0.0%) |
| High School Diploma | 1 (100.0%) | 0 (0.0%) |
| College/Associate Degree | 13 (100.0%) | 0 (0.0%) |
| Bachelor's Degree or higher | 5 (100.0%) | 0 (0.0%) |
Occupancy by Age of Householder in Callimont borough
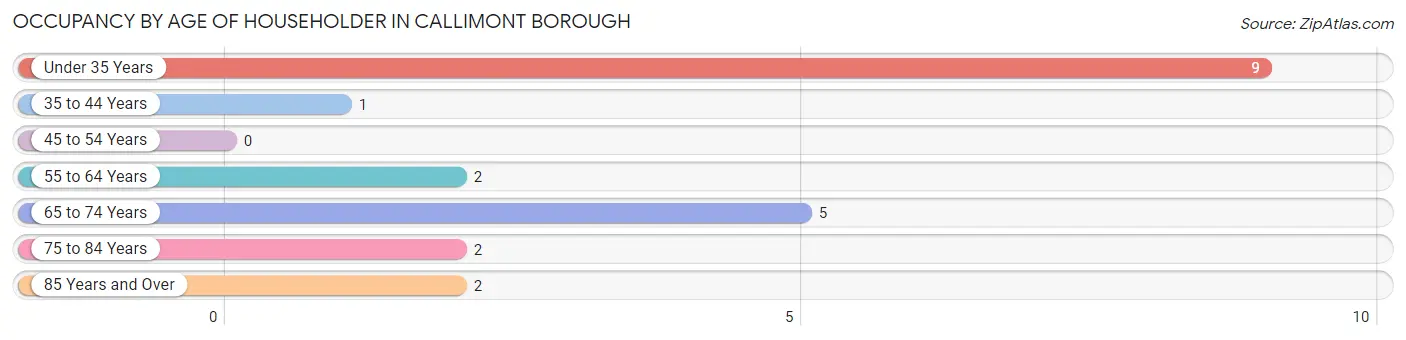
| Age Bracket | # Households | % Households |
| Under 35 Years | 9 | 42.9% |
| 35 to 44 Years | 1 | 4.8% |
| 45 to 54 Years | 0 | 0.0% |
| 55 to 64 Years | 2 | 9.5% |
| 65 to 74 Years | 5 | 23.8% |
| 75 to 84 Years | 2 | 9.5% |
| 85 Years and Over | 2 | 9.5% |
| Total | 21 | 100.0% |
Housing Finances in Callimont borough
Median Income by Occupancy in Callimont borough
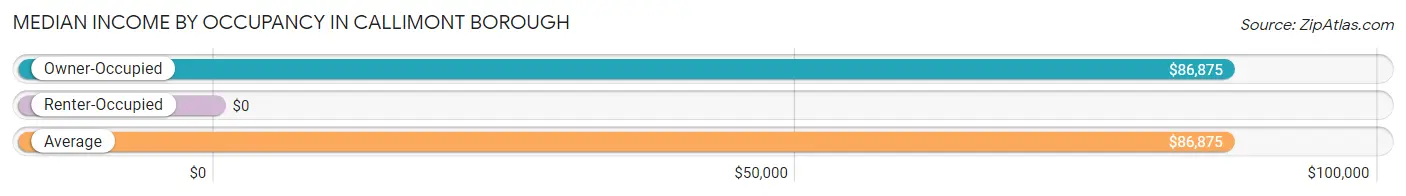
| Occupancy Type | # Households | Median Income |
| Owner-Occupied | 21 (100.0%) | $86,875 |
| Renter-Occupied | 0 (0.0%) | $0 |
| Average | 21 (100.0%) | $86,875 |
Occupancy by Householder Income Bracket in Callimont borough
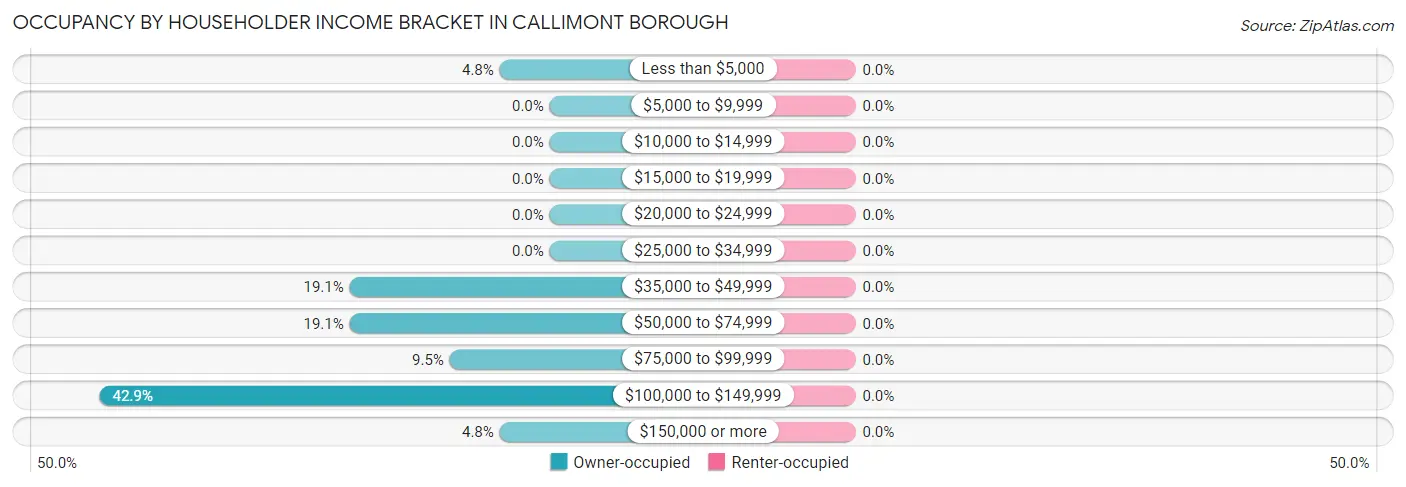
| Income Bracket | Owner-occupied | Renter-occupied |
| Less than $5,000 | 1 (4.8%) | 0 (0.0%) |
| $5,000 to $9,999 | 0 (0.0%) | 0 (0.0%) |
| $10,000 to $14,999 | 0 (0.0%) | 0 (0.0%) |
| $15,000 to $19,999 | 0 (0.0%) | 0 (0.0%) |
| $20,000 to $24,999 | 0 (0.0%) | 0 (0.0%) |
| $25,000 to $34,999 | 0 (0.0%) | 0 (0.0%) |
| $35,000 to $49,999 | 4 (19.1%) | 0 (0.0%) |
| $50,000 to $74,999 | 4 (19.1%) | 0 (0.0%) |
| $75,000 to $99,999 | 2 (9.5%) | 0 (0.0%) |
| $100,000 to $149,999 | 9 (42.9%) | 0 (0.0%) |
| $150,000 or more | 1 (4.8%) | 0 (0.0%) |
| Total | 21 (100.0%) | 0 (0.0%) |
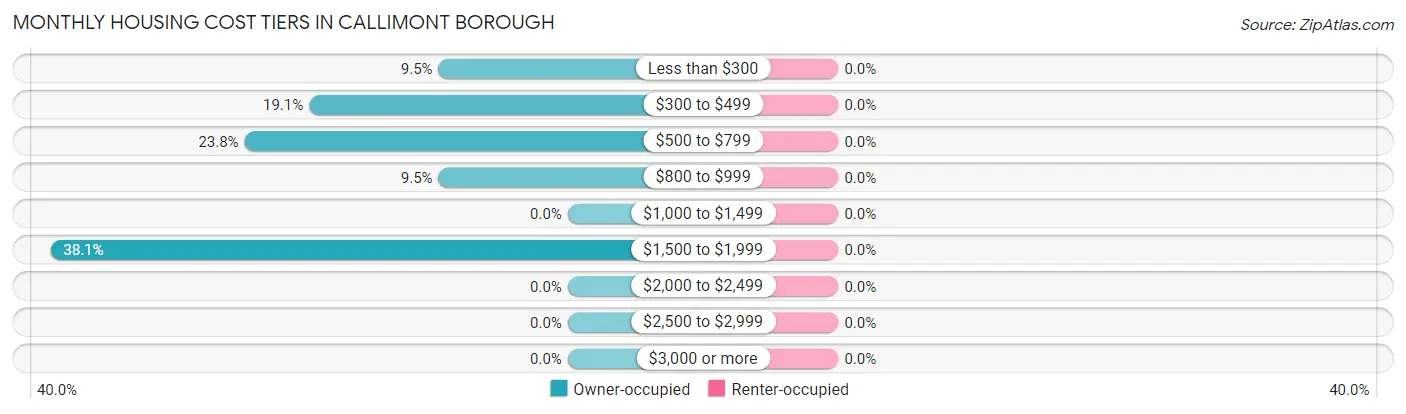
Monthly Housing Cost Tiers in Callimont borough
| Monthly Cost | Owner-occupied | Renter-occupied |
| Less than $300 | 2 (9.5%) | 0 (0.0%) |
| $300 to $499 | 4 (19.1%) | 0 (0.0%) |
| $500 to $799 | 5 (23.8%) | 0 (0.0%) |
| $800 to $999 | 2 (9.5%) | 0 (0.0%) |
| $1,000 to $1,499 | 0 (0.0%) | 0 (0.0%) |
| $1,500 to $1,999 | 8 (38.1%) | 0 (0.0%) |
| $2,000 to $2,499 | 0 (0.0%) | 0 (0.0%) |
| $2,500 to $2,999 | 0 (0.0%) | 0 (0.0%) |
| $3,000 or more | 0 (0.0%) | 0 (0.0%) |
| Total | 21 (100.0%) | 0 (0.0%) |
Physical Housing Characteristics in Callimont borough
Housing Structures in Callimont borough
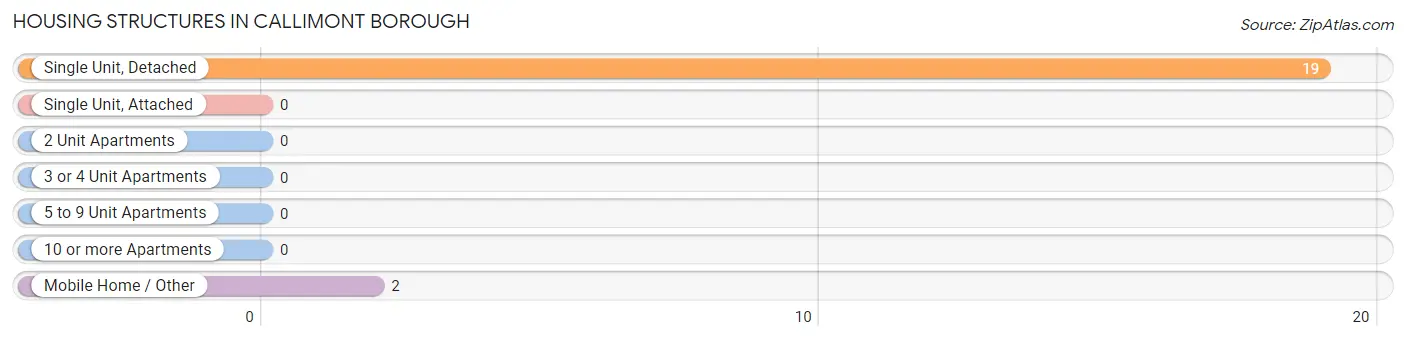
| Structure Type | # Housing Units | % Housing Units |
| Single Unit, Detached | 19 | 90.5% |
| Single Unit, Attached | 0 | 0.0% |
| 2 Unit Apartments | 0 | 0.0% |
| 3 or 4 Unit Apartments | 0 | 0.0% |
| 5 to 9 Unit Apartments | 0 | 0.0% |
| 10 or more Apartments | 0 | 0.0% |
| Mobile Home / Other | 2 | 9.5% |
| Total | 21 | 100.0% |
Housing Structures by Occupancy in Callimont borough
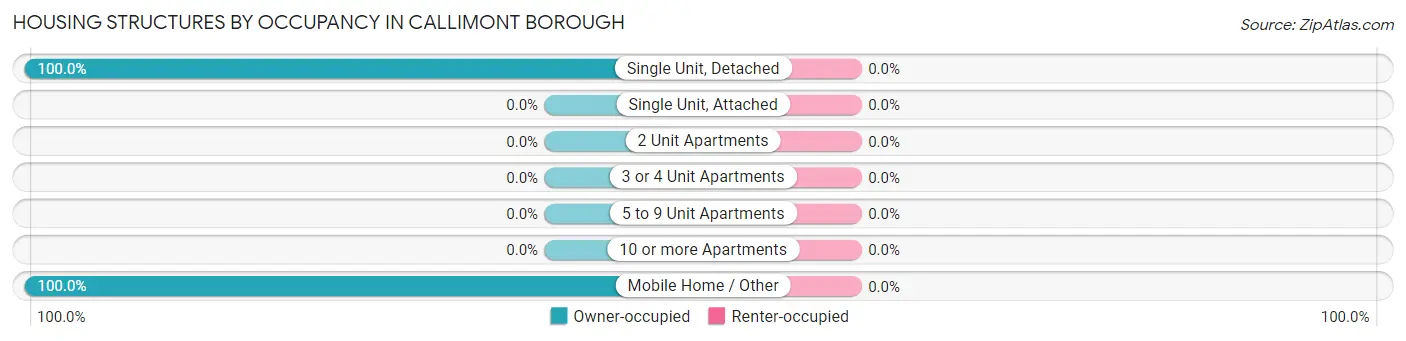
| Structure Type | Owner-occupied | Renter-occupied |
| Single Unit, Detached | 19 (100.0%) | 0 (0.0%) |
| Single Unit, Attached | 0 (0.0%) | 0 (0.0%) |
| 2 Unit Apartments | 0 (0.0%) | 0 (0.0%) |
| 3 or 4 Unit Apartments | 0 (0.0%) | 0 (0.0%) |
| 5 to 9 Unit Apartments | 0 (0.0%) | 0 (0.0%) |
| 10 or more Apartments | 0 (0.0%) | 0 (0.0%) |
| Mobile Home / Other | 2 (100.0%) | 0 (0.0%) |
| Total | 21 (100.0%) | 0 (0.0%) |
Housing Structures by Number of Rooms in Callimont borough
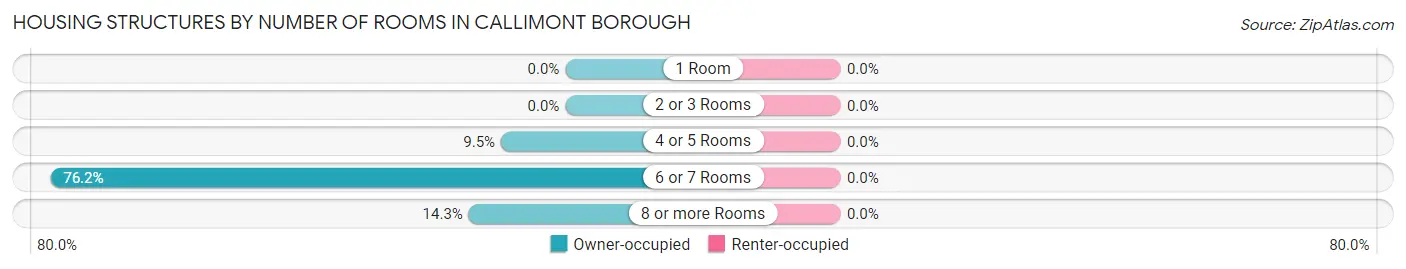
| Number of Rooms | Owner-occupied | Renter-occupied |
| 1 Room | 0 (0.0%) | 0 (0.0%) |
| 2 or 3 Rooms | 0 (0.0%) | 0 (0.0%) |
| 4 or 5 Rooms | 2 (9.5%) | 0 (0.0%) |
| 6 or 7 Rooms | 16 (76.2%) | 0 (0.0%) |
| 8 or more Rooms | 3 (14.3%) | 0 (0.0%) |
| Total | 21 (100.0%) | 0 (0.0%) |
Housing Structure by Heating Type in Callimont borough
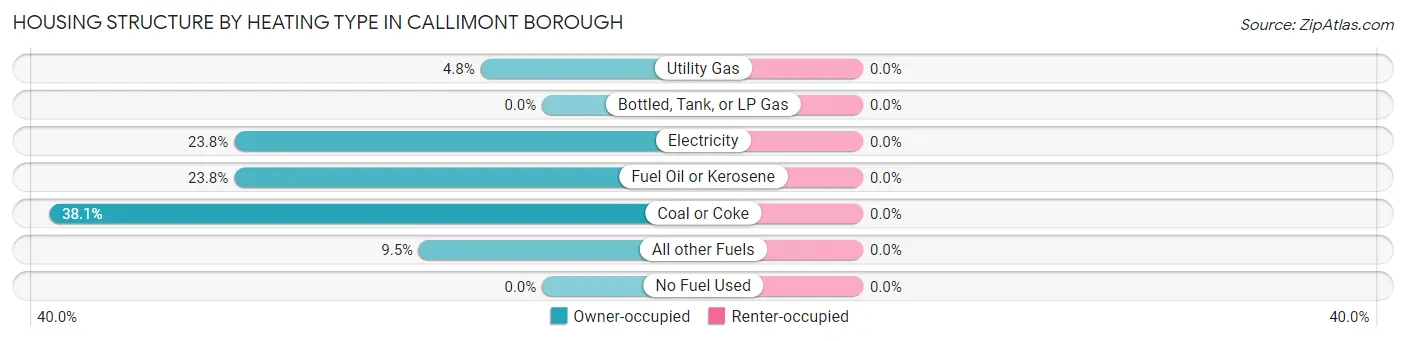
| Heating Type | Owner-occupied | Renter-occupied |
| Utility Gas | 1 (4.8%) | 0 (0.0%) |
| Bottled, Tank, or LP Gas | 0 (0.0%) | 0 (0.0%) |
| Electricity | 5 (23.8%) | 0 (0.0%) |
| Fuel Oil or Kerosene | 5 (23.8%) | 0 (0.0%) |
| Coal or Coke | 8 (38.1%) | 0 (0.0%) |
| All other Fuels | 2 (9.5%) | 0 (0.0%) |
| No Fuel Used | 0 (0.0%) | 0 (0.0%) |
| Total | 21 (100.0%) | 0 (0.0%) |
Household Vehicle Usage in Callimont borough
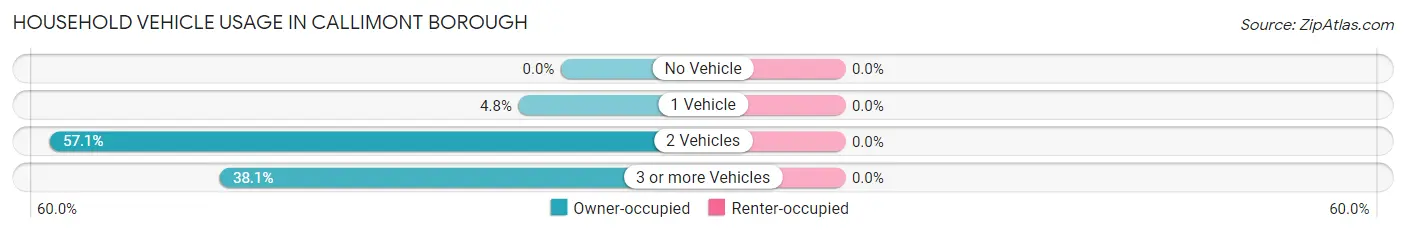
| Vehicles per Household | Owner-occupied | Renter-occupied |
| No Vehicle | 0 (0.0%) | 0 (0.0%) |
| 1 Vehicle | 1 (4.8%) | 0 (0.0%) |
| 2 Vehicles | 12 (57.1%) | 0 (0.0%) |
| 3 or more Vehicles | 8 (38.1%) | 0 (0.0%) |
| Total | 21 (100.0%) | 0 (0.0%) |
Real Estate & Mortgages in Callimont borough
Real Estate and Mortgage Overview in Callimont borough
| Characteristic | Without Mortgage | With Mortgage |
| Housing Units | 8 | 13 |
| Median Property Value | $175,000 | $225,000 |
| Median Household Income | $70,000 | $0 |
| Monthly Housing Costs | $375 | $0 |
| Real Estate Taxes | $900 | $0 |
Property Value by Mortgage Status in Callimont borough
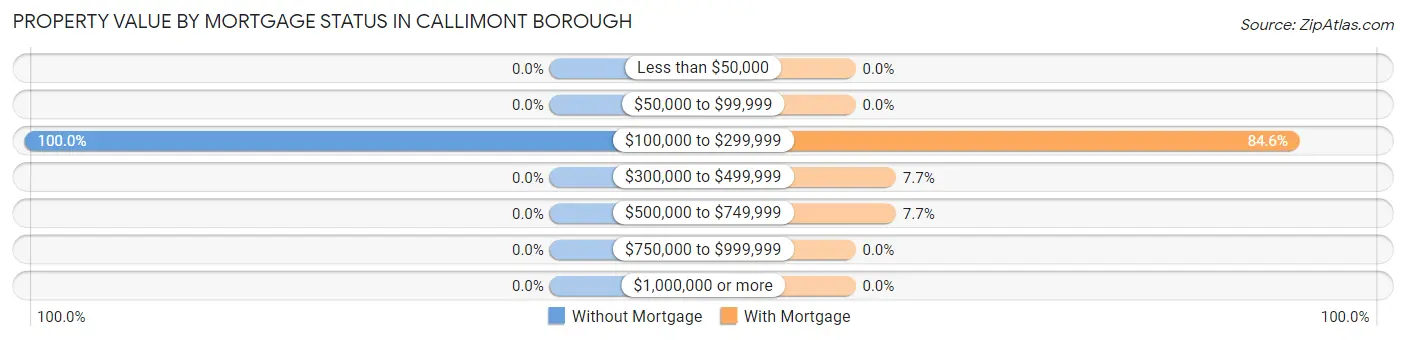
| Property Value | Without Mortgage | With Mortgage |
| Less than $50,000 | 0 (0.0%) | 0 (0.0%) |
| $50,000 to $99,999 | 0 (0.0%) | 0 (0.0%) |
| $100,000 to $299,999 | 8 (100.0%) | 11 (84.6%) |
| $300,000 to $499,999 | 0 (0.0%) | 1 (7.7%) |
| $500,000 to $749,999 | 0 (0.0%) | 1 (7.7%) |
| $750,000 to $999,999 | 0 (0.0%) | 0 (0.0%) |
| $1,000,000 or more | 0 (0.0%) | 0 (0.0%) |
| Total | 8 (100.0%) | 13 (100.0%) |
Household Income by Mortgage Status in Callimont borough
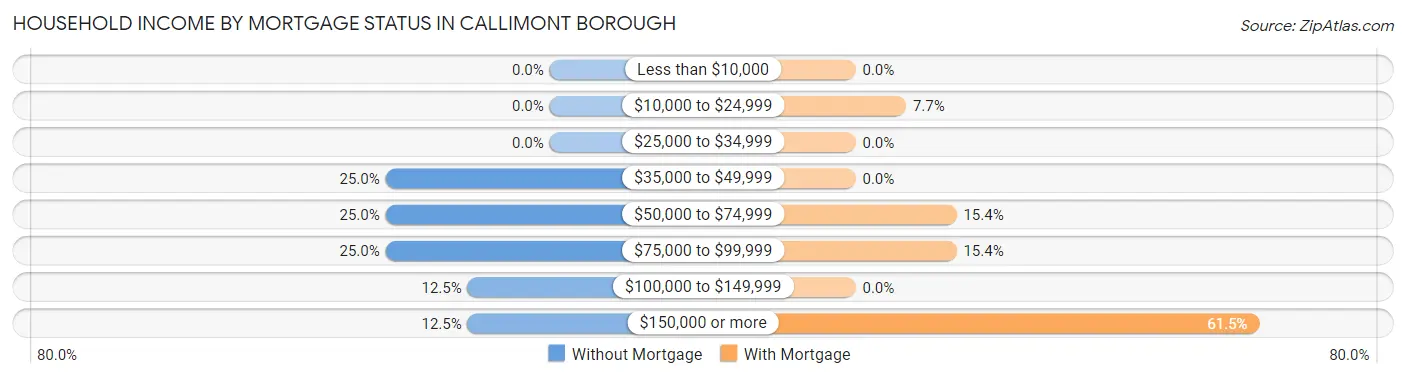
| Household Income | Without Mortgage | With Mortgage |
| Less than $10,000 | 0 (0.0%) | 0 (0.0%) |
| $10,000 to $24,999 | 0 (0.0%) | 1 (7.7%) |
| $25,000 to $34,999 | 0 (0.0%) | 0 (0.0%) |
| $35,000 to $49,999 | 2 (25.0%) | 0 (0.0%) |
| $50,000 to $74,999 | 2 (25.0%) | 2 (15.4%) |
| $75,000 to $99,999 | 2 (25.0%) | 2 (15.4%) |
| $100,000 to $149,999 | 1 (12.5%) | 0 (0.0%) |
| $150,000 or more | 1 (12.5%) | 8 (61.5%) |
| Total | 8 (100.0%) | 13 (100.0%) |
Property Value to Household Income Ratio in Callimont borough
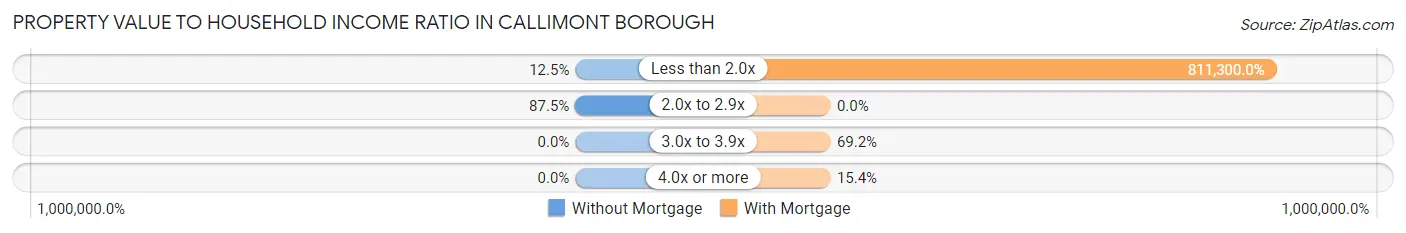
| Value-to-Income Ratio | Without Mortgage | With Mortgage |
| Less than 2.0x | 1 (12.5%) | 105,469 (811,300.0%) |
| 2.0x to 2.9x | 7 (87.5%) | 0 (0.0%) |
| 3.0x to 3.9x | 0 (0.0%) | 9 (69.2%) |
| 4.0x or more | 0 (0.0%) | 2 (15.4%) |
| Total | 8 (100.0%) | 13 (100.0%) |
Real Estate Taxes by Mortgage Status in Callimont borough
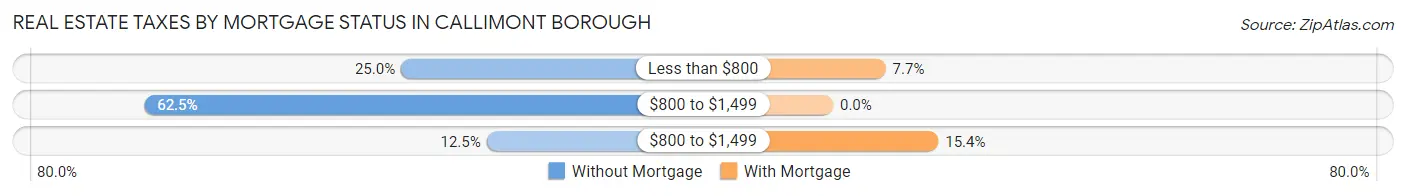
| Property Taxes | Without Mortgage | With Mortgage |
| Less than $800 | 2 (25.0%) | 1 (7.7%) |
| $800 to $1,499 | 5 (62.5%) | 0 (0.0%) |
| $800 to $1,499 | 1 (12.5%) | 2 (15.4%) |
| Total | 8 (100.0%) | 13 (100.0%) |
Health & Disability in Callimont borough
Health Insurance Coverage by Age in Callimont borough
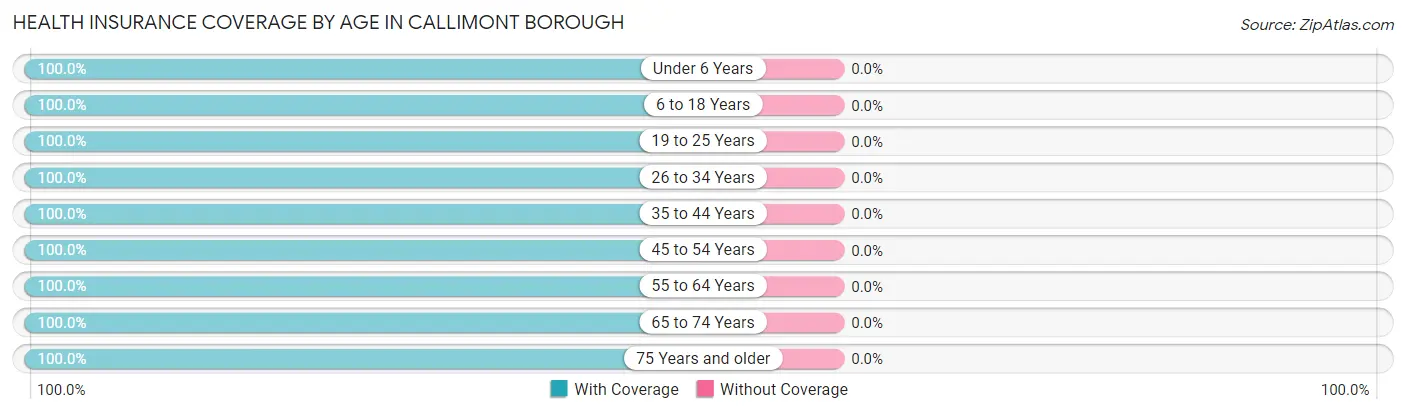
| Age Bracket | With Coverage | Without Coverage |
| Under 6 Years | 10 (100.0%) | 0 (0.0%) |
| 6 to 18 Years | 1 (100.0%) | 0 (0.0%) |
| 19 to 25 Years | 2 (100.0%) | 0 (0.0%) |
| 26 to 34 Years | 15 (100.0%) | 0 (0.0%) |
| 35 to 44 Years | 3 (100.0%) | 0 (0.0%) |
| 45 to 54 Years | 1 (100.0%) | 0 (0.0%) |
| 55 to 64 Years | 4 (100.0%) | 0 (0.0%) |
| 65 to 74 Years | 9 (100.0%) | 0 (0.0%) |
| 75 Years and older | 7 (100.0%) | 0 (0.0%) |
| Total | 52 (100.0%) | 0 (0.0%) |
Health Insurance Coverage by Citizenship Status in Callimont borough
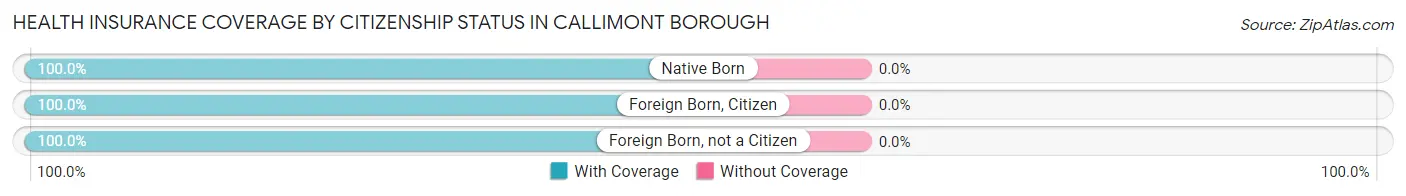
| Citizenship Status | With Coverage | Without Coverage |
| Native Born | 10 (100.0%) | 0 (0.0%) |
| Foreign Born, Citizen | 1 (100.0%) | 0 (0.0%) |
| Foreign Born, not a Citizen | 2 (100.0%) | 0 (0.0%) |
Health Insurance Coverage by Household Income in Callimont borough
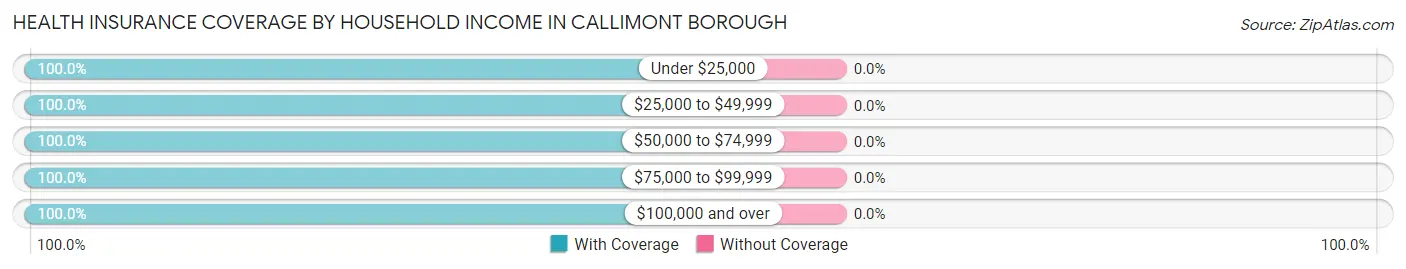
| Household Income | With Coverage | Without Coverage |
| Under $25,000 | 2 (100.0%) | 0 (0.0%) |
| $25,000 to $49,999 | 7 (100.0%) | 0 (0.0%) |
| $50,000 to $74,999 | 7 (100.0%) | 0 (0.0%) |
| $75,000 to $99,999 | 3 (100.0%) | 0 (0.0%) |
| $100,000 and over | 33 (100.0%) | 0 (0.0%) |
Public vs Private Health Insurance Coverage by Age in Callimont borough
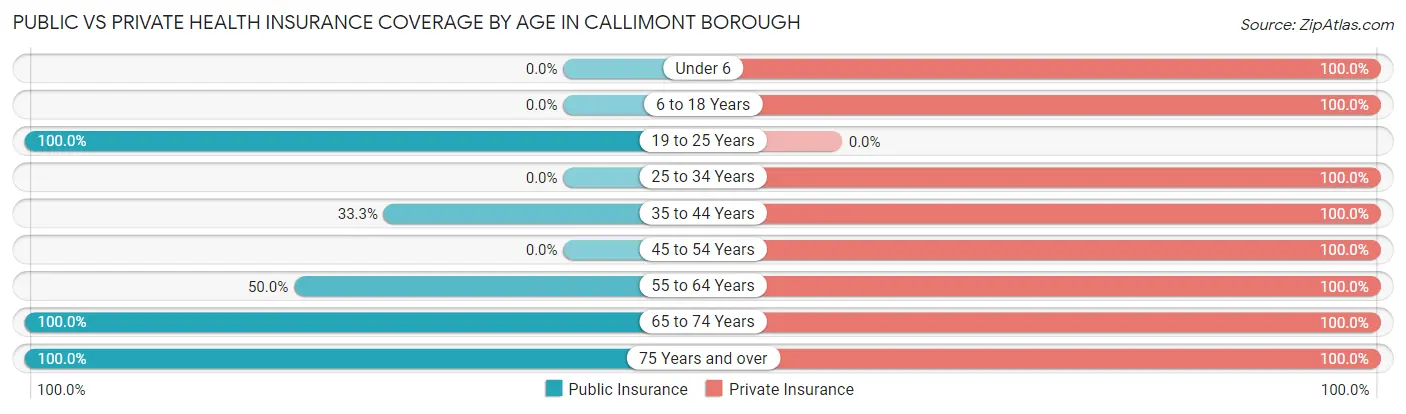
| Age Bracket | Public Insurance | Private Insurance |
| Under 6 | 0 (0.0%) | 10 (100.0%) |
| 6 to 18 Years | 0 (0.0%) | 1 (100.0%) |
| 19 to 25 Years | 2 (100.0%) | 0 (0.0%) |
| 25 to 34 Years | 0 (0.0%) | 15 (100.0%) |
| 35 to 44 Years | 1 (33.3%) | 3 (100.0%) |
| 45 to 54 Years | 0 (0.0%) | 1 (100.0%) |
| 55 to 64 Years | 2 (50.0%) | 4 (100.0%) |
| 65 to 74 Years | 9 (100.0%) | 9 (100.0%) |
| 75 Years and over | 7 (100.0%) | 7 (100.0%) |
| Total | 21 (40.4%) | 50 (96.2%) |
Disability Status by Sex by Age in Callimont borough
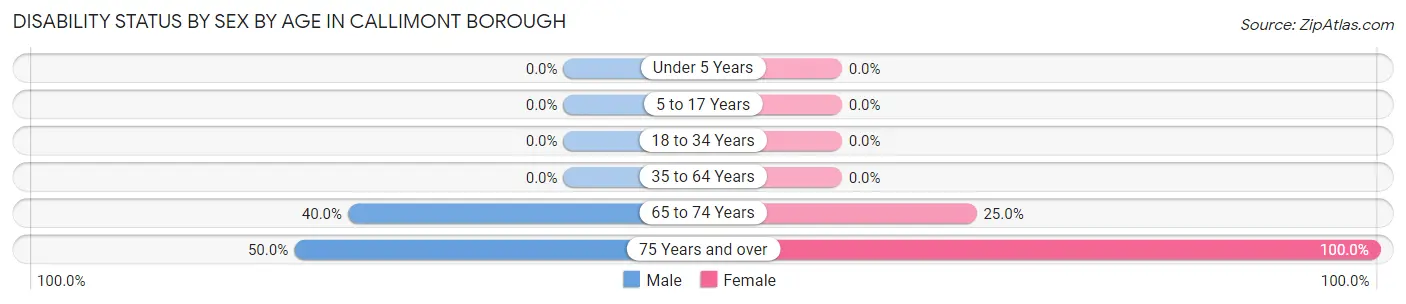
| Age Bracket | Male | Female |
| Under 5 Years | 0 (0.0%) | 0 (0.0%) |
| 5 to 17 Years | 0 (0.0%) | 0 (0.0%) |
| 18 to 34 Years | 0 (0.0%) | 0 (0.0%) |
| 35 to 64 Years | 0 (0.0%) | 0 (0.0%) |
| 65 to 74 Years | 2 (40.0%) | 1 (25.0%) |
| 75 Years and over | 2 (50.0%) | 3 (100.0%) |
Disability Class by Sex by Age in Callimont borough
Disability Class: Hearing Difficulty
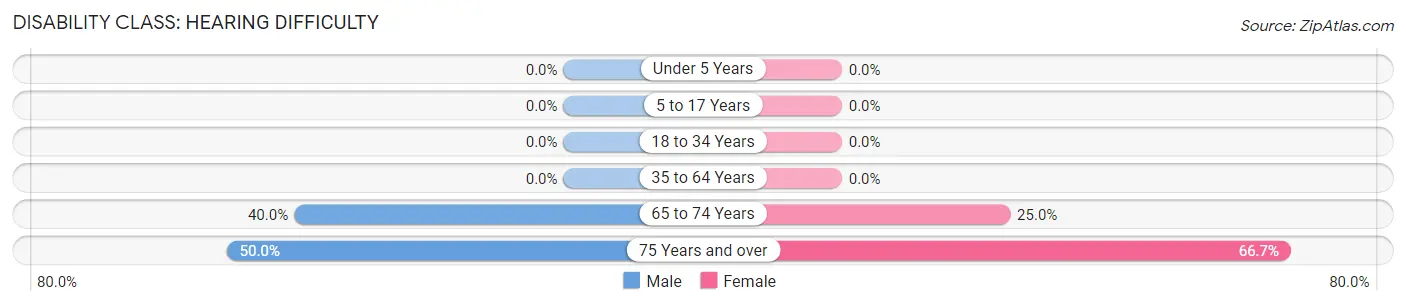
| Age Bracket | Male | Female |
| Under 5 Years | 0 (0.0%) | 0 (0.0%) |
| 5 to 17 Years | 0 (0.0%) | 0 (0.0%) |
| 18 to 34 Years | 0 (0.0%) | 0 (0.0%) |
| 35 to 64 Years | 0 (0.0%) | 0 (0.0%) |
| 65 to 74 Years | 2 (40.0%) | 1 (25.0%) |
| 75 Years and over | 2 (50.0%) | 2 (66.7%) |
Disability Class: Vision Difficulty
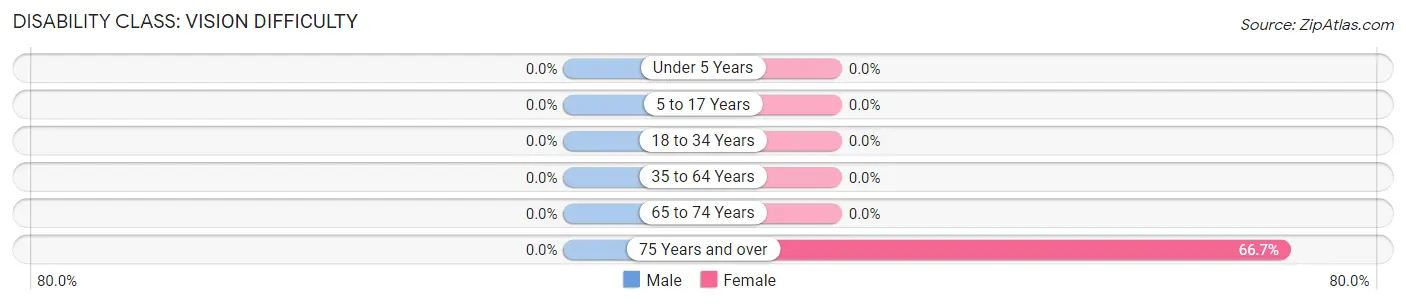
| Age Bracket | Male | Female |
| Under 5 Years | 0 (0.0%) | 0 (0.0%) |
| 5 to 17 Years | 0 (0.0%) | 0 (0.0%) |
| 18 to 34 Years | 0 (0.0%) | 0 (0.0%) |
| 35 to 64 Years | 0 (0.0%) | 0 (0.0%) |
| 65 to 74 Years | 0 (0.0%) | 0 (0.0%) |
| 75 Years and over | 0 (0.0%) | 2 (66.7%) |
Disability Class: Cognitive Difficulty
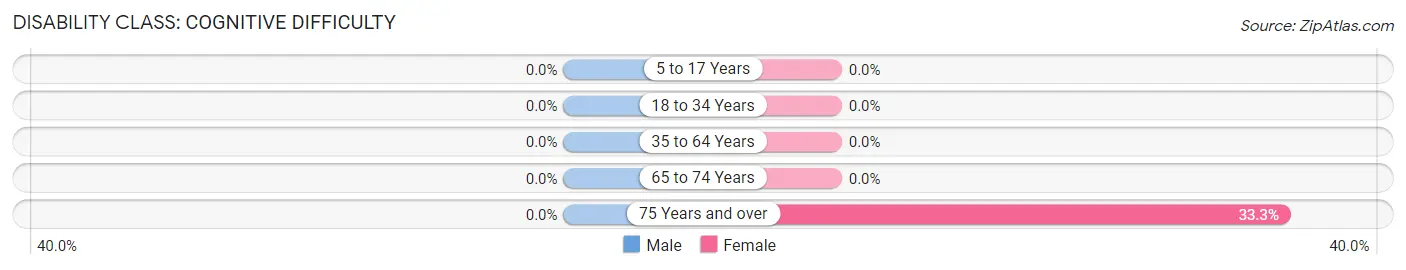
| Age Bracket | Male | Female |
| 5 to 17 Years | 0 (0.0%) | 0 (0.0%) |
| 18 to 34 Years | 0 (0.0%) | 0 (0.0%) |
| 35 to 64 Years | 0 (0.0%) | 0 (0.0%) |
| 65 to 74 Years | 0 (0.0%) | 0 (0.0%) |
| 75 Years and over | 0 (0.0%) | 1 (33.3%) |
Disability Class: Ambulatory Difficulty
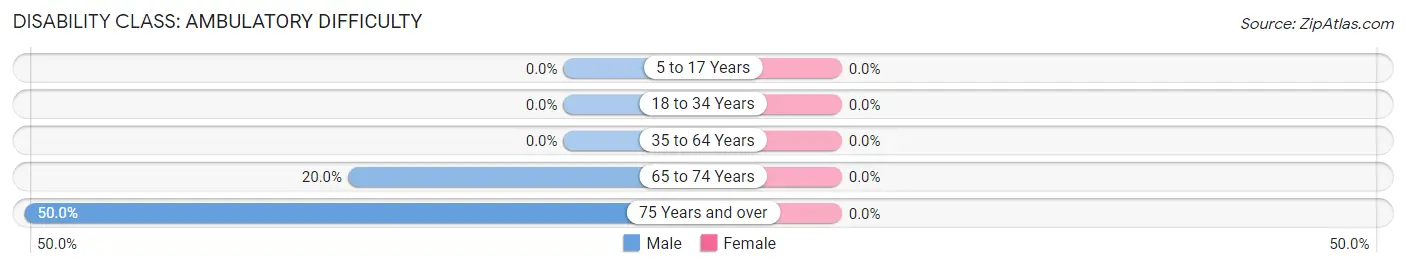
| Age Bracket | Male | Female |
| 5 to 17 Years | 0 (0.0%) | 0 (0.0%) |
| 18 to 34 Years | 0 (0.0%) | 0 (0.0%) |
| 35 to 64 Years | 0 (0.0%) | 0 (0.0%) |
| 65 to 74 Years | 1 (20.0%) | 0 (0.0%) |
| 75 Years and over | 2 (50.0%) | 0 (0.0%) |
Disability Class: Self-Care Difficulty
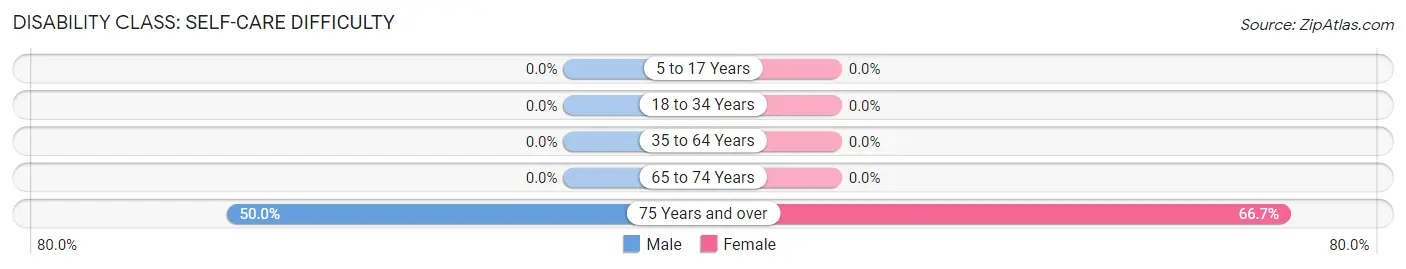
| Age Bracket | Male | Female |
| 5 to 17 Years | 0 (0.0%) | 0 (0.0%) |
| 18 to 34 Years | 0 (0.0%) | 0 (0.0%) |
| 35 to 64 Years | 0 (0.0%) | 0 (0.0%) |
| 65 to 74 Years | 0 (0.0%) | 0 (0.0%) |
| 75 Years and over | 2 (50.0%) | 2 (66.7%) |
Technology Access in Callimont borough
Computing Device Access in Callimont borough
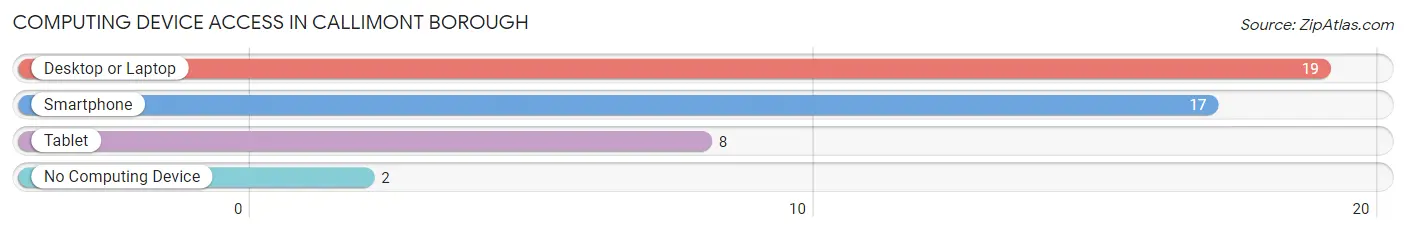
| Device Type | # Households | % Households |
| Desktop or Laptop | 19 | 90.5% |
| Smartphone | 17 | 80.9% |
| Tablet | 8 | 38.1% |
| No Computing Device | 2 | 9.5% |
| Total | 21 | 100.0% |
Internet Access in Callimont borough
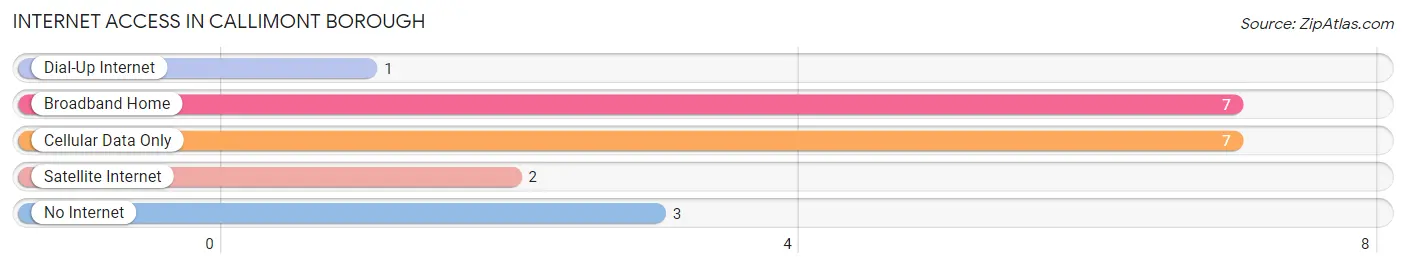
| Internet Type | # Households | % Households |
| Dial-Up Internet | 1 | 4.8% |
| Broadband Home | 7 | 33.3% |
| Cellular Data Only | 7 | 33.3% |
| Satellite Internet | 2 | 9.5% |
| No Internet | 3 | 14.3% |
| Total | 21 | 100.0% |
Callimont borough Summary
Callimont Borough is a small borough located in Fayette County, Pennsylvania. It is situated in the southwestern corner of the county, and is bordered by the townships of Franklin, German, and Nicholson. The borough was incorporated in 1891 and has a population of approximately 1,000 people.
Geography
Callimont Borough is located in the southwestern corner of Fayette County, Pennsylvania. It is bordered by the townships of Franklin, German, and Nicholson. The borough is situated in the foothills of the Allegheny Mountains, and is surrounded by rolling hills and valleys. The borough is located approximately 25 miles south of Pittsburgh, and is accessible via Interstate 70 and U.S. Route 40.
The borough is home to several small streams, including the Little Redstone Creek, which flows through the borough and is a tributary of the Redstone Creek. The borough is also home to several small lakes, including Lake Callimont, which is a popular destination for fishing and boating.
Demographics
As of the 2010 census, the population of Callimont Borough was 1,000 people. The racial makeup of the borough was 97.2% White, 0.7% African American, 0.2% Native American, 0.2% Asian, 0.2% from other races, and 1.7% from two or more races. Hispanic or Latino of any race were 0.7% of the population.
The median household income in Callimont Borough was $37,500, and the median family income was $45,000. The per capita income for the borough was $18,000. About 8.3% of families and 10.2% of the population were below the poverty line, including 14.3% of those under age 18 and 6.7% of those age 65 or over.
Economy
The economy of Callimont Borough is largely based on agriculture and tourism. The borough is home to several small farms, which produce a variety of crops, including corn, soybeans, wheat, and hay. The borough is also home to several small businesses, including restaurants, retail stores, and service providers.
The borough is also a popular destination for tourists, who come to enjoy the area's natural beauty and outdoor activities. The borough is home to several parks, including Lake Callimont Park, which offers fishing, boating, and other recreational activities. The borough is also home to several historic sites, including the Callimont Covered Bridge, which was built in 1891 and is listed on the National Register of Historic Places.
Conclusion
Callimont Borough is a small borough located in Fayette County, Pennsylvania. It is situated in the southwestern corner of the county, and is bordered by the townships of Franklin, German, and Nicholson. The borough was incorporated in 1891 and has a population of approximately 1,000 people. The economy of Callimont Borough is largely based on agriculture and tourism, and the borough is home to several small farms, businesses, and parks. The borough is also a popular destination for tourists, who come to enjoy the area's natural beauty and outdoor activities.
Common Questions
What is Per Capita Income in Callimont borough?
Per Capita income in Callimont borough is $33,235.
What is the Median Family Income in Callimont borough?
Median Family Income in Callimont borough is $96,250.
What is the Median Household income in Callimont borough?
Median Household Income in Callimont borough is $86,875.
What is Income or Wage Gap in Callimont borough?
Income or Wage Gap in Callimont borough is 49.3%.
Women in Callimont borough earn 50.7 cents for every dollar earned by a man.
What is Inequality or Gini Index in Callimont borough?
Inequality or Gini Index in Callimont borough is 0.24.
What is the Total Population of Callimont borough?
Total Population of Callimont borough is 52.
What is the Total Male Population of Callimont borough?
Total Male Population of Callimont borough is 24.
What is the Total Female Population of Callimont borough?
Total Female Population of Callimont borough is 28.
What is the Ratio of Males per 100 Females in Callimont borough?
There are 85.71 Males per 100 Females in Callimont borough.
What is the Ratio of Females per 100 Males in Callimont borough?
There are 116.67 Females per 100 Males in Callimont borough.
What is the Median Population Age in Callimont borough?
Median Population Age in Callimont borough is 34.8 Years.
What is the Average Family Size in Callimont borough
Average Family Size in Callimont borough is 2.5 People.
What is the Average Household Size in Callimont borough
Average Household Size in Callimont borough is 2.5 People.
How Large is the Labor Force in Callimont borough?
There are 22 People in the Labor Forcein in Callimont borough.
What is the Percentage of People in the Labor Force in Callimont borough?
53.7% of People are in the Labor Force in Callimont borough.