Chalfont borough, PA Map & Demographics
Chalfont borough Overview
$54,337
PER CAPITA INCOME
$154,783
AVG FAMILY INCOME
$118,871
AVG HOUSEHOLD INCOME
31.7%
WAGE / INCOME GAP [ % ]
68.3¢/ $1
WAGE / INCOME GAP [ $ ]
0.44
INEQUALITY / GINI INDEX
4,259
TOTAL POPULATION
2,141
MALE POPULATION
2,118
FEMALE POPULATION
101.09
MALES / 100 FEMALES
98.93
FEMALES / 100 MALES
41.7
MEDIAN AGE
2.9
AVG FAMILY SIZE
2.5
AVG HOUSEHOLD SIZE
2,644
LABOR FORCE [ PEOPLE ]
74.8%
PERCENT IN LABOR FORCE
7.5%
UNEMPLOYMENT RATE
Income in Chalfont borough
Income Overview in Chalfont borough
Per Capita Income in Chalfont borough is $54,337, while median incomes of families and households are $154,783 and $118,871 respectively.
| Characteristic | Number | Measure |
| Per Capita Income | 4,259 | $54,337 |
| Median Family Income | 1,228 | $154,783 |
| Mean Family Income | 1,228 | $159,794 |
| Median Household Income | 1,688 | $118,871 |
| Mean Household Income | 1,688 | $135,867 |
| Income Deficit | 1,228 | $0 |
| Wage / Income Gap (%) | 4,259 | 31.73% |
| Wage / Income Gap ($) | 4,259 | 68.27¢ per $1 |
| Gini / Inequality Index | 4,259 | 0.44 |
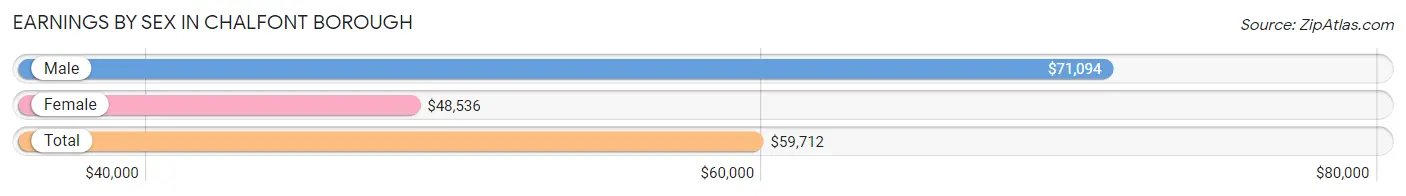
Earnings by Sex in Chalfont borough
Average Earnings in Chalfont borough are $59,712, $71,094 for men and $48,536 for women, a difference of 31.7%.
| Sex | Number | Average Earnings |
| Male | 1,368 (52.8%) | $71,094 |
| Female | 1,221 (47.2%) | $48,536 |
| Total | 2,589 (100.0%) | $59,712 |
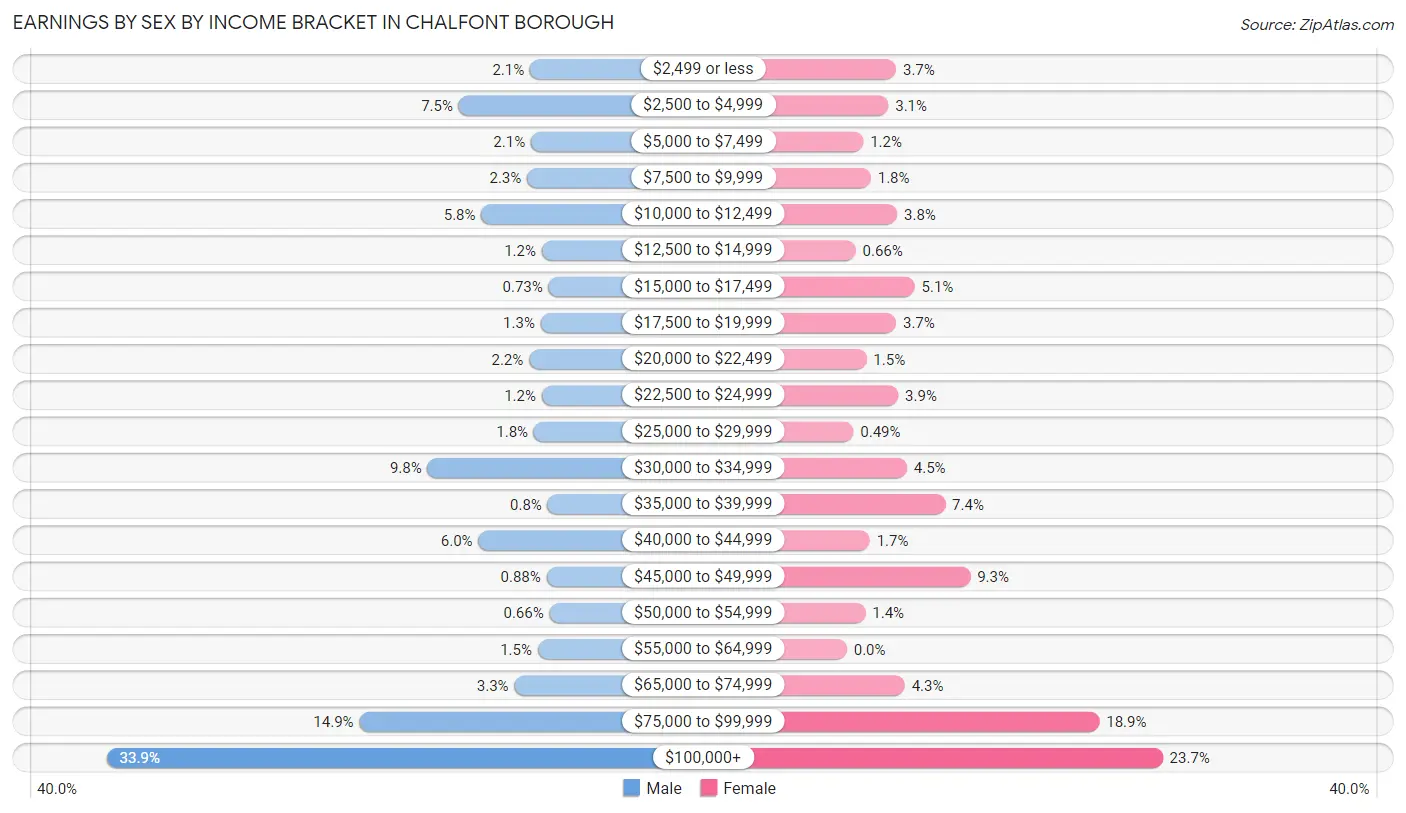
Earnings by Sex by Income Bracket in Chalfont borough
The most common earnings brackets in Chalfont borough are $100,000+ for men (463 | 33.9%) and $100,000+ for women (289 | 23.7%).
| Income | Male | Female |
| $2,499 or less | 29 (2.1%) | 45 (3.7%) |
| $2,500 to $4,999 | 102 (7.5%) | 38 (3.1%) |
| $5,000 to $7,499 | 28 (2.1%) | 15 (1.2%) |
| $7,500 to $9,999 | 32 (2.3%) | 22 (1.8%) |
| $10,000 to $12,499 | 79 (5.8%) | 46 (3.8%) |
| $12,500 to $14,999 | 17 (1.2%) | 8 (0.7%) |
| $15,000 to $17,499 | 10 (0.7%) | 62 (5.1%) |
| $17,500 to $19,999 | 18 (1.3%) | 45 (3.7%) |
| $20,000 to $22,499 | 30 (2.2%) | 18 (1.5%) |
| $22,500 to $24,999 | 17 (1.2%) | 47 (3.8%) |
| $25,000 to $29,999 | 25 (1.8%) | 6 (0.5%) |
| $30,000 to $34,999 | 134 (9.8%) | 55 (4.5%) |
| $35,000 to $39,999 | 11 (0.8%) | 90 (7.4%) |
| $40,000 to $44,999 | 82 (6.0%) | 21 (1.7%) |
| $45,000 to $49,999 | 12 (0.9%) | 113 (9.2%) |
| $50,000 to $54,999 | 9 (0.7%) | 17 (1.4%) |
| $55,000 to $64,999 | 21 (1.5%) | 0 (0.0%) |
| $65,000 to $74,999 | 45 (3.3%) | 53 (4.3%) |
| $75,000 to $99,999 | 204 (14.9%) | 231 (18.9%) |
| $100,000+ | 463 (33.9%) | 289 (23.7%) |
| Total | 1,368 (100.0%) | 1,221 (100.0%) |
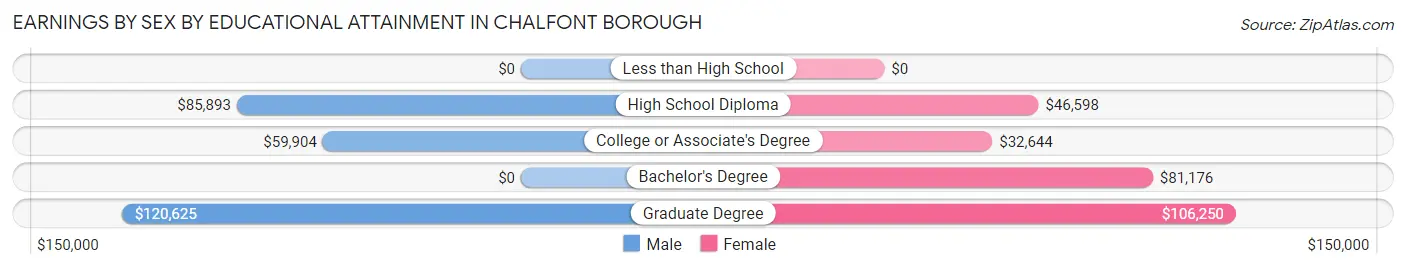
Earnings by Sex by Educational Attainment in Chalfont borough
Average earnings in Chalfont borough are $87,034 for men and $71,875 for women, a difference of 17.4%. Men with an educational attainment of graduate degree enjoy the highest average annual earnings of $120,625, while those with college or associate's degree education earn the least with $59,904. Women with an educational attainment of graduate degree earn the most with the average annual earnings of $106,250, while those with college or associate's degree education have the smallest earnings of $32,644.
| Educational Attainment | Male Income | Female Income |
| Less than High School | - | - |
| High School Diploma | $85,893 | $46,598 |
| College or Associate's Degree | $59,904 | $32,644 |
| Bachelor's Degree | - | - |
| Graduate Degree | $120,625 | $106,250 |
| Total | $87,034 | $71,875 |
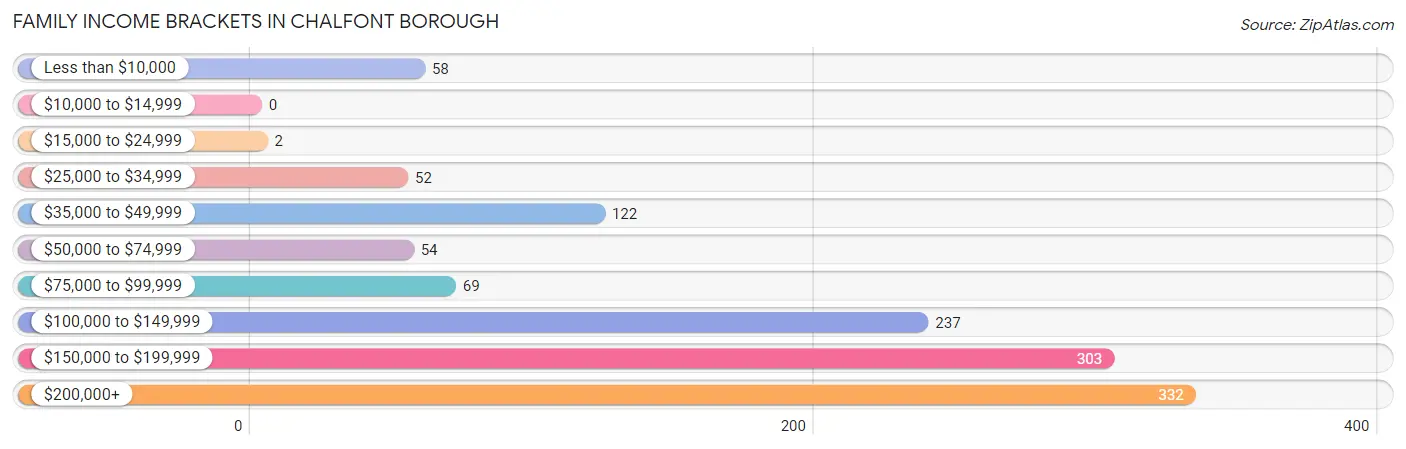
Family Income in Chalfont borough
Family Income Brackets in Chalfont borough
According to the Chalfont borough family income data, there are 332 families falling into the $200,000+ income range, which is the most common income bracket and makes up 27.0% of all families.
| Income Bracket | # Families | % Families |
| Less than $10,000 | 58 | 4.7% |
| $10,000 to $14,999 | 0 | 0.0% |
| $15,000 to $24,999 | 2 | 0.2% |
| $25,000 to $34,999 | 52 | 4.2% |
| $35,000 to $49,999 | 122 | 9.9% |
| $50,000 to $74,999 | 54 | 4.4% |
| $75,000 to $99,999 | 69 | 5.6% |
| $100,000 to $149,999 | 237 | 19.3% |
| $150,000 to $199,999 | 303 | 24.7% |
| $200,000+ | 332 | 27.0% |
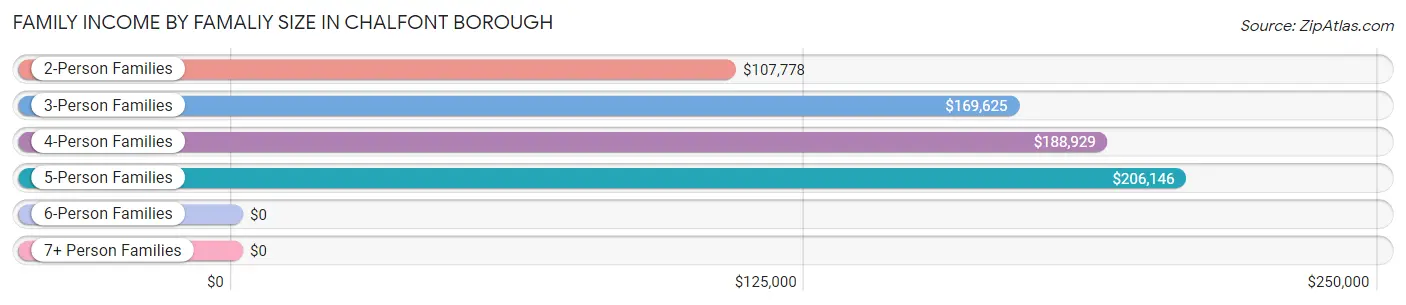
Family Income by Famaliy Size in Chalfont borough
5-person families (61 | 5.0%) account for the highest median family income in Chalfont borough with $206,146 per family, while 3-person families (353 | 28.7%) have the highest median income of $56,542 per family member.
| Income Bracket | # Families | Median Income |
| 2-Person Families | 560 (45.6%) | $107,778 |
| 3-Person Families | 353 (28.7%) | $169,625 |
| 4-Person Families | 222 (18.1%) | $188,929 |
| 5-Person Families | 61 (5.0%) | $206,146 |
| 6-Person Families | 32 (2.6%) | $0 |
| 7+ Person Families | 0 (0.0%) | $0 |
| Total | 1,228 (100.0%) | $154,783 |
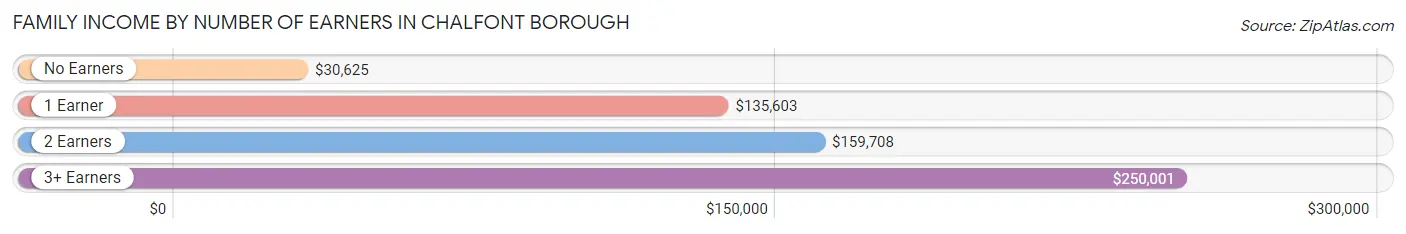
Family Income by Number of Earners in Chalfont borough
The median family income in Chalfont borough is $154,783, with families comprising 3+ earners (188) having the highest median family income of $250,001, while families with no earners (167) have the lowest median family income of $30,625, accounting for 15.3% and 13.6% of families, respectively.
| Number of Earners | # Families | Median Income |
| No Earners | 167 (13.6%) | $30,625 |
| 1 Earner | 220 (17.9%) | $135,603 |
| 2 Earners | 653 (53.2%) | $159,708 |
| 3+ Earners | 188 (15.3%) | $250,001 |
| Total | 1,228 (100.0%) | $154,783 |
Household Income in Chalfont borough
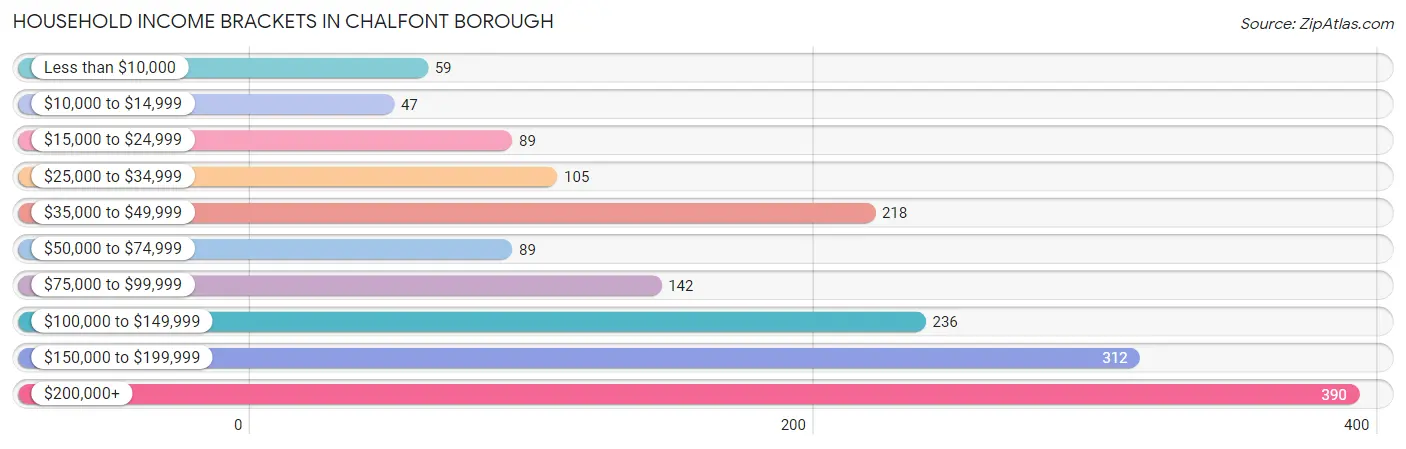
Household Income Brackets in Chalfont borough
With 390 households falling in the category, the $200,000+ income range is the most frequent in Chalfont borough, accounting for 23.1% of all households. In contrast, only 47 households (2.8%) fall into the $10,000 to $14,999 income bracket, making it the least populous group.
| Income Bracket | # Households | % Households |
| Less than $10,000 | 59 | 3.5% |
| $10,000 to $14,999 | 47 | 2.8% |
| $15,000 to $24,999 | 89 | 5.3% |
| $25,000 to $34,999 | 105 | 6.2% |
| $35,000 to $49,999 | 218 | 12.9% |
| $50,000 to $74,999 | 89 | 5.3% |
| $75,000 to $99,999 | 142 | 8.4% |
| $100,000 to $149,999 | 236 | 14.0% |
| $150,000 to $199,999 | 312 | 18.5% |
| $200,000+ | 390 | 23.1% |
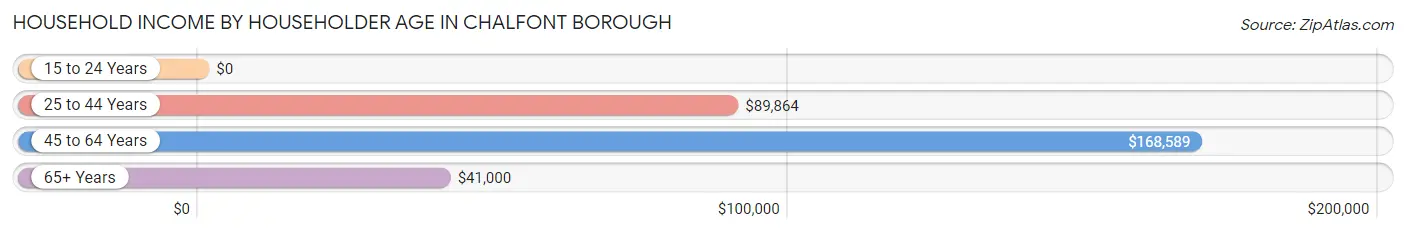
Household Income by Householder Age in Chalfont borough
The median household income in Chalfont borough is $118,871, with the highest median household income of $168,589 found in the 45 to 64 years age bracket for the primary householder. A total of 751 households (44.5%) fall into this category.
| Income Bracket | # Households | Median Income |
| 15 to 24 Years | 0 (0.0%) | $0 |
| 25 to 44 Years | 523 (31.0%) | $89,864 |
| 45 to 64 Years | 751 (44.5%) | $168,589 |
| 65+ Years | 414 (24.5%) | $41,000 |
| Total | 1,688 (100.0%) | $118,871 |
Poverty in Chalfont borough
Income Below Poverty by Sex and Age in Chalfont borough
With 5.0% poverty level for males and 9.5% for females among the residents of Chalfont borough, 75 year old and over males and 16 and 17 year old females are the most vulnerable to poverty, with 33 males (27.1%) and 129 females (71.7%) in their respective age groups living below the poverty level.
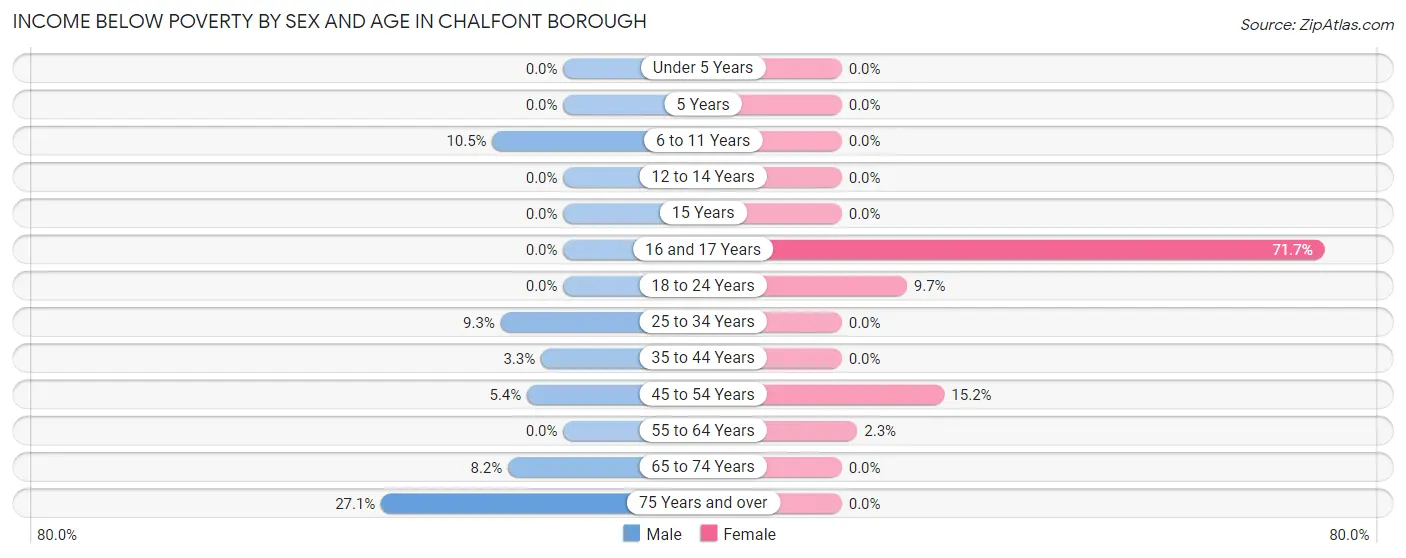
| Age Bracket | Male | Female |
| Under 5 Years | 0 (0.0%) | 0 (0.0%) |
| 5 Years | 0 (0.0%) | 0 (0.0%) |
| 6 to 11 Years | 18 (10.5%) | 0 (0.0%) |
| 12 to 14 Years | 0 (0.0%) | 0 (0.0%) |
| 15 Years | 0 (0.0%) | 0 (0.0%) |
| 16 and 17 Years | 0 (0.0%) | 129 (71.7%) |
| 18 to 24 Years | 0 (0.0%) | 14 (9.7%) |
| 25 to 34 Years | 19 (9.3%) | 0 (0.0%) |
| 35 to 44 Years | 12 (3.3%) | 0 (0.0%) |
| 45 to 54 Years | 15 (5.4%) | 50 (15.2%) |
| 55 to 64 Years | 0 (0.0%) | 8 (2.3%) |
| 65 to 74 Years | 10 (8.2%) | 0 (0.0%) |
| 75 Years and over | 33 (27.1%) | 0 (0.0%) |
| Total | 107 (5.0%) | 201 (9.5%) |
Income Above Poverty by Sex and Age in Chalfont borough
According to the poverty statistics in Chalfont borough, males aged under 5 years and females aged under 5 years are the age groups that are most secure financially, with 100.0% of males and 100.0% of females in these age groups living above the poverty line.
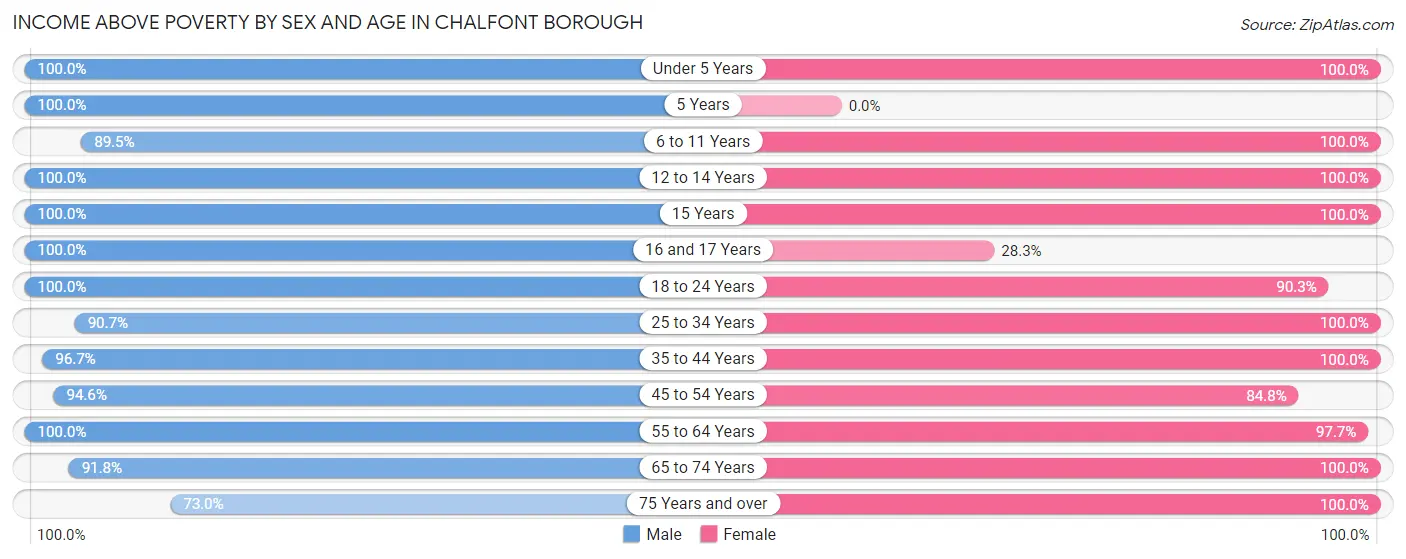
| Age Bracket | Male | Female |
| Under 5 Years | 95 (100.0%) | 76 (100.0%) |
| 5 Years | 14 (100.0%) | 0 (0.0%) |
| 6 to 11 Years | 153 (89.5%) | 155 (100.0%) |
| 12 to 14 Years | 86 (100.0%) | 50 (100.0%) |
| 15 Years | 59 (100.0%) | 13 (100.0%) |
| 16 and 17 Years | 153 (100.0%) | 51 (28.3%) |
| 18 to 24 Years | 152 (100.0%) | 131 (90.3%) |
| 25 to 34 Years | 185 (90.7%) | 254 (100.0%) |
| 35 to 44 Years | 350 (96.7%) | 264 (100.0%) |
| 45 to 54 Years | 264 (94.6%) | 278 (84.8%) |
| 55 to 64 Years | 321 (100.0%) | 339 (97.7%) |
| 65 to 74 Years | 112 (91.8%) | 139 (100.0%) |
| 75 Years and over | 89 (73.0%) | 162 (100.0%) |
| Total | 2,033 (95.0%) | 1,912 (90.5%) |
Income Below Poverty Among Married-Couple Families in Chalfont borough
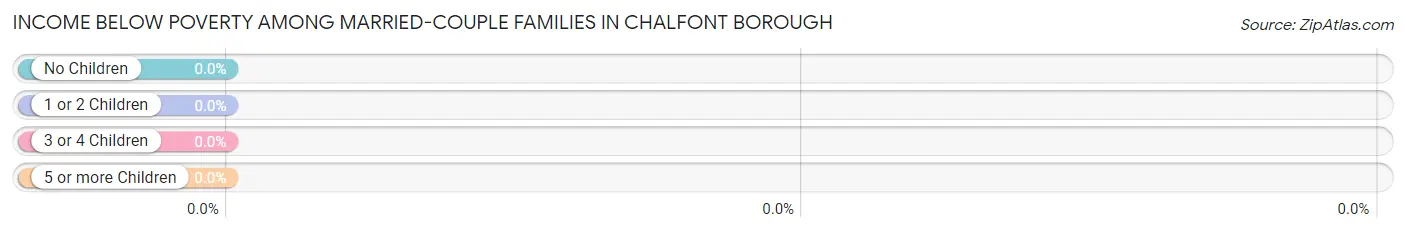
| Children | Above Poverty | Below Poverty |
| No Children | 446 (100.0%) | 0 (0.0%) |
| 1 or 2 Children | 342 (100.0%) | 0 (0.0%) |
| 3 or 4 Children | 57 (100.0%) | 0 (0.0%) |
| 5 or more Children | 0 (0.0%) | 0 (0.0%) |
| Total | 845 (100.0%) | 0 (0.0%) |
Income Below Poverty Among Single-Parent Households in Chalfont borough
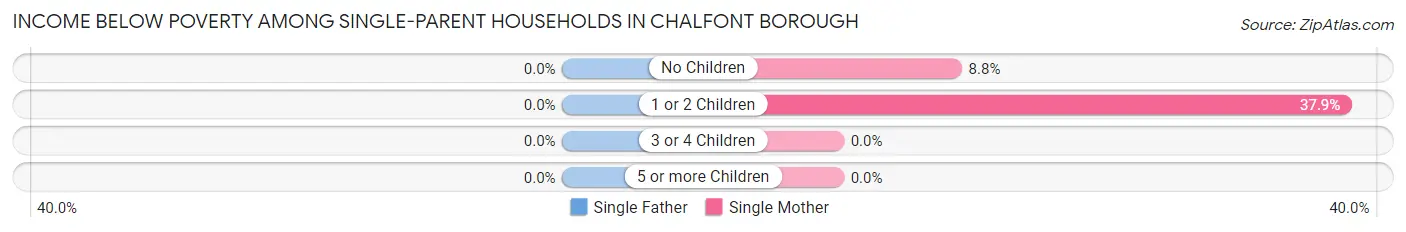
| Children | Single Father | Single Mother |
| No Children | 0 (0.0%) | 8 (8.8%) |
| 1 or 2 Children | 0 (0.0%) | 50 (37.9%) |
| 3 or 4 Children | 0 (0.0%) | 0 (0.0%) |
| 5 or more Children | 0 (0.0%) | 0 (0.0%) |
| Total | 0 (0.0%) | 58 (23.8%) |
Income Below Poverty Among Married-Couple vs Single-Parent Households in Chalfont borough
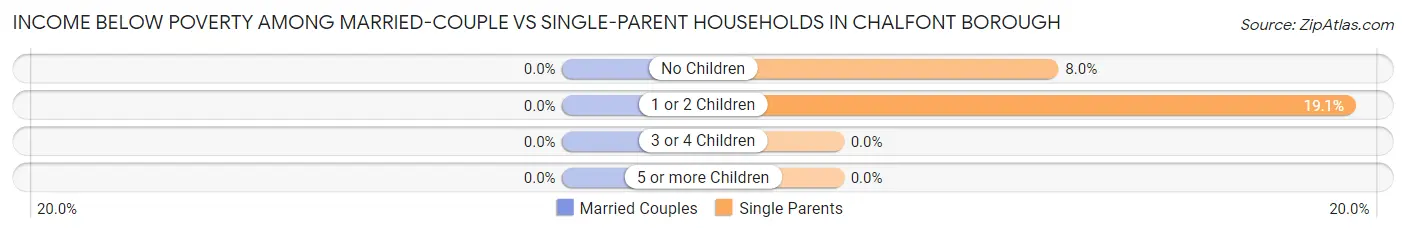
| Children | Married-Couple Families | Single-Parent Households |
| No Children | 0 (0.0%) | 8 (8.0%) |
| 1 or 2 Children | 0 (0.0%) | 50 (19.1%) |
| 3 or 4 Children | 0 (0.0%) | 0 (0.0%) |
| 5 or more Children | 0 (0.0%) | 0 (0.0%) |
| Total | 0 (0.0%) | 58 (15.1%) |
Race in Chalfont borough
The most populous races in Chalfont borough are White / Caucasian (3,893 | 91.4%), Asian (173 | 4.1%), and Hispanic or Latino (167 | 3.9%).
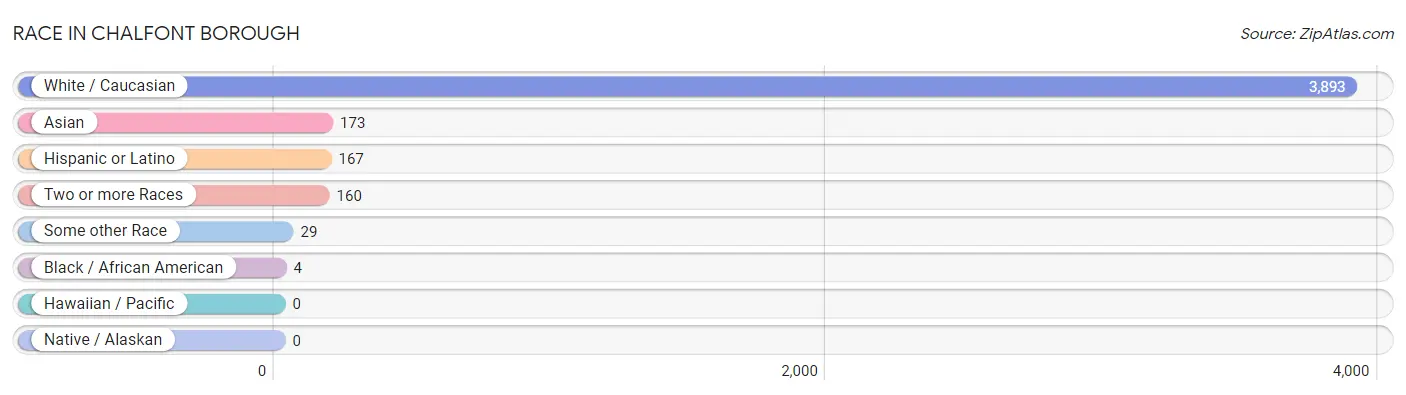
| Race | # Population | % Population |
| Asian | 173 | 4.1% |
| Black / African American | 4 | 0.1% |
| Hawaiian / Pacific | 0 | 0.0% |
| Hispanic or Latino | 167 | 3.9% |
| Native / Alaskan | 0 | 0.0% |
| White / Caucasian | 3,893 | 91.4% |
| Two or more Races | 160 | 3.8% |
| Some other Race | 29 | 0.7% |
| Total | 4,259 | 100.0% |
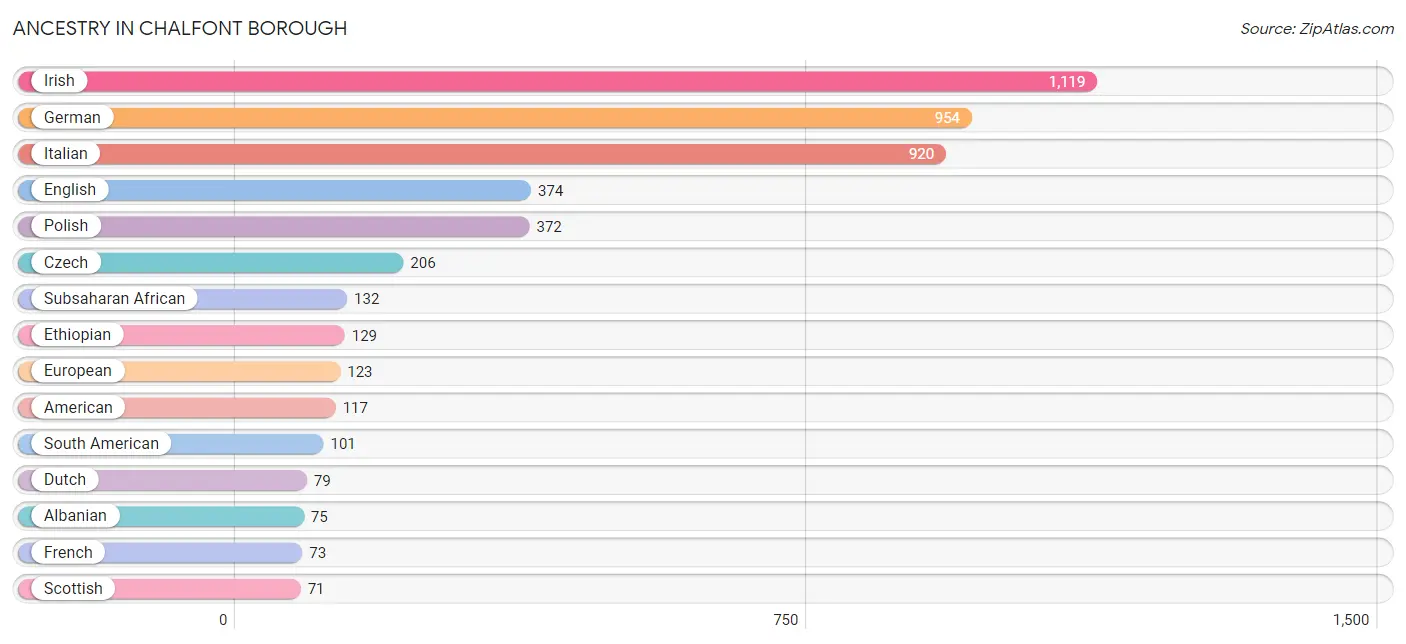
Ancestry in Chalfont borough
The most populous ancestries reported in Chalfont borough are Irish (1,119 | 26.3%), German (954 | 22.4%), Italian (920 | 21.6%), English (374 | 8.8%), and Polish (372 | 8.7%), together accounting for 87.8% of all Chalfont borough residents.
| Ancestry | # Population | % Population |
| African | 3 | 0.1% |
| Albanian | 75 | 1.8% |
| American | 117 | 2.8% |
| Argentinean | 28 | 0.7% |
| British | 19 | 0.4% |
| Burmese | 31 | 0.7% |
| Colombian | 24 | 0.6% |
| Croatian | 24 | 0.6% |
| Czech | 206 | 4.8% |
| Dutch | 79 | 1.8% |
| Eastern European | 17 | 0.4% |
| Ecuadorian | 7 | 0.2% |
| English | 374 | 8.8% |
| Ethiopian | 129 | 3.0% |
| European | 123 | 2.9% |
| French | 73 | 1.7% |
| German | 954 | 22.4% |
| Hungarian | 37 | 0.9% |
| Indian (Asian) | 6 | 0.1% |
| Irish | 1,119 | 26.3% |
| Italian | 920 | 21.6% |
| Korean | 3 | 0.1% |
| Lithuanian | 15 | 0.4% |
| Pennsylvania German | 23 | 0.5% |
| Polish | 372 | 8.7% |
| Portuguese | 21 | 0.5% |
| Puerto Rican | 57 | 1.3% |
| Romanian | 9 | 0.2% |
| Russian | 33 | 0.8% |
| Scotch-Irish | 23 | 0.5% |
| Scottish | 71 | 1.7% |
| South American | 101 | 2.4% |
| Subsaharan African | 132 | 3.1% |
| Swedish | 9 | 0.2% |
| Thai | 10 | 0.2% |
| Ukrainian | 41 | 1.0% |
| Venezuelan | 42 | 1.0% |
| Welsh | 26 | 0.6% |
| Yugoslavian | 9 | 0.2% | View All 39 Rows |
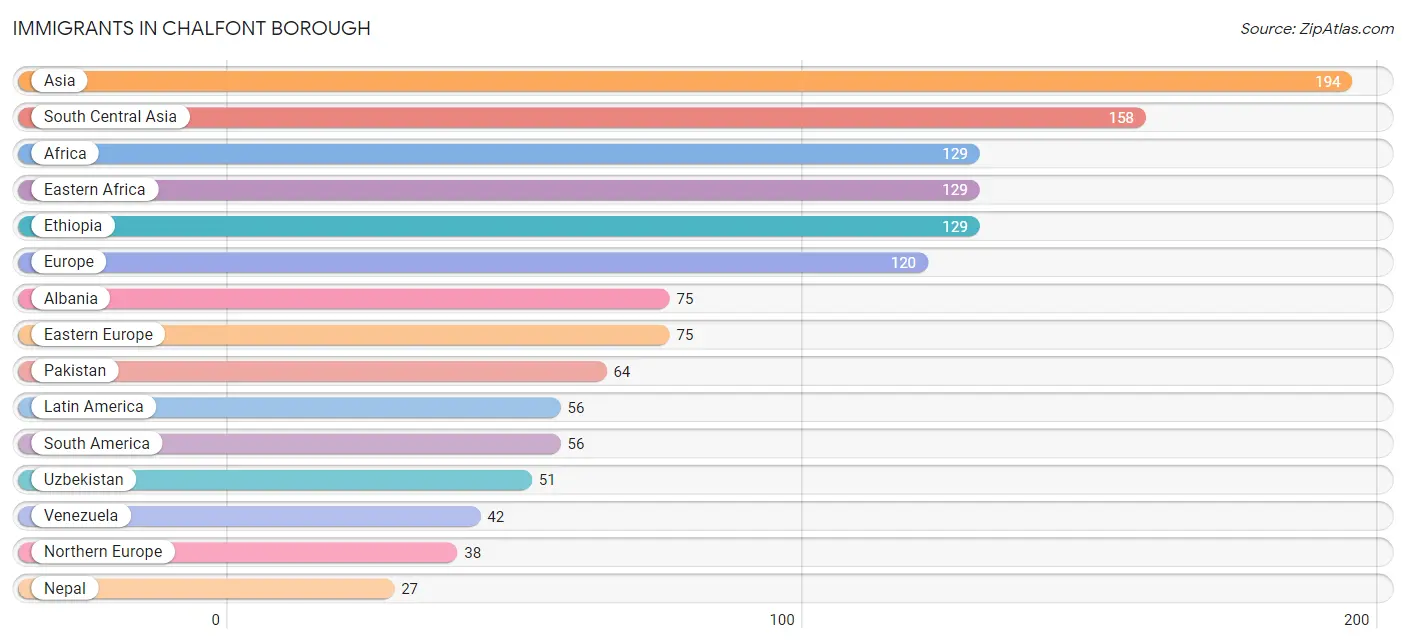
Immigrants in Chalfont borough
The most numerous immigrant groups reported in Chalfont borough came from Asia (194 | 4.6%), South Central Asia (158 | 3.7%), Africa (129 | 3.0%), Eastern Africa (129 | 3.0%), and Ethiopia (129 | 3.0%), together accounting for 17.4% of all Chalfont borough residents.
| Immigration Origin | # Population | % Population |
| Africa | 129 | 3.0% |
| Albania | 75 | 1.8% |
| Asia | 194 | 4.6% |
| Australia | 2 | 0.1% |
| Colombia | 14 | 0.3% |
| Eastern Africa | 129 | 3.0% |
| Eastern Asia | 14 | 0.3% |
| Eastern Europe | 75 | 1.8% |
| England | 24 | 0.6% |
| Ethiopia | 129 | 3.0% |
| Europe | 120 | 2.8% |
| Germany | 7 | 0.2% |
| India | 16 | 0.4% |
| Korea | 14 | 0.3% |
| Laos | 5 | 0.1% |
| Latin America | 56 | 1.3% |
| Nepal | 27 | 0.6% |
| Northern Europe | 38 | 0.9% |
| Oceania | 2 | 0.1% |
| Pakistan | 64 | 1.5% |
| Philippines | 3 | 0.1% |
| Saudi Arabia | 14 | 0.3% |
| South America | 56 | 1.3% |
| South Central Asia | 158 | 3.7% |
| South Eastern Asia | 8 | 0.2% |
| Uzbekistan | 51 | 1.2% |
| Venezuela | 42 | 1.0% |
| Western Asia | 14 | 0.3% |
| Western Europe | 7 | 0.2% | View All 29 Rows |
Sex and Age in Chalfont borough
Sex and Age in Chalfont borough
The most populous age groups in Chalfont borough are 40 to 44 Years (280 | 13.1%) for men and 55 to 59 Years (238 | 11.2%) for women.
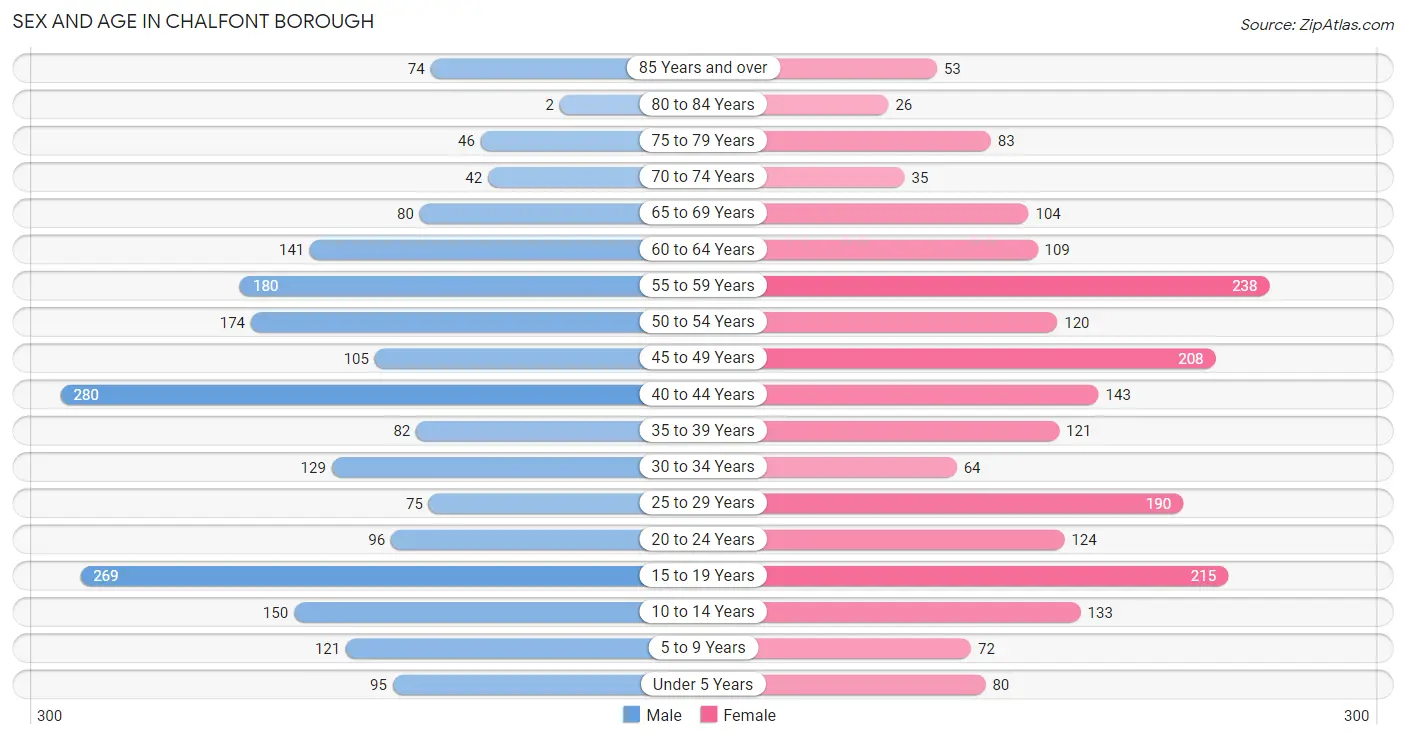
| Age Bracket | Male | Female |
| Under 5 Years | 95 (4.4%) | 80 (3.8%) |
| 5 to 9 Years | 121 (5.7%) | 72 (3.4%) |
| 10 to 14 Years | 150 (7.0%) | 133 (6.3%) |
| 15 to 19 Years | 269 (12.6%) | 215 (10.2%) |
| 20 to 24 Years | 96 (4.5%) | 124 (5.9%) |
| 25 to 29 Years | 75 (3.5%) | 190 (9.0%) |
| 30 to 34 Years | 129 (6.0%) | 64 (3.0%) |
| 35 to 39 Years | 82 (3.8%) | 121 (5.7%) |
| 40 to 44 Years | 280 (13.1%) | 143 (6.8%) |
| 45 to 49 Years | 105 (4.9%) | 208 (9.8%) |
| 50 to 54 Years | 174 (8.1%) | 120 (5.7%) |
| 55 to 59 Years | 180 (8.4%) | 238 (11.2%) |
| 60 to 64 Years | 141 (6.6%) | 109 (5.1%) |
| 65 to 69 Years | 80 (3.7%) | 104 (4.9%) |
| 70 to 74 Years | 42 (2.0%) | 35 (1.7%) |
| 75 to 79 Years | 46 (2.1%) | 83 (3.9%) |
| 80 to 84 Years | 2 (0.1%) | 26 (1.2%) |
| 85 Years and over | 74 (3.5%) | 53 (2.5%) |
| Total | 2,141 (100.0%) | 2,118 (100.0%) |
Families and Households in Chalfont borough
Median Family Size in Chalfont borough
The median family size in Chalfont borough is 2.87 persons per family, with married-couple families (845 | 68.8%) accounting for the largest median family size of 3.14 persons per family. On the other hand, single male/father families (139 | 11.3%) represent the smallest median family size with 1.84 persons per family.
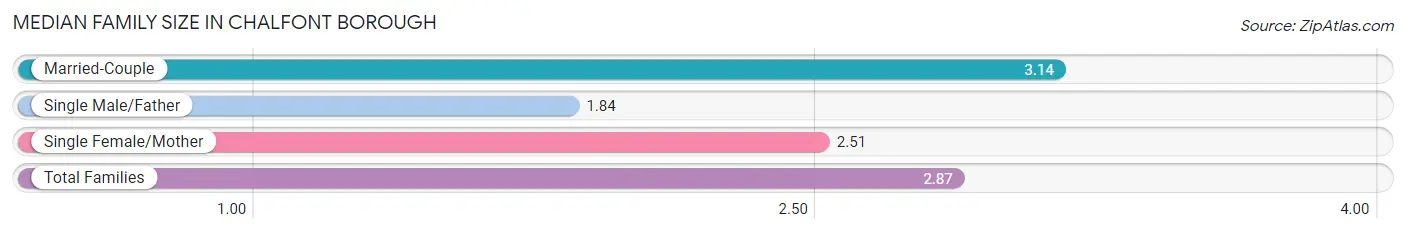
| Family Type | # Families | Family Size |
| Married-Couple | 845 (68.8%) | 3.14 |
| Single Male/Father | 139 (11.3%) | 1.84 |
| Single Female/Mother | 244 (19.9%) | 2.51 |
| Total Families | 1,228 (100.0%) | 2.87 |
Median Household Size in Chalfont borough
The median household size in Chalfont borough is 2.52 persons per household, with married-couple households (845 | 50.1%) accounting for the largest median household size of 3.14 persons per household. non-family households (460 | 27.3%) represent the smallest median household size with 1.22 persons per household.
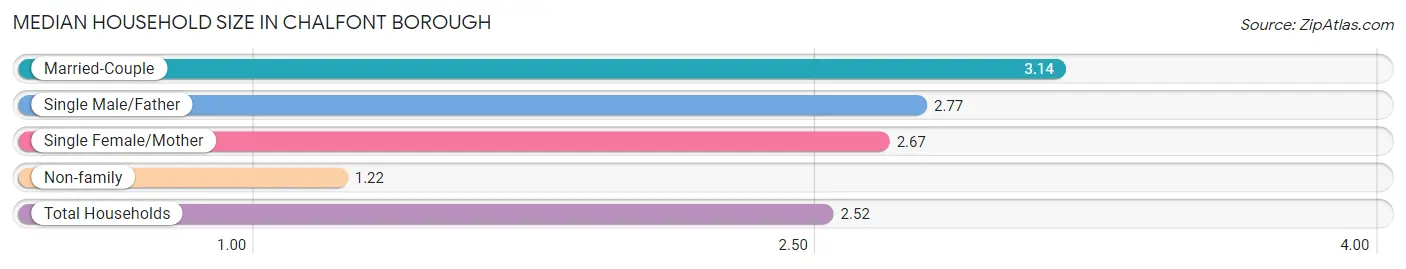
| Household Type | # Households | Household Size |
| Married-Couple | 845 (50.1%) | 3.14 |
| Single Male/Father | 139 (8.2%) | 2.77 |
| Single Female/Mother | 244 (14.4%) | 2.67 |
| Non-family | 460 (27.3%) | 1.22 |
| Total Households | 1,688 (100.0%) | 2.52 |
Household Size by Marriage Status in Chalfont borough
Out of a total of 1,688 households in Chalfont borough, 1,228 (72.8%) are family households, while 460 (27.3%) are nonfamily households. The most numerous type of family households are 2-person households, comprising 441, and the most common type of nonfamily households are 1-person households, comprising 363.
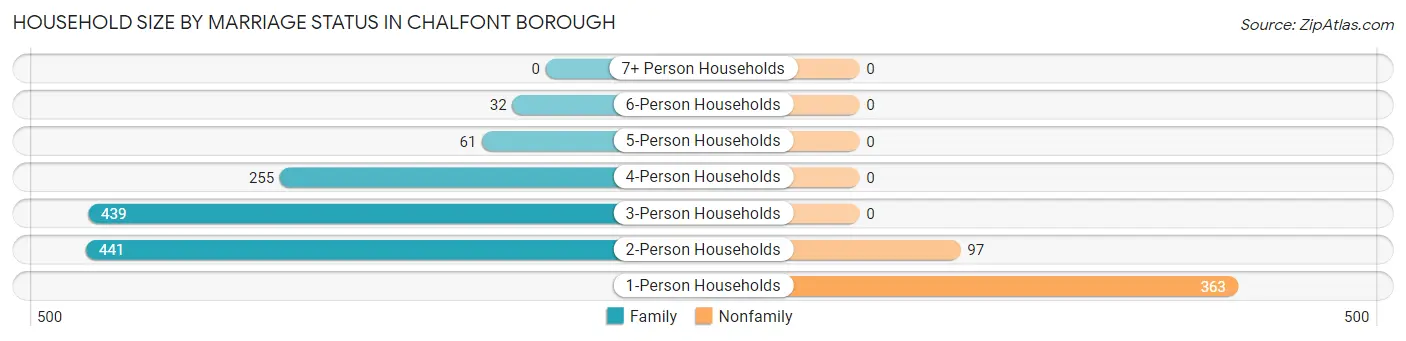
| Household Size | Family Households | Nonfamily Households |
| 1-Person Households | - | 363 (21.5%) |
| 2-Person Households | 441 (26.1%) | 97 (5.8%) |
| 3-Person Households | 439 (26.0%) | 0 (0.0%) |
| 4-Person Households | 255 (15.1%) | 0 (0.0%) |
| 5-Person Households | 61 (3.6%) | 0 (0.0%) |
| 6-Person Households | 32 (1.9%) | 0 (0.0%) |
| 7+ Person Households | 0 (0.0%) | 0 (0.0%) |
| Total | 1,228 (72.8%) | 460 (27.3%) |
Female Fertility in Chalfont borough
Fertility by Age in Chalfont borough
Average fertility rate in Chalfont borough is 52.0 births per 1,000 women. Women in the age bracket of 35 to 50 years have the highest fertility rate with 71.0 births per 1,000 women. Women in the age bracket of 35 to 50 years acount for 63.2% of all women with births.
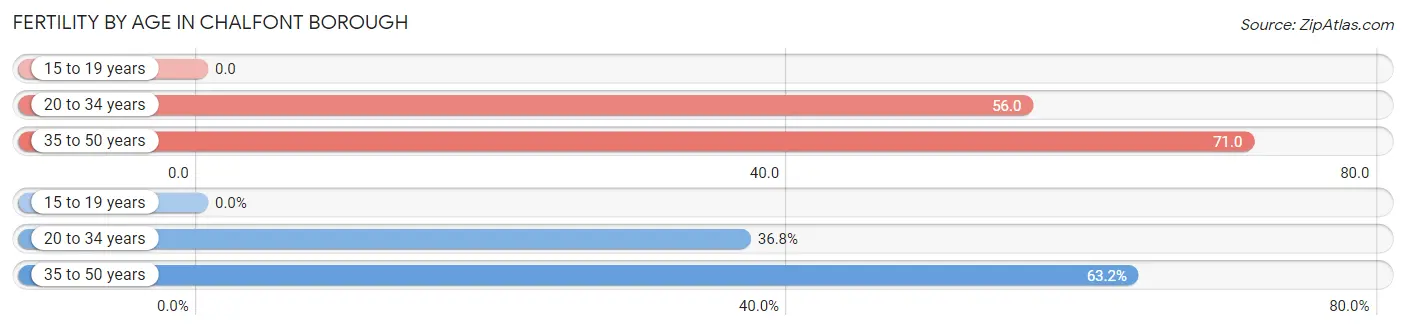
| Age Bracket | Women with Births | Births / 1,000 Women |
| 15 to 19 years | 0 (0.0%) | 0.0 |
| 20 to 34 years | 21 (36.8%) | 56.0 |
| 35 to 50 years | 36 (63.2%) | 71.0 |
| Total | 57 (100.0%) | 52.0 |
Fertility by Age by Marriage Status in Chalfont borough
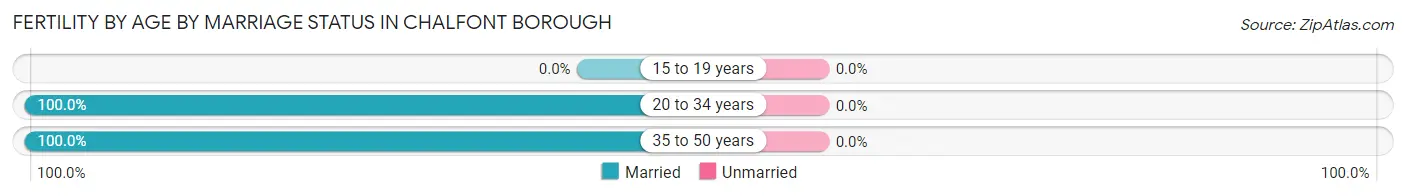
| Age Bracket | Married | Unmarried |
| 15 to 19 years | 0 (0.0%) | 0 (0.0%) |
| 20 to 34 years | 21 (100.0%) | 0 (0.0%) |
| 35 to 50 years | 36 (100.0%) | 0 (0.0%) |
| Total | 57 (100.0%) | 0 (0.0%) |
Fertility by Education in Chalfont borough
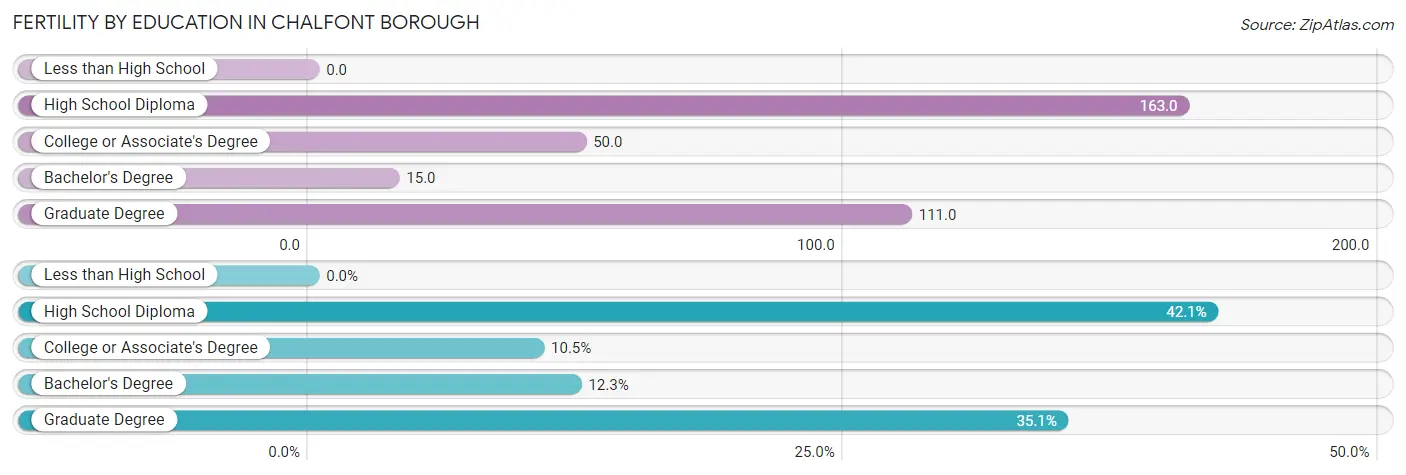
| Educational Attainment | Women with Births | Births / 1,000 Women |
| Less than High School | 0 (0.0%) | 0.0 |
| High School Diploma | 24 (42.1%) | 163.0 |
| College or Associate's Degree | 6 (10.5%) | 50.0 |
| Bachelor's Degree | 7 (12.3%) | 15.0 |
| Graduate Degree | 20 (35.1%) | 111.0 |
| Total | 57 (100.0%) | 52.0 |
Fertility by Education by Marriage Status in Chalfont borough
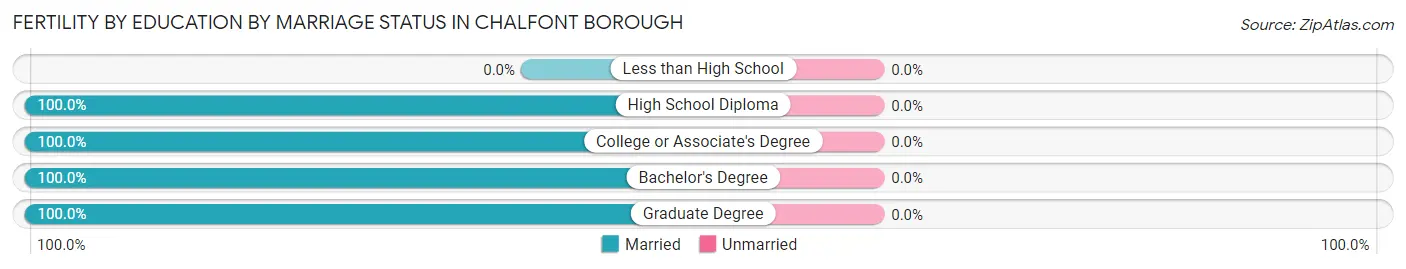
| Educational Attainment | Married | Unmarried |
| Less than High School | 0 (0.0%) | 0 (0.0%) |
| High School Diploma | 24 (100.0%) | 0 (0.0%) |
| College or Associate's Degree | 6 (100.0%) | 0 (0.0%) |
| Bachelor's Degree | 7 (100.0%) | 0 (0.0%) |
| Graduate Degree | 20 (100.0%) | 0 (0.0%) |
| Total | 57 (100.0%) | 0 (0.0%) |
Employment Characteristics in Chalfont borough
Employment by Class of Employer in Chalfont borough
Among the 2,427 employed individuals in Chalfont borough, private company employees (1,598 | 65.8%), local government employees (343 | 14.1%), and self-employed (not incorporated) (157 | 6.5%) make up the most common classes of employment.
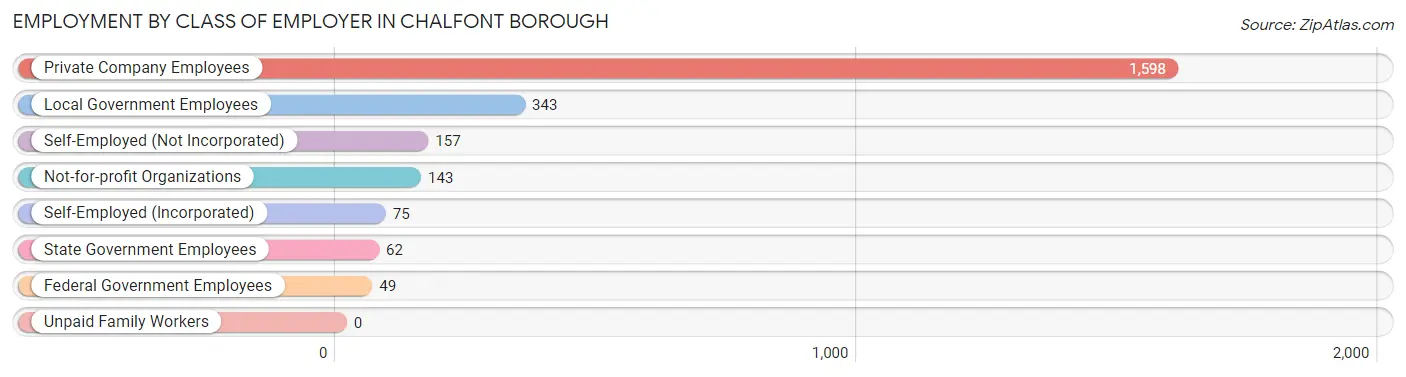
| Employer Class | # Employees | % Employees |
| Private Company Employees | 1,598 | 65.8% |
| Self-Employed (Incorporated) | 75 | 3.1% |
| Self-Employed (Not Incorporated) | 157 | 6.5% |
| Not-for-profit Organizations | 143 | 5.9% |
| Local Government Employees | 343 | 14.1% |
| State Government Employees | 62 | 2.5% |
| Federal Government Employees | 49 | 2.0% |
| Unpaid Family Workers | 0 | 0.0% |
| Total | 2,427 | 100.0% |
Employment Status by Age in Chalfont borough
According to the labor force statistics for Chalfont borough, out of the total population over 16 years of age (3,535), 74.8% or 2,644 individuals are in the labor force, with 7.5% or 198 of them unemployed. The age group with the highest labor force participation rate is 20 to 24 years, with 100.0% or 220 individuals in the labor force. Within the labor force, the 16 to 19 years age range has the highest percentage of unemployed individuals, with 53.2% or 157 of them being unemployed.
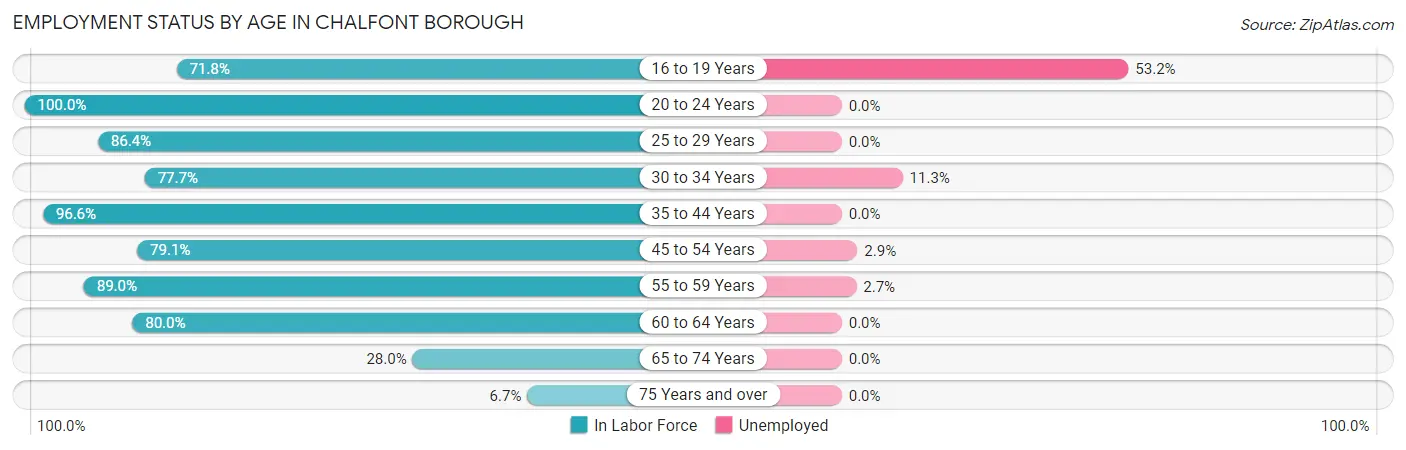
| Age Bracket | In Labor Force | Unemployed |
| 16 to 19 Years | 295 (71.8%) | 157 (53.2%) |
| 20 to 24 Years | 220 (100.0%) | 0 (0.0%) |
| 25 to 29 Years | 229 (86.4%) | 0 (0.0%) |
| 30 to 34 Years | 150 (77.7%) | 17 (11.3%) |
| 35 to 44 Years | 605 (96.6%) | 0 (0.0%) |
| 45 to 54 Years | 480 (79.1%) | 14 (2.9%) |
| 55 to 59 Years | 372 (89.0%) | 10 (2.7%) |
| 60 to 64 Years | 200 (80.0%) | 0 (0.0%) |
| 65 to 74 Years | 73 (28.0%) | 0 (0.0%) |
| 75 Years and over | 19 (6.7%) | 0 (0.0%) |
| Total | 2,644 (74.8%) | 198 (7.5%) |
Employment Status by Educational Attainment in Chalfont borough
According to labor force statistics for Chalfont borough, 86.3% of individuals (2,036) out of the total population between 25 and 64 years of age (2,359) are in the labor force, with 2.0% or 41 of them being unemployed. The group with the highest labor force participation rate are those with the educational attainment of bachelor's degree or higher, with 91.5% or 1,512 individuals in the labor force. Within the labor force, individuals with college / associate degree education have the highest percentage of unemployment, with 12.1% or 31 of them being unemployed.
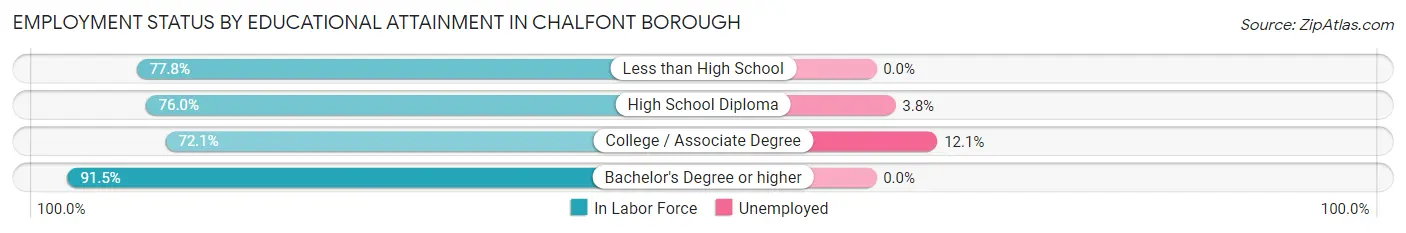
| Educational Attainment | In Labor Force | Unemployed |
| Less than High School | 7 (77.8%) | 0 (0.0%) |
| High School Diploma | 260 (76.0%) | 13 (3.8%) |
| College / Associate Degree | 256 (72.1%) | 43 (12.1%) |
| Bachelor's Degree or higher | 1,512 (91.5%) | 0 (0.0%) |
| Total | 2,036 (86.3%) | 47 (2.0%) |
Employment Occupations by Sex in Chalfont borough
Management, Business, Science and Arts Occupations
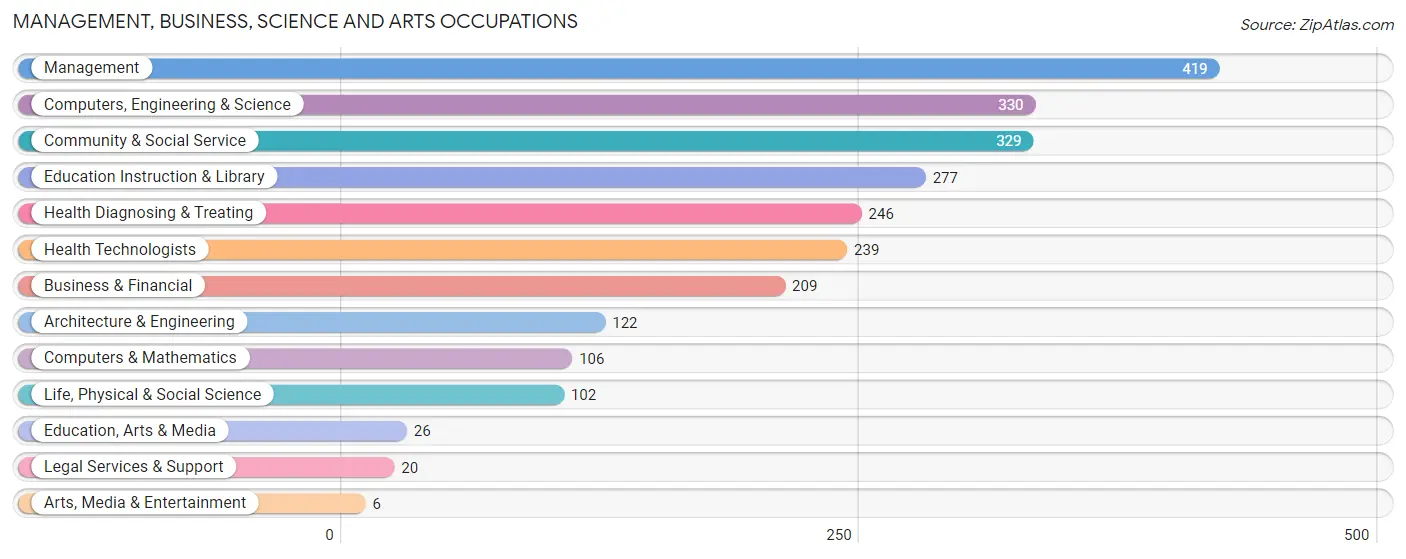
The most common Management, Business, Science and Arts occupations in Chalfont borough are Management (419 | 17.1%), Computers, Engineering & Science (330 | 13.5%), Community & Social Service (329 | 13.5%), Education Instruction & Library (277 | 11.3%), and Health Diagnosing & Treating (246 | 10.1%).
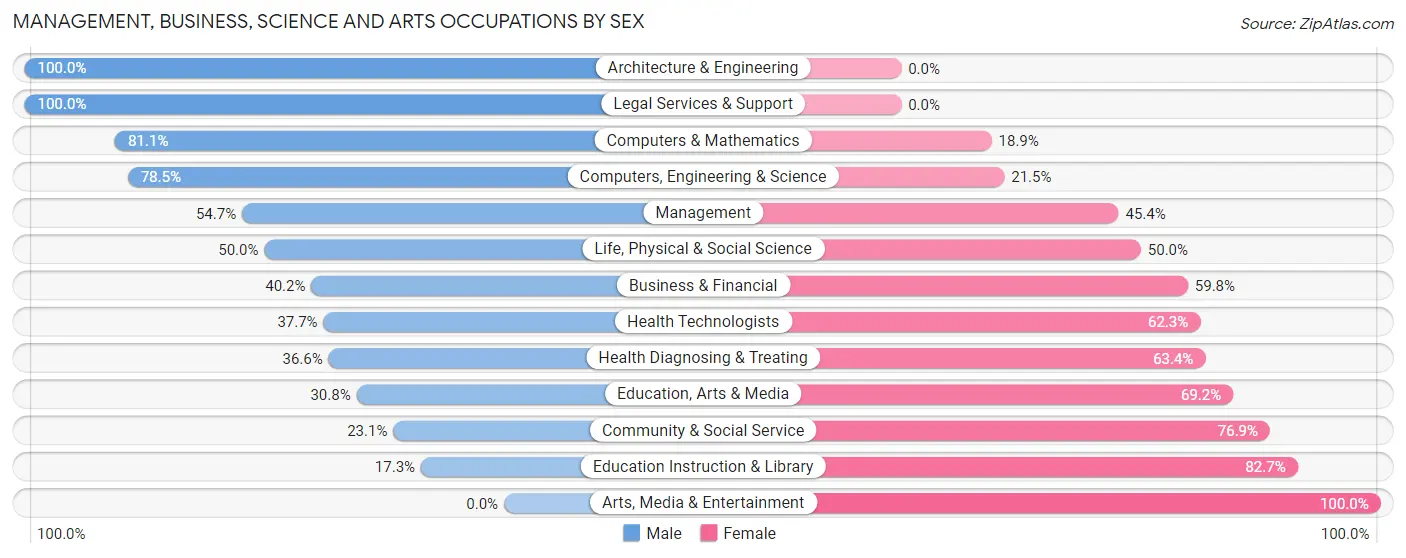
Management, Business, Science and Arts Occupations by Sex
Within the Management, Business, Science and Arts occupations in Chalfont borough, the most male-oriented occupations are Architecture & Engineering (100.0%), Legal Services & Support (100.0%), and Computers & Mathematics (81.1%), while the most female-oriented occupations are Arts, Media & Entertainment (100.0%), Education Instruction & Library (82.7%), and Community & Social Service (76.9%).
| Occupation | Male | Female |
| Management | 229 (54.6%) | 190 (45.4%) |
| Business & Financial | 84 (40.2%) | 125 (59.8%) |
| Computers, Engineering & Science | 259 (78.5%) | 71 (21.5%) |
| Computers & Mathematics | 86 (81.1%) | 20 (18.9%) |
| Architecture & Engineering | 122 (100.0%) | 0 (0.0%) |
| Life, Physical & Social Science | 51 (50.0%) | 51 (50.0%) |
| Community & Social Service | 76 (23.1%) | 253 (76.9%) |
| Education, Arts & Media | 8 (30.8%) | 18 (69.2%) |
| Legal Services & Support | 20 (100.0%) | 0 (0.0%) |
| Education Instruction & Library | 48 (17.3%) | 229 (82.7%) |
| Arts, Media & Entertainment | 0 (0.0%) | 6 (100.0%) |
| Health Diagnosing & Treating | 90 (36.6%) | 156 (63.4%) |
| Health Technologists | 90 (37.7%) | 149 (62.3%) |
| Total (Category) | 738 (48.1%) | 795 (51.9%) |
| Total (Overall) | 1,285 (52.6%) | 1,160 (47.4%) |
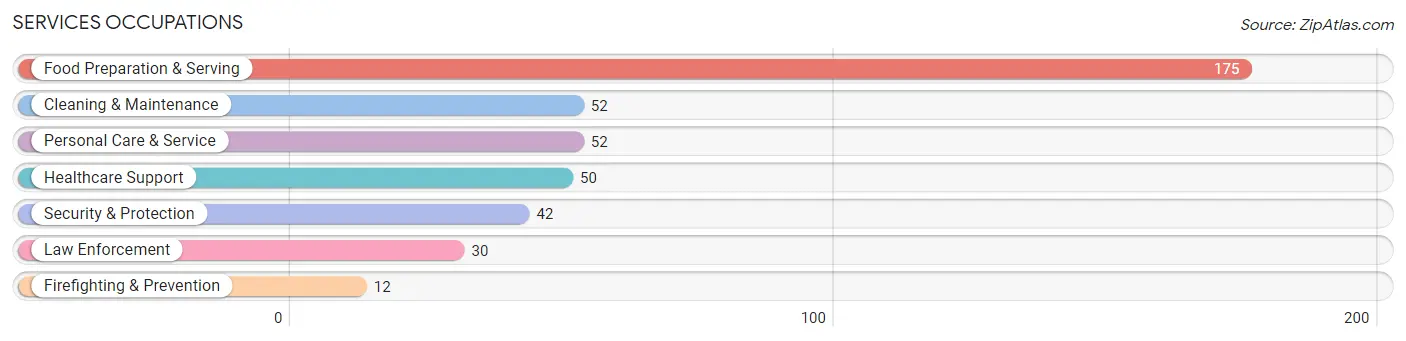
Services Occupations
The most common Services occupations in Chalfont borough are Food Preparation & Serving (175 | 7.2%), Cleaning & Maintenance (52 | 2.1%), Personal Care & Service (52 | 2.1%), Healthcare Support (50 | 2.0%), and Security & Protection (42 | 1.7%).
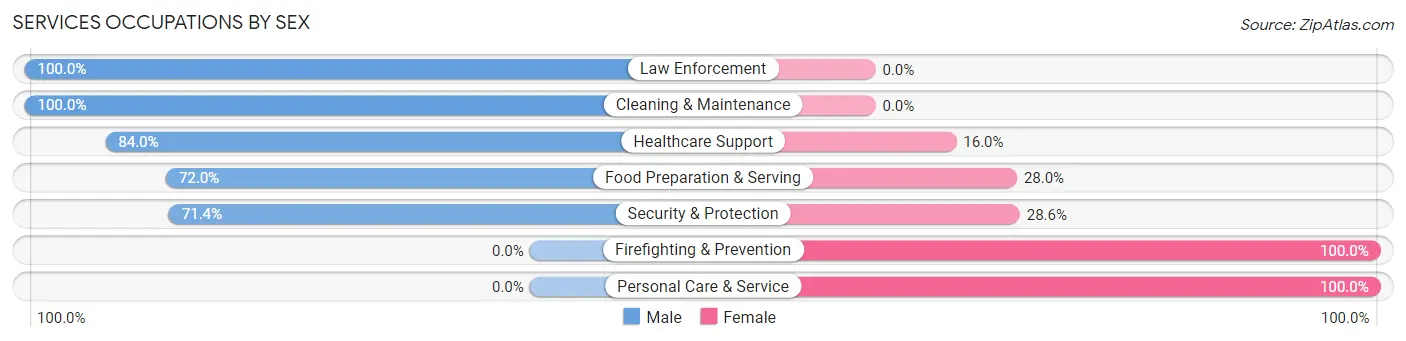
Services Occupations by Sex
Within the Services occupations in Chalfont borough, the most male-oriented occupations are Law Enforcement (100.0%), Cleaning & Maintenance (100.0%), and Healthcare Support (84.0%), while the most female-oriented occupations are Firefighting & Prevention (100.0%), Personal Care & Service (100.0%), and Security & Protection (28.6%).
| Occupation | Male | Female |
| Healthcare Support | 42 (84.0%) | 8 (16.0%) |
| Security & Protection | 30 (71.4%) | 12 (28.6%) |
| Firefighting & Prevention | 0 (0.0%) | 12 (100.0%) |
| Law Enforcement | 30 (100.0%) | 0 (0.0%) |
| Food Preparation & Serving | 126 (72.0%) | 49 (28.0%) |
| Cleaning & Maintenance | 52 (100.0%) | 0 (0.0%) |
| Personal Care & Service | 0 (0.0%) | 52 (100.0%) |
| Total (Category) | 250 (67.4%) | 121 (32.6%) |
| Total (Overall) | 1,285 (52.6%) | 1,160 (47.4%) |
Sales and Office Occupations
The most common Sales and Office occupations in Chalfont borough are Office & Administration (208 | 8.5%), and Sales & Related (136 | 5.6%).

Sales and Office Occupations by Sex

| Occupation | Male | Female |
| Sales & Related | 107 (78.7%) | 29 (21.3%) |
| Office & Administration | 0 (0.0%) | 208 (100.0%) |
| Total (Category) | 107 (31.1%) | 237 (68.9%) |
| Total (Overall) | 1,285 (52.6%) | 1,160 (47.4%) |
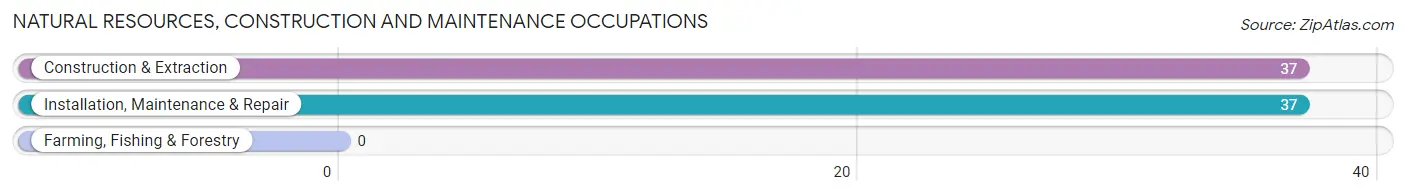
Natural Resources, Construction and Maintenance Occupations
The most common Natural Resources, Construction and Maintenance occupations in Chalfont borough are Construction & Extraction (37 | 1.5%), and Installation, Maintenance & Repair (37 | 1.5%).
Natural Resources, Construction and Maintenance Occupations by Sex

| Occupation | Male | Female |
| Farming, Fishing & Forestry | 0 (0.0%) | 0 (0.0%) |
| Construction & Extraction | 37 (100.0%) | 0 (0.0%) |
| Installation, Maintenance & Repair | 37 (100.0%) | 0 (0.0%) |
| Total (Category) | 74 (100.0%) | 0 (0.0%) |
| Total (Overall) | 1,285 (52.6%) | 1,160 (47.4%) |
Production, Transportation and Moving Occupations
The most common Production, Transportation and Moving occupations in Chalfont borough are Transportation (78 | 3.2%), Production (36 | 1.5%), and Material Moving (9 | 0.4%).
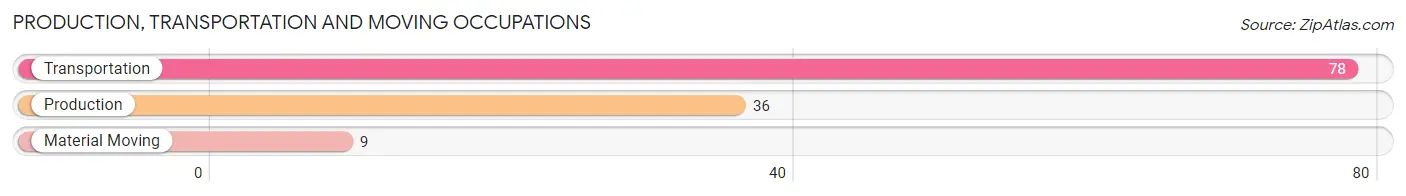
Production, Transportation and Moving Occupations by Sex
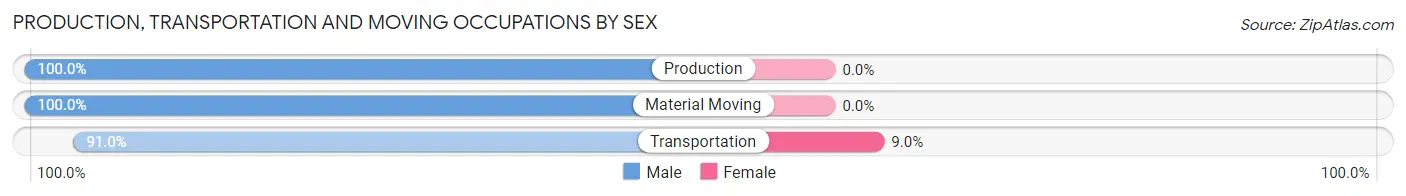
| Occupation | Male | Female |
| Production | 36 (100.0%) | 0 (0.0%) |
| Transportation | 71 (91.0%) | 7 (9.0%) |
| Material Moving | 9 (100.0%) | 0 (0.0%) |
| Total (Category) | 116 (94.3%) | 7 (5.7%) |
| Total (Overall) | 1,285 (52.6%) | 1,160 (47.4%) |
Employment Industries by Sex in Chalfont borough
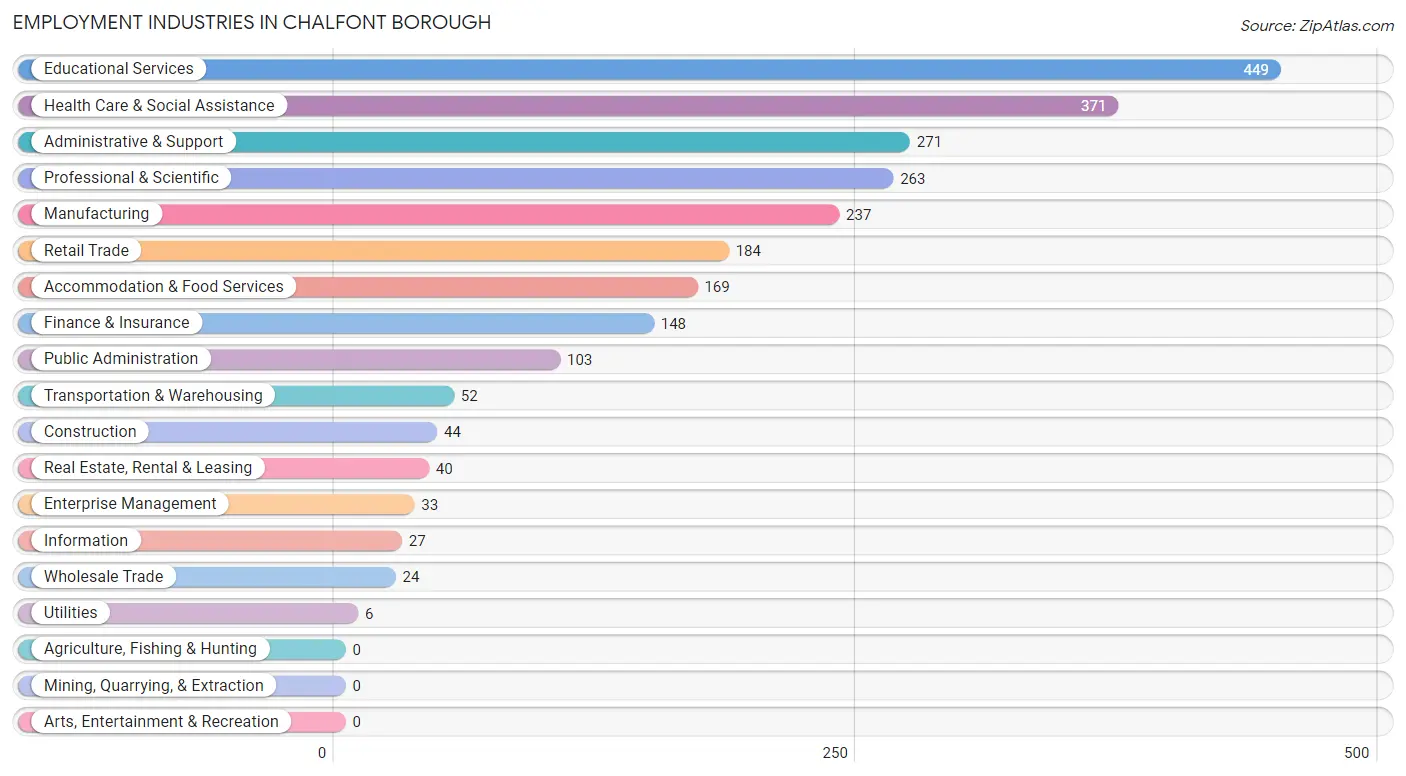
Employment Industries in Chalfont borough
The major employment industries in Chalfont borough include Educational Services (449 | 18.4%), Health Care & Social Assistance (371 | 15.2%), Administrative & Support (271 | 11.1%), Professional & Scientific (263 | 10.8%), and Manufacturing (237 | 9.7%).
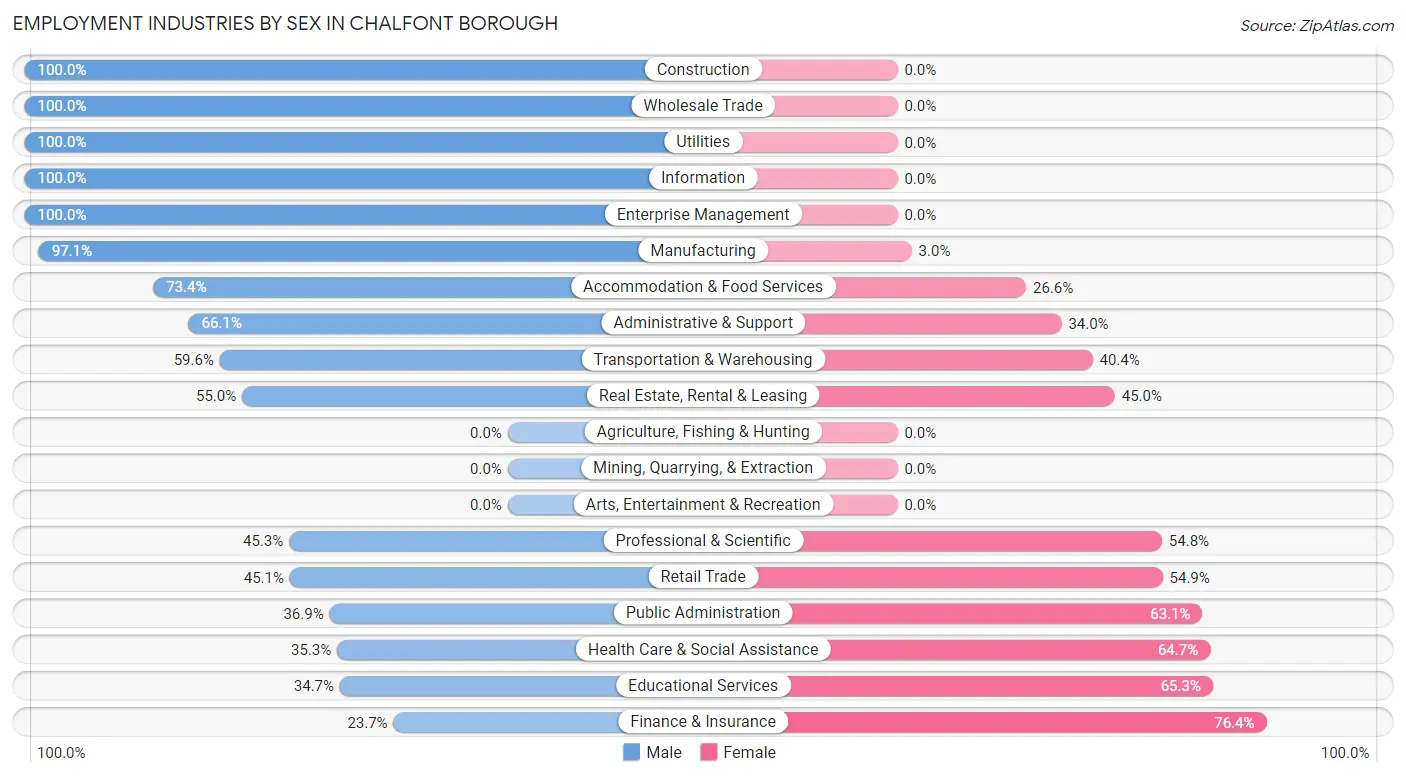
Employment Industries by Sex in Chalfont borough
The Chalfont borough industries that see more men than women are Construction (100.0%), Wholesale Trade (100.0%), and Utilities (100.0%), whereas the industries that tend to have a higher number of women are Finance & Insurance (76.3%), Educational Services (65.3%), and Health Care & Social Assistance (64.7%).
| Industry | Male | Female |
| Agriculture, Fishing & Hunting | 0 (0.0%) | 0 (0.0%) |
| Mining, Quarrying, & Extraction | 0 (0.0%) | 0 (0.0%) |
| Construction | 44 (100.0%) | 0 (0.0%) |
| Manufacturing | 230 (97.1%) | 7 (2.9%) |
| Wholesale Trade | 24 (100.0%) | 0 (0.0%) |
| Retail Trade | 83 (45.1%) | 101 (54.9%) |
| Transportation & Warehousing | 31 (59.6%) | 21 (40.4%) |
| Utilities | 6 (100.0%) | 0 (0.0%) |
| Information | 27 (100.0%) | 0 (0.0%) |
| Finance & Insurance | 35 (23.6%) | 113 (76.3%) |
| Real Estate, Rental & Leasing | 22 (55.0%) | 18 (45.0%) |
| Professional & Scientific | 119 (45.3%) | 144 (54.7%) |
| Enterprise Management | 33 (100.0%) | 0 (0.0%) |
| Administrative & Support | 179 (66.0%) | 92 (34.0%) |
| Educational Services | 156 (34.7%) | 293 (65.3%) |
| Health Care & Social Assistance | 131 (35.3%) | 240 (64.7%) |
| Arts, Entertainment & Recreation | 0 (0.0%) | 0 (0.0%) |
| Accommodation & Food Services | 124 (73.4%) | 45 (26.6%) |
| Public Administration | 38 (36.9%) | 65 (63.1%) |
| Total | 1,285 (52.6%) | 1,160 (47.4%) |
Education in Chalfont borough
School Enrollment in Chalfont borough
The most common levels of schooling among the 1,050 students in Chalfont borough are high school (314 | 29.9%), middle school (236 | 22.5%), and elementary school (183 | 17.4%).
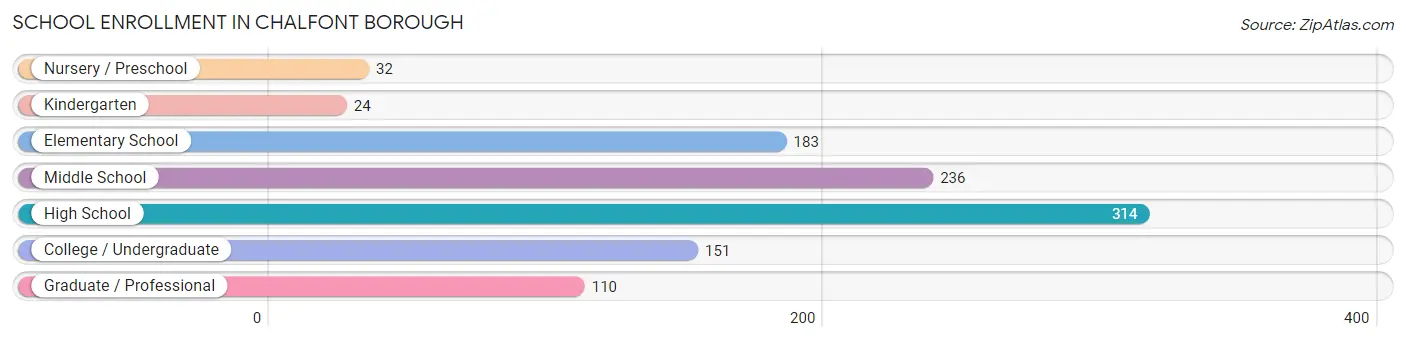
| School Level | # Students | % Students |
| Nursery / Preschool | 32 | 3.0% |
| Kindergarten | 24 | 2.3% |
| Elementary School | 183 | 17.4% |
| Middle School | 236 | 22.5% |
| High School | 314 | 29.9% |
| College / Undergraduate | 151 | 14.4% |
| Graduate / Professional | 110 | 10.5% |
| Total | 1,050 | 100.0% |
School Enrollment by Age by Funding Source in Chalfont borough
Out of a total of 1,050 students who are enrolled in schools in Chalfont borough, 155 (14.8%) attend a private institution, while the remaining 895 (85.2%) are enrolled in public schools. The age group of 3 to 4 year olds has the highest likelihood of being enrolled in private schools, with 16 (50.0% in the age bracket) enrolled. Conversely, the age group of 18 to 19 year olds has the lowest likelihood of being enrolled in a private school, with 40 (100.0% in the age bracket) attending a public institution.
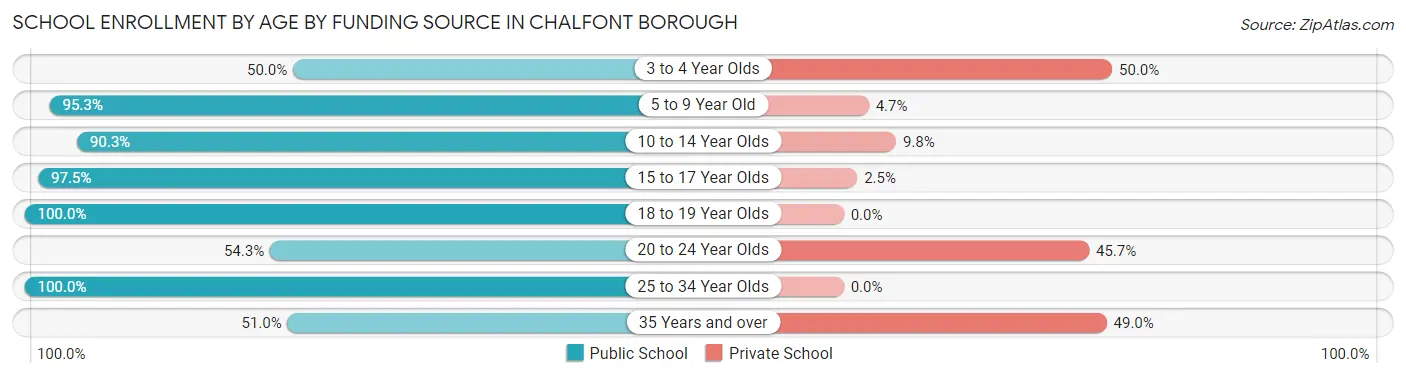
| Age Bracket | Public School | Private School |
| 3 to 4 Year Olds | 16 (50.0%) | 16 (50.0%) |
| 5 to 9 Year Old | 184 (95.3%) | 9 (4.7%) |
| 10 to 14 Year Olds | 250 (90.2%) | 27 (9.8%) |
| 15 to 17 Year Olds | 271 (97.5%) | 7 (2.5%) |
| 18 to 19 Year Olds | 40 (100.0%) | 0 (0.0%) |
| 20 to 24 Year Olds | 57 (54.3%) | 48 (45.7%) |
| 25 to 34 Year Olds | 27 (100.0%) | 0 (0.0%) |
| 35 Years and over | 50 (51.0%) | 48 (49.0%) |
| Total | 895 (85.2%) | 155 (14.8%) |
Educational Attainment by Field of Study in Chalfont borough
Education (492 | 25.9%), business (454 | 23.9%), science & technology (238 | 12.5%), social sciences (110 | 5.8%), and bio, nature & agricultural (107 | 5.6%) are the most common fields of study among 1,898 individuals in Chalfont borough who have obtained a bachelor's degree or higher.
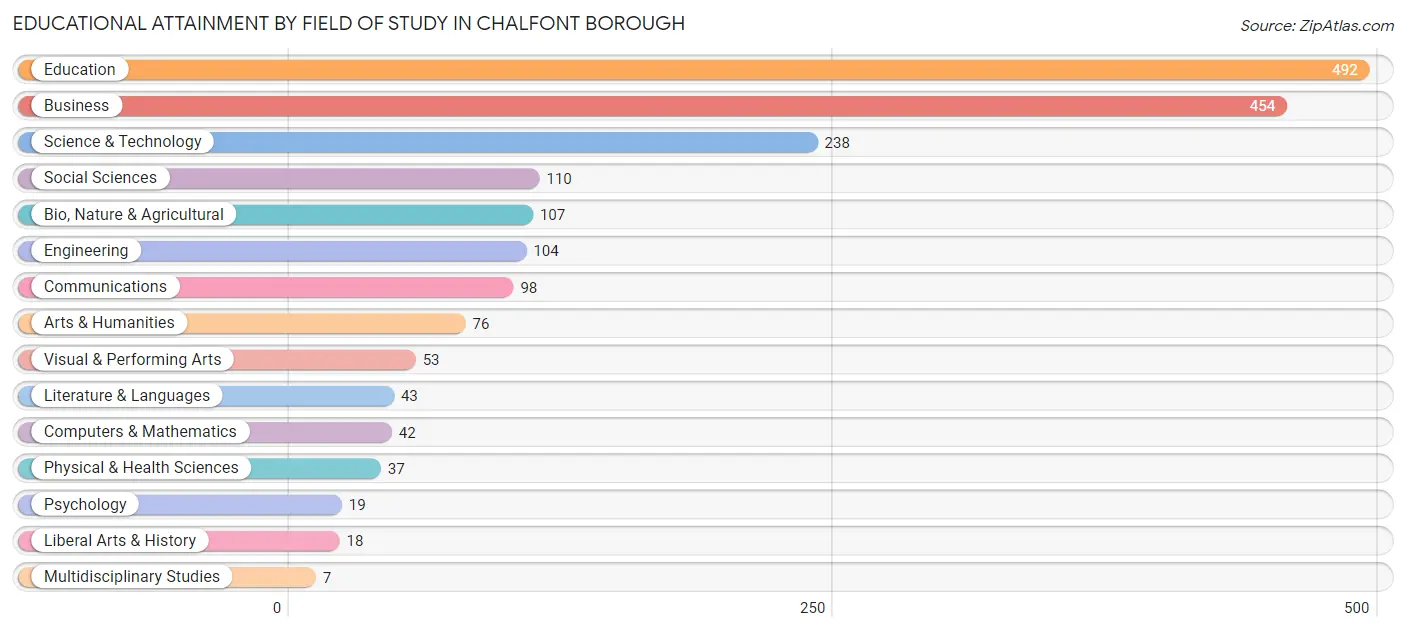
| Field of Study | # Graduates | % Graduates |
| Computers & Mathematics | 42 | 2.2% |
| Bio, Nature & Agricultural | 107 | 5.6% |
| Physical & Health Sciences | 37 | 1.9% |
| Psychology | 19 | 1.0% |
| Social Sciences | 110 | 5.8% |
| Engineering | 104 | 5.5% |
| Multidisciplinary Studies | 7 | 0.4% |
| Science & Technology | 238 | 12.5% |
| Business | 454 | 23.9% |
| Education | 492 | 25.9% |
| Literature & Languages | 43 | 2.3% |
| Liberal Arts & History | 18 | 0.9% |
| Visual & Performing Arts | 53 | 2.8% |
| Communications | 98 | 5.2% |
| Arts & Humanities | 76 | 4.0% |
| Total | 1,898 | 100.0% |
Transportation & Commute in Chalfont borough
Vehicle Availability by Sex in Chalfont borough
The most prevalent vehicle ownership categories in Chalfont borough are males with 2 vehicles (736, accounting for 57.3%) and females with 2 vehicles (476, making up 64.4%).
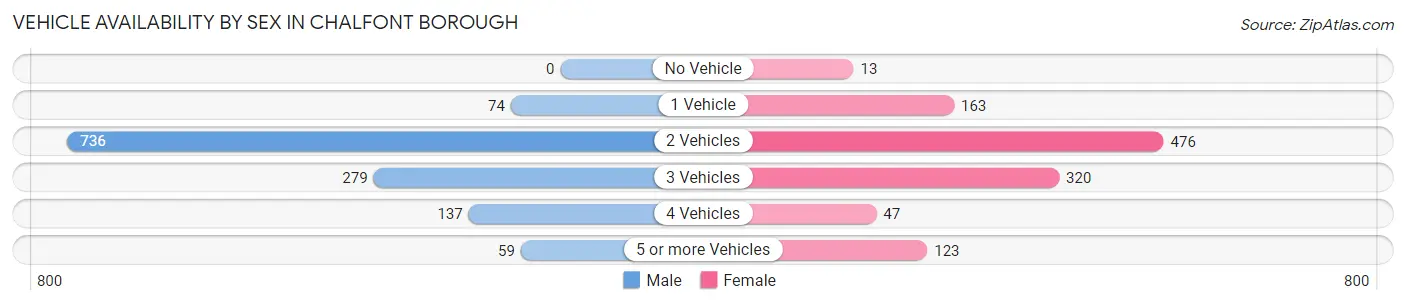
| Vehicles Available | Male | Female |
| No Vehicle | 0 (0.0%) | 13 (1.1%) |
| 1 Vehicle | 74 (5.8%) | 163 (14.3%) |
| 2 Vehicles | 736 (57.3%) | 476 (41.7%) |
| 3 Vehicles | 279 (21.7%) | 320 (28.0%) |
| 4 Vehicles | 137 (10.7%) | 47 (4.1%) |
| 5 or more Vehicles | 59 (4.6%) | 123 (10.8%) |
| Total | 1,285 (100.0%) | 1,142 (100.0%) |
Commute Time in Chalfont borough
The most frequently occuring commute durations in Chalfont borough are 15 to 19 minutes (342 commuters, 17.5%), 20 to 24 minutes (307 commuters, 15.7%), and 45 to 59 minutes (301 commuters, 15.4%).
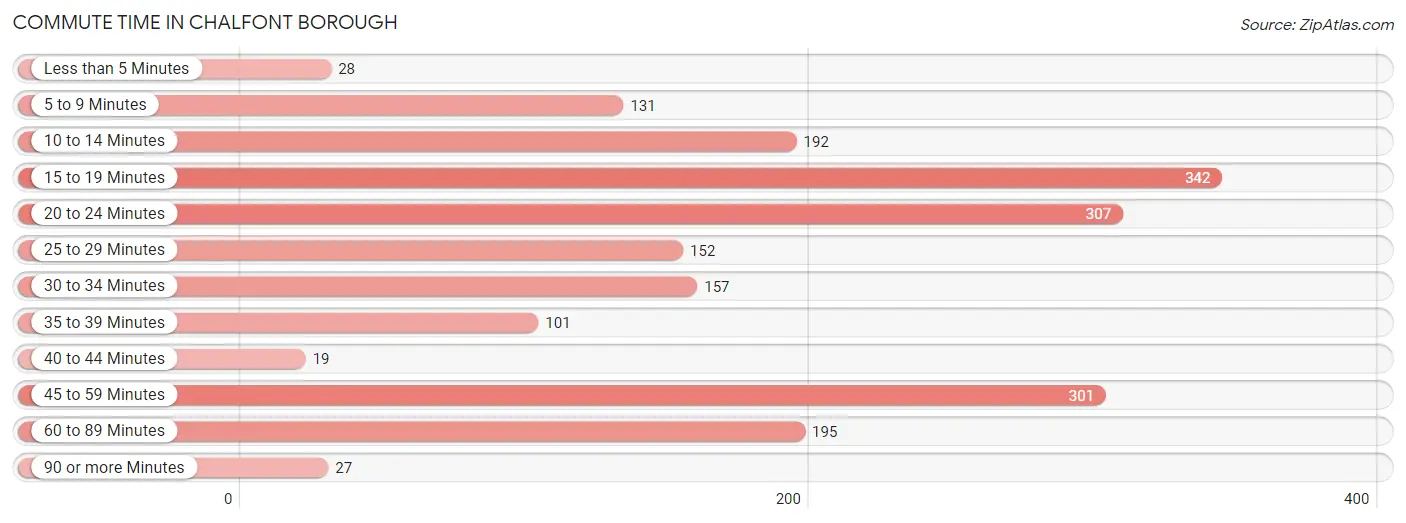
| Commute Time | # Commuters | % Commuters |
| Less than 5 Minutes | 28 | 1.4% |
| 5 to 9 Minutes | 131 | 6.7% |
| 10 to 14 Minutes | 192 | 9.8% |
| 15 to 19 Minutes | 342 | 17.5% |
| 20 to 24 Minutes | 307 | 15.7% |
| 25 to 29 Minutes | 152 | 7.8% |
| 30 to 34 Minutes | 157 | 8.0% |
| 35 to 39 Minutes | 101 | 5.2% |
| 40 to 44 Minutes | 19 | 1.0% |
| 45 to 59 Minutes | 301 | 15.4% |
| 60 to 89 Minutes | 195 | 10.0% |
| 90 or more Minutes | 27 | 1.4% |
Commute Time by Sex in Chalfont borough
The most common commute times in Chalfont borough are 45 to 59 minutes (191 commuters, 19.2%) for males and 15 to 19 minutes (227 commuters, 23.7%) for females.
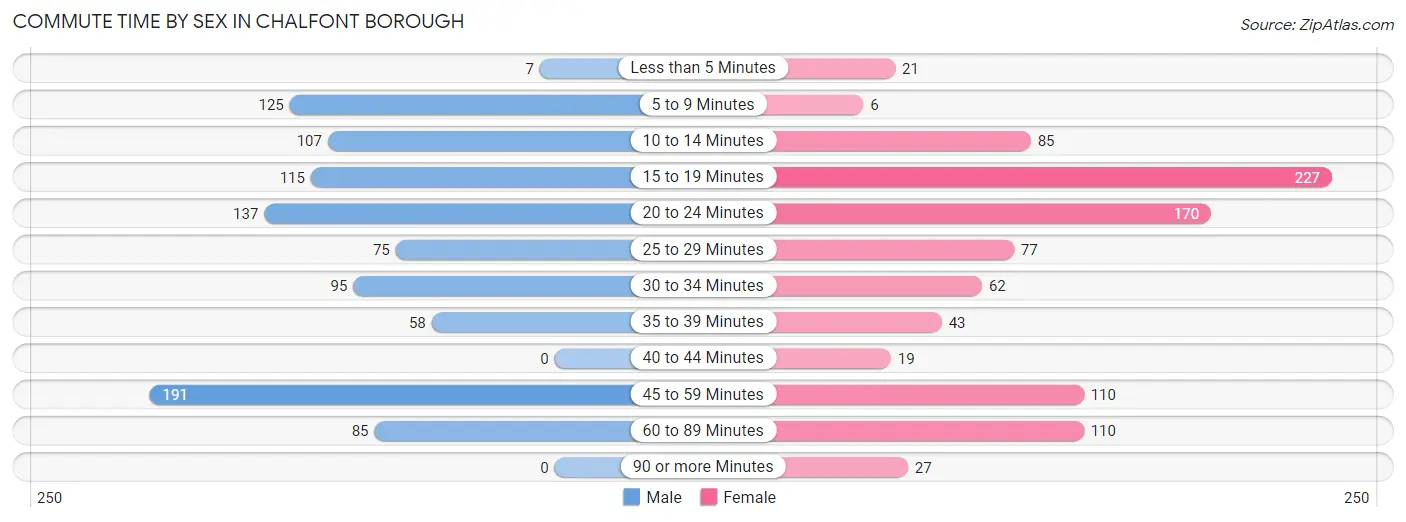
| Commute Time | Male | Female |
| Less than 5 Minutes | 7 (0.7%) | 21 (2.2%) |
| 5 to 9 Minutes | 125 (12.6%) | 6 (0.6%) |
| 10 to 14 Minutes | 107 (10.7%) | 85 (8.9%) |
| 15 to 19 Minutes | 115 (11.6%) | 227 (23.7%) |
| 20 to 24 Minutes | 137 (13.8%) | 170 (17.8%) |
| 25 to 29 Minutes | 75 (7.5%) | 77 (8.1%) |
| 30 to 34 Minutes | 95 (9.6%) | 62 (6.5%) |
| 35 to 39 Minutes | 58 (5.8%) | 43 (4.5%) |
| 40 to 44 Minutes | 0 (0.0%) | 19 (2.0%) |
| 45 to 59 Minutes | 191 (19.2%) | 110 (11.5%) |
| 60 to 89 Minutes | 85 (8.5%) | 110 (11.5%) |
| 90 or more Minutes | 0 (0.0%) | 27 (2.8%) |
Time of Departure to Work by Sex in Chalfont borough
The most frequent times of departure to work in Chalfont borough are 7:00 AM to 7:29 AM (176, 17.7%) for males and 6:30 AM to 6:59 AM (155, 16.2%) for females.
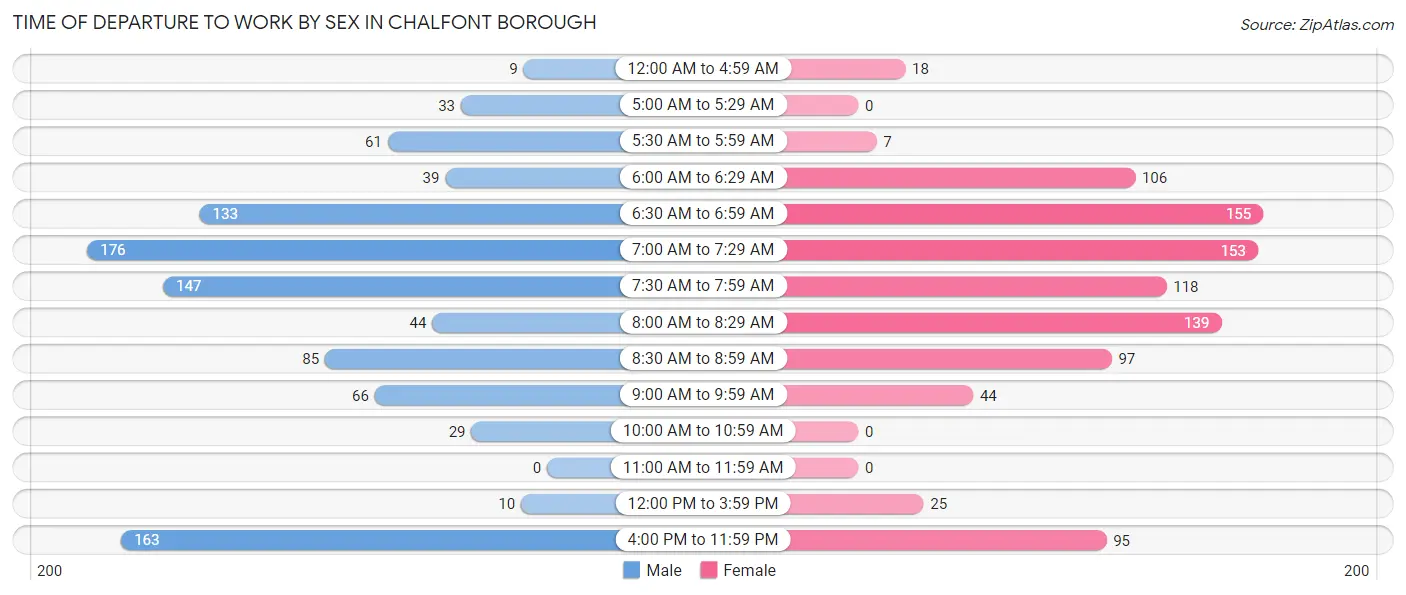
| Time of Departure | Male | Female |
| 12:00 AM to 4:59 AM | 9 (0.9%) | 18 (1.9%) |
| 5:00 AM to 5:29 AM | 33 (3.3%) | 0 (0.0%) |
| 5:30 AM to 5:59 AM | 61 (6.1%) | 7 (0.7%) |
| 6:00 AM to 6:29 AM | 39 (3.9%) | 106 (11.1%) |
| 6:30 AM to 6:59 AM | 133 (13.4%) | 155 (16.2%) |
| 7:00 AM to 7:29 AM | 176 (17.7%) | 153 (16.0%) |
| 7:30 AM to 7:59 AM | 147 (14.8%) | 118 (12.3%) |
| 8:00 AM to 8:29 AM | 44 (4.4%) | 139 (14.5%) |
| 8:30 AM to 8:59 AM | 85 (8.5%) | 97 (10.1%) |
| 9:00 AM to 9:59 AM | 66 (6.6%) | 44 (4.6%) |
| 10:00 AM to 10:59 AM | 29 (2.9%) | 0 (0.0%) |
| 11:00 AM to 11:59 AM | 0 (0.0%) | 0 (0.0%) |
| 12:00 PM to 3:59 PM | 10 (1.0%) | 25 (2.6%) |
| 4:00 PM to 11:59 PM | 163 (16.4%) | 95 (9.9%) |
| Total | 995 (100.0%) | 957 (100.0%) |
Housing Occupancy in Chalfont borough
Occupancy by Ownership in Chalfont borough
Of the total 1,688 dwellings in Chalfont borough, owner-occupied units account for 1,406 (83.3%), while renter-occupied units make up 282 (16.7%).
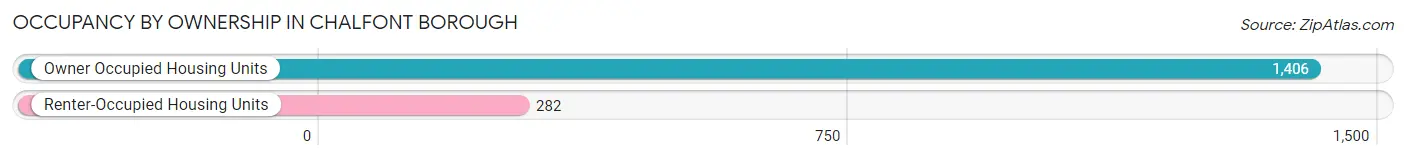
| Occupancy | # Housing Units | % Housing Units |
| Owner Occupied Housing Units | 1,406 | 83.3% |
| Renter-Occupied Housing Units | 282 | 16.7% |
| Total Occupied Housing Units | 1,688 | 100.0% |
Occupancy by Household Size in Chalfont borough
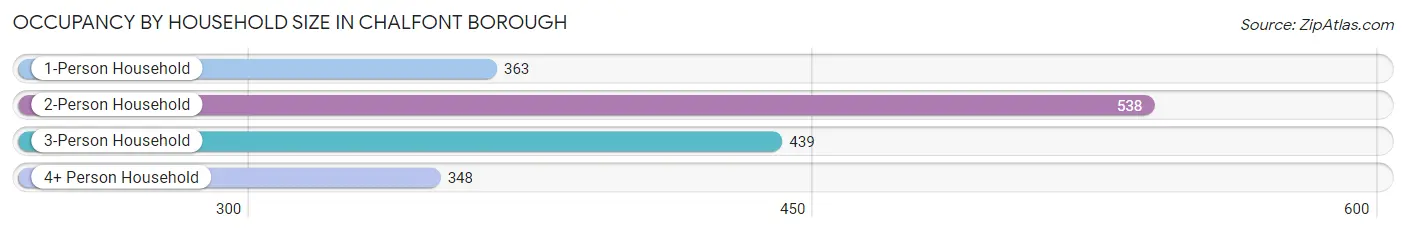
| Household Size | # Housing Units | % Housing Units |
| 1-Person Household | 363 | 21.5% |
| 2-Person Household | 538 | 31.9% |
| 3-Person Household | 439 | 26.0% |
| 4+ Person Household | 348 | 20.6% |
| Total Housing Units | 1,688 | 100.0% |
Occupancy by Ownership by Household Size in Chalfont borough
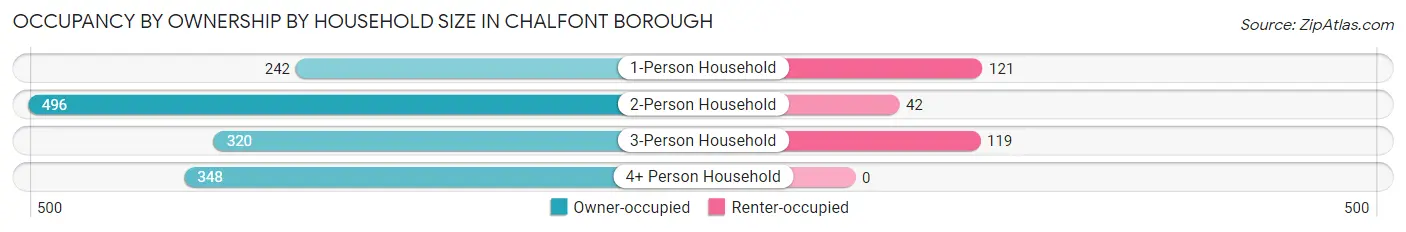
| Household Size | Owner-occupied | Renter-occupied |
| 1-Person Household | 242 (66.7%) | 121 (33.3%) |
| 2-Person Household | 496 (92.2%) | 42 (7.8%) |
| 3-Person Household | 320 (72.9%) | 119 (27.1%) |
| 4+ Person Household | 348 (100.0%) | 0 (0.0%) |
| Total Housing Units | 1,406 (83.3%) | 282 (16.7%) |
Occupancy by Educational Attainment in Chalfont borough
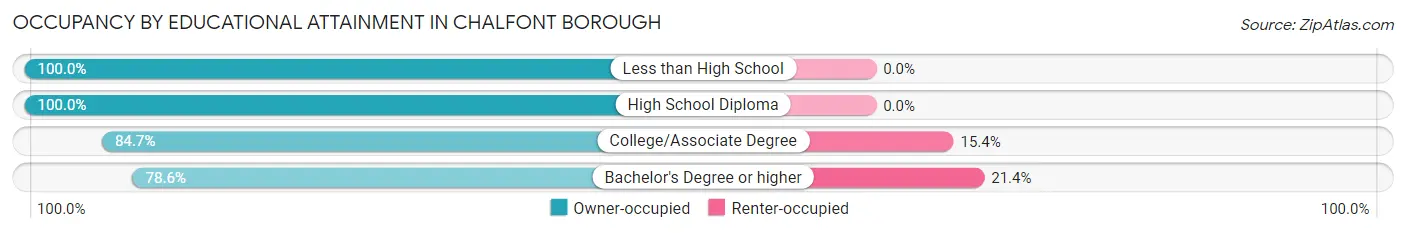
| Household Size | Owner-occupied | Renter-occupied |
| Less than High School | 47 (100.0%) | 0 (0.0%) |
| High School Diploma | 253 (100.0%) | 0 (0.0%) |
| College/Associate Degree | 215 (84.7%) | 39 (15.3%) |
| Bachelor's Degree or higher | 891 (78.6%) | 243 (21.4%) |
Occupancy by Age of Householder in Chalfont borough
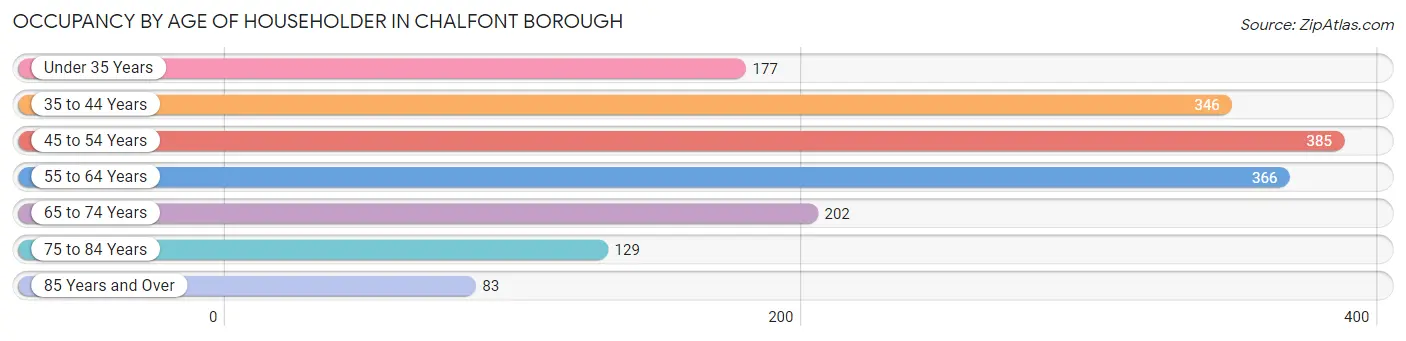
| Age Bracket | # Households | % Households |
| Under 35 Years | 177 | 10.5% |
| 35 to 44 Years | 346 | 20.5% |
| 45 to 54 Years | 385 | 22.8% |
| 55 to 64 Years | 366 | 21.7% |
| 65 to 74 Years | 202 | 12.0% |
| 75 to 84 Years | 129 | 7.6% |
| 85 Years and Over | 83 | 4.9% |
| Total | 1,688 | 100.0% |
Housing Finances in Chalfont borough
Median Income by Occupancy in Chalfont borough

| Occupancy Type | # Households | Median Income |
| Owner-Occupied | 1,406 (83.3%) | $148,684 |
| Renter-Occupied | 282 (16.7%) | $38,908 |
| Average | 1,688 (100.0%) | $118,871 |
Occupancy by Householder Income Bracket in Chalfont borough
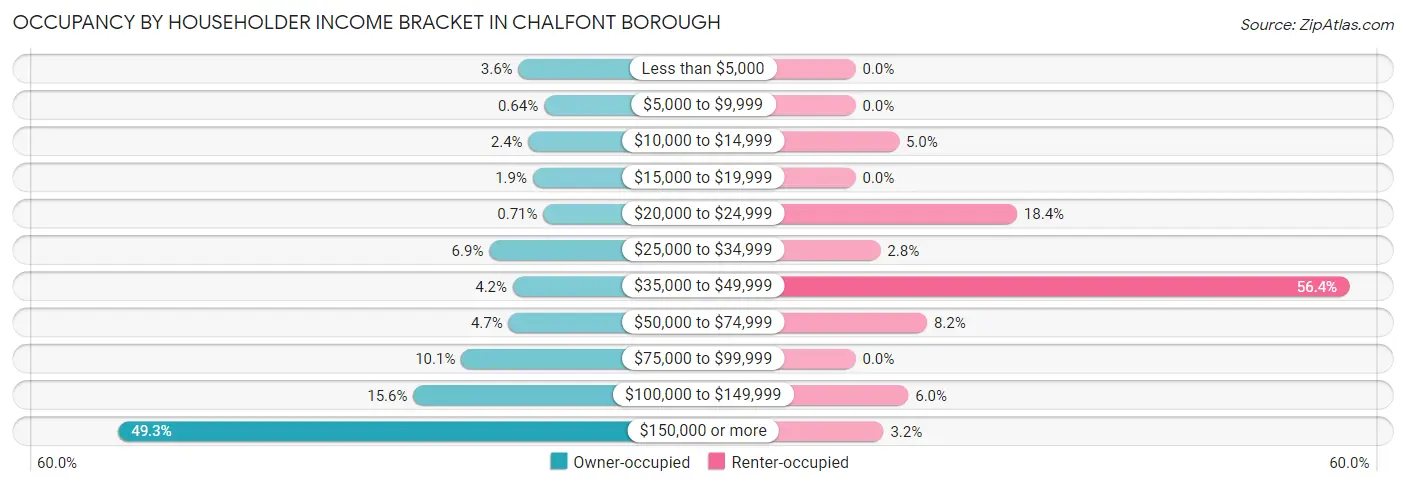
| Income Bracket | Owner-occupied | Renter-occupied |
| Less than $5,000 | 50 (3.6%) | 0 (0.0%) |
| $5,000 to $9,999 | 9 (0.6%) | 0 (0.0%) |
| $10,000 to $14,999 | 34 (2.4%) | 14 (5.0%) |
| $15,000 to $19,999 | 27 (1.9%) | 0 (0.0%) |
| $20,000 to $24,999 | 10 (0.7%) | 52 (18.4%) |
| $25,000 to $34,999 | 97 (6.9%) | 8 (2.8%) |
| $35,000 to $49,999 | 59 (4.2%) | 159 (56.4%) |
| $50,000 to $74,999 | 66 (4.7%) | 23 (8.2%) |
| $75,000 to $99,999 | 142 (10.1%) | 0 (0.0%) |
| $100,000 to $149,999 | 219 (15.6%) | 17 (6.0%) |
| $150,000 or more | 693 (49.3%) | 9 (3.2%) |
| Total | 1,406 (100.0%) | 282 (100.0%) |
Monthly Housing Cost Tiers in Chalfont borough
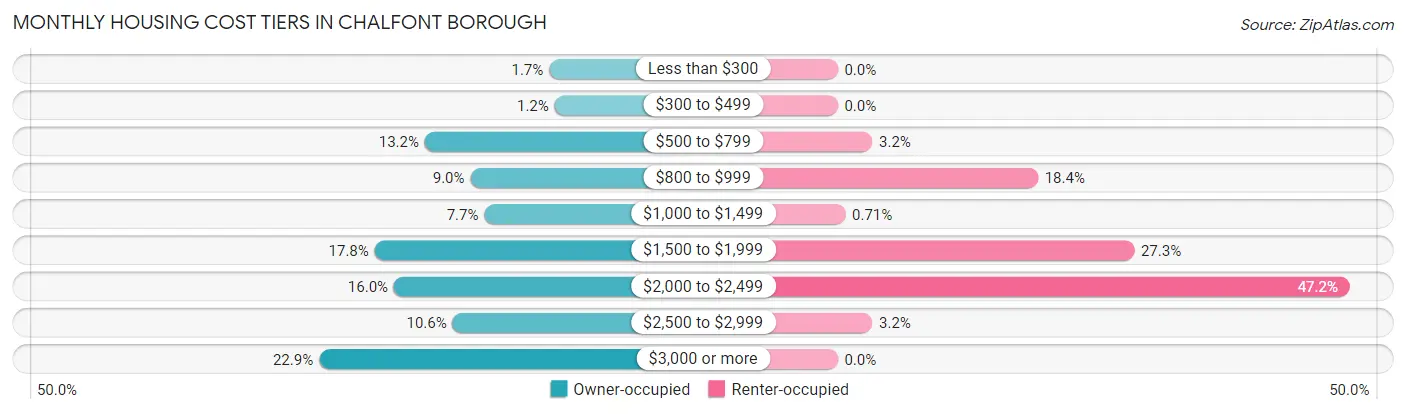
| Monthly Cost | Owner-occupied | Renter-occupied |
| Less than $300 | 24 (1.7%) | 0 (0.0%) |
| $300 to $499 | 17 (1.2%) | 0 (0.0%) |
| $500 to $799 | 185 (13.2%) | 9 (3.2%) |
| $800 to $999 | 126 (9.0%) | 52 (18.4%) |
| $1,000 to $1,499 | 108 (7.7%) | 2 (0.7%) |
| $1,500 to $1,999 | 250 (17.8%) | 77 (27.3%) |
| $2,000 to $2,499 | 225 (16.0%) | 133 (47.2%) |
| $2,500 to $2,999 | 149 (10.6%) | 9 (3.2%) |
| $3,000 or more | 322 (22.9%) | 0 (0.0%) |
| Total | 1,406 (100.0%) | 282 (100.0%) |
Physical Housing Characteristics in Chalfont borough
Housing Structures in Chalfont borough
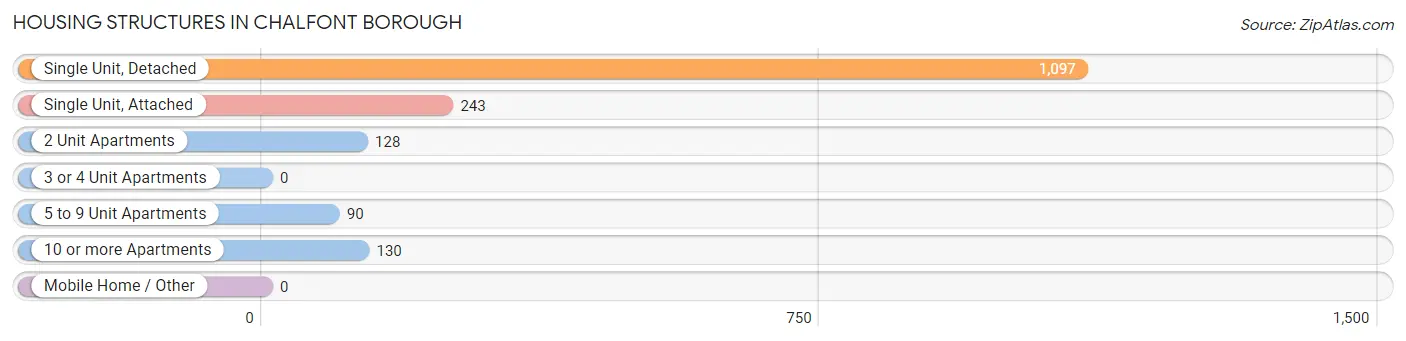
| Structure Type | # Housing Units | % Housing Units |
| Single Unit, Detached | 1,097 | 65.0% |
| Single Unit, Attached | 243 | 14.4% |
| 2 Unit Apartments | 128 | 7.6% |
| 3 or 4 Unit Apartments | 0 | 0.0% |
| 5 to 9 Unit Apartments | 90 | 5.3% |
| 10 or more Apartments | 130 | 7.7% |
| Mobile Home / Other | 0 | 0.0% |
| Total | 1,688 | 100.0% |
Housing Structures by Occupancy in Chalfont borough
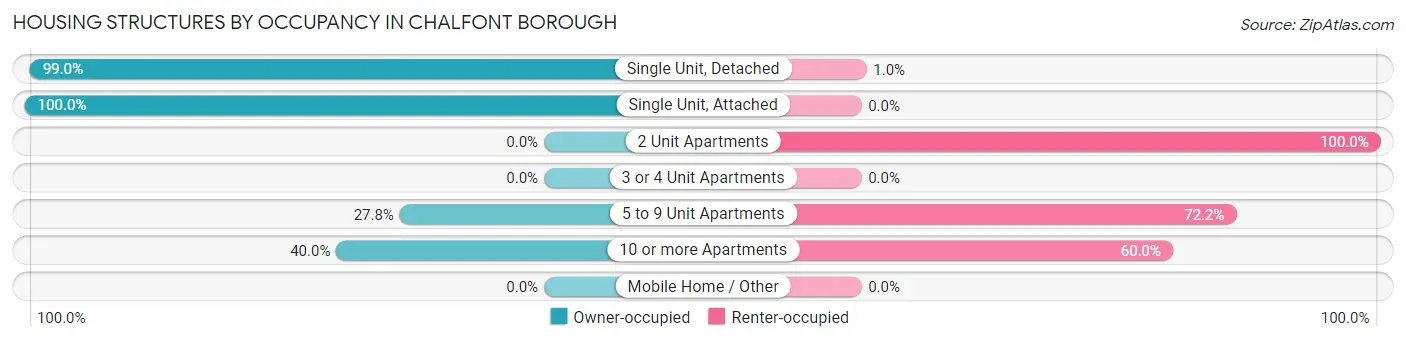
| Structure Type | Owner-occupied | Renter-occupied |
| Single Unit, Detached | 1,086 (99.0%) | 11 (1.0%) |
| Single Unit, Attached | 243 (100.0%) | 0 (0.0%) |
| 2 Unit Apartments | 0 (0.0%) | 128 (100.0%) |
| 3 or 4 Unit Apartments | 0 (0.0%) | 0 (0.0%) |
| 5 to 9 Unit Apartments | 25 (27.8%) | 65 (72.2%) |
| 10 or more Apartments | 52 (40.0%) | 78 (60.0%) |
| Mobile Home / Other | 0 (0.0%) | 0 (0.0%) |
| Total | 1,406 (83.3%) | 282 (16.7%) |
Housing Structures by Number of Rooms in Chalfont borough
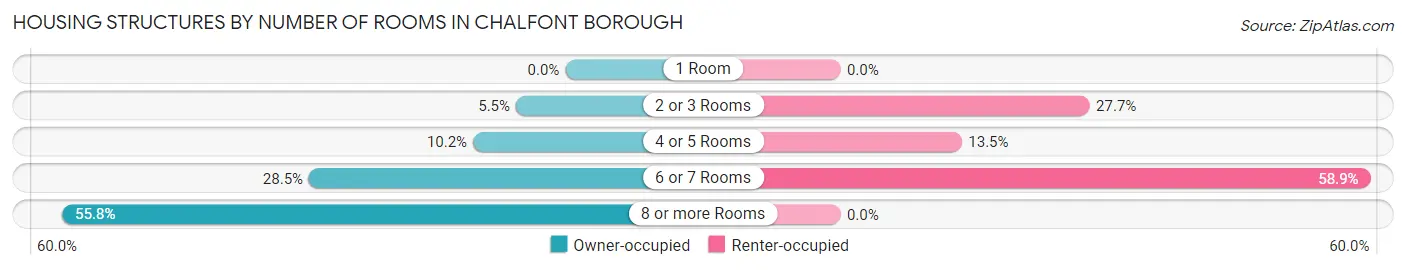
| Number of Rooms | Owner-occupied | Renter-occupied |
| 1 Room | 0 (0.0%) | 0 (0.0%) |
| 2 or 3 Rooms | 77 (5.5%) | 78 (27.7%) |
| 4 or 5 Rooms | 144 (10.2%) | 38 (13.5%) |
| 6 or 7 Rooms | 400 (28.4%) | 166 (58.9%) |
| 8 or more Rooms | 785 (55.8%) | 0 (0.0%) |
| Total | 1,406 (100.0%) | 282 (100.0%) |
Housing Structure by Heating Type in Chalfont borough
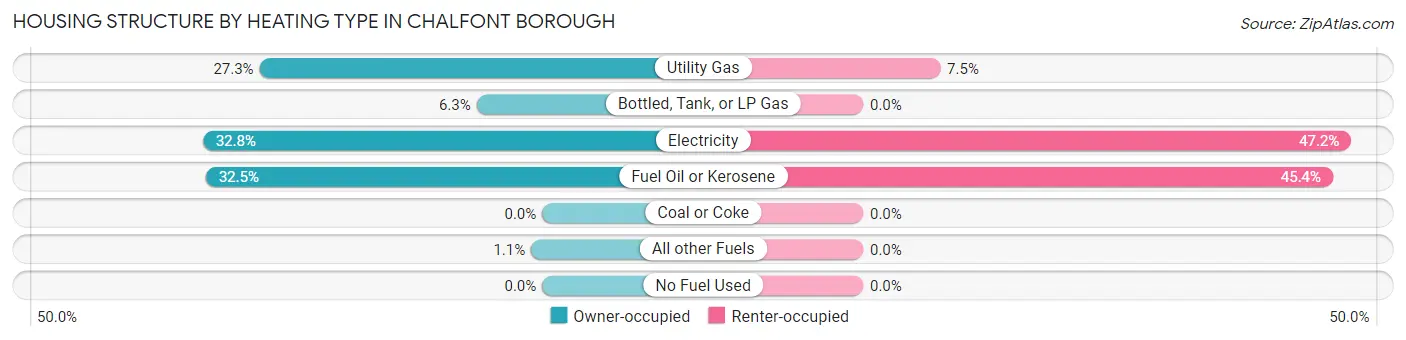
| Heating Type | Owner-occupied | Renter-occupied |
| Utility Gas | 384 (27.3%) | 21 (7.4%) |
| Bottled, Tank, or LP Gas | 89 (6.3%) | 0 (0.0%) |
| Electricity | 461 (32.8%) | 133 (47.2%) |
| Fuel Oil or Kerosene | 457 (32.5%) | 128 (45.4%) |
| Coal or Coke | 0 (0.0%) | 0 (0.0%) |
| All other Fuels | 15 (1.1%) | 0 (0.0%) |
| No Fuel Used | 0 (0.0%) | 0 (0.0%) |
| Total | 1,406 (100.0%) | 282 (100.0%) |
Household Vehicle Usage in Chalfont borough
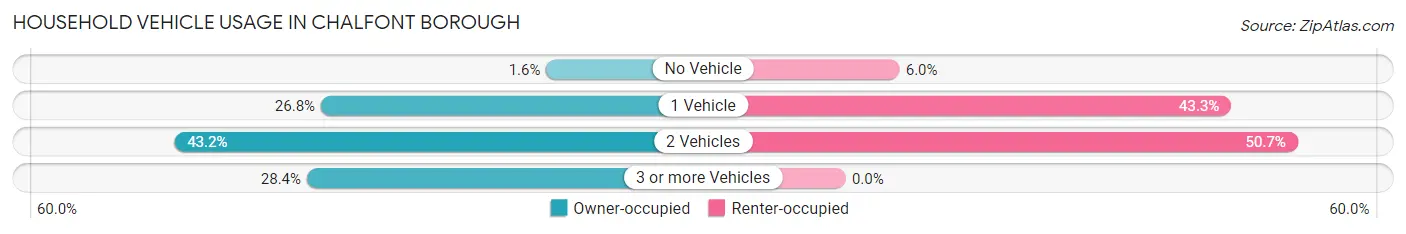
| Vehicles per Household | Owner-occupied | Renter-occupied |
| No Vehicle | 22 (1.6%) | 17 (6.0%) |
| 1 Vehicle | 377 (26.8%) | 122 (43.3%) |
| 2 Vehicles | 608 (43.2%) | 143 (50.7%) |
| 3 or more Vehicles | 399 (28.4%) | 0 (0.0%) |
| Total | 1,406 (100.0%) | 282 (100.0%) |
Real Estate & Mortgages in Chalfont borough
Real Estate and Mortgage Overview in Chalfont borough
| Characteristic | Without Mortgage | With Mortgage |
| Housing Units | 336 | 1,070 |
| Median Property Value | $398,800 | $416,700 |
| Median Household Income | $48,750 | $623 |
| Monthly Housing Costs | $713 | $322 |
| Real Estate Taxes | $4,943 | $0 |
Property Value by Mortgage Status in Chalfont borough
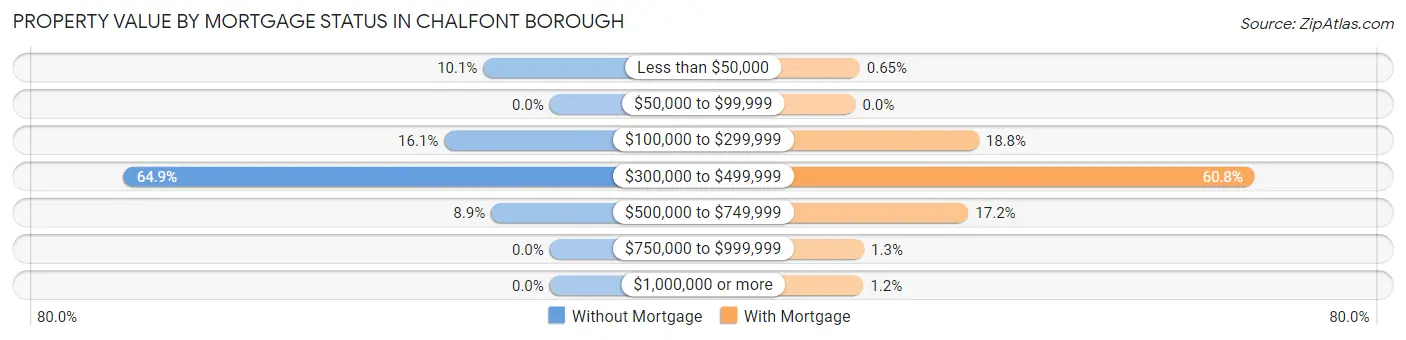
| Property Value | Without Mortgage | With Mortgage |
| Less than $50,000 | 34 (10.1%) | 7 (0.6%) |
| $50,000 to $99,999 | 0 (0.0%) | 0 (0.0%) |
| $100,000 to $299,999 | 54 (16.1%) | 201 (18.8%) |
| $300,000 to $499,999 | 218 (64.9%) | 651 (60.8%) |
| $500,000 to $749,999 | 30 (8.9%) | 184 (17.2%) |
| $750,000 to $999,999 | 0 (0.0%) | 14 (1.3%) |
| $1,000,000 or more | 0 (0.0%) | 13 (1.2%) |
| Total | 336 (100.0%) | 1,070 (100.0%) |
Household Income by Mortgage Status in Chalfont borough
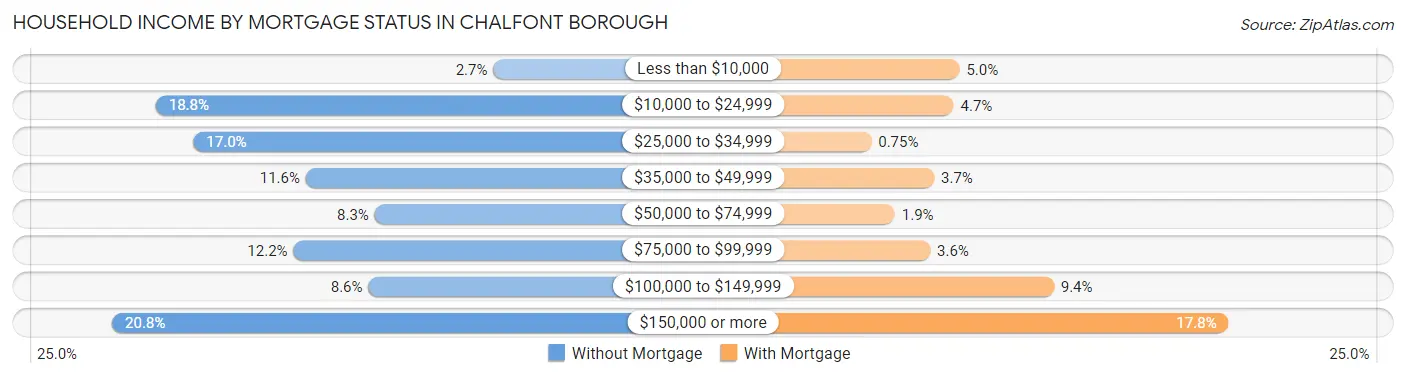
| Household Income | Without Mortgage | With Mortgage |
| Less than $10,000 | 9 (2.7%) | 53 (5.0%) |
| $10,000 to $24,999 | 63 (18.8%) | 50 (4.7%) |
| $25,000 to $34,999 | 57 (17.0%) | 8 (0.7%) |
| $35,000 to $49,999 | 39 (11.6%) | 40 (3.7%) |
| $50,000 to $74,999 | 28 (8.3%) | 20 (1.9%) |
| $75,000 to $99,999 | 41 (12.2%) | 38 (3.5%) |
| $100,000 to $149,999 | 29 (8.6%) | 101 (9.4%) |
| $150,000 or more | 70 (20.8%) | 190 (17.8%) |
| Total | 336 (100.0%) | 1,070 (100.0%) |
Property Value to Household Income Ratio in Chalfont borough
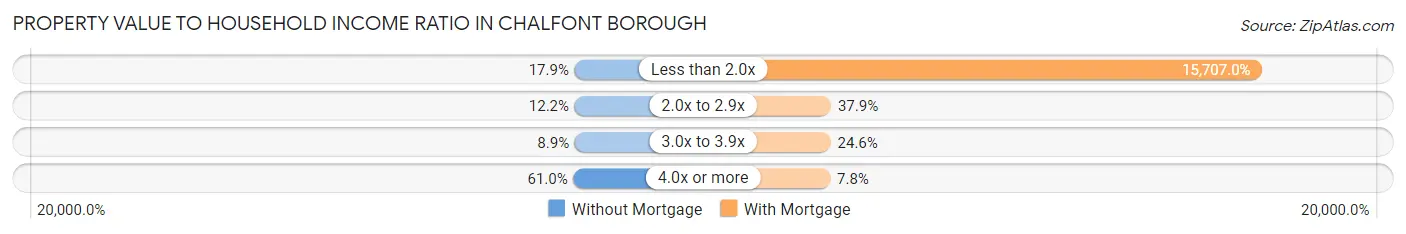
| Value-to-Income Ratio | Without Mortgage | With Mortgage |
| Less than 2.0x | 60 (17.9%) | 168,065 (15,707.0%) |
| 2.0x to 2.9x | 41 (12.2%) | 405 (37.9%) |
| 3.0x to 3.9x | 30 (8.9%) | 263 (24.6%) |
| 4.0x or more | 205 (61.0%) | 83 (7.8%) |
| Total | 336 (100.0%) | 1,070 (100.0%) |
Real Estate Taxes by Mortgage Status in Chalfont borough
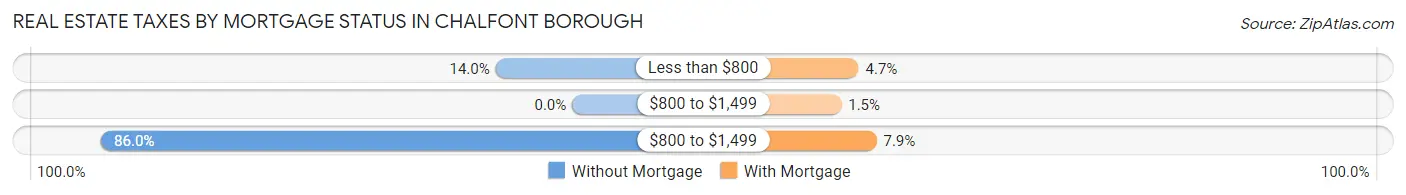
| Property Taxes | Without Mortgage | With Mortgage |
| Less than $800 | 47 (14.0%) | 50 (4.7%) |
| $800 to $1,499 | 0 (0.0%) | 16 (1.5%) |
| $800 to $1,499 | 289 (86.0%) | 85 (7.9%) |
| Total | 336 (100.0%) | 1,070 (100.0%) |
Health & Disability in Chalfont borough
Health Insurance Coverage by Age in Chalfont borough
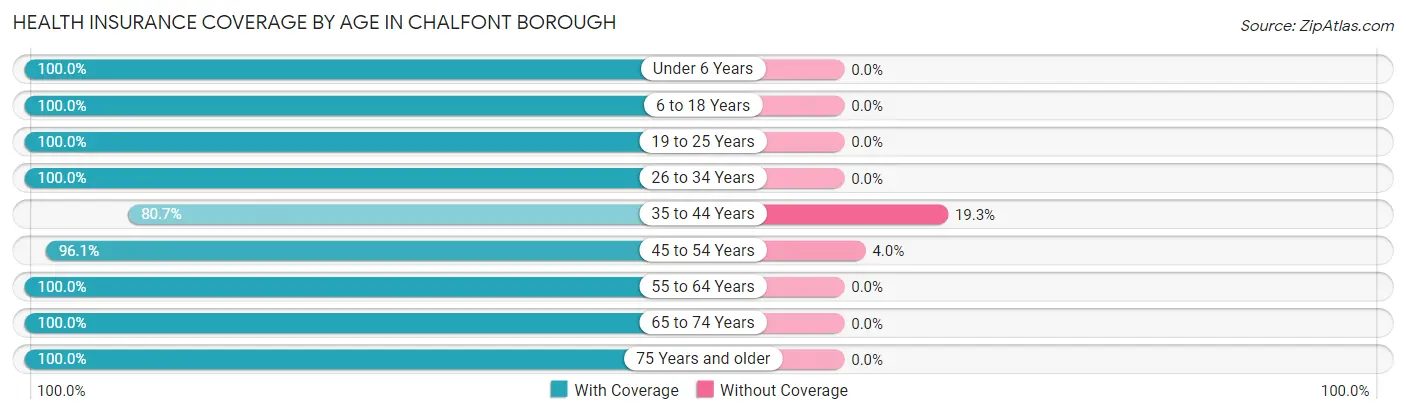
| Age Bracket | With Coverage | Without Coverage |
| Under 6 Years | 185 (100.0%) | 0 (0.0%) |
| 6 to 18 Years | 911 (100.0%) | 0 (0.0%) |
| 19 to 25 Years | 253 (100.0%) | 0 (0.0%) |
| 26 to 34 Years | 458 (100.0%) | 0 (0.0%) |
| 35 to 44 Years | 505 (80.7%) | 121 (19.3%) |
| 45 to 54 Years | 583 (96.1%) | 24 (4.0%) |
| 55 to 64 Years | 668 (100.0%) | 0 (0.0%) |
| 65 to 74 Years | 261 (100.0%) | 0 (0.0%) |
| 75 Years and older | 284 (100.0%) | 0 (0.0%) |
| Total | 4,108 (96.6%) | 145 (3.4%) |
Health Insurance Coverage by Citizenship Status in Chalfont borough

| Citizenship Status | With Coverage | Without Coverage |
| Native Born | 185 (100.0%) | 0 (0.0%) |
| Foreign Born, Citizen | 911 (100.0%) | 0 (0.0%) |
| Foreign Born, not a Citizen | 253 (100.0%) | 0 (0.0%) |
Health Insurance Coverage by Household Income in Chalfont borough
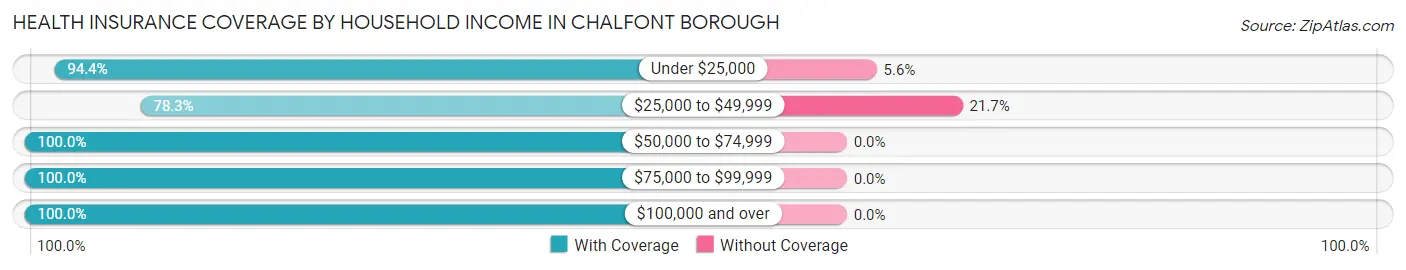
| Household Income | With Coverage | Without Coverage |
| Under $25,000 | 237 (94.4%) | 14 (5.6%) |
| $25,000 to $49,999 | 466 (78.3%) | 129 (21.7%) |
| $50,000 to $74,999 | 199 (100.0%) | 0 (0.0%) |
| $75,000 to $99,999 | 355 (100.0%) | 0 (0.0%) |
| $100,000 and over | 2,850 (100.0%) | 0 (0.0%) |
Public vs Private Health Insurance Coverage by Age in Chalfont borough
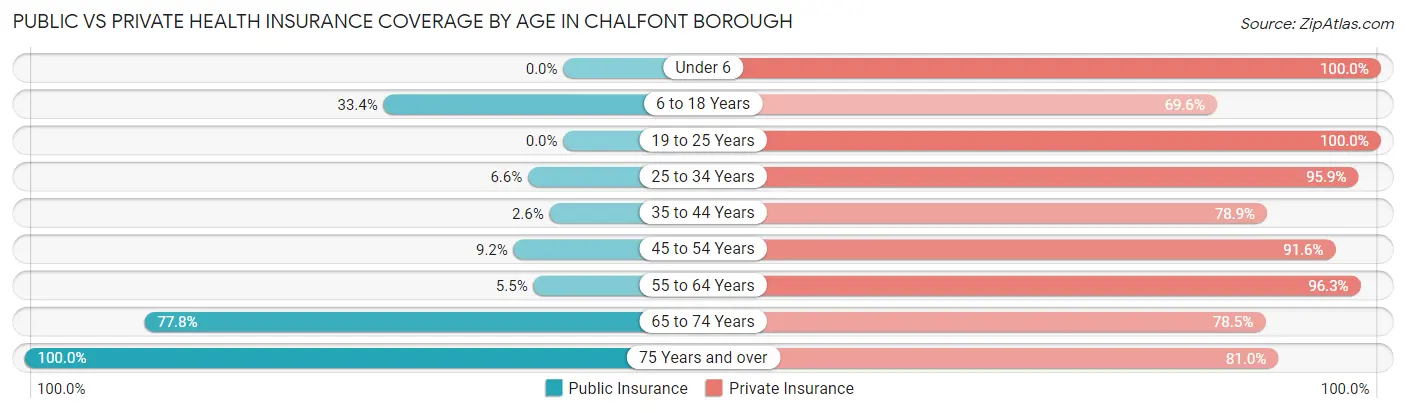
| Age Bracket | Public Insurance | Private Insurance |
| Under 6 | 0 (0.0%) | 185 (100.0%) |
| 6 to 18 Years | 304 (33.4%) | 634 (69.6%) |
| 19 to 25 Years | 0 (0.0%) | 253 (100.0%) |
| 25 to 34 Years | 30 (6.6%) | 439 (95.9%) |
| 35 to 44 Years | 16 (2.6%) | 494 (78.9%) |
| 45 to 54 Years | 56 (9.2%) | 556 (91.6%) |
| 55 to 64 Years | 37 (5.5%) | 643 (96.3%) |
| 65 to 74 Years | 203 (77.8%) | 205 (78.5%) |
| 75 Years and over | 284 (100.0%) | 230 (81.0%) |
| Total | 930 (21.9%) | 3,639 (85.6%) |
Disability Status by Sex by Age in Chalfont borough
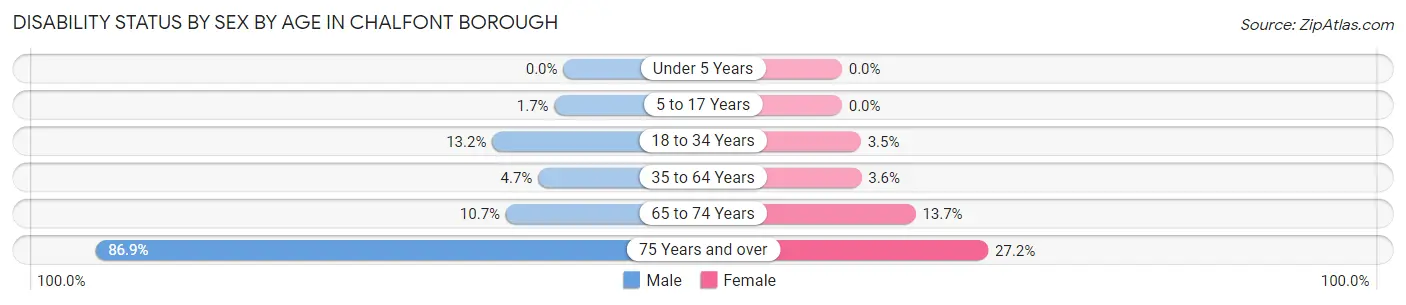
| Age Bracket | Male | Female |
| Under 5 Years | 0 (0.0%) | 0 (0.0%) |
| 5 to 17 Years | 8 (1.7%) | 0 (0.0%) |
| 18 to 34 Years | 47 (13.2%) | 14 (3.5%) |
| 35 to 64 Years | 45 (4.7%) | 34 (3.6%) |
| 65 to 74 Years | 13 (10.7%) | 19 (13.7%) |
| 75 Years and over | 106 (86.9%) | 44 (27.2%) |
Disability Class by Sex by Age in Chalfont borough
Disability Class: Hearing Difficulty
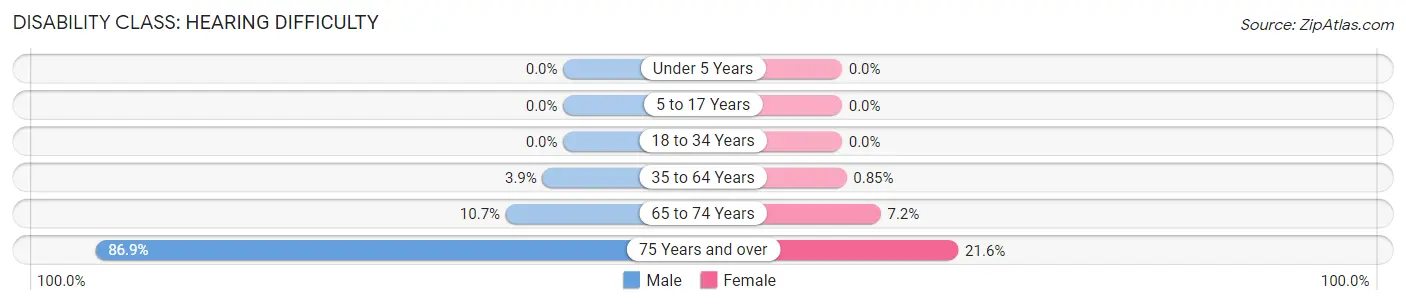
| Age Bracket | Male | Female |
| Under 5 Years | 0 (0.0%) | 0 (0.0%) |
| 5 to 17 Years | 0 (0.0%) | 0 (0.0%) |
| 18 to 34 Years | 0 (0.0%) | 0 (0.0%) |
| 35 to 64 Years | 37 (3.8%) | 8 (0.9%) |
| 65 to 74 Years | 13 (10.7%) | 10 (7.2%) |
| 75 Years and over | 106 (86.9%) | 35 (21.6%) |
Disability Class: Vision Difficulty
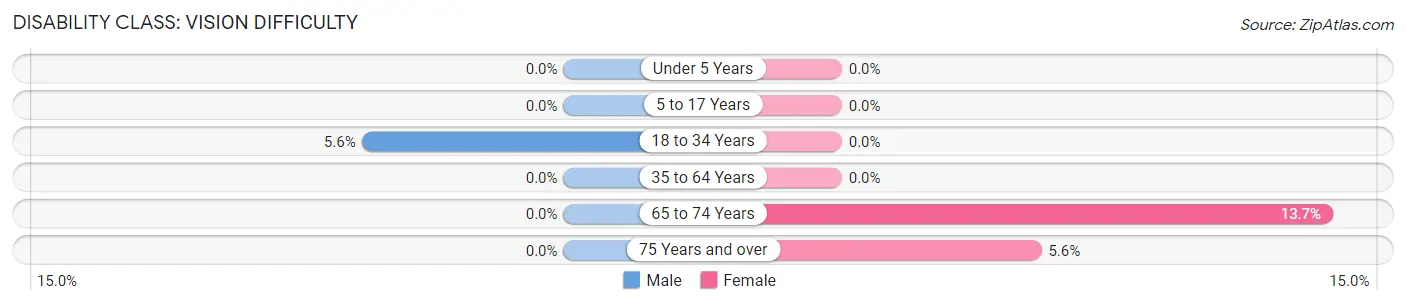
| Age Bracket | Male | Female |
| Under 5 Years | 0 (0.0%) | 0 (0.0%) |
| 5 to 17 Years | 0 (0.0%) | 0 (0.0%) |
| 18 to 34 Years | 20 (5.6%) | 0 (0.0%) |
| 35 to 64 Years | 0 (0.0%) | 0 (0.0%) |
| 65 to 74 Years | 0 (0.0%) | 19 (13.7%) |
| 75 Years and over | 0 (0.0%) | 9 (5.6%) |
Disability Class: Cognitive Difficulty
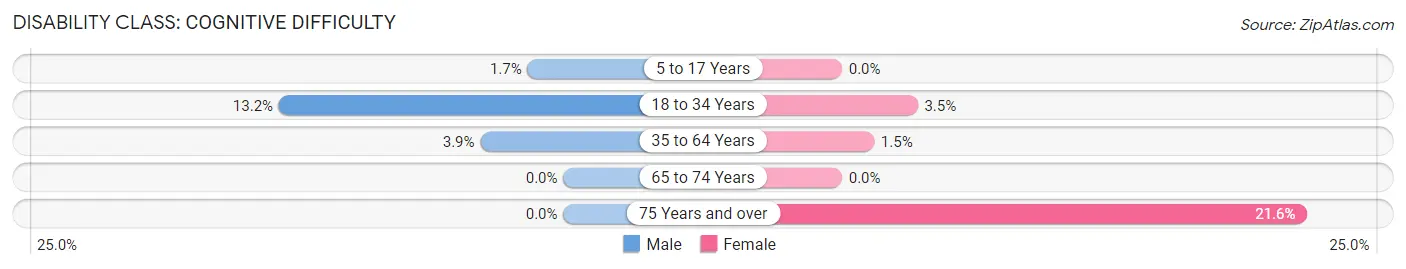
| Age Bracket | Male | Female |
| 5 to 17 Years | 8 (1.7%) | 0 (0.0%) |
| 18 to 34 Years | 47 (13.2%) | 14 (3.5%) |
| 35 to 64 Years | 37 (3.8%) | 14 (1.5%) |
| 65 to 74 Years | 0 (0.0%) | 0 (0.0%) |
| 75 Years and over | 0 (0.0%) | 35 (21.6%) |
Disability Class: Ambulatory Difficulty
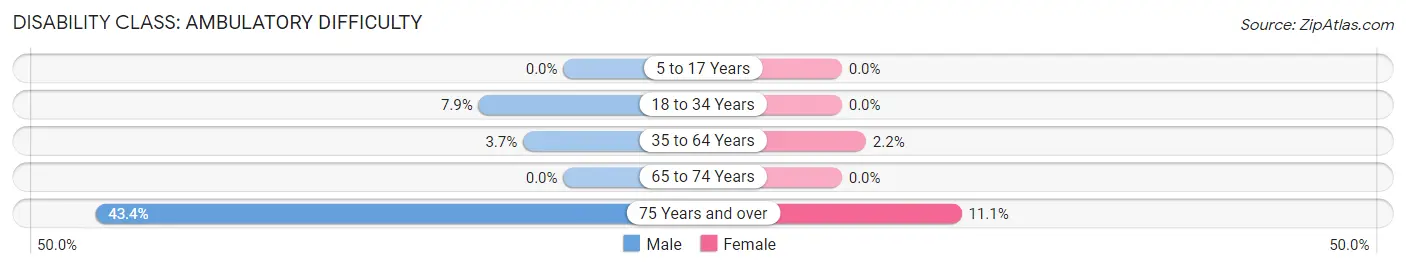
| Age Bracket | Male | Female |
| 5 to 17 Years | 0 (0.0%) | 0 (0.0%) |
| 18 to 34 Years | 28 (7.9%) | 0 (0.0%) |
| 35 to 64 Years | 36 (3.7%) | 21 (2.2%) |
| 65 to 74 Years | 0 (0.0%) | 0 (0.0%) |
| 75 Years and over | 53 (43.4%) | 18 (11.1%) |
Disability Class: Self-Care Difficulty
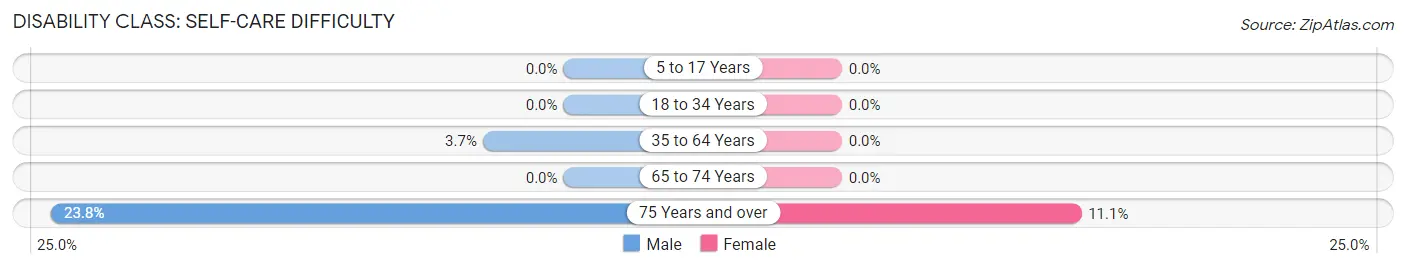
| Age Bracket | Male | Female |
| 5 to 17 Years | 0 (0.0%) | 0 (0.0%) |
| 18 to 34 Years | 0 (0.0%) | 0 (0.0%) |
| 35 to 64 Years | 36 (3.7%) | 0 (0.0%) |
| 65 to 74 Years | 0 (0.0%) | 0 (0.0%) |
| 75 Years and over | 29 (23.8%) | 18 (11.1%) |
Technology Access in Chalfont borough
Computing Device Access in Chalfont borough
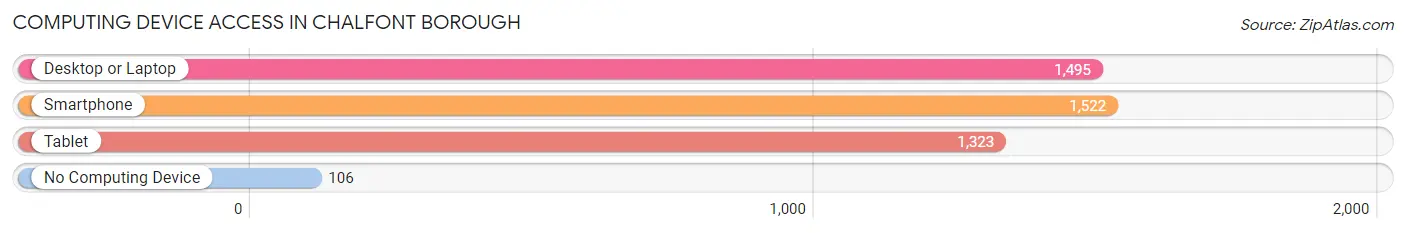
| Device Type | # Households | % Households |
| Desktop or Laptop | 1,495 | 88.6% |
| Smartphone | 1,522 | 90.2% |
| Tablet | 1,323 | 78.4% |
| No Computing Device | 106 | 6.3% |
| Total | 1,688 | 100.0% |
Internet Access in Chalfont borough
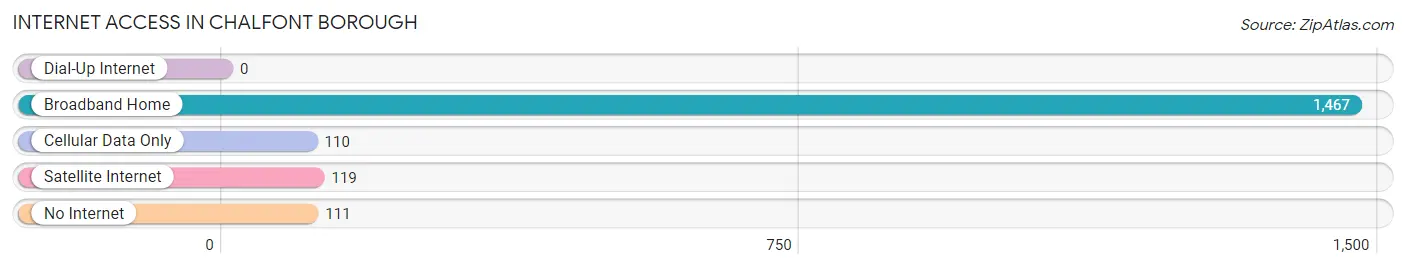
| Internet Type | # Households | % Households |
| Dial-Up Internet | 0 | 0.0% |
| Broadband Home | 1,467 | 86.9% |
| Cellular Data Only | 110 | 6.5% |
| Satellite Internet | 119 | 7.0% |
| No Internet | 111 | 6.6% |
| Total | 1,688 | 100.0% |
Chalfont borough Summary
Chalfont Borough is a small borough located in Bucks County, Pennsylvania. It is situated in the heart of the Delaware Valley, approximately 25 miles north of Philadelphia. The borough is bordered by New Britain Township to the north, Hilltown Township to the east, New Britain Borough to the south, and Warrington Township to the west. As of the 2010 census, the population of Chalfont Borough was 4,009.
History
The area that is now Chalfont Borough was originally inhabited by the Lenape Native Americans. The first European settlers arrived in the area in the late 17th century. The area was part of a larger tract of land known as the “Chalfont Purchase”, which was purchased from the Lenape in 1683 by William Penn. The area was then divided into several smaller tracts of land, one of which was known as the “Chalfont Tract”. This tract was purchased by Thomas Chalfont in 1717, and the area became known as “Chalfont”.
The area remained largely rural until the mid-19th century, when the North Pennsylvania Railroad was built through the area. This brought an influx of new residents and businesses to the area, and the population of Chalfont began to grow. In 1872, the area was incorporated as a borough.
Geography
Chalfont Borough is located at 40°17'N 75°14'W (40.2833, -75.2333). It has a total area of 1.2 square miles, all of which is land. The borough is located in the Delaware Valley, approximately 25 miles north of Philadelphia. It is bordered by New Britain Township to the north, Hilltown Township to the east, New Britain Borough to the south, and Warrington Township to the west.
The borough is located in a hilly area, with elevations ranging from approximately 200 to 400 feet above sea level. The borough is drained by the East Branch of the Perkiomen Creek, which flows through the center of the borough.
Economy
The economy of Chalfont Borough is largely based on small businesses and services. The borough is home to several small businesses, including restaurants, retail stores, and professional services. The borough is also home to several industrial and manufacturing businesses, including a plastics manufacturer and a printing company.
The borough is also home to several large employers, including a medical device manufacturer, a pharmaceutical company, and a food processing plant. The borough is also home to several educational institutions, including a community college and a technical school.
Demographics
As of the 2010 census, the population of Chalfont Borough was 4,009. The racial makeup of the borough was 94.3% White, 1.7% African American, 0.2% Native American, 1.3% Asian, 0.1% Pacific Islander, 1.2% from other races, and 1.3% from two or more races. Hispanic or Latino of any race were 3.3% of the population.
The median household income in Chalfont Borough was $76,944, and the median family income was $87,813. The per capita income for the borough was $35,945. About 3.2% of families and 4.2% of the population were below the poverty line, including 5.2% of those under age 18 and 4.2% of those age 65 or over.
Common Questions
What is Per Capita Income in Chalfont borough?
Per Capita income in Chalfont borough is $54,337.
What is the Median Family Income in Chalfont borough?
Median Family Income in Chalfont borough is $154,783.
What is the Median Household income in Chalfont borough?
Median Household Income in Chalfont borough is $118,871.
What is Income or Wage Gap in Chalfont borough?
Income or Wage Gap in Chalfont borough is 31.7%.
Women in Chalfont borough earn 68.3 cents for every dollar earned by a man.
What is Inequality or Gini Index in Chalfont borough?
Inequality or Gini Index in Chalfont borough is 0.44.
What is the Total Population of Chalfont borough?
Total Population of Chalfont borough is 4,259.
What is the Total Male Population of Chalfont borough?
Total Male Population of Chalfont borough is 2,141.
What is the Total Female Population of Chalfont borough?
Total Female Population of Chalfont borough is 2,118.
What is the Ratio of Males per 100 Females in Chalfont borough?
There are 101.09 Males per 100 Females in Chalfont borough.
What is the Ratio of Females per 100 Males in Chalfont borough?
There are 98.93 Females per 100 Males in Chalfont borough.
What is the Median Population Age in Chalfont borough?
Median Population Age in Chalfont borough is 41.7 Years.
What is the Average Family Size in Chalfont borough
Average Family Size in Chalfont borough is 2.9 People.
What is the Average Household Size in Chalfont borough
Average Household Size in Chalfont borough is 2.5 People.
How Large is the Labor Force in Chalfont borough?
There are 2,644 People in the Labor Forcein in Chalfont borough.
What is the Percentage of People in the Labor Force in Chalfont borough?
74.8% of People are in the Labor Force in Chalfont borough.
What is the Unemployment Rate in Chalfont borough?
Unemployment Rate in Chalfont borough is 7.5%.