Zip Codes with the Highest Percentage of Population Employed in Life, Physical & Social Science in Pennsylvania
RELATED REPORTS & OPTIONS
Life, Physical & Social Science
Pennsylvania
Compare Zip Codes
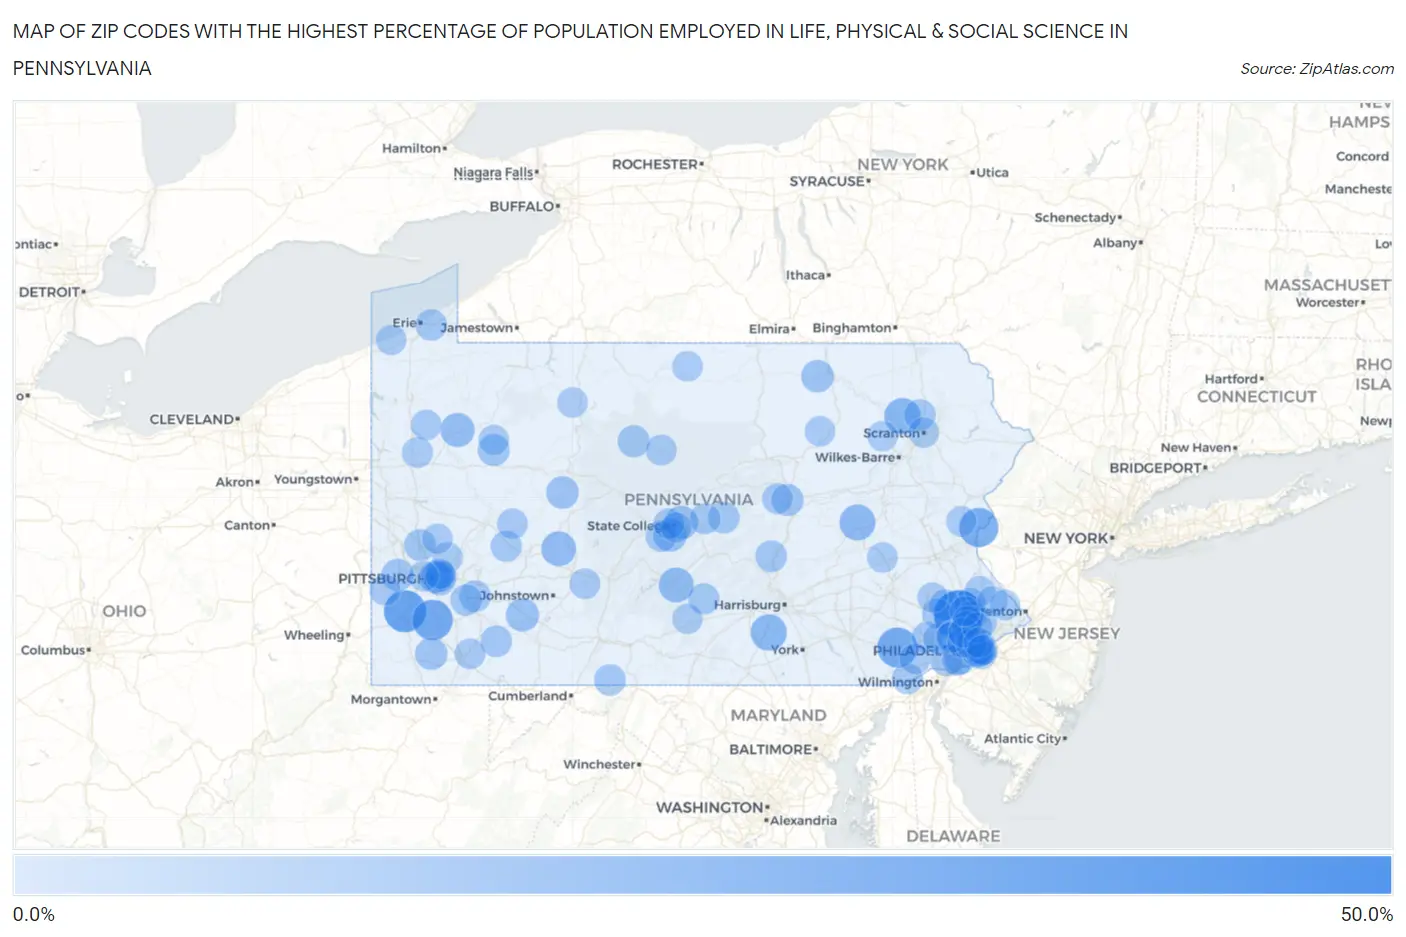
Map of Zip Codes with the Highest Percentage of Population Employed in Life, Physical & Social Science in Pennsylvania
0.0%
50.0%
Zip Codes with the Highest Percentage of Population Employed in Life, Physical & Social Science in Pennsylvania
| Zip Code | % Employed | vs State | vs National | |
| 1. | 19490 | 41.7% | 1.2%(+40.5)#1 | 1.1%(+40.6)#11 |
| 2. | 15347 | 26.7% | 1.2%(+25.4)#2 | 1.1%(+25.6)#38 |
| 3. | 15366 | 23.1% | 1.2%(+21.9)#3 | 1.1%(+22.0)#45 |
| 4. | 19369 | 22.4% | 1.2%(+21.2)#4 | 1.1%(+21.3)#49 |
| 5. | 18063 | 20.6% | 1.2%(+19.3)#5 | 1.1%(+19.5)#57 |
| 6. | 18625 | 15.1% | 1.2%(+13.8)#6 | 1.1%(+14.0)#101 |
| 7. | 17323 | 14.5% | 1.2%(+13.3)#7 | 1.1%(+13.4)#110 |
| 8. | 17946 | 14.0% | 1.2%(+12.7)#8 | 1.1%(+12.9)#118 |
| 9. | 17075 | 11.9% | 1.2%(+10.7)#9 | 1.1%(+10.8)#146 |
| 10. | 15710 | 11.5% | 1.2%(+10.3)#10 | 1.1%(+10.4)#153 |
| 11. | 16343 | 10.4% | 1.2%(+9.19)#11 | 1.1%(+9.33)#197 |
| 12. | 16868 | 9.2% | 1.2%(+7.95)#12 | 1.1%(+8.08)#248 |
| 13. | 16851 | 9.1% | 1.2%(+7.90)#13 | 1.1%(+8.03)#251 |
| 14. | 15655 | 8.6% | 1.2%(+7.38)#14 | 1.1%(+7.51)#276 |
| 15. | 15863 | 7.3% | 1.2%(+6.05)#15 | 1.1%(+6.18)#383 |
| 16. | 18814 | 7.2% | 1.2%(+6.02)#16 | 1.1%(+6.16)#386 |
| 17. | 15126 | 7.1% | 1.2%(+5.84)#17 | 1.1%(+5.97)#400 |
| 18. | 15357 | 6.8% | 1.2%(+5.59)#18 | 1.1%(+5.72)#425 |
| 19. | 17850 | 6.5% | 1.2%(+5.28)#19 | 1.1%(+5.42)#471 |
| 20. | 15232 | 6.3% | 1.2%(+5.08)#20 | 1.1%(+5.21)#503 |
| 21. | 15832 | 6.2% | 1.2%(+5.03)#21 | 1.1%(+5.16)#512 |
| 22. | 16334 | 6.2% | 1.2%(+4.96)#22 | 1.1%(+5.09)#519 |
| 23. | 19017 | 6.0% | 1.2%(+4.78)#23 | 1.1%(+4.91)#551 |
| 24. | 19096 | 5.8% | 1.2%(+4.61)#24 | 1.1%(+4.74)#570 |
| 25. | 15086 | 5.8% | 1.2%(+4.57)#25 | 1.1%(+4.71)#578 |
| 26. | 15213 | 5.7% | 1.2%(+4.45)#26 | 1.1%(+4.58)#594 |
| 27. | 17045 | 5.6% | 1.2%(+4.42)#27 | 1.1%(+4.55)#603 |
| 28. | 19341 | 5.5% | 1.2%(+4.26)#28 | 1.1%(+4.39)#630 |
| 29. | 15634 | 5.4% | 1.2%(+4.21)#29 | 1.1%(+4.34)#643 |
| 30. | 15469 | 5.4% | 1.2%(+4.21)#30 | 1.1%(+4.34)#646 |
| 31. | 18471 | 5.4% | 1.2%(+4.13)#31 | 1.1%(+4.26)#664 |
| 32. | 19127 | 5.3% | 1.2%(+4.13)#32 | 1.1%(+4.26)#665 |
| 33. | 15691 | 5.3% | 1.2%(+4.10)#33 | 1.1%(+4.23)#680 |
| 34. | 17211 | 5.3% | 1.2%(+4.04)#34 | 1.1%(+4.17)#694 |
| 35. | 16832 | 5.3% | 1.2%(+4.04)#35 | 1.1%(+4.17)#696 |
| 36. | 19405 | 5.1% | 1.2%(+3.88)#36 | 1.1%(+4.01)#735 |
| 37. | 19103 | 5.1% | 1.2%(+3.83)#37 | 1.1%(+3.96)#745 |
| 38. | 16563 | 5.1% | 1.2%(+3.83)#38 | 1.1%(+3.96)#746 |
| 39. | 19104 | 5.0% | 1.2%(+3.77)#39 | 1.1%(+3.91)#762 |
| 40. | 19072 | 4.9% | 1.2%(+3.66)#40 | 1.1%(+3.79)#800 |
| 41. | 16865 | 4.7% | 1.2%(+3.52)#41 | 1.1%(+3.65)#834 |
| 42. | 18915 | 4.7% | 1.2%(+3.49)#42 | 1.1%(+3.62)#846 |
| 43. | 19355 | 4.6% | 1.2%(+3.38)#43 | 1.1%(+3.51)#884 |
| 44. | 17071 | 4.5% | 1.2%(+3.32)#44 | 1.1%(+3.45)#912 |
| 45. | 15774 | 4.4% | 1.2%(+3.22)#45 | 1.1%(+3.36)#945 |
| 46. | 19025 | 4.4% | 1.2%(+3.18)#46 | 1.1%(+3.31)#965 |
| 47. | 15217 | 4.3% | 1.2%(+3.07)#47 | 1.1%(+3.20)#1,006 |
| 48. | 19350 | 4.2% | 1.2%(+2.99)#48 | 1.1%(+3.12)#1,042 |
| 49. | 19081 | 4.2% | 1.2%(+2.98)#49 | 1.1%(+3.11)#1,044 |
| 50. | 19437 | 4.2% | 1.2%(+2.94)#50 | 1.1%(+3.08)#1,065 |
| 51. | 19086 | 4.1% | 1.2%(+2.91)#51 | 1.1%(+3.04)#1,082 |
| 52. | 19473 | 4.1% | 1.2%(+2.90)#52 | 1.1%(+3.03)#1,088 |
| 53. | 16875 | 4.1% | 1.2%(+2.89)#53 | 1.1%(+3.02)#1,093 |
| 54. | 15054 | 4.0% | 1.2%(+2.80)#54 | 1.1%(+2.93)#1,139 |
| 55. | 16133 | 4.0% | 1.2%(+2.74)#55 | 1.1%(+2.87)#1,177 |
| 56. | 19468 | 3.9% | 1.2%(+2.70)#56 | 1.1%(+2.83)#1,201 |
| 57. | 17778 | 3.9% | 1.2%(+2.70)#57 | 1.1%(+2.83)#1,204 |
| 58. | 19375 | 3.9% | 1.2%(+2.67)#58 | 1.1%(+2.81)#1,219 |
| 59. | 16803 | 3.9% | 1.2%(+2.64)#59 | 1.1%(+2.77)#1,227 |
| 60. | 19004 | 3.9% | 1.2%(+2.64)#60 | 1.1%(+2.77)#1,228 |
| 61. | 17837 | 3.8% | 1.2%(+2.62)#61 | 1.1%(+2.76)#1,233 |
| 62. | 19087 | 3.8% | 1.2%(+2.59)#62 | 1.1%(+2.72)#1,257 |
| 63. | 19333 | 3.8% | 1.2%(+2.59)#63 | 1.1%(+2.72)#1,258 |
| 64. | 15024 | 3.8% | 1.2%(+2.56)#64 | 1.1%(+2.70)#1,272 |
| 65. | 19147 | 3.7% | 1.2%(+2.44)#65 | 1.1%(+2.57)#1,337 |
| 66. | 16244 | 3.6% | 1.2%(+2.35)#66 | 1.1%(+2.48)#1,381 |
| 67. | 19130 | 3.6% | 1.2%(+2.35)#67 | 1.1%(+2.48)#1,385 |
| 68. | 16801 | 3.6% | 1.2%(+2.35)#68 | 1.1%(+2.48)#1,386 |
| 69. | 19146 | 3.5% | 1.2%(+2.31)#69 | 1.1%(+2.44)#1,403 |
| 70. | 16311 | 3.5% | 1.2%(+2.29)#70 | 1.1%(+2.42)#1,417 |
| 71. | 15208 | 3.5% | 1.2%(+2.28)#71 | 1.1%(+2.41)#1,427 |
| 72. | 19102 | 3.5% | 1.2%(+2.26)#72 | 1.1%(+2.39)#1,441 |
| 73. | 15456 | 3.5% | 1.2%(+2.25)#73 | 1.1%(+2.38)#1,446 |
| 74. | 19422 | 3.5% | 1.2%(+2.24)#74 | 1.1%(+2.38)#1,449 |
| 75. | 15925 | 3.4% | 1.2%(+2.23)#75 | 1.1%(+2.36)#1,462 |
| 76. | 18923 | 3.4% | 1.2%(+2.18)#76 | 1.1%(+2.31)#1,500 |
| 77. | 19549 | 3.4% | 1.2%(+2.16)#77 | 1.1%(+2.29)#1,513 |
| 78. | 19462 | 3.4% | 1.2%(+2.15)#78 | 1.1%(+2.28)#1,515 |
| 79. | 16948 | 3.4% | 1.2%(+2.14)#79 | 1.1%(+2.27)#1,523 |
| 80. | 18503 | 3.3% | 1.2%(+2.09)#80 | 1.1%(+2.22)#1,568 |
| 81. | 19041 | 3.2% | 1.2%(+1.97)#81 | 1.1%(+2.10)#1,672 |
| 82. | 18925 | 3.2% | 1.2%(+1.97)#82 | 1.1%(+2.10)#1,675 |
| 83. | 15206 | 3.2% | 1.2%(+1.95)#83 | 1.1%(+2.09)#1,684 |
| 84. | 19066 | 3.2% | 1.2%(+1.93)#84 | 1.1%(+2.06)#1,704 |
| 85. | 17731 | 3.1% | 1.2%(+1.90)#85 | 1.1%(+2.03)#1,729 |
| 86. | 16326 | 3.1% | 1.2%(+1.88)#86 | 1.1%(+2.01)#1,751 |
| 87. | 16059 | 3.1% | 1.2%(+1.87)#87 | 1.1%(+2.00)#1,775 |
| 88. | 19428 | 3.1% | 1.2%(+1.86)#88 | 1.1%(+1.99)#1,781 |
| 89. | 19075 | 3.1% | 1.2%(+1.85)#89 | 1.1%(+1.99)#1,785 |
| 90. | 18091 | 3.1% | 1.2%(+1.84)#90 | 1.1%(+1.98)#1,792 |
| 91. | 16423 | 3.0% | 1.2%(+1.83)#91 | 1.1%(+1.96)#1,819 |
| 92. | 16735 | 3.0% | 1.2%(+1.82)#92 | 1.1%(+1.96)#1,825 |
| 93. | 19129 | 3.0% | 1.2%(+1.80)#93 | 1.1%(+1.94)#1,845 |
| 94. | 18940 | 3.0% | 1.2%(+1.79)#94 | 1.1%(+1.92)#1,863 |
| 95. | 17220 | 3.0% | 1.2%(+1.76)#95 | 1.1%(+1.89)#1,894 |
| 96. | 18618 | 3.0% | 1.2%(+1.75)#96 | 1.1%(+1.88)#1,907 |
| 97. | 15204 | 3.0% | 1.2%(+1.73)#97 | 1.1%(+1.86)#1,931 |
| 98. | 19123 | 2.9% | 1.2%(+1.71)#98 | 1.1%(+1.84)#1,956 |
| 99. | 19446 | 2.9% | 1.2%(+1.71)#99 | 1.1%(+1.84)#1,958 |
| 100. | 19525 | 2.9% | 1.2%(+1.71)#100 | 1.1%(+1.84)#1,964 |
Common Questions
What are the Top 10 Zip Codes with the Highest Percentage of Population Employed in Life, Physical & Social Science in Pennsylvania?
Top 10 Zip Codes with the Highest Percentage of Population Employed in Life, Physical & Social Science in Pennsylvania are:
What zip code has the Highest Percentage of Population Employed in Life, Physical & Social Science in Pennsylvania?
19490 has the Highest Percentage of Population Employed in Life, Physical & Social Science in Pennsylvania with 41.7%.
What is the Percentage of Population Employed in Life, Physical & Social Science in the State of Pennsylvania?
Percentage of Population Employed in Life, Physical & Social Science in Pennsylvania is 1.2%.
What is the Percentage of Population Employed in Life, Physical & Social Science in the United States?
Percentage of Population Employed in Life, Physical & Social Science in the United States is 1.1%.