Kempton, PA Map & Demographics
Kempton Map
Kempton Overview
$38,570
PER CAPITA INCOME
$142,083
AVG FAMILY INCOME
$105,833
AVG HOUSEHOLD INCOME
12.8%
WAGE / INCOME GAP [ % ]
87.2¢/ $1
WAGE / INCOME GAP [ $ ]
0.32
INEQUALITY / GINI INDEX
158
TOTAL POPULATION
87
MALE POPULATION
71
FEMALE POPULATION
122.54
MALES / 100 FEMALES
81.61
FEMALES / 100 MALES
31.7
MEDIAN AGE
3.7
AVG FAMILY SIZE
2.7
AVG HOUSEHOLD SIZE
84
LABOR FORCE [ PEOPLE ]
72.4%
PERCENT IN LABOR FORCE
Kempton Zip Codes
Income in Kempton
Income Overview in Kempton
Per Capita Income in Kempton is $38,570, while median incomes of families and households are $142,083 and $105,833 respectively.
| Characteristic | Number | Measure |
| Per Capita Income | 158 | $38,570 |
| Median Family Income | 33 | $142,083 |
| Mean Family Income | 33 | $123,345 |
| Median Household Income | 58 | $105,833 |
| Mean Household Income | 58 | $108,826 |
| Income Deficit | 33 | $0 |
| Wage / Income Gap (%) | 158 | 12.82% |
| Wage / Income Gap ($) | 158 | 87.18¢ per $1 |
| Gini / Inequality Index | 158 | 0.32 |
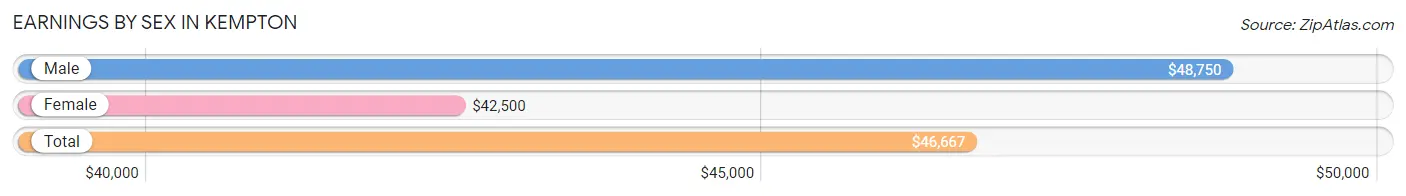
Earnings by Sex in Kempton
Average Earnings in Kempton are $46,667, $48,750 for men and $42,500 for women, a difference of 12.8%.
| Sex | Number | Average Earnings |
| Male | 62 (59.6%) | $48,750 |
| Female | 42 (40.4%) | $42,500 |
| Total | 104 (100.0%) | $46,667 |
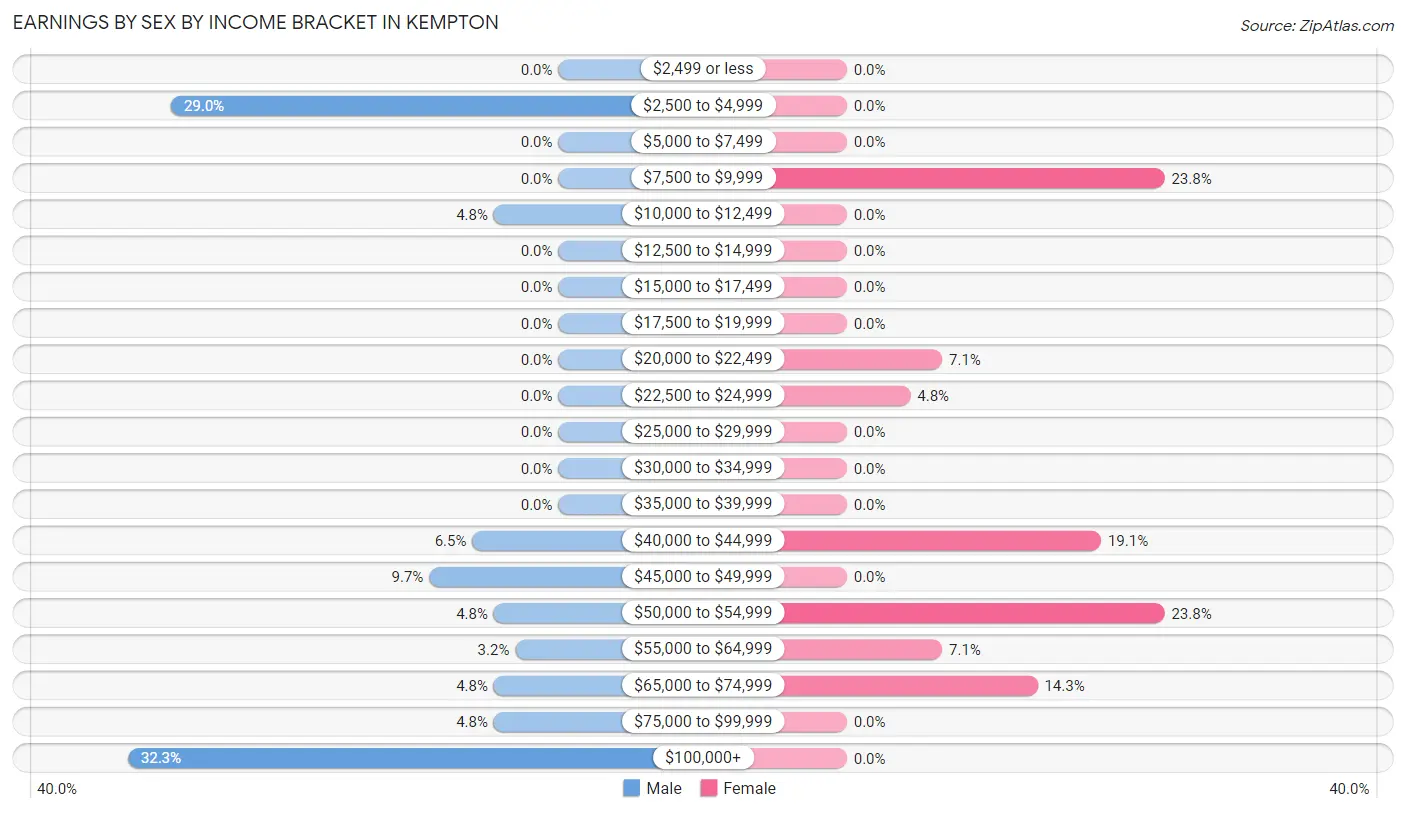
Earnings by Sex by Income Bracket in Kempton
The most common earnings brackets in Kempton are $100,000+ for men (20 | 32.3%) and $7,500 to $9,999 for women (10 | 23.8%).
| Income | Male | Female |
| $2,499 or less | 0 (0.0%) | 0 (0.0%) |
| $2,500 to $4,999 | 18 (29.0%) | 0 (0.0%) |
| $5,000 to $7,499 | 0 (0.0%) | 0 (0.0%) |
| $7,500 to $9,999 | 0 (0.0%) | 10 (23.8%) |
| $10,000 to $12,499 | 3 (4.8%) | 0 (0.0%) |
| $12,500 to $14,999 | 0 (0.0%) | 0 (0.0%) |
| $15,000 to $17,499 | 0 (0.0%) | 0 (0.0%) |
| $17,500 to $19,999 | 0 (0.0%) | 0 (0.0%) |
| $20,000 to $22,499 | 0 (0.0%) | 3 (7.1%) |
| $22,500 to $24,999 | 0 (0.0%) | 2 (4.8%) |
| $25,000 to $29,999 | 0 (0.0%) | 0 (0.0%) |
| $30,000 to $34,999 | 0 (0.0%) | 0 (0.0%) |
| $35,000 to $39,999 | 0 (0.0%) | 0 (0.0%) |
| $40,000 to $44,999 | 4 (6.5%) | 8 (19.1%) |
| $45,000 to $49,999 | 6 (9.7%) | 0 (0.0%) |
| $50,000 to $54,999 | 3 (4.8%) | 10 (23.8%) |
| $55,000 to $64,999 | 2 (3.2%) | 3 (7.1%) |
| $65,000 to $74,999 | 3 (4.8%) | 6 (14.3%) |
| $75,000 to $99,999 | 3 (4.8%) | 0 (0.0%) |
| $100,000+ | 20 (32.3%) | 0 (0.0%) |
| Total | 62 (100.0%) | 42 (100.0%) |
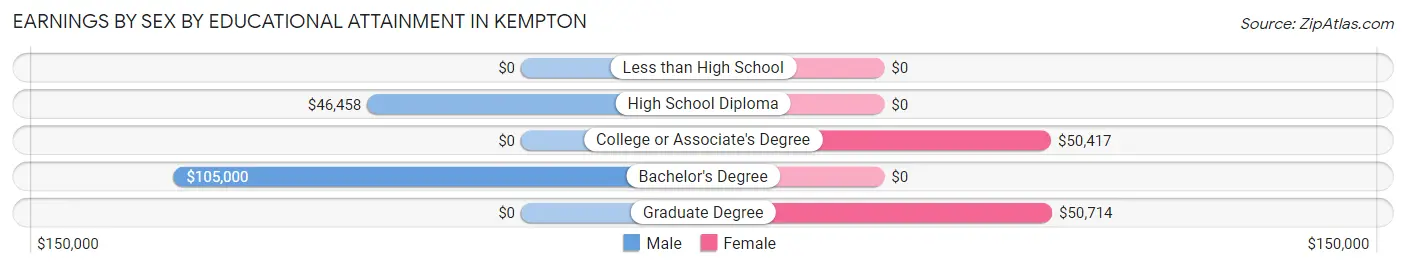
Earnings by Sex by Educational Attainment in Kempton
Average earnings in Kempton are $85,833 for men and $42,500 for women, a difference of 50.5%. Men with an educational attainment of bachelor's degree enjoy the highest average annual earnings of $105,000, while those with high school diploma education earn the least with $46,458. Women with an educational attainment of graduate degree earn the most with the average annual earnings of $50,714, while those with college or associate's degree education have the smallest earnings of $50,417.
| Educational Attainment | Male Income | Female Income |
| Less than High School | - | - |
| High School Diploma | $46,458 | $0 |
| College or Associate's Degree | - | - |
| Bachelor's Degree | $105,000 | $0 |
| Graduate Degree | - | - |
| Total | $85,833 | $42,500 |
Family Income in Kempton
Family Income Brackets in Kempton
According to the Kempton family income data, there are 13 families falling into the $150,000 to $199,999 income range, which is the most common income bracket and makes up 39.4% of all families.
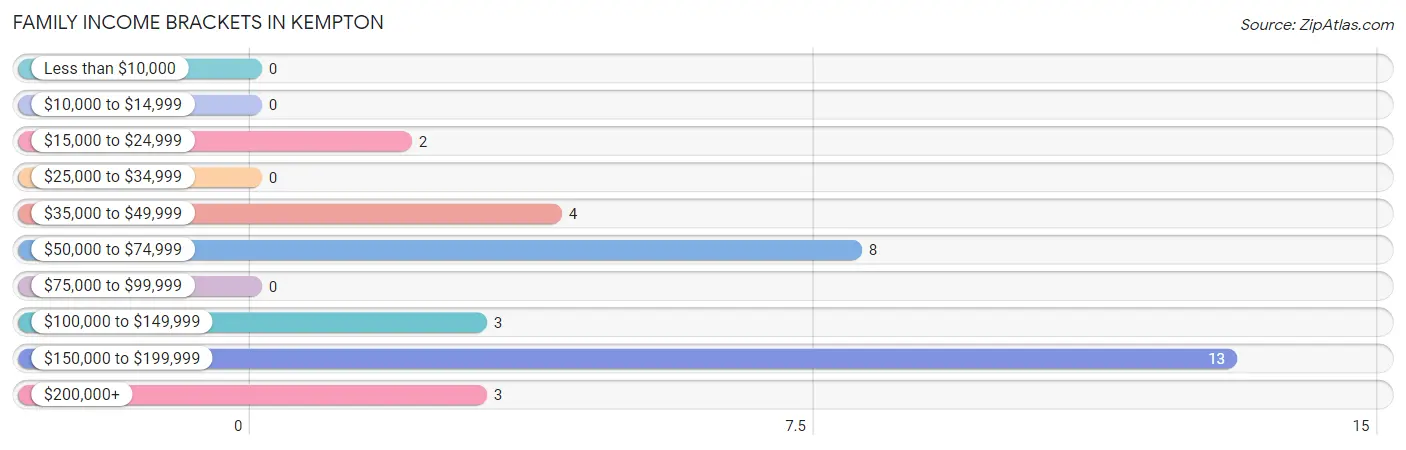
| Income Bracket | # Families | % Families |
| Less than $10,000 | 0 | 0.0% |
| $10,000 to $14,999 | 0 | 0.0% |
| $15,000 to $24,999 | 2 | 6.1% |
| $25,000 to $34,999 | 0 | 0.0% |
| $35,000 to $49,999 | 4 | 12.1% |
| $50,000 to $74,999 | 8 | 24.2% |
| $75,000 to $99,999 | 0 | 0.0% |
| $100,000 to $149,999 | 3 | 9.1% |
| $150,000 to $199,999 | 13 | 39.4% |
| $200,000+ | 3 | 9.1% |
Family Income by Famaliy Size in Kempton
4-person families (9 | 27.3%) account for the highest median family income in Kempton with $151,250 per family, while 4-person families (9 | 27.3%) have the highest median income of $37,812 per family member.
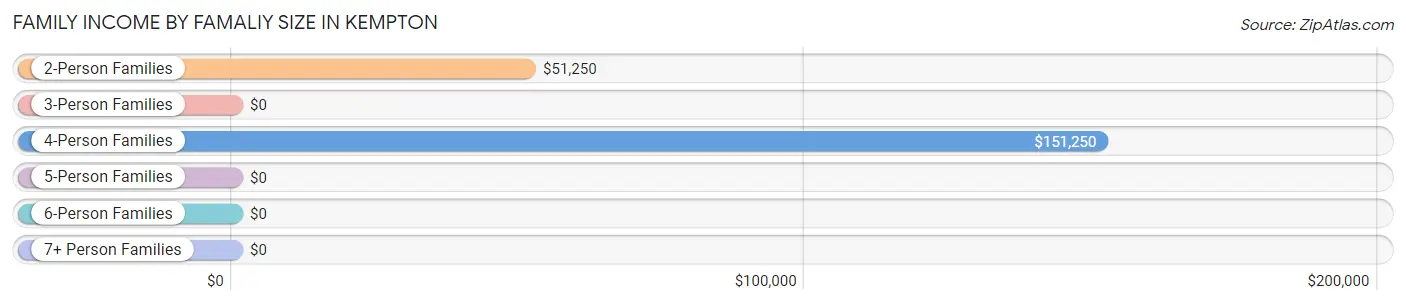
| Income Bracket | # Families | Median Income |
| 2-Person Families | 12 (36.4%) | $51,250 |
| 3-Person Families | 2 (6.1%) | $0 |
| 4-Person Families | 9 (27.3%) | $151,250 |
| 5-Person Families | 0 (0.0%) | $0 |
| 6-Person Families | 0 (0.0%) | $0 |
| 7+ Person Families | 10 (30.3%) | $0 |
| Total | 33 (100.0%) | $142,083 |
Family Income by Number of Earners in Kempton
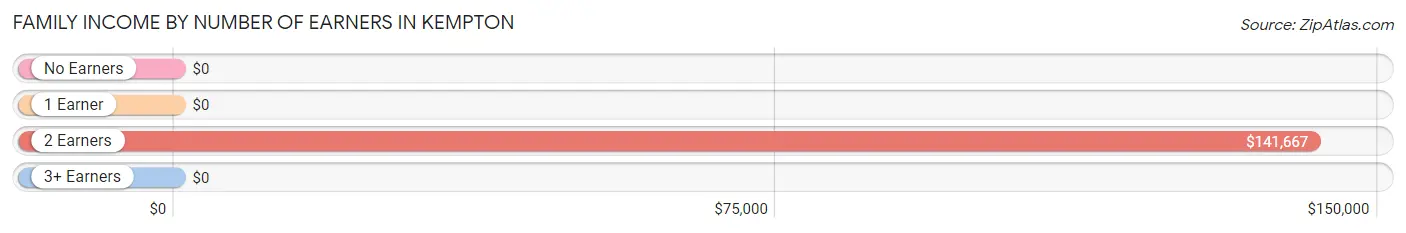
| Number of Earners | # Families | Median Income |
| No Earners | 2 (6.1%) | $0 |
| 1 Earner | 7 (21.2%) | $0 |
| 2 Earners | 14 (42.4%) | $141,667 |
| 3+ Earners | 10 (30.3%) | $0 |
| Total | 33 (100.0%) | $142,083 |
Household Income in Kempton
Household Income Brackets in Kempton
With 21 households falling in the category, the $150,000 to $199,999 income range is the most frequent in Kempton, accounting for 36.2% of all households.
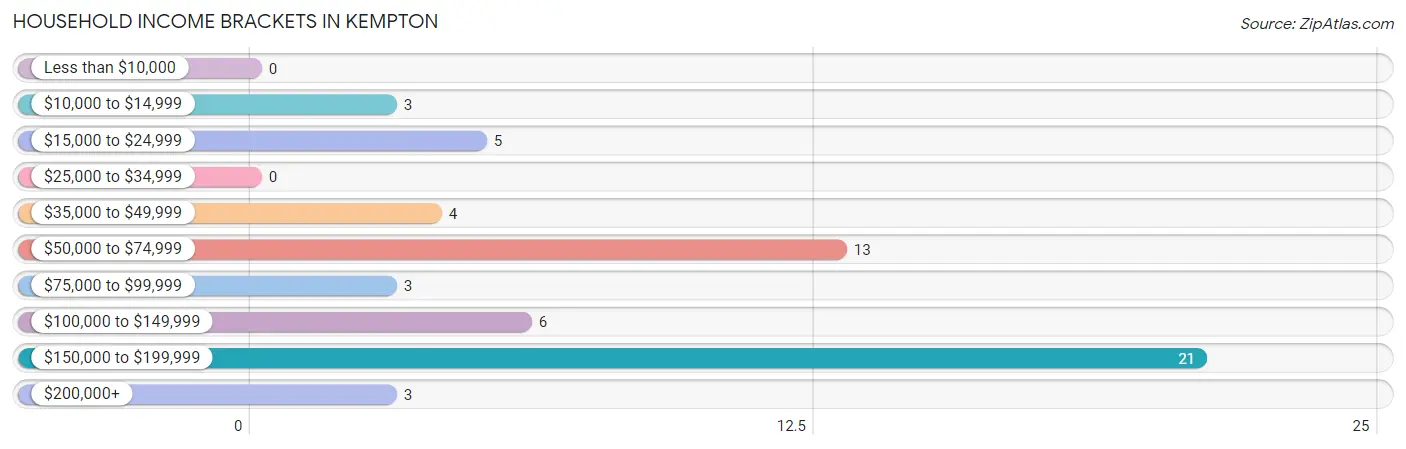
| Income Bracket | # Households | % Households |
| Less than $10,000 | 0 | 0.0% |
| $10,000 to $14,999 | 3 | 5.2% |
| $15,000 to $24,999 | 5 | 8.6% |
| $25,000 to $34,999 | 0 | 0.0% |
| $35,000 to $49,999 | 4 | 6.9% |
| $50,000 to $74,999 | 13 | 22.4% |
| $75,000 to $99,999 | 3 | 5.2% |
| $100,000 to $149,999 | 6 | 10.3% |
| $150,000 to $199,999 | 21 | 36.2% |
| $200,000+ | 3 | 5.2% |
Household Income by Householder Age in Kempton
The median household income in Kempton is $105,833, with the highest median household income of $153,750 found in the 45 to 64 years age bracket for the primary householder. A total of 28 households (48.3%) fall into this category.
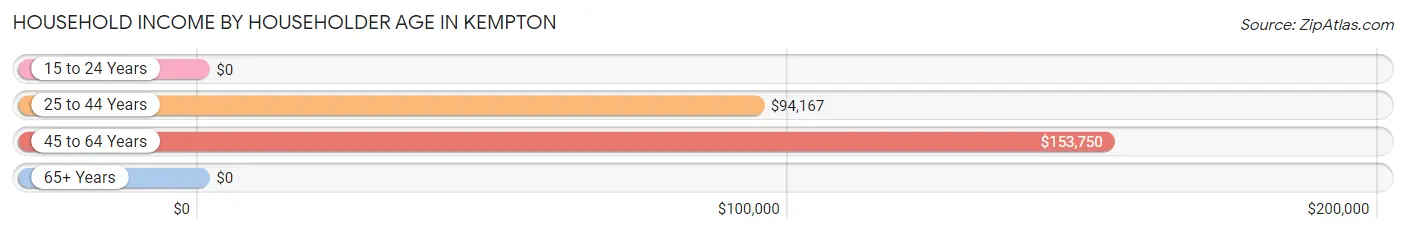
| Income Bracket | # Households | Median Income |
| 15 to 24 Years | 0 (0.0%) | $0 |
| 25 to 44 Years | 20 (34.5%) | $94,167 |
| 45 to 64 Years | 28 (48.3%) | $153,750 |
| 65+ Years | 10 (17.2%) | $0 |
| Total | 58 (100.0%) | $105,833 |
Poverty in Kempton
Income Below Poverty by Sex and Age in Kempton
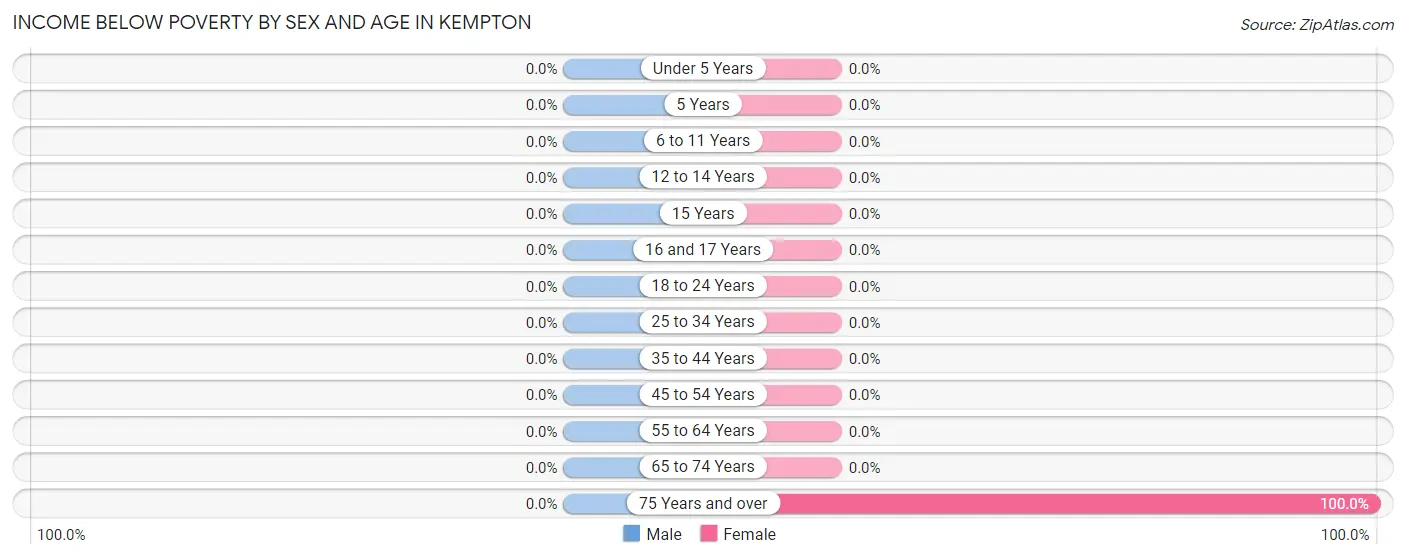
| Age Bracket | Male | Female |
| Under 5 Years | 0 (0.0%) | 0 (0.0%) |
| 5 Years | 0 (0.0%) | 0 (0.0%) |
| 6 to 11 Years | 0 (0.0%) | 0 (0.0%) |
| 12 to 14 Years | 0 (0.0%) | 0 (0.0%) |
| 15 Years | 0 (0.0%) | 0 (0.0%) |
| 16 and 17 Years | 0 (0.0%) | 0 (0.0%) |
| 18 to 24 Years | 0 (0.0%) | 0 (0.0%) |
| 25 to 34 Years | 0 (0.0%) | 0 (0.0%) |
| 35 to 44 Years | 0 (0.0%) | 0 (0.0%) |
| 45 to 54 Years | 0 (0.0%) | 0 (0.0%) |
| 55 to 64 Years | 0 (0.0%) | 0 (0.0%) |
| 65 to 74 Years | 0 (0.0%) | 0 (0.0%) |
| 75 Years and over | 0 (0.0%) | 3 (100.0%) |
| Total | 0 (0.0%) | 3 (4.2%) |
Income Above Poverty by Sex and Age in Kempton
According to the poverty statistics in Kempton, males aged under 5 years and females aged under 5 years are the age groups that are most secure financially, with 100.0% of males and 100.0% of females in these age groups living above the poverty line.
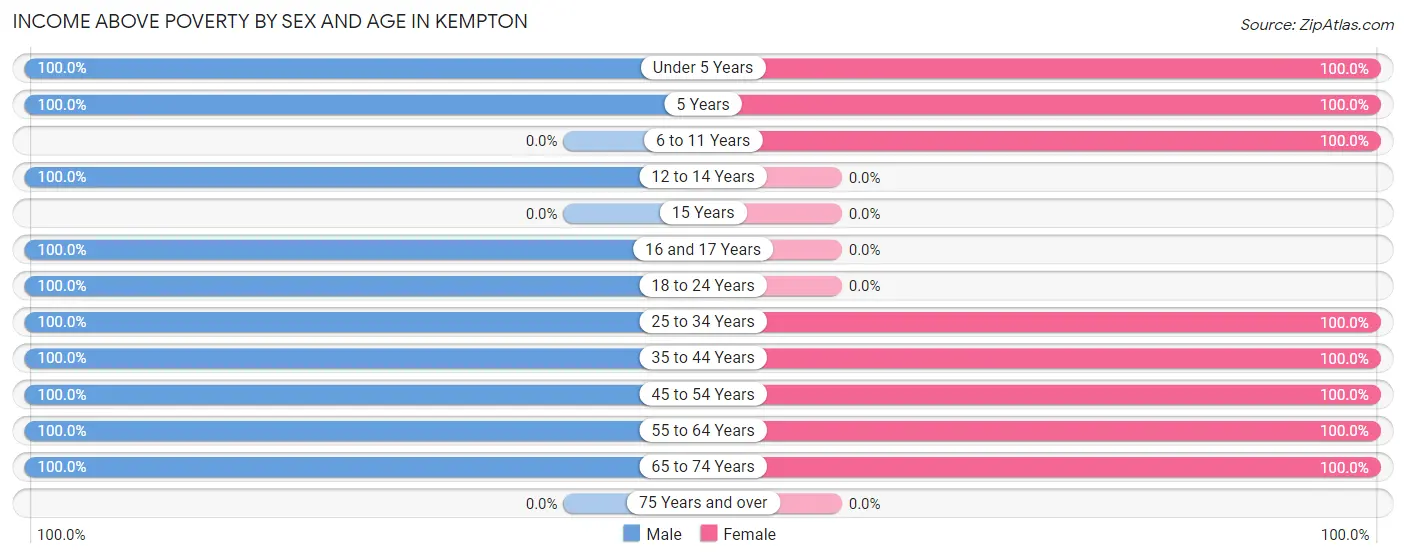
| Age Bracket | Male | Female |
| Under 5 Years | 4 (100.0%) | 6 (100.0%) |
| 5 Years | 2 (100.0%) | 2 (100.0%) |
| 6 to 11 Years | 0 (0.0%) | 11 (100.0%) |
| 12 to 14 Years | 17 (100.0%) | 0 (0.0%) |
| 15 Years | 0 (0.0%) | 0 (0.0%) |
| 16 and 17 Years | 10 (100.0%) | 0 (0.0%) |
| 18 to 24 Years | 8 (100.0%) | 0 (0.0%) |
| 25 to 34 Years | 14 (100.0%) | 12 (100.0%) |
| 35 to 44 Years | 3 (100.0%) | 12 (100.0%) |
| 45 to 54 Years | 20 (100.0%) | 10 (100.0%) |
| 55 to 64 Years | 7 (100.0%) | 6 (100.0%) |
| 65 to 74 Years | 2 (100.0%) | 9 (100.0%) |
| 75 Years and over | 0 (0.0%) | 0 (0.0%) |
| Total | 87 (100.0%) | 68 (95.8%) |
Income Below Poverty Among Married-Couple Families in Kempton
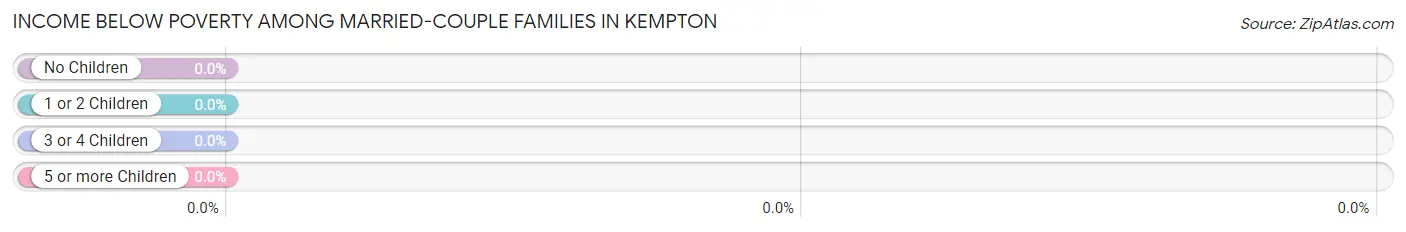
| Children | Above Poverty | Below Poverty |
| No Children | 12 (100.0%) | 0 (0.0%) |
| 1 or 2 Children | 11 (100.0%) | 0 (0.0%) |
| 3 or 4 Children | 10 (100.0%) | 0 (0.0%) |
| 5 or more Children | 0 (0.0%) | 0 (0.0%) |
| Total | 33 (100.0%) | 0 (0.0%) |
Income Below Poverty Among Single-Parent Households in Kempton
| Children | Single Father | Single Mother |
| No Children | 0 (0.0%) | 0 (0.0%) |
| 1 or 2 Children | 0 (0.0%) | 0 (0.0%) |
| 3 or 4 Children | 0 (0.0%) | 0 (0.0%) |
| 5 or more Children | 0 (0.0%) | 0 (0.0%) |
| Total | 0 (0.0%) | 0 (0.0%) |
Income Below Poverty Among Married-Couple vs Single-Parent Households in Kempton
| Children | Married-Couple Families | Single-Parent Households |
| No Children | 0 (0.0%) | 0 (0.0%) |
| 1 or 2 Children | 0 (0.0%) | 0 (0.0%) |
| 3 or 4 Children | 0 (0.0%) | 0 (0.0%) |
| 5 or more Children | 0 (0.0%) | 0 (0.0%) |
| Total | 0 (0.0%) | 0 (0.0%) |
Race in Kempton
The most populous races in Kempton are , and White / Caucasian (158 | 100.0%).
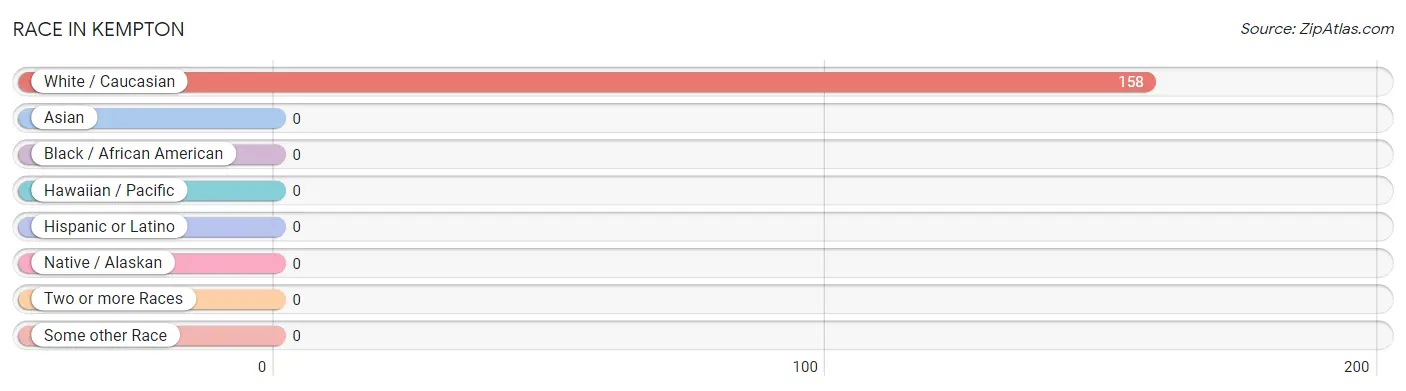
| Race | # Population | % Population |
| Asian | 0 | 0.0% |
| Black / African American | 0 | 0.0% |
| Hawaiian / Pacific | 0 | 0.0% |
| Hispanic or Latino | 0 | 0.0% |
| Native / Alaskan | 0 | 0.0% |
| White / Caucasian | 158 | 100.0% |
| Two or more Races | 0 | 0.0% |
| Some other Race | 0 | 0.0% |
| Total | 158 | 100.0% |
Ancestry in Kempton
The most populous ancestries reported in Kempton are Irish (65 | 41.1%), English (58 | 36.7%), German (33 | 20.9%), Polish (12 | 7.6%), and Hungarian (10 | 6.3%), together accounting for 112.7% of all Kempton residents.
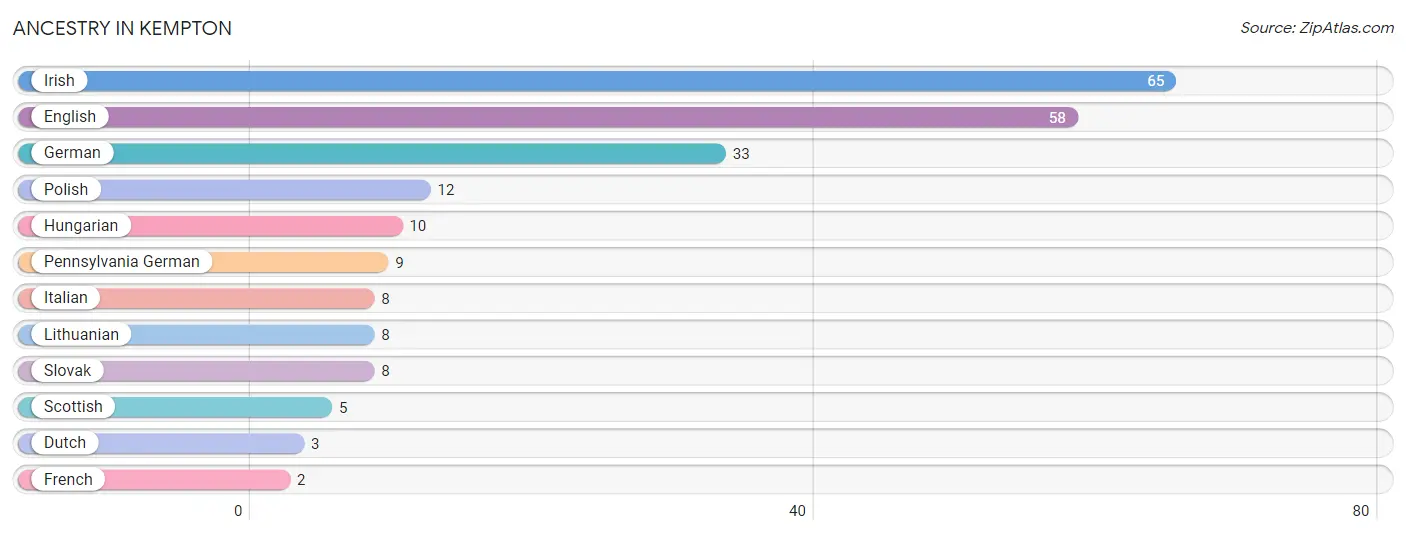
| Ancestry | # Population | % Population |
| Dutch | 3 | 1.9% |
| English | 58 | 36.7% |
| French | 2 | 1.3% |
| German | 33 | 20.9% |
| Hungarian | 10 | 6.3% |
| Irish | 65 | 41.1% |
| Italian | 8 | 5.1% |
| Lithuanian | 8 | 5.1% |
| Pennsylvania German | 9 | 5.7% |
| Polish | 12 | 7.6% |
| Scottish | 5 | 3.2% |
| Slovak | 8 | 5.1% | View All 12 Rows |
Immigrants in Kempton

| Immigration Origin | # Population | % Population | View All 0 Rows |
Sex and Age in Kempton
Sex and Age in Kempton
The most populous age groups in Kempton are 15 to 19 Years (18 | 20.7%) for men and 5 to 9 Years (13 | 18.3%) for women.
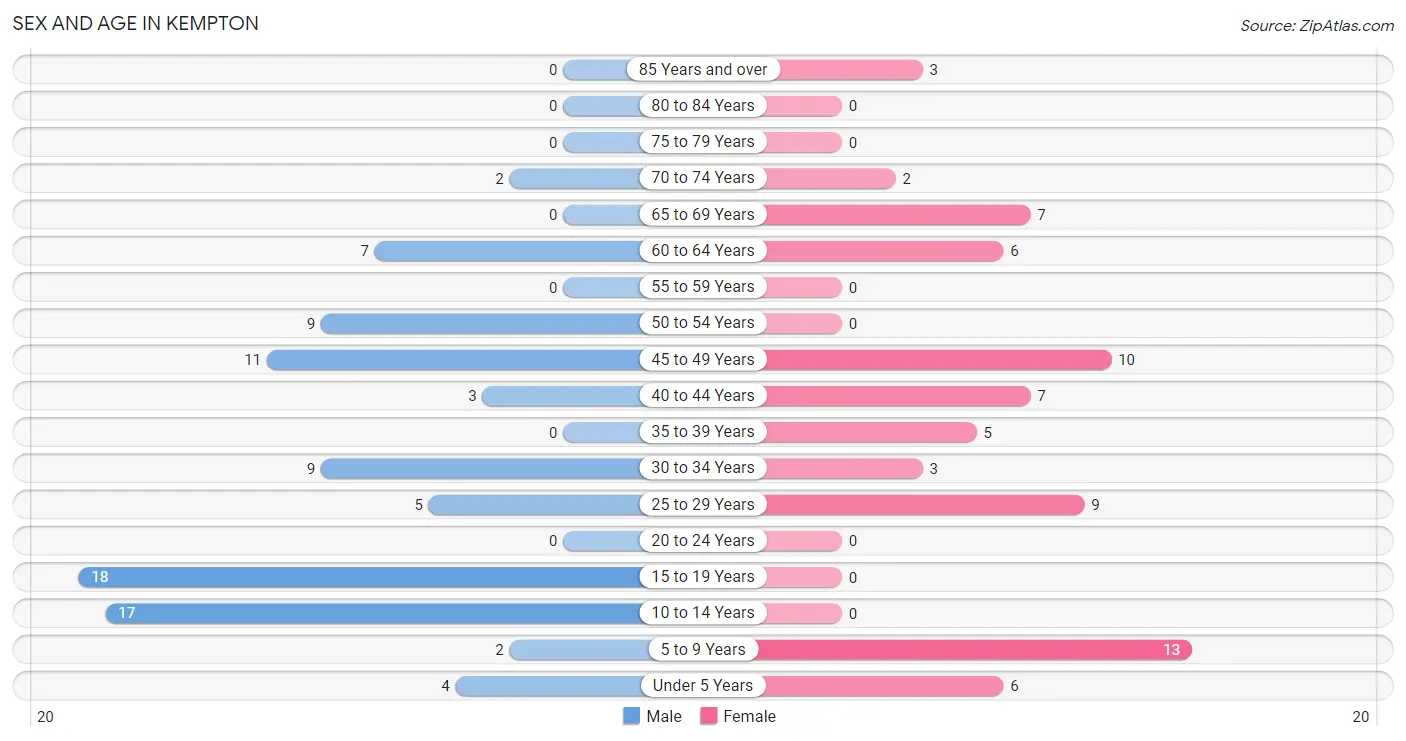
| Age Bracket | Male | Female |
| Under 5 Years | 4 (4.6%) | 6 (8.5%) |
| 5 to 9 Years | 2 (2.3%) | 13 (18.3%) |
| 10 to 14 Years | 17 (19.5%) | 0 (0.0%) |
| 15 to 19 Years | 18 (20.7%) | 0 (0.0%) |
| 20 to 24 Years | 0 (0.0%) | 0 (0.0%) |
| 25 to 29 Years | 5 (5.8%) | 9 (12.7%) |
| 30 to 34 Years | 9 (10.3%) | 3 (4.2%) |
| 35 to 39 Years | 0 (0.0%) | 5 (7.0%) |
| 40 to 44 Years | 3 (3.5%) | 7 (9.9%) |
| 45 to 49 Years | 11 (12.6%) | 10 (14.1%) |
| 50 to 54 Years | 9 (10.3%) | 0 (0.0%) |
| 55 to 59 Years | 0 (0.0%) | 0 (0.0%) |
| 60 to 64 Years | 7 (8.1%) | 6 (8.5%) |
| 65 to 69 Years | 0 (0.0%) | 7 (9.9%) |
| 70 to 74 Years | 2 (2.3%) | 2 (2.8%) |
| 75 to 79 Years | 0 (0.0%) | 0 (0.0%) |
| 80 to 84 Years | 0 (0.0%) | 0 (0.0%) |
| 85 Years and over | 0 (0.0%) | 3 (4.2%) |
| Total | 87 (100.0%) | 71 (100.0%) |
Families and Households in Kempton
Median Family Size in Kempton
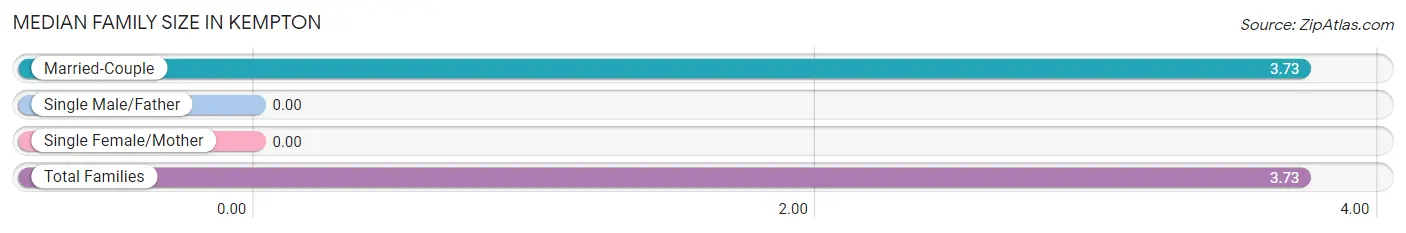
| Family Type | # Families | Family Size |
| Married-Couple | 33 (100.0%) | 3.73 |
| Single Male/Father | 0 (0.0%) | - |
| Single Female/Mother | 0 (0.0%) | - |
| Total Families | 33 (100.0%) | 3.73 |
Median Household Size in Kempton
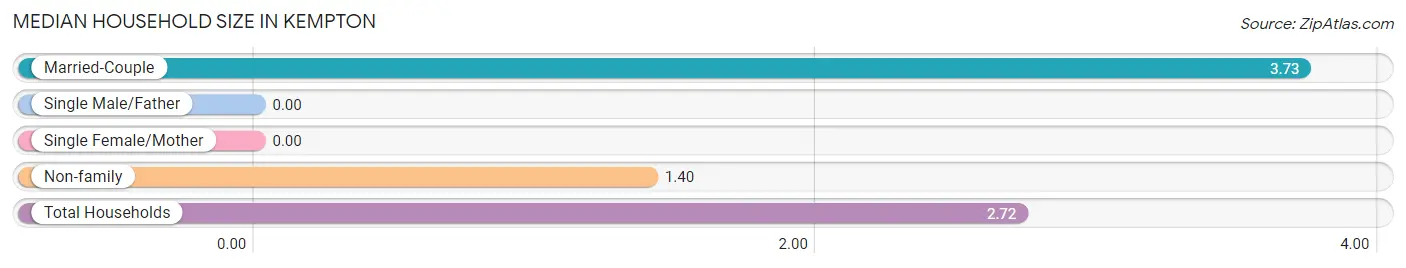
| Household Type | # Households | Household Size |
| Married-Couple | 33 (56.9%) | 3.73 |
| Single Male/Father | 0 (0.0%) | - |
| Single Female/Mother | 0 (0.0%) | - |
| Non-family | 25 (43.1%) | 1.40 |
| Total Households | 58 (100.0%) | 2.72 |
Household Size by Marriage Status in Kempton
Out of a total of 58 households in Kempton, 33 (56.9%) are family households, while 25 (43.1%) are nonfamily households. The most numerous type of family households are 2-person households, comprising 12, and the most common type of nonfamily households are 1-person households, comprising 14.
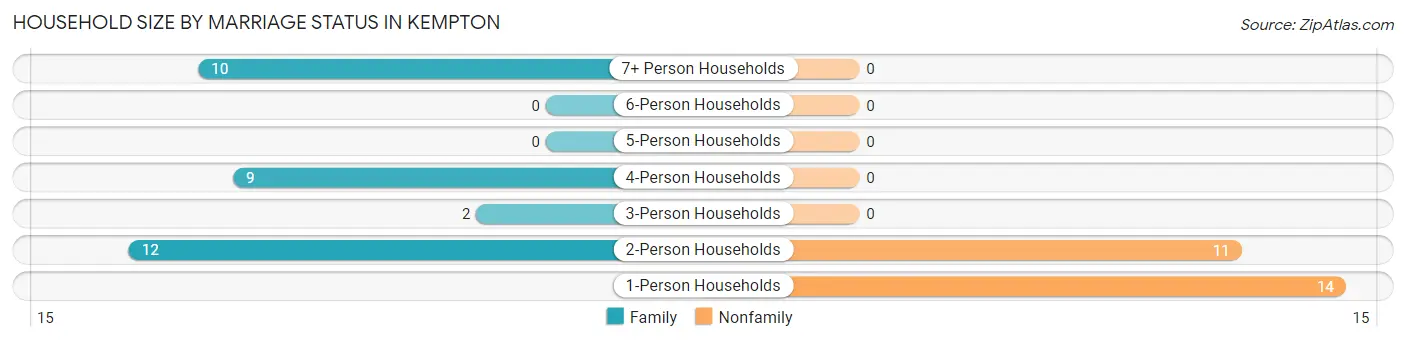
| Household Size | Family Households | Nonfamily Households |
| 1-Person Households | - | 14 (24.1%) |
| 2-Person Households | 12 (20.7%) | 11 (19.0%) |
| 3-Person Households | 2 (3.5%) | 0 (0.0%) |
| 4-Person Households | 9 (15.5%) | 0 (0.0%) |
| 5-Person Households | 0 (0.0%) | 0 (0.0%) |
| 6-Person Households | 0 (0.0%) | 0 (0.0%) |
| 7+ Person Households | 10 (17.2%) | 0 (0.0%) |
| Total | 33 (56.9%) | 25 (43.1%) |
Female Fertility in Kempton
Fertility by Age in Kempton
Average fertility rate in Kempton is 88.0 births per 1,000 women. Women in the age bracket of 20 to 34 years have the highest fertility rate with 250.0 births per 1,000 women. Women in the age bracket of 20 to 34 years acount for 100.0% of all women with births.
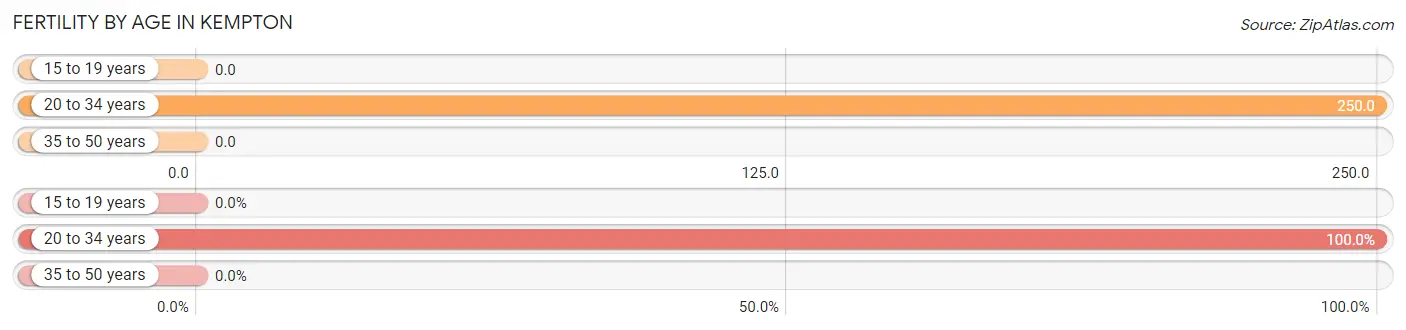
| Age Bracket | Women with Births | Births / 1,000 Women |
| 15 to 19 years | 0 (0.0%) | 0.0 |
| 20 to 34 years | 3 (100.0%) | 250.0 |
| 35 to 50 years | 0 (0.0%) | 0.0 |
| Total | 3 (100.0%) | 88.0 |
Fertility by Age by Marriage Status in Kempton
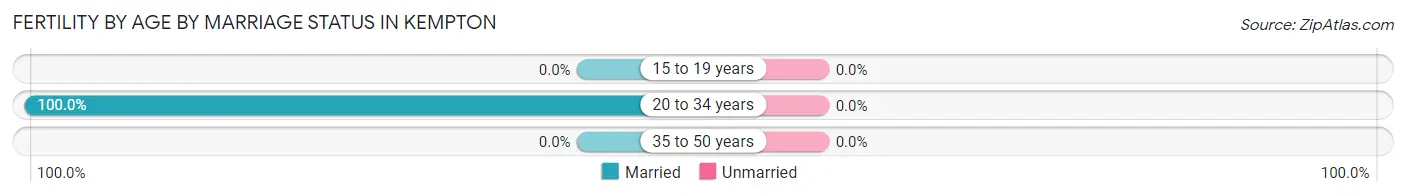
| Age Bracket | Married | Unmarried |
| 15 to 19 years | 0 (0.0%) | 0 (0.0%) |
| 20 to 34 years | 3 (100.0%) | 0 (0.0%) |
| 35 to 50 years | 0 (0.0%) | 0 (0.0%) |
| Total | 3 (100.0%) | 0 (0.0%) |
Fertility by Education in Kempton
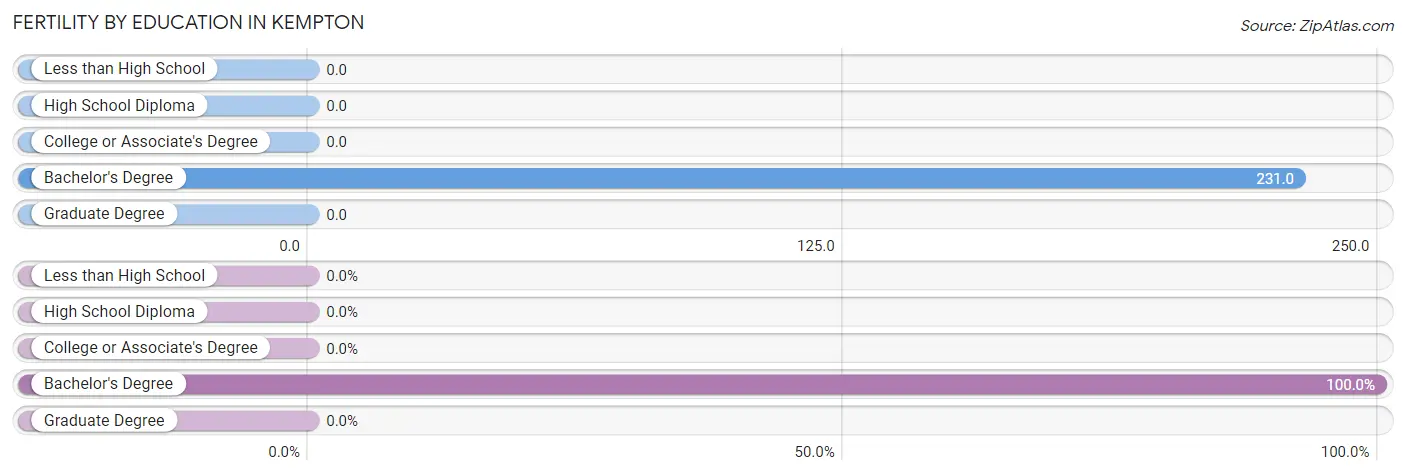
| Educational Attainment | Women with Births | Births / 1,000 Women |
| Less than High School | 0 (0.0%) | 0.0 |
| High School Diploma | 0 (0.0%) | 0.0 |
| College or Associate's Degree | 0 (0.0%) | 0.0 |
| Bachelor's Degree | 3 (100.0%) | 231.0 |
| Graduate Degree | 0 (0.0%) | 0.0 |
| Total | 3 (100.0%) | 88.0 |
Fertility by Education by Marriage Status in Kempton
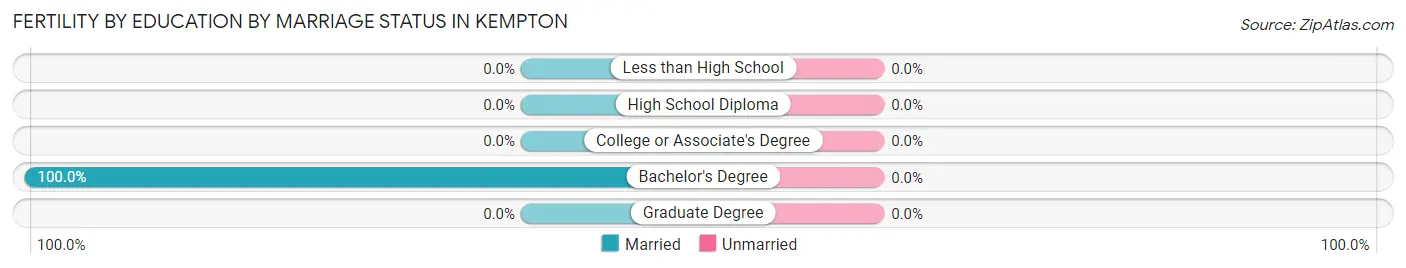
| Educational Attainment | Married | Unmarried |
| Less than High School | 0 (0.0%) | 0 (0.0%) |
| High School Diploma | 0 (0.0%) | 0 (0.0%) |
| College or Associate's Degree | 0 (0.0%) | 0 (0.0%) |
| Bachelor's Degree | 3 (100.0%) | 0 (0.0%) |
| Graduate Degree | 0 (0.0%) | 0 (0.0%) |
| Total | 3 (100.0%) | 0 (0.0%) |
Employment Characteristics in Kempton
Employment by Class of Employer in Kempton
Among the 81 employed individuals in Kempton, private company employees (49 | 60.5%), not-for-profit organizations (13 | 16.1%), and self-employed (not incorporated) (10 | 12.3%) make up the most common classes of employment.
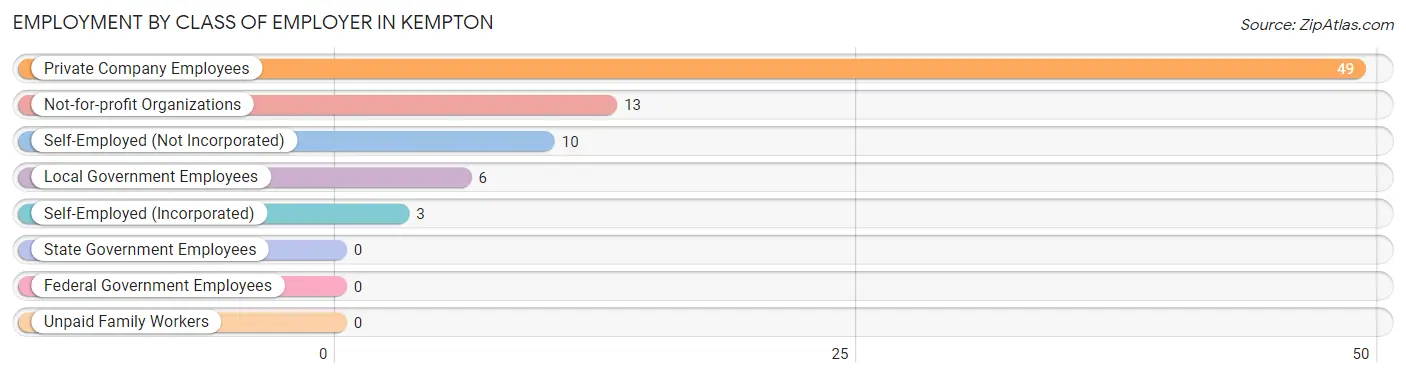
| Employer Class | # Employees | % Employees |
| Private Company Employees | 49 | 60.5% |
| Self-Employed (Incorporated) | 3 | 3.7% |
| Self-Employed (Not Incorporated) | 10 | 12.3% |
| Not-for-profit Organizations | 13 | 16.1% |
| Local Government Employees | 6 | 7.4% |
| State Government Employees | 0 | 0.0% |
| Federal Government Employees | 0 | 0.0% |
| Unpaid Family Workers | 0 | 0.0% |
| Total | 81 | 100.0% |
Employment Status by Age in Kempton
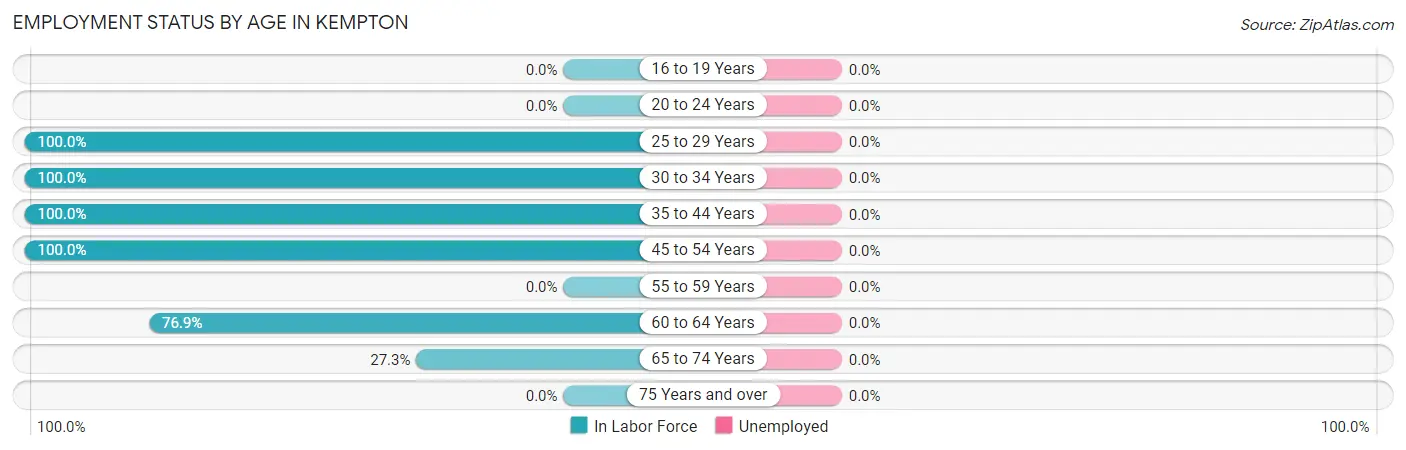
| Age Bracket | In Labor Force | Unemployed |
| 16 to 19 Years | 0 (0.0%) | 0 (0.0%) |
| 20 to 24 Years | 0 (0.0%) | 0 (0.0%) |
| 25 to 29 Years | 14 (100.0%) | 0 (0.0%) |
| 30 to 34 Years | 12 (100.0%) | 0 (0.0%) |
| 35 to 44 Years | 15 (100.0%) | 0 (0.0%) |
| 45 to 54 Years | 30 (100.0%) | 0 (0.0%) |
| 55 to 59 Years | 0 (0.0%) | 0 (0.0%) |
| 60 to 64 Years | 10 (76.9%) | 0 (0.0%) |
| 65 to 74 Years | 3 (27.3%) | 0 (0.0%) |
| 75 Years and over | 0 (0.0%) | 0 (0.0%) |
| Total | 84 (72.4%) | 0 (0.0%) |
Employment Status by Educational Attainment in Kempton
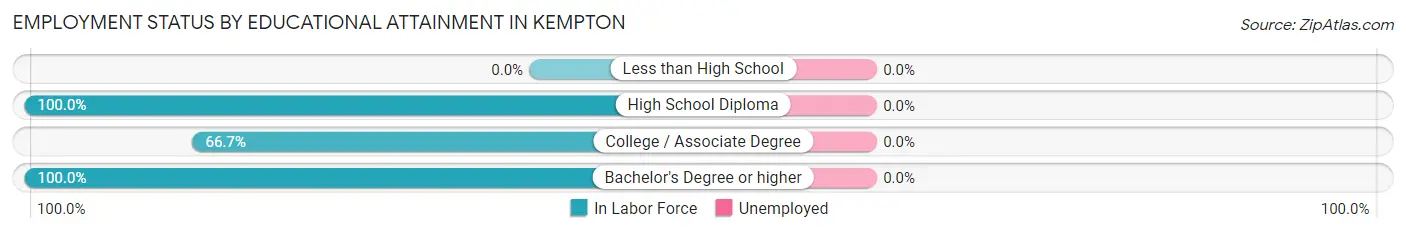
| Educational Attainment | In Labor Force | Unemployed |
| Less than High School | 0 (0.0%) | 0 (0.0%) |
| High School Diploma | 17 (100.0%) | 0 (0.0%) |
| College / Associate Degree | 6 (66.7%) | 0 (0.0%) |
| Bachelor's Degree or higher | 58 (100.0%) | 0 (0.0%) |
| Total | 81 (96.4%) | 0 (0.0%) |
Employment Occupations by Sex in Kempton
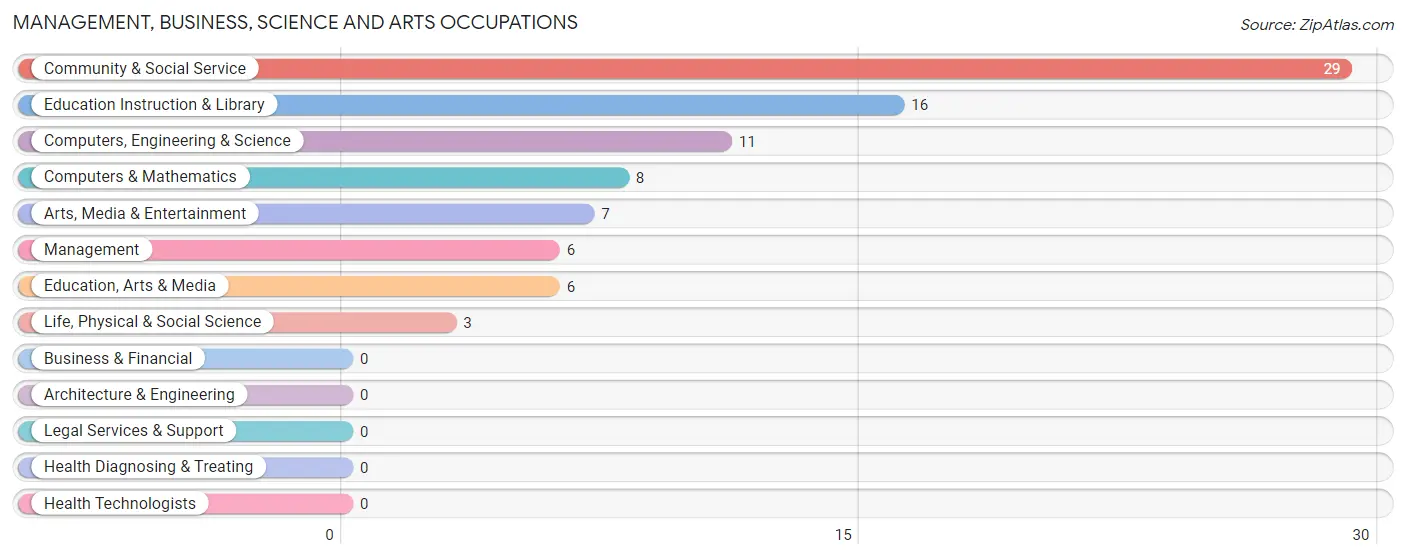
Management, Business, Science and Arts Occupations
The most common Management, Business, Science and Arts occupations in Kempton are Community & Social Service (29 | 34.5%), Education Instruction & Library (16 | 19.1%), Computers, Engineering & Science (11 | 13.1%), Computers & Mathematics (8 | 9.5%), and Arts, Media & Entertainment (7 | 8.3%).
Management, Business, Science and Arts Occupations by Sex
Within the Management, Business, Science and Arts occupations in Kempton, the most male-oriented occupations are Management (100.0%), Computers & Mathematics (100.0%), and Computers, Engineering & Science (72.7%), while the most female-oriented occupations are Life, Physical & Social Science (100.0%), Education Instruction & Library (100.0%), and Arts, Media & Entertainment (100.0%).
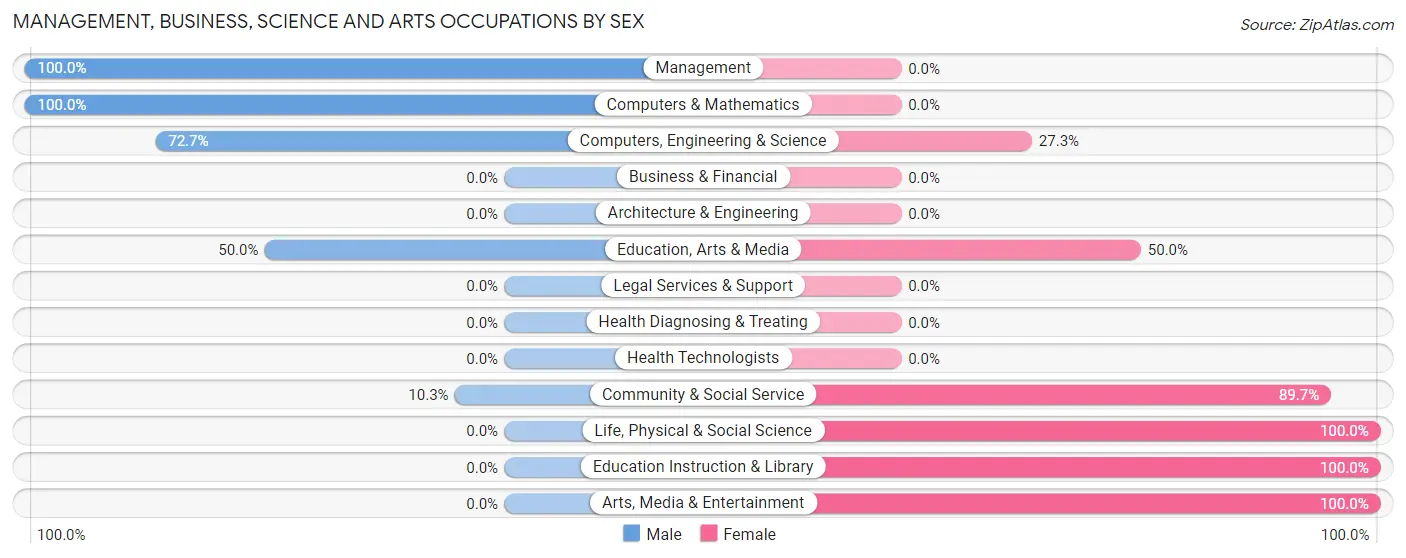
| Occupation | Male | Female |
| Management | 6 (100.0%) | 0 (0.0%) |
| Business & Financial | 0 (0.0%) | 0 (0.0%) |
| Computers, Engineering & Science | 8 (72.7%) | 3 (27.3%) |
| Computers & Mathematics | 8 (100.0%) | 0 (0.0%) |
| Architecture & Engineering | 0 (0.0%) | 0 (0.0%) |
| Life, Physical & Social Science | 0 (0.0%) | 3 (100.0%) |
| Community & Social Service | 3 (10.3%) | 26 (89.7%) |
| Education, Arts & Media | 3 (50.0%) | 3 (50.0%) |
| Legal Services & Support | 0 (0.0%) | 0 (0.0%) |
| Education Instruction & Library | 0 (0.0%) | 16 (100.0%) |
| Arts, Media & Entertainment | 0 (0.0%) | 7 (100.0%) |
| Health Diagnosing & Treating | 0 (0.0%) | 0 (0.0%) |
| Health Technologists | 0 (0.0%) | 0 (0.0%) |
| Total (Category) | 17 (37.0%) | 29 (63.0%) |
| Total (Overall) | 44 (52.4%) | 40 (47.6%) |
Services Occupations
Services Occupations by Sex
| Occupation | Male | Female |
| Healthcare Support | 0 (0.0%) | 0 (0.0%) |
| Security & Protection | 0 (0.0%) | 0 (0.0%) |
| Firefighting & Prevention | 0 (0.0%) | 0 (0.0%) |
| Law Enforcement | 0 (0.0%) | 0 (0.0%) |
| Food Preparation & Serving | 0 (0.0%) | 0 (0.0%) |
| Cleaning & Maintenance | 0 (0.0%) | 0 (0.0%) |
| Personal Care & Service | 0 (0.0%) | 0 (0.0%) |
| Total (Category) | 0 (0.0%) | 0 (0.0%) |
| Total (Overall) | 44 (52.4%) | 40 (47.6%) |
Sales and Office Occupations
The most common Sales and Office occupations in Kempton are Sales & Related (19 | 22.6%), and Office & Administration (3 | 3.6%).
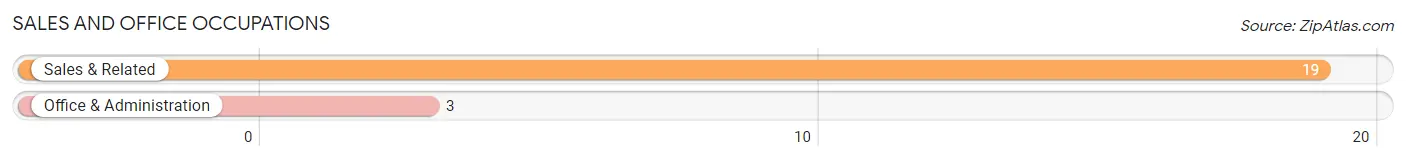
Sales and Office Occupations by Sex
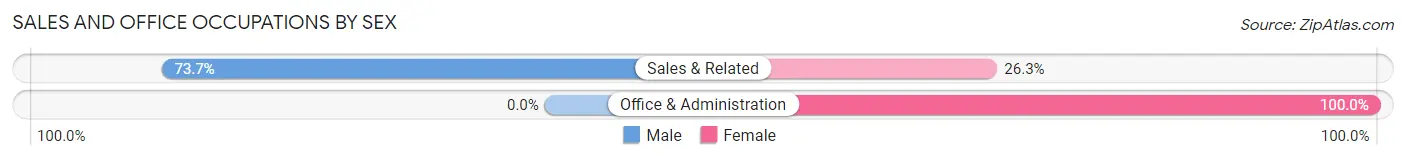
| Occupation | Male | Female |
| Sales & Related | 14 (73.7%) | 5 (26.3%) |
| Office & Administration | 0 (0.0%) | 3 (100.0%) |
| Total (Category) | 14 (63.6%) | 8 (36.4%) |
| Total (Overall) | 44 (52.4%) | 40 (47.6%) |
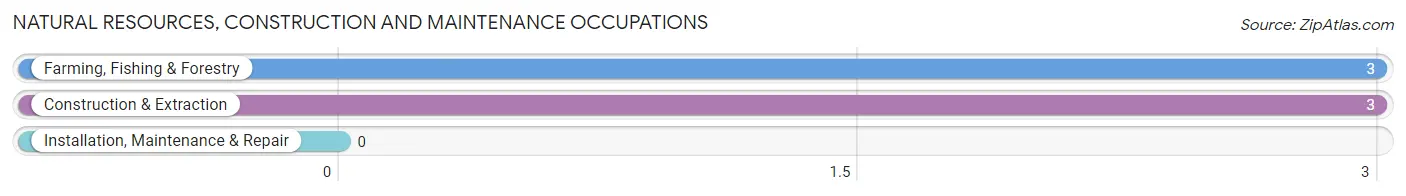
Natural Resources, Construction and Maintenance Occupations
The most common Natural Resources, Construction and Maintenance occupations in Kempton are Farming, Fishing & Forestry (3 | 3.6%), and Construction & Extraction (3 | 3.6%).
Natural Resources, Construction and Maintenance Occupations by Sex
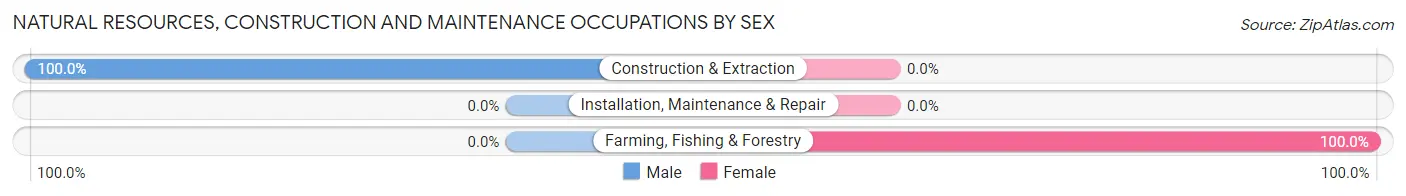
| Occupation | Male | Female |
| Farming, Fishing & Forestry | 0 (0.0%) | 3 (100.0%) |
| Construction & Extraction | 3 (100.0%) | 0 (0.0%) |
| Installation, Maintenance & Repair | 0 (0.0%) | 0 (0.0%) |
| Total (Category) | 3 (50.0%) | 3 (50.0%) |
| Total (Overall) | 44 (52.4%) | 40 (47.6%) |
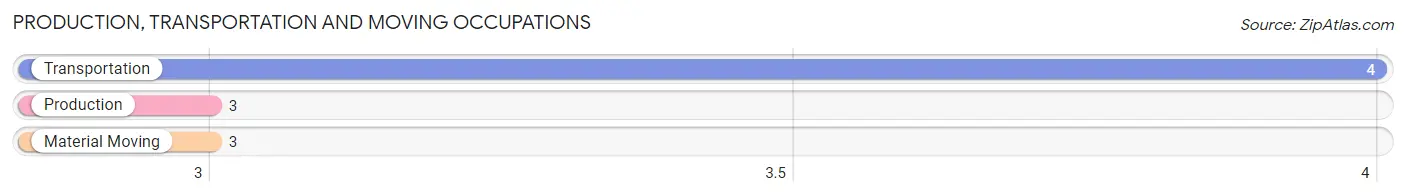
Production, Transportation and Moving Occupations
The most common Production, Transportation and Moving occupations in Kempton are Transportation (4 | 4.8%), Production (3 | 3.6%), and Material Moving (3 | 3.6%).
Production, Transportation and Moving Occupations by Sex
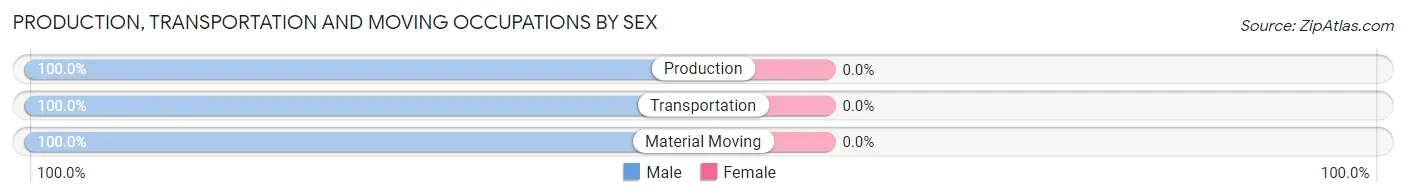
| Occupation | Male | Female |
| Production | 3 (100.0%) | 0 (0.0%) |
| Transportation | 4 (100.0%) | 0 (0.0%) |
| Material Moving | 3 (100.0%) | 0 (0.0%) |
| Total (Category) | 10 (100.0%) | 0 (0.0%) |
| Total (Overall) | 44 (52.4%) | 40 (47.6%) |
Employment Industries by Sex in Kempton
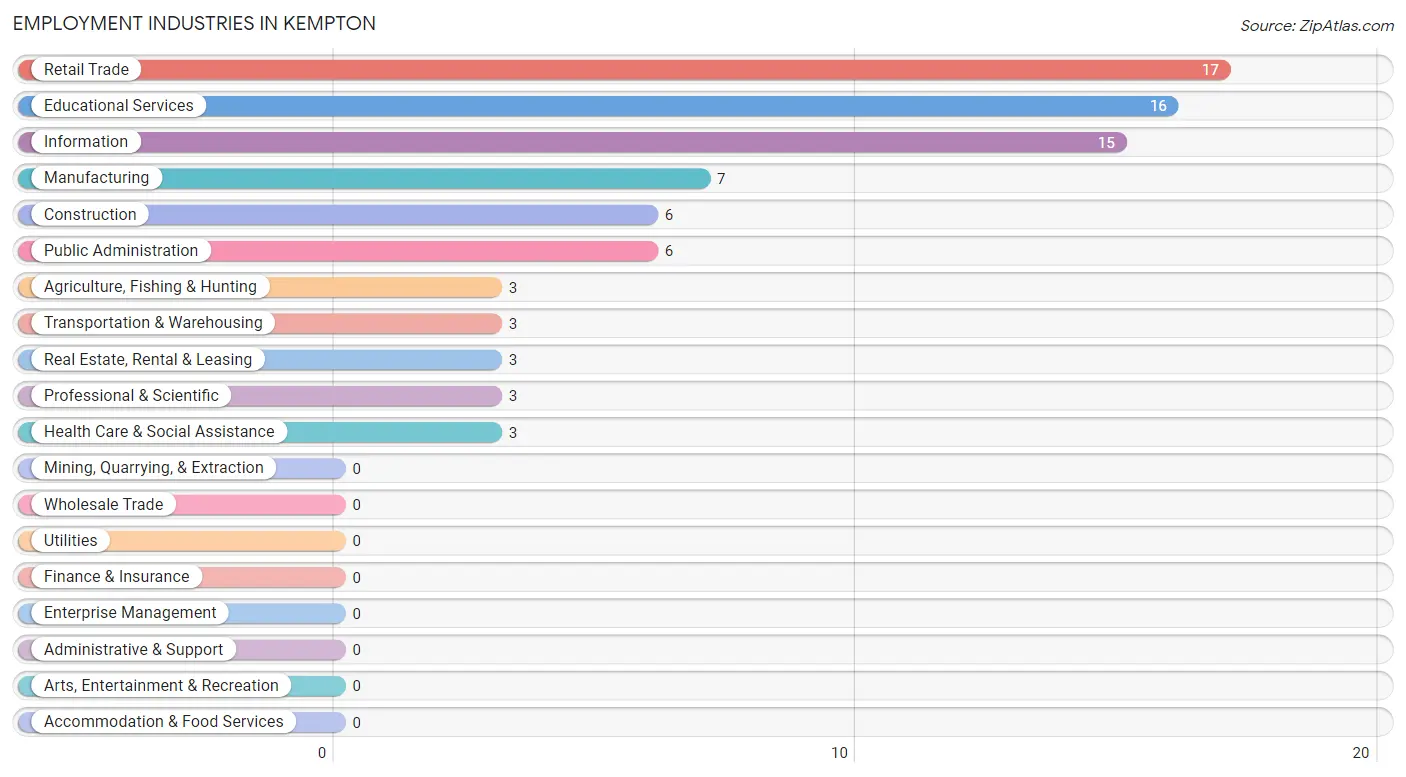
Employment Industries in Kempton
The major employment industries in Kempton include Retail Trade (17 | 20.2%), Educational Services (16 | 19.1%), Information (15 | 17.9%), Manufacturing (7 | 8.3%), and Construction (6 | 7.1%).
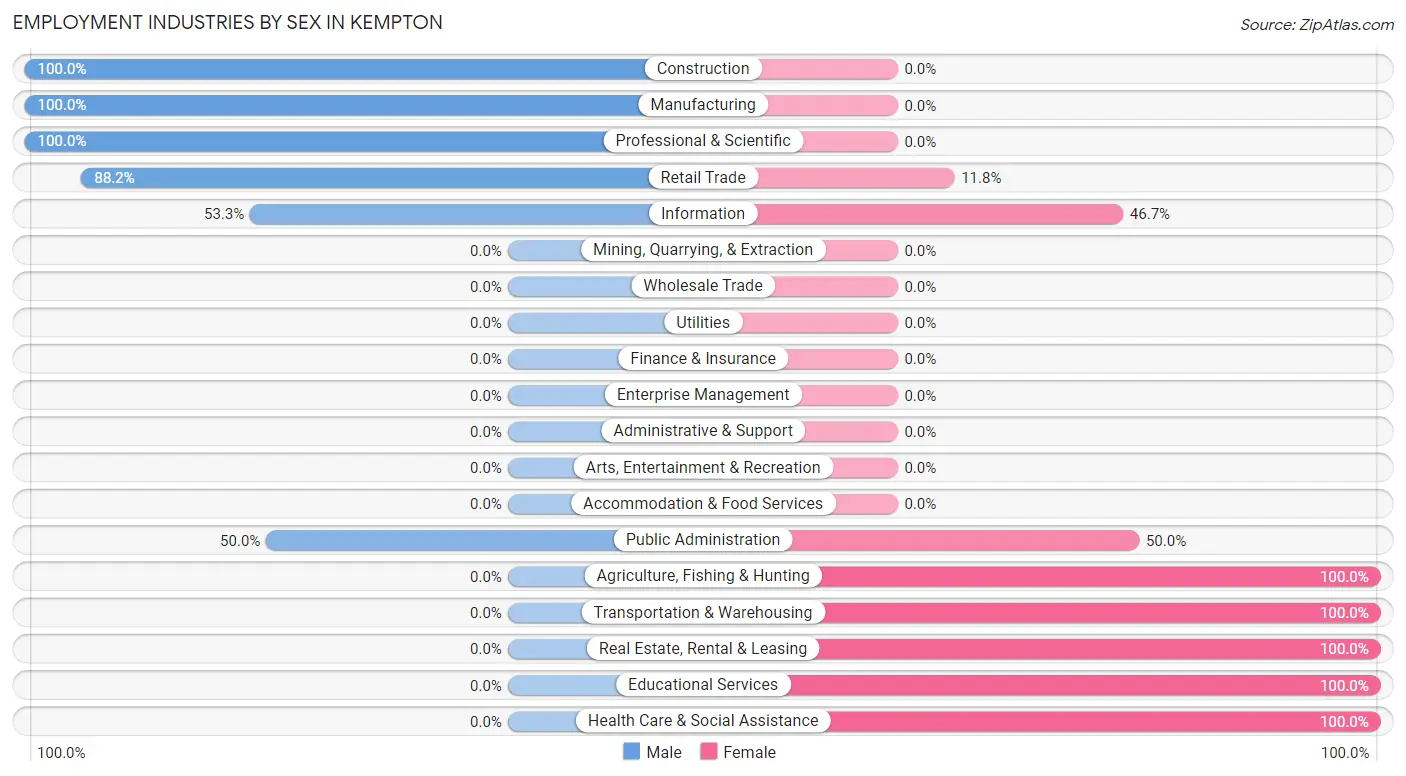
Employment Industries by Sex in Kempton
The Kempton industries that see more men than women are Construction (100.0%), Manufacturing (100.0%), and Professional & Scientific (100.0%), whereas the industries that tend to have a higher number of women are Agriculture, Fishing & Hunting (100.0%), Transportation & Warehousing (100.0%), and Real Estate, Rental & Leasing (100.0%).
| Industry | Male | Female |
| Agriculture, Fishing & Hunting | 0 (0.0%) | 3 (100.0%) |
| Mining, Quarrying, & Extraction | 0 (0.0%) | 0 (0.0%) |
| Construction | 6 (100.0%) | 0 (0.0%) |
| Manufacturing | 7 (100.0%) | 0 (0.0%) |
| Wholesale Trade | 0 (0.0%) | 0 (0.0%) |
| Retail Trade | 15 (88.2%) | 2 (11.8%) |
| Transportation & Warehousing | 0 (0.0%) | 3 (100.0%) |
| Utilities | 0 (0.0%) | 0 (0.0%) |
| Information | 8 (53.3%) | 7 (46.7%) |
| Finance & Insurance | 0 (0.0%) | 0 (0.0%) |
| Real Estate, Rental & Leasing | 0 (0.0%) | 3 (100.0%) |
| Professional & Scientific | 3 (100.0%) | 0 (0.0%) |
| Enterprise Management | 0 (0.0%) | 0 (0.0%) |
| Administrative & Support | 0 (0.0%) | 0 (0.0%) |
| Educational Services | 0 (0.0%) | 16 (100.0%) |
| Health Care & Social Assistance | 0 (0.0%) | 3 (100.0%) |
| Arts, Entertainment & Recreation | 0 (0.0%) | 0 (0.0%) |
| Accommodation & Food Services | 0 (0.0%) | 0 (0.0%) |
| Public Administration | 3 (50.0%) | 3 (50.0%) |
| Total | 44 (52.4%) | 40 (47.6%) |
Education in Kempton
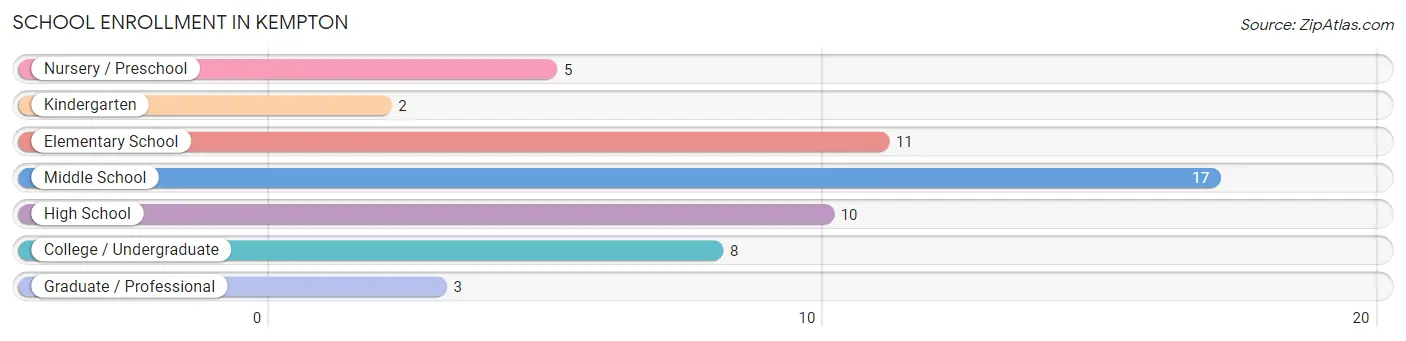
School Enrollment in Kempton
The most common levels of schooling among the 56 students in Kempton are middle school (17 | 30.4%), elementary school (11 | 19.6%), and high school (10 | 17.9%).
| School Level | # Students | % Students |
| Nursery / Preschool | 5 | 8.9% |
| Kindergarten | 2 | 3.6% |
| Elementary School | 11 | 19.6% |
| Middle School | 17 | 30.4% |
| High School | 10 | 17.9% |
| College / Undergraduate | 8 | 14.3% |
| Graduate / Professional | 3 | 5.4% |
| Total | 56 | 100.0% |
School Enrollment by Age by Funding Source in Kempton
Out of a total of 56 students who are enrolled in schools in Kempton, 49 (87.5%) attend a private institution, while the remaining 7 (12.5%) are enrolled in public schools. The age group of 10 to 14 year olds has the highest likelihood of being enrolled in private schools, with 17 (100.0% in the age bracket) enrolled. Conversely, the age group of 3 to 4 year olds has the lowest likelihood of being enrolled in a private school, with 3 (100.0% in the age bracket) attending a public institution.
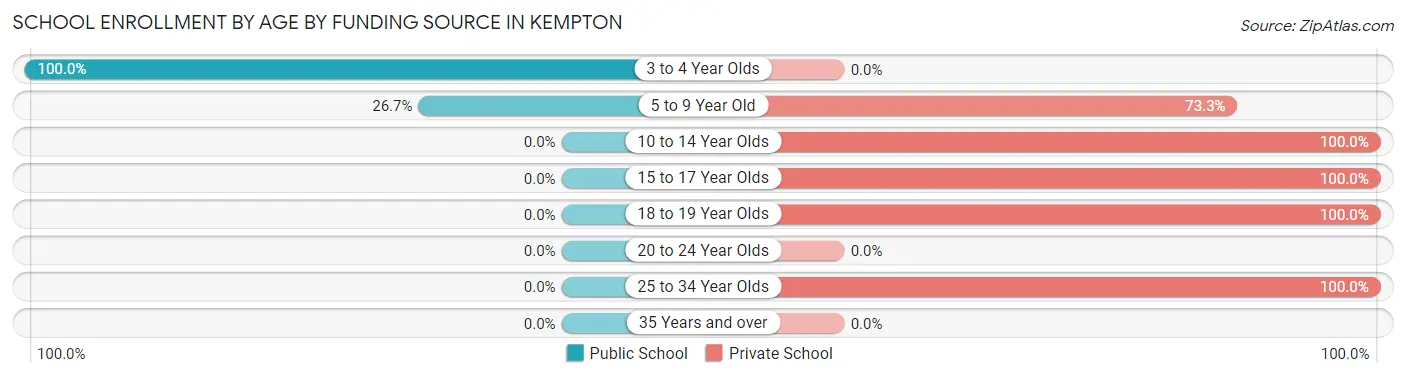
| Age Bracket | Public School | Private School |
| 3 to 4 Year Olds | 3 (100.0%) | 0 (0.0%) |
| 5 to 9 Year Old | 4 (26.7%) | 11 (73.3%) |
| 10 to 14 Year Olds | 0 (0.0%) | 17 (100.0%) |
| 15 to 17 Year Olds | 0 (0.0%) | 10 (100.0%) |
| 18 to 19 Year Olds | 0 (0.0%) | 8 (100.0%) |
| 20 to 24 Year Olds | 0 (0.0%) | 0 (0.0%) |
| 25 to 34 Year Olds | 0 (0.0%) | 3 (100.0%) |
| 35 Years and over | 0 (0.0%) | 0 (0.0%) |
| Total | 7 (12.5%) | 49 (87.5%) |
Educational Attainment by Field of Study in Kempton
Psychology (14 | 19.7%), bio, nature & agricultural (13 | 18.3%), business (12 | 16.9%), science & technology (10 | 14.1%), and liberal arts & history (8 | 11.3%) are the most common fields of study among 71 individuals in Kempton who have obtained a bachelor's degree or higher.
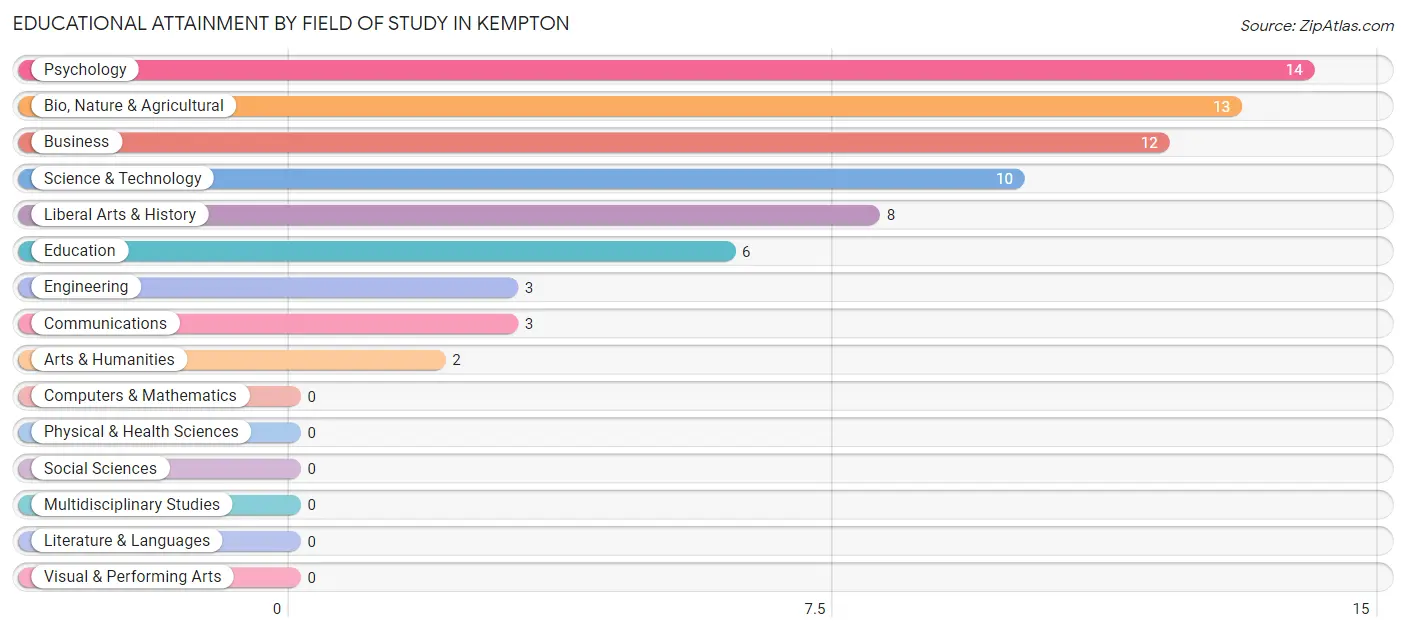
| Field of Study | # Graduates | % Graduates |
| Computers & Mathematics | 0 | 0.0% |
| Bio, Nature & Agricultural | 13 | 18.3% |
| Physical & Health Sciences | 0 | 0.0% |
| Psychology | 14 | 19.7% |
| Social Sciences | 0 | 0.0% |
| Engineering | 3 | 4.2% |
| Multidisciplinary Studies | 0 | 0.0% |
| Science & Technology | 10 | 14.1% |
| Business | 12 | 16.9% |
| Education | 6 | 8.5% |
| Literature & Languages | 0 | 0.0% |
| Liberal Arts & History | 8 | 11.3% |
| Visual & Performing Arts | 0 | 0.0% |
| Communications | 3 | 4.2% |
| Arts & Humanities | 2 | 2.8% |
| Total | 71 | 100.0% |
Transportation & Commute in Kempton
Vehicle Availability by Sex in Kempton
The most prevalent vehicle ownership categories in Kempton are males with 2 vehicles (16, accounting for 36.4%) and females with 2 vehicles (9, making up 43.2%).
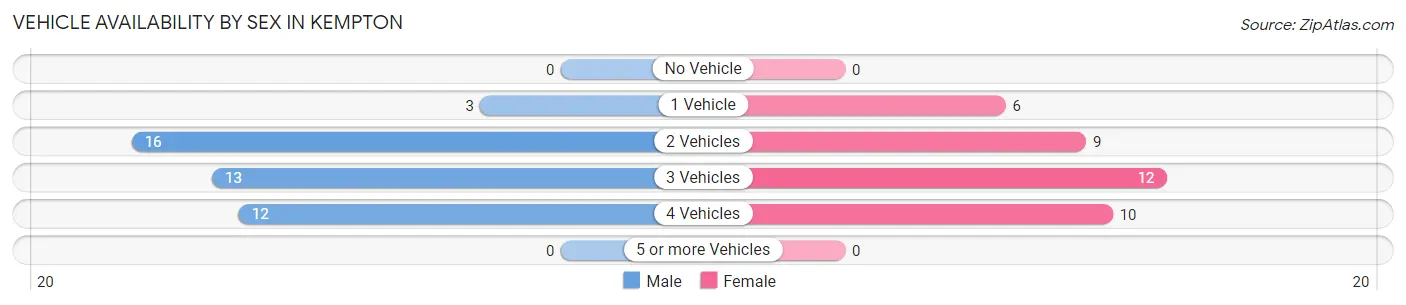
| Vehicles Available | Male | Female |
| No Vehicle | 0 (0.0%) | 0 (0.0%) |
| 1 Vehicle | 3 (6.8%) | 6 (16.2%) |
| 2 Vehicles | 16 (36.4%) | 9 (24.3%) |
| 3 Vehicles | 13 (29.5%) | 12 (32.4%) |
| 4 Vehicles | 12 (27.3%) | 10 (27.0%) |
| 5 or more Vehicles | 0 (0.0%) | 0 (0.0%) |
| Total | 44 (100.0%) | 37 (100.0%) |
Commute Time in Kempton
The most frequently occuring commute durations in Kempton are 20 to 24 minutes (18 commuters, 27.3%), 5 to 9 minutes (13 commuters, 19.7%), and 30 to 34 minutes (10 commuters, 15.1%).
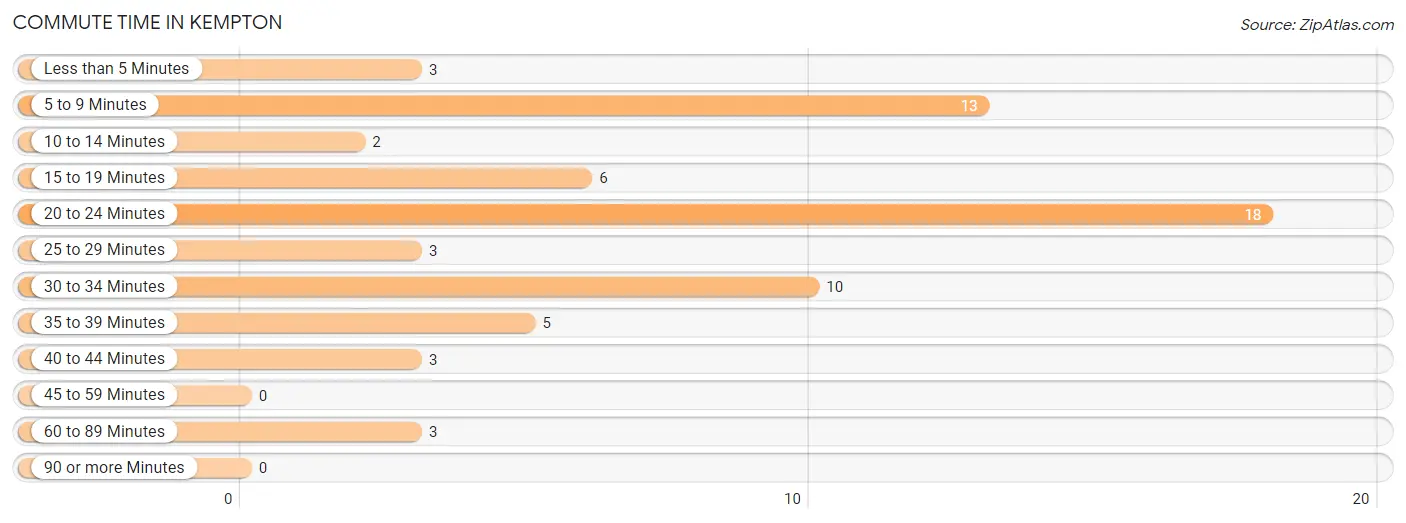
| Commute Time | # Commuters | % Commuters |
| Less than 5 Minutes | 3 | 4.5% |
| 5 to 9 Minutes | 13 | 19.7% |
| 10 to 14 Minutes | 2 | 3.0% |
| 15 to 19 Minutes | 6 | 9.1% |
| 20 to 24 Minutes | 18 | 27.3% |
| 25 to 29 Minutes | 3 | 4.5% |
| 30 to 34 Minutes | 10 | 15.1% |
| 35 to 39 Minutes | 5 | 7.6% |
| 40 to 44 Minutes | 3 | 4.5% |
| 45 to 59 Minutes | 0 | 0.0% |
| 60 to 89 Minutes | 3 | 4.5% |
| 90 or more Minutes | 0 | 0.0% |
Commute Time by Sex in Kempton
The most common commute times in Kempton are 20 to 24 minutes (12 commuters, 33.3%) for males and 5 to 9 minutes (10 commuters, 33.3%) for females.
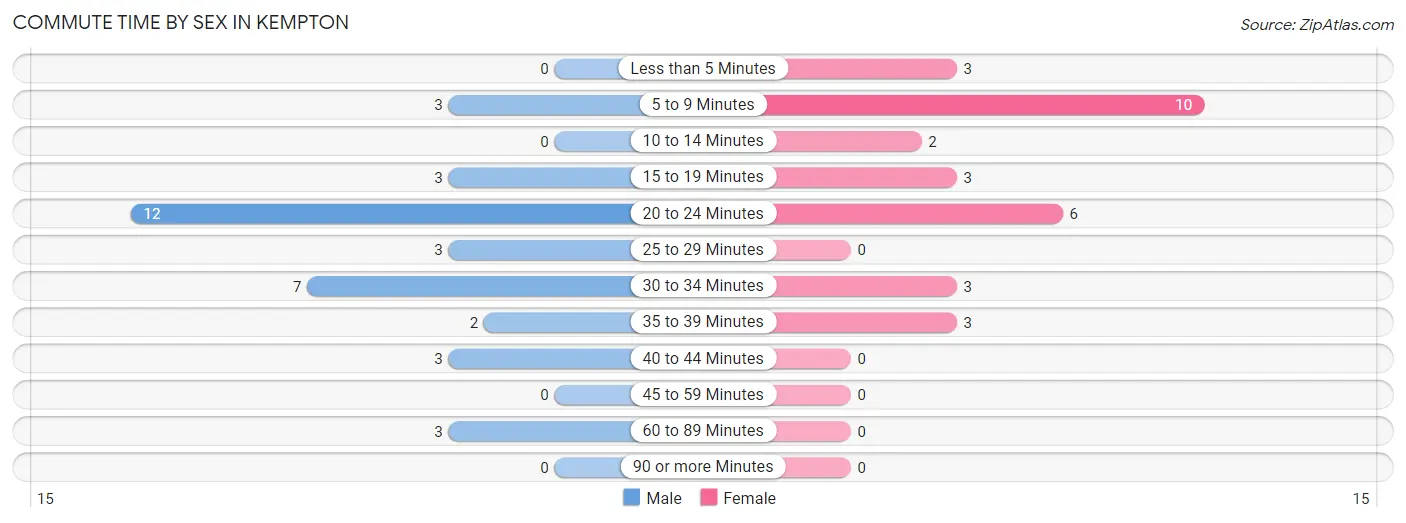
| Commute Time | Male | Female |
| Less than 5 Minutes | 0 (0.0%) | 3 (10.0%) |
| 5 to 9 Minutes | 3 (8.3%) | 10 (33.3%) |
| 10 to 14 Minutes | 0 (0.0%) | 2 (6.7%) |
| 15 to 19 Minutes | 3 (8.3%) | 3 (10.0%) |
| 20 to 24 Minutes | 12 (33.3%) | 6 (20.0%) |
| 25 to 29 Minutes | 3 (8.3%) | 0 (0.0%) |
| 30 to 34 Minutes | 7 (19.4%) | 3 (10.0%) |
| 35 to 39 Minutes | 2 (5.6%) | 3 (10.0%) |
| 40 to 44 Minutes | 3 (8.3%) | 0 (0.0%) |
| 45 to 59 Minutes | 0 (0.0%) | 0 (0.0%) |
| 60 to 89 Minutes | 3 (8.3%) | 0 (0.0%) |
| 90 or more Minutes | 0 (0.0%) | 0 (0.0%) |
Time of Departure to Work by Sex in Kempton
The most frequent times of departure to work in Kempton are 12:00 AM to 4:59 AM (10, 27.8%) for males and 8:00 AM to 8:29 AM (12, 40.0%) for females.
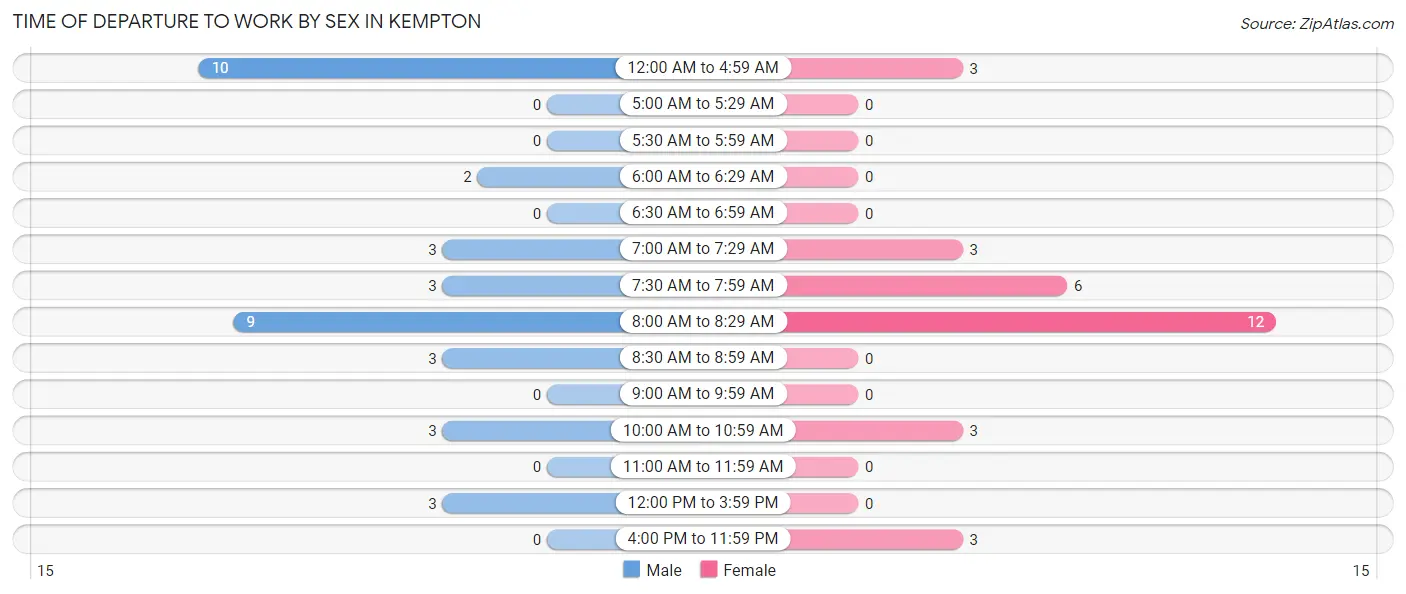
| Time of Departure | Male | Female |
| 12:00 AM to 4:59 AM | 10 (27.8%) | 3 (10.0%) |
| 5:00 AM to 5:29 AM | 0 (0.0%) | 0 (0.0%) |
| 5:30 AM to 5:59 AM | 0 (0.0%) | 0 (0.0%) |
| 6:00 AM to 6:29 AM | 2 (5.6%) | 0 (0.0%) |
| 6:30 AM to 6:59 AM | 0 (0.0%) | 0 (0.0%) |
| 7:00 AM to 7:29 AM | 3 (8.3%) | 3 (10.0%) |
| 7:30 AM to 7:59 AM | 3 (8.3%) | 6 (20.0%) |
| 8:00 AM to 8:29 AM | 9 (25.0%) | 12 (40.0%) |
| 8:30 AM to 8:59 AM | 3 (8.3%) | 0 (0.0%) |
| 9:00 AM to 9:59 AM | 0 (0.0%) | 0 (0.0%) |
| 10:00 AM to 10:59 AM | 3 (8.3%) | 3 (10.0%) |
| 11:00 AM to 11:59 AM | 0 (0.0%) | 0 (0.0%) |
| 12:00 PM to 3:59 PM | 3 (8.3%) | 0 (0.0%) |
| 4:00 PM to 11:59 PM | 0 (0.0%) | 3 (10.0%) |
| Total | 36 (100.0%) | 30 (100.0%) |
Housing Occupancy in Kempton
Occupancy by Ownership in Kempton
Of the total 58 dwellings in Kempton, owner-occupied units account for 47 (81.0%), while renter-occupied units make up 11 (19.0%).
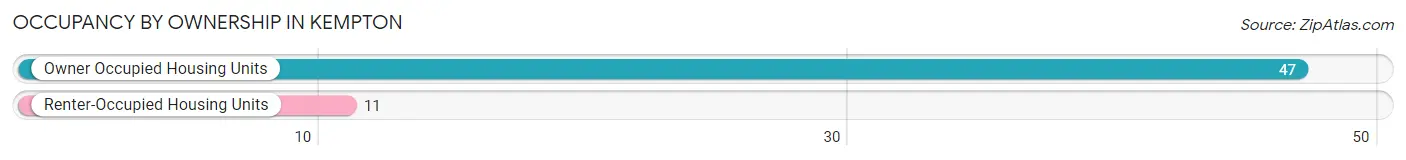
| Occupancy | # Housing Units | % Housing Units |
| Owner Occupied Housing Units | 47 | 81.0% |
| Renter-Occupied Housing Units | 11 | 19.0% |
| Total Occupied Housing Units | 58 | 100.0% |
Occupancy by Household Size in Kempton
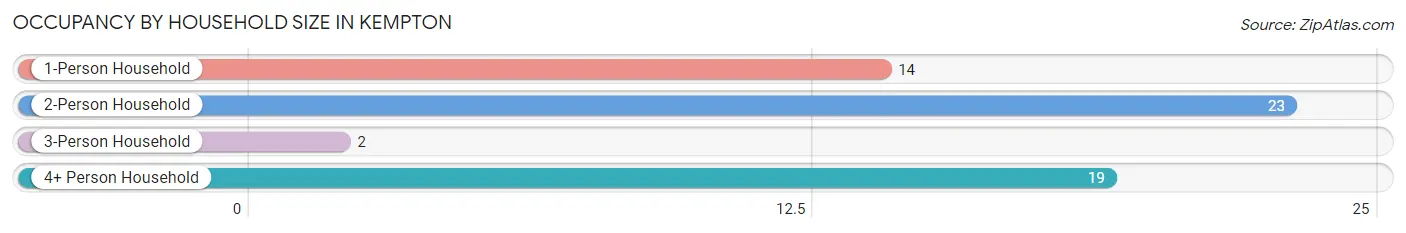
| Household Size | # Housing Units | % Housing Units |
| 1-Person Household | 14 | 24.1% |
| 2-Person Household | 23 | 39.7% |
| 3-Person Household | 2 | 3.5% |
| 4+ Person Household | 19 | 32.8% |
| Total Housing Units | 58 | 100.0% |
Occupancy by Ownership by Household Size in Kempton
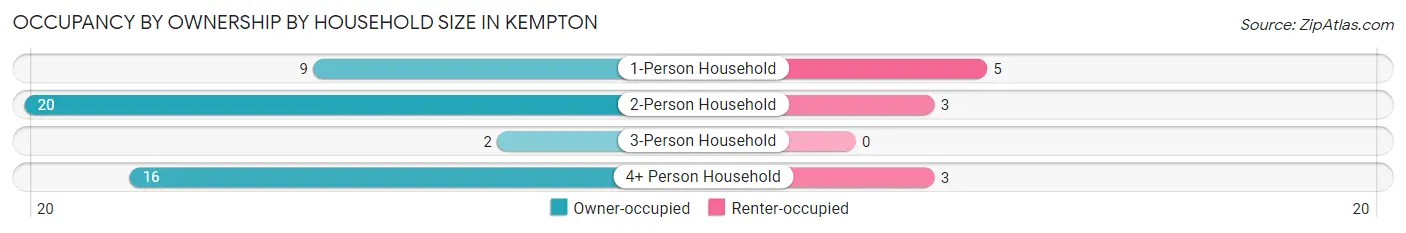
| Household Size | Owner-occupied | Renter-occupied |
| 1-Person Household | 9 (64.3%) | 5 (35.7%) |
| 2-Person Household | 20 (87.0%) | 3 (13.0%) |
| 3-Person Household | 2 (100.0%) | 0 (0.0%) |
| 4+ Person Household | 16 (84.2%) | 3 (15.8%) |
| Total Housing Units | 47 (81.0%) | 11 (19.0%) |
Occupancy by Educational Attainment in Kempton
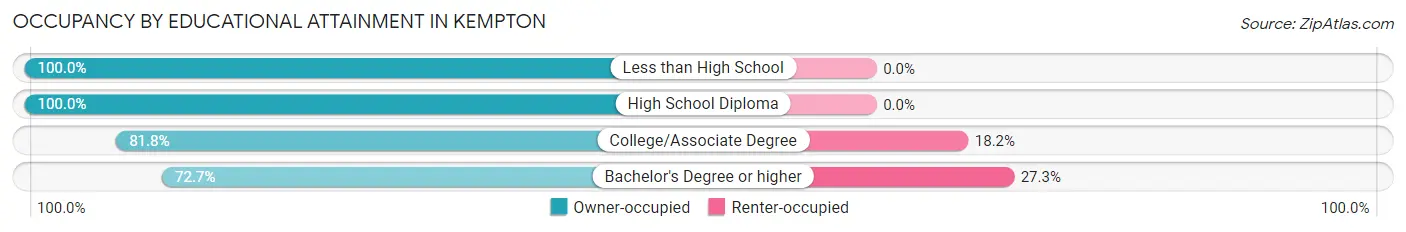
| Household Size | Owner-occupied | Renter-occupied |
| Less than High School | 3 (100.0%) | 0 (0.0%) |
| High School Diploma | 11 (100.0%) | 0 (0.0%) |
| College/Associate Degree | 9 (81.8%) | 2 (18.2%) |
| Bachelor's Degree or higher | 24 (72.7%) | 9 (27.3%) |
Occupancy by Age of Householder in Kempton
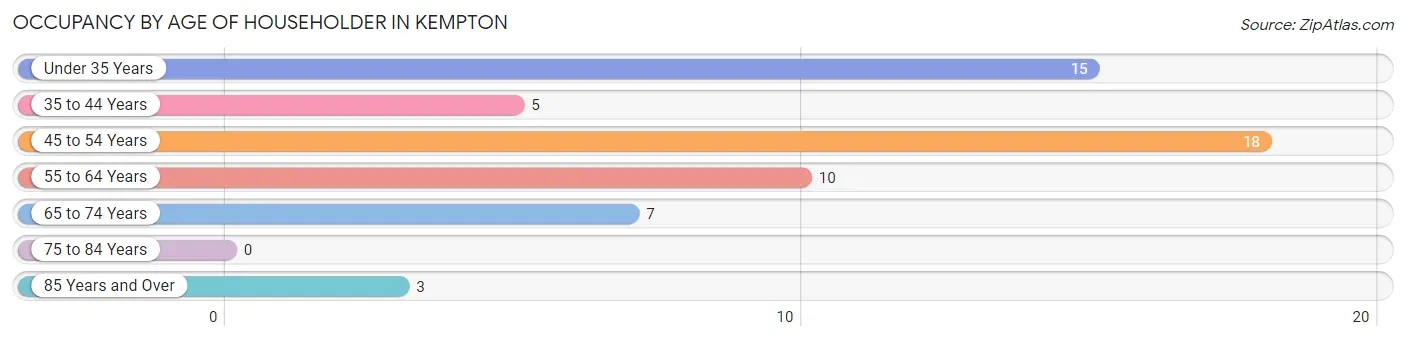
| Age Bracket | # Households | % Households |
| Under 35 Years | 15 | 25.9% |
| 35 to 44 Years | 5 | 8.6% |
| 45 to 54 Years | 18 | 31.0% |
| 55 to 64 Years | 10 | 17.2% |
| 65 to 74 Years | 7 | 12.1% |
| 75 to 84 Years | 0 | 0.0% |
| 85 Years and Over | 3 | 5.2% |
| Total | 58 | 100.0% |
Housing Finances in Kempton
Median Income by Occupancy in Kempton
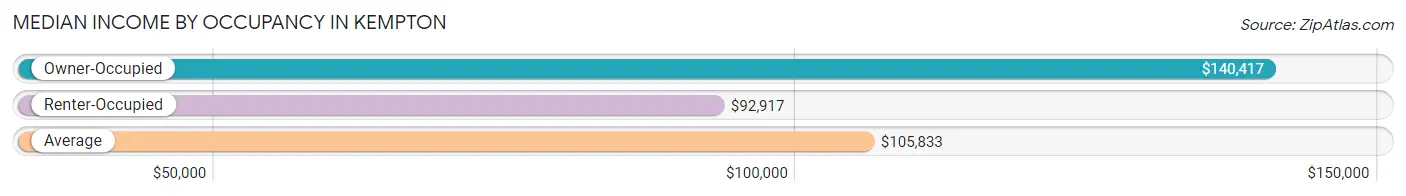
| Occupancy Type | # Households | Median Income |
| Owner-Occupied | 47 (81.0%) | $140,417 |
| Renter-Occupied | 11 (19.0%) | $92,917 |
| Average | 58 (100.0%) | $105,833 |
Occupancy by Householder Income Bracket in Kempton
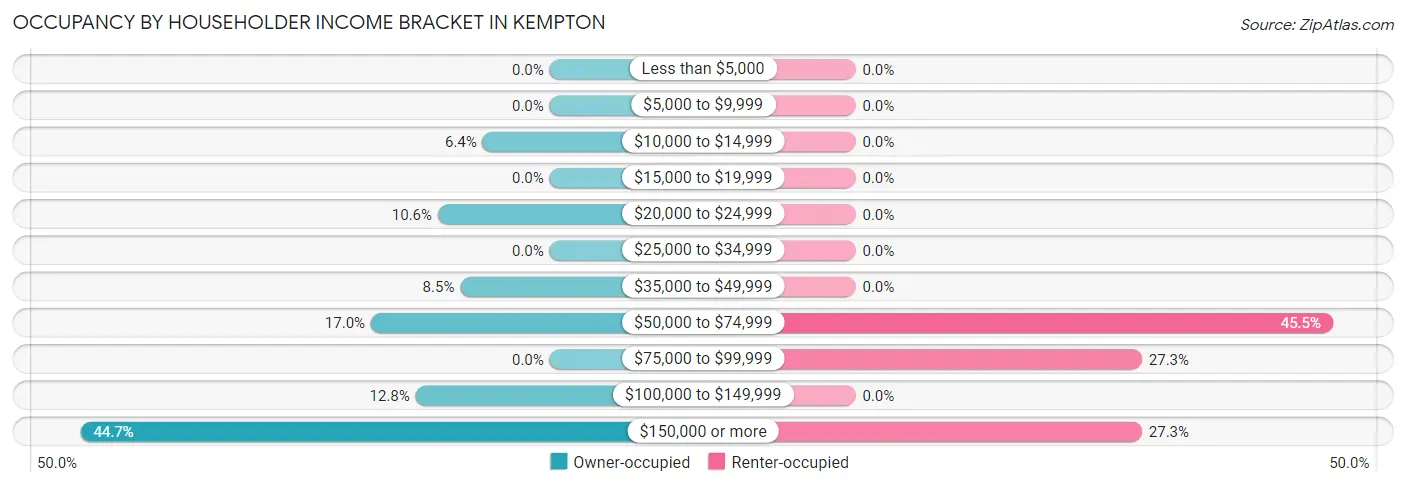
| Income Bracket | Owner-occupied | Renter-occupied |
| Less than $5,000 | 0 (0.0%) | 0 (0.0%) |
| $5,000 to $9,999 | 0 (0.0%) | 0 (0.0%) |
| $10,000 to $14,999 | 3 (6.4%) | 0 (0.0%) |
| $15,000 to $19,999 | 0 (0.0%) | 0 (0.0%) |
| $20,000 to $24,999 | 5 (10.6%) | 0 (0.0%) |
| $25,000 to $34,999 | 0 (0.0%) | 0 (0.0%) |
| $35,000 to $49,999 | 4 (8.5%) | 0 (0.0%) |
| $50,000 to $74,999 | 8 (17.0%) | 5 (45.5%) |
| $75,000 to $99,999 | 0 (0.0%) | 3 (27.3%) |
| $100,000 to $149,999 | 6 (12.8%) | 0 (0.0%) |
| $150,000 or more | 21 (44.7%) | 3 (27.3%) |
| Total | 47 (100.0%) | 11 (100.0%) |
Monthly Housing Cost Tiers in Kempton
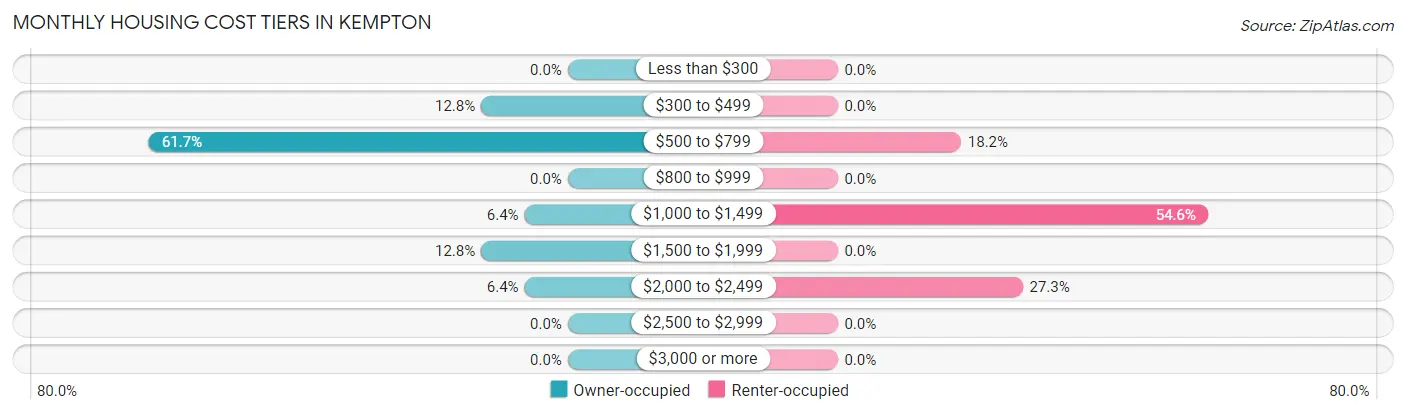
| Monthly Cost | Owner-occupied | Renter-occupied |
| Less than $300 | 0 (0.0%) | 0 (0.0%) |
| $300 to $499 | 6 (12.8%) | 0 (0.0%) |
| $500 to $799 | 29 (61.7%) | 2 (18.2%) |
| $800 to $999 | 0 (0.0%) | 0 (0.0%) |
| $1,000 to $1,499 | 3 (6.4%) | 6 (54.5%) |
| $1,500 to $1,999 | 6 (12.8%) | 0 (0.0%) |
| $2,000 to $2,499 | 3 (6.4%) | 3 (27.3%) |
| $2,500 to $2,999 | 0 (0.0%) | 0 (0.0%) |
| $3,000 or more | 0 (0.0%) | 0 (0.0%) |
| Total | 47 (100.0%) | 11 (100.0%) |
Physical Housing Characteristics in Kempton
Housing Structures in Kempton
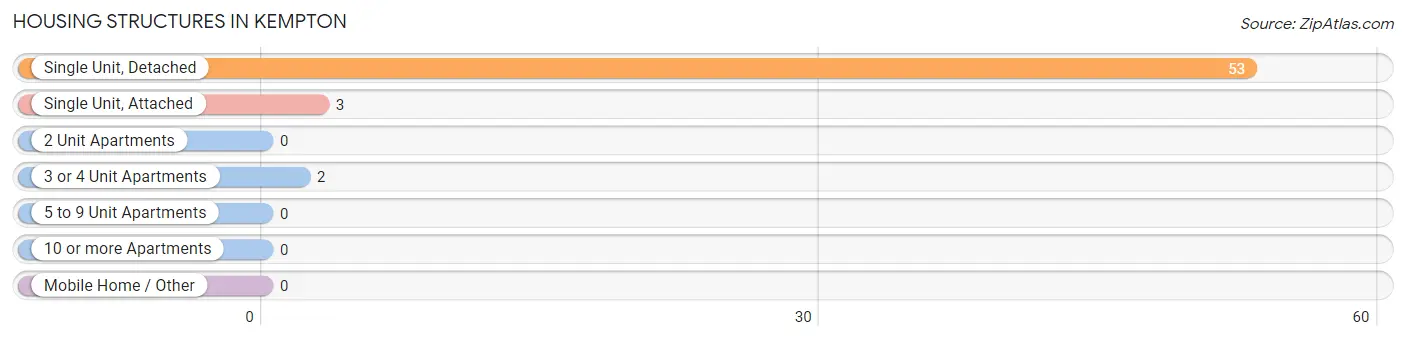
| Structure Type | # Housing Units | % Housing Units |
| Single Unit, Detached | 53 | 91.4% |
| Single Unit, Attached | 3 | 5.2% |
| 2 Unit Apartments | 0 | 0.0% |
| 3 or 4 Unit Apartments | 2 | 3.5% |
| 5 to 9 Unit Apartments | 0 | 0.0% |
| 10 or more Apartments | 0 | 0.0% |
| Mobile Home / Other | 0 | 0.0% |
| Total | 58 | 100.0% |
Housing Structures by Occupancy in Kempton
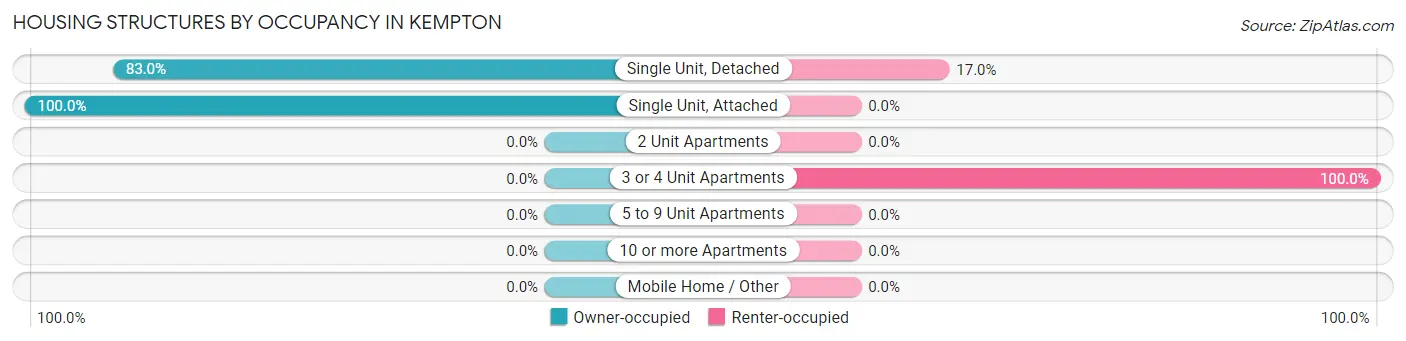
| Structure Type | Owner-occupied | Renter-occupied |
| Single Unit, Detached | 44 (83.0%) | 9 (17.0%) |
| Single Unit, Attached | 3 (100.0%) | 0 (0.0%) |
| 2 Unit Apartments | 0 (0.0%) | 0 (0.0%) |
| 3 or 4 Unit Apartments | 0 (0.0%) | 2 (100.0%) |
| 5 to 9 Unit Apartments | 0 (0.0%) | 0 (0.0%) |
| 10 or more Apartments | 0 (0.0%) | 0 (0.0%) |
| Mobile Home / Other | 0 (0.0%) | 0 (0.0%) |
| Total | 47 (81.0%) | 11 (19.0%) |
Housing Structures by Number of Rooms in Kempton
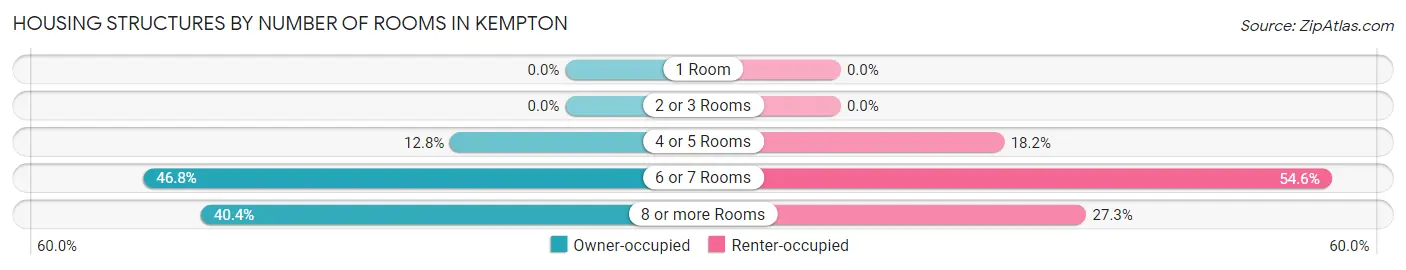
| Number of Rooms | Owner-occupied | Renter-occupied |
| 1 Room | 0 (0.0%) | 0 (0.0%) |
| 2 or 3 Rooms | 0 (0.0%) | 0 (0.0%) |
| 4 or 5 Rooms | 6 (12.8%) | 2 (18.2%) |
| 6 or 7 Rooms | 22 (46.8%) | 6 (54.5%) |
| 8 or more Rooms | 19 (40.4%) | 3 (27.3%) |
| Total | 47 (100.0%) | 11 (100.0%) |
Housing Structure by Heating Type in Kempton
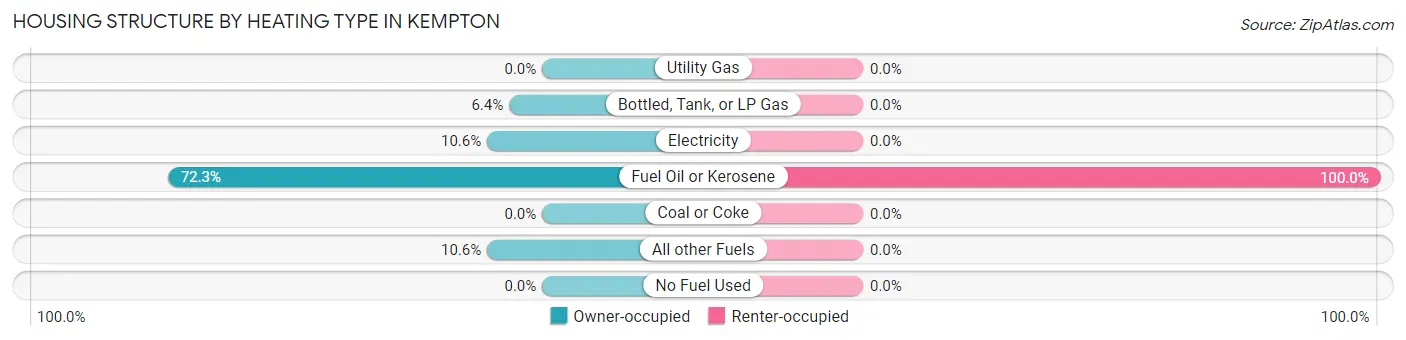
| Heating Type | Owner-occupied | Renter-occupied |
| Utility Gas | 0 (0.0%) | 0 (0.0%) |
| Bottled, Tank, or LP Gas | 3 (6.4%) | 0 (0.0%) |
| Electricity | 5 (10.6%) | 0 (0.0%) |
| Fuel Oil or Kerosene | 34 (72.3%) | 11 (100.0%) |
| Coal or Coke | 0 (0.0%) | 0 (0.0%) |
| All other Fuels | 5 (10.6%) | 0 (0.0%) |
| No Fuel Used | 0 (0.0%) | 0 (0.0%) |
| Total | 47 (100.0%) | 11 (100.0%) |
Household Vehicle Usage in Kempton
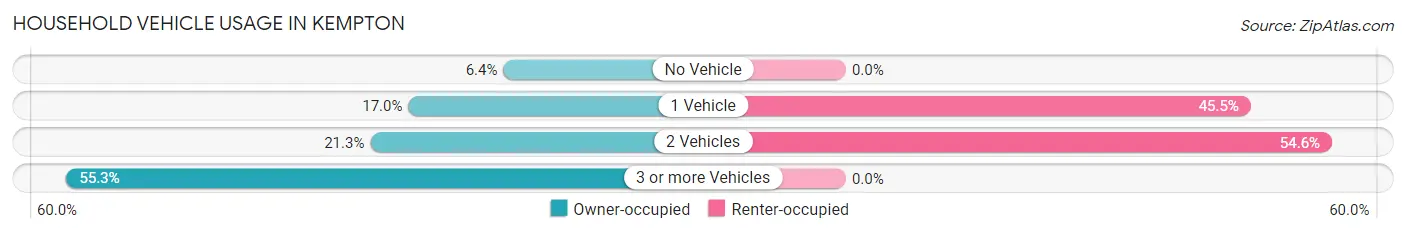
| Vehicles per Household | Owner-occupied | Renter-occupied |
| No Vehicle | 3 (6.4%) | 0 (0.0%) |
| 1 Vehicle | 8 (17.0%) | 5 (45.5%) |
| 2 Vehicles | 10 (21.3%) | 6 (54.5%) |
| 3 or more Vehicles | 26 (55.3%) | 0 (0.0%) |
| Total | 47 (100.0%) | 11 (100.0%) |
Real Estate & Mortgages in Kempton
Real Estate and Mortgage Overview in Kempton
| Characteristic | Without Mortgage | With Mortgage |
| Housing Units | 35 | 12 |
| Median Property Value | $236,100 | $225,000 |
| Median Household Income | $152,656 | $3 |
| Monthly Housing Costs | $630 | $0 |
| Real Estate Taxes | $3,500 | $0 |
Property Value by Mortgage Status in Kempton
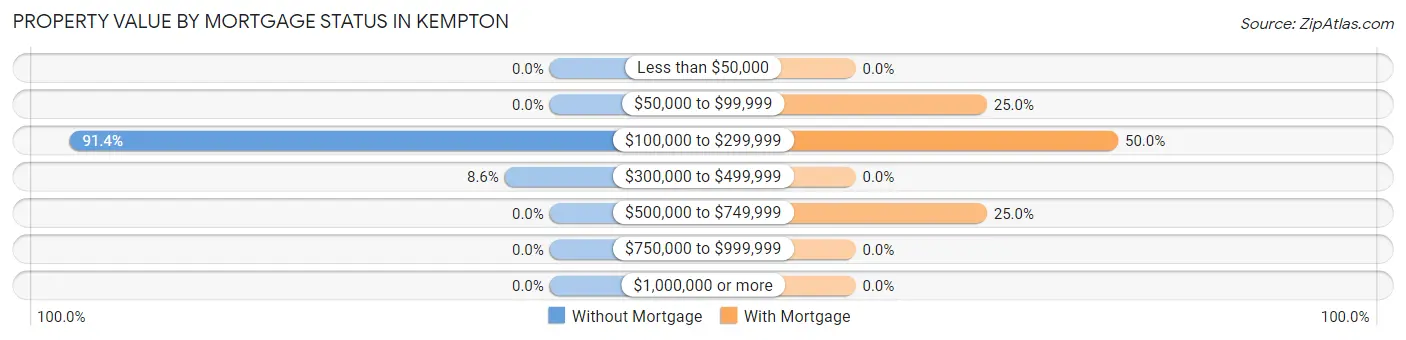
| Property Value | Without Mortgage | With Mortgage |
| Less than $50,000 | 0 (0.0%) | 0 (0.0%) |
| $50,000 to $99,999 | 0 (0.0%) | 3 (25.0%) |
| $100,000 to $299,999 | 32 (91.4%) | 6 (50.0%) |
| $300,000 to $499,999 | 3 (8.6%) | 0 (0.0%) |
| $500,000 to $749,999 | 0 (0.0%) | 3 (25.0%) |
| $750,000 to $999,999 | 0 (0.0%) | 0 (0.0%) |
| $1,000,000 or more | 0 (0.0%) | 0 (0.0%) |
| Total | 35 (100.0%) | 12 (100.0%) |
Household Income by Mortgage Status in Kempton
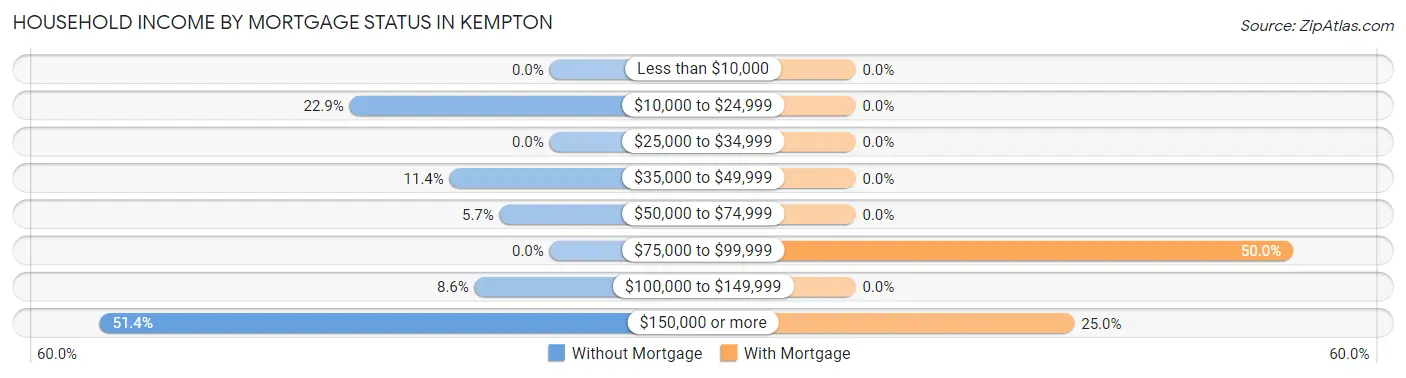
| Household Income | Without Mortgage | With Mortgage |
| Less than $10,000 | 0 (0.0%) | 0 (0.0%) |
| $10,000 to $24,999 | 8 (22.9%) | 0 (0.0%) |
| $25,000 to $34,999 | 0 (0.0%) | 0 (0.0%) |
| $35,000 to $49,999 | 4 (11.4%) | 0 (0.0%) |
| $50,000 to $74,999 | 2 (5.7%) | 0 (0.0%) |
| $75,000 to $99,999 | 0 (0.0%) | 6 (50.0%) |
| $100,000 to $149,999 | 3 (8.6%) | 0 (0.0%) |
| $150,000 or more | 18 (51.4%) | 3 (25.0%) |
| Total | 35 (100.0%) | 12 (100.0%) |
Property Value to Household Income Ratio in Kempton
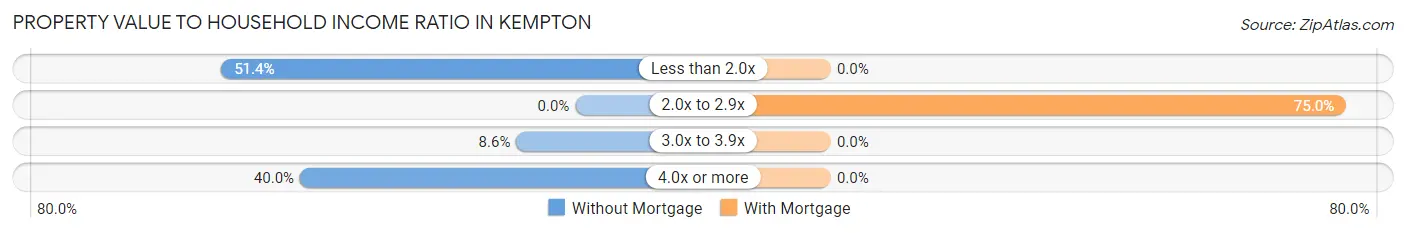
| Value-to-Income Ratio | Without Mortgage | With Mortgage |
| Less than 2.0x | 18 (51.4%) | 0 (0.0%) |
| 2.0x to 2.9x | 0 (0.0%) | 9 (75.0%) |
| 3.0x to 3.9x | 3 (8.6%) | 0 (0.0%) |
| 4.0x or more | 14 (40.0%) | 0 (0.0%) |
| Total | 35 (100.0%) | 12 (100.0%) |
Real Estate Taxes by Mortgage Status in Kempton

| Property Taxes | Without Mortgage | With Mortgage |
| Less than $800 | 0 (0.0%) | 0 (0.0%) |
| $800 to $1,499 | 0 (0.0%) | 0 (0.0%) |
| $800 to $1,499 | 35 (100.0%) | 3 (25.0%) |
| Total | 35 (100.0%) | 12 (100.0%) |
Health & Disability in Kempton
Health Insurance Coverage by Age in Kempton
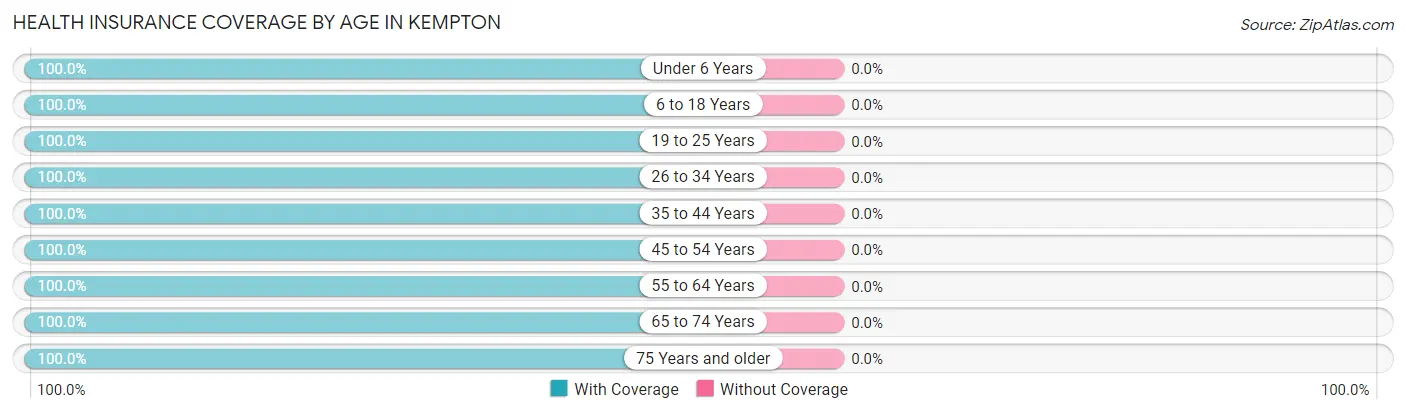
| Age Bracket | With Coverage | Without Coverage |
| Under 6 Years | 14 (100.0%) | 0 (0.0%) |
| 6 to 18 Years | 38 (100.0%) | 0 (0.0%) |
| 19 to 25 Years | 11 (100.0%) | 0 (0.0%) |
| 26 to 34 Years | 23 (100.0%) | 0 (0.0%) |
| 35 to 44 Years | 15 (100.0%) | 0 (0.0%) |
| 45 to 54 Years | 30 (100.0%) | 0 (0.0%) |
| 55 to 64 Years | 13 (100.0%) | 0 (0.0%) |
| 65 to 74 Years | 11 (100.0%) | 0 (0.0%) |
| 75 Years and older | 3 (100.0%) | 0 (0.0%) |
| Total | 158 (100.0%) | 0 (0.0%) |
Health Insurance Coverage by Citizenship Status in Kempton
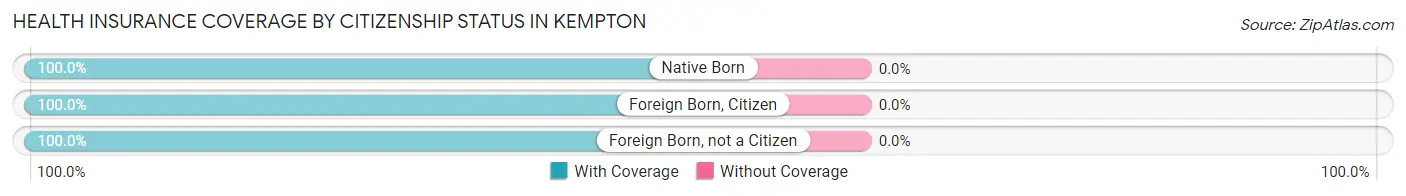
| Citizenship Status | With Coverage | Without Coverage |
| Native Born | 14 (100.0%) | 0 (0.0%) |
| Foreign Born, Citizen | 38 (100.0%) | 0 (0.0%) |
| Foreign Born, not a Citizen | 11 (100.0%) | 0 (0.0%) |
Health Insurance Coverage by Household Income in Kempton
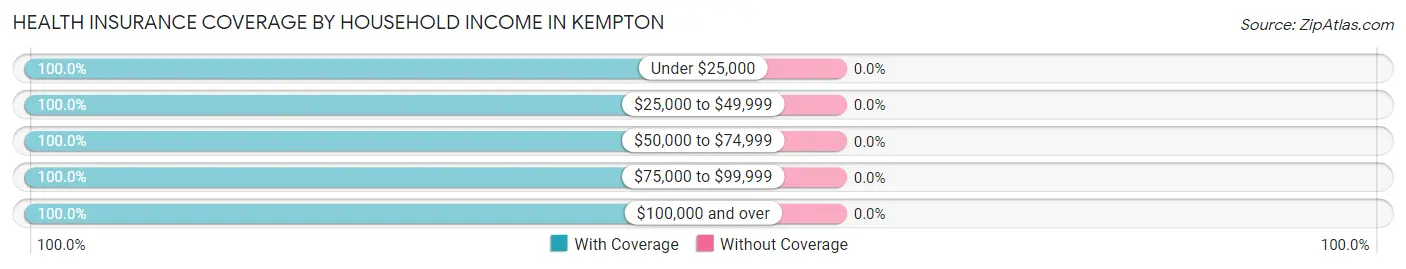
| Household Income | With Coverage | Without Coverage |
| Under $25,000 | 10 (100.0%) | 0 (0.0%) |
| $25,000 to $49,999 | 7 (100.0%) | 0 (0.0%) |
| $50,000 to $74,999 | 28 (100.0%) | 0 (0.0%) |
| $75,000 to $99,999 | 6 (100.0%) | 0 (0.0%) |
| $100,000 and over | 107 (100.0%) | 0 (0.0%) |
Public vs Private Health Insurance Coverage by Age in Kempton
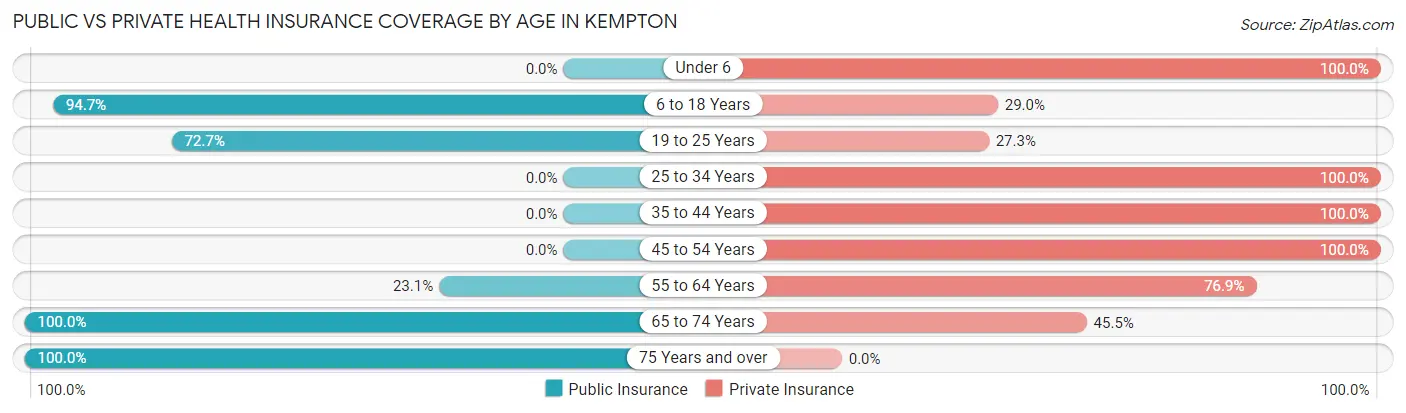
| Age Bracket | Public Insurance | Private Insurance |
| Under 6 | 0 (0.0%) | 14 (100.0%) |
| 6 to 18 Years | 36 (94.7%) | 11 (28.9%) |
| 19 to 25 Years | 8 (72.7%) | 3 (27.3%) |
| 25 to 34 Years | 0 (0.0%) | 23 (100.0%) |
| 35 to 44 Years | 0 (0.0%) | 15 (100.0%) |
| 45 to 54 Years | 0 (0.0%) | 30 (100.0%) |
| 55 to 64 Years | 3 (23.1%) | 10 (76.9%) |
| 65 to 74 Years | 11 (100.0%) | 5 (45.5%) |
| 75 Years and over | 3 (100.0%) | 0 (0.0%) |
| Total | 61 (38.6%) | 111 (70.3%) |
Disability Status by Sex by Age in Kempton
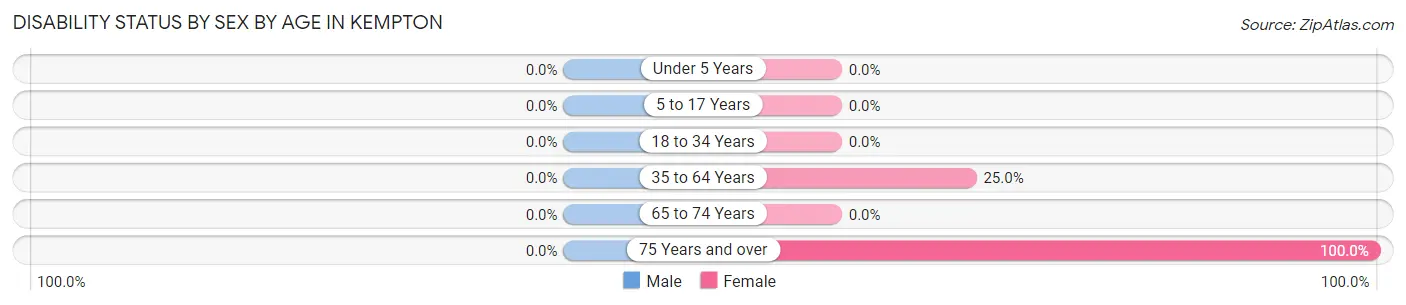
| Age Bracket | Male | Female |
| Under 5 Years | 0 (0.0%) | 0 (0.0%) |
| 5 to 17 Years | 0 (0.0%) | 0 (0.0%) |
| 18 to 34 Years | 0 (0.0%) | 0 (0.0%) |
| 35 to 64 Years | 0 (0.0%) | 7 (25.0%) |
| 65 to 74 Years | 0 (0.0%) | 0 (0.0%) |
| 75 Years and over | 0 (0.0%) | 3 (100.0%) |
Disability Class by Sex by Age in Kempton
Disability Class: Hearing Difficulty
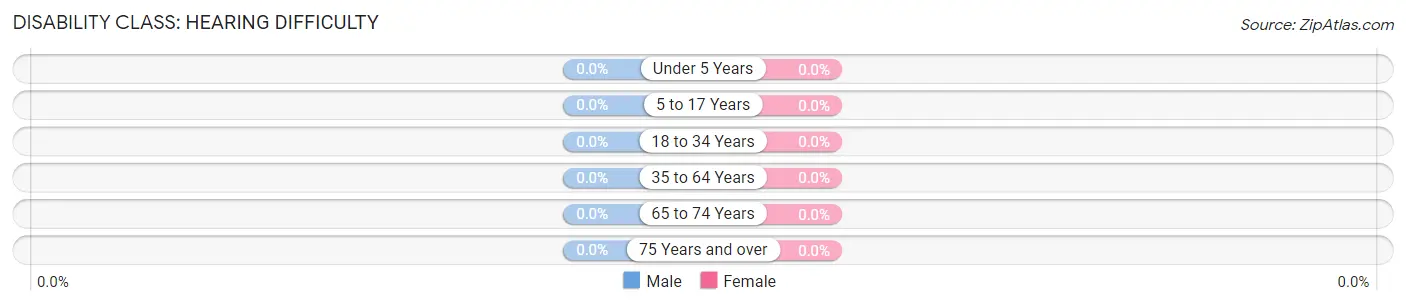
| Age Bracket | Male | Female |
| Under 5 Years | 0 (0.0%) | 0 (0.0%) |
| 5 to 17 Years | 0 (0.0%) | 0 (0.0%) |
| 18 to 34 Years | 0 (0.0%) | 0 (0.0%) |
| 35 to 64 Years | 0 (0.0%) | 0 (0.0%) |
| 65 to 74 Years | 0 (0.0%) | 0 (0.0%) |
| 75 Years and over | 0 (0.0%) | 0 (0.0%) |
Disability Class: Vision Difficulty
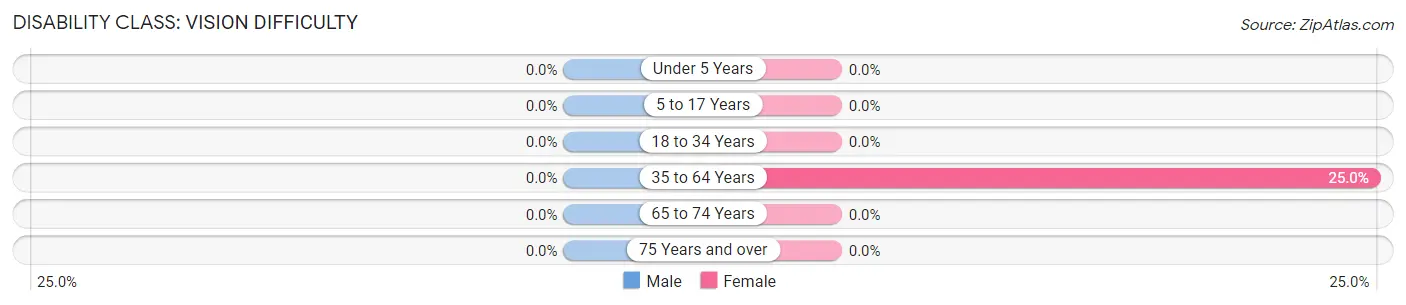
| Age Bracket | Male | Female |
| Under 5 Years | 0 (0.0%) | 0 (0.0%) |
| 5 to 17 Years | 0 (0.0%) | 0 (0.0%) |
| 18 to 34 Years | 0 (0.0%) | 0 (0.0%) |
| 35 to 64 Years | 0 (0.0%) | 7 (25.0%) |
| 65 to 74 Years | 0 (0.0%) | 0 (0.0%) |
| 75 Years and over | 0 (0.0%) | 0 (0.0%) |
Disability Class: Cognitive Difficulty
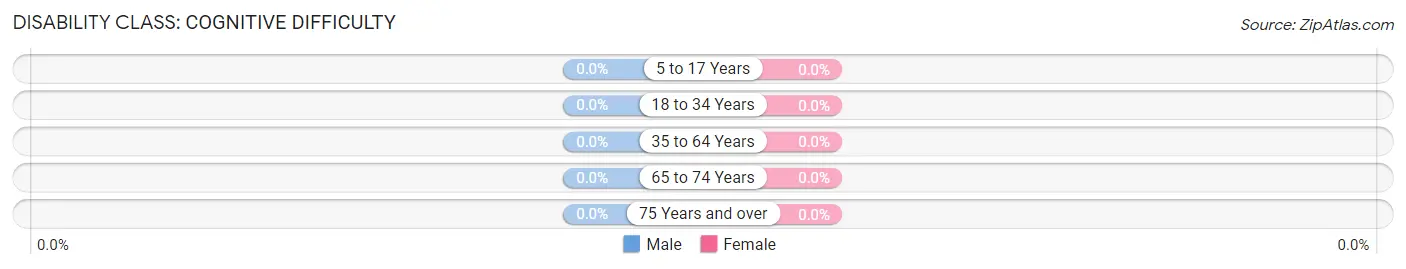
| Age Bracket | Male | Female |
| 5 to 17 Years | 0 (0.0%) | 0 (0.0%) |
| 18 to 34 Years | 0 (0.0%) | 0 (0.0%) |
| 35 to 64 Years | 0 (0.0%) | 0 (0.0%) |
| 65 to 74 Years | 0 (0.0%) | 0 (0.0%) |
| 75 Years and over | 0 (0.0%) | 0 (0.0%) |
Disability Class: Ambulatory Difficulty
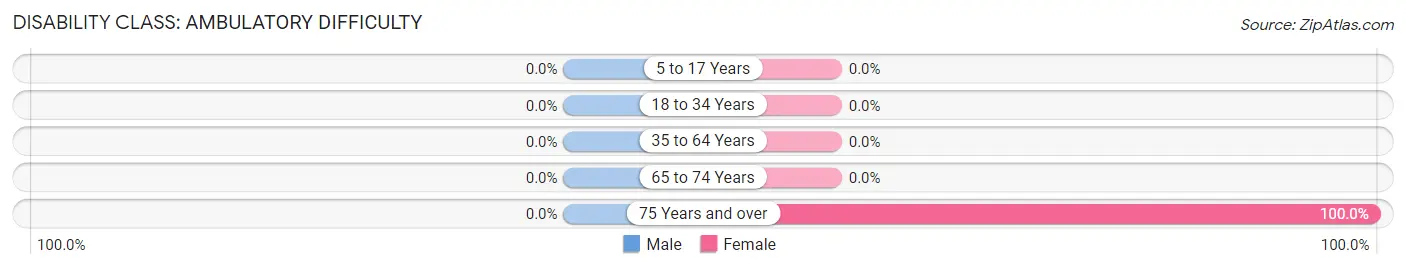
| Age Bracket | Male | Female |
| 5 to 17 Years | 0 (0.0%) | 0 (0.0%) |
| 18 to 34 Years | 0 (0.0%) | 0 (0.0%) |
| 35 to 64 Years | 0 (0.0%) | 0 (0.0%) |
| 65 to 74 Years | 0 (0.0%) | 0 (0.0%) |
| 75 Years and over | 0 (0.0%) | 3 (100.0%) |
Disability Class: Self-Care Difficulty
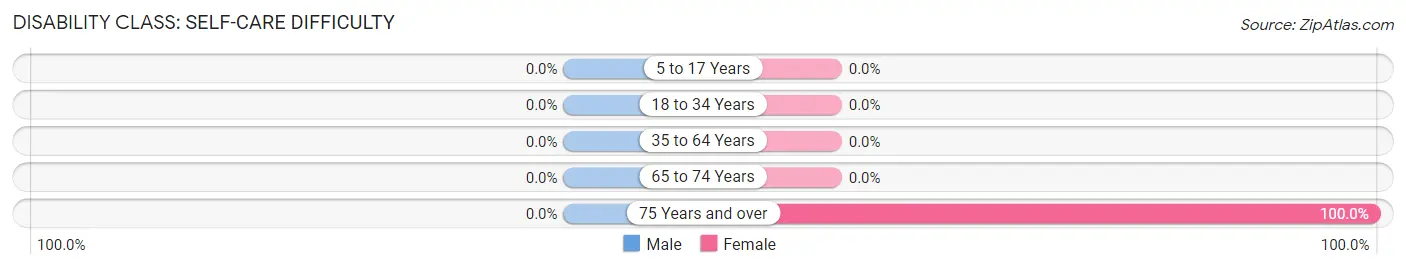
| Age Bracket | Male | Female |
| 5 to 17 Years | 0 (0.0%) | 0 (0.0%) |
| 18 to 34 Years | 0 (0.0%) | 0 (0.0%) |
| 35 to 64 Years | 0 (0.0%) | 0 (0.0%) |
| 65 to 74 Years | 0 (0.0%) | 0 (0.0%) |
| 75 Years and over | 0 (0.0%) | 3 (100.0%) |
Technology Access in Kempton
Computing Device Access in Kempton
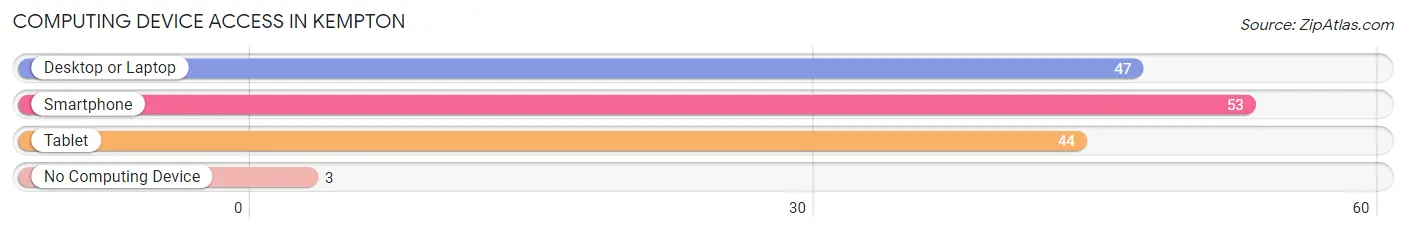
| Device Type | # Households | % Households |
| Desktop or Laptop | 47 | 81.0% |
| Smartphone | 53 | 91.4% |
| Tablet | 44 | 75.9% |
| No Computing Device | 3 | 5.2% |
| Total | 58 | 100.0% |
Internet Access in Kempton
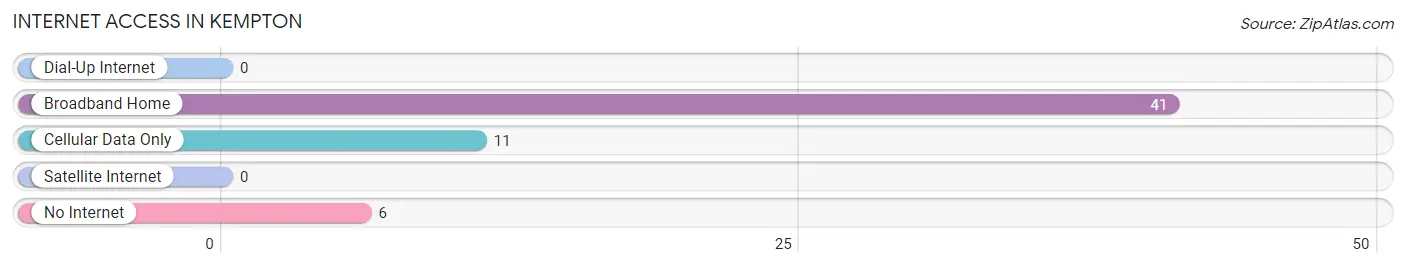
| Internet Type | # Households | % Households |
| Dial-Up Internet | 0 | 0.0% |
| Broadband Home | 41 | 70.7% |
| Cellular Data Only | 11 | 19.0% |
| Satellite Internet | 0 | 0.0% |
| No Internet | 6 | 10.3% |
| Total | 58 | 100.0% |
Kempton Summary
Kempton, Pennsylvania is a small borough located in Berks County, Pennsylvania. It is situated in the foothills of the Blue Mountains, approximately 25 miles northwest of Reading. The population of Kempton was 1,093 at the 2010 census.
History
Kempton was founded in 1845 by a group of German immigrants who had settled in the area. The town was named after the German city of Kempten, which is located in Bavaria. The first settlers were mostly farmers, and the town quickly grew to include a post office, a general store, a blacksmith shop, and a school.
In the late 19th century, Kempton became a popular tourist destination due to its proximity to the Blue Mountains. The town was home to several hotels, including the Kempton Hotel, which was built in 1891. The hotel was a popular destination for visitors from Philadelphia and other nearby cities.
Geography
Kempton is located at 40°33'N 75°45'W (40.55, -75.75). According to the United States Census Bureau, the borough has a total area of 0.6 square miles (1.6 km2), all of it land.
The borough is located in the foothills of the Blue Mountains, and is surrounded by rolling hills and farmland. The nearby Schuylkill River provides recreational opportunities for fishing and boating.
Economy
Kempton is a small, rural community with a limited economy. The town is home to several small businesses, including a general store, a hardware store, and a few restaurants. The town also has a small industrial park, which is home to several small manufacturing companies.
The town is also home to several farms, which produce a variety of crops, including corn, soybeans, and hay. The nearby Blue Mountains provide opportunities for hunting, fishing, and camping.
Demographics
As of the 2010 census, the population of Kempton was 1,093. The racial makeup of the borough was 97.2% White, 0.7% African American, 0.2% Native American, 0.2% Asian, 0.2% from other races, and 1.7% from two or more races. Hispanic or Latino of any race were 1.3% of the population.
The median income for a household in the borough was $45,000, and the median income for a family was $50,000. The per capita income for the borough was $20,000. About 8.3% of families and 10.2% of the population were below the poverty line, including 14.3% of those under age 18 and 6.3% of those age 65 or over.
Common Questions
What is Per Capita Income in Kempton?
Per Capita income in Kempton is $38,570.
What is the Median Family Income in Kempton?
Median Family Income in Kempton is $142,083.
What is the Median Household income in Kempton?
Median Household Income in Kempton is $105,833.
What is Income or Wage Gap in Kempton?
Income or Wage Gap in Kempton is 12.8%.
Women in Kempton earn 87.2 cents for every dollar earned by a man.
What is Inequality or Gini Index in Kempton?
Inequality or Gini Index in Kempton is 0.32.
What is the Total Population of Kempton?
Total Population of Kempton is 158.
What is the Total Male Population of Kempton?
Total Male Population of Kempton is 87.
What is the Total Female Population of Kempton?
Total Female Population of Kempton is 71.
What is the Ratio of Males per 100 Females in Kempton?
There are 122.54 Males per 100 Females in Kempton.
What is the Ratio of Females per 100 Males in Kempton?
There are 81.61 Females per 100 Males in Kempton.
What is the Median Population Age in Kempton?
Median Population Age in Kempton is 31.7 Years.
What is the Average Family Size in Kempton
Average Family Size in Kempton is 3.7 People.
What is the Average Household Size in Kempton
Average Household Size in Kempton is 2.7 People.
How Large is the Labor Force in Kempton?
There are 84 People in the Labor Forcein in Kempton.
What is the Percentage of People in the Labor Force in Kempton?
72.4% of People are in the Labor Force in Kempton.