Jenkintown borough, PA Map & Demographics
Jenkintown borough Overview
$70,057
PER CAPITA INCOME
$160,051
AVG FAMILY INCOME
$118,750
AVG HOUSEHOLD INCOME
28.2%
WAGE / INCOME GAP [ % ]
71.8¢/ $1
WAGE / INCOME GAP [ $ ]
0.54
INEQUALITY / GINI INDEX
4,703
TOTAL POPULATION
2,431
MALE POPULATION
2,272
FEMALE POPULATION
107.00
MALES / 100 FEMALES
93.46
FEMALES / 100 MALES
42.7
MEDIAN AGE
3.2
AVG FAMILY SIZE
2.4
AVG HOUSEHOLD SIZE
2,360
LABOR FORCE [ PEOPLE ]
65.8%
PERCENT IN LABOR FORCE
6.1%
UNEMPLOYMENT RATE
Income in Jenkintown borough
Income Overview in Jenkintown borough
Per Capita Income in Jenkintown borough is $70,057, while median incomes of families and households are $160,051 and $118,750 respectively.
| Characteristic | Number | Measure |
| Per Capita Income | 4,703 | $70,057 |
| Median Family Income | 1,188 | $160,051 |
| Mean Family Income | 1,188 | $225,660 |
| Median Household Income | 1,988 | $118,750 |
| Mean Household Income | 1,988 | $164,300 |
| Income Deficit | 1,188 | $0 |
| Wage / Income Gap (%) | 4,703 | 28.24% |
| Wage / Income Gap ($) | 4,703 | 71.76¢ per $1 |
| Gini / Inequality Index | 4,703 | 0.54 |
Earnings by Sex in Jenkintown borough
Average Earnings in Jenkintown borough are $80,575, $92,582 for men and $66,438 for women, a difference of 28.2%.
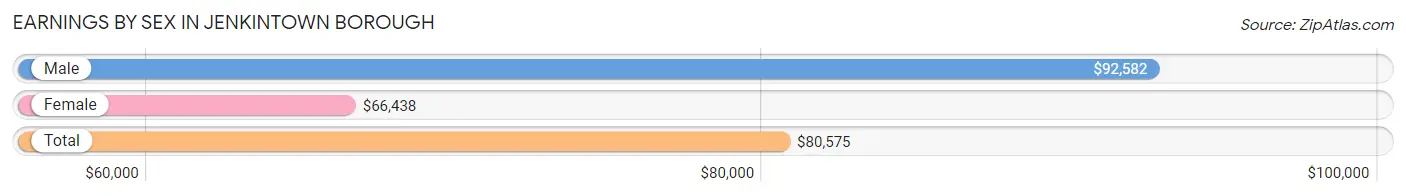
| Sex | Number | Average Earnings |
| Male | 1,225 (52.3%) | $92,582 |
| Female | 1,118 (47.7%) | $66,438 |
| Total | 2,343 (100.0%) | $80,575 |
Earnings by Sex by Income Bracket in Jenkintown borough
The most common earnings brackets in Jenkintown borough are $100,000+ for men (471 | 38.5%) and $100,000+ for women (414 | 37.0%).
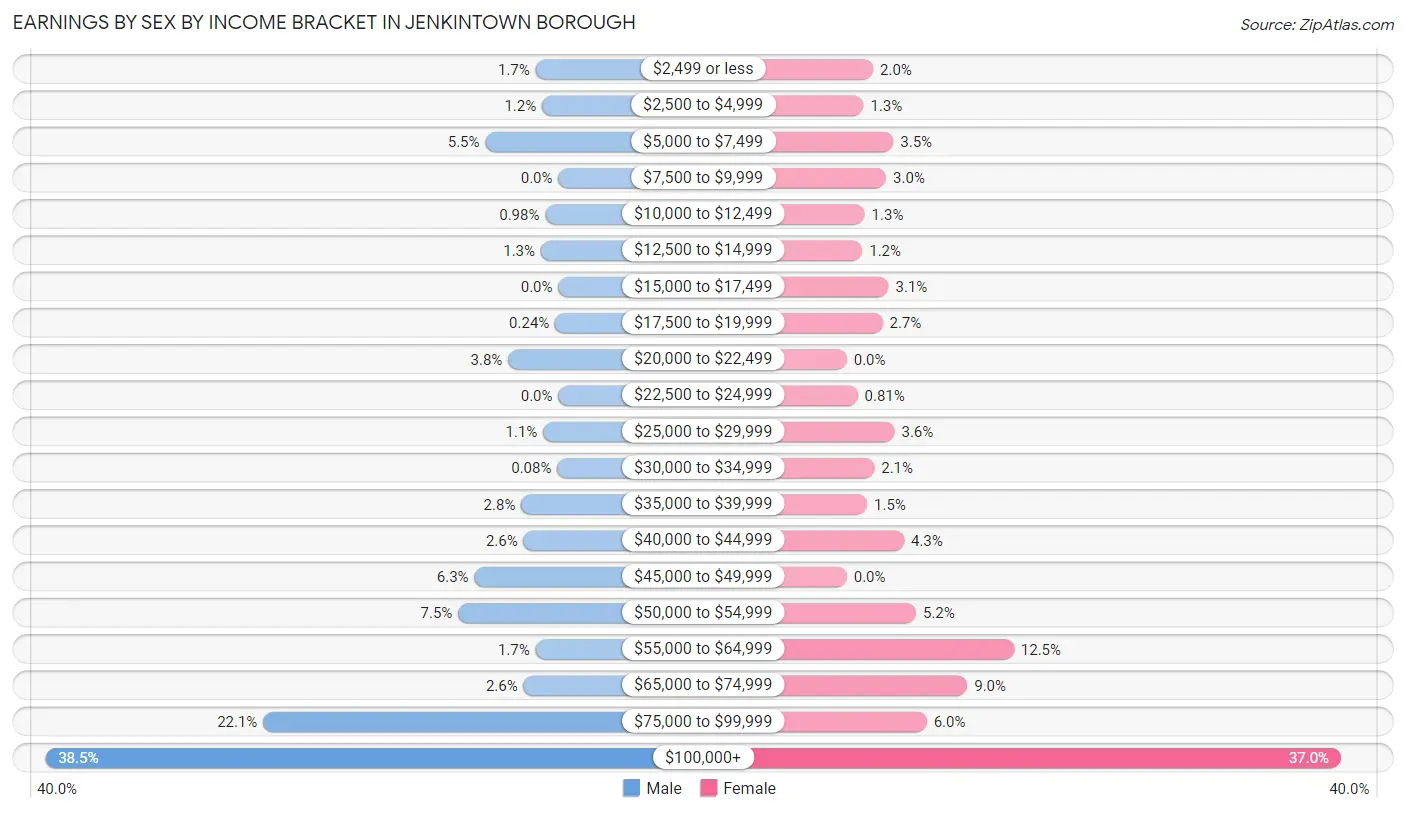
| Income | Male | Female |
| $2,499 or less | 21 (1.7%) | 22 (2.0%) |
| $2,500 to $4,999 | 15 (1.2%) | 14 (1.3%) |
| $5,000 to $7,499 | 67 (5.5%) | 39 (3.5%) |
| $7,500 to $9,999 | 0 (0.0%) | 33 (2.9%) |
| $10,000 to $12,499 | 12 (1.0%) | 15 (1.3%) |
| $12,500 to $14,999 | 16 (1.3%) | 13 (1.2%) |
| $15,000 to $17,499 | 0 (0.0%) | 35 (3.1%) |
| $17,500 to $19,999 | 3 (0.2%) | 30 (2.7%) |
| $20,000 to $22,499 | 46 (3.8%) | 0 (0.0%) |
| $22,500 to $24,999 | 0 (0.0%) | 9 (0.8%) |
| $25,000 to $29,999 | 14 (1.1%) | 40 (3.6%) |
| $30,000 to $34,999 | 1 (0.1%) | 23 (2.1%) |
| $35,000 to $39,999 | 34 (2.8%) | 17 (1.5%) |
| $40,000 to $44,999 | 32 (2.6%) | 48 (4.3%) |
| $45,000 to $49,999 | 77 (6.3%) | 0 (0.0%) |
| $50,000 to $54,999 | 92 (7.5%) | 58 (5.2%) |
| $55,000 to $64,999 | 21 (1.7%) | 140 (12.5%) |
| $65,000 to $74,999 | 32 (2.6%) | 101 (9.0%) |
| $75,000 to $99,999 | 271 (22.1%) | 67 (6.0%) |
| $100,000+ | 471 (38.5%) | 414 (37.0%) |
| Total | 1,225 (100.0%) | 1,118 (100.0%) |
Earnings by Sex by Educational Attainment in Jenkintown borough
Average earnings in Jenkintown borough are $95,216 for men and $67,125 for women, a difference of 29.5%. Men with an educational attainment of graduate degree enjoy the highest average annual earnings of $106,042, while those with bachelor's degree education earn the least with $84,831. Women with an educational attainment of graduate degree earn the most with the average annual earnings of $105,909, while those with bachelor's degree education have the smallest earnings of $61,923.
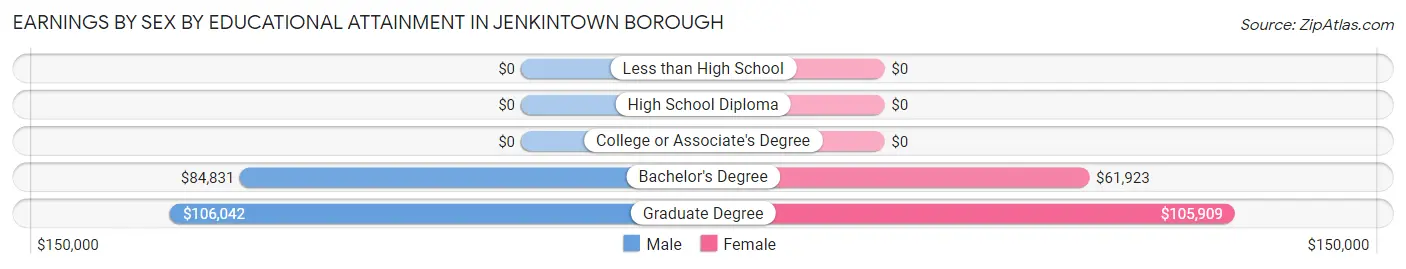
| Educational Attainment | Male Income | Female Income |
| Less than High School | - | - |
| High School Diploma | - | - |
| College or Associate's Degree | - | - |
| Bachelor's Degree | $84,831 | $61,923 |
| Graduate Degree | $106,042 | $105,909 |
| Total | $95,216 | $67,125 |
Family Income in Jenkintown borough
Family Income Brackets in Jenkintown borough
According to the Jenkintown borough family income data, there are 388 families falling into the $200,000+ income range, which is the most common income bracket and makes up 32.7% of all families.
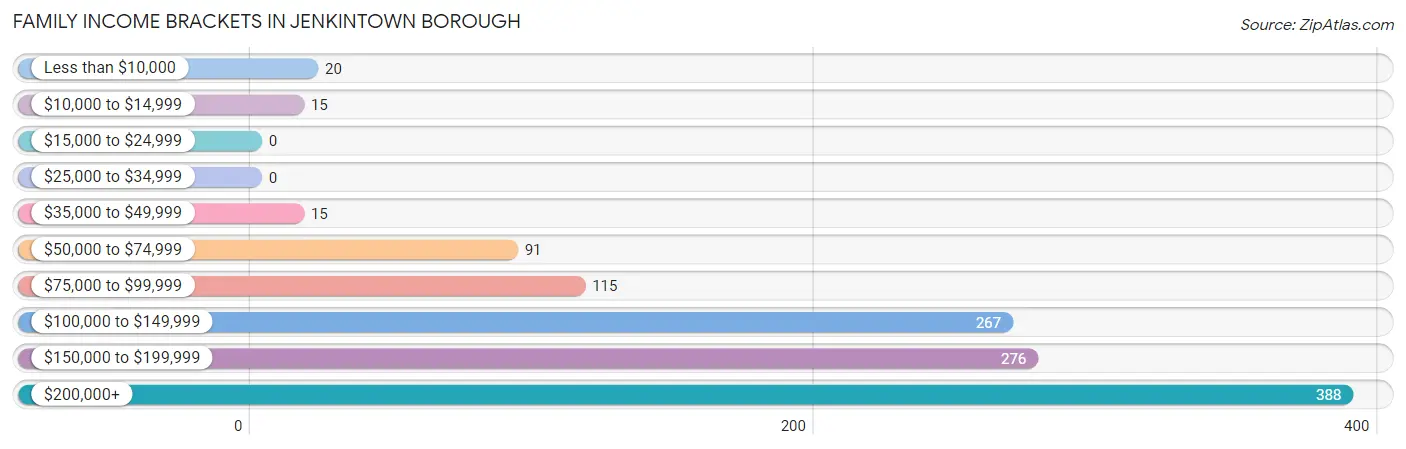
| Income Bracket | # Families | % Families |
| Less than $10,000 | 20 | 1.7% |
| $10,000 to $14,999 | 15 | 1.3% |
| $15,000 to $24,999 | 0 | 0.0% |
| $25,000 to $34,999 | 0 | 0.0% |
| $35,000 to $49,999 | 15 | 1.3% |
| $50,000 to $74,999 | 91 | 7.7% |
| $75,000 to $99,999 | 115 | 9.7% |
| $100,000 to $149,999 | 267 | 22.5% |
| $150,000 to $199,999 | 276 | 23.2% |
| $200,000+ | 388 | 32.7% |
Family Income by Famaliy Size in Jenkintown borough
5-person families (152 | 12.8%) account for the highest median family income in Jenkintown borough with $242,650 per family, while 3-person families (216 | 18.2%) have the highest median income of $72,237 per family member.
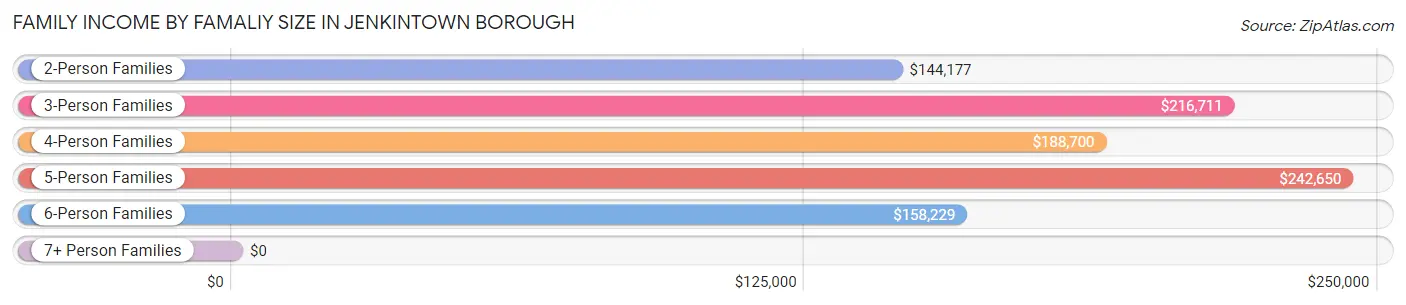
| Income Bracket | # Families | Median Income |
| 2-Person Families | 573 (48.2%) | $144,177 |
| 3-Person Families | 216 (18.2%) | $216,711 |
| 4-Person Families | 176 (14.8%) | $188,700 |
| 5-Person Families | 152 (12.8%) | $242,650 |
| 6-Person Families | 62 (5.2%) | $158,229 |
| 7+ Person Families | 9 (0.8%) | $0 |
| Total | 1,188 (100.0%) | $160,051 |
Family Income by Number of Earners in Jenkintown borough
The median family income in Jenkintown borough is $160,051, with families comprising 3+ earners (60) having the highest median family income of $180,278, while families with no earners (118) have the lowest median family income of $86,176, accounting for 5.1% and 9.9% of families, respectively.
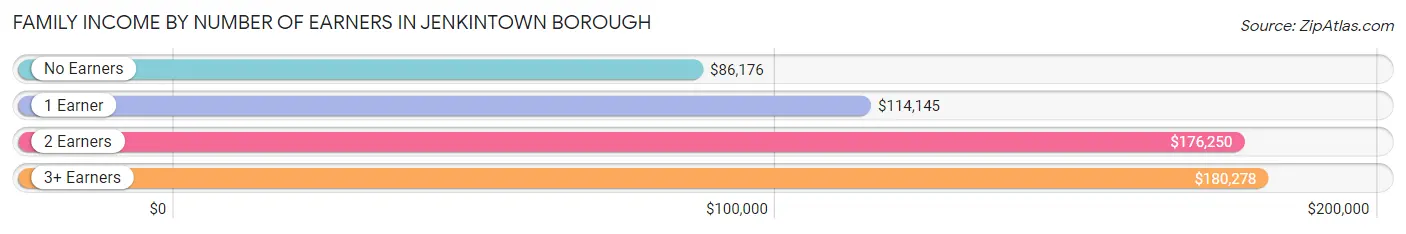
| Number of Earners | # Families | Median Income |
| No Earners | 118 (9.9%) | $86,176 |
| 1 Earner | 367 (30.9%) | $114,145 |
| 2 Earners | 643 (54.1%) | $176,250 |
| 3+ Earners | 60 (5.1%) | $180,278 |
| Total | 1,188 (100.0%) | $160,051 |
Household Income in Jenkintown borough
Household Income Brackets in Jenkintown borough
With 461 households falling in the category, the $200,000+ income range is the most frequent in Jenkintown borough, accounting for 23.2% of all households. In contrast, only 62 households (3.1%) fall into the $25,000 to $34,999 income bracket, making it the least populous group.
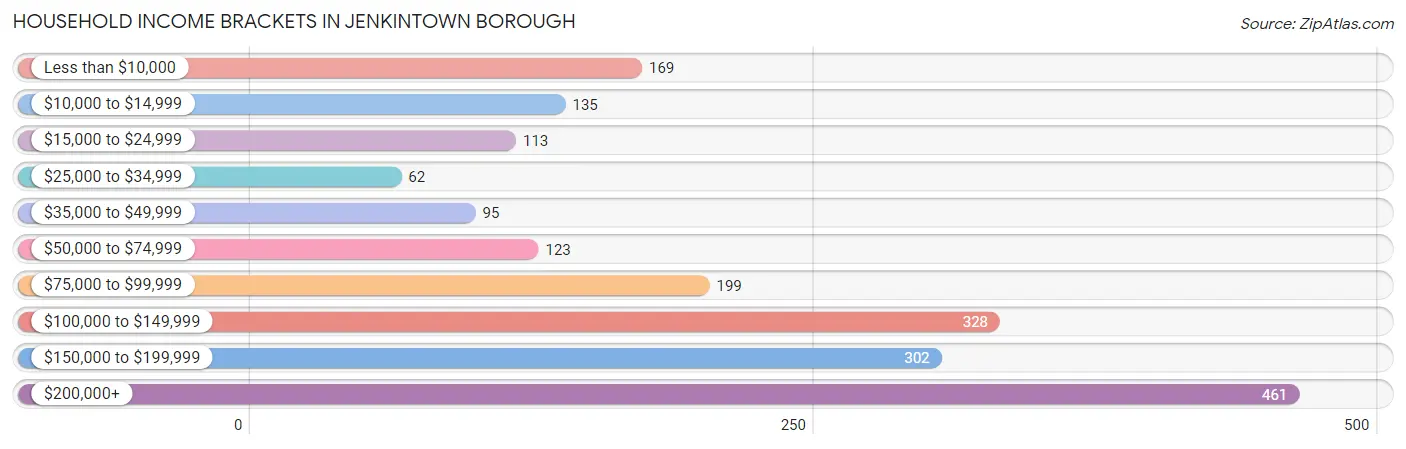
| Income Bracket | # Households | % Households |
| Less than $10,000 | 169 | 8.5% |
| $10,000 to $14,999 | 135 | 6.8% |
| $15,000 to $24,999 | 113 | 5.7% |
| $25,000 to $34,999 | 62 | 3.1% |
| $35,000 to $49,999 | 95 | 4.8% |
| $50,000 to $74,999 | 123 | 6.2% |
| $75,000 to $99,999 | 199 | 10.0% |
| $100,000 to $149,999 | 328 | 16.5% |
| $150,000 to $199,999 | 302 | 15.2% |
| $200,000+ | 461 | 23.2% |
Household Income by Householder Age in Jenkintown borough
The median household income in Jenkintown borough is $118,750, with the highest median household income of $147,517 found in the 45 to 64 years age bracket for the primary householder. A total of 847 households (42.6%) fall into this category.
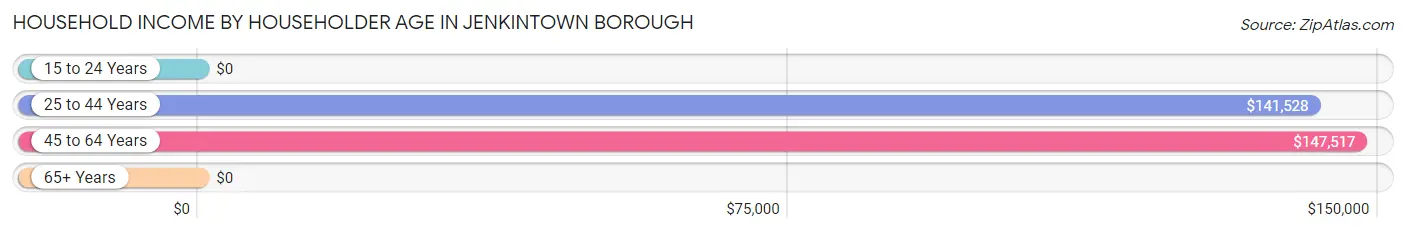
| Income Bracket | # Households | Median Income |
| 15 to 24 Years | 0 (0.0%) | $0 |
| 25 to 44 Years | 585 (29.4%) | $141,528 |
| 45 to 64 Years | 847 (42.6%) | $147,517 |
| 65+ Years | 556 (28.0%) | $0 |
| Total | 1,988 (100.0%) | $118,750 |
Poverty in Jenkintown borough
Income Below Poverty by Sex and Age in Jenkintown borough
With 7.8% poverty level for males and 10.8% for females among the residents of Jenkintown borough, 75 year old and over males and 75 year old and over females are the most vulnerable to poverty, with 79 males (34.5%) and 36 females (42.3%) in their respective age groups living below the poverty level.
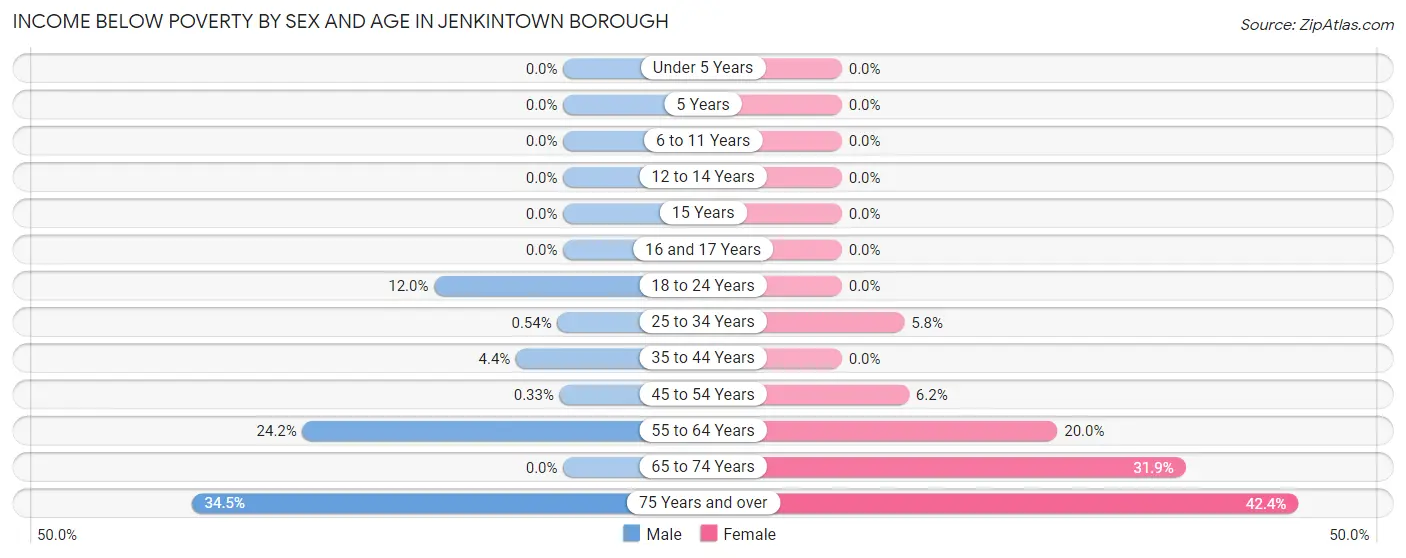
| Age Bracket | Male | Female |
| Under 5 Years | 0 (0.0%) | 0 (0.0%) |
| 5 Years | 0 (0.0%) | 0 (0.0%) |
| 6 to 11 Years | 0 (0.0%) | 0 (0.0%) |
| 12 to 14 Years | 0 (0.0%) | 0 (0.0%) |
| 15 Years | 0 (0.0%) | 0 (0.0%) |
| 16 and 17 Years | 0 (0.0%) | 0 (0.0%) |
| 18 to 24 Years | 23 (12.0%) | 0 (0.0%) |
| 25 to 34 Years | 1 (0.5%) | 16 (5.8%) |
| 35 to 44 Years | 16 (4.4%) | 0 (0.0%) |
| 45 to 54 Years | 1 (0.3%) | 17 (6.2%) |
| 55 to 64 Years | 68 (24.2%) | 73 (20.0%) |
| 65 to 74 Years | 0 (0.0%) | 104 (31.9%) |
| 75 Years and over | 79 (34.5%) | 36 (42.3%) |
| Total | 188 (7.8%) | 246 (10.8%) |
Income Above Poverty by Sex and Age in Jenkintown borough
According to the poverty statistics in Jenkintown borough, males aged under 5 years and females aged under 5 years are the age groups that are most secure financially, with 100.0% of males and 100.0% of females in these age groups living above the poverty line.
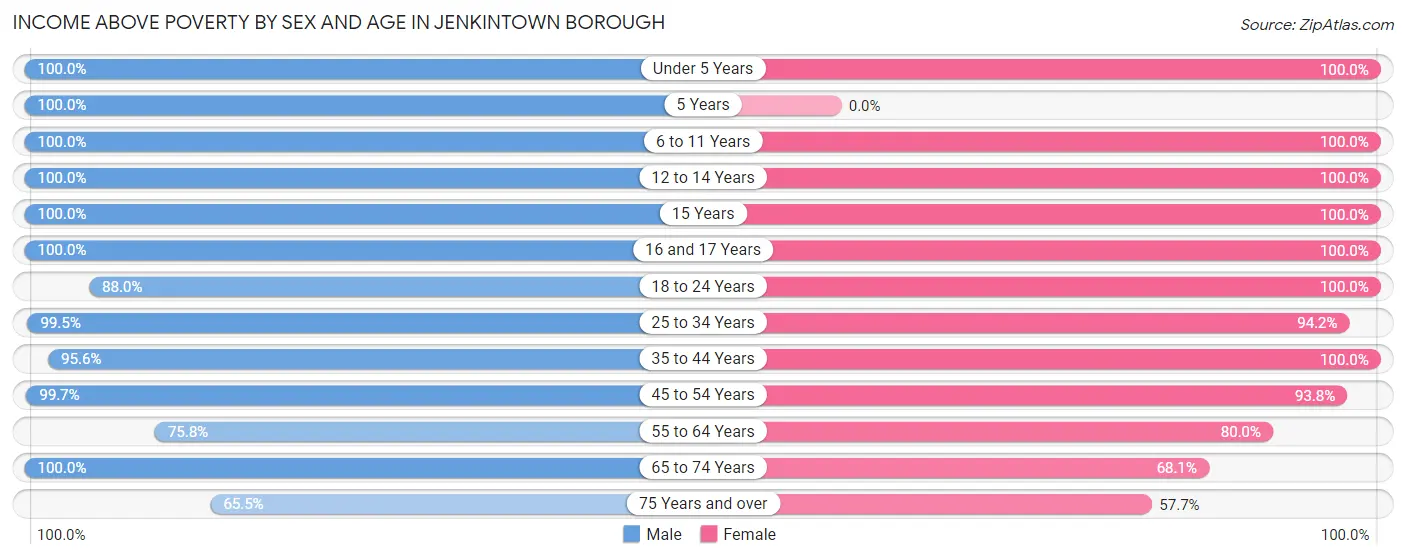
| Age Bracket | Male | Female |
| Under 5 Years | 92 (100.0%) | 188 (100.0%) |
| 5 Years | 51 (100.0%) | 0 (0.0%) |
| 6 to 11 Years | 310 (100.0%) | 247 (100.0%) |
| 12 to 14 Years | 55 (100.0%) | 89 (100.0%) |
| 15 Years | 12 (100.0%) | 40 (100.0%) |
| 16 and 17 Years | 113 (100.0%) | 12 (100.0%) |
| 18 to 24 Years | 169 (88.0%) | 51 (100.0%) |
| 25 to 34 Years | 185 (99.5%) | 260 (94.2%) |
| 35 to 44 Years | 349 (95.6%) | 320 (100.0%) |
| 45 to 54 Years | 306 (99.7%) | 256 (93.8%) |
| 55 to 64 Years | 213 (75.8%) | 292 (80.0%) |
| 65 to 74 Years | 206 (100.0%) | 222 (68.1%) |
| 75 Years and over | 150 (65.5%) | 49 (57.7%) |
| Total | 2,211 (92.2%) | 2,026 (89.2%) |
Income Below Poverty Among Married-Couple Families in Jenkintown borough
The poverty statistics for married-couple families in Jenkintown borough show that 2.1% or 20 of the total 943 families live below the poverty line. Families with no children have the highest poverty rate of 4.0%, comprising of 20 families. On the other hand, families with 1 or 2 children have the lowest poverty rate of 0.0%, which includes 0 families.
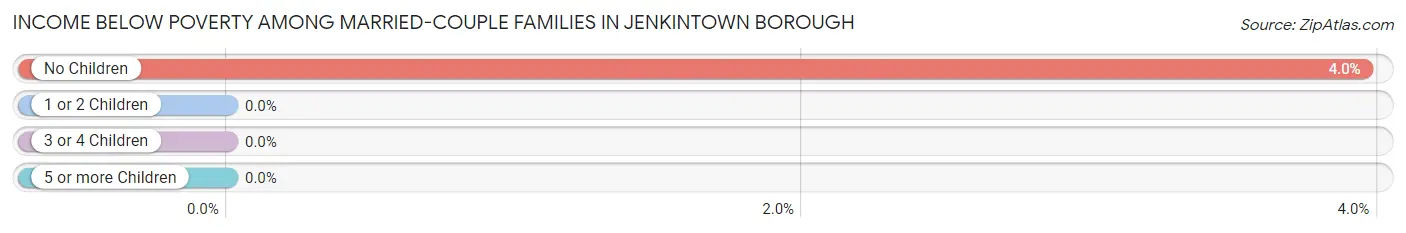
| Children | Above Poverty | Below Poverty |
| No Children | 486 (96.1%) | 20 (4.0%) |
| 1 or 2 Children | 228 (100.0%) | 0 (0.0%) |
| 3 or 4 Children | 209 (100.0%) | 0 (0.0%) |
| 5 or more Children | 0 (0.0%) | 0 (0.0%) |
| Total | 923 (97.9%) | 20 (2.1%) |
Income Below Poverty Among Single-Parent Households in Jenkintown borough
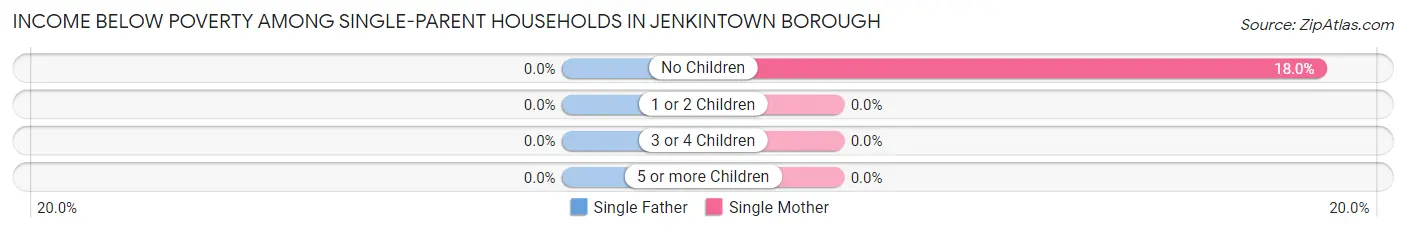
| Children | Single Father | Single Mother |
| No Children | 0 (0.0%) | 16 (18.0%) |
| 1 or 2 Children | 0 (0.0%) | 0 (0.0%) |
| 3 or 4 Children | 0 (0.0%) | 0 (0.0%) |
| 5 or more Children | 0 (0.0%) | 0 (0.0%) |
| Total | 0 (0.0%) | 16 (11.6%) |
Income Below Poverty Among Married-Couple vs Single-Parent Households in Jenkintown borough
The poverty data for Jenkintown borough shows that 20 of the married-couple family households (2.1%) and 16 of the single-parent households (6.5%) are living below the poverty level. Within the married-couple family households, those with no children have the highest poverty rate, with 20 households (4.0%) falling below the poverty line. Among the single-parent households, those with no children have the highest poverty rate, with 16 household (11.8%) living below poverty.
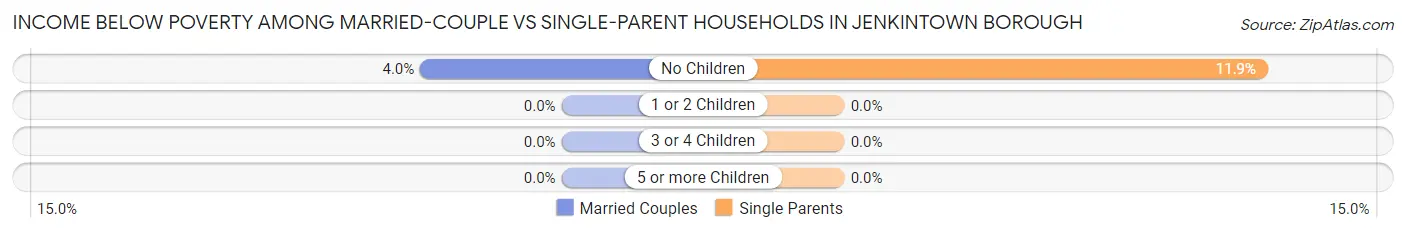
| Children | Married-Couple Families | Single-Parent Households |
| No Children | 20 (4.0%) | 16 (11.8%) |
| 1 or 2 Children | 0 (0.0%) | 0 (0.0%) |
| 3 or 4 Children | 0 (0.0%) | 0 (0.0%) |
| 5 or more Children | 0 (0.0%) | 0 (0.0%) |
| Total | 20 (2.1%) | 16 (6.5%) |
Race in Jenkintown borough
The most populous races in Jenkintown borough are White / Caucasian (3,802 | 80.8%), Black / African American (428 | 9.1%), and Hispanic or Latino (322 | 6.9%).
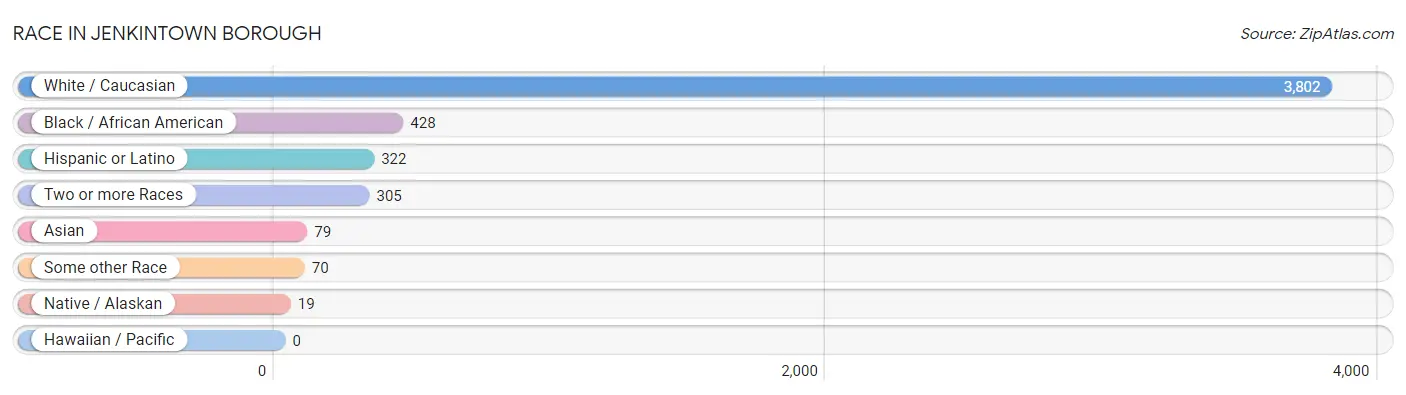
| Race | # Population | % Population |
| Asian | 79 | 1.7% |
| Black / African American | 428 | 9.1% |
| Hawaiian / Pacific | 0 | 0.0% |
| Hispanic or Latino | 322 | 6.9% |
| Native / Alaskan | 19 | 0.4% |
| White / Caucasian | 3,802 | 80.8% |
| Two or more Races | 305 | 6.5% |
| Some other Race | 70 | 1.5% |
| Total | 4,703 | 100.0% |
Ancestry in Jenkintown borough
The most populous ancestries reported in Jenkintown borough are Irish (1,186 | 25.2%), English (792 | 16.8%), German (633 | 13.5%), Italian (499 | 10.6%), and American (402 | 8.6%), together accounting for 74.7% of all Jenkintown borough residents.
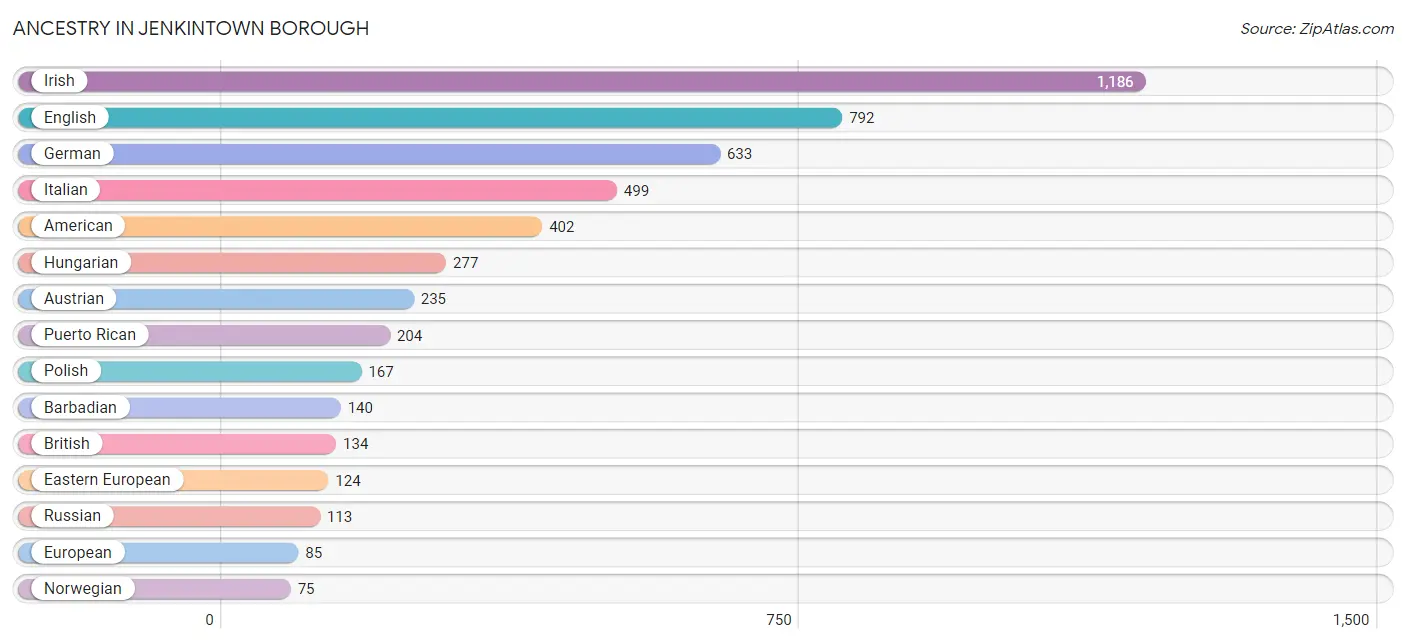
| Ancestry | # Population | % Population |
| African | 1 | 0.0% |
| Alaska Native | 58 | 1.2% |
| American | 402 | 8.6% |
| Armenian | 12 | 0.3% |
| Austrian | 235 | 5.0% |
| Barbadian | 140 | 3.0% |
| Bhutanese | 23 | 0.5% |
| British | 134 | 2.9% |
| Burmese | 39 | 0.8% |
| Central American | 19 | 0.4% |
| Central American Indian | 19 | 0.4% |
| Czechoslovakian | 27 | 0.6% |
| Dutch | 34 | 0.7% |
| Eastern European | 124 | 2.6% |
| English | 792 | 16.8% |
| European | 85 | 1.8% |
| French | 71 | 1.5% |
| French Canadian | 17 | 0.4% |
| German | 633 | 13.5% |
| Greek | 26 | 0.5% |
| Honduran | 19 | 0.4% |
| Hungarian | 277 | 5.9% |
| Irish | 1,186 | 25.2% |
| Israeli | 17 | 0.4% |
| Italian | 499 | 10.6% |
| Kenyan | 42 | 0.9% |
| Korean | 29 | 0.6% |
| Lithuanian | 20 | 0.4% |
| Mexican | 41 | 0.9% |
| Navajo | 58 | 1.2% |
| Norwegian | 75 | 1.6% |
| Polish | 167 | 3.5% |
| Portuguese | 13 | 0.3% |
| Puerto Rican | 204 | 4.3% |
| Russian | 113 | 2.4% |
| Scotch-Irish | 18 | 0.4% |
| Scottish | 64 | 1.4% |
| Serbian | 15 | 0.3% |
| Slovak | 41 | 0.9% |
| Spaniard | 58 | 1.2% |
| Subsaharan African | 43 | 0.9% |
| Swedish | 38 | 0.8% |
| Swiss | 1 | 0.0% |
| Ukrainian | 27 | 0.6% |
| Welsh | 44 | 0.9% | View All 45 Rows |
Immigrants in Jenkintown borough
The most numerous immigrant groups reported in Jenkintown borough came from Asia (140 | 3.0%), Europe (120 | 2.5%), Eastern Europe (86 | 1.8%), Western Asia (61 | 1.3%), and Eastern Asia (50 | 1.1%), together accounting for 9.7% of all Jenkintown borough residents.
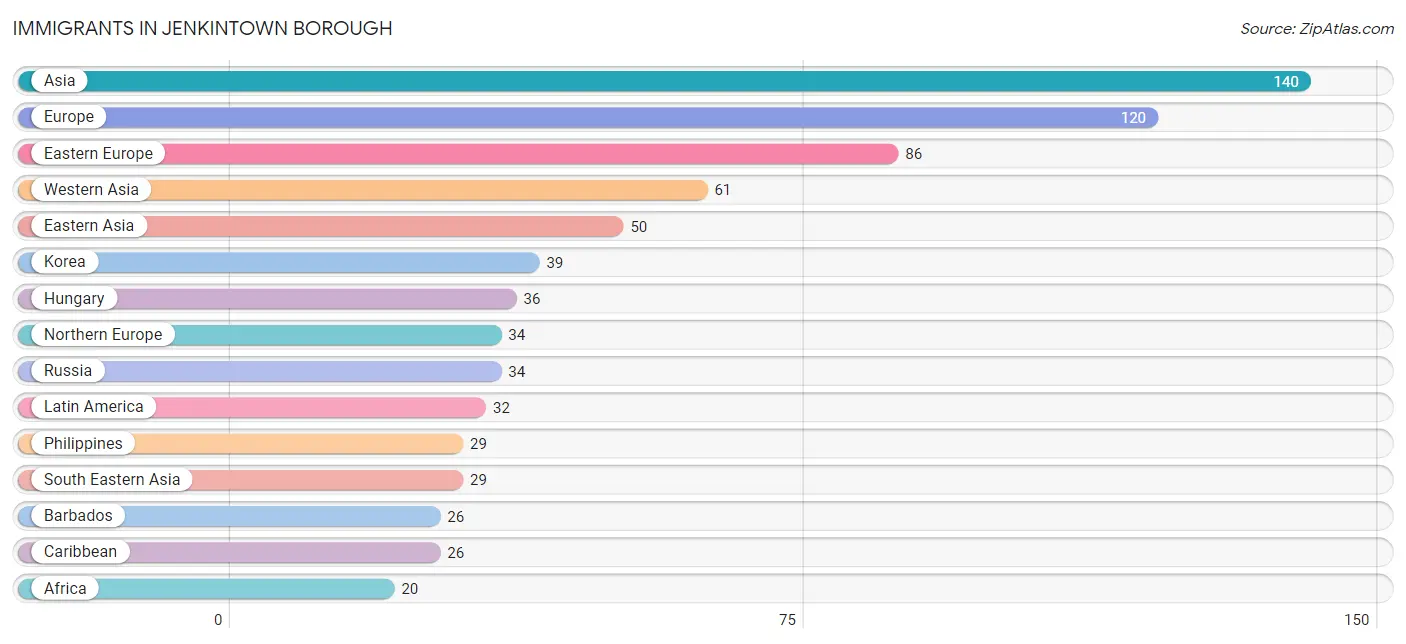
| Immigration Origin | # Population | % Population |
| Africa | 20 | 0.4% |
| Asia | 140 | 3.0% |
| Barbados | 26 | 0.5% |
| Canada | 13 | 0.3% |
| Caribbean | 26 | 0.5% |
| Central America | 6 | 0.1% |
| Eastern Africa | 20 | 0.4% |
| Eastern Asia | 50 | 1.1% |
| Eastern Europe | 86 | 1.8% |
| Europe | 120 | 2.5% |
| Honduras | 6 | 0.1% |
| Hungary | 36 | 0.8% |
| Ireland | 9 | 0.2% |
| Israel | 20 | 0.4% |
| Japan | 11 | 0.2% |
| Kenya | 20 | 0.4% |
| Korea | 39 | 0.8% |
| Latin America | 32 | 0.7% |
| Northern Europe | 34 | 0.7% |
| Philippines | 29 | 0.6% |
| Poland | 1 | 0.0% |
| Russia | 34 | 0.7% |
| South Eastern Asia | 29 | 0.6% |
| Western Asia | 61 | 1.3% | View All 24 Rows |
Sex and Age in Jenkintown borough
Sex and Age in Jenkintown borough
The most populous age groups in Jenkintown borough are 5 to 9 Years (318 | 13.1%) for men and 60 to 64 Years (246 | 10.8%) for women.
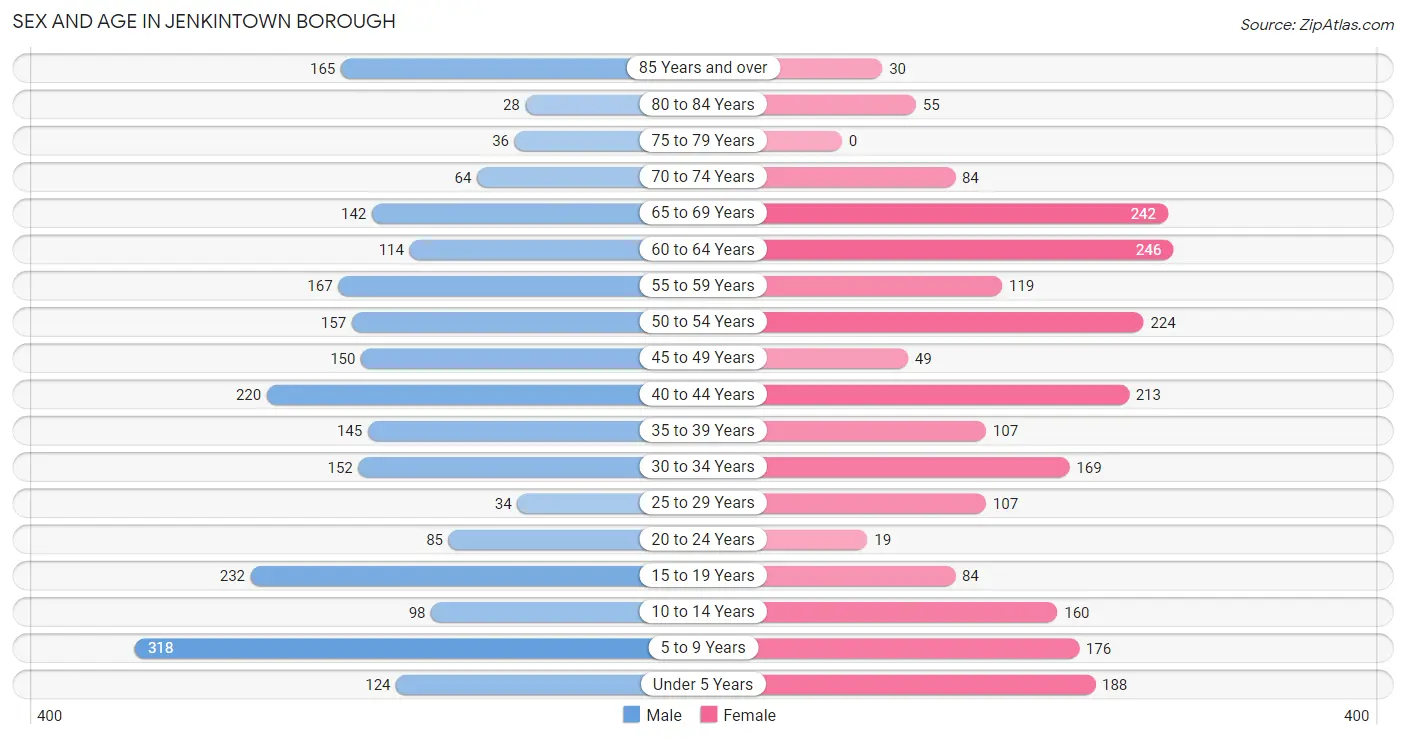
| Age Bracket | Male | Female |
| Under 5 Years | 124 (5.1%) | 188 (8.3%) |
| 5 to 9 Years | 318 (13.1%) | 176 (7.7%) |
| 10 to 14 Years | 98 (4.0%) | 160 (7.0%) |
| 15 to 19 Years | 232 (9.5%) | 84 (3.7%) |
| 20 to 24 Years | 85 (3.5%) | 19 (0.8%) |
| 25 to 29 Years | 34 (1.4%) | 107 (4.7%) |
| 30 to 34 Years | 152 (6.2%) | 169 (7.4%) |
| 35 to 39 Years | 145 (6.0%) | 107 (4.7%) |
| 40 to 44 Years | 220 (9.0%) | 213 (9.4%) |
| 45 to 49 Years | 150 (6.2%) | 49 (2.2%) |
| 50 to 54 Years | 157 (6.5%) | 224 (9.9%) |
| 55 to 59 Years | 167 (6.9%) | 119 (5.2%) |
| 60 to 64 Years | 114 (4.7%) | 246 (10.8%) |
| 65 to 69 Years | 142 (5.8%) | 242 (10.6%) |
| 70 to 74 Years | 64 (2.6%) | 84 (3.7%) |
| 75 to 79 Years | 36 (1.5%) | 0 (0.0%) |
| 80 to 84 Years | 28 (1.1%) | 55 (2.4%) |
| 85 Years and over | 165 (6.8%) | 30 (1.3%) |
| Total | 2,431 (100.0%) | 2,272 (100.0%) |
Families and Households in Jenkintown borough
Median Family Size in Jenkintown borough
The median family size in Jenkintown borough is 3.17 persons per family, with married-couple families (943 | 79.4%) accounting for the largest median family size of 3.32 persons per family. On the other hand, single female/mother families (138 | 11.6%) represent the smallest median family size with 2.50 persons per family.
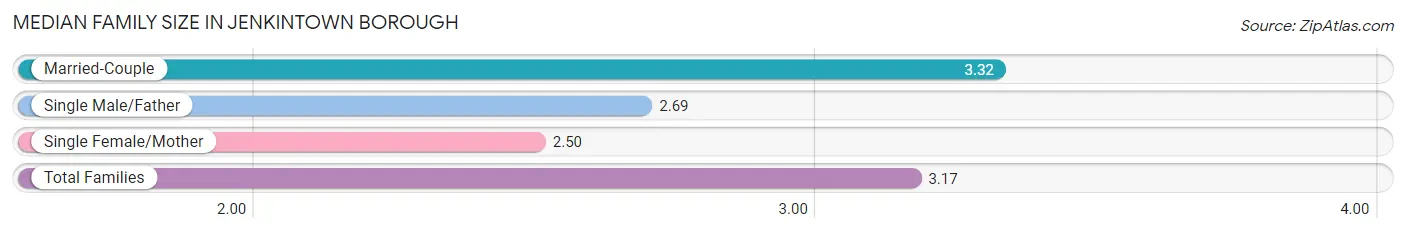
| Family Type | # Families | Family Size |
| Married-Couple | 943 (79.4%) | 3.32 |
| Single Male/Father | 107 (9.0%) | 2.69 |
| Single Female/Mother | 138 (11.6%) | 2.50 |
| Total Families | 1,188 (100.0%) | 3.17 |
Median Household Size in Jenkintown borough
The median household size in Jenkintown borough is 2.36 persons per household, with single male/father households (107 | 5.4%) accounting for the largest median household size of 3.48 persons per household. non-family households (800 | 40.2%) represent the smallest median household size with 1.06 persons per household.
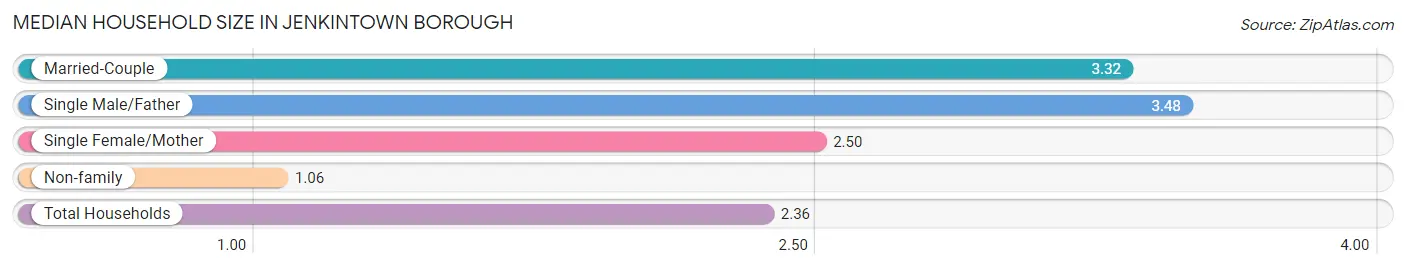
| Household Type | # Households | Household Size |
| Married-Couple | 943 (47.4%) | 3.32 |
| Single Male/Father | 107 (5.4%) | 3.48 |
| Single Female/Mother | 138 (6.9%) | 2.50 |
| Non-family | 800 (40.2%) | 1.06 |
| Total Households | 1,988 (100.0%) | 2.36 |
Household Size by Marriage Status in Jenkintown borough
Out of a total of 1,988 households in Jenkintown borough, 1,188 (59.8%) are family households, while 800 (40.2%) are nonfamily households. The most numerous type of family households are 2-person households, comprising 524, and the most common type of nonfamily households are 1-person households, comprising 752.
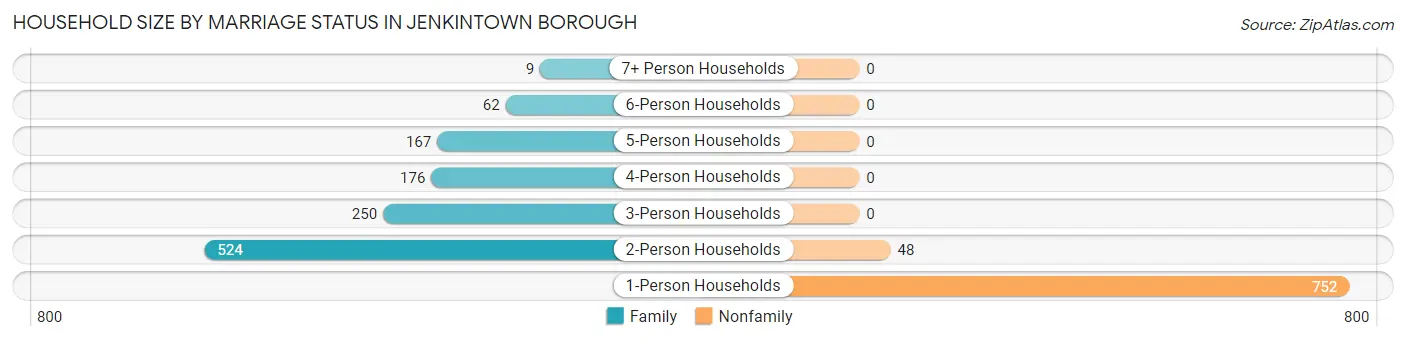
| Household Size | Family Households | Nonfamily Households |
| 1-Person Households | - | 752 (37.8%) |
| 2-Person Households | 524 (26.4%) | 48 (2.4%) |
| 3-Person Households | 250 (12.6%) | 0 (0.0%) |
| 4-Person Households | 176 (8.8%) | 0 (0.0%) |
| 5-Person Households | 167 (8.4%) | 0 (0.0%) |
| 6-Person Households | 62 (3.1%) | 0 (0.0%) |
| 7+ Person Households | 9 (0.4%) | 0 (0.0%) |
| Total | 1,188 (59.8%) | 800 (40.2%) |
Female Fertility in Jenkintown borough
Fertility by Age in Jenkintown borough
Average fertility rate in Jenkintown borough is 52.0 births per 1,000 women. Women in the age bracket of 20 to 34 years have the highest fertility rate with 85.0 births per 1,000 women. Women in the age bracket of 20 to 34 years acount for 59.5% of all women with births.
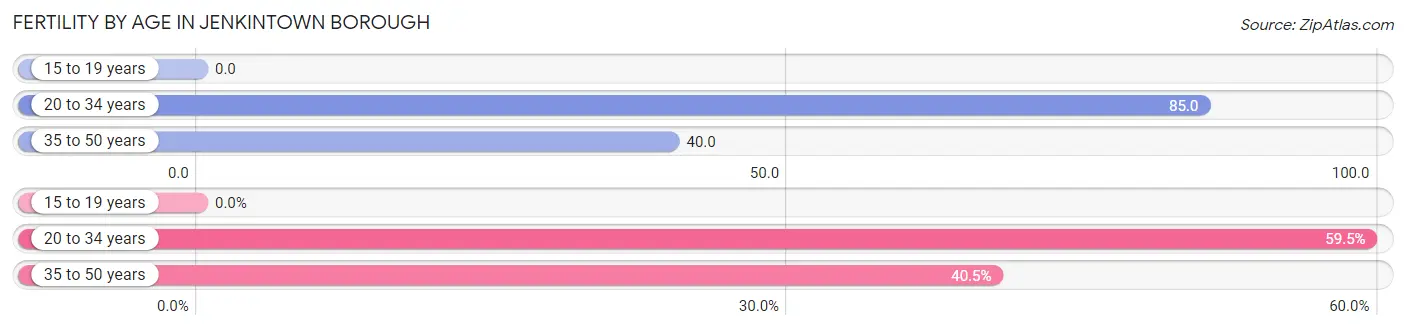
| Age Bracket | Women with Births | Births / 1,000 Women |
| 15 to 19 years | 0 (0.0%) | 0.0 |
| 20 to 34 years | 25 (59.5%) | 85.0 |
| 35 to 50 years | 17 (40.5%) | 40.0 |
| Total | 42 (100.0%) | 52.0 |
Fertility by Age by Marriage Status in Jenkintown borough
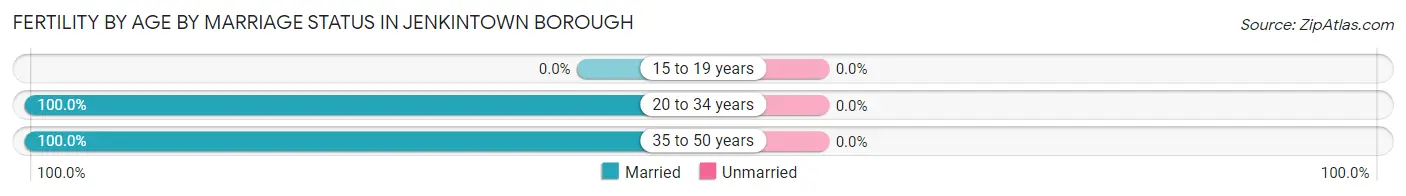
| Age Bracket | Married | Unmarried |
| 15 to 19 years | 0 (0.0%) | 0 (0.0%) |
| 20 to 34 years | 25 (100.0%) | 0 (0.0%) |
| 35 to 50 years | 17 (100.0%) | 0 (0.0%) |
| Total | 42 (100.0%) | 0 (0.0%) |
Fertility by Education in Jenkintown borough
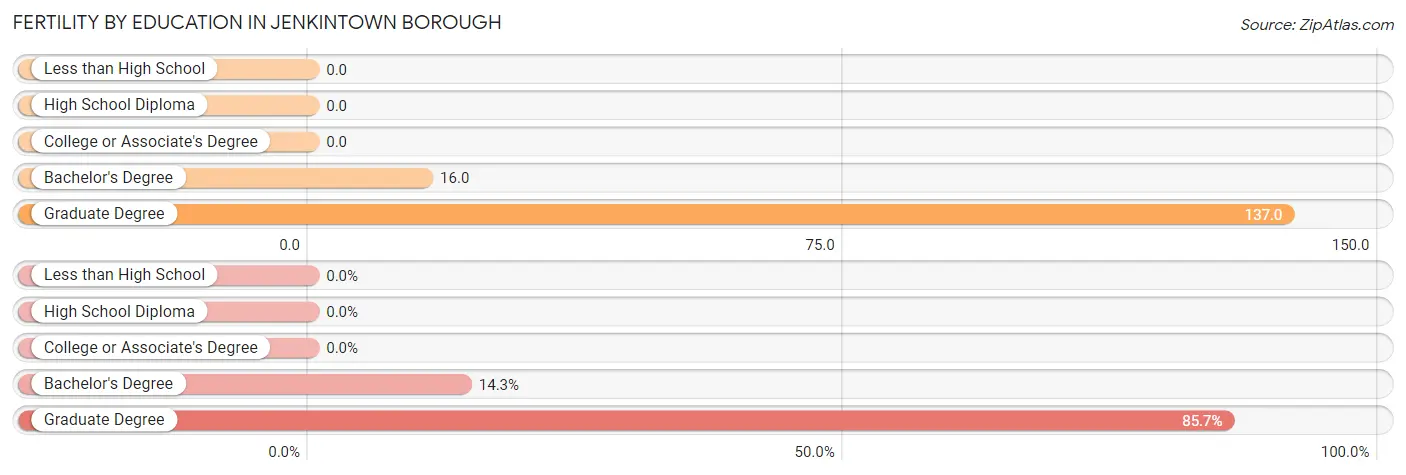
| Educational Attainment | Women with Births | Births / 1,000 Women |
| Less than High School | 0 (0.0%) | 0.0 |
| High School Diploma | 0 (0.0%) | 0.0 |
| College or Associate's Degree | 0 (0.0%) | 0.0 |
| Bachelor's Degree | 6 (14.3%) | 16.0 |
| Graduate Degree | 36 (85.7%) | 137.0 |
| Total | 42 (100.0%) | 52.0 |
Fertility by Education by Marriage Status in Jenkintown borough
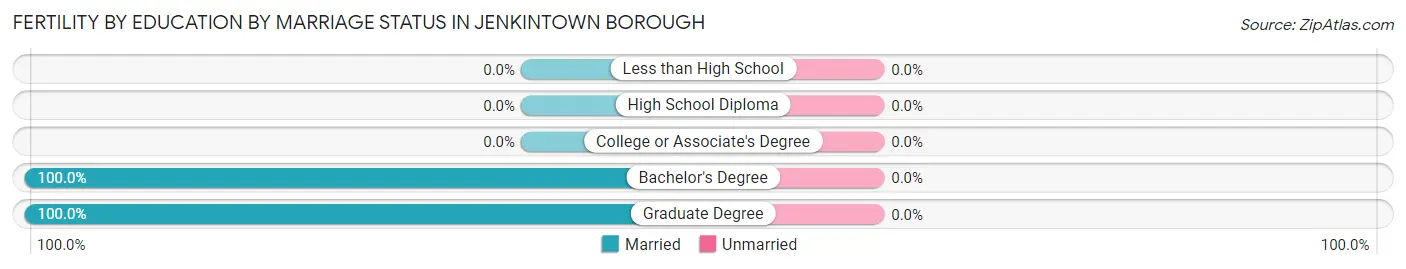
| Educational Attainment | Married | Unmarried |
| Less than High School | 0 (0.0%) | 0 (0.0%) |
| High School Diploma | 0 (0.0%) | 0 (0.0%) |
| College or Associate's Degree | 0 (0.0%) | 0 (0.0%) |
| Bachelor's Degree | 6 (100.0%) | 0 (0.0%) |
| Graduate Degree | 36 (100.0%) | 0 (0.0%) |
| Total | 42 (100.0%) | 0 (0.0%) |
Employment Characteristics in Jenkintown borough
Employment by Class of Employer in Jenkintown borough
Among the 2,122 employed individuals in Jenkintown borough, private company employees (1,338 | 63.0%), not-for-profit organizations (381 | 17.9%), and self-employed (not incorporated) (165 | 7.8%) make up the most common classes of employment.
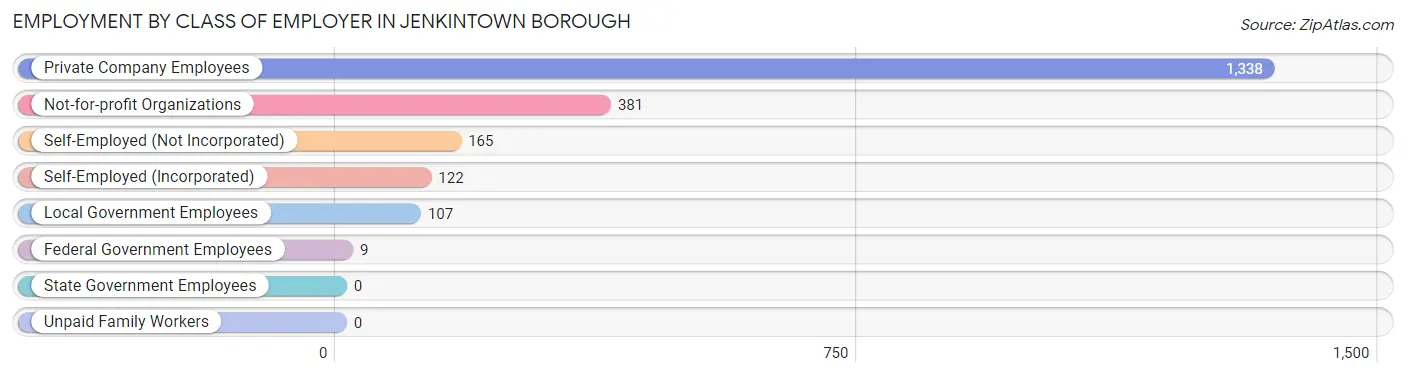
| Employer Class | # Employees | % Employees |
| Private Company Employees | 1,338 | 63.0% |
| Self-Employed (Incorporated) | 122 | 5.8% |
| Self-Employed (Not Incorporated) | 165 | 7.8% |
| Not-for-profit Organizations | 381 | 17.9% |
| Local Government Employees | 107 | 5.0% |
| State Government Employees | 0 | 0.0% |
| Federal Government Employees | 9 | 0.4% |
| Unpaid Family Workers | 0 | 0.0% |
| Total | 2,122 | 100.0% |
Employment Status by Age in Jenkintown borough
According to the labor force statistics for Jenkintown borough, out of the total population over 16 years of age (3,587), 65.8% or 2,360 individuals are in the labor force, with 6.1% or 144 of them unemployed. The age group with the highest labor force participation rate is 30 to 34 years, with 99.7% or 320 individuals in the labor force. Within the labor force, the 20 to 24 years age range has the highest percentage of unemployed individuals, with 26.2% or 22 of them being unemployed.
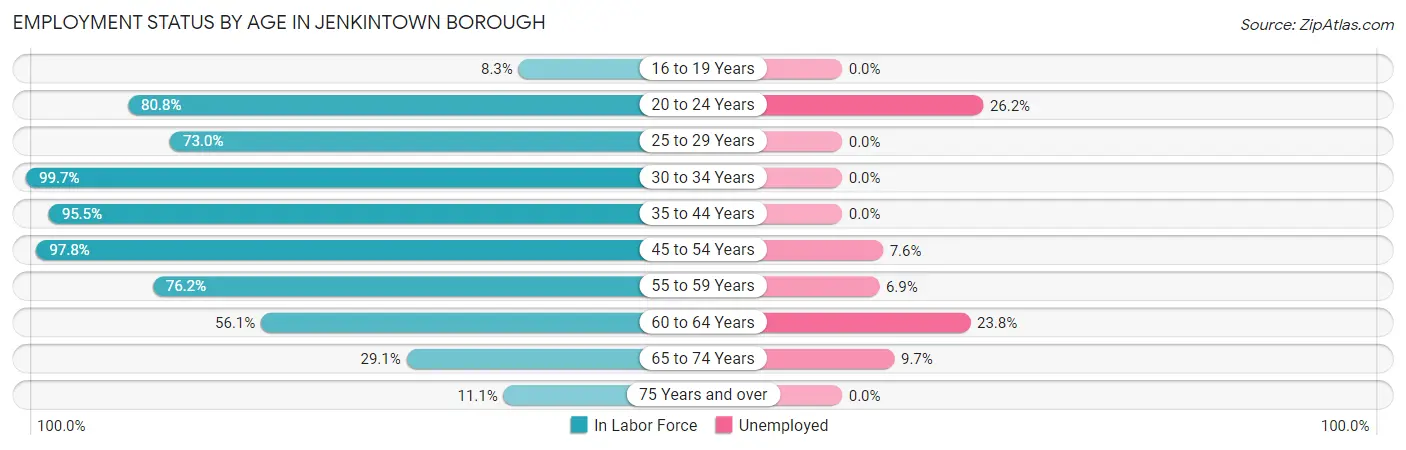
| Age Bracket | In Labor Force | Unemployed |
| 16 to 19 Years | 22 (8.3%) | 0 (0.0%) |
| 20 to 24 Years | 84 (80.8%) | 22 (26.2%) |
| 25 to 29 Years | 103 (73.0%) | 0 (0.0%) |
| 30 to 34 Years | 320 (99.7%) | 0 (0.0%) |
| 35 to 44 Years | 654 (95.5%) | 0 (0.0%) |
| 45 to 54 Years | 567 (97.8%) | 43 (7.6%) |
| 55 to 59 Years | 218 (76.2%) | 15 (6.9%) |
| 60 to 64 Years | 202 (56.1%) | 48 (23.8%) |
| 65 to 74 Years | 155 (29.1%) | 15 (9.7%) |
| 75 Years and over | 35 (11.1%) | 0 (0.0%) |
| Total | 2,360 (65.8%) | 144 (6.1%) |
Employment Status by Educational Attainment in Jenkintown borough
According to labor force statistics for Jenkintown borough, 87.0% of individuals (2,065) out of the total population between 25 and 64 years of age (2,373) are in the labor force, with 5.1% or 105 of them being unemployed. The group with the highest labor force participation rate are those with the educational attainment of college / associate degree, with 90.8% or 356 individuals in the labor force. Within the labor force, individuals with college / associate degree education have the highest percentage of unemployment, with 21.9% or 78 of them being unemployed.
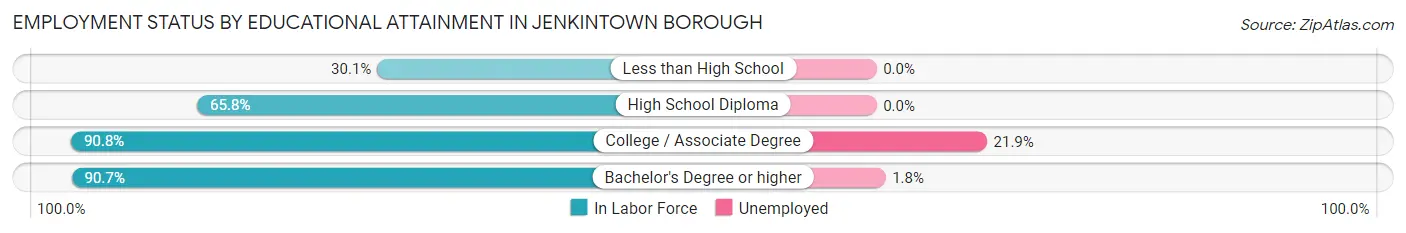
| Educational Attainment | In Labor Force | Unemployed |
| Less than High School | 25 (30.1%) | 0 (0.0%) |
| High School Diploma | 102 (65.8%) | 0 (0.0%) |
| College / Associate Degree | 356 (90.8%) | 86 (21.9%) |
| Bachelor's Degree or higher | 1,581 (90.7%) | 31 (1.8%) |
| Total | 2,065 (87.0%) | 121 (5.1%) |
Employment Occupations by Sex in Jenkintown borough
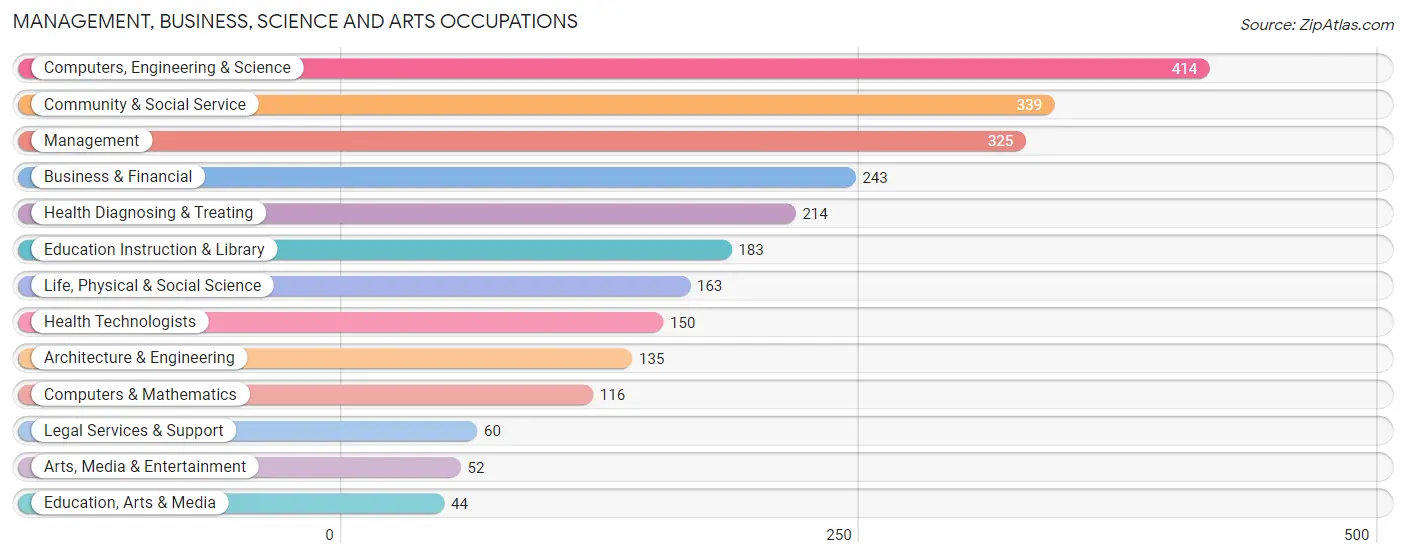
Management, Business, Science and Arts Occupations
The most common Management, Business, Science and Arts occupations in Jenkintown borough are Computers, Engineering & Science (414 | 18.7%), Community & Social Service (339 | 15.3%), Management (325 | 14.7%), Business & Financial (243 | 11.0%), and Health Diagnosing & Treating (214 | 9.7%).
Management, Business, Science and Arts Occupations by Sex
Within the Management, Business, Science and Arts occupations in Jenkintown borough, the most male-oriented occupations are Legal Services & Support (100.0%), Architecture & Engineering (86.7%), and Computers & Mathematics (69.8%), while the most female-oriented occupations are Arts, Media & Entertainment (100.0%), Education, Arts & Media (97.7%), and Life, Physical & Social Science (66.9%).
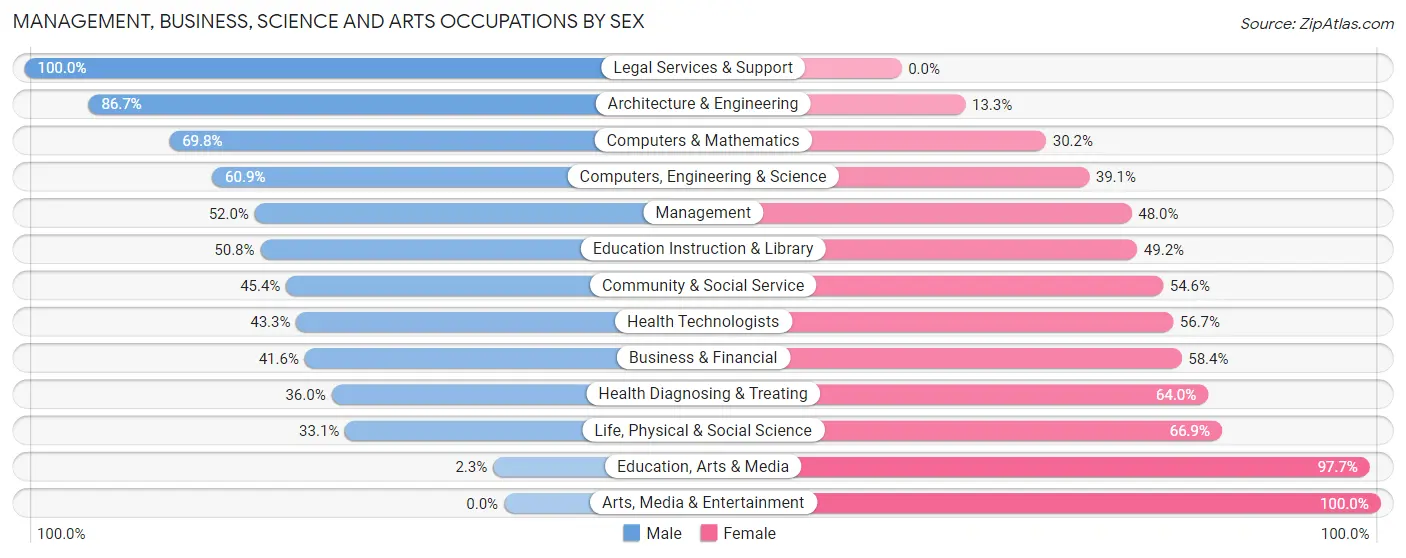
| Occupation | Male | Female |
| Management | 169 (52.0%) | 156 (48.0%) |
| Business & Financial | 101 (41.6%) | 142 (58.4%) |
| Computers, Engineering & Science | 252 (60.9%) | 162 (39.1%) |
| Computers & Mathematics | 81 (69.8%) | 35 (30.2%) |
| Architecture & Engineering | 117 (86.7%) | 18 (13.3%) |
| Life, Physical & Social Science | 54 (33.1%) | 109 (66.9%) |
| Community & Social Service | 154 (45.4%) | 185 (54.6%) |
| Education, Arts & Media | 1 (2.3%) | 43 (97.7%) |
| Legal Services & Support | 60 (100.0%) | 0 (0.0%) |
| Education Instruction & Library | 93 (50.8%) | 90 (49.2%) |
| Arts, Media & Entertainment | 0 (0.0%) | 52 (100.0%) |
| Health Diagnosing & Treating | 77 (36.0%) | 137 (64.0%) |
| Health Technologists | 65 (43.3%) | 85 (56.7%) |
| Total (Category) | 753 (49.1%) | 782 (50.9%) |
| Total (Overall) | 1,141 (51.5%) | 1,076 (48.5%) |
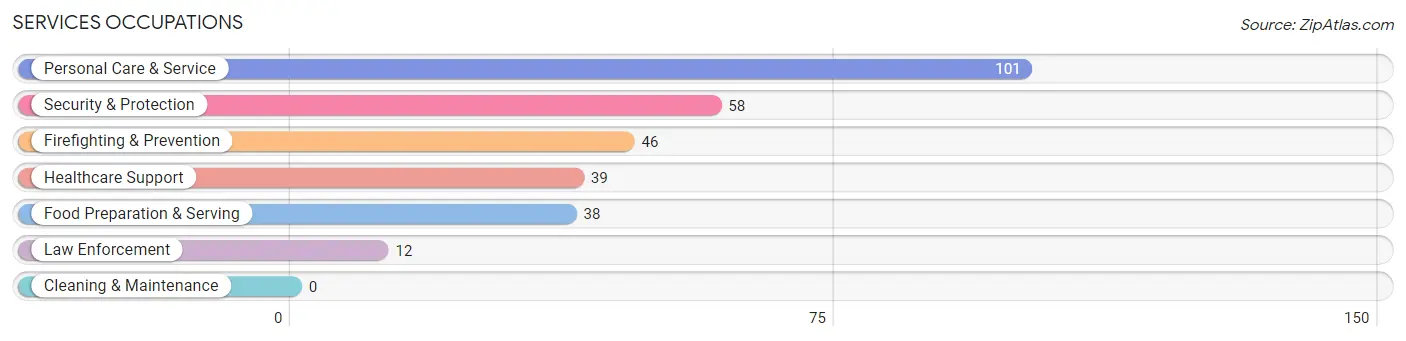
Services Occupations
The most common Services occupations in Jenkintown borough are Personal Care & Service (101 | 4.6%), Security & Protection (58 | 2.6%), Firefighting & Prevention (46 | 2.1%), Healthcare Support (39 | 1.8%), and Food Preparation & Serving (38 | 1.7%).
Services Occupations by Sex
Within the Services occupations in Jenkintown borough, the most male-oriented occupations are Law Enforcement (100.0%), Food Preparation & Serving (100.0%), and Personal Care & Service (61.4%), while the most female-oriented occupations are Healthcare Support (100.0%), Firefighting & Prevention (63.0%), and Security & Protection (50.0%).
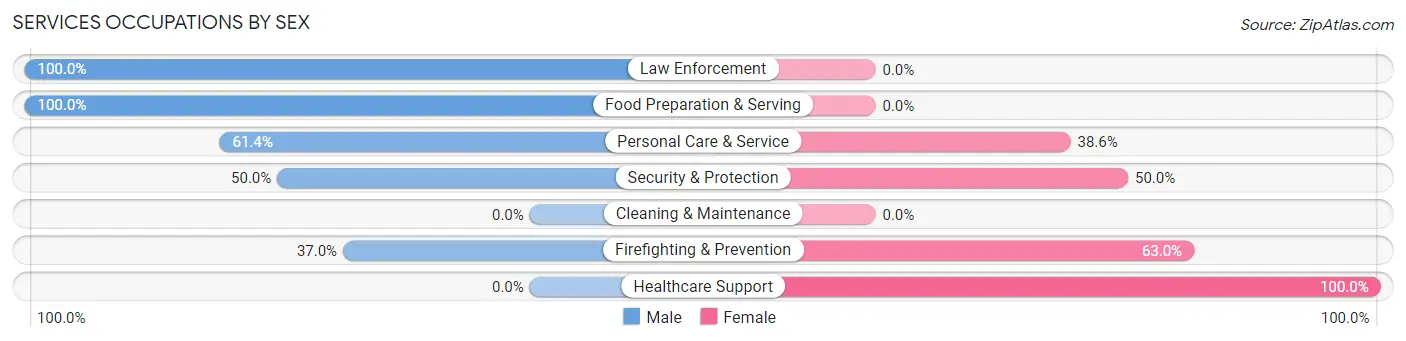
| Occupation | Male | Female |
| Healthcare Support | 0 (0.0%) | 39 (100.0%) |
| Security & Protection | 29 (50.0%) | 29 (50.0%) |
| Firefighting & Prevention | 17 (37.0%) | 29 (63.0%) |
| Law Enforcement | 12 (100.0%) | 0 (0.0%) |
| Food Preparation & Serving | 38 (100.0%) | 0 (0.0%) |
| Cleaning & Maintenance | 0 (0.0%) | 0 (0.0%) |
| Personal Care & Service | 62 (61.4%) | 39 (38.6%) |
| Total (Category) | 129 (54.7%) | 107 (45.3%) |
| Total (Overall) | 1,141 (51.5%) | 1,076 (48.5%) |
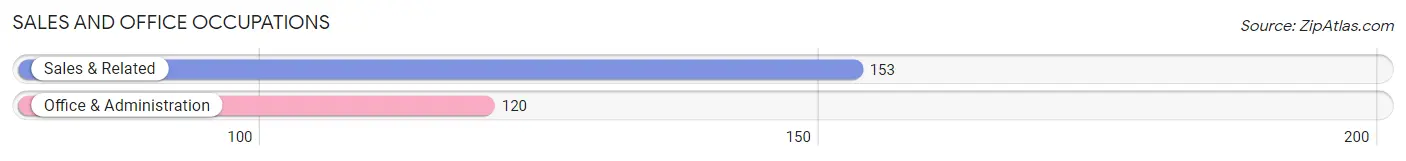
Sales and Office Occupations
The most common Sales and Office occupations in Jenkintown borough are Sales & Related (153 | 6.9%), and Office & Administration (120 | 5.4%).
Sales and Office Occupations by Sex
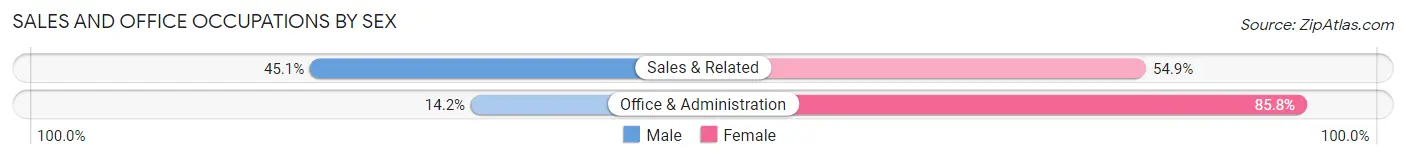
| Occupation | Male | Female |
| Sales & Related | 69 (45.1%) | 84 (54.9%) |
| Office & Administration | 17 (14.2%) | 103 (85.8%) |
| Total (Category) | 86 (31.5%) | 187 (68.5%) |
| Total (Overall) | 1,141 (51.5%) | 1,076 (48.5%) |
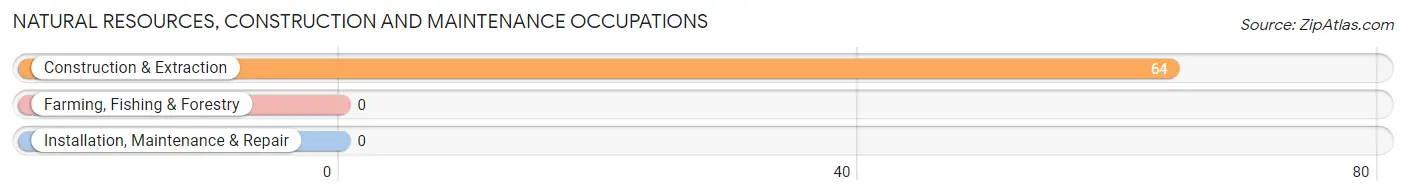
Natural Resources, Construction and Maintenance Occupations
The most common Natural Resources, Construction and Maintenance occupations in Jenkintown borough are , and Construction & Extraction (64 | 2.9%).
Natural Resources, Construction and Maintenance Occupations by Sex
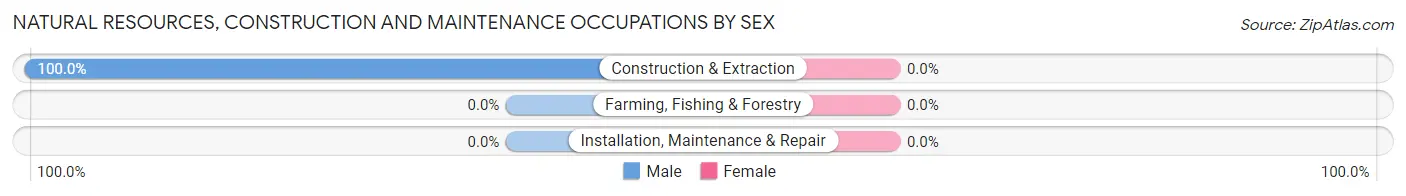
| Occupation | Male | Female |
| Farming, Fishing & Forestry | 0 (0.0%) | 0 (0.0%) |
| Construction & Extraction | 64 (100.0%) | 0 (0.0%) |
| Installation, Maintenance & Repair | 0 (0.0%) | 0 (0.0%) |
| Total (Category) | 64 (100.0%) | 0 (0.0%) |
| Total (Overall) | 1,141 (51.5%) | 1,076 (48.5%) |
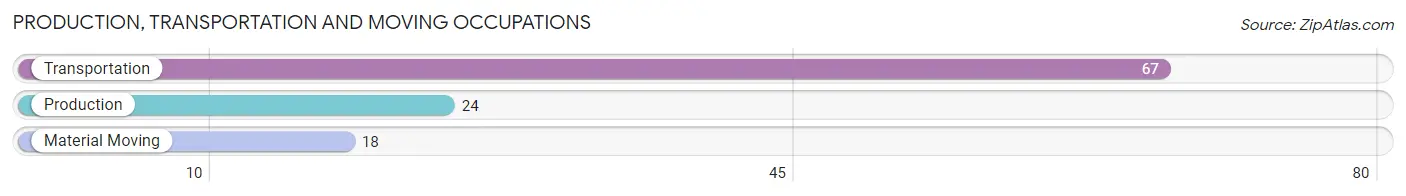
Production, Transportation and Moving Occupations
The most common Production, Transportation and Moving occupations in Jenkintown borough are Transportation (67 | 3.0%), Production (24 | 1.1%), and Material Moving (18 | 0.8%).
Production, Transportation and Moving Occupations by Sex
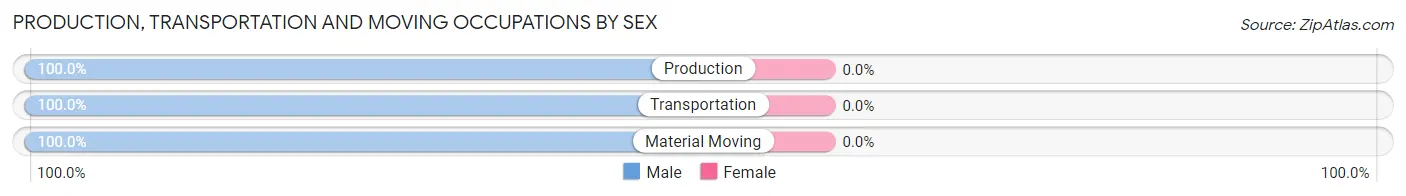
| Occupation | Male | Female |
| Production | 24 (100.0%) | 0 (0.0%) |
| Transportation | 67 (100.0%) | 0 (0.0%) |
| Material Moving | 18 (100.0%) | 0 (0.0%) |
| Total (Category) | 109 (100.0%) | 0 (0.0%) |
| Total (Overall) | 1,141 (51.5%) | 1,076 (48.5%) |
Employment Industries by Sex in Jenkintown borough
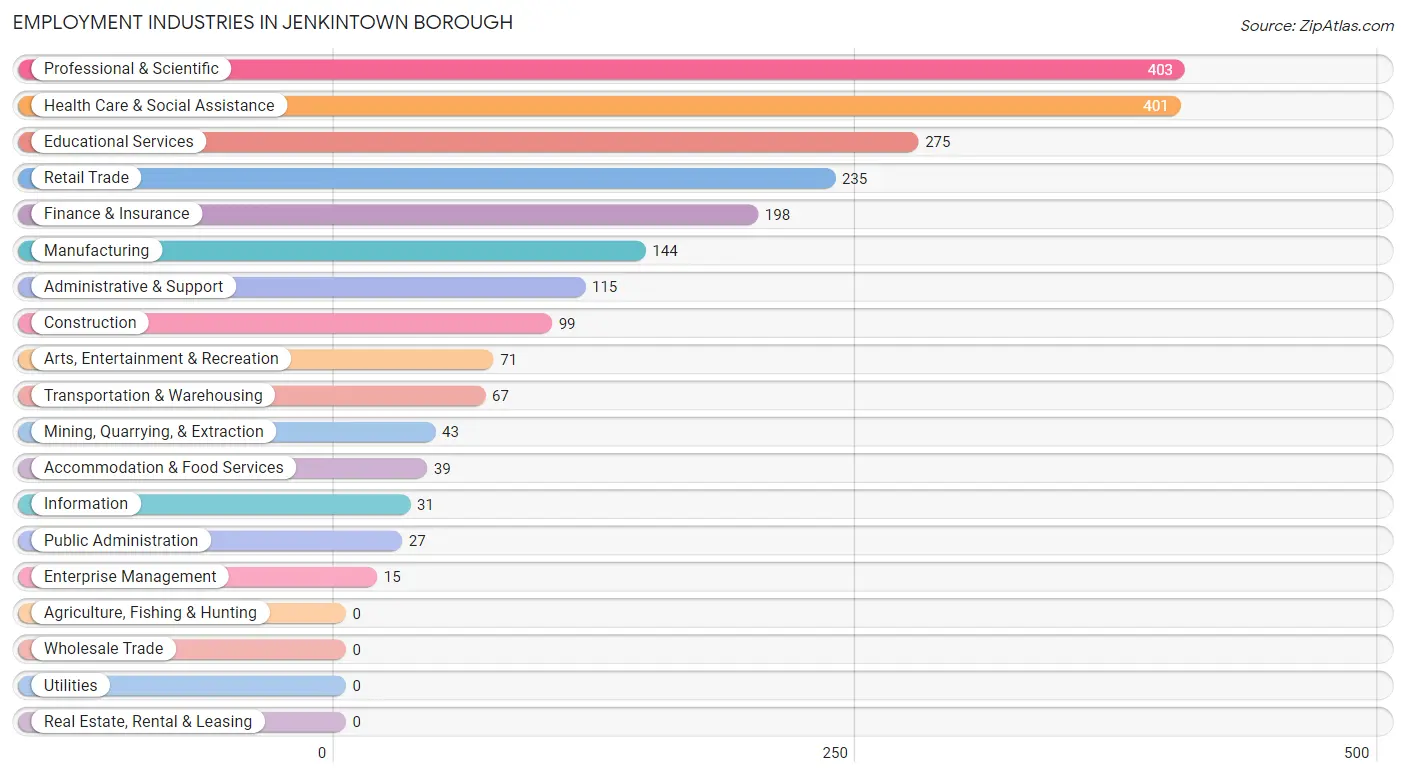
Employment Industries in Jenkintown borough
The major employment industries in Jenkintown borough include Professional & Scientific (403 | 18.2%), Health Care & Social Assistance (401 | 18.1%), Educational Services (275 | 12.4%), Retail Trade (235 | 10.6%), and Finance & Insurance (198 | 8.9%).
Employment Industries by Sex in Jenkintown borough
The Jenkintown borough industries that see more men than women are Mining, Quarrying, & Extraction (100.0%), Transportation & Warehousing (100.0%), and Construction (87.9%), whereas the industries that tend to have a higher number of women are Enterprise Management (100.0%), Arts, Entertainment & Recreation (100.0%), and Educational Services (66.2%).
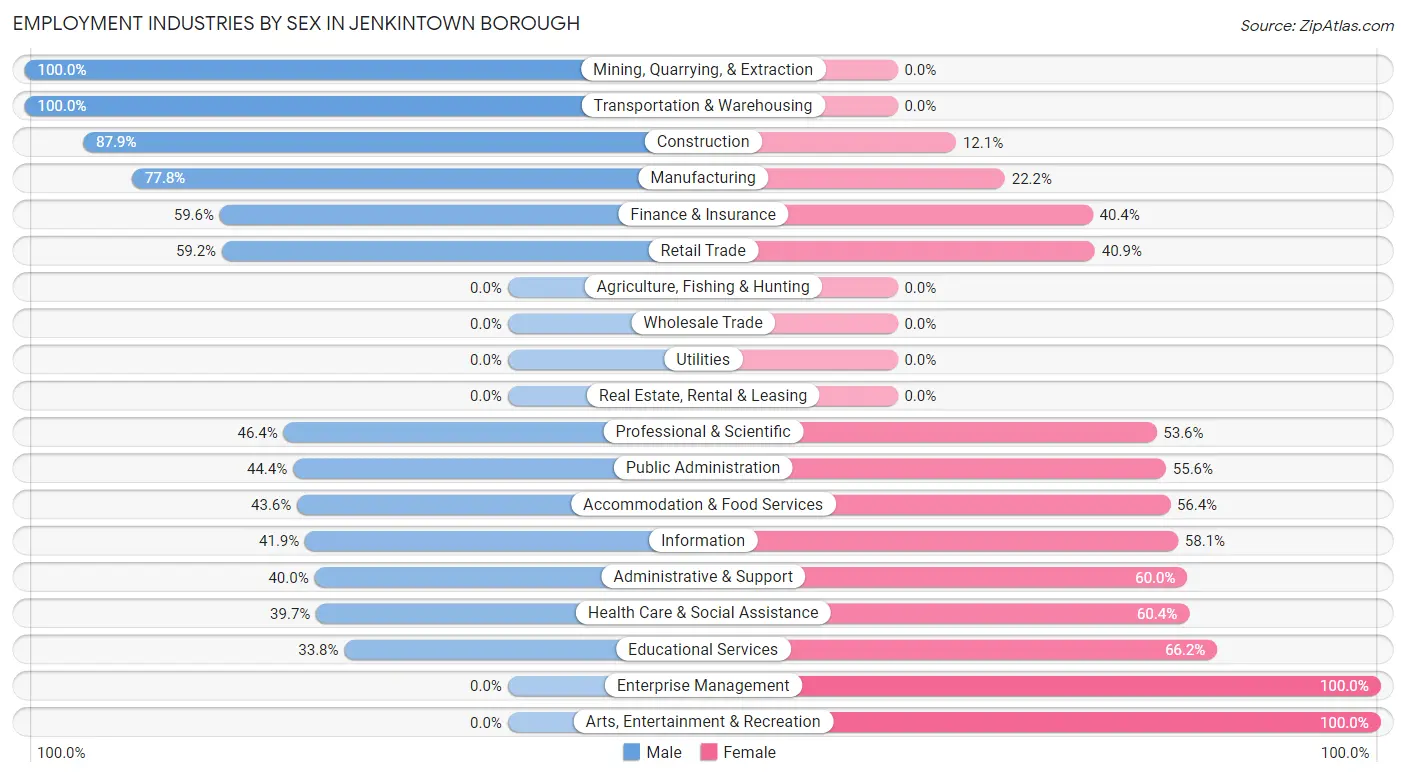
| Industry | Male | Female |
| Agriculture, Fishing & Hunting | 0 (0.0%) | 0 (0.0%) |
| Mining, Quarrying, & Extraction | 43 (100.0%) | 0 (0.0%) |
| Construction | 87 (87.9%) | 12 (12.1%) |
| Manufacturing | 112 (77.8%) | 32 (22.2%) |
| Wholesale Trade | 0 (0.0%) | 0 (0.0%) |
| Retail Trade | 139 (59.2%) | 96 (40.8%) |
| Transportation & Warehousing | 67 (100.0%) | 0 (0.0%) |
| Utilities | 0 (0.0%) | 0 (0.0%) |
| Information | 13 (41.9%) | 18 (58.1%) |
| Finance & Insurance | 118 (59.6%) | 80 (40.4%) |
| Real Estate, Rental & Leasing | 0 (0.0%) | 0 (0.0%) |
| Professional & Scientific | 187 (46.4%) | 216 (53.6%) |
| Enterprise Management | 0 (0.0%) | 15 (100.0%) |
| Administrative & Support | 46 (40.0%) | 69 (60.0%) |
| Educational Services | 93 (33.8%) | 182 (66.2%) |
| Health Care & Social Assistance | 159 (39.7%) | 242 (60.4%) |
| Arts, Entertainment & Recreation | 0 (0.0%) | 71 (100.0%) |
| Accommodation & Food Services | 17 (43.6%) | 22 (56.4%) |
| Public Administration | 12 (44.4%) | 15 (55.6%) |
| Total | 1,141 (51.5%) | 1,076 (48.5%) |
Education in Jenkintown borough
School Enrollment in Jenkintown borough
The most common levels of schooling among the 1,291 students in Jenkintown borough are elementary school (399 | 30.9%), high school (347 | 26.9%), and middle school (212 | 16.4%).
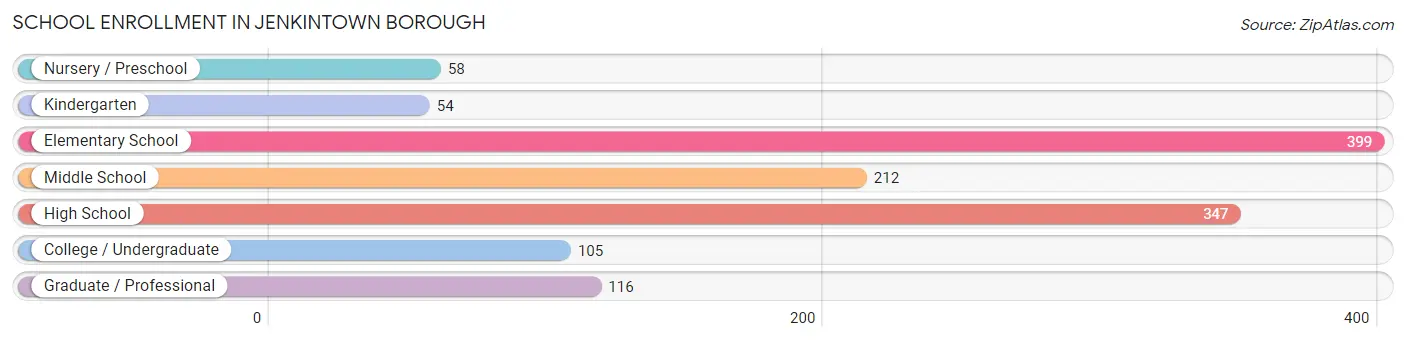
| School Level | # Students | % Students |
| Nursery / Preschool | 58 | 4.5% |
| Kindergarten | 54 | 4.2% |
| Elementary School | 399 | 30.9% |
| Middle School | 212 | 16.4% |
| High School | 347 | 26.9% |
| College / Undergraduate | 105 | 8.1% |
| Graduate / Professional | 116 | 9.0% |
| Total | 1,291 | 100.0% |
School Enrollment by Age by Funding Source in Jenkintown borough
Out of a total of 1,291 students who are enrolled in schools in Jenkintown borough, 309 (23.9%) attend a private institution, while the remaining 982 (76.1%) are enrolled in public schools. The age group of 3 to 4 year olds has the highest likelihood of being enrolled in private schools, with 58 (100.0% in the age bracket) enrolled. Conversely, the age group of 10 to 14 year olds has the lowest likelihood of being enrolled in a private school, with 258 (100.0% in the age bracket) attending a public institution.
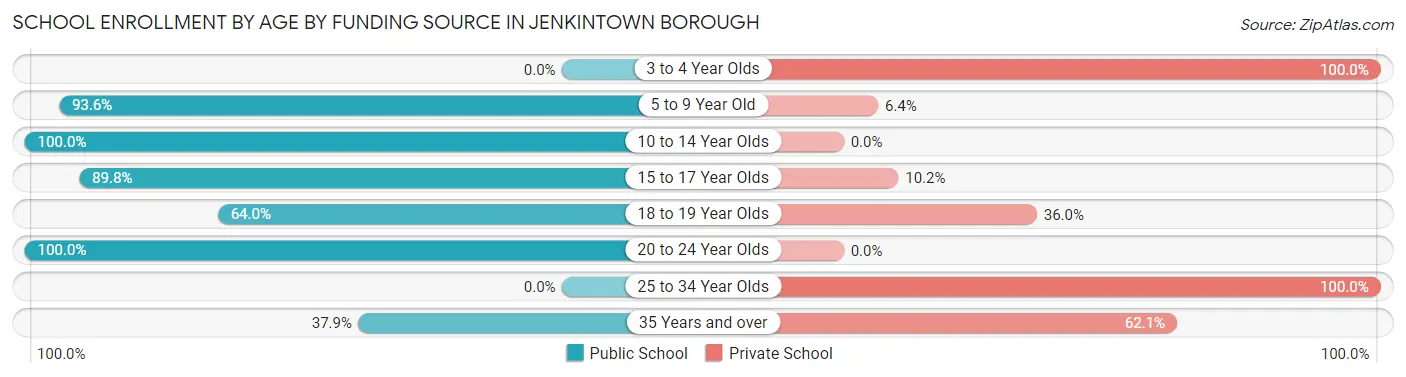
| Age Bracket | Public School | Private School |
| 3 to 4 Year Olds | 0 (0.0%) | 58 (100.0%) |
| 5 to 9 Year Old | 424 (93.6%) | 29 (6.4%) |
| 10 to 14 Year Olds | 258 (100.0%) | 0 (0.0%) |
| 15 to 17 Year Olds | 159 (89.8%) | 18 (10.2%) |
| 18 to 19 Year Olds | 89 (64.0%) | 50 (36.0%) |
| 20 to 24 Year Olds | 19 (100.0%) | 0 (0.0%) |
| 25 to 34 Year Olds | 0 (0.0%) | 100 (100.0%) |
| 35 Years and over | 33 (37.9%) | 54 (62.1%) |
| Total | 982 (76.1%) | 309 (23.9%) |
Educational Attainment by Field of Study in Jenkintown borough
Business (319 | 13.2%), social sciences (250 | 10.3%), psychology (218 | 9.0%), science & technology (214 | 8.8%), and liberal arts & history (186 | 7.7%) are the most common fields of study among 2,423 individuals in Jenkintown borough who have obtained a bachelor's degree or higher.
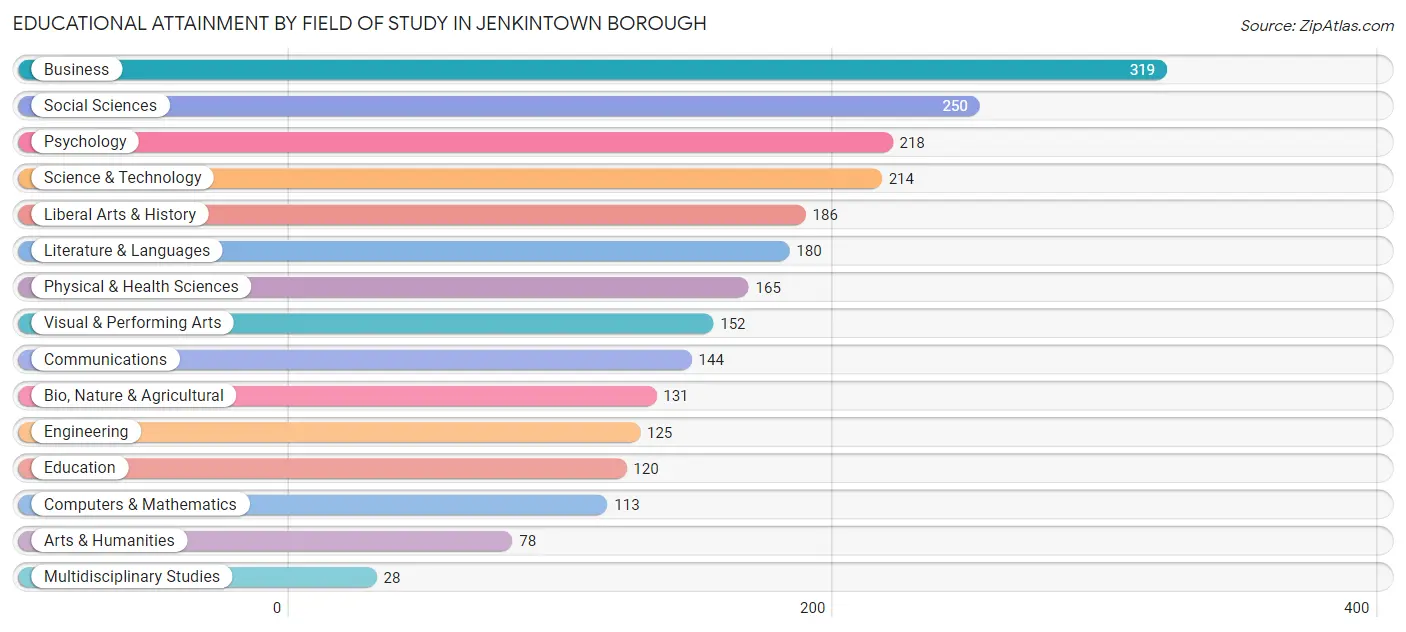
| Field of Study | # Graduates | % Graduates |
| Computers & Mathematics | 113 | 4.7% |
| Bio, Nature & Agricultural | 131 | 5.4% |
| Physical & Health Sciences | 165 | 6.8% |
| Psychology | 218 | 9.0% |
| Social Sciences | 250 | 10.3% |
| Engineering | 125 | 5.2% |
| Multidisciplinary Studies | 28 | 1.2% |
| Science & Technology | 214 | 8.8% |
| Business | 319 | 13.2% |
| Education | 120 | 5.0% |
| Literature & Languages | 180 | 7.4% |
| Liberal Arts & History | 186 | 7.7% |
| Visual & Performing Arts | 152 | 6.3% |
| Communications | 144 | 5.9% |
| Arts & Humanities | 78 | 3.2% |
| Total | 2,423 | 100.0% |
Transportation & Commute in Jenkintown borough
Vehicle Availability by Sex in Jenkintown borough
The most prevalent vehicle ownership categories in Jenkintown borough are males with 2 vehicles (593, accounting for 53.7%) and females with 2 vehicles (560, making up 58.4%).
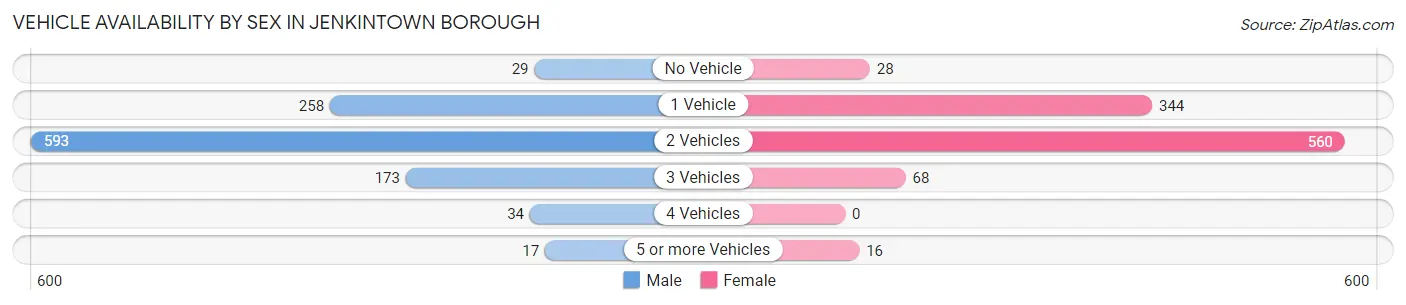
| Vehicles Available | Male | Female |
| No Vehicle | 29 (2.6%) | 28 (2.8%) |
| 1 Vehicle | 258 (23.4%) | 344 (33.9%) |
| 2 Vehicles | 593 (53.7%) | 560 (55.1%) |
| 3 Vehicles | 173 (15.7%) | 68 (6.7%) |
| 4 Vehicles | 34 (3.1%) | 0 (0.0%) |
| 5 or more Vehicles | 17 (1.5%) | 16 (1.6%) |
| Total | 1,104 (100.0%) | 1,016 (100.0%) |
Commute Time in Jenkintown borough
The most frequently occuring commute durations in Jenkintown borough are 20 to 24 minutes (278 commuters, 18.3%), 45 to 59 minutes (267 commuters, 17.5%), and 15 to 19 minutes (187 commuters, 12.3%).
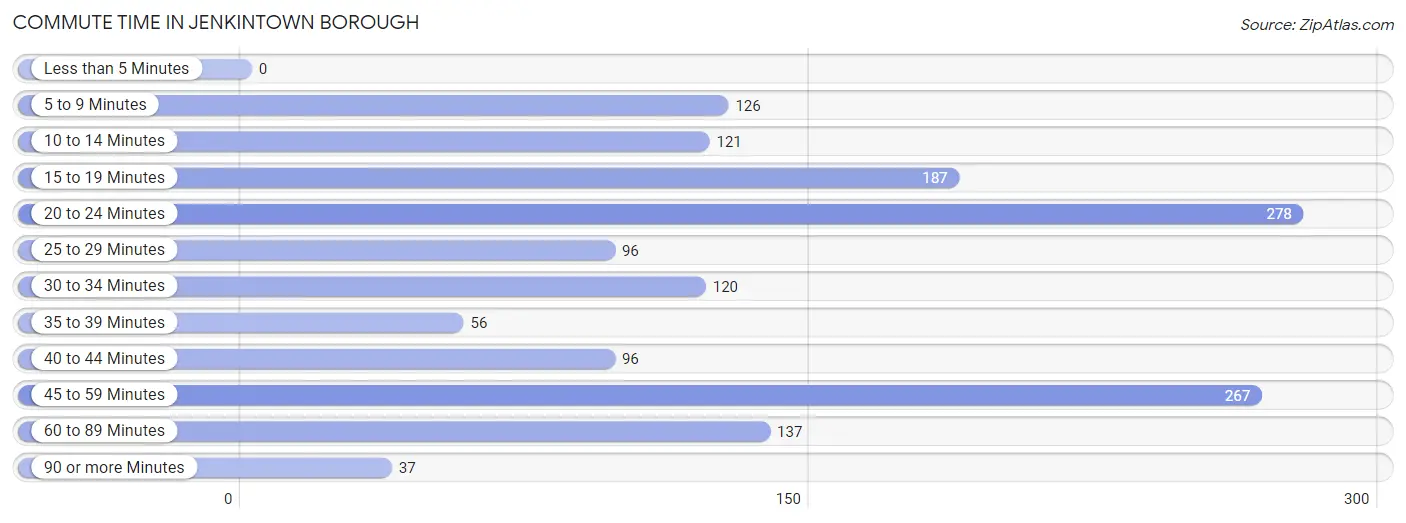
| Commute Time | # Commuters | % Commuters |
| Less than 5 Minutes | 0 | 0.0% |
| 5 to 9 Minutes | 126 | 8.3% |
| 10 to 14 Minutes | 121 | 8.0% |
| 15 to 19 Minutes | 187 | 12.3% |
| 20 to 24 Minutes | 278 | 18.3% |
| 25 to 29 Minutes | 96 | 6.3% |
| 30 to 34 Minutes | 120 | 7.9% |
| 35 to 39 Minutes | 56 | 3.7% |
| 40 to 44 Minutes | 96 | 6.3% |
| 45 to 59 Minutes | 267 | 17.5% |
| 60 to 89 Minutes | 137 | 9.0% |
| 90 or more Minutes | 37 | 2.4% |
Commute Time by Sex in Jenkintown borough
The most common commute times in Jenkintown borough are 45 to 59 minutes (117 commuters, 14.8%) for males and 20 to 24 minutes (191 commuters, 26.1%) for females.
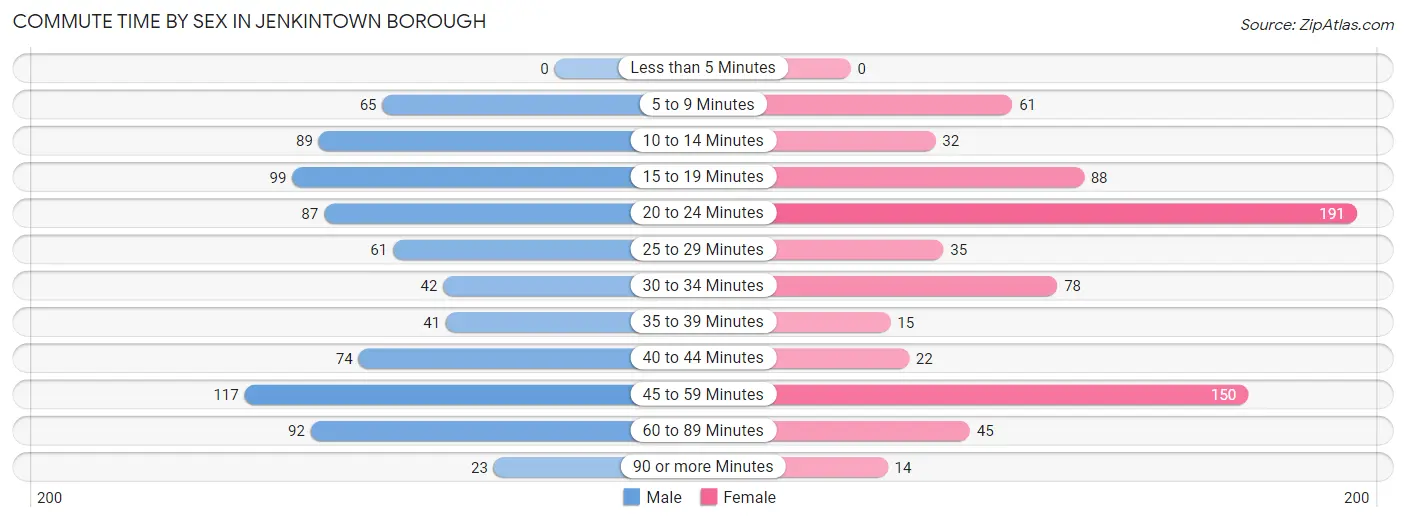
| Commute Time | Male | Female |
| Less than 5 Minutes | 0 (0.0%) | 0 (0.0%) |
| 5 to 9 Minutes | 65 (8.2%) | 61 (8.3%) |
| 10 to 14 Minutes | 89 (11.3%) | 32 (4.4%) |
| 15 to 19 Minutes | 99 (12.5%) | 88 (12.0%) |
| 20 to 24 Minutes | 87 (11.0%) | 191 (26.1%) |
| 25 to 29 Minutes | 61 (7.7%) | 35 (4.8%) |
| 30 to 34 Minutes | 42 (5.3%) | 78 (10.7%) |
| 35 to 39 Minutes | 41 (5.2%) | 15 (2.1%) |
| 40 to 44 Minutes | 74 (9.4%) | 22 (3.0%) |
| 45 to 59 Minutes | 117 (14.8%) | 150 (20.5%) |
| 60 to 89 Minutes | 92 (11.7%) | 45 (6.2%) |
| 90 or more Minutes | 23 (2.9%) | 14 (1.9%) |
Time of Departure to Work by Sex in Jenkintown borough
The most frequent times of departure to work in Jenkintown borough are 7:00 AM to 7:29 AM (147, 18.6%) for males and 8:00 AM to 8:29 AM (201, 27.5%) for females.
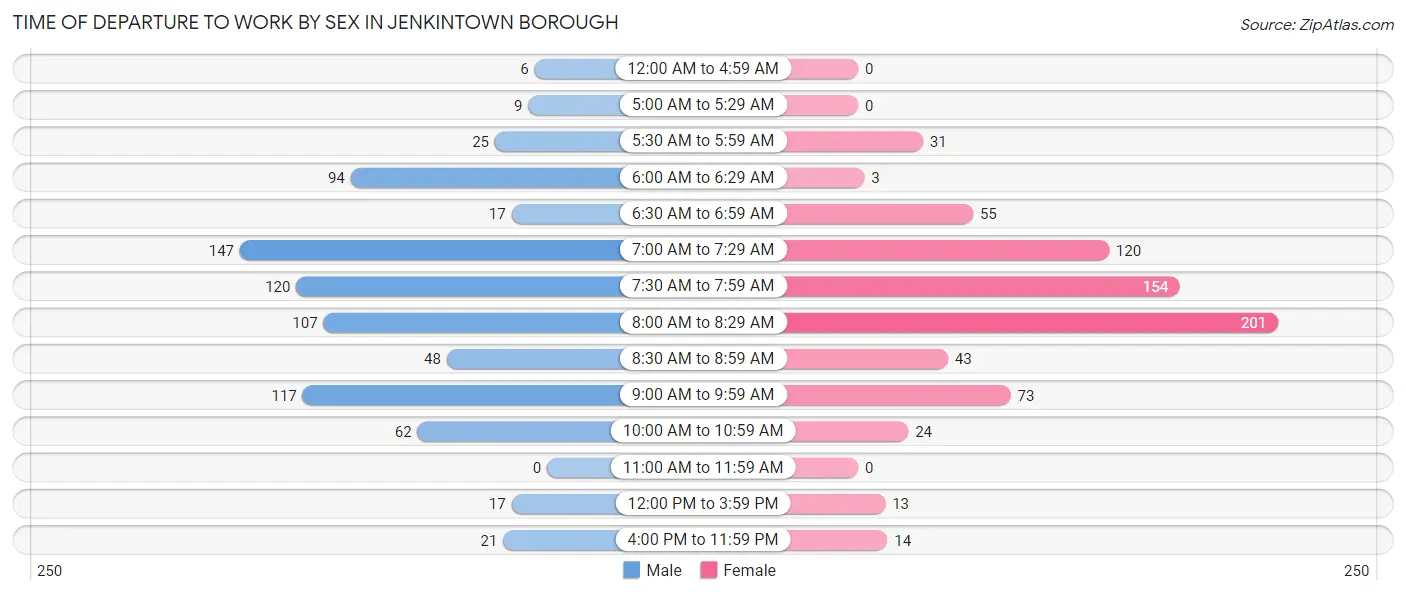
| Time of Departure | Male | Female |
| 12:00 AM to 4:59 AM | 6 (0.8%) | 0 (0.0%) |
| 5:00 AM to 5:29 AM | 9 (1.1%) | 0 (0.0%) |
| 5:30 AM to 5:59 AM | 25 (3.2%) | 31 (4.2%) |
| 6:00 AM to 6:29 AM | 94 (11.9%) | 3 (0.4%) |
| 6:30 AM to 6:59 AM | 17 (2.1%) | 55 (7.5%) |
| 7:00 AM to 7:29 AM | 147 (18.6%) | 120 (16.4%) |
| 7:30 AM to 7:59 AM | 120 (15.2%) | 154 (21.1%) |
| 8:00 AM to 8:29 AM | 107 (13.5%) | 201 (27.5%) |
| 8:30 AM to 8:59 AM | 48 (6.1%) | 43 (5.9%) |
| 9:00 AM to 9:59 AM | 117 (14.8%) | 73 (10.0%) |
| 10:00 AM to 10:59 AM | 62 (7.9%) | 24 (3.3%) |
| 11:00 AM to 11:59 AM | 0 (0.0%) | 0 (0.0%) |
| 12:00 PM to 3:59 PM | 17 (2.1%) | 13 (1.8%) |
| 4:00 PM to 11:59 PM | 21 (2.7%) | 14 (1.9%) |
| Total | 790 (100.0%) | 731 (100.0%) |
Housing Occupancy in Jenkintown borough
Occupancy by Ownership in Jenkintown borough
Of the total 1,988 dwellings in Jenkintown borough, owner-occupied units account for 1,320 (66.4%), while renter-occupied units make up 668 (33.6%).
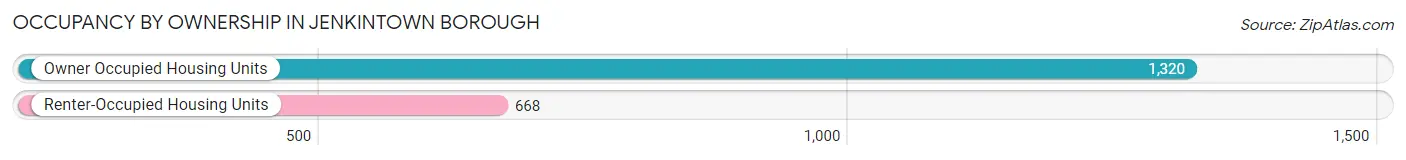
| Occupancy | # Housing Units | % Housing Units |
| Owner Occupied Housing Units | 1,320 | 66.4% |
| Renter-Occupied Housing Units | 668 | 33.6% |
| Total Occupied Housing Units | 1,988 | 100.0% |
Occupancy by Household Size in Jenkintown borough
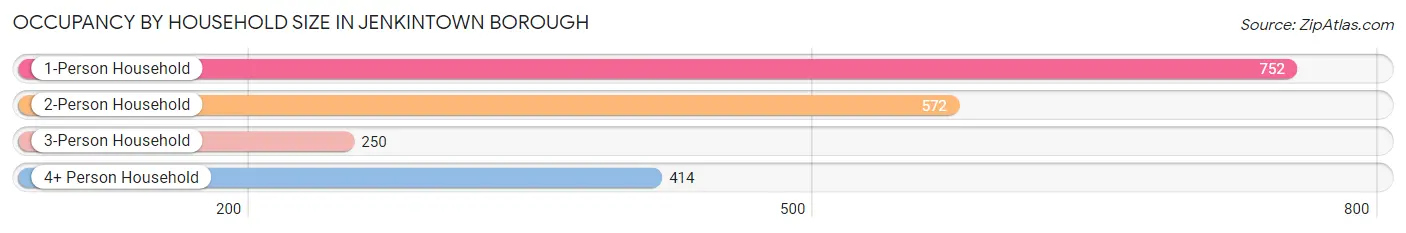
| Household Size | # Housing Units | % Housing Units |
| 1-Person Household | 752 | 37.8% |
| 2-Person Household | 572 | 28.8% |
| 3-Person Household | 250 | 12.6% |
| 4+ Person Household | 414 | 20.8% |
| Total Housing Units | 1,988 | 100.0% |
Occupancy by Ownership by Household Size in Jenkintown borough
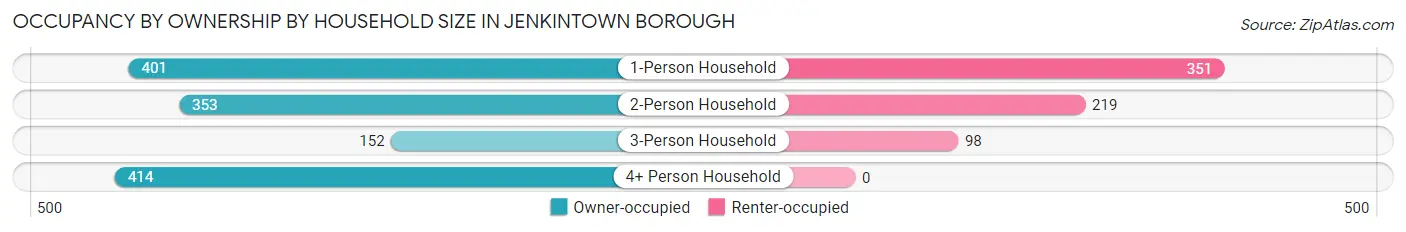
| Household Size | Owner-occupied | Renter-occupied |
| 1-Person Household | 401 (53.3%) | 351 (46.7%) |
| 2-Person Household | 353 (61.7%) | 219 (38.3%) |
| 3-Person Household | 152 (60.8%) | 98 (39.2%) |
| 4+ Person Household | 414 (100.0%) | 0 (0.0%) |
| Total Housing Units | 1,320 (66.4%) | 668 (33.6%) |
Occupancy by Educational Attainment in Jenkintown borough
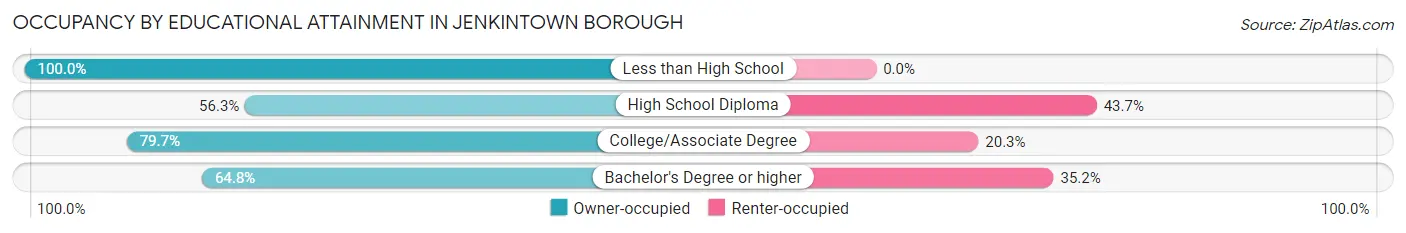
| Household Size | Owner-occupied | Renter-occupied |
| Less than High School | 70 (100.0%) | 0 (0.0%) |
| High School Diploma | 184 (56.3%) | 143 (43.7%) |
| College/Associate Degree | 185 (79.7%) | 47 (20.3%) |
| Bachelor's Degree or higher | 881 (64.8%) | 478 (35.2%) |
Occupancy by Age of Householder in Jenkintown borough
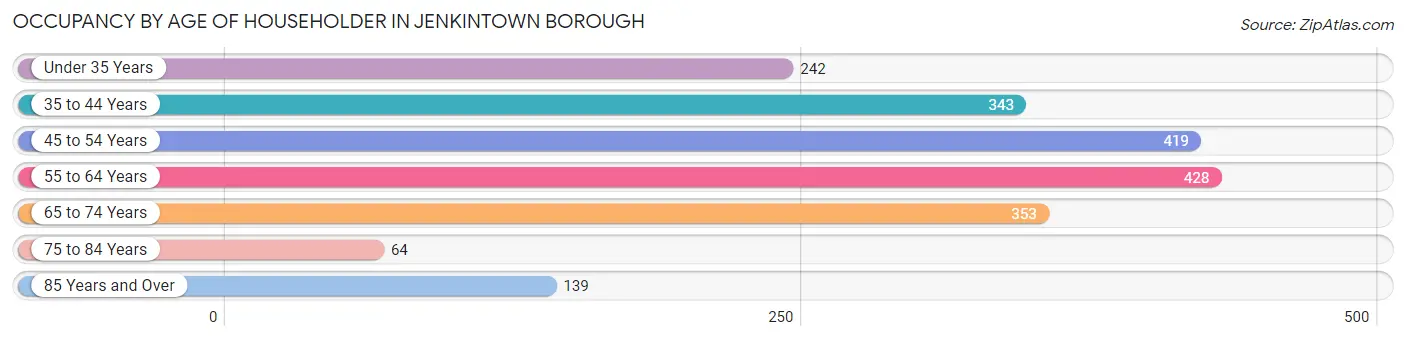
| Age Bracket | # Households | % Households |
| Under 35 Years | 242 | 12.2% |
| 35 to 44 Years | 343 | 17.2% |
| 45 to 54 Years | 419 | 21.1% |
| 55 to 64 Years | 428 | 21.5% |
| 65 to 74 Years | 353 | 17.8% |
| 75 to 84 Years | 64 | 3.2% |
| 85 Years and Over | 139 | 7.0% |
| Total | 1,988 | 100.0% |
Housing Finances in Jenkintown borough
Median Income by Occupancy in Jenkintown borough
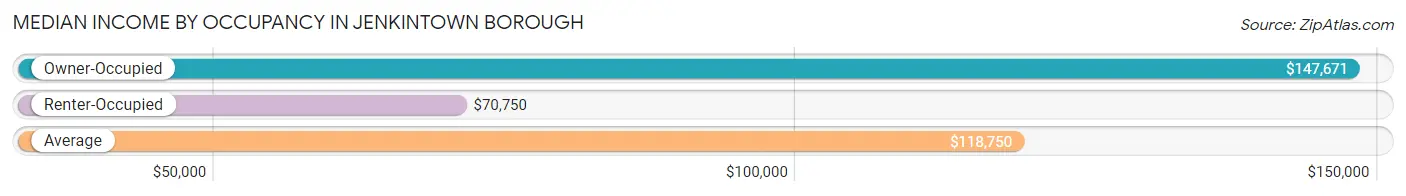
| Occupancy Type | # Households | Median Income |
| Owner-Occupied | 1,320 (66.4%) | $147,671 |
| Renter-Occupied | 668 (33.6%) | $70,750 |
| Average | 1,988 (100.0%) | $118,750 |
Occupancy by Householder Income Bracket in Jenkintown borough
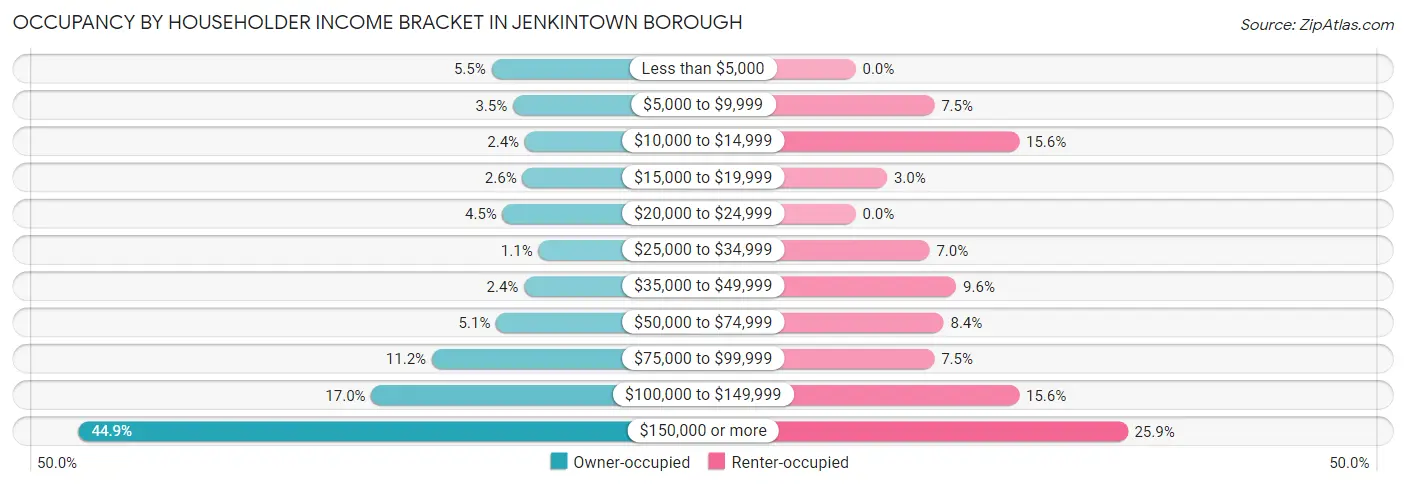
| Income Bracket | Owner-occupied | Renter-occupied |
| Less than $5,000 | 73 (5.5%) | 0 (0.0%) |
| $5,000 to $9,999 | 46 (3.5%) | 50 (7.5%) |
| $10,000 to $14,999 | 31 (2.4%) | 104 (15.6%) |
| $15,000 to $19,999 | 34 (2.6%) | 20 (3.0%) |
| $20,000 to $24,999 | 59 (4.5%) | 0 (0.0%) |
| $25,000 to $34,999 | 14 (1.1%) | 47 (7.0%) |
| $35,000 to $49,999 | 32 (2.4%) | 64 (9.6%) |
| $50,000 to $74,999 | 67 (5.1%) | 56 (8.4%) |
| $75,000 to $99,999 | 148 (11.2%) | 50 (7.5%) |
| $100,000 to $149,999 | 224 (17.0%) | 104 (15.6%) |
| $150,000 or more | 592 (44.9%) | 173 (25.9%) |
| Total | 1,320 (100.0%) | 668 (100.0%) |
Monthly Housing Cost Tiers in Jenkintown borough
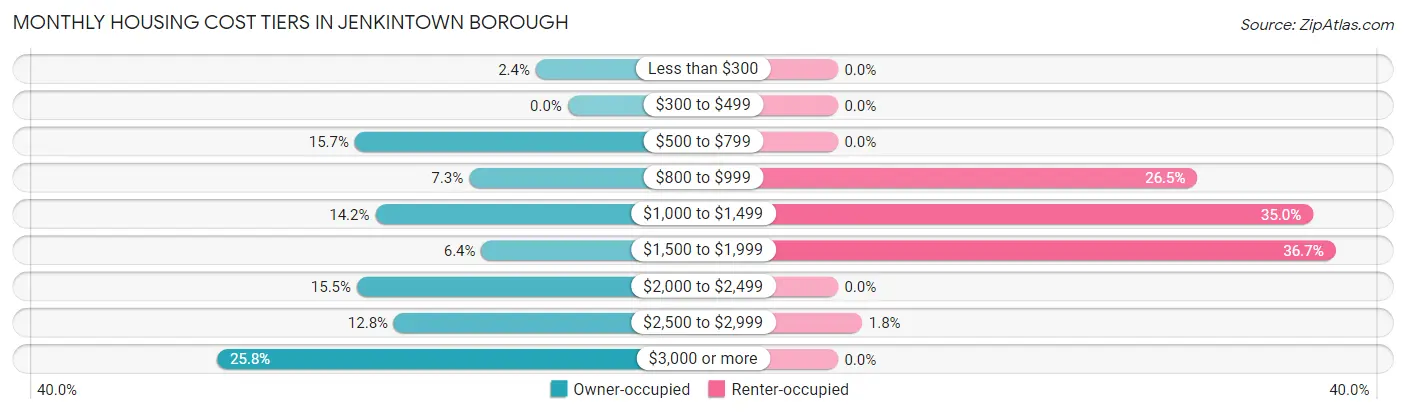
| Monthly Cost | Owner-occupied | Renter-occupied |
| Less than $300 | 31 (2.4%) | 0 (0.0%) |
| $300 to $499 | 0 (0.0%) | 0 (0.0%) |
| $500 to $799 | 207 (15.7%) | 0 (0.0%) |
| $800 to $999 | 96 (7.3%) | 177 (26.5%) |
| $1,000 to $1,499 | 187 (14.2%) | 234 (35.0%) |
| $1,500 to $1,999 | 84 (6.4%) | 245 (36.7%) |
| $2,000 to $2,499 | 205 (15.5%) | 0 (0.0%) |
| $2,500 to $2,999 | 169 (12.8%) | 12 (1.8%) |
| $3,000 or more | 341 (25.8%) | 0 (0.0%) |
| Total | 1,320 (100.0%) | 668 (100.0%) |
Physical Housing Characteristics in Jenkintown borough
Housing Structures in Jenkintown borough
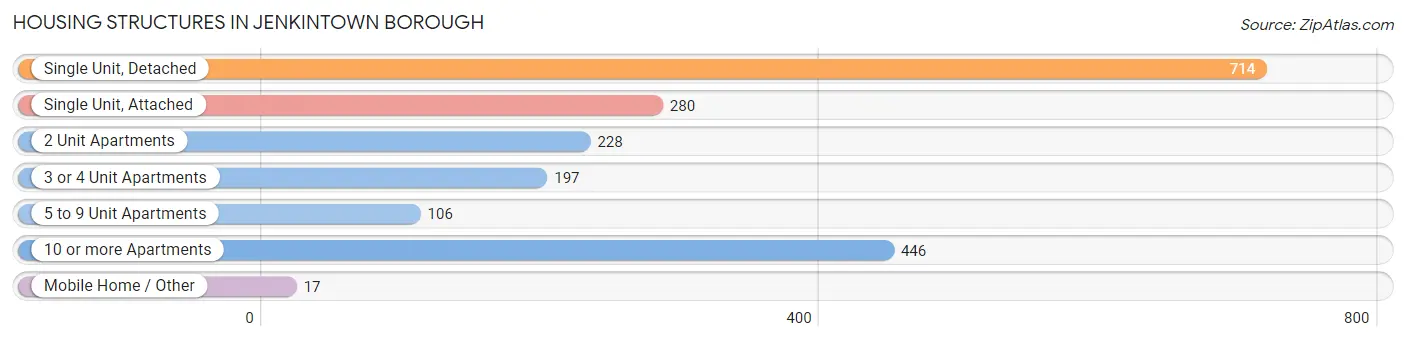
| Structure Type | # Housing Units | % Housing Units |
| Single Unit, Detached | 714 | 35.9% |
| Single Unit, Attached | 280 | 14.1% |
| 2 Unit Apartments | 228 | 11.5% |
| 3 or 4 Unit Apartments | 197 | 9.9% |
| 5 to 9 Unit Apartments | 106 | 5.3% |
| 10 or more Apartments | 446 | 22.4% |
| Mobile Home / Other | 17 | 0.9% |
| Total | 1,988 | 100.0% |
Housing Structures by Occupancy in Jenkintown borough
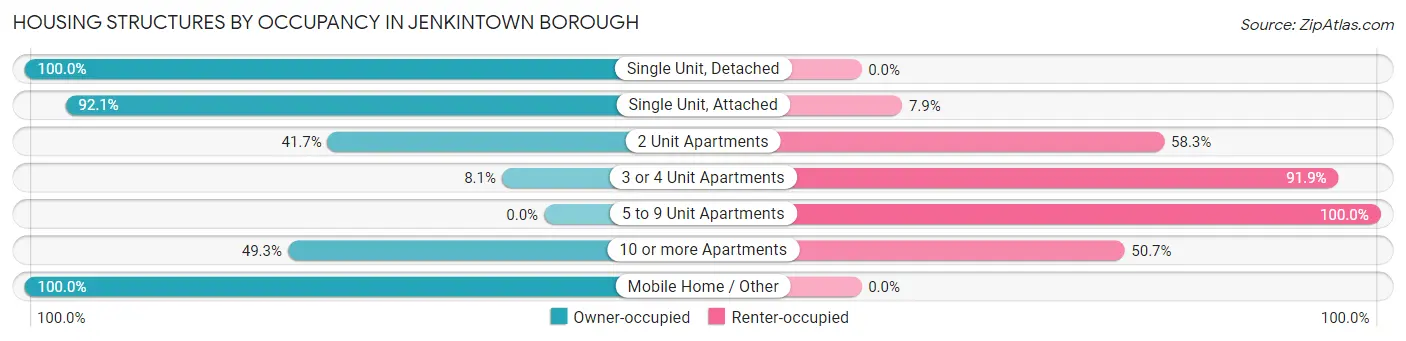
| Structure Type | Owner-occupied | Renter-occupied |
| Single Unit, Detached | 714 (100.0%) | 0 (0.0%) |
| Single Unit, Attached | 258 (92.1%) | 22 (7.9%) |
| 2 Unit Apartments | 95 (41.7%) | 133 (58.3%) |
| 3 or 4 Unit Apartments | 16 (8.1%) | 181 (91.9%) |
| 5 to 9 Unit Apartments | 0 (0.0%) | 106 (100.0%) |
| 10 or more Apartments | 220 (49.3%) | 226 (50.7%) |
| Mobile Home / Other | 17 (100.0%) | 0 (0.0%) |
| Total | 1,320 (66.4%) | 668 (33.6%) |
Housing Structures by Number of Rooms in Jenkintown borough
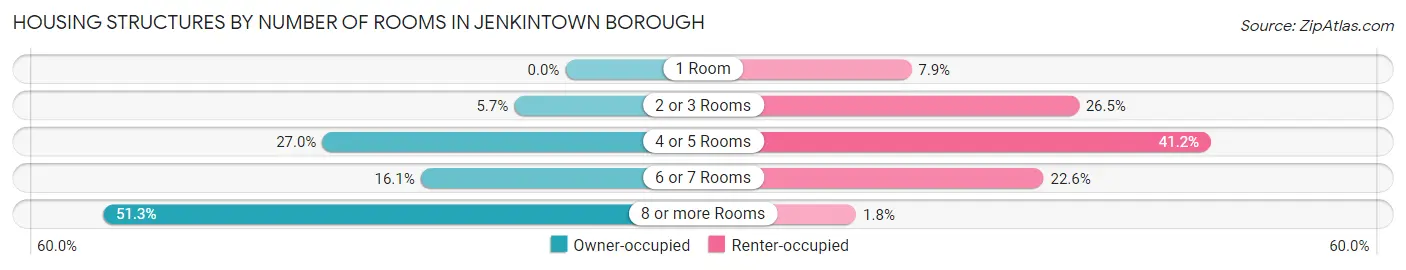
| Number of Rooms | Owner-occupied | Renter-occupied |
| 1 Room | 0 (0.0%) | 53 (7.9%) |
| 2 or 3 Rooms | 75 (5.7%) | 177 (26.5%) |
| 4 or 5 Rooms | 356 (27.0%) | 275 (41.2%) |
| 6 or 7 Rooms | 212 (16.1%) | 151 (22.6%) |
| 8 or more Rooms | 677 (51.3%) | 12 (1.8%) |
| Total | 1,320 (100.0%) | 668 (100.0%) |
Housing Structure by Heating Type in Jenkintown borough
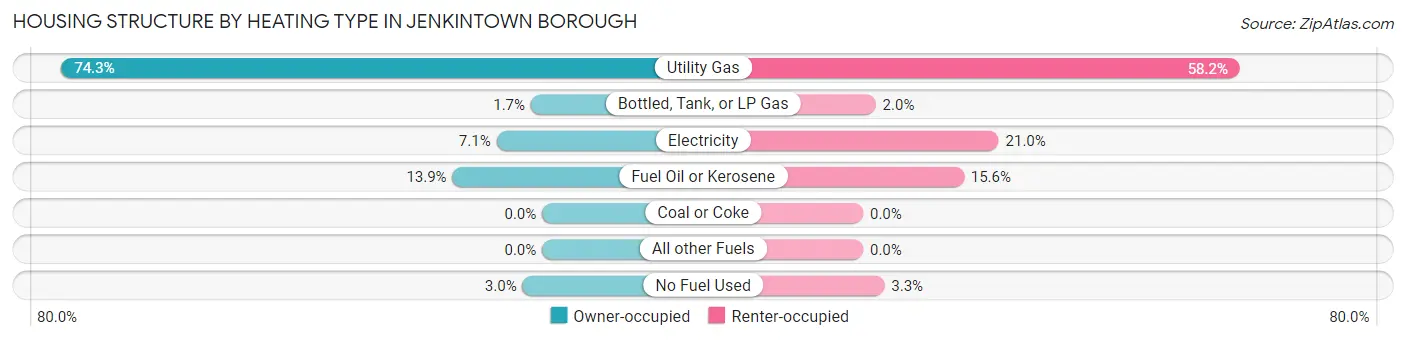
| Heating Type | Owner-occupied | Renter-occupied |
| Utility Gas | 981 (74.3%) | 389 (58.2%) |
| Bottled, Tank, or LP Gas | 23 (1.7%) | 13 (1.9%) |
| Electricity | 93 (7.0%) | 140 (21.0%) |
| Fuel Oil or Kerosene | 183 (13.9%) | 104 (15.6%) |
| Coal or Coke | 0 (0.0%) | 0 (0.0%) |
| All other Fuels | 0 (0.0%) | 0 (0.0%) |
| No Fuel Used | 40 (3.0%) | 22 (3.3%) |
| Total | 1,320 (100.0%) | 668 (100.0%) |
Household Vehicle Usage in Jenkintown borough
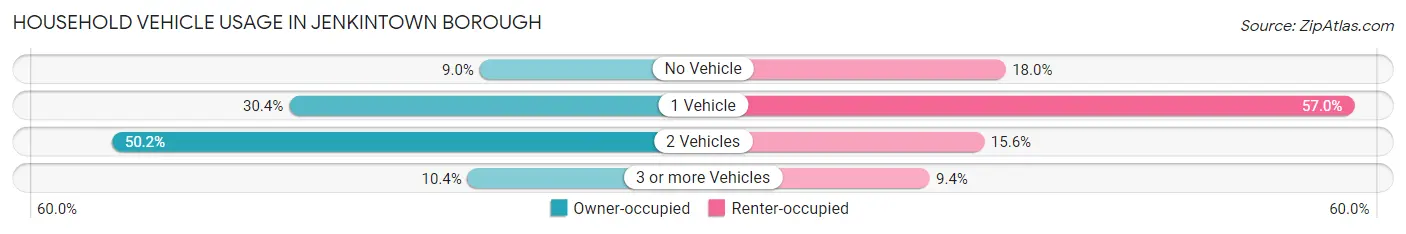
| Vehicles per Household | Owner-occupied | Renter-occupied |
| No Vehicle | 119 (9.0%) | 120 (18.0%) |
| 1 Vehicle | 401 (30.4%) | 381 (57.0%) |
| 2 Vehicles | 663 (50.2%) | 104 (15.6%) |
| 3 or more Vehicles | 137 (10.4%) | 63 (9.4%) |
| Total | 1,320 (100.0%) | 668 (100.0%) |
Real Estate & Mortgages in Jenkintown borough
Real Estate and Mortgage Overview in Jenkintown borough
| Characteristic | Without Mortgage | With Mortgage |
| Housing Units | 544 | 776 |
| Median Property Value | $169,000 | $388,100 |
| Median Household Income | $78,750 | $456 |
| Monthly Housing Costs | $923 | $327 |
| Real Estate Taxes | $4,366 | $0 |
Property Value by Mortgage Status in Jenkintown borough
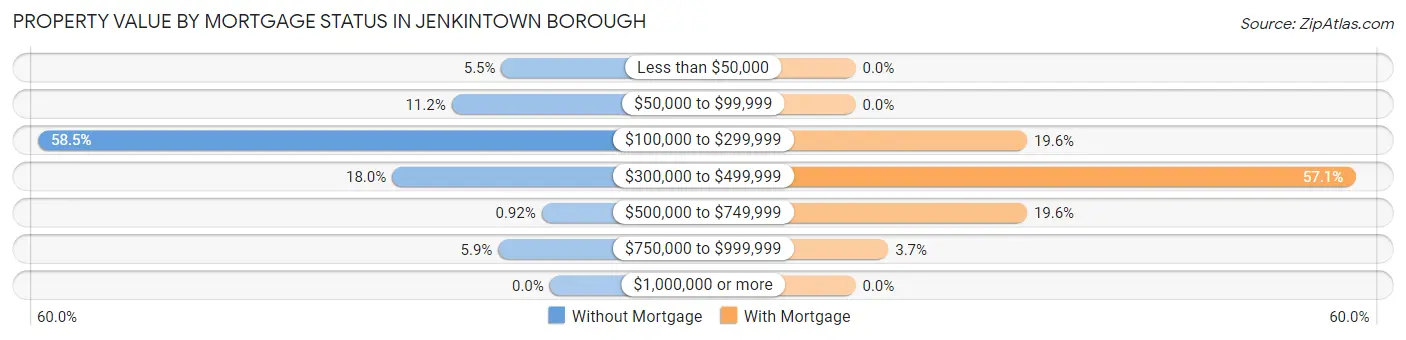
| Property Value | Without Mortgage | With Mortgage |
| Less than $50,000 | 30 (5.5%) | 0 (0.0%) |
| $50,000 to $99,999 | 61 (11.2%) | 0 (0.0%) |
| $100,000 to $299,999 | 318 (58.5%) | 152 (19.6%) |
| $300,000 to $499,999 | 98 (18.0%) | 443 (57.1%) |
| $500,000 to $749,999 | 5 (0.9%) | 152 (19.6%) |
| $750,000 to $999,999 | 32 (5.9%) | 29 (3.7%) |
| $1,000,000 or more | 0 (0.0%) | 0 (0.0%) |
| Total | 544 (100.0%) | 776 (100.0%) |
Household Income by Mortgage Status in Jenkintown borough
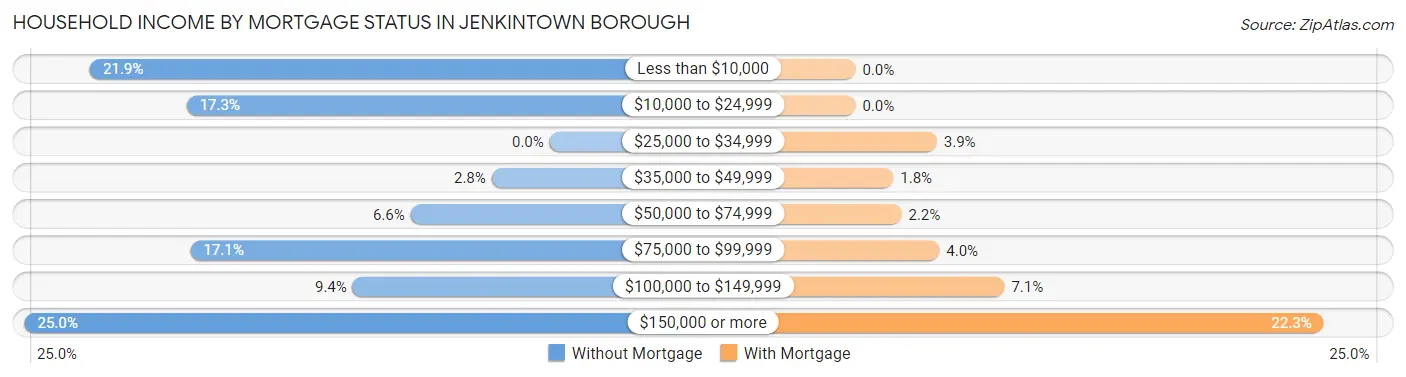
| Household Income | Without Mortgage | With Mortgage |
| Less than $10,000 | 119 (21.9%) | 0 (0.0%) |
| $10,000 to $24,999 | 94 (17.3%) | 0 (0.0%) |
| $25,000 to $34,999 | 0 (0.0%) | 30 (3.9%) |
| $35,000 to $49,999 | 15 (2.8%) | 14 (1.8%) |
| $50,000 to $74,999 | 36 (6.6%) | 17 (2.2%) |
| $75,000 to $99,999 | 93 (17.1%) | 31 (4.0%) |
| $100,000 to $149,999 | 51 (9.4%) | 55 (7.1%) |
| $150,000 or more | 136 (25.0%) | 173 (22.3%) |
| Total | 544 (100.0%) | 776 (100.0%) |
Property Value to Household Income Ratio in Jenkintown borough
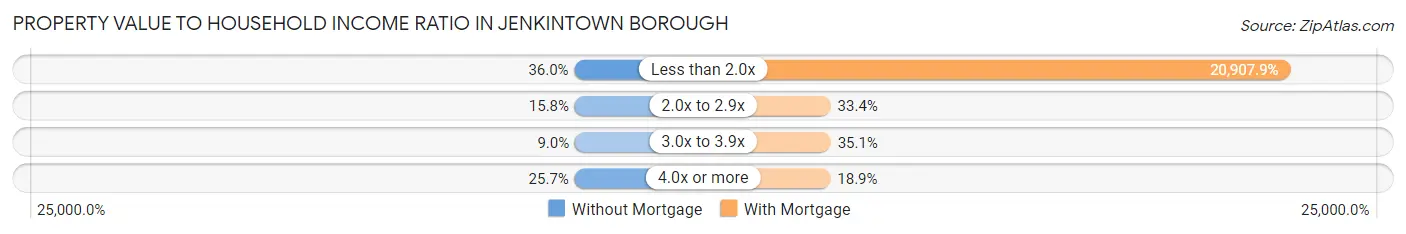
| Value-to-Income Ratio | Without Mortgage | With Mortgage |
| Less than 2.0x | 196 (36.0%) | 162,245 (20,907.9%) |
| 2.0x to 2.9x | 86 (15.8%) | 259 (33.4%) |
| 3.0x to 3.9x | 49 (9.0%) | 272 (35.0%) |
| 4.0x or more | 140 (25.7%) | 147 (18.9%) |
| Total | 544 (100.0%) | 776 (100.0%) |
Real Estate Taxes by Mortgage Status in Jenkintown borough
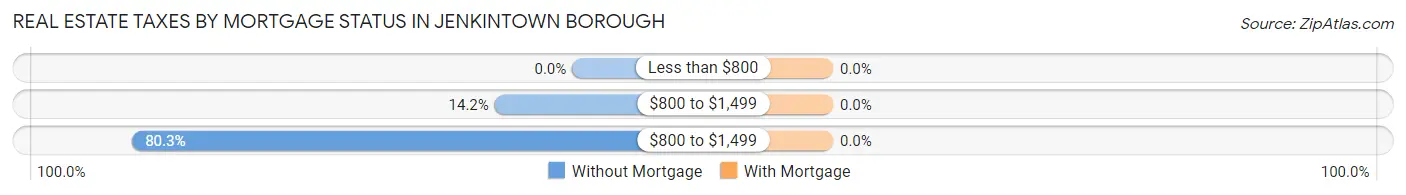
| Property Taxes | Without Mortgage | With Mortgage |
| Less than $800 | 0 (0.0%) | 0 (0.0%) |
| $800 to $1,499 | 77 (14.1%) | 0 (0.0%) |
| $800 to $1,499 | 437 (80.3%) | 0 (0.0%) |
| Total | 544 (100.0%) | 776 (100.0%) |
Health & Disability in Jenkintown borough
Health Insurance Coverage by Age in Jenkintown borough
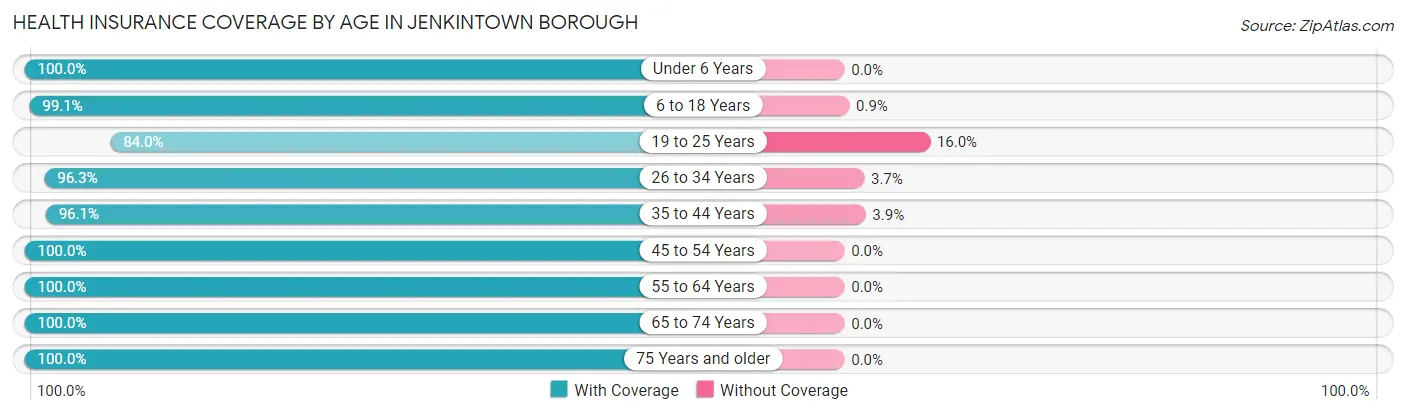
| Age Bracket | With Coverage | Without Coverage |
| Under 6 Years | 363 (100.0%) | 0 (0.0%) |
| 6 to 18 Years | 993 (99.1%) | 9 (0.9%) |
| 19 to 25 Years | 100 (84.0%) | 19 (16.0%) |
| 26 to 34 Years | 445 (96.3%) | 17 (3.7%) |
| 35 to 44 Years | 658 (96.1%) | 27 (3.9%) |
| 45 to 54 Years | 580 (100.0%) | 0 (0.0%) |
| 55 to 64 Years | 646 (100.0%) | 0 (0.0%) |
| 65 to 74 Years | 532 (100.0%) | 0 (0.0%) |
| 75 Years and older | 314 (100.0%) | 0 (0.0%) |
| Total | 4,631 (98.5%) | 72 (1.5%) |
Health Insurance Coverage by Citizenship Status in Jenkintown borough
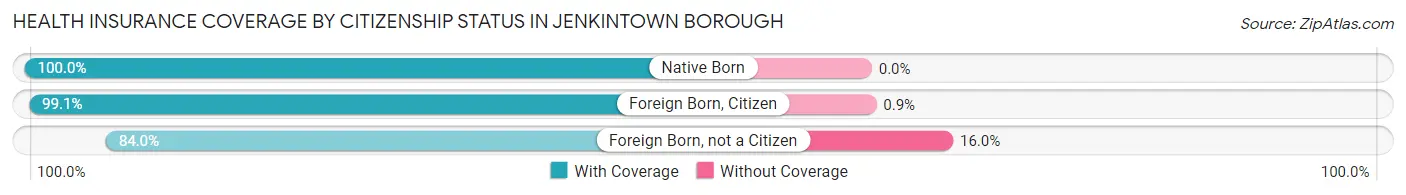
| Citizenship Status | With Coverage | Without Coverage |
| Native Born | 363 (100.0%) | 0 (0.0%) |
| Foreign Born, Citizen | 993 (99.1%) | 9 (0.9%) |
| Foreign Born, not a Citizen | 100 (84.0%) | 19 (16.0%) |
Health Insurance Coverage by Household Income in Jenkintown borough
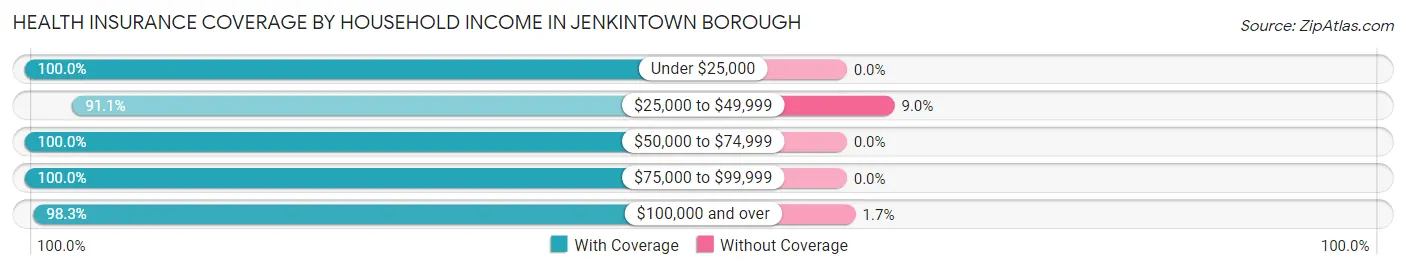
| Household Income | With Coverage | Without Coverage |
| Under $25,000 | 476 (100.0%) | 0 (0.0%) |
| $25,000 to $49,999 | 173 (91.0%) | 17 (8.9%) |
| $50,000 to $74,999 | 329 (100.0%) | 0 (0.0%) |
| $75,000 to $99,999 | 387 (100.0%) | 0 (0.0%) |
| $100,000 and over | 3,261 (98.3%) | 55 (1.7%) |
Public vs Private Health Insurance Coverage by Age in Jenkintown borough
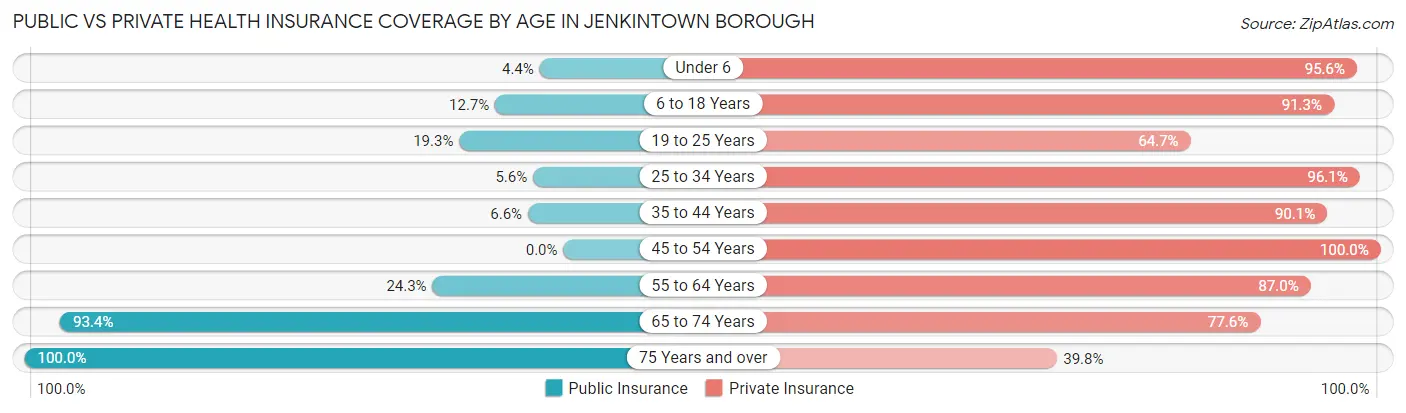
| Age Bracket | Public Insurance | Private Insurance |
| Under 6 | 16 (4.4%) | 347 (95.6%) |
| 6 to 18 Years | 127 (12.7%) | 915 (91.3%) |
| 19 to 25 Years | 23 (19.3%) | 77 (64.7%) |
| 25 to 34 Years | 26 (5.6%) | 444 (96.1%) |
| 35 to 44 Years | 45 (6.6%) | 617 (90.1%) |
| 45 to 54 Years | 0 (0.0%) | 580 (100.0%) |
| 55 to 64 Years | 157 (24.3%) | 562 (87.0%) |
| 65 to 74 Years | 497 (93.4%) | 413 (77.6%) |
| 75 Years and over | 314 (100.0%) | 125 (39.8%) |
| Total | 1,205 (25.6%) | 4,080 (86.8%) |
Disability Status by Sex by Age in Jenkintown borough
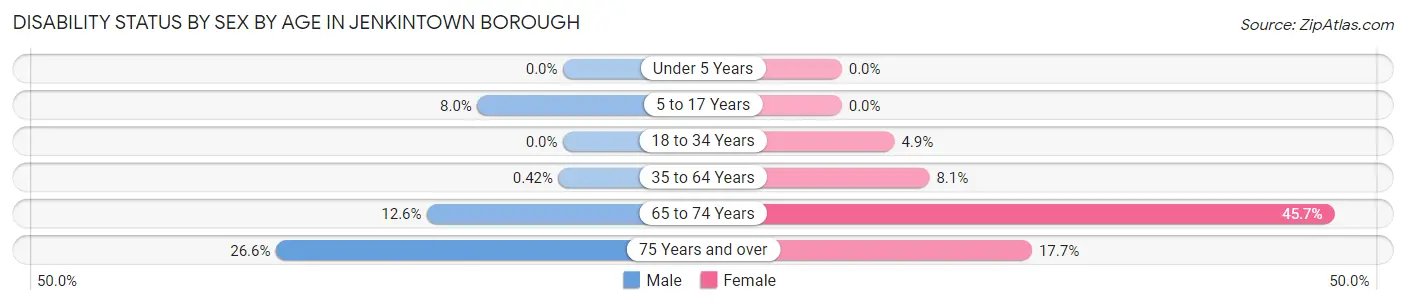
| Age Bracket | Male | Female |
| Under 5 Years | 0 (0.0%) | 0 (0.0%) |
| 5 to 17 Years | 43 (8.0%) | 0 (0.0%) |
| 18 to 34 Years | 0 (0.0%) | 16 (4.9%) |
| 35 to 64 Years | 4 (0.4%) | 78 (8.1%) |
| 65 to 74 Years | 26 (12.6%) | 149 (45.7%) |
| 75 Years and over | 61 (26.6%) | 15 (17.6%) |
Disability Class by Sex by Age in Jenkintown borough
Disability Class: Hearing Difficulty
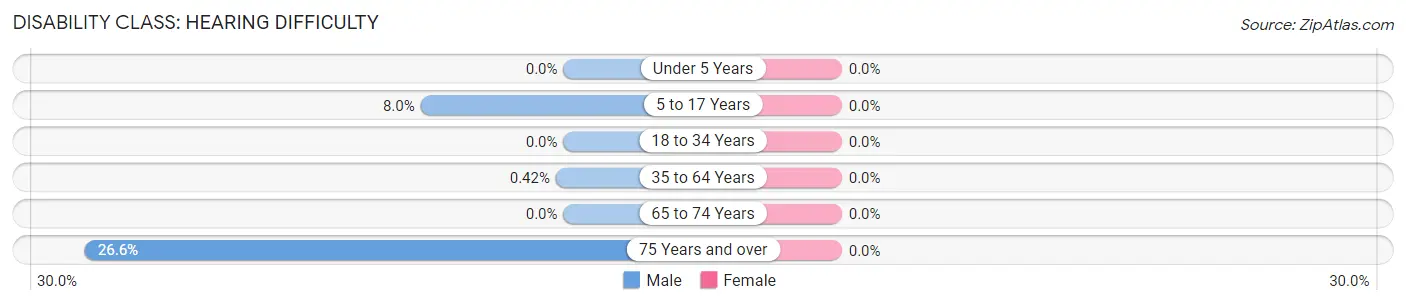
| Age Bracket | Male | Female |
| Under 5 Years | 0 (0.0%) | 0 (0.0%) |
| 5 to 17 Years | 43 (8.0%) | 0 (0.0%) |
| 18 to 34 Years | 0 (0.0%) | 0 (0.0%) |
| 35 to 64 Years | 4 (0.4%) | 0 (0.0%) |
| 65 to 74 Years | 0 (0.0%) | 0 (0.0%) |
| 75 Years and over | 61 (26.6%) | 0 (0.0%) |
Disability Class: Vision Difficulty
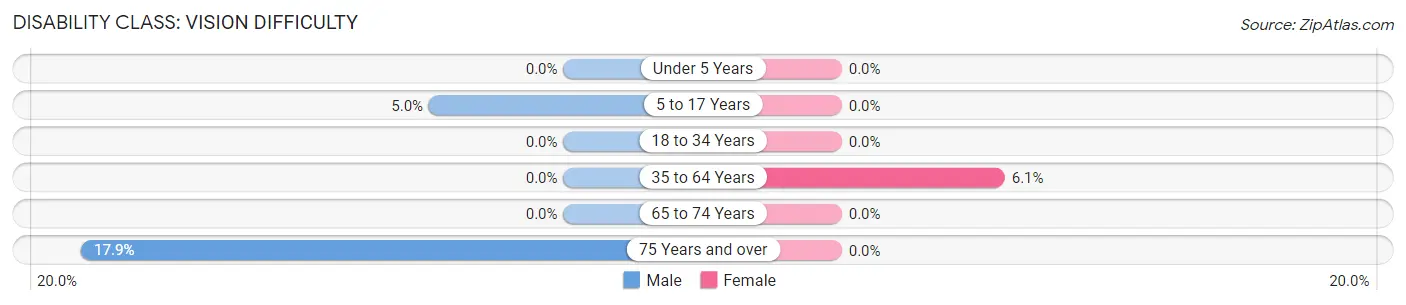
| Age Bracket | Male | Female |
| Under 5 Years | 0 (0.0%) | 0 (0.0%) |
| 5 to 17 Years | 27 (5.0%) | 0 (0.0%) |
| 18 to 34 Years | 0 (0.0%) | 0 (0.0%) |
| 35 to 64 Years | 0 (0.0%) | 58 (6.0%) |
| 65 to 74 Years | 0 (0.0%) | 0 (0.0%) |
| 75 Years and over | 41 (17.9%) | 0 (0.0%) |
Disability Class: Cognitive Difficulty
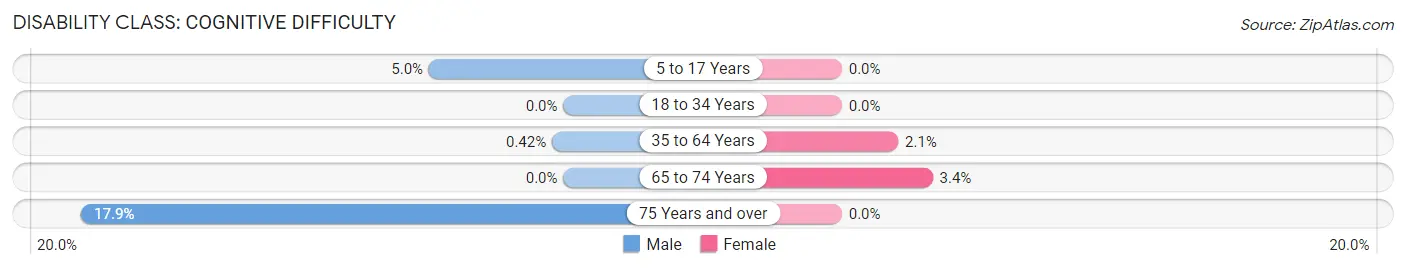
| Age Bracket | Male | Female |
| 5 to 17 Years | 27 (5.0%) | 0 (0.0%) |
| 18 to 34 Years | 0 (0.0%) | 0 (0.0%) |
| 35 to 64 Years | 4 (0.4%) | 20 (2.1%) |
| 65 to 74 Years | 0 (0.0%) | 11 (3.4%) |
| 75 Years and over | 41 (17.9%) | 0 (0.0%) |
Disability Class: Ambulatory Difficulty
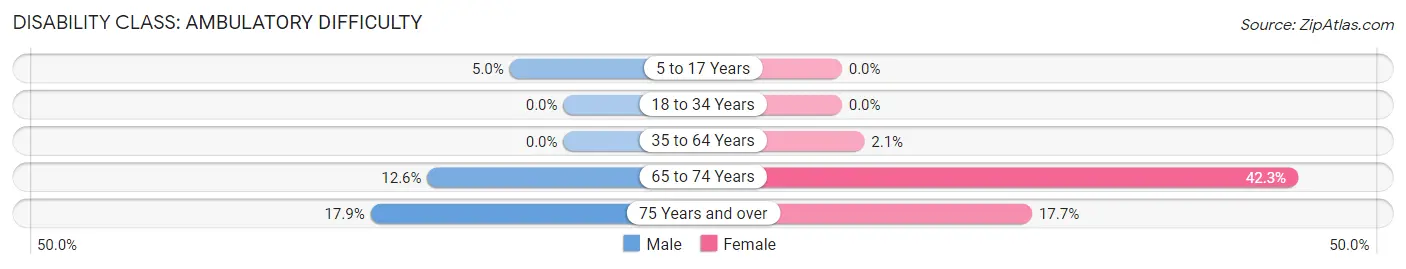
| Age Bracket | Male | Female |
| 5 to 17 Years | 27 (5.0%) | 0 (0.0%) |
| 18 to 34 Years | 0 (0.0%) | 0 (0.0%) |
| 35 to 64 Years | 0 (0.0%) | 20 (2.1%) |
| 65 to 74 Years | 26 (12.6%) | 138 (42.3%) |
| 75 Years and over | 41 (17.9%) | 15 (17.6%) |
Disability Class: Self-Care Difficulty
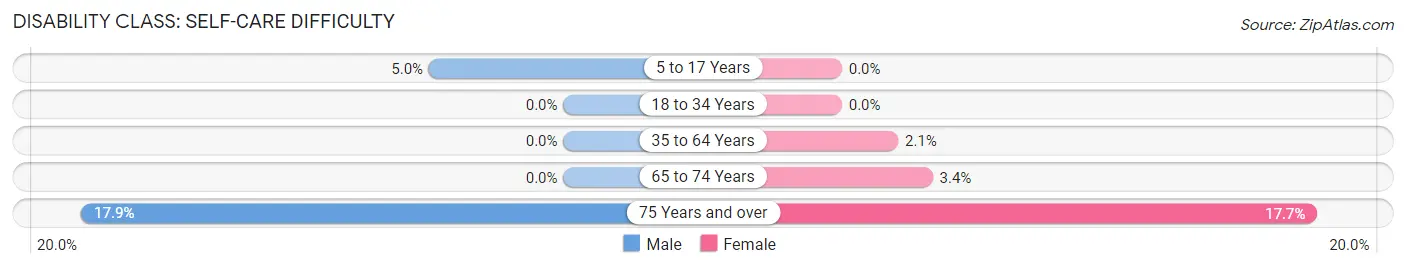
| Age Bracket | Male | Female |
| 5 to 17 Years | 27 (5.0%) | 0 (0.0%) |
| 18 to 34 Years | 0 (0.0%) | 0 (0.0%) |
| 35 to 64 Years | 0 (0.0%) | 20 (2.1%) |
| 65 to 74 Years | 0 (0.0%) | 11 (3.4%) |
| 75 Years and over | 41 (17.9%) | 15 (17.6%) |
Technology Access in Jenkintown borough
Computing Device Access in Jenkintown borough
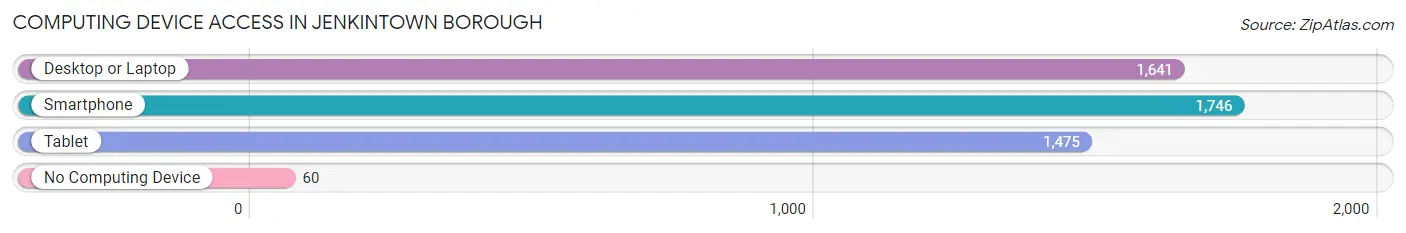
| Device Type | # Households | % Households |
| Desktop or Laptop | 1,641 | 82.6% |
| Smartphone | 1,746 | 87.8% |
| Tablet | 1,475 | 74.2% |
| No Computing Device | 60 | 3.0% |
| Total | 1,988 | 100.0% |
Internet Access in Jenkintown borough
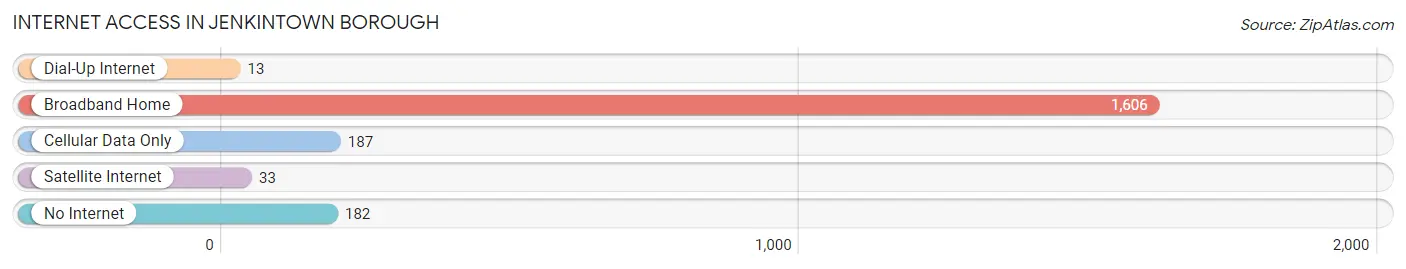
| Internet Type | # Households | % Households |
| Dial-Up Internet | 13 | 0.6% |
| Broadband Home | 1,606 | 80.8% |
| Cellular Data Only | 187 | 9.4% |
| Satellite Internet | 33 | 1.7% |
| No Internet | 182 | 9.1% |
| Total | 1,988 | 100.0% |
Jenkintown borough Summary
Jenkintown Borough is a small borough located in Montgomery County, Pennsylvania. It is situated approximately 15 miles north of Philadelphia and is part of the Abington Township. The borough is home to a population of 4,500 people and covers an area of 0.8 square miles.
History
Jenkintown was founded in 1697 by Welsh settlers who named the area after their leader, William Jenkins. The area was originally part of Abington Township and was known as “Jenkins’ Town”. The town was officially incorporated as a borough in 1874.
In the late 19th century, Jenkintown became a popular summer resort for wealthy Philadelphians. The town was home to several large estates, including the historic “Greystone” estate, which was built in 1876. The town also had a thriving business district, which included a variety of shops, restaurants, and theaters.
In the early 20th century, Jenkintown began to experience a decline in population as many of the wealthy residents moved away. The town was also affected by the Great Depression and World War II. However, the town began to experience a resurgence in the 1950s and 1960s, as many of the original buildings were restored and new businesses opened.
Geography
Jenkintown is located in Montgomery County, Pennsylvania. It is situated approximately 15 miles north of Philadelphia and is part of the Abington Township. The borough is bordered by Abington Township to the north, Elkins Park to the east, Cheltenham Township to the south, and Rockledge Borough to the west.
The borough is located in the Delaware Valley region and is situated on the banks of the Pennypack Creek. The terrain is mostly flat, with some rolling hills in the northern part of the borough. The borough is home to several parks, including the Jenkintown Park and the Jenkintown Green.
Economy
The economy of Jenkintown is largely based on retail and services. The borough is home to several small businesses, including restaurants, shops, and professional services. The borough is also home to several large employers, including the Abington Memorial Hospital and the Abington School District.
The borough is also home to several historic buildings, including the Greystone estate and the Jenkintown Train Station. These buildings are popular tourist attractions and contribute to the local economy.
Demographics
As of the 2010 census, the population of Jenkintown was 4,500. The racial makeup of the borough was 87.3% White, 8.2% African American, 0.7% Asian, 0.2% Native American, and 3.6% from other races. The median household income was $63,750 and the median family income was $76,250.
The borough is home to a diverse population, with a variety of religious backgrounds. The largest religious group is the Roman Catholic Church, followed by the Episcopal Church, the Presbyterian Church, and the United Methodist Church.
Conclusion
Jenkintown is a small borough located in Montgomery County, Pennsylvania. It is situated approximately 15 miles north of Philadelphia and is part of the Abington Township. The borough is home to a population of 4,500 people and covers an area of 0.8 square miles. The economy of Jenkintown is largely based on retail and services, and the borough is home to several historic buildings, including the Greystone estate and the Jenkintown Train Station. The borough is also home to a diverse population, with a variety of religious backgrounds.
Common Questions
What is Per Capita Income in Jenkintown borough?
Per Capita income in Jenkintown borough is $70,057.
What is the Median Family Income in Jenkintown borough?
Median Family Income in Jenkintown borough is $160,051.
What is the Median Household income in Jenkintown borough?
Median Household Income in Jenkintown borough is $118,750.
What is Income or Wage Gap in Jenkintown borough?
Income or Wage Gap in Jenkintown borough is 28.2%.
Women in Jenkintown borough earn 71.8 cents for every dollar earned by a man.
What is Inequality or Gini Index in Jenkintown borough?
Inequality or Gini Index in Jenkintown borough is 0.54.
What is the Total Population of Jenkintown borough?
Total Population of Jenkintown borough is 4,703.
What is the Total Male Population of Jenkintown borough?
Total Male Population of Jenkintown borough is 2,431.
What is the Total Female Population of Jenkintown borough?
Total Female Population of Jenkintown borough is 2,272.
What is the Ratio of Males per 100 Females in Jenkintown borough?
There are 107.00 Males per 100 Females in Jenkintown borough.
What is the Ratio of Females per 100 Males in Jenkintown borough?
There are 93.46 Females per 100 Males in Jenkintown borough.
What is the Median Population Age in Jenkintown borough?
Median Population Age in Jenkintown borough is 42.7 Years.
What is the Average Family Size in Jenkintown borough
Average Family Size in Jenkintown borough is 3.2 People.
What is the Average Household Size in Jenkintown borough
Average Household Size in Jenkintown borough is 2.4 People.
How Large is the Labor Force in Jenkintown borough?
There are 2,360 People in the Labor Forcein in Jenkintown borough.
What is the Percentage of People in the Labor Force in Jenkintown borough?
65.8% of People are in the Labor Force in Jenkintown borough.
What is the Unemployment Rate in Jenkintown borough?
Unemployment Rate in Jenkintown borough is 6.1%.