Devon, PA Map & Demographics
Devon Map
Devon Overview
$70,993
PER CAPITA INCOME
$214,063
AVG FAMILY INCOME
$206,827
AVG HOUSEHOLD INCOME
43.0%
WAGE / INCOME GAP [ % ]
57.0¢/ $1
WAGE / INCOME GAP [ $ ]
0.40
INEQUALITY / GINI INDEX
1,890
TOTAL POPULATION
997
MALE POPULATION
893
FEMALE POPULATION
111.65
MALES / 100 FEMALES
89.57
FEMALES / 100 MALES
45.6
MEDIAN AGE
3.3
AVG FAMILY SIZE
3.0
AVG HOUSEHOLD SIZE
1,210
LABOR FORCE [ PEOPLE ]
77.0%
PERCENT IN LABOR FORCE
3.4%
UNEMPLOYMENT RATE
Devon Zip Codes
Income in Devon
Income Overview in Devon
Per Capita Income in Devon is $70,993, while median incomes of families and households are $214,063 and $206,827 respectively.
| Characteristic | Number | Measure |
| Per Capita Income | 1,890 | $70,993 |
| Median Family Income | 460 | $214,063 |
| Mean Family Income | 460 | $237,265 |
| Median Household Income | 601 | $206,827 |
| Mean Household Income | 601 | $216,686 |
| Income Deficit | 460 | $0 |
| Wage / Income Gap (%) | 1,890 | 42.99% |
| Wage / Income Gap ($) | 1,890 | 57.01¢ per $1 |
| Gini / Inequality Index | 1,890 | 0.40 |
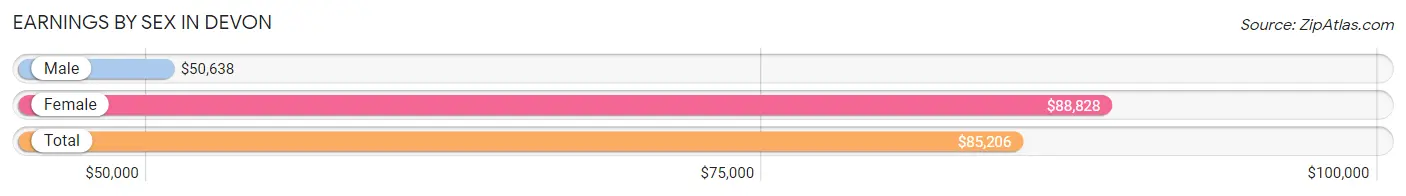
Earnings by Sex in Devon
Average Earnings in Devon are $85,206, $50,638 for men and $88,828 for women, a difference of 43.0%.
| Sex | Number | Average Earnings |
| Male | 715 (58.6%) | $50,638 |
| Female | 506 (41.4%) | $88,828 |
| Total | 1,221 (100.0%) | $85,206 |
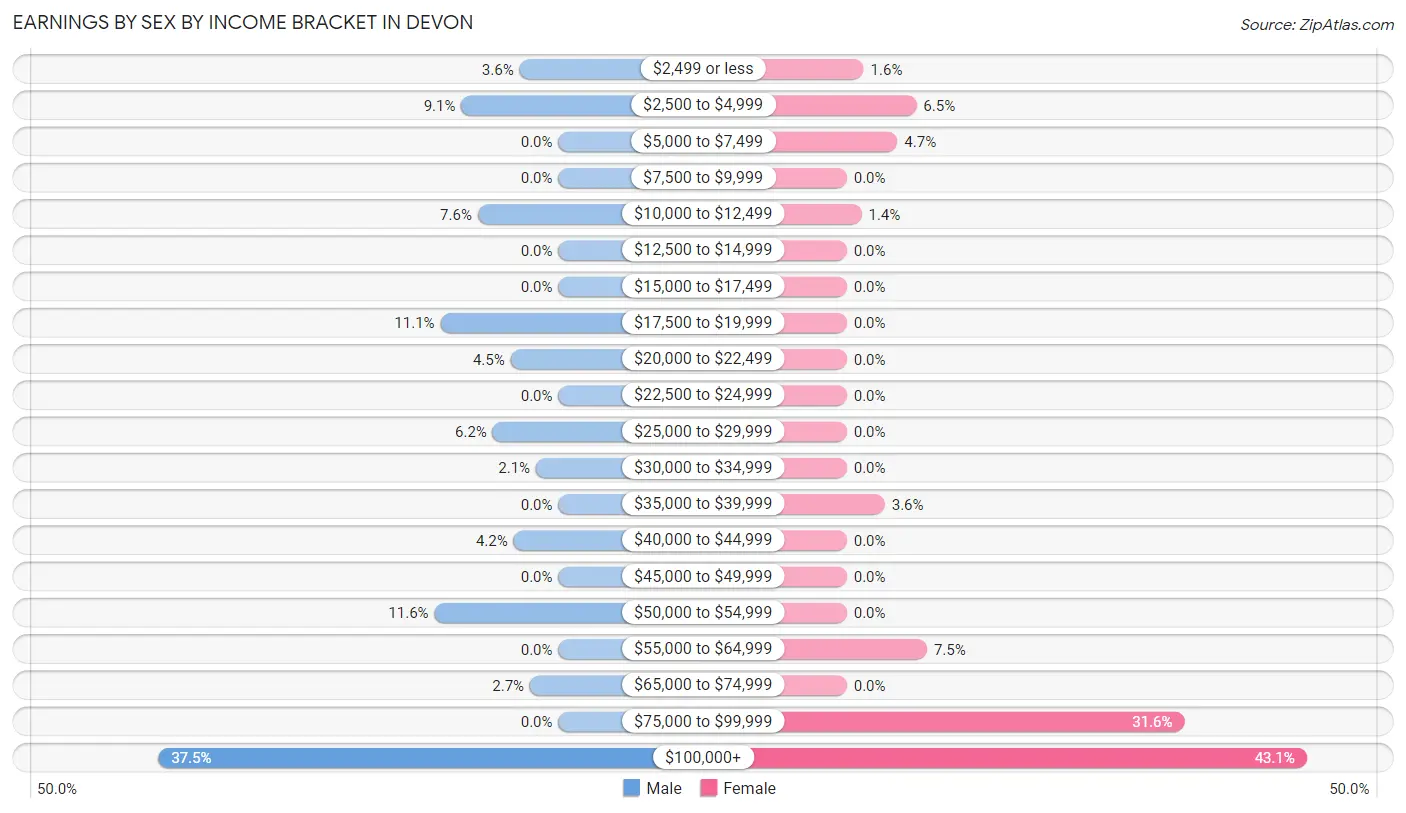
Earnings by Sex by Income Bracket in Devon
The most common earnings brackets in Devon are $100,000+ for men (268 | 37.5%) and $100,000+ for women (218 | 43.1%).
| Income | Male | Female |
| $2,499 or less | 26 (3.6%) | 8 (1.6%) |
| $2,500 to $4,999 | 65 (9.1%) | 33 (6.5%) |
| $5,000 to $7,499 | 0 (0.0%) | 24 (4.7%) |
| $7,500 to $9,999 | 0 (0.0%) | 0 (0.0%) |
| $10,000 to $12,499 | 54 (7.5%) | 7 (1.4%) |
| $12,500 to $14,999 | 0 (0.0%) | 0 (0.0%) |
| $15,000 to $17,499 | 0 (0.0%) | 0 (0.0%) |
| $17,500 to $19,999 | 79 (11.1%) | 0 (0.0%) |
| $20,000 to $22,499 | 32 (4.5%) | 0 (0.0%) |
| $22,500 to $24,999 | 0 (0.0%) | 0 (0.0%) |
| $25,000 to $29,999 | 44 (6.1%) | 0 (0.0%) |
| $30,000 to $34,999 | 15 (2.1%) | 0 (0.0%) |
| $35,000 to $39,999 | 0 (0.0%) | 18 (3.6%) |
| $40,000 to $44,999 | 30 (4.2%) | 0 (0.0%) |
| $45,000 to $49,999 | 0 (0.0%) | 0 (0.0%) |
| $50,000 to $54,999 | 83 (11.6%) | 0 (0.0%) |
| $55,000 to $64,999 | 0 (0.0%) | 38 (7.5%) |
| $65,000 to $74,999 | 19 (2.7%) | 0 (0.0%) |
| $75,000 to $99,999 | 0 (0.0%) | 160 (31.6%) |
| $100,000+ | 268 (37.5%) | 218 (43.1%) |
| Total | 715 (100.0%) | 506 (100.0%) |
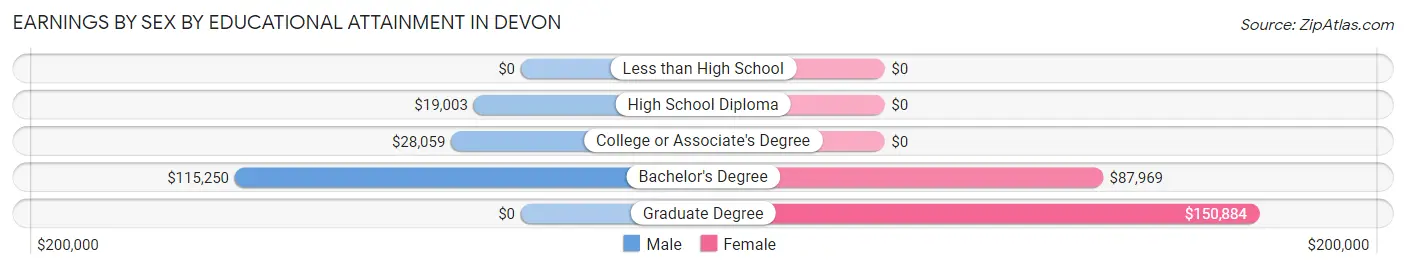
Earnings by Sex by Educational Attainment in Devon
| Educational Attainment | Male Income | Female Income |
| Less than High School | - | - |
| High School Diploma | $19,003 | $0 |
| College or Associate's Degree | $28,059 | $0 |
| Bachelor's Degree | $115,250 | $87,969 |
| Graduate Degree | - | - |
| Total | - | - |
Family Income in Devon
Family Income Brackets in Devon
According to the Devon family income data, there are 277 families falling into the $200,000+ income range, which is the most common income bracket and makes up 60.2% of all families.
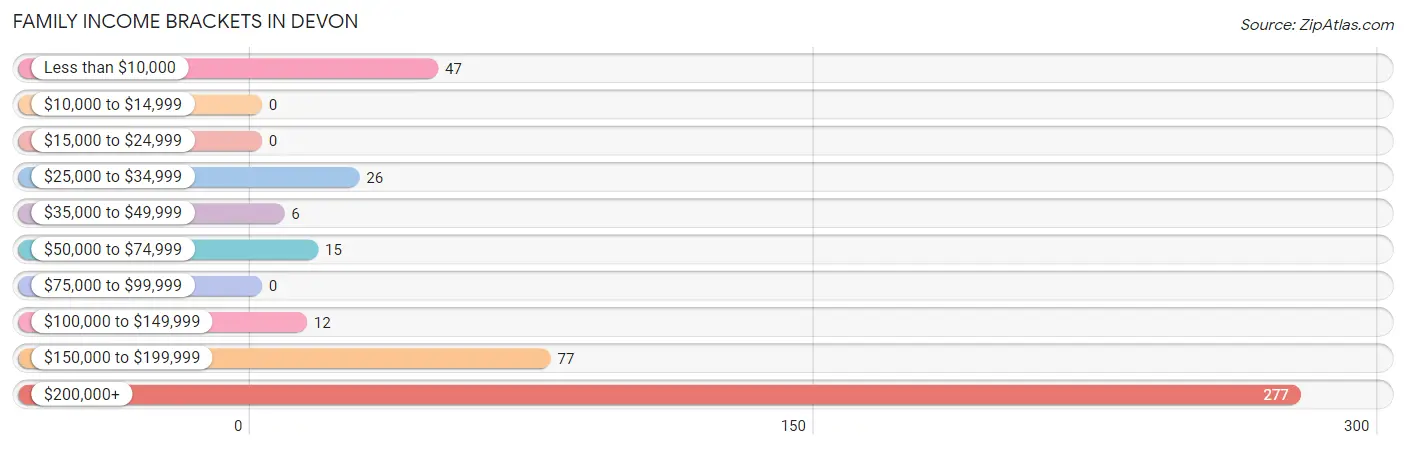
| Income Bracket | # Families | % Families |
| Less than $10,000 | 47 | 10.2% |
| $10,000 to $14,999 | 0 | 0.0% |
| $15,000 to $24,999 | 0 | 0.0% |
| $25,000 to $34,999 | 26 | 5.7% |
| $35,000 to $49,999 | 6 | 1.3% |
| $50,000 to $74,999 | 15 | 3.3% |
| $75,000 to $99,999 | 0 | 0.0% |
| $100,000 to $149,999 | 12 | 2.6% |
| $150,000 to $199,999 | 77 | 16.7% |
| $200,000+ | 277 | 60.2% |
Family Income by Famaliy Size in Devon
3-person families (111 | 24.1%) account for the highest median family income in Devon with $250,001 per family, while 3-person families (111 | 24.1%) have the highest median income of $83,334 per family member.
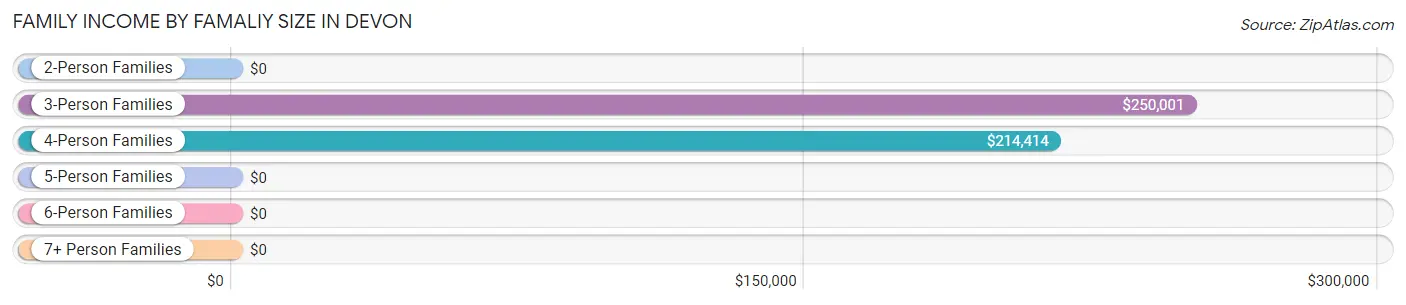
| Income Bracket | # Families | Median Income |
| 2-Person Families | 167 (36.3%) | $0 |
| 3-Person Families | 111 (24.1%) | $250,001 |
| 4-Person Families | 137 (29.8%) | $214,414 |
| 5-Person Families | 14 (3.0%) | $0 |
| 6-Person Families | 31 (6.7%) | $0 |
| 7+ Person Families | 0 (0.0%) | $0 |
| Total | 460 (100.0%) | $214,063 |
Family Income by Number of Earners in Devon
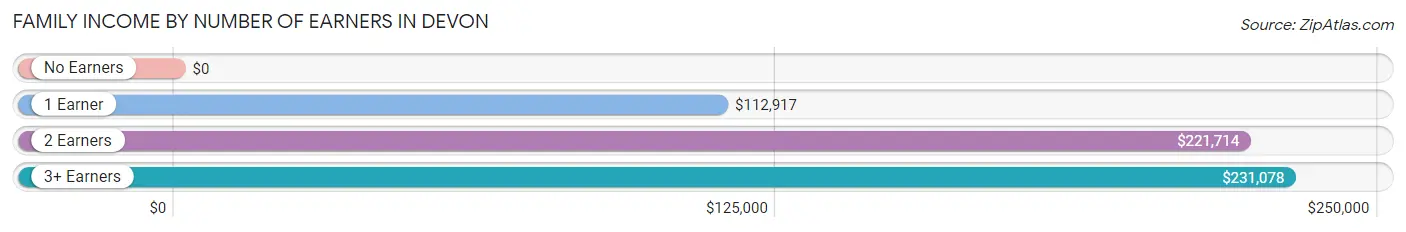
| Number of Earners | # Families | Median Income |
| No Earners | 47 (10.2%) | $0 |
| 1 Earner | 86 (18.7%) | $112,917 |
| 2 Earners | 214 (46.5%) | $221,714 |
| 3+ Earners | 113 (24.6%) | $231,078 |
| Total | 460 (100.0%) | $214,063 |
Household Income in Devon
Household Income Brackets in Devon
With 310 households falling in the category, the $200,000+ income range is the most frequent in Devon, accounting for 51.6% of all households.
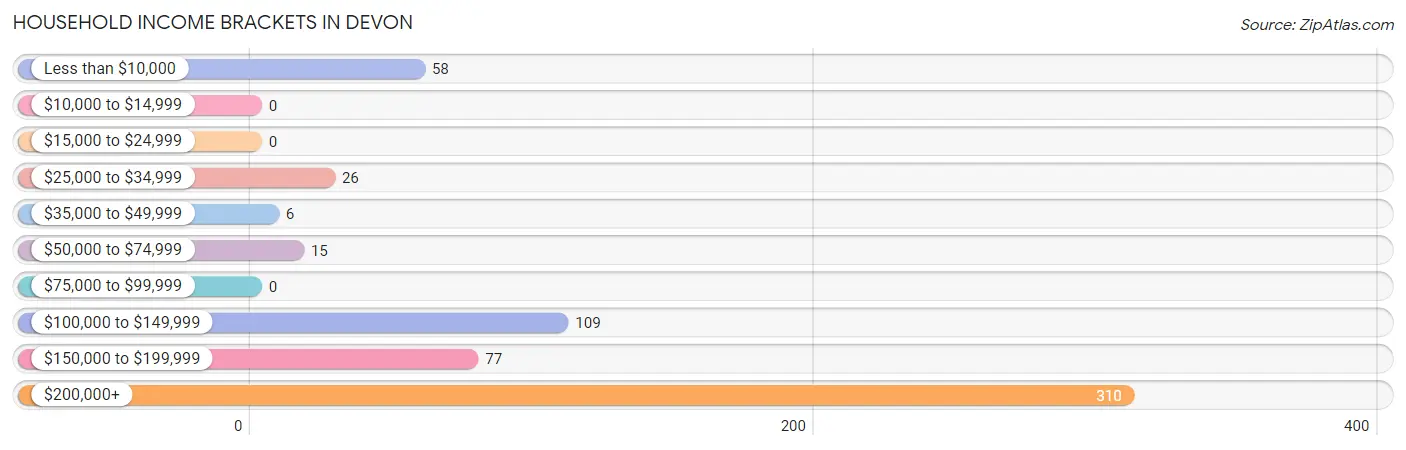
| Income Bracket | # Households | % Households |
| Less than $10,000 | 58 | 9.7% |
| $10,000 to $14,999 | 0 | 0.0% |
| $15,000 to $24,999 | 0 | 0.0% |
| $25,000 to $34,999 | 26 | 4.3% |
| $35,000 to $49,999 | 6 | 1.0% |
| $50,000 to $74,999 | 15 | 2.5% |
| $75,000 to $99,999 | 0 | 0.0% |
| $100,000 to $149,999 | 109 | 18.1% |
| $150,000 to $199,999 | 77 | 12.8% |
| $200,000+ | 310 | 51.6% |
Household Income by Householder Age in Devon
The median household income in Devon is $206,827, with the highest median household income of $214,414 found in the 25 to 44 years age bracket for the primary householder. A total of 85 households (14.1%) fall into this category.
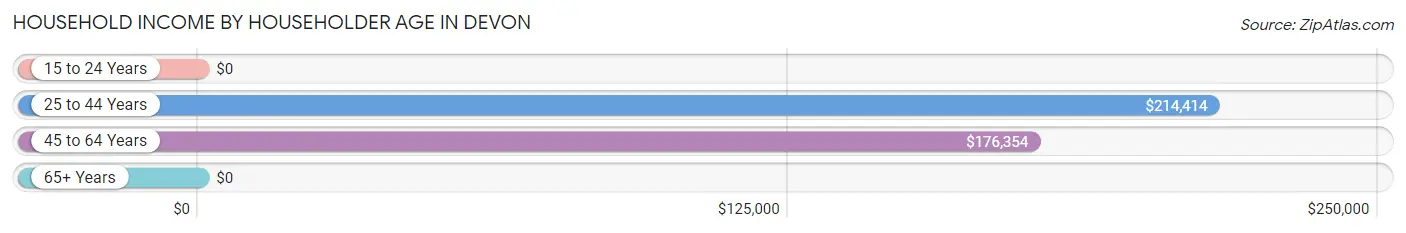
| Income Bracket | # Households | Median Income |
| 15 to 24 Years | 0 (0.0%) | $0 |
| 25 to 44 Years | 85 (14.1%) | $214,414 |
| 45 to 64 Years | 442 (73.5%) | $176,354 |
| 65+ Years | 74 (12.3%) | $0 |
| Total | 601 (100.0%) | $206,827 |
Poverty in Devon
Income Below Poverty by Sex and Age in Devon
With 12.0% poverty level for males and 8.5% for females among the residents of Devon, 35 to 44 year old males and 25 to 34 year old females are the most vulnerable to poverty, with 72 males (69.2%) and 18 females (24.7%) in their respective age groups living below the poverty level.
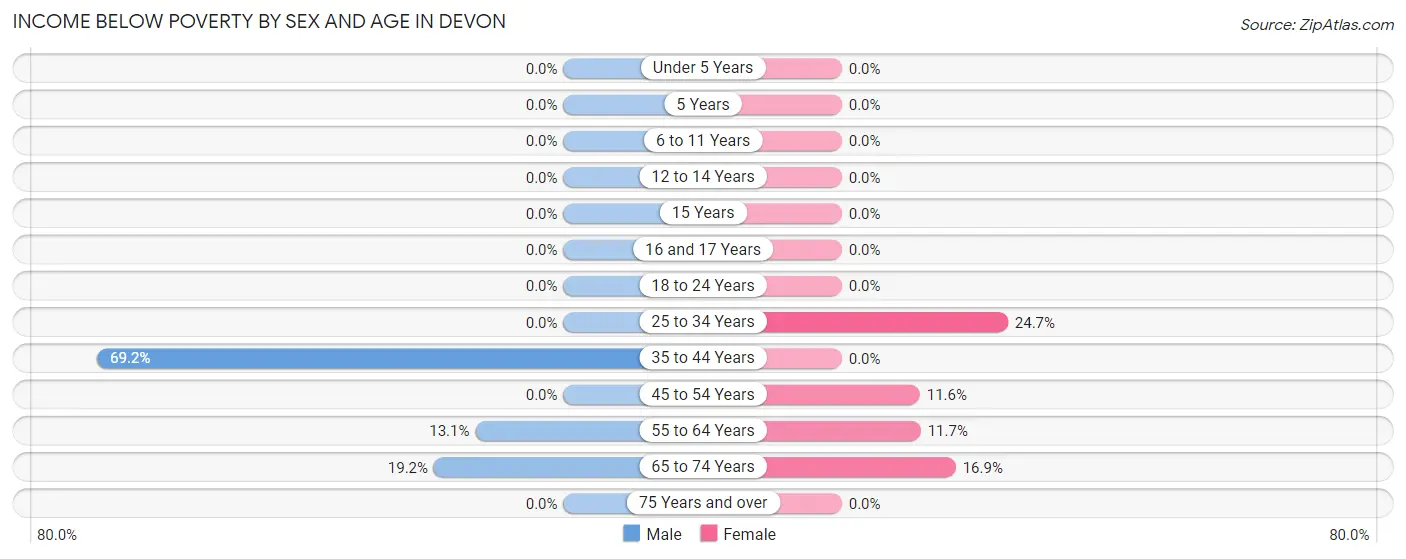
| Age Bracket | Male | Female |
| Under 5 Years | 0 (0.0%) | 0 (0.0%) |
| 5 Years | 0 (0.0%) | 0 (0.0%) |
| 6 to 11 Years | 0 (0.0%) | 0 (0.0%) |
| 12 to 14 Years | 0 (0.0%) | 0 (0.0%) |
| 15 Years | 0 (0.0%) | 0 (0.0%) |
| 16 and 17 Years | 0 (0.0%) | 0 (0.0%) |
| 18 to 24 Years | 0 (0.0%) | 0 (0.0%) |
| 25 to 34 Years | 0 (0.0%) | 18 (24.7%) |
| 35 to 44 Years | 72 (69.2%) | 0 (0.0%) |
| 45 to 54 Years | 0 (0.0%) | 30 (11.6%) |
| 55 to 64 Years | 31 (13.1%) | 17 (11.7%) |
| 65 to 74 Years | 15 (19.2%) | 11 (16.9%) |
| 75 Years and over | 0 (0.0%) | 0 (0.0%) |
| Total | 118 (12.0%) | 76 (8.5%) |
Income Above Poverty by Sex and Age in Devon
According to the poverty statistics in Devon, males aged under 5 years and females aged 5 years are the age groups that are most secure financially, with 100.0% of males and 100.0% of females in these age groups living above the poverty line.
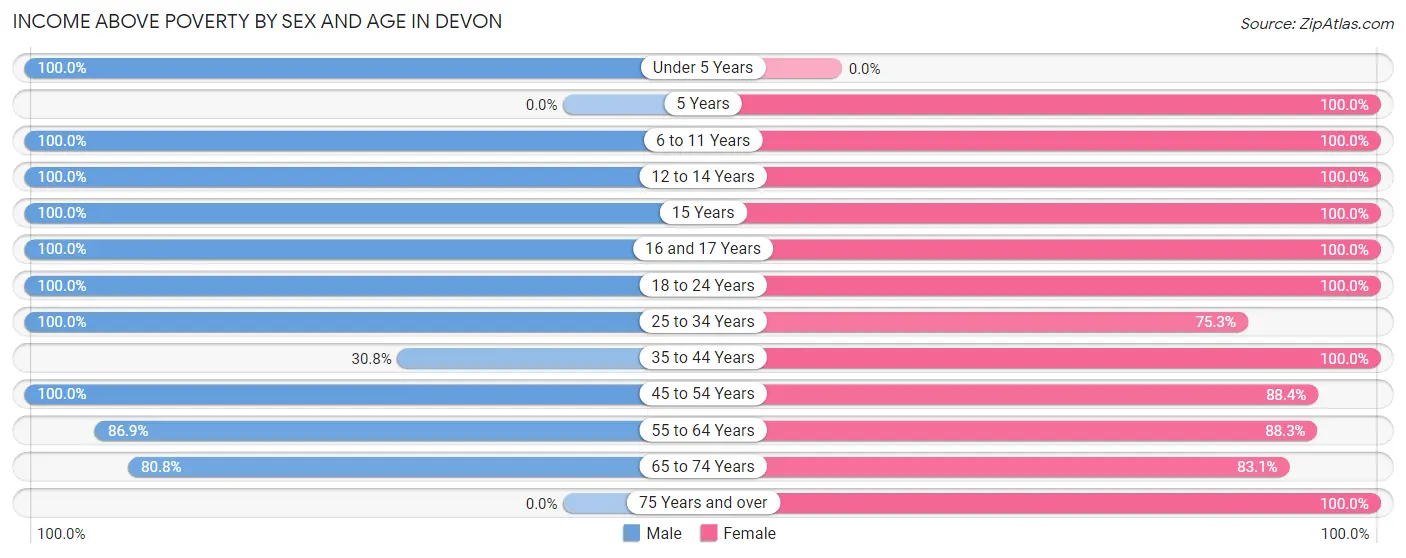
| Age Bracket | Male | Female |
| Under 5 Years | 60 (100.0%) | 0 (0.0%) |
| 5 Years | 0 (0.0%) | 32 (100.0%) |
| 6 to 11 Years | 62 (100.0%) | 13 (100.0%) |
| 12 to 14 Years | 4 (100.0%) | 73 (100.0%) |
| 15 Years | 7 (100.0%) | 61 (100.0%) |
| 16 and 17 Years | 77 (100.0%) | 33 (100.0%) |
| 18 to 24 Years | 56 (100.0%) | 37 (100.0%) |
| 25 to 34 Years | 158 (100.0%) | 55 (75.3%) |
| 35 to 44 Years | 32 (30.8%) | 73 (100.0%) |
| 45 to 54 Years | 143 (100.0%) | 229 (88.4%) |
| 55 to 64 Years | 206 (86.9%) | 128 (88.3%) |
| 65 to 74 Years | 63 (80.8%) | 54 (83.1%) |
| 75 Years and over | 0 (0.0%) | 29 (100.0%) |
| Total | 868 (88.0%) | 817 (91.5%) |
Income Below Poverty Among Married-Couple Families in Devon
The poverty statistics for married-couple families in Devon show that 11.6% or 47 of the total 406 families live below the poverty line. Families with no children have the highest poverty rate of 26.3%, comprising of 47 families. On the other hand, families with 1 or 2 children have the lowest poverty rate of 0.0%, which includes 0 families.
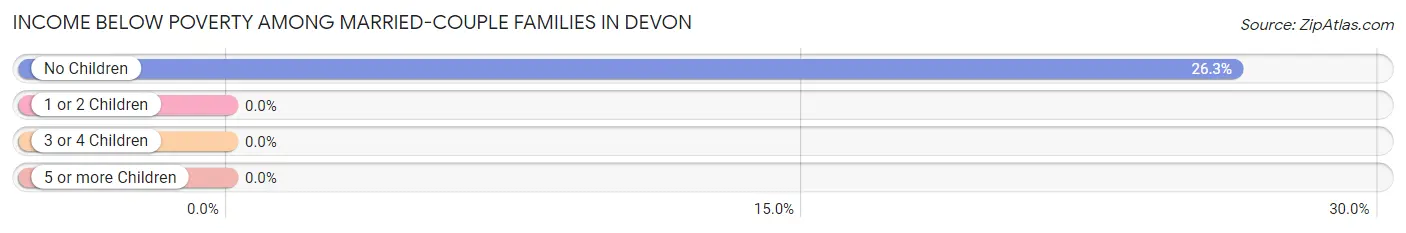
| Children | Above Poverty | Below Poverty |
| No Children | 132 (73.7%) | 47 (26.3%) |
| 1 or 2 Children | 182 (100.0%) | 0 (0.0%) |
| 3 or 4 Children | 45 (100.0%) | 0 (0.0%) |
| 5 or more Children | 0 (0.0%) | 0 (0.0%) |
| Total | 359 (88.4%) | 47 (11.6%) |
Income Below Poverty Among Single-Parent Households in Devon
| Children | Single Father | Single Mother |
| No Children | 0 (0.0%) | 0 (0.0%) |
| 1 or 2 Children | 0 (0.0%) | 0 (0.0%) |
| 3 or 4 Children | 0 (0.0%) | 0 (0.0%) |
| 5 or more Children | 0 (0.0%) | 0 (0.0%) |
| Total | 0 (0.0%) | 0 (0.0%) |
Income Below Poverty Among Married-Couple vs Single-Parent Households in Devon
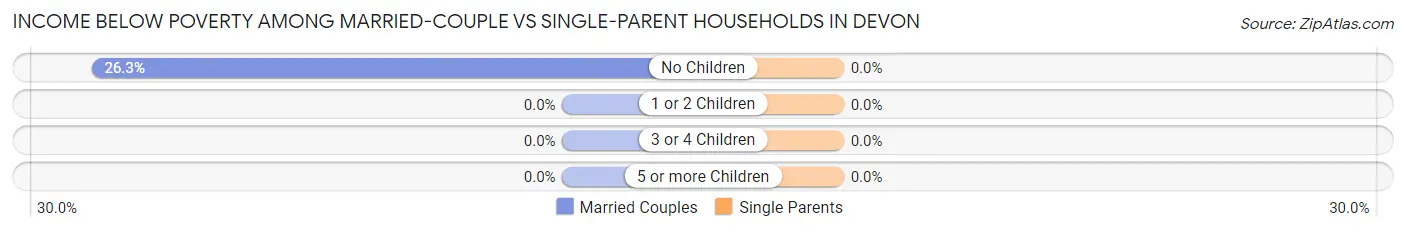
| Children | Married-Couple Families | Single-Parent Households |
| No Children | 47 (26.3%) | 0 (0.0%) |
| 1 or 2 Children | 0 (0.0%) | 0 (0.0%) |
| 3 or 4 Children | 0 (0.0%) | 0 (0.0%) |
| 5 or more Children | 0 (0.0%) | 0 (0.0%) |
| Total | 47 (11.6%) | 0 (0.0%) |
Race in Devon
The most populous races in Devon are White / Caucasian (1,649 | 87.3%), Hispanic or Latino (171 | 9.0%), and Two or more Races (112 | 5.9%).
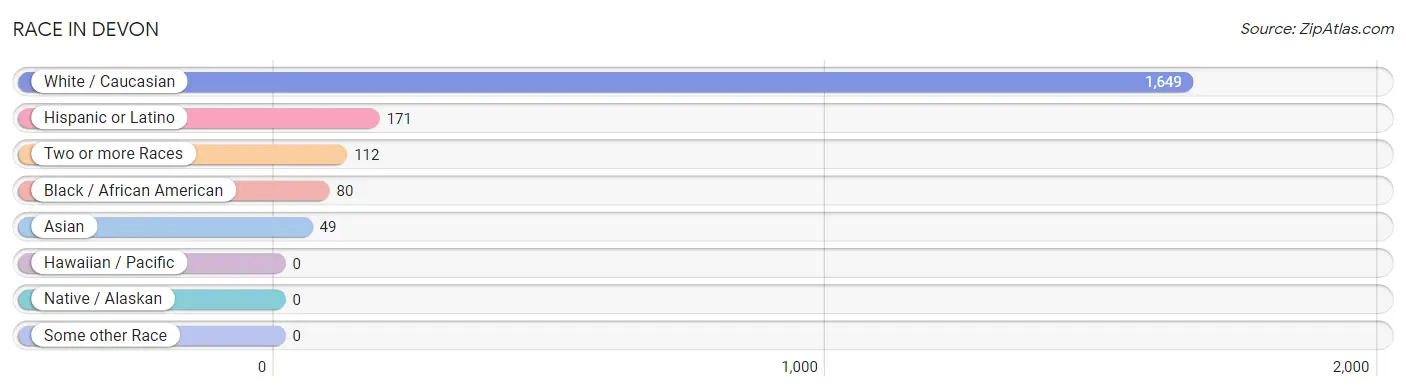
| Race | # Population | % Population |
| Asian | 49 | 2.6% |
| Black / African American | 80 | 4.2% |
| Hawaiian / Pacific | 0 | 0.0% |
| Hispanic or Latino | 171 | 9.0% |
| Native / Alaskan | 0 | 0.0% |
| White / Caucasian | 1,649 | 87.3% |
| Two or more Races | 112 | 5.9% |
| Some other Race | 0 | 0.0% |
| Total | 1,890 | 100.0% |
Ancestry in Devon
The most populous ancestries reported in Devon are Irish (557 | 29.5%), German (311 | 16.5%), Italian (281 | 14.9%), English (187 | 9.9%), and French (133 | 7.0%), together accounting for 77.7% of all Devon residents.
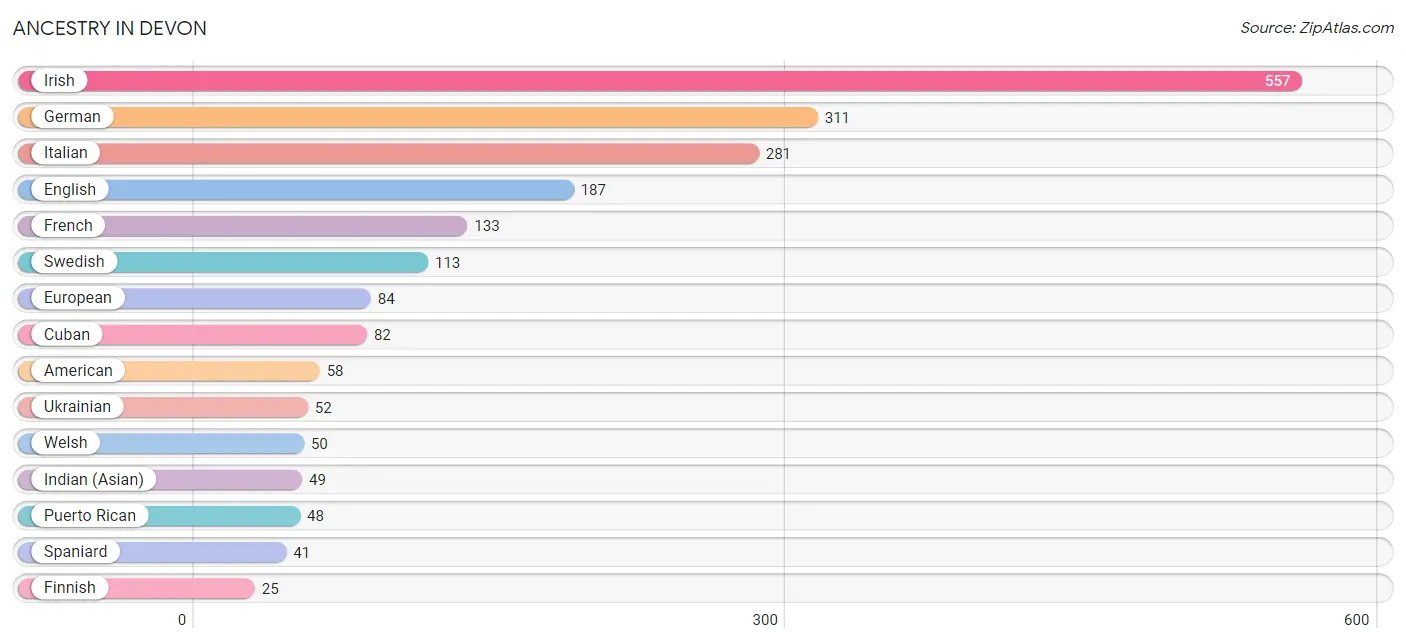
| Ancestry | # Population | % Population |
| American | 58 | 3.1% |
| Cuban | 82 | 4.3% |
| Dutch | 14 | 0.7% |
| Eastern European | 14 | 0.7% |
| English | 187 | 9.9% |
| European | 84 | 4.4% |
| Finnish | 25 | 1.3% |
| French | 133 | 7.0% |
| German | 311 | 16.5% |
| Indian (Asian) | 49 | 2.6% |
| Irish | 557 | 29.5% |
| Italian | 281 | 14.9% |
| Latvian | 14 | 0.7% |
| Polish | 18 | 0.9% |
| Puerto Rican | 48 | 2.5% |
| Russian | 14 | 0.7% |
| Spaniard | 41 | 2.2% |
| Swedish | 113 | 6.0% |
| Swiss | 25 | 1.3% |
| Ukrainian | 52 | 2.8% |
| Welsh | 50 | 2.6% | View All 21 Rows |
Immigrants in Devon
The most numerous immigrant groups reported in Devon came from England (35 | 1.8%), Europe (35 | 1.8%), Northern Europe (35 | 1.8%), Caribbean (34 | 1.8%), and Cuba (34 | 1.8%), together accounting for 9.1% of all Devon residents.
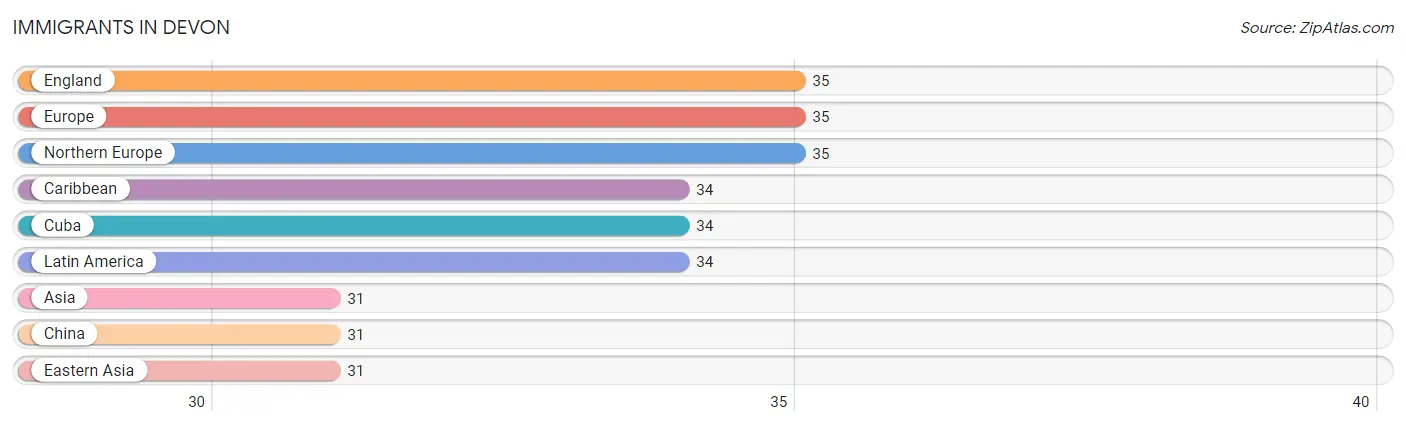
| Immigration Origin | # Population | % Population |
| Asia | 31 | 1.6% |
| Caribbean | 34 | 1.8% |
| China | 31 | 1.6% |
| Cuba | 34 | 1.8% |
| Eastern Asia | 31 | 1.6% |
| England | 35 | 1.8% |
| Europe | 35 | 1.8% |
| Latin America | 34 | 1.8% |
| Northern Europe | 35 | 1.8% | View All 9 Rows |
Sex and Age in Devon
Sex and Age in Devon
The most populous age groups in Devon are 55 to 59 Years (193 | 19.4%) for men and 50 to 54 Years (223 | 25.0%) for women.
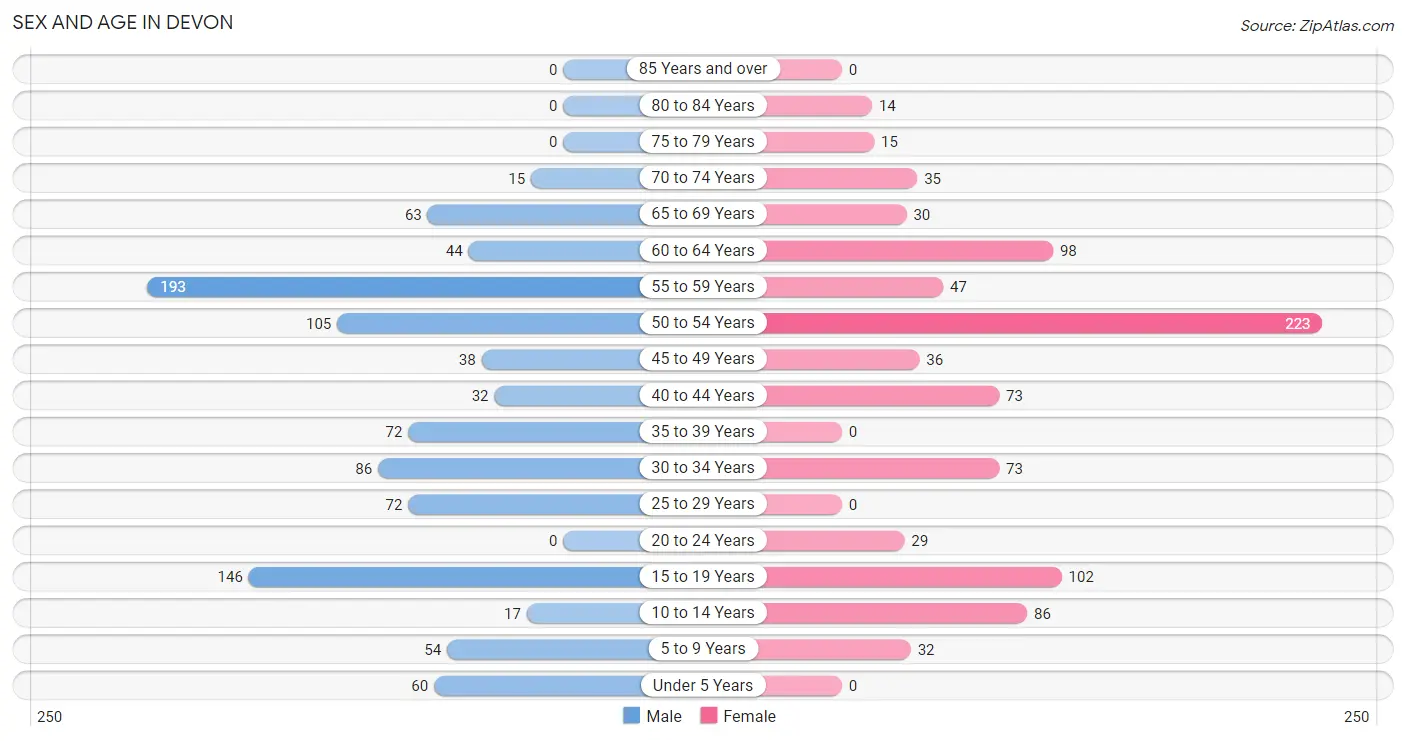
| Age Bracket | Male | Female |
| Under 5 Years | 60 (6.0%) | 0 (0.0%) |
| 5 to 9 Years | 54 (5.4%) | 32 (3.6%) |
| 10 to 14 Years | 17 (1.7%) | 86 (9.6%) |
| 15 to 19 Years | 146 (14.6%) | 102 (11.4%) |
| 20 to 24 Years | 0 (0.0%) | 29 (3.3%) |
| 25 to 29 Years | 72 (7.2%) | 0 (0.0%) |
| 30 to 34 Years | 86 (8.6%) | 73 (8.2%) |
| 35 to 39 Years | 72 (7.2%) | 0 (0.0%) |
| 40 to 44 Years | 32 (3.2%) | 73 (8.2%) |
| 45 to 49 Years | 38 (3.8%) | 36 (4.0%) |
| 50 to 54 Years | 105 (10.5%) | 223 (25.0%) |
| 55 to 59 Years | 193 (19.4%) | 47 (5.3%) |
| 60 to 64 Years | 44 (4.4%) | 98 (11.0%) |
| 65 to 69 Years | 63 (6.3%) | 30 (3.4%) |
| 70 to 74 Years | 15 (1.5%) | 35 (3.9%) |
| 75 to 79 Years | 0 (0.0%) | 15 (1.7%) |
| 80 to 84 Years | 0 (0.0%) | 14 (1.6%) |
| 85 Years and over | 0 (0.0%) | 0 (0.0%) |
| Total | 997 (100.0%) | 893 (100.0%) |
Families and Households in Devon
Median Family Size in Devon
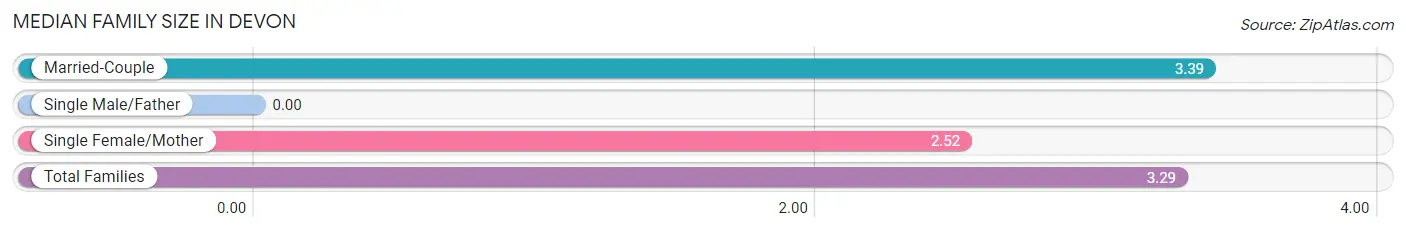
| Family Type | # Families | Family Size |
| Married-Couple | 406 (88.3%) | 3.39 |
| Single Male/Father | 0 (0.0%) | - |
| Single Female/Mother | 54 (11.7%) | 2.52 |
| Total Families | 460 (100.0%) | 3.29 |
Median Household Size in Devon
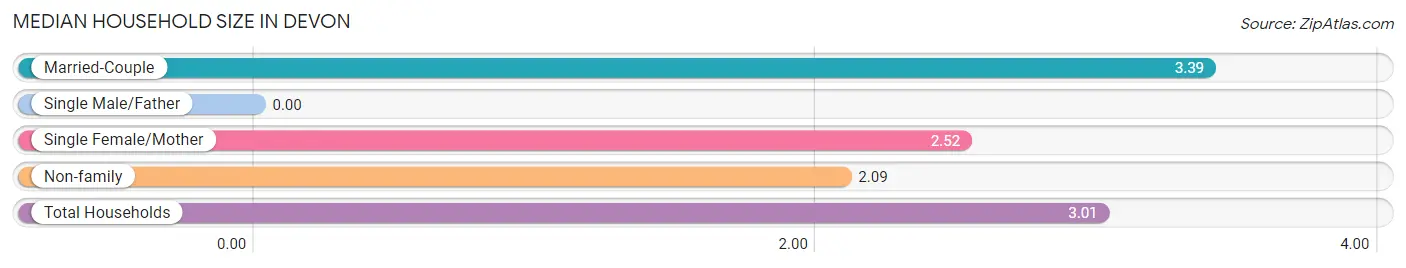
| Household Type | # Households | Household Size |
| Married-Couple | 406 (67.5%) | 3.39 |
| Single Male/Father | 0 (0.0%) | - |
| Single Female/Mother | 54 (9.0%) | 2.52 |
| Non-family | 141 (23.5%) | 2.09 |
| Total Households | 601 (100.0%) | 3.01 |
Household Size by Marriage Status in Devon
Out of a total of 601 households in Devon, 460 (76.5%) are family households, while 141 (23.5%) are nonfamily households. The most numerous type of family households are 2-person households, comprising 167, and the most common type of nonfamily households are 2-person households, comprising 130.
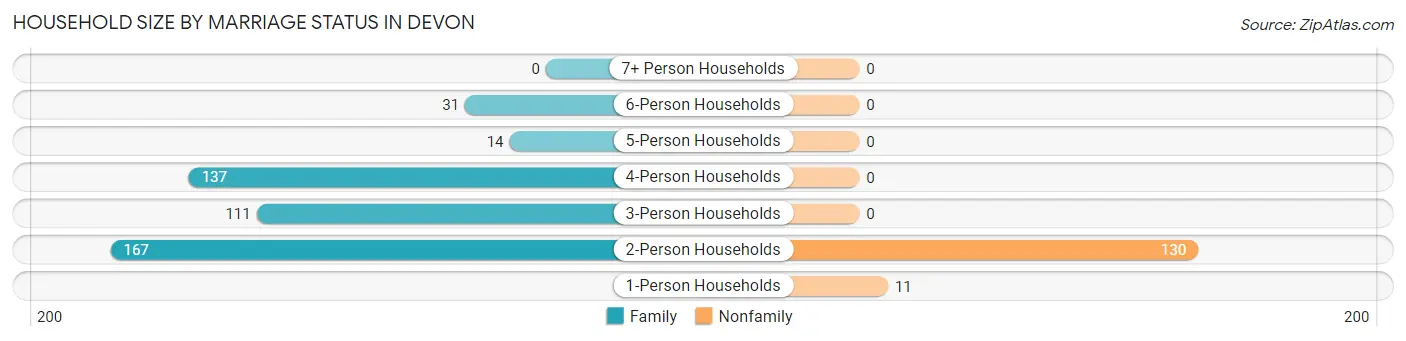
| Household Size | Family Households | Nonfamily Households |
| 1-Person Households | - | 11 (1.8%) |
| 2-Person Households | 167 (27.8%) | 130 (21.6%) |
| 3-Person Households | 111 (18.5%) | 0 (0.0%) |
| 4-Person Households | 137 (22.8%) | 0 (0.0%) |
| 5-Person Households | 14 (2.3%) | 0 (0.0%) |
| 6-Person Households | 31 (5.2%) | 0 (0.0%) |
| 7+ Person Households | 0 (0.0%) | 0 (0.0%) |
| Total | 460 (76.5%) | 141 (23.5%) |
Female Fertility in Devon
Fertility by Age in Devon
Average fertility rate in Devon is 89.0 births per 1,000 women. Women in the age bracket of 20 to 34 years have the highest fertility rate with 343.0 births per 1,000 women. Women in the age bracket of 20 to 34 years acount for 100.0% of all women with births.
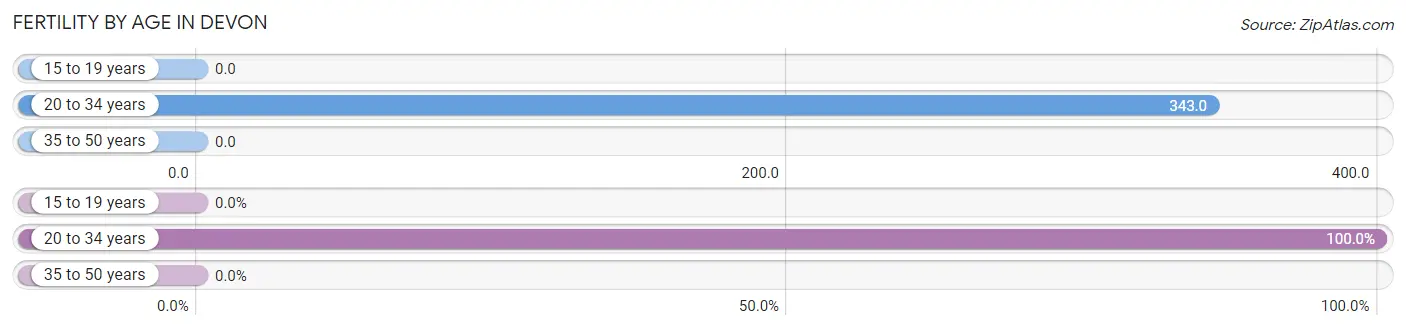
| Age Bracket | Women with Births | Births / 1,000 Women |
| 15 to 19 years | 0 (0.0%) | 0.0 |
| 20 to 34 years | 35 (100.0%) | 343.0 |
| 35 to 50 years | 0 (0.0%) | 0.0 |
| Total | 35 (100.0%) | 89.0 |
Fertility by Age by Marriage Status in Devon
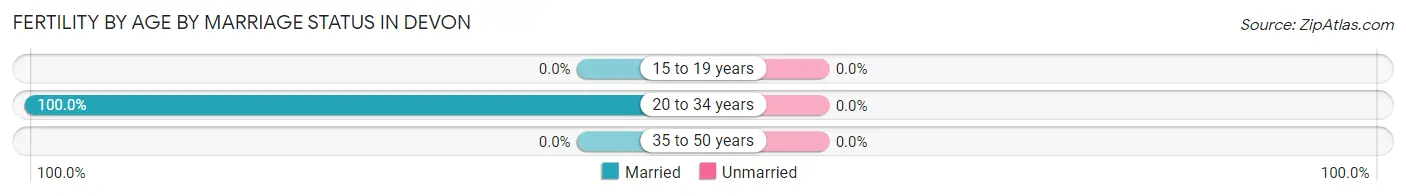
| Age Bracket | Married | Unmarried |
| 15 to 19 years | 0 (0.0%) | 0 (0.0%) |
| 20 to 34 years | 35 (100.0%) | 0 (0.0%) |
| 35 to 50 years | 0 (0.0%) | 0 (0.0%) |
| Total | 35 (100.0%) | 0 (0.0%) |
Fertility by Education in Devon
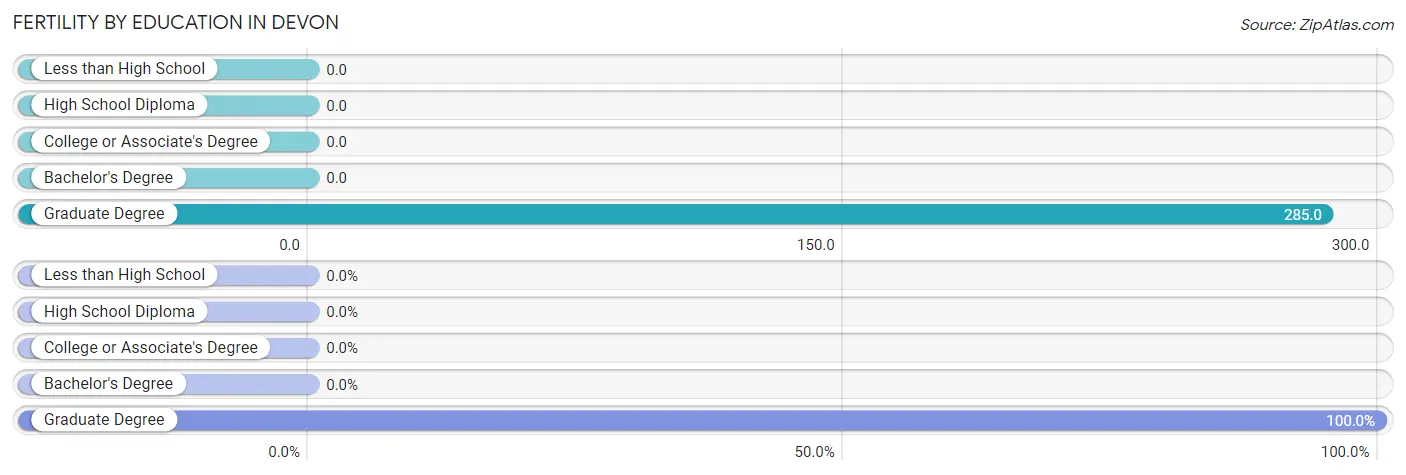
| Educational Attainment | Women with Births | Births / 1,000 Women |
| Less than High School | 0 (0.0%) | 0.0 |
| High School Diploma | 0 (0.0%) | 0.0 |
| College or Associate's Degree | 0 (0.0%) | 0.0 |
| Bachelor's Degree | 0 (0.0%) | 0.0 |
| Graduate Degree | 35 (100.0%) | 285.0 |
| Total | 35 (100.0%) | 89.0 |
Fertility by Education by Marriage Status in Devon
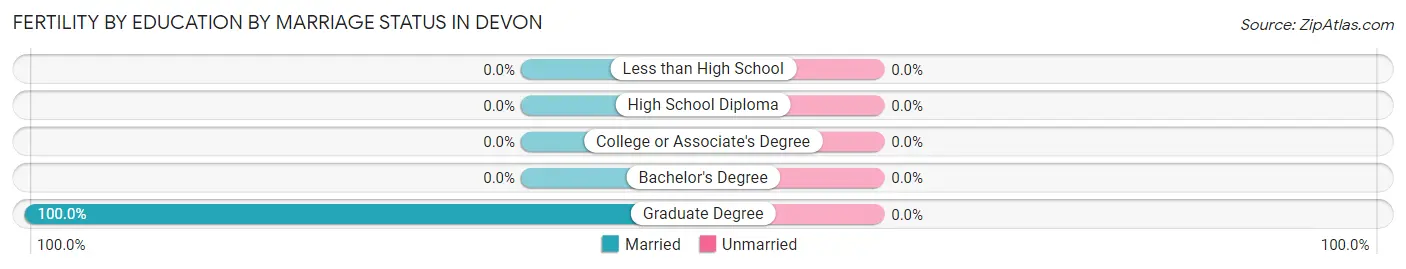
| Educational Attainment | Married | Unmarried |
| Less than High School | 0 (0.0%) | 0 (0.0%) |
| High School Diploma | 0 (0.0%) | 0 (0.0%) |
| College or Associate's Degree | 0 (0.0%) | 0 (0.0%) |
| Bachelor's Degree | 0 (0.0%) | 0 (0.0%) |
| Graduate Degree | 35 (100.0%) | 0 (0.0%) |
| Total | 35 (100.0%) | 0 (0.0%) |
Employment Characteristics in Devon
Employment by Class of Employer in Devon
Among the 1,089 employed individuals in Devon, private company employees (696 | 63.9%), not-for-profit organizations (144 | 13.2%), and local government employees (110 | 10.1%) make up the most common classes of employment.
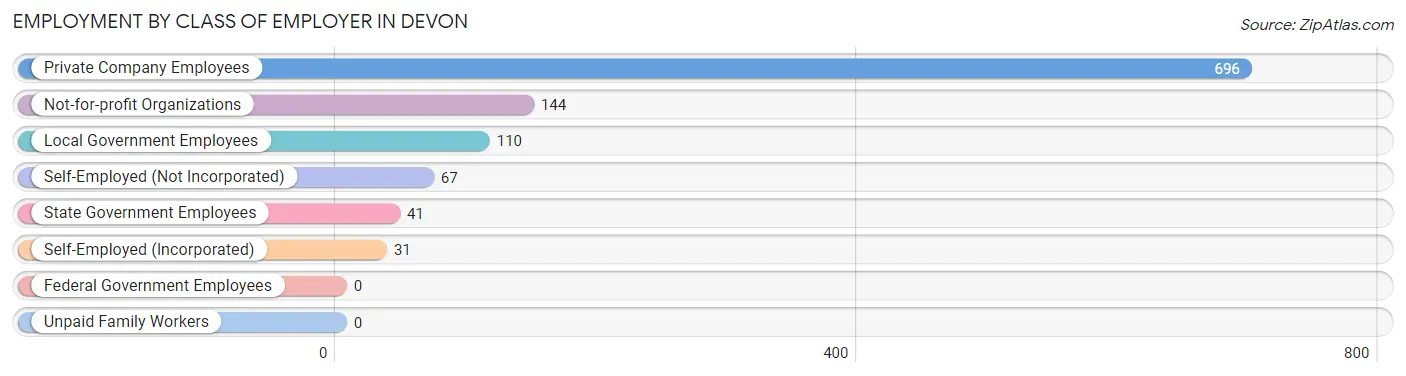
| Employer Class | # Employees | % Employees |
| Private Company Employees | 696 | 63.9% |
| Self-Employed (Incorporated) | 31 | 2.9% |
| Self-Employed (Not Incorporated) | 67 | 6.1% |
| Not-for-profit Organizations | 144 | 13.2% |
| Local Government Employees | 110 | 10.1% |
| State Government Employees | 41 | 3.8% |
| Federal Government Employees | 0 | 0.0% |
| Unpaid Family Workers | 0 | 0.0% |
| Total | 1,089 | 100.0% |
Employment Status by Age in Devon
According to the labor force statistics for Devon, out of the total population over 16 years of age (1,571), 77.0% or 1,210 individuals are in the labor force, with 3.4% or 41 of them unemployed. The age group with the highest labor force participation rate is 20 to 24 years, with 100.0% or 29 individuals in the labor force. Within the labor force, the 65 to 74 years age range has the highest percentage of unemployed individuals, with 18.3% or 11 of them being unemployed.
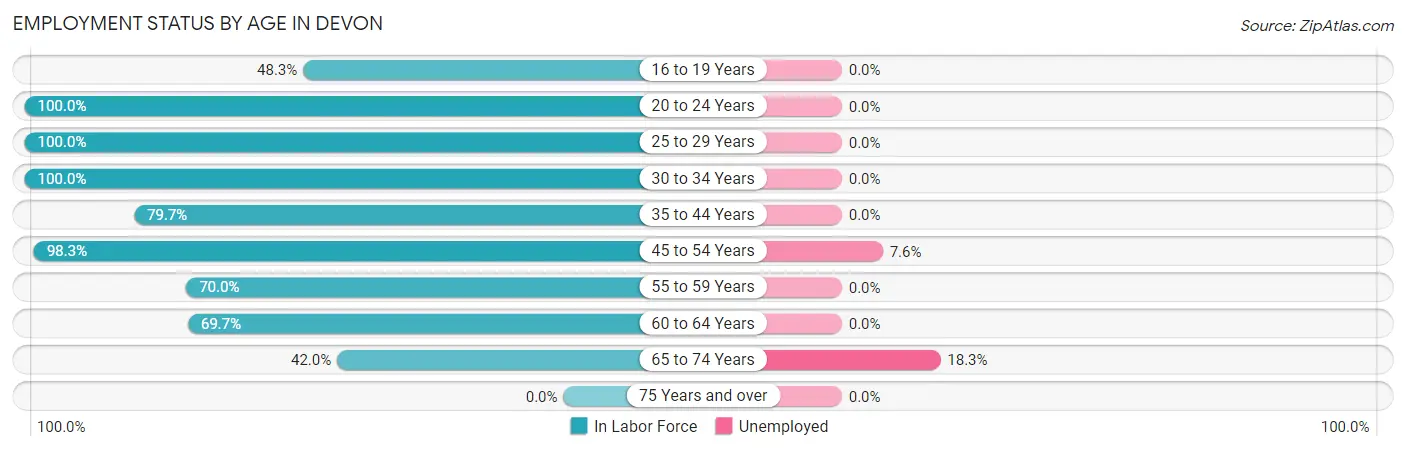
| Age Bracket | In Labor Force | Unemployed |
| 16 to 19 Years | 86 (48.3%) | 0 (0.0%) |
| 20 to 24 Years | 29 (100.0%) | 0 (0.0%) |
| 25 to 29 Years | 72 (100.0%) | 0 (0.0%) |
| 30 to 34 Years | 159 (100.0%) | 0 (0.0%) |
| 35 to 44 Years | 141 (79.7%) | 0 (0.0%) |
| 45 to 54 Years | 395 (98.3%) | 30 (7.6%) |
| 55 to 59 Years | 168 (70.0%) | 0 (0.0%) |
| 60 to 64 Years | 99 (69.7%) | 0 (0.0%) |
| 65 to 74 Years | 60 (42.0%) | 11 (18.3%) |
| 75 Years and over | 0 (0.0%) | 0 (0.0%) |
| Total | 1,210 (77.0%) | 41 (3.4%) |
Employment Status by Educational Attainment in Devon
According to labor force statistics for Devon, 86.7% of individuals (1,033) out of the total population between 25 and 64 years of age (1,192) are in the labor force, with 2.9% or 30 of them being unemployed. The group with the highest labor force participation rate are those with the educational attainment of high school diploma, with 100.0% or 131 individuals in the labor force. Within the labor force, individuals with bachelor's degree or higher education have the highest percentage of unemployment, with 3.6% or 30 of them being unemployed.
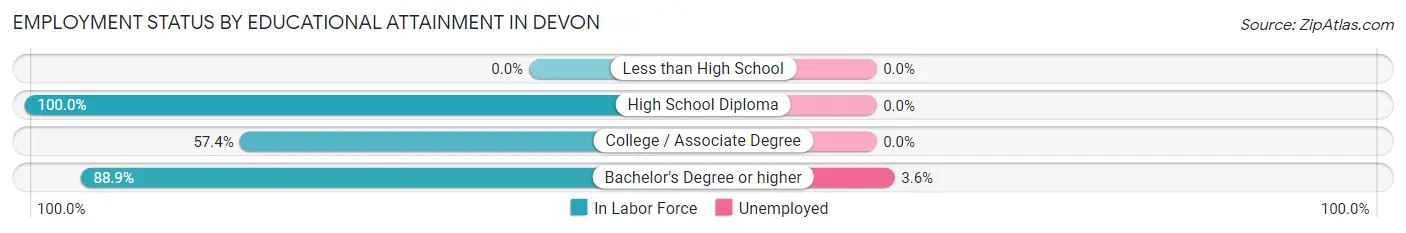
| Educational Attainment | In Labor Force | Unemployed |
| Less than High School | 0 (0.0%) | 0 (0.0%) |
| High School Diploma | 131 (100.0%) | 0 (0.0%) |
| College / Associate Degree | 74 (57.4%) | 0 (0.0%) |
| Bachelor's Degree or higher | 829 (88.9%) | 34 (3.6%) |
| Total | 1,033 (86.7%) | 35 (2.9%) |
Employment Occupations by Sex in Devon
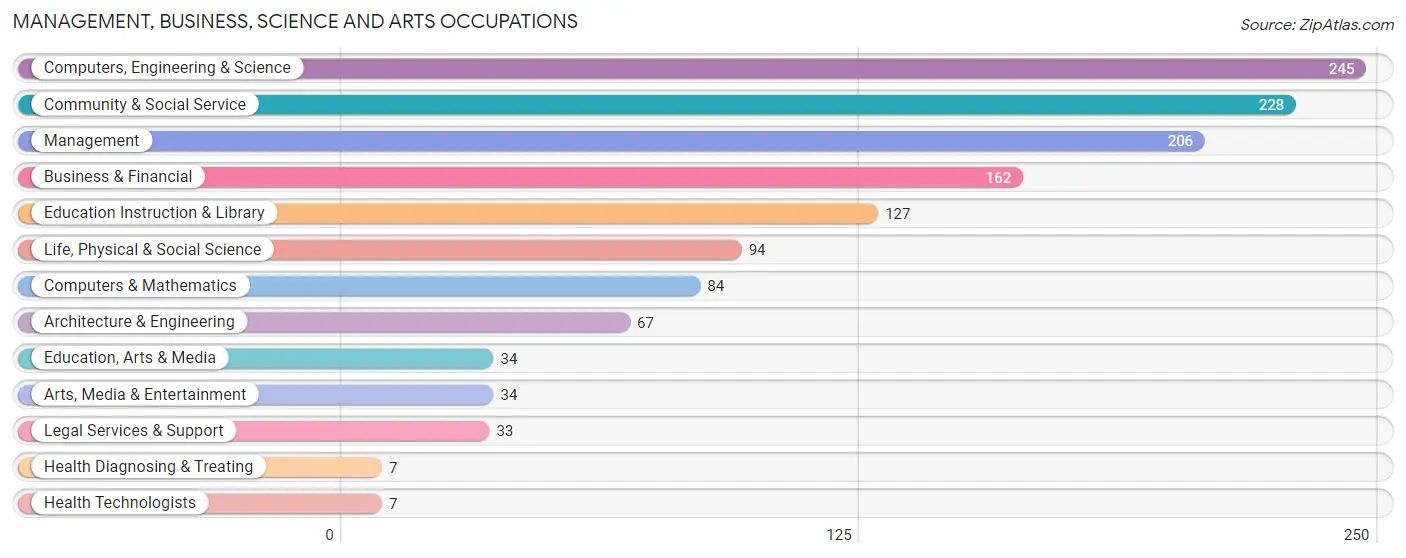
Management, Business, Science and Arts Occupations
The most common Management, Business, Science and Arts occupations in Devon are Computers, Engineering & Science (245 | 21.0%), Community & Social Service (228 | 19.5%), Management (206 | 17.6%), Business & Financial (162 | 13.9%), and Education Instruction & Library (127 | 10.9%).
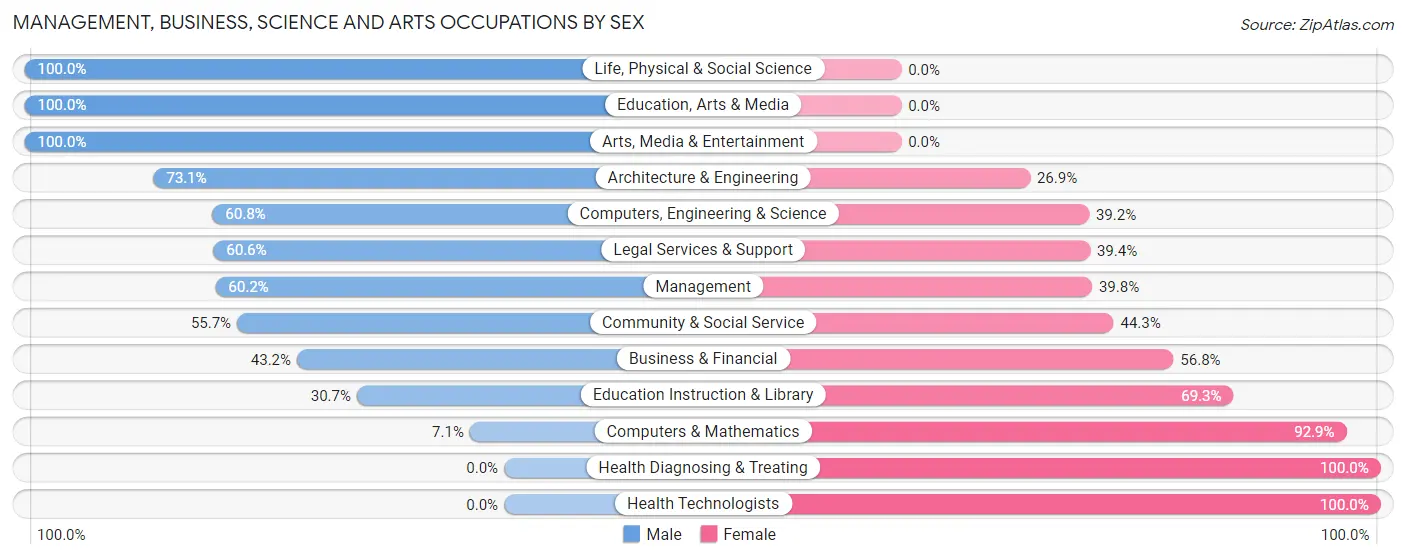
Management, Business, Science and Arts Occupations by Sex
Within the Management, Business, Science and Arts occupations in Devon, the most male-oriented occupations are Life, Physical & Social Science (100.0%), Education, Arts & Media (100.0%), and Arts, Media & Entertainment (100.0%), while the most female-oriented occupations are Health Diagnosing & Treating (100.0%), Health Technologists (100.0%), and Computers & Mathematics (92.9%).
| Occupation | Male | Female |
| Management | 124 (60.2%) | 82 (39.8%) |
| Business & Financial | 70 (43.2%) | 92 (56.8%) |
| Computers, Engineering & Science | 149 (60.8%) | 96 (39.2%) |
| Computers & Mathematics | 6 (7.1%) | 78 (92.9%) |
| Architecture & Engineering | 49 (73.1%) | 18 (26.9%) |
| Life, Physical & Social Science | 94 (100.0%) | 0 (0.0%) |
| Community & Social Service | 127 (55.7%) | 101 (44.3%) |
| Education, Arts & Media | 34 (100.0%) | 0 (0.0%) |
| Legal Services & Support | 20 (60.6%) | 13 (39.4%) |
| Education Instruction & Library | 39 (30.7%) | 88 (69.3%) |
| Arts, Media & Entertainment | 34 (100.0%) | 0 (0.0%) |
| Health Diagnosing & Treating | 0 (0.0%) | 7 (100.0%) |
| Health Technologists | 0 (0.0%) | 7 (100.0%) |
| Total (Category) | 470 (55.4%) | 378 (44.6%) |
| Total (Overall) | 669 (57.3%) | 499 (42.7%) |
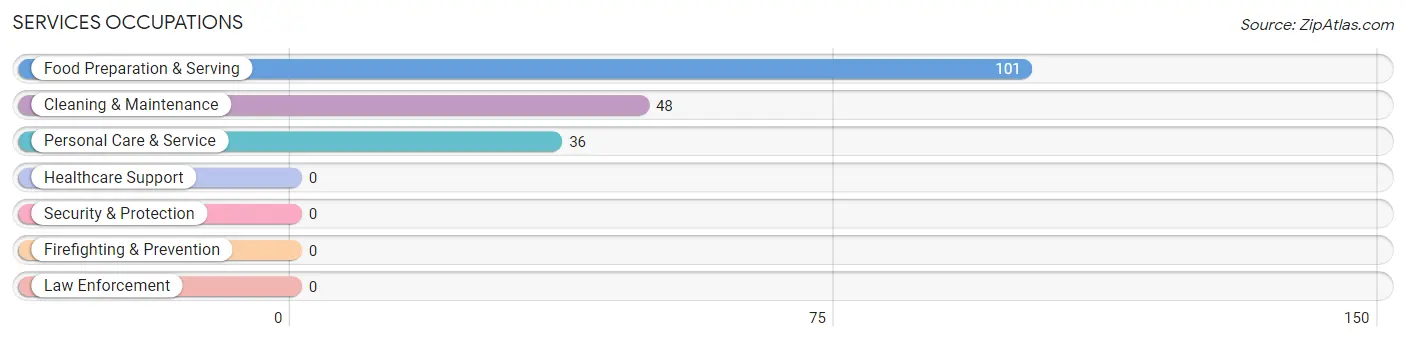
Services Occupations
The most common Services occupations in Devon are Food Preparation & Serving (101 | 8.6%), Cleaning & Maintenance (48 | 4.1%), and Personal Care & Service (36 | 3.1%).
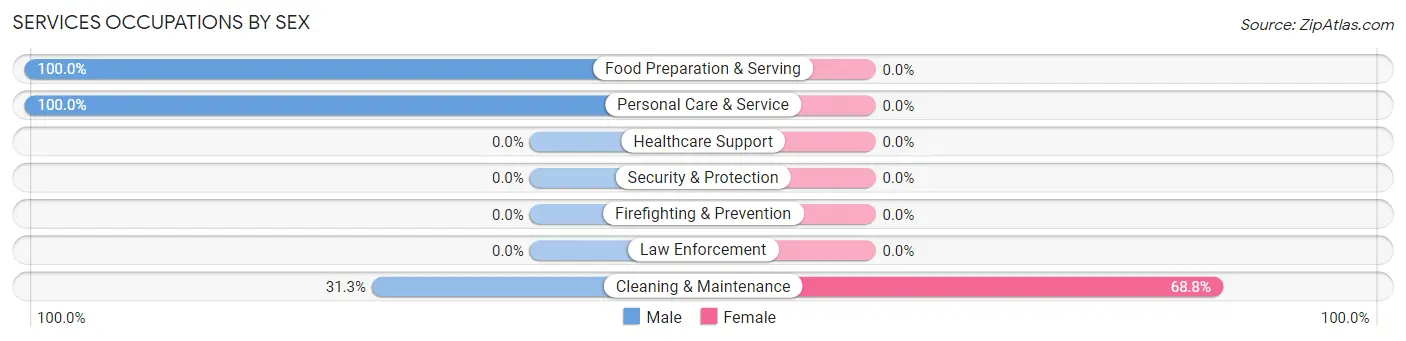
Services Occupations by Sex
| Occupation | Male | Female |
| Healthcare Support | 0 (0.0%) | 0 (0.0%) |
| Security & Protection | 0 (0.0%) | 0 (0.0%) |
| Firefighting & Prevention | 0 (0.0%) | 0 (0.0%) |
| Law Enforcement | 0 (0.0%) | 0 (0.0%) |
| Food Preparation & Serving | 101 (100.0%) | 0 (0.0%) |
| Cleaning & Maintenance | 15 (31.2%) | 33 (68.8%) |
| Personal Care & Service | 36 (100.0%) | 0 (0.0%) |
| Total (Category) | 152 (82.2%) | 33 (17.8%) |
| Total (Overall) | 669 (57.3%) | 499 (42.7%) |
Sales and Office Occupations
The most common Sales and Office occupations in Devon are Sales & Related (62 | 5.3%), and Office & Administration (41 | 3.5%).
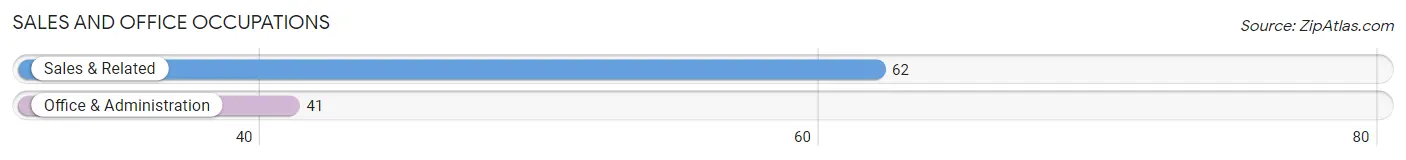
Sales and Office Occupations by Sex

| Occupation | Male | Female |
| Sales & Related | 15 (24.2%) | 47 (75.8%) |
| Office & Administration | 0 (0.0%) | 41 (100.0%) |
| Total (Category) | 15 (14.6%) | 88 (85.4%) |
| Total (Overall) | 669 (57.3%) | 499 (42.7%) |
Natural Resources, Construction and Maintenance Occupations
The most common Natural Resources, Construction and Maintenance occupations in Devon are , and Farming, Fishing & Forestry (32 | 2.7%).
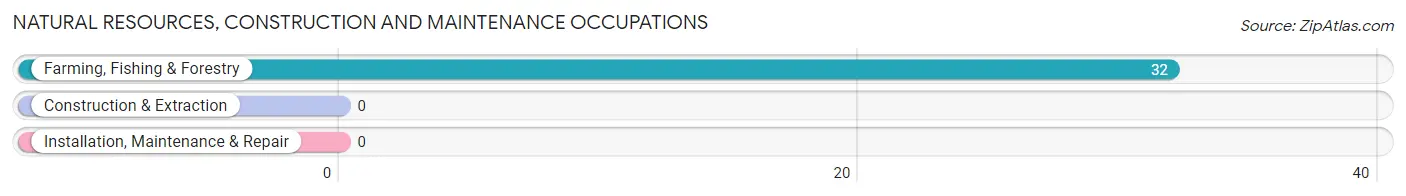
Natural Resources, Construction and Maintenance Occupations by Sex
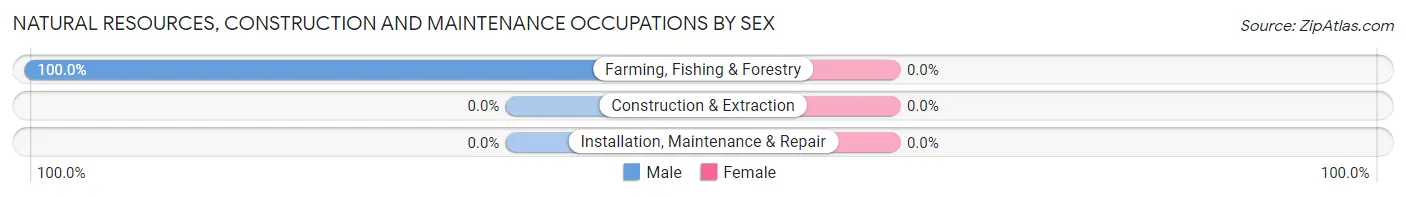
| Occupation | Male | Female |
| Farming, Fishing & Forestry | 32 (100.0%) | 0 (0.0%) |
| Construction & Extraction | 0 (0.0%) | 0 (0.0%) |
| Installation, Maintenance & Repair | 0 (0.0%) | 0 (0.0%) |
| Total (Category) | 32 (100.0%) | 0 (0.0%) |
| Total (Overall) | 669 (57.3%) | 499 (42.7%) |
Production, Transportation and Moving Occupations
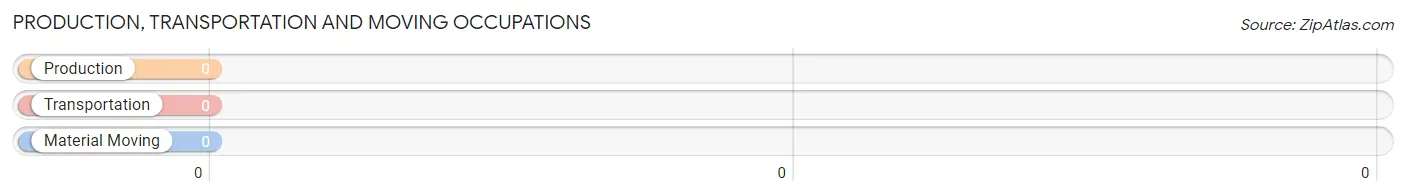
Production, Transportation and Moving Occupations by Sex
| Occupation | Male | Female |
| Production | 0 (0.0%) | 0 (0.0%) |
| Transportation | 0 (0.0%) | 0 (0.0%) |
| Material Moving | 0 (0.0%) | 0 (0.0%) |
| Total (Category) | 0 (0.0%) | 0 (0.0%) |
| Total (Overall) | 669 (57.3%) | 499 (42.7%) |
Employment Industries by Sex in Devon
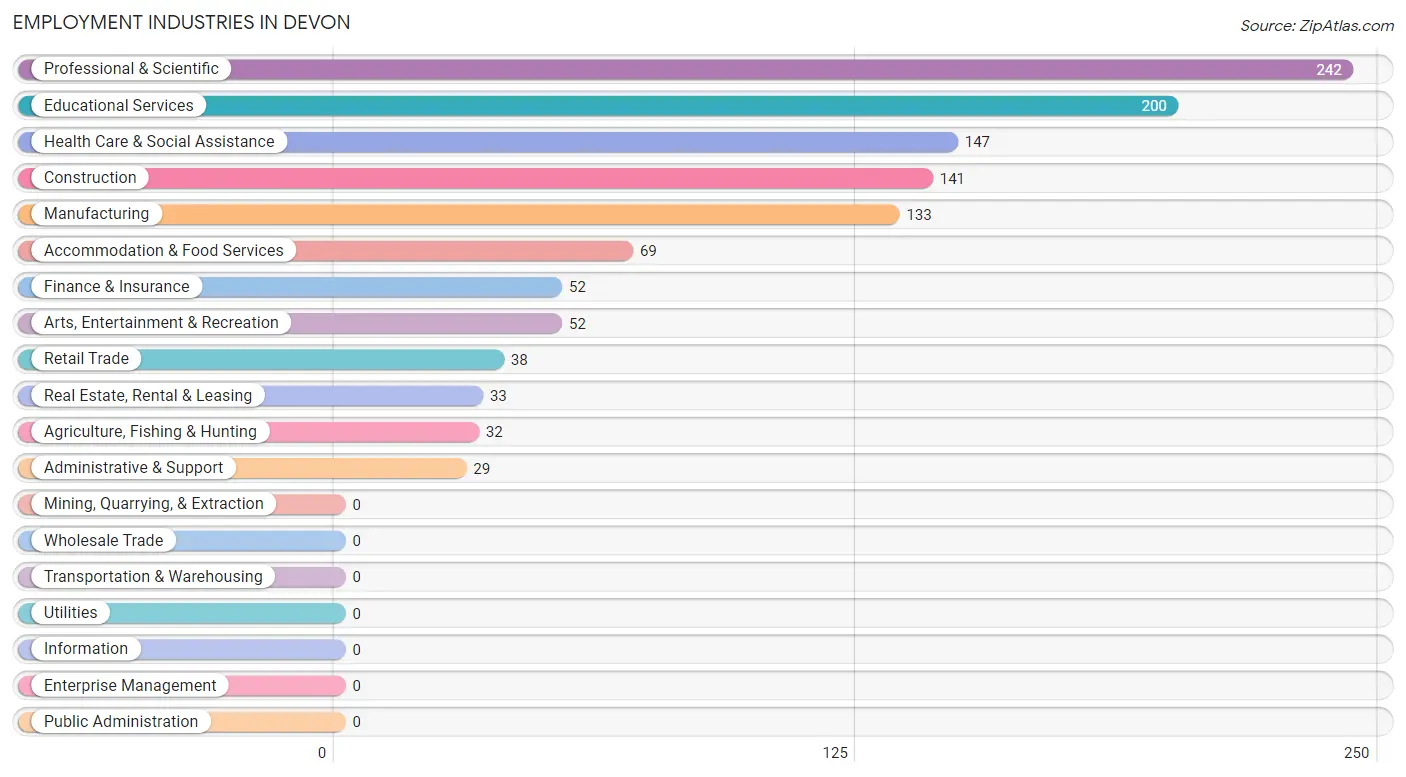
Employment Industries in Devon
The major employment industries in Devon include Professional & Scientific (242 | 20.7%), Educational Services (200 | 17.1%), Health Care & Social Assistance (147 | 12.6%), Construction (141 | 12.1%), and Manufacturing (133 | 11.4%).
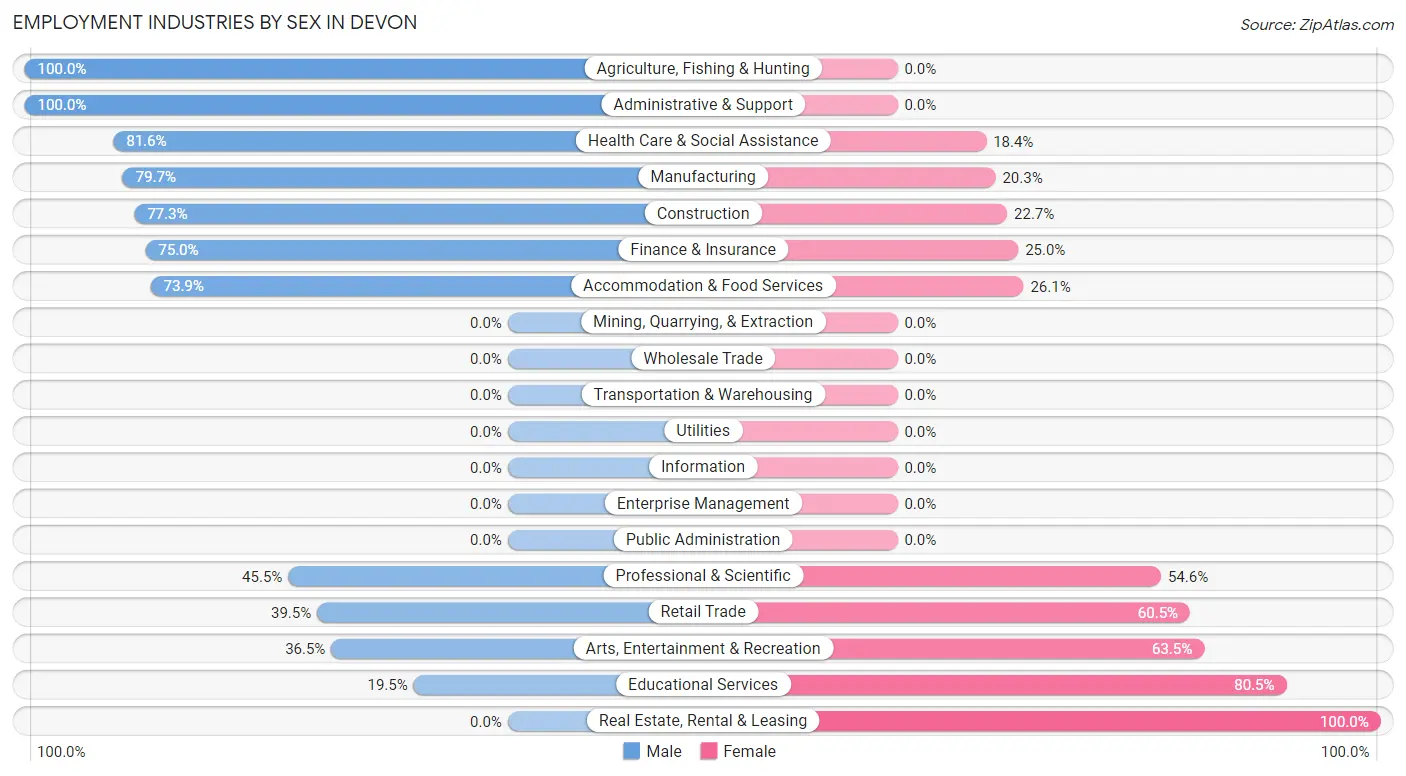
Employment Industries by Sex in Devon
The Devon industries that see more men than women are Agriculture, Fishing & Hunting (100.0%), Administrative & Support (100.0%), and Health Care & Social Assistance (81.6%), whereas the industries that tend to have a higher number of women are Real Estate, Rental & Leasing (100.0%), Educational Services (80.5%), and Arts, Entertainment & Recreation (63.5%).
| Industry | Male | Female |
| Agriculture, Fishing & Hunting | 32 (100.0%) | 0 (0.0%) |
| Mining, Quarrying, & Extraction | 0 (0.0%) | 0 (0.0%) |
| Construction | 109 (77.3%) | 32 (22.7%) |
| Manufacturing | 106 (79.7%) | 27 (20.3%) |
| Wholesale Trade | 0 (0.0%) | 0 (0.0%) |
| Retail Trade | 15 (39.5%) | 23 (60.5%) |
| Transportation & Warehousing | 0 (0.0%) | 0 (0.0%) |
| Utilities | 0 (0.0%) | 0 (0.0%) |
| Information | 0 (0.0%) | 0 (0.0%) |
| Finance & Insurance | 39 (75.0%) | 13 (25.0%) |
| Real Estate, Rental & Leasing | 0 (0.0%) | 33 (100.0%) |
| Professional & Scientific | 110 (45.5%) | 132 (54.5%) |
| Enterprise Management | 0 (0.0%) | 0 (0.0%) |
| Administrative & Support | 29 (100.0%) | 0 (0.0%) |
| Educational Services | 39 (19.5%) | 161 (80.5%) |
| Health Care & Social Assistance | 120 (81.6%) | 27 (18.4%) |
| Arts, Entertainment & Recreation | 19 (36.5%) | 33 (63.5%) |
| Accommodation & Food Services | 51 (73.9%) | 18 (26.1%) |
| Public Administration | 0 (0.0%) | 0 (0.0%) |
| Total | 669 (57.3%) | 499 (42.7%) |
Education in Devon
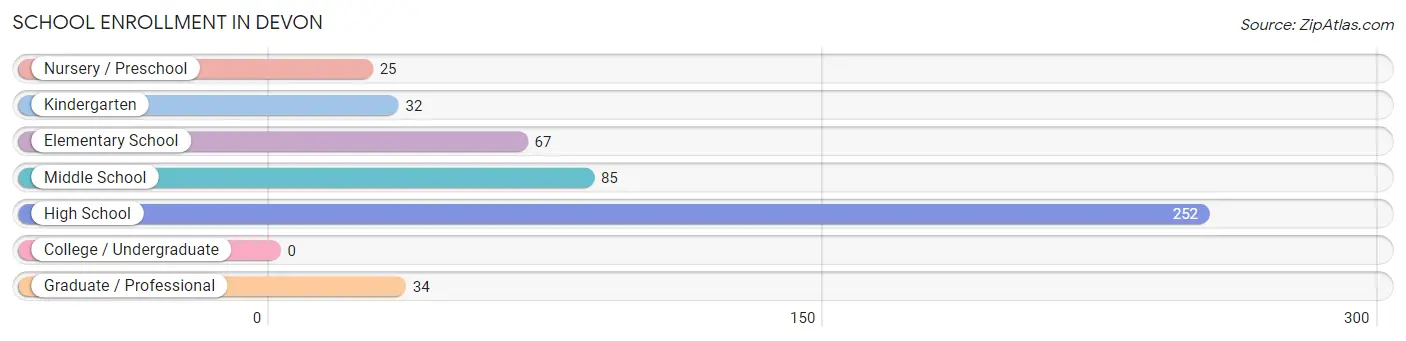
School Enrollment in Devon
The most common levels of schooling among the 495 students in Devon are high school (252 | 50.9%), middle school (85 | 17.2%), and elementary school (67 | 13.5%).
| School Level | # Students | % Students |
| Nursery / Preschool | 25 | 5.1% |
| Kindergarten | 32 | 6.5% |
| Elementary School | 67 | 13.5% |
| Middle School | 85 | 17.2% |
| High School | 252 | 50.9% |
| College / Undergraduate | 0 | 0.0% |
| Graduate / Professional | 34 | 6.9% |
| Total | 495 | 100.0% |
School Enrollment by Age by Funding Source in Devon
Out of a total of 495 students who are enrolled in schools in Devon, 39 (7.9%) attend a private institution, while the remaining 456 (92.1%) are enrolled in public schools. The age group of 25 to 34 year olds has the highest likelihood of being enrolled in private schools, with 34 (100.0% in the age bracket) enrolled. Conversely, the age group of 3 to 4 year olds has the lowest likelihood of being enrolled in a private school, with 25 (100.0% in the age bracket) attending a public institution.
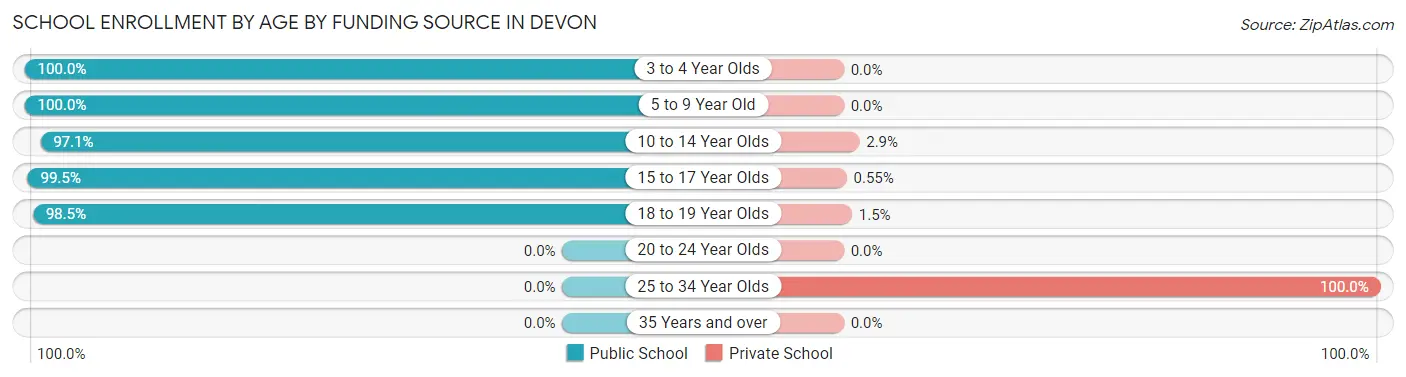
| Age Bracket | Public School | Private School |
| 3 to 4 Year Olds | 25 (100.0%) | 0 (0.0%) |
| 5 to 9 Year Old | 86 (100.0%) | 0 (0.0%) |
| 10 to 14 Year Olds | 100 (97.1%) | 3 (2.9%) |
| 15 to 17 Year Olds | 180 (99.5%) | 1 (0.5%) |
| 18 to 19 Year Olds | 65 (98.5%) | 1 (1.5%) |
| 20 to 24 Year Olds | 0 (0.0%) | 0 (0.0%) |
| 25 to 34 Year Olds | 0 (0.0%) | 34 (100.0%) |
| 35 Years and over | 0 (0.0%) | 0 (0.0%) |
| Total | 456 (92.1%) | 39 (7.9%) |
Educational Attainment by Field of Study in Devon
Social sciences (163 | 13.9%), business (153 | 13.1%), science & technology (147 | 12.5%), bio, nature & agricultural (123 | 10.5%), and education (104 | 8.9%) are the most common fields of study among 1,172 individuals in Devon who have obtained a bachelor's degree or higher.
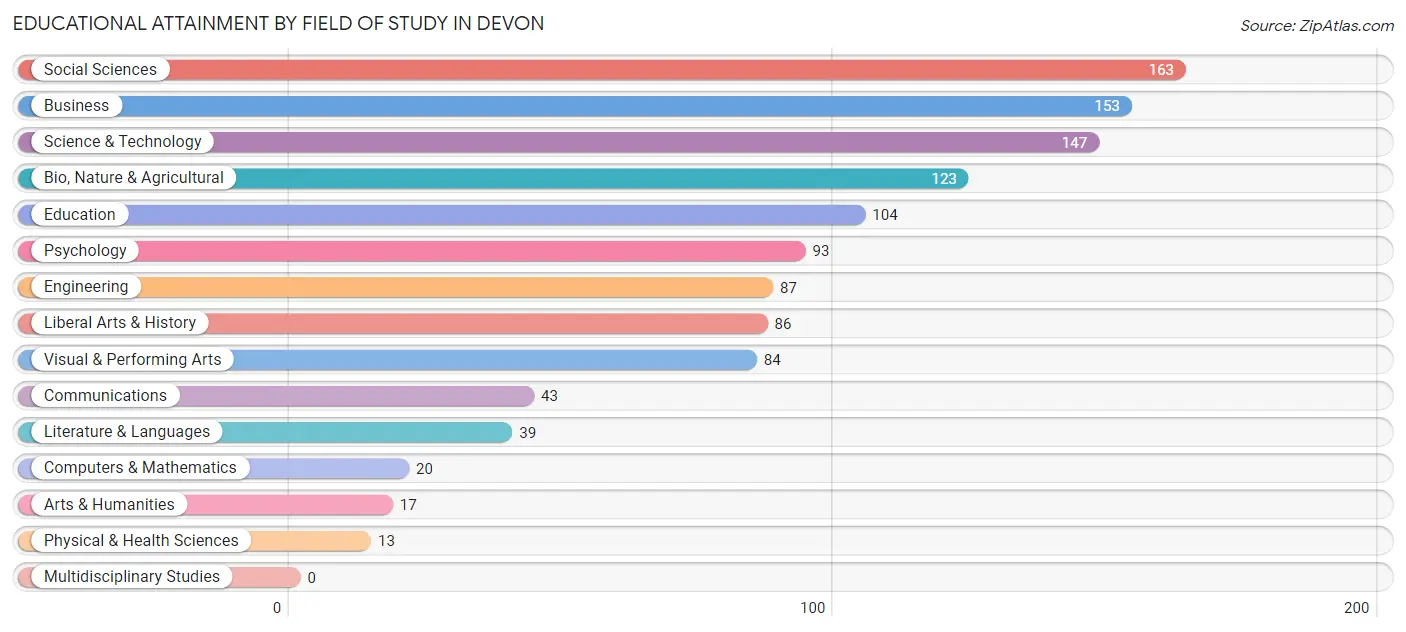
| Field of Study | # Graduates | % Graduates |
| Computers & Mathematics | 20 | 1.7% |
| Bio, Nature & Agricultural | 123 | 10.5% |
| Physical & Health Sciences | 13 | 1.1% |
| Psychology | 93 | 7.9% |
| Social Sciences | 163 | 13.9% |
| Engineering | 87 | 7.4% |
| Multidisciplinary Studies | 0 | 0.0% |
| Science & Technology | 147 | 12.5% |
| Business | 153 | 13.1% |
| Education | 104 | 8.9% |
| Literature & Languages | 39 | 3.3% |
| Liberal Arts & History | 86 | 7.3% |
| Visual & Performing Arts | 84 | 7.2% |
| Communications | 43 | 3.7% |
| Arts & Humanities | 17 | 1.5% |
| Total | 1,172 | 100.0% |
Transportation & Commute in Devon
Vehicle Availability by Sex in Devon
The most prevalent vehicle ownership categories in Devon are males with 2 vehicles (235, accounting for 42.4%) and females with 2 vehicles (280, making up 47.1%).
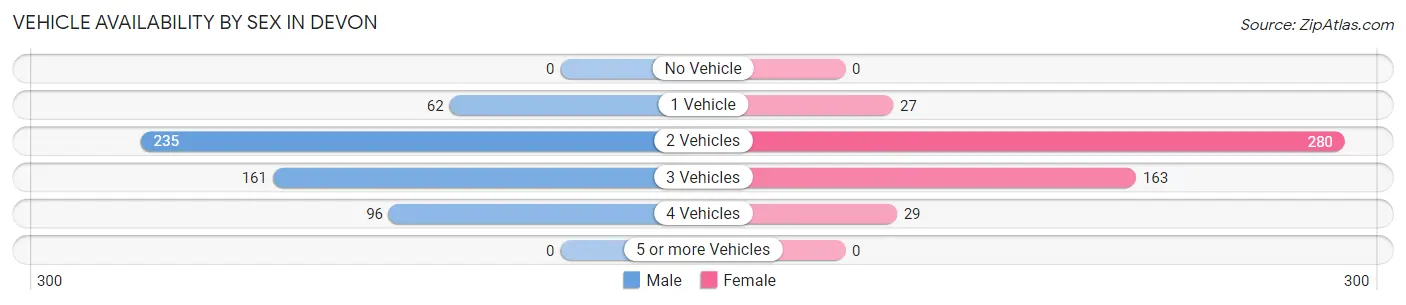
| Vehicles Available | Male | Female |
| No Vehicle | 0 (0.0%) | 0 (0.0%) |
| 1 Vehicle | 62 (11.2%) | 27 (5.4%) |
| 2 Vehicles | 235 (42.4%) | 280 (56.1%) |
| 3 Vehicles | 161 (29.1%) | 163 (32.7%) |
| 4 Vehicles | 96 (17.3%) | 29 (5.8%) |
| 5 or more Vehicles | 0 (0.0%) | 0 (0.0%) |
| Total | 554 (100.0%) | 499 (100.0%) |
Commute Time in Devon
The most frequently occuring commute durations in Devon are 30 to 34 minutes (188 commuters, 19.1%), 10 to 14 minutes (175 commuters, 17.8%), and 5 to 9 minutes (147 commuters, 14.9%).
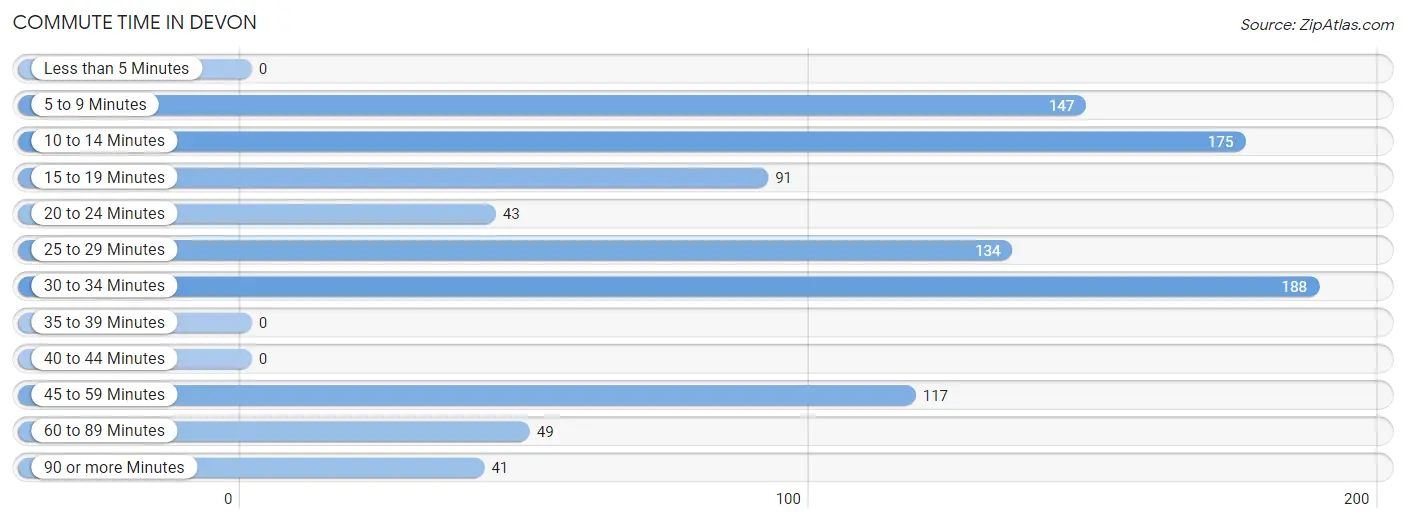
| Commute Time | # Commuters | % Commuters |
| Less than 5 Minutes | 0 | 0.0% |
| 5 to 9 Minutes | 147 | 14.9% |
| 10 to 14 Minutes | 175 | 17.8% |
| 15 to 19 Minutes | 91 | 9.2% |
| 20 to 24 Minutes | 43 | 4.4% |
| 25 to 29 Minutes | 134 | 13.6% |
| 30 to 34 Minutes | 188 | 19.1% |
| 35 to 39 Minutes | 0 | 0.0% |
| 40 to 44 Minutes | 0 | 0.0% |
| 45 to 59 Minutes | 117 | 11.9% |
| 60 to 89 Minutes | 49 | 5.0% |
| 90 or more Minutes | 41 | 4.2% |
Commute Time by Sex in Devon
The most common commute times in Devon are 10 to 14 minutes (138 commuters, 25.9%) for males and 5 to 9 minutes (106 commuters, 23.4%) for females.
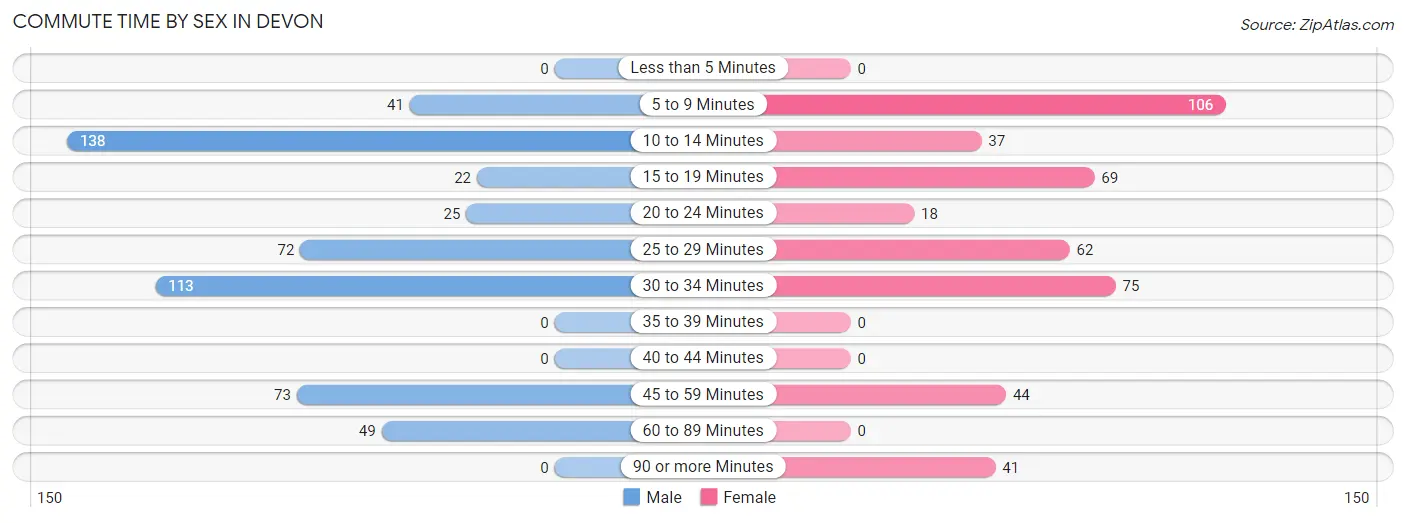
| Commute Time | Male | Female |
| Less than 5 Minutes | 0 (0.0%) | 0 (0.0%) |
| 5 to 9 Minutes | 41 (7.7%) | 106 (23.4%) |
| 10 to 14 Minutes | 138 (25.9%) | 37 (8.2%) |
| 15 to 19 Minutes | 22 (4.1%) | 69 (15.3%) |
| 20 to 24 Minutes | 25 (4.7%) | 18 (4.0%) |
| 25 to 29 Minutes | 72 (13.5%) | 62 (13.7%) |
| 30 to 34 Minutes | 113 (21.2%) | 75 (16.6%) |
| 35 to 39 Minutes | 0 (0.0%) | 0 (0.0%) |
| 40 to 44 Minutes | 0 (0.0%) | 0 (0.0%) |
| 45 to 59 Minutes | 73 (13.7%) | 44 (9.7%) |
| 60 to 89 Minutes | 49 (9.2%) | 0 (0.0%) |
| 90 or more Minutes | 0 (0.0%) | 41 (9.1%) |
Time of Departure to Work by Sex in Devon
The most frequent times of departure to work in Devon are 7:00 AM to 7:29 AM (130, 24.4%) for males and 8:00 AM to 8:29 AM (250, 55.3%) for females.
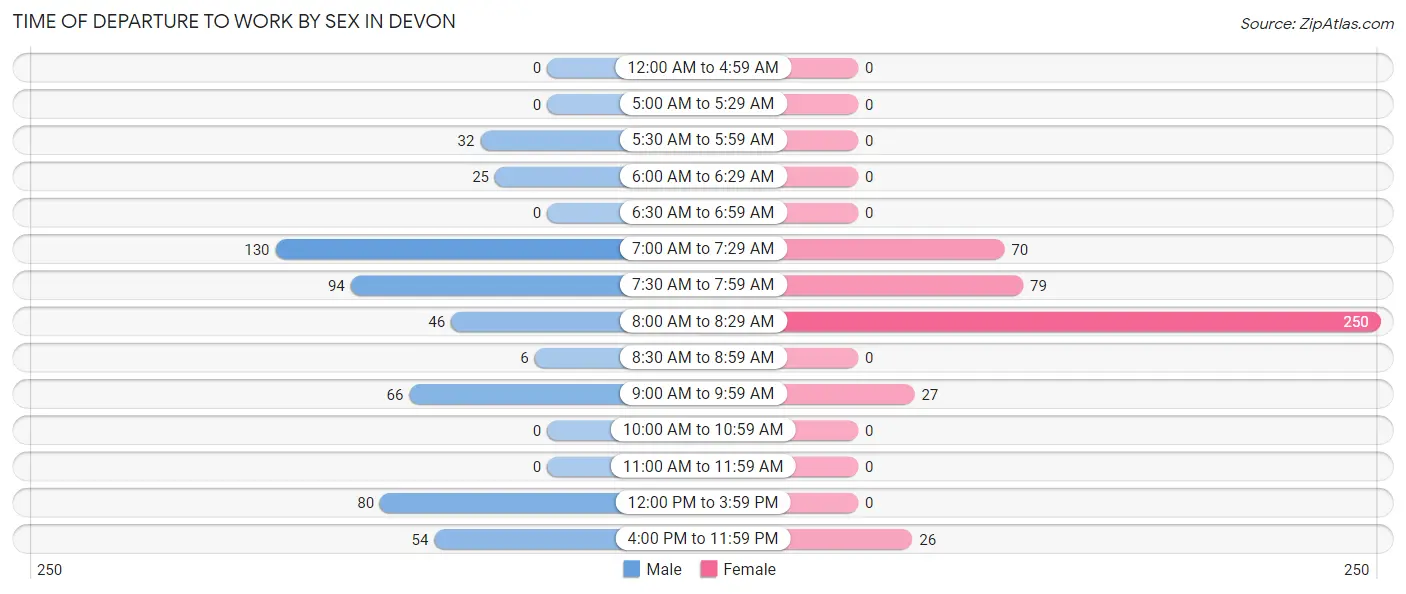
| Time of Departure | Male | Female |
| 12:00 AM to 4:59 AM | 0 (0.0%) | 0 (0.0%) |
| 5:00 AM to 5:29 AM | 0 (0.0%) | 0 (0.0%) |
| 5:30 AM to 5:59 AM | 32 (6.0%) | 0 (0.0%) |
| 6:00 AM to 6:29 AM | 25 (4.7%) | 0 (0.0%) |
| 6:30 AM to 6:59 AM | 0 (0.0%) | 0 (0.0%) |
| 7:00 AM to 7:29 AM | 130 (24.4%) | 70 (15.5%) |
| 7:30 AM to 7:59 AM | 94 (17.6%) | 79 (17.5%) |
| 8:00 AM to 8:29 AM | 46 (8.6%) | 250 (55.3%) |
| 8:30 AM to 8:59 AM | 6 (1.1%) | 0 (0.0%) |
| 9:00 AM to 9:59 AM | 66 (12.4%) | 27 (6.0%) |
| 10:00 AM to 10:59 AM | 0 (0.0%) | 0 (0.0%) |
| 11:00 AM to 11:59 AM | 0 (0.0%) | 0 (0.0%) |
| 12:00 PM to 3:59 PM | 80 (15.0%) | 0 (0.0%) |
| 4:00 PM to 11:59 PM | 54 (10.1%) | 26 (5.8%) |
| Total | 533 (100.0%) | 452 (100.0%) |
Housing Occupancy in Devon
Occupancy by Ownership in Devon
Of the total 601 dwellings in Devon, owner-occupied units account for 583 (97.0%), while renter-occupied units make up 18 (3.0%).
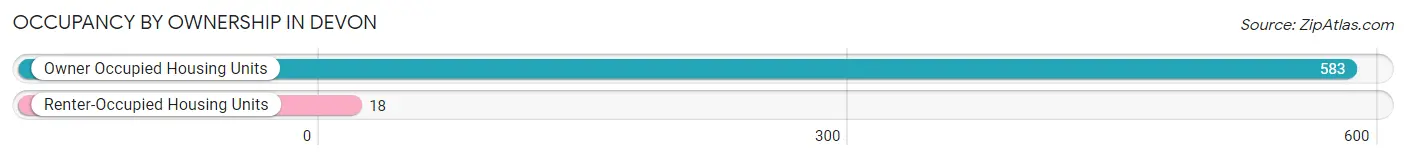
| Occupancy | # Housing Units | % Housing Units |
| Owner Occupied Housing Units | 583 | 97.0% |
| Renter-Occupied Housing Units | 18 | 3.0% |
| Total Occupied Housing Units | 601 | 100.0% |
Occupancy by Household Size in Devon
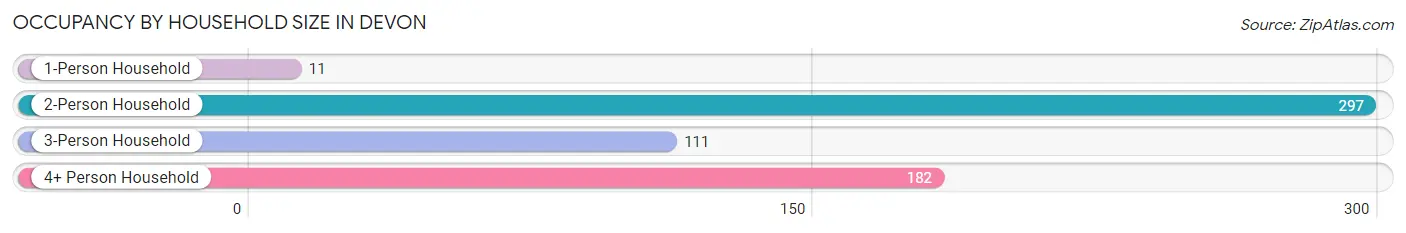
| Household Size | # Housing Units | % Housing Units |
| 1-Person Household | 11 | 1.8% |
| 2-Person Household | 297 | 49.4% |
| 3-Person Household | 111 | 18.5% |
| 4+ Person Household | 182 | 30.3% |
| Total Housing Units | 601 | 100.0% |
Occupancy by Ownership by Household Size in Devon
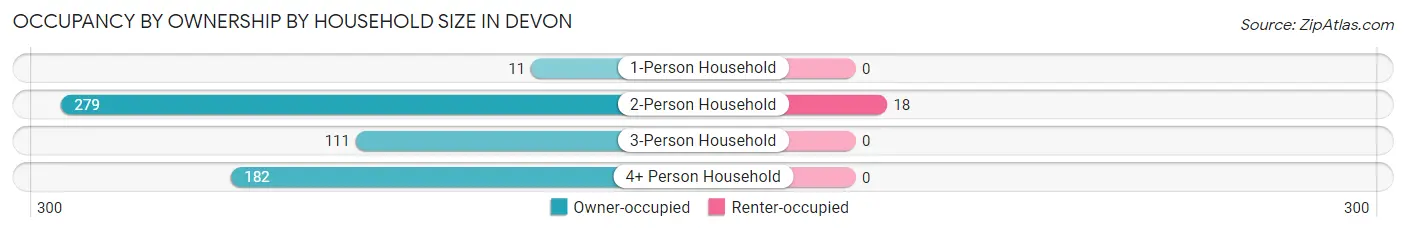
| Household Size | Owner-occupied | Renter-occupied |
| 1-Person Household | 11 (100.0%) | 0 (0.0%) |
| 2-Person Household | 279 (93.9%) | 18 (6.1%) |
| 3-Person Household | 111 (100.0%) | 0 (0.0%) |
| 4+ Person Household | 182 (100.0%) | 0 (0.0%) |
| Total Housing Units | 583 (97.0%) | 18 (3.0%) |
Occupancy by Educational Attainment in Devon
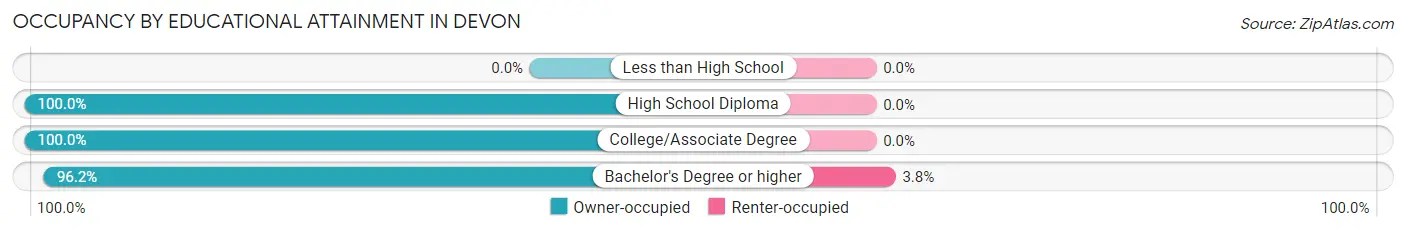
| Household Size | Owner-occupied | Renter-occupied |
| Less than High School | 0 (0.0%) | 0 (0.0%) |
| High School Diploma | 90 (100.0%) | 0 (0.0%) |
| College/Associate Degree | 41 (100.0%) | 0 (0.0%) |
| Bachelor's Degree or higher | 452 (96.2%) | 18 (3.8%) |
Occupancy by Age of Householder in Devon
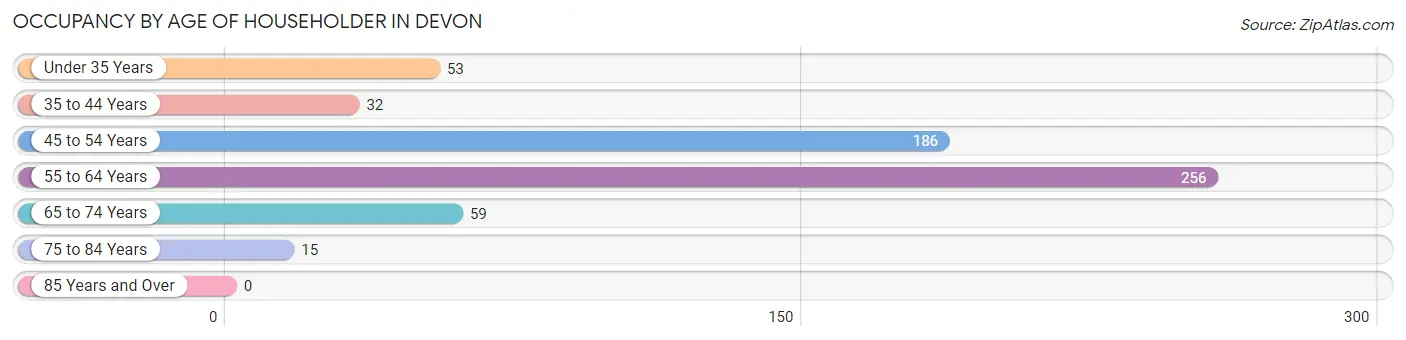
| Age Bracket | # Households | % Households |
| Under 35 Years | 53 | 8.8% |
| 35 to 44 Years | 32 | 5.3% |
| 45 to 54 Years | 186 | 30.9% |
| 55 to 64 Years | 256 | 42.6% |
| 65 to 74 Years | 59 | 9.8% |
| 75 to 84 Years | 15 | 2.5% |
| 85 Years and Over | 0 | 0.0% |
| Total | 601 | 100.0% |
Housing Finances in Devon
Median Income by Occupancy in Devon
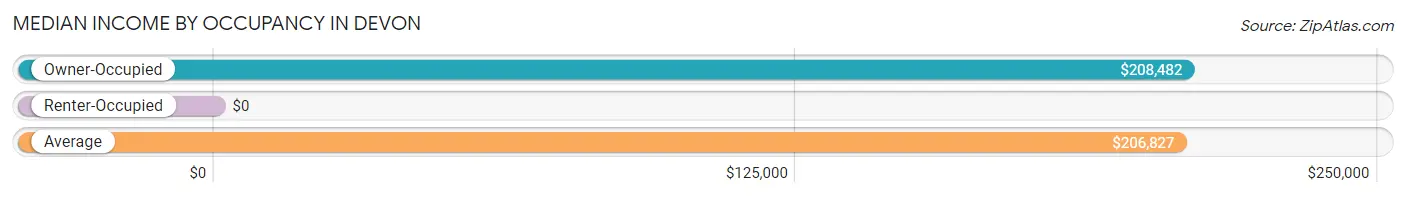
| Occupancy Type | # Households | Median Income |
| Owner-Occupied | 583 (97.0%) | $208,482 |
| Renter-Occupied | 18 (3.0%) | $0 |
| Average | 601 (100.0%) | $206,827 |
Occupancy by Householder Income Bracket in Devon
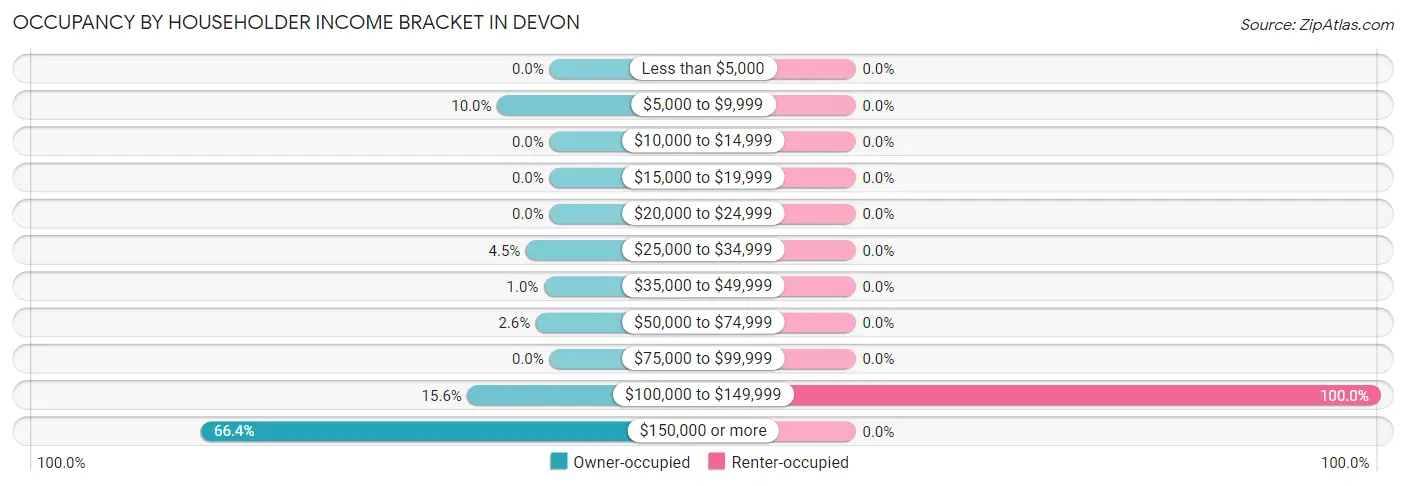
| Income Bracket | Owner-occupied | Renter-occupied |
| Less than $5,000 | 0 (0.0%) | 0 (0.0%) |
| $5,000 to $9,999 | 58 (10.0%) | 0 (0.0%) |
| $10,000 to $14,999 | 0 (0.0%) | 0 (0.0%) |
| $15,000 to $19,999 | 0 (0.0%) | 0 (0.0%) |
| $20,000 to $24,999 | 0 (0.0%) | 0 (0.0%) |
| $25,000 to $34,999 | 26 (4.5%) | 0 (0.0%) |
| $35,000 to $49,999 | 6 (1.0%) | 0 (0.0%) |
| $50,000 to $74,999 | 15 (2.6%) | 0 (0.0%) |
| $75,000 to $99,999 | 0 (0.0%) | 0 (0.0%) |
| $100,000 to $149,999 | 91 (15.6%) | 18 (100.0%) |
| $150,000 or more | 387 (66.4%) | 0 (0.0%) |
| Total | 583 (100.0%) | 18 (100.0%) |
Monthly Housing Cost Tiers in Devon
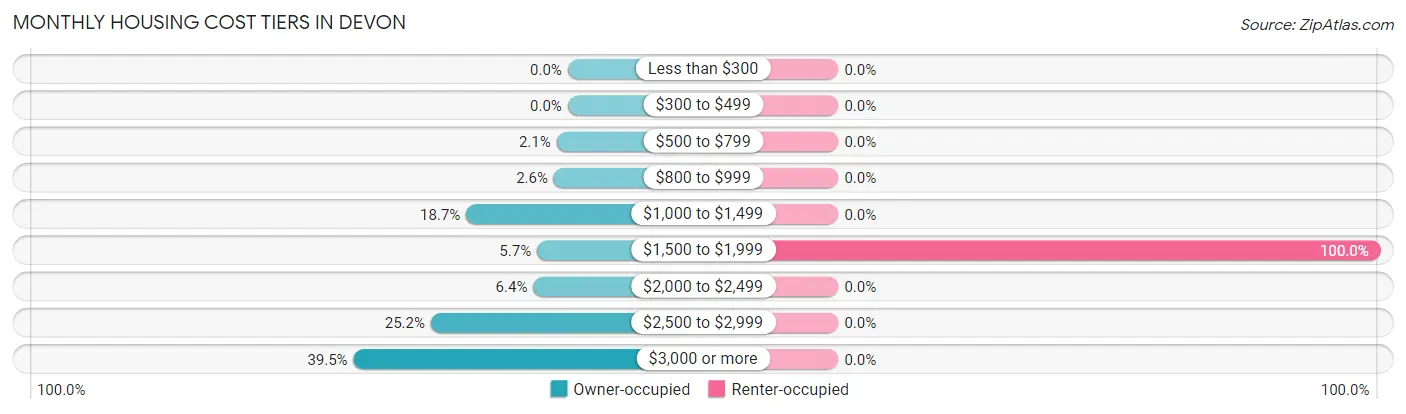
| Monthly Cost | Owner-occupied | Renter-occupied |
| Less than $300 | 0 (0.0%) | 0 (0.0%) |
| $300 to $499 | 0 (0.0%) | 0 (0.0%) |
| $500 to $799 | 12 (2.1%) | 0 (0.0%) |
| $800 to $999 | 15 (2.6%) | 0 (0.0%) |
| $1,000 to $1,499 | 109 (18.7%) | 0 (0.0%) |
| $1,500 to $1,999 | 33 (5.7%) | 18 (100.0%) |
| $2,000 to $2,499 | 37 (6.4%) | 0 (0.0%) |
| $2,500 to $2,999 | 147 (25.2%) | 0 (0.0%) |
| $3,000 or more | 230 (39.5%) | 0 (0.0%) |
| Total | 583 (100.0%) | 18 (100.0%) |
Physical Housing Characteristics in Devon
Housing Structures in Devon
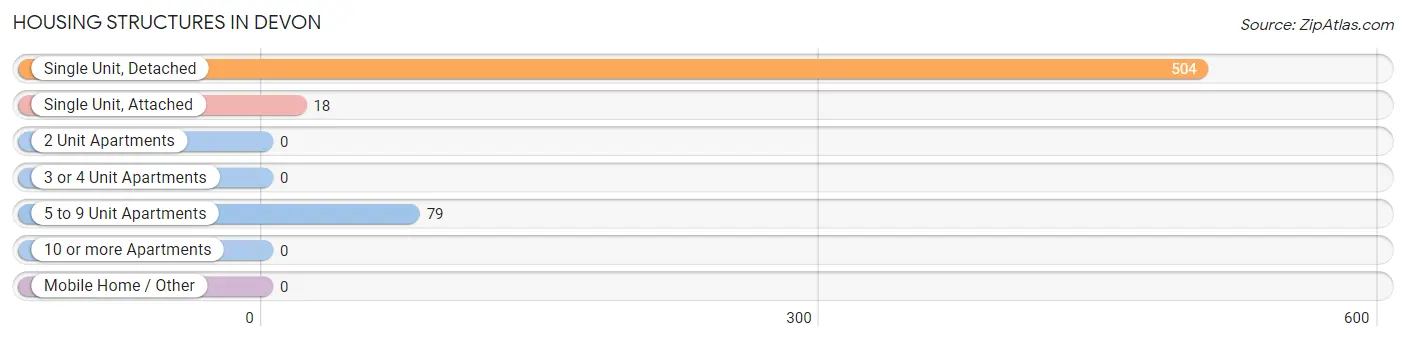
| Structure Type | # Housing Units | % Housing Units |
| Single Unit, Detached | 504 | 83.9% |
| Single Unit, Attached | 18 | 3.0% |
| 2 Unit Apartments | 0 | 0.0% |
| 3 or 4 Unit Apartments | 0 | 0.0% |
| 5 to 9 Unit Apartments | 79 | 13.1% |
| 10 or more Apartments | 0 | 0.0% |
| Mobile Home / Other | 0 | 0.0% |
| Total | 601 | 100.0% |
Housing Structures by Occupancy in Devon
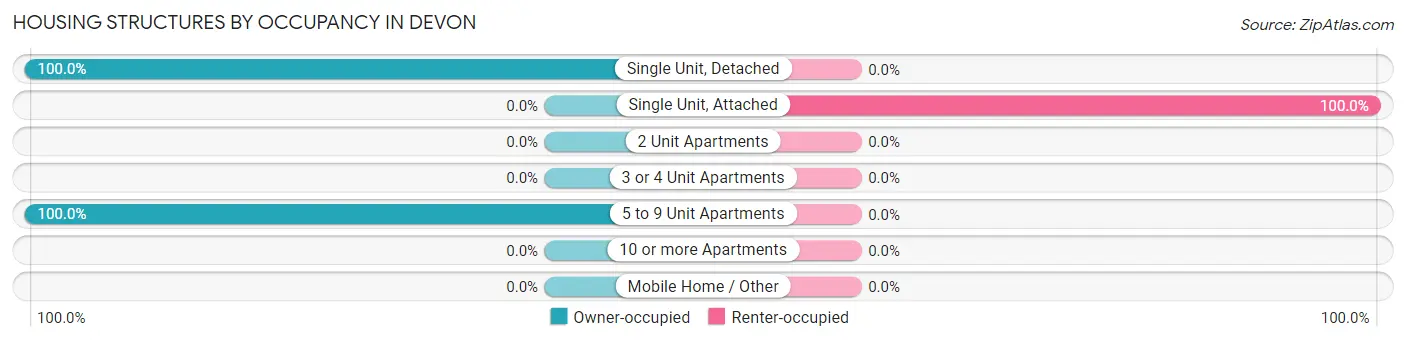
| Structure Type | Owner-occupied | Renter-occupied |
| Single Unit, Detached | 504 (100.0%) | 0 (0.0%) |
| Single Unit, Attached | 0 (0.0%) | 18 (100.0%) |
| 2 Unit Apartments | 0 (0.0%) | 0 (0.0%) |
| 3 or 4 Unit Apartments | 0 (0.0%) | 0 (0.0%) |
| 5 to 9 Unit Apartments | 79 (100.0%) | 0 (0.0%) |
| 10 or more Apartments | 0 (0.0%) | 0 (0.0%) |
| Mobile Home / Other | 0 (0.0%) | 0 (0.0%) |
| Total | 583 (97.0%) | 18 (3.0%) |
Housing Structures by Number of Rooms in Devon
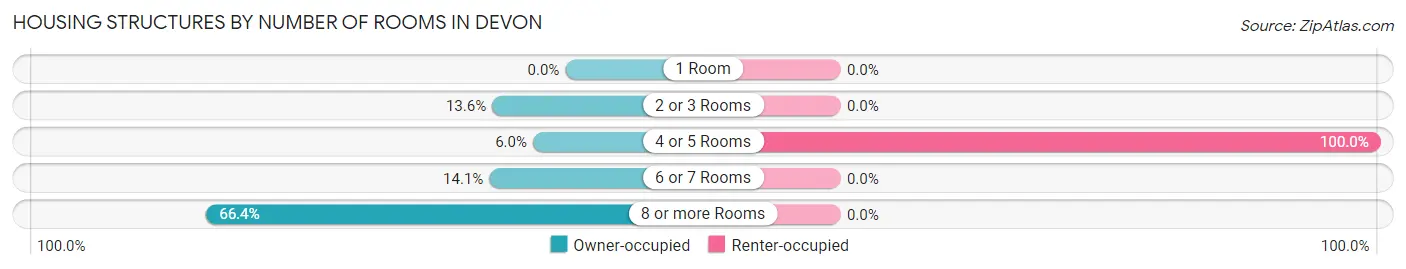
| Number of Rooms | Owner-occupied | Renter-occupied |
| 1 Room | 0 (0.0%) | 0 (0.0%) |
| 2 or 3 Rooms | 79 (13.6%) | 0 (0.0%) |
| 4 or 5 Rooms | 35 (6.0%) | 18 (100.0%) |
| 6 or 7 Rooms | 82 (14.1%) | 0 (0.0%) |
| 8 or more Rooms | 387 (66.4%) | 0 (0.0%) |
| Total | 583 (100.0%) | 18 (100.0%) |
Housing Structure by Heating Type in Devon
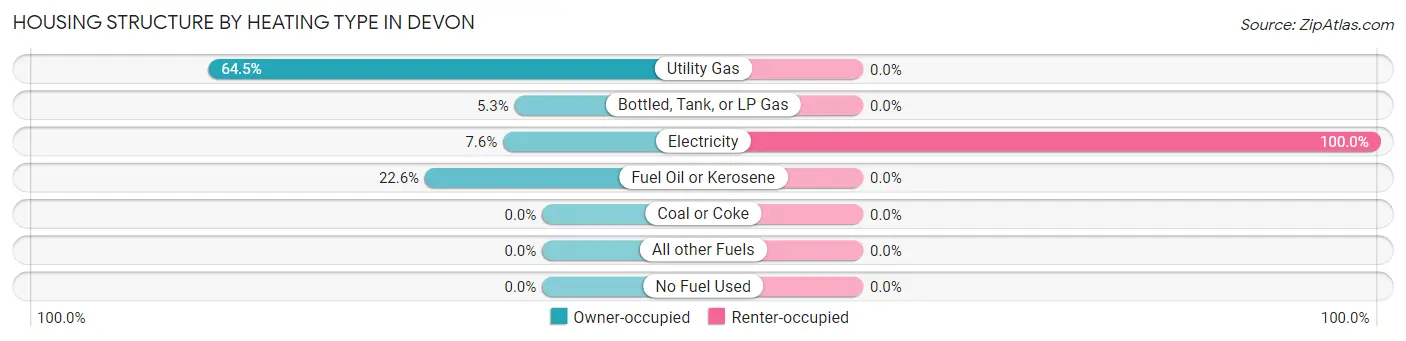
| Heating Type | Owner-occupied | Renter-occupied |
| Utility Gas | 376 (64.5%) | 0 (0.0%) |
| Bottled, Tank, or LP Gas | 31 (5.3%) | 0 (0.0%) |
| Electricity | 44 (7.5%) | 18 (100.0%) |
| Fuel Oil or Kerosene | 132 (22.6%) | 0 (0.0%) |
| Coal or Coke | 0 (0.0%) | 0 (0.0%) |
| All other Fuels | 0 (0.0%) | 0 (0.0%) |
| No Fuel Used | 0 (0.0%) | 0 (0.0%) |
| Total | 583 (100.0%) | 18 (100.0%) |
Household Vehicle Usage in Devon
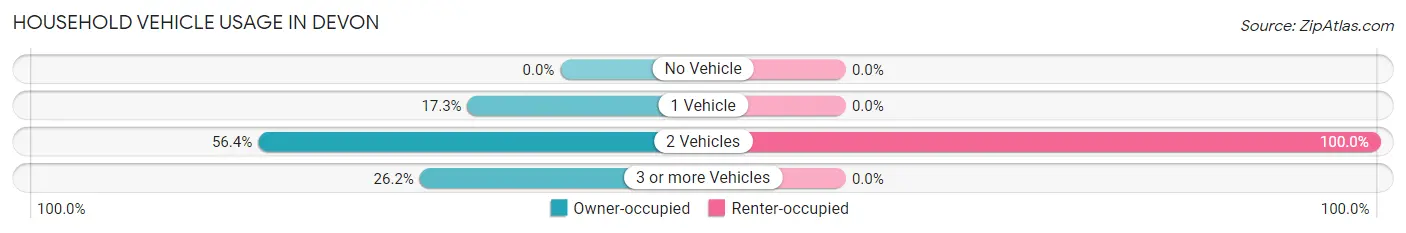
| Vehicles per Household | Owner-occupied | Renter-occupied |
| No Vehicle | 0 (0.0%) | 0 (0.0%) |
| 1 Vehicle | 101 (17.3%) | 0 (0.0%) |
| 2 Vehicles | 329 (56.4%) | 18 (100.0%) |
| 3 or more Vehicles | 153 (26.2%) | 0 (0.0%) |
| Total | 583 (100.0%) | 18 (100.0%) |
Real Estate & Mortgages in Devon
Real Estate and Mortgage Overview in Devon
| Characteristic | Without Mortgage | With Mortgage |
| Housing Units | 160 | 423 |
| Median Property Value | $750,000 | $640,800 |
| Median Household Income | - | - |
| Monthly Housing Costs | $1,227 | $230 |
| Real Estate Taxes | $6,771 | $0 |
Property Value by Mortgage Status in Devon
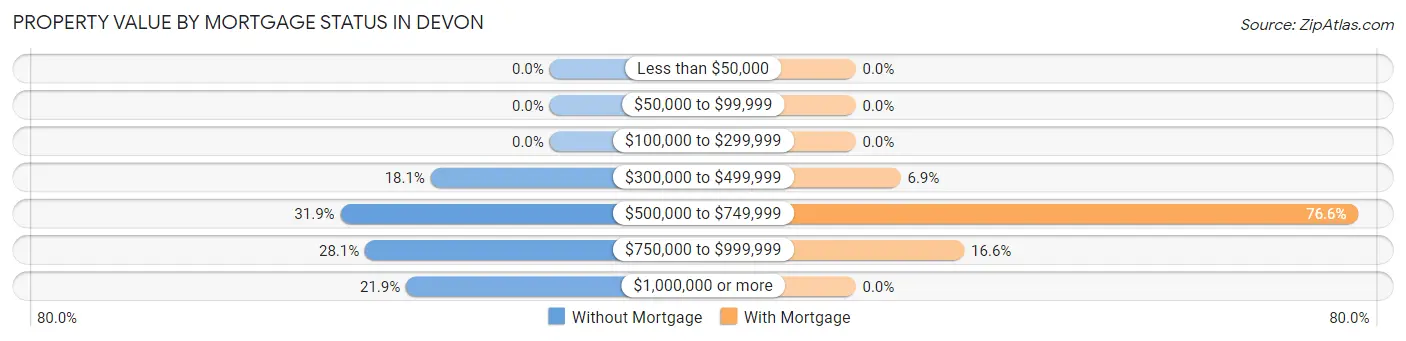
| Property Value | Without Mortgage | With Mortgage |
| Less than $50,000 | 0 (0.0%) | 0 (0.0%) |
| $50,000 to $99,999 | 0 (0.0%) | 0 (0.0%) |
| $100,000 to $299,999 | 0 (0.0%) | 0 (0.0%) |
| $300,000 to $499,999 | 29 (18.1%) | 29 (6.9%) |
| $500,000 to $749,999 | 51 (31.9%) | 324 (76.6%) |
| $750,000 to $999,999 | 45 (28.1%) | 70 (16.6%) |
| $1,000,000 or more | 35 (21.9%) | 0 (0.0%) |
| Total | 160 (100.0%) | 423 (100.0%) |
Household Income by Mortgage Status in Devon
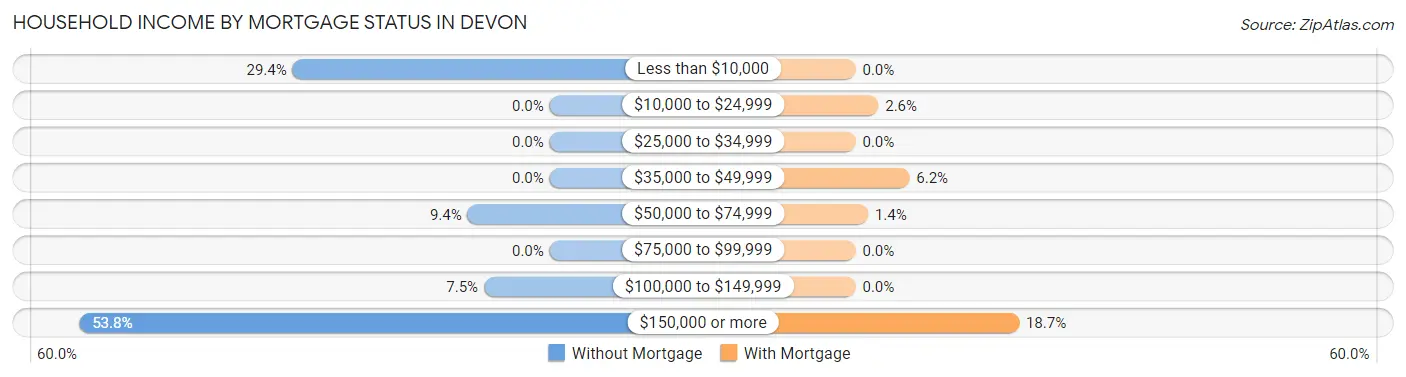
| Household Income | Without Mortgage | With Mortgage |
| Less than $10,000 | 47 (29.4%) | 0 (0.0%) |
| $10,000 to $24,999 | 0 (0.0%) | 11 (2.6%) |
| $25,000 to $34,999 | 0 (0.0%) | 0 (0.0%) |
| $35,000 to $49,999 | 0 (0.0%) | 26 (6.1%) |
| $50,000 to $74,999 | 15 (9.4%) | 6 (1.4%) |
| $75,000 to $99,999 | 0 (0.0%) | 0 (0.0%) |
| $100,000 to $149,999 | 12 (7.5%) | 0 (0.0%) |
| $150,000 or more | 86 (53.7%) | 79 (18.7%) |
| Total | 160 (100.0%) | 423 (100.0%) |
Property Value to Household Income Ratio in Devon
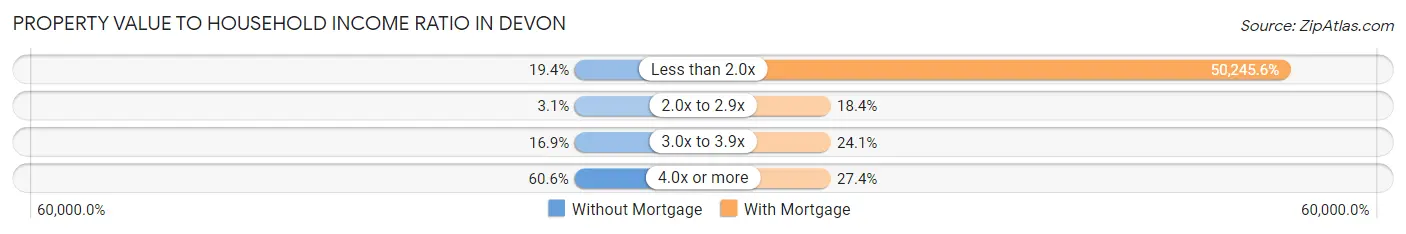
| Value-to-Income Ratio | Without Mortgage | With Mortgage |
| Less than 2.0x | 31 (19.4%) | 212,539 (50,245.6%) |
| 2.0x to 2.9x | 5 (3.1%) | 78 (18.4%) |
| 3.0x to 3.9x | 27 (16.9%) | 102 (24.1%) |
| 4.0x or more | 97 (60.6%) | 116 (27.4%) |
| Total | 160 (100.0%) | 423 (100.0%) |
Real Estate Taxes by Mortgage Status in Devon
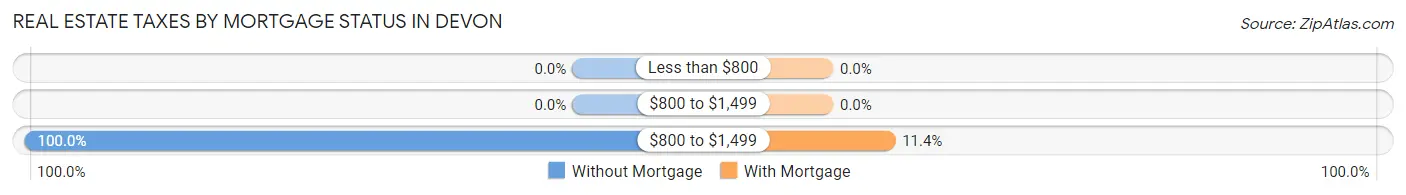
| Property Taxes | Without Mortgage | With Mortgage |
| Less than $800 | 0 (0.0%) | 0 (0.0%) |
| $800 to $1,499 | 0 (0.0%) | 0 (0.0%) |
| $800 to $1,499 | 160 (100.0%) | 48 (11.4%) |
| Total | 160 (100.0%) | 423 (100.0%) |
Health & Disability in Devon
Health Insurance Coverage by Age in Devon
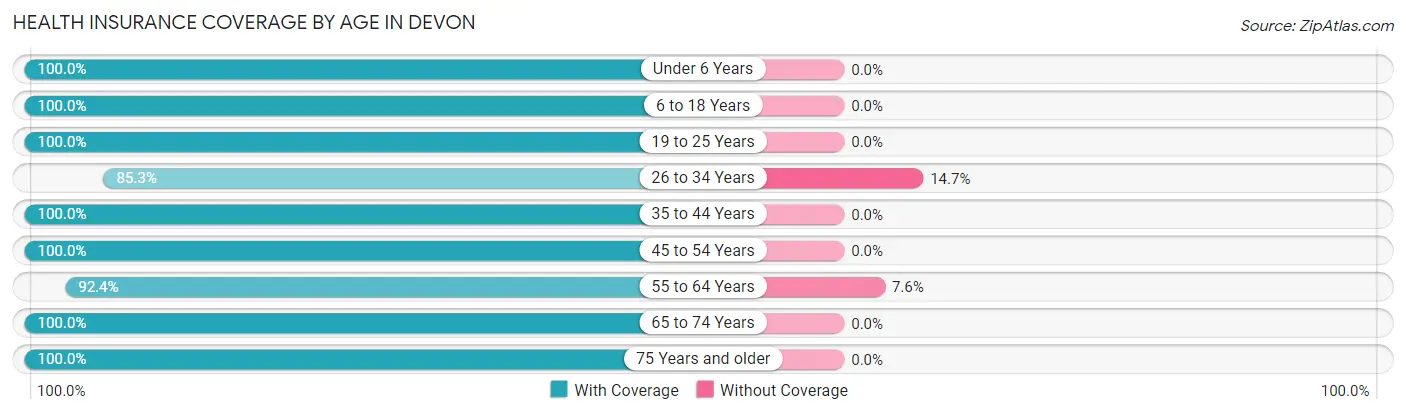
| Age Bracket | With Coverage | Without Coverage |
| Under 6 Years | 92 (100.0%) | 0 (0.0%) |
| 6 to 18 Years | 394 (100.0%) | 0 (0.0%) |
| 19 to 25 Years | 29 (100.0%) | 0 (0.0%) |
| 26 to 34 Years | 197 (85.3%) | 34 (14.7%) |
| 35 to 44 Years | 177 (100.0%) | 0 (0.0%) |
| 45 to 54 Years | 402 (100.0%) | 0 (0.0%) |
| 55 to 64 Years | 353 (92.4%) | 29 (7.6%) |
| 65 to 74 Years | 143 (100.0%) | 0 (0.0%) |
| 75 Years and older | 29 (100.0%) | 0 (0.0%) |
| Total | 1,816 (96.7%) | 63 (3.4%) |
Health Insurance Coverage by Citizenship Status in Devon
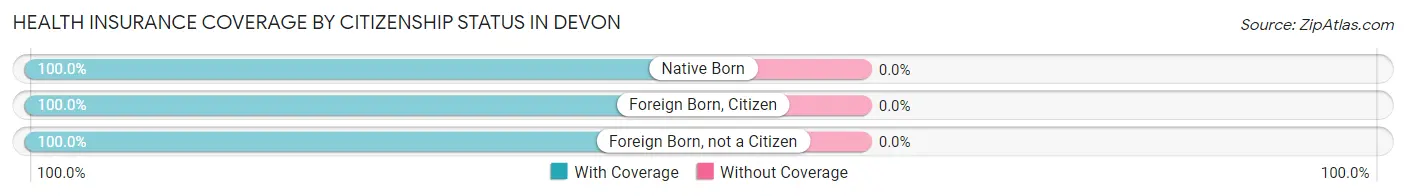
| Citizenship Status | With Coverage | Without Coverage |
| Native Born | 92 (100.0%) | 0 (0.0%) |
| Foreign Born, Citizen | 394 (100.0%) | 0 (0.0%) |
| Foreign Born, not a Citizen | 29 (100.0%) | 0 (0.0%) |
Health Insurance Coverage by Household Income in Devon
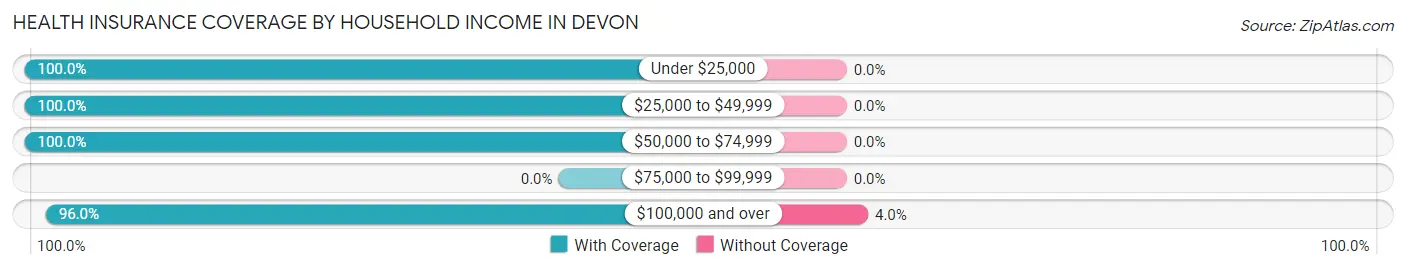
| Household Income | With Coverage | Without Coverage |
| Under $25,000 | 104 (100.0%) | 0 (0.0%) |
| $25,000 to $49,999 | 92 (100.0%) | 0 (0.0%) |
| $50,000 to $74,999 | 29 (100.0%) | 0 (0.0%) |
| $75,000 to $99,999 | 0 (0.0%) | 0 (0.0%) |
| $100,000 and over | 1,519 (96.0%) | 63 (4.0%) |
Public vs Private Health Insurance Coverage by Age in Devon
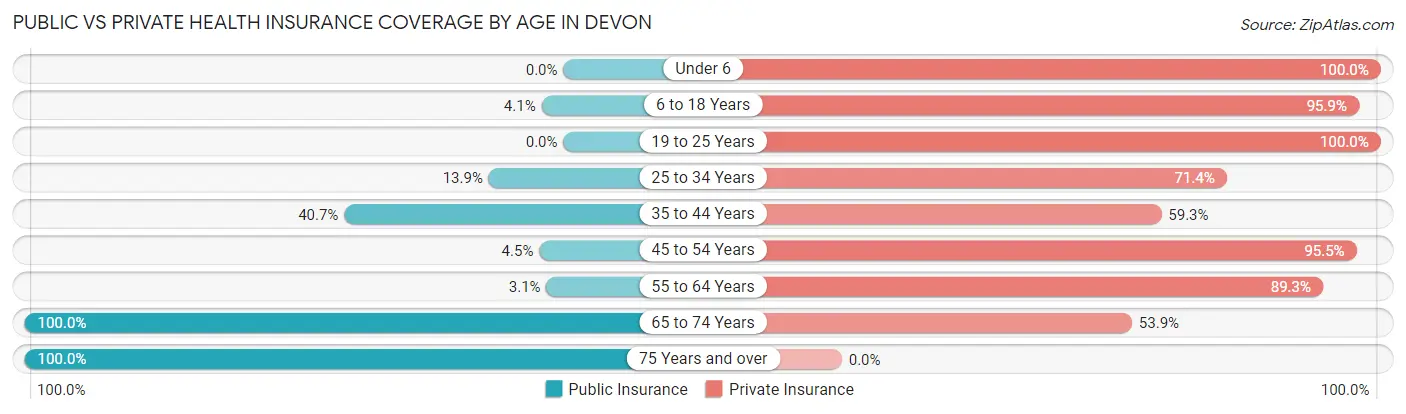
| Age Bracket | Public Insurance | Private Insurance |
| Under 6 | 0 (0.0%) | 92 (100.0%) |
| 6 to 18 Years | 16 (4.1%) | 378 (95.9%) |
| 19 to 25 Years | 0 (0.0%) | 29 (100.0%) |
| 25 to 34 Years | 32 (13.9%) | 165 (71.4%) |
| 35 to 44 Years | 72 (40.7%) | 105 (59.3%) |
| 45 to 54 Years | 18 (4.5%) | 384 (95.5%) |
| 55 to 64 Years | 12 (3.1%) | 341 (89.3%) |
| 65 to 74 Years | 143 (100.0%) | 77 (53.8%) |
| 75 Years and over | 29 (100.0%) | 0 (0.0%) |
| Total | 322 (17.1%) | 1,571 (83.6%) |
Disability Status by Sex by Age in Devon
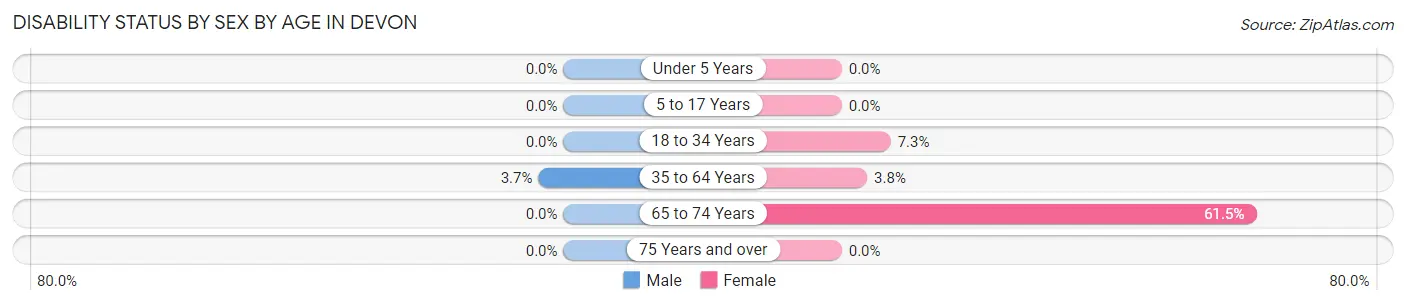
| Age Bracket | Male | Female |
| Under 5 Years | 0 (0.0%) | 0 (0.0%) |
| 5 to 17 Years | 0 (0.0%) | 0 (0.0%) |
| 18 to 34 Years | 0 (0.0%) | 8 (7.3%) |
| 35 to 64 Years | 18 (3.7%) | 18 (3.8%) |
| 65 to 74 Years | 0 (0.0%) | 40 (61.5%) |
| 75 Years and over | 0 (0.0%) | 0 (0.0%) |
Disability Class by Sex by Age in Devon
Disability Class: Hearing Difficulty
| Age Bracket | Male | Female |
| Under 5 Years | 0 (0.0%) | 0 (0.0%) |
| 5 to 17 Years | 0 (0.0%) | 0 (0.0%) |
| 18 to 34 Years | 0 (0.0%) | 0 (0.0%) |
| 35 to 64 Years | 0 (0.0%) | 0 (0.0%) |
| 65 to 74 Years | 0 (0.0%) | 0 (0.0%) |
| 75 Years and over | 0 (0.0%) | 0 (0.0%) |
Disability Class: Vision Difficulty
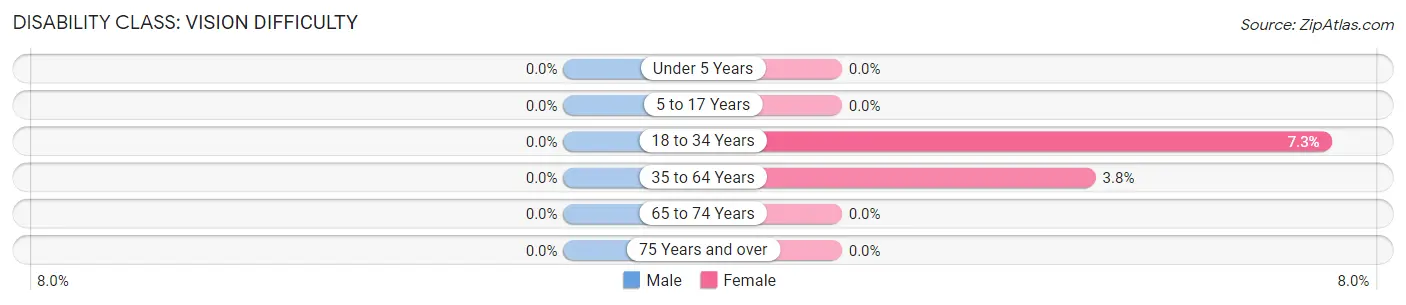
| Age Bracket | Male | Female |
| Under 5 Years | 0 (0.0%) | 0 (0.0%) |
| 5 to 17 Years | 0 (0.0%) | 0 (0.0%) |
| 18 to 34 Years | 0 (0.0%) | 8 (7.3%) |
| 35 to 64 Years | 0 (0.0%) | 18 (3.8%) |
| 65 to 74 Years | 0 (0.0%) | 0 (0.0%) |
| 75 Years and over | 0 (0.0%) | 0 (0.0%) |
Disability Class: Cognitive Difficulty
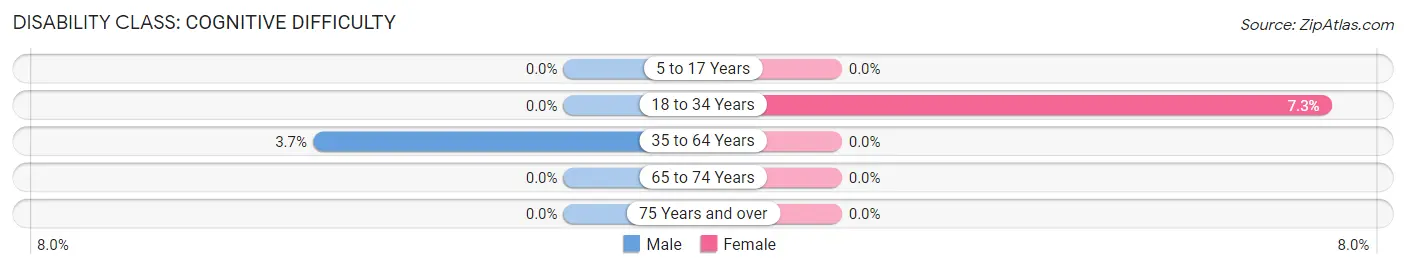
| Age Bracket | Male | Female |
| 5 to 17 Years | 0 (0.0%) | 0 (0.0%) |
| 18 to 34 Years | 0 (0.0%) | 8 (7.3%) |
| 35 to 64 Years | 18 (3.7%) | 0 (0.0%) |
| 65 to 74 Years | 0 (0.0%) | 0 (0.0%) |
| 75 Years and over | 0 (0.0%) | 0 (0.0%) |
Disability Class: Ambulatory Difficulty
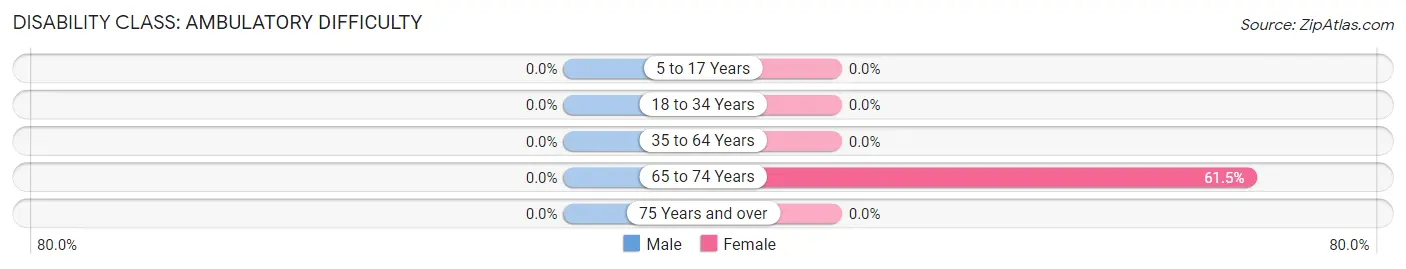
| Age Bracket | Male | Female |
| 5 to 17 Years | 0 (0.0%) | 0 (0.0%) |
| 18 to 34 Years | 0 (0.0%) | 0 (0.0%) |
| 35 to 64 Years | 0 (0.0%) | 0 (0.0%) |
| 65 to 74 Years | 0 (0.0%) | 40 (61.5%) |
| 75 Years and over | 0 (0.0%) | 0 (0.0%) |
Disability Class: Self-Care Difficulty
| Age Bracket | Male | Female |
| 5 to 17 Years | 0 (0.0%) | 0 (0.0%) |
| 18 to 34 Years | 0 (0.0%) | 0 (0.0%) |
| 35 to 64 Years | 0 (0.0%) | 0 (0.0%) |
| 65 to 74 Years | 0 (0.0%) | 0 (0.0%) |
| 75 Years and over | 0 (0.0%) | 0 (0.0%) |
Technology Access in Devon
Computing Device Access in Devon
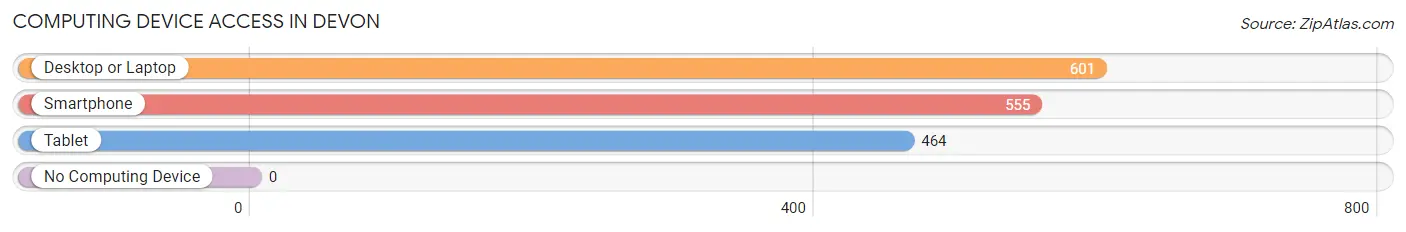
| Device Type | # Households | % Households |
| Desktop or Laptop | 601 | 100.0% |
| Smartphone | 555 | 92.3% |
| Tablet | 464 | 77.2% |
| No Computing Device | 0 | 0.0% |
| Total | 601 | 100.0% |
Internet Access in Devon
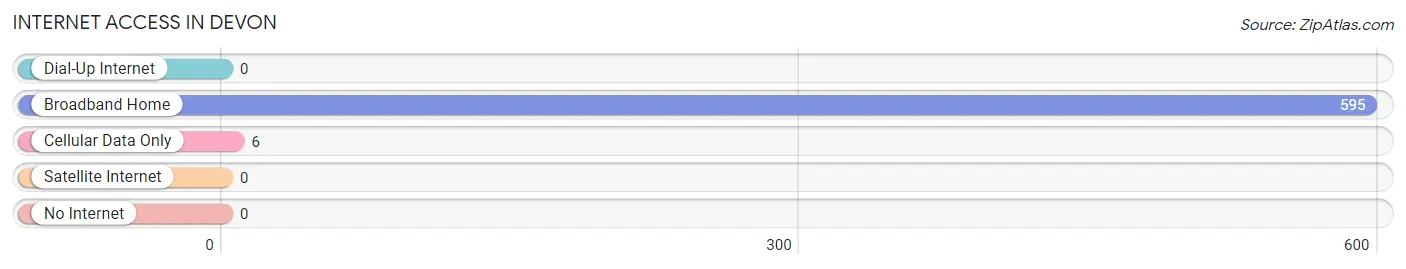
| Internet Type | # Households | % Households |
| Dial-Up Internet | 0 | 0.0% |
| Broadband Home | 595 | 99.0% |
| Cellular Data Only | 6 | 1.0% |
| Satellite Internet | 0 | 0.0% |
| No Internet | 0 | 0.0% |
| Total | 601 | 100.0% |
Devon Summary
Devon, Pennsylvania is a small borough located in the heart of Chester County, Pennsylvania. It is situated in the southeastern corner of the county, just north of the city of Philadelphia. The borough is bordered by the townships of Easttown, Willistown, Tredyffrin, and East Goshen. The population of Devon was 2,845 at the 2010 census.
History
The area that is now Devon was originally inhabited by the Lenni Lenape Native Americans. The first European settlers arrived in the area in the late 1600s. The area was part of the original land grant given to William Penn in 1681. The area was known as “Devonshire” and was named after the English county of Devon. The area was first settled by Quakers in the early 1700s. The first permanent settlement was established in 1714.
The area was primarily agricultural until the late 1800s when the Pennsylvania Railroad built a station in Devon. This allowed for the development of the area as a summer resort destination. The area was known for its beautiful scenery and was a popular destination for wealthy Philadelphians.
In 1891, the borough of Devon was incorporated. The borough was named after the English county of Devon. The borough was primarily residential and remained a popular summer resort destination until the 1950s.
Geography
Devon is located in southeastern Chester County, Pennsylvania. It is situated in the heart of the county, just north of the city of Philadelphia. The borough is bordered by the townships of Easttown, Willistown, Tredyffrin, and East Goshen. The borough is located in the Brandywine Valley and is surrounded by rolling hills and lush forests.
The borough covers an area of 1.2 square miles and has a population of 2,845 as of the 2010 census. The borough is primarily residential and is home to several parks and recreational areas.
Economy
The economy of Devon is primarily based on the service industry. The borough is home to several restaurants, retail stores, and professional services. The borough is also home to several corporate offices, including the headquarters of the Vanguard Group.
The borough is also home to several educational institutions, including the Devon Preparatory School and the Devon Friends School. The borough is also home to several churches and religious organizations.
Demographics
As of the 2010 census, the population of Devon was 2,845. The racial makeup of the borough was 94.3% White, 2.2% African American, 0.3% Native American, 1.2% Asian, 0.1% Pacific Islander, 0.7% from other races, and 1.3% from two or more races. Hispanic or Latino of any race were 2.2% of the population.
The median income for a household in the borough was $90,917 and the median income for a family was $106,917. The per capita income for the borough was $45,917. About 3.2% of families and 4.2% of the population were below the poverty line, including 4.7% of those under age 18 and 4.2% of those age 65 or over.
Common Questions
What is Per Capita Income in Devon?
Per Capita income in Devon is $70,993.
What is the Median Family Income in Devon?
Median Family Income in Devon is $214,063.
What is the Median Household income in Devon?
Median Household Income in Devon is $206,827.
What is Income or Wage Gap in Devon?
Income or Wage Gap in Devon is 43.0%.
Women in Devon earn 57.0 cents for every dollar earned by a man.
What is Inequality or Gini Index in Devon?
Inequality or Gini Index in Devon is 0.40.
What is the Total Population of Devon?
Total Population of Devon is 1,890.
What is the Total Male Population of Devon?
Total Male Population of Devon is 997.
What is the Total Female Population of Devon?
Total Female Population of Devon is 893.
What is the Ratio of Males per 100 Females in Devon?
There are 111.65 Males per 100 Females in Devon.
What is the Ratio of Females per 100 Males in Devon?
There are 89.57 Females per 100 Males in Devon.
What is the Median Population Age in Devon?
Median Population Age in Devon is 45.6 Years.
What is the Average Family Size in Devon
Average Family Size in Devon is 3.3 People.
What is the Average Household Size in Devon
Average Household Size in Devon is 3.0 People.
How Large is the Labor Force in Devon?
There are 1,210 People in the Labor Forcein in Devon.
What is the Percentage of People in the Labor Force in Devon?
77.0% of People are in the Labor Force in Devon.
What is the Unemployment Rate in Devon?
Unemployment Rate in Devon is 3.4%.