Virginville, PA Map & Demographics
Virginville Map
Virginville Overview
$46,146
PER CAPITA INCOME
$115,250
AVG FAMILY INCOME
$103,565
AVG HOUSEHOLD INCOME
39.8%
WAGE / INCOME GAP [ % ]
60.2¢/ $1
WAGE / INCOME GAP [ $ ]
0.22
INEQUALITY / GINI INDEX
238
TOTAL POPULATION
109
MALE POPULATION
129
FEMALE POPULATION
84.50
MALES / 100 FEMALES
118.35
FEMALES / 100 MALES
32.9
MEDIAN AGE
3.0
AVG FAMILY SIZE
2.1
AVG HOUSEHOLD SIZE
195
LABOR FORCE [ PEOPLE ]
81.9%
PERCENT IN LABOR FORCE
Virginville Zip Codes
Virginville Area Codes
Income in Virginville
Income Overview in Virginville
Per Capita Income in Virginville is $46,146, while median incomes of families and households are $115,250 and $103,565 respectively.
| Characteristic | Number | Measure |
| Per Capita Income | 238 | $46,146 |
| Median Family Income | 56 | $115,250 |
| Mean Family Income | 56 | $99,095 |
| Median Household Income | 111 | $103,565 |
| Mean Household Income | 111 | $95,694 |
| Income Deficit | 56 | $0 |
| Wage / Income Gap (%) | 238 | 39.77% |
| Wage / Income Gap ($) | 238 | 60.23¢ per $1 |
| Gini / Inequality Index | 238 | 0.22 |
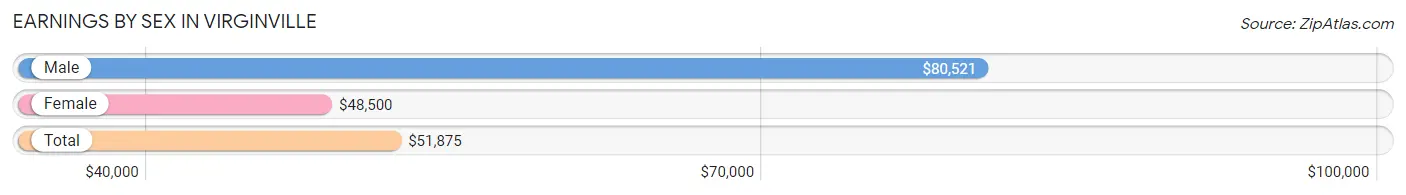
Earnings by Sex in Virginville
Average Earnings in Virginville are $51,875, $80,521 for men and $48,500 for women, a difference of 39.8%.
| Sex | Number | Average Earnings |
| Male | 85 (43.6%) | $80,521 |
| Female | 110 (56.4%) | $48,500 |
| Total | 195 (100.0%) | $51,875 |
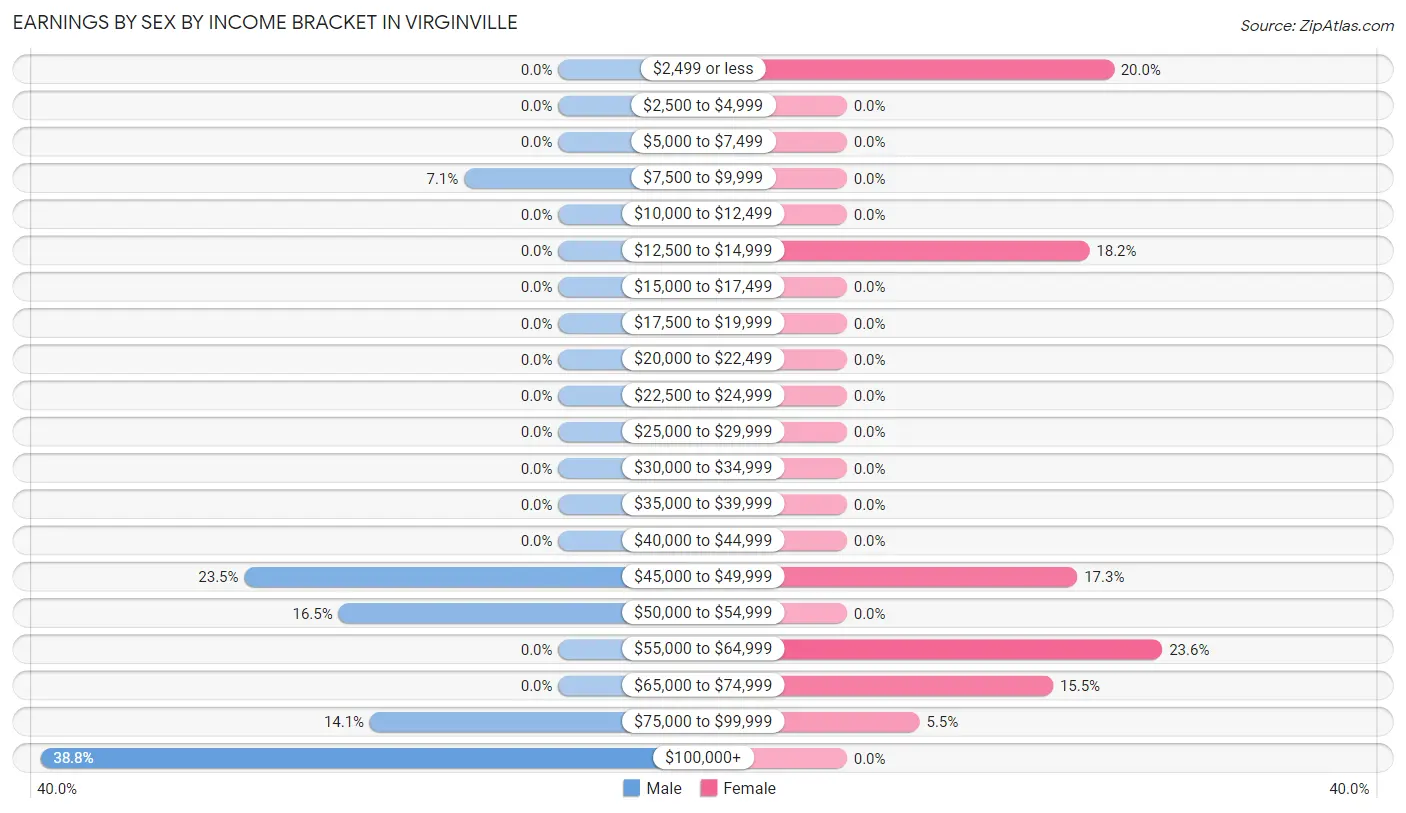
Earnings by Sex by Income Bracket in Virginville
The most common earnings brackets in Virginville are $100,000+ for men (33 | 38.8%) and $55,000 to $64,999 for women (26 | 23.6%).
| Income | Male | Female |
| $2,499 or less | 0 (0.0%) | 22 (20.0%) |
| $2,500 to $4,999 | 0 (0.0%) | 0 (0.0%) |
| $5,000 to $7,499 | 0 (0.0%) | 0 (0.0%) |
| $7,500 to $9,999 | 6 (7.1%) | 0 (0.0%) |
| $10,000 to $12,499 | 0 (0.0%) | 0 (0.0%) |
| $12,500 to $14,999 | 0 (0.0%) | 20 (18.2%) |
| $15,000 to $17,499 | 0 (0.0%) | 0 (0.0%) |
| $17,500 to $19,999 | 0 (0.0%) | 0 (0.0%) |
| $20,000 to $22,499 | 0 (0.0%) | 0 (0.0%) |
| $22,500 to $24,999 | 0 (0.0%) | 0 (0.0%) |
| $25,000 to $29,999 | 0 (0.0%) | 0 (0.0%) |
| $30,000 to $34,999 | 0 (0.0%) | 0 (0.0%) |
| $35,000 to $39,999 | 0 (0.0%) | 0 (0.0%) |
| $40,000 to $44,999 | 0 (0.0%) | 0 (0.0%) |
| $45,000 to $49,999 | 20 (23.5%) | 19 (17.3%) |
| $50,000 to $54,999 | 14 (16.5%) | 0 (0.0%) |
| $55,000 to $64,999 | 0 (0.0%) | 26 (23.6%) |
| $65,000 to $74,999 | 0 (0.0%) | 17 (15.4%) |
| $75,000 to $99,999 | 12 (14.1%) | 6 (5.4%) |
| $100,000+ | 33 (38.8%) | 0 (0.0%) |
| Total | 85 (100.0%) | 110 (100.0%) |
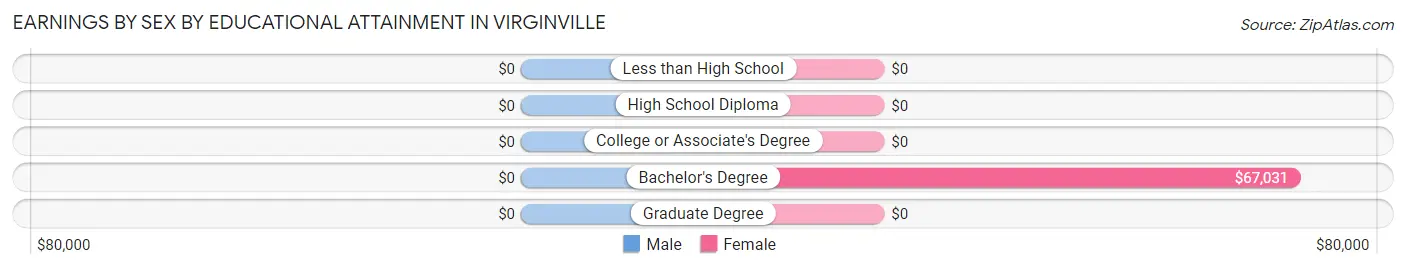
Earnings by Sex by Educational Attainment in Virginville
| Educational Attainment | Male Income | Female Income |
| Less than High School | - | - |
| High School Diploma | - | - |
| College or Associate's Degree | - | - |
| Bachelor's Degree | - | - |
| Graduate Degree | - | - |
| Total | $80,521 | $56,923 |
Family Income in Virginville
Family Income Brackets in Virginville
According to the Virginville family income data, there are 24 families falling into the $100,000 to $149,999 income range, which is the most common income bracket and makes up 42.9% of all families.
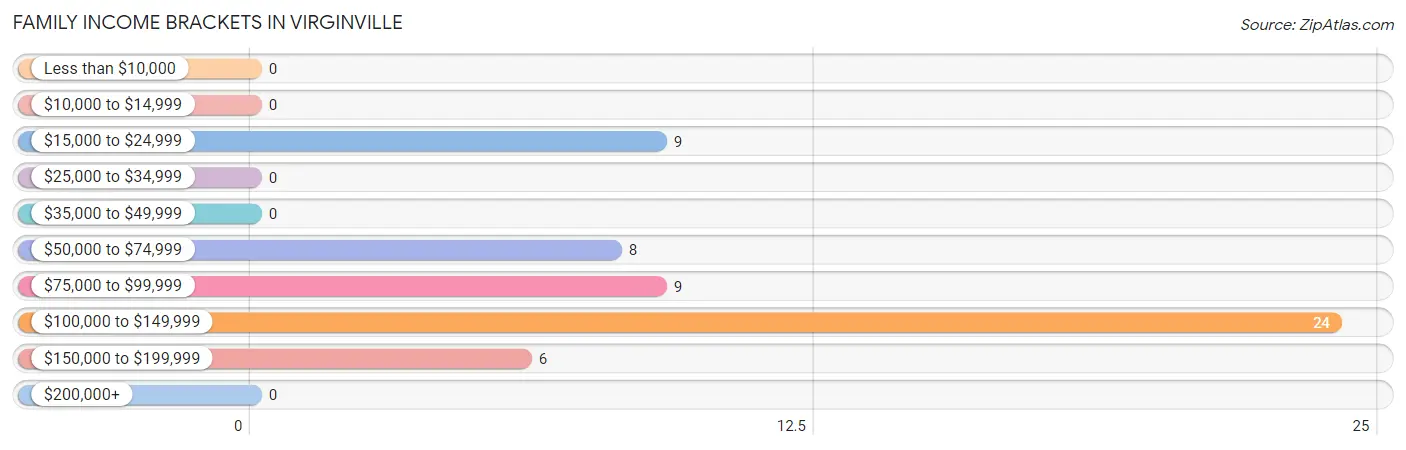
| Income Bracket | # Families | % Families |
| Less than $10,000 | 0 | 0.0% |
| $10,000 to $14,999 | 0 | 0.0% |
| $15,000 to $24,999 | 9 | 16.1% |
| $25,000 to $34,999 | 0 | 0.0% |
| $35,000 to $49,999 | 0 | 0.0% |
| $50,000 to $74,999 | 8 | 14.3% |
| $75,000 to $99,999 | 9 | 16.1% |
| $100,000 to $149,999 | 24 | 42.9% |
| $150,000 to $199,999 | 6 | 10.7% |
| $200,000+ | 0 | 0.0% |
Family Income by Famaliy Size in Virginville
| Income Bracket | # Families | Median Income |
| 2-Person Families | 26 (46.4%) | $0 |
| 3-Person Families | 10 (17.9%) | $0 |
| 4-Person Families | 20 (35.7%) | $0 |
| 5-Person Families | 0 (0.0%) | $0 |
| 6-Person Families | 0 (0.0%) | $0 |
| 7+ Person Families | 0 (0.0%) | $0 |
| Total | 56 (100.0%) | $115,250 |
Family Income by Number of Earners in Virginville
| Number of Earners | # Families | Median Income |
| No Earners | 9 (16.1%) | $0 |
| 1 Earner | 8 (14.3%) | $0 |
| 2 Earners | 15 (26.8%) | $0 |
| 3+ Earners | 24 (42.9%) | $0 |
| Total | 56 (100.0%) | $115,250 |
Household Income in Virginville
Household Income Brackets in Virginville
With 61 households falling in the category, the $100,000 to $149,999 income range is the most frequent in Virginville, accounting for 54.9% of all households.
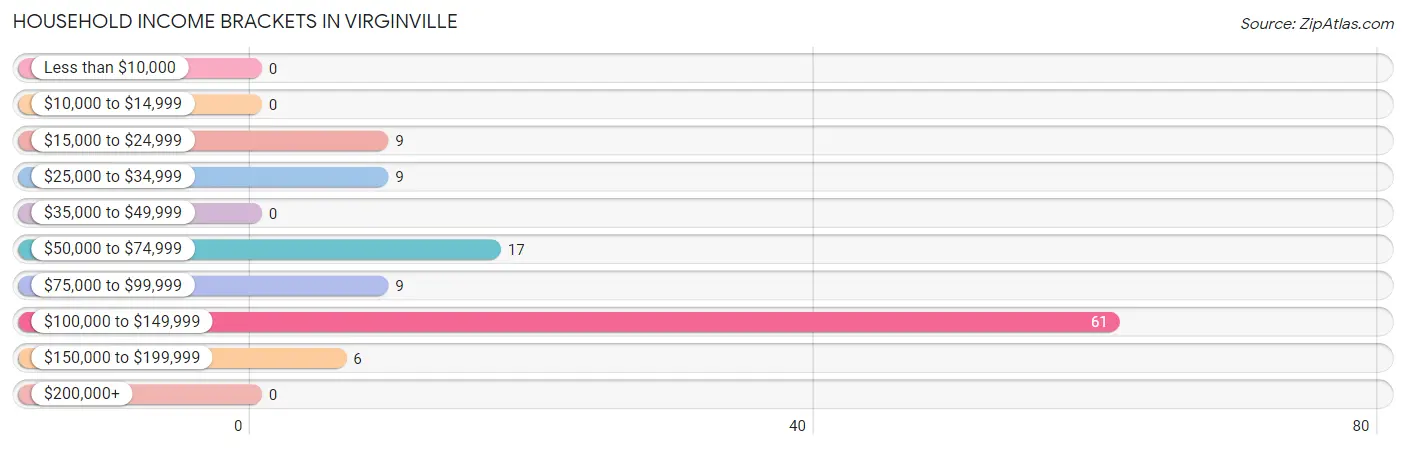
| Income Bracket | # Households | % Households |
| Less than $10,000 | 0 | 0.0% |
| $10,000 to $14,999 | 0 | 0.0% |
| $15,000 to $24,999 | 9 | 8.1% |
| $25,000 to $34,999 | 9 | 8.1% |
| $35,000 to $49,999 | 0 | 0.0% |
| $50,000 to $74,999 | 17 | 15.3% |
| $75,000 to $99,999 | 9 | 8.1% |
| $100,000 to $149,999 | 61 | 55.0% |
| $150,000 to $199,999 | 6 | 5.4% |
| $200,000+ | 0 | 0.0% |
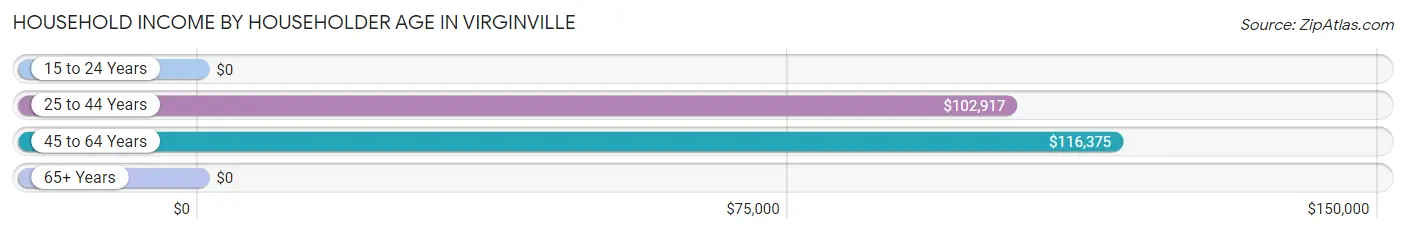
Household Income by Householder Age in Virginville
The median household income in Virginville is $103,565, with the highest median household income of $116,375 found in the 45 to 64 years age bracket for the primary householder. A total of 38 households (34.2%) fall into this category. Meanwhile, the 15 to 24 years age bracket for the primary householder has the lowest median household income of $0, with 10 households (9.0%) in this group.
| Income Bracket | # Households | Median Income |
| 15 to 24 Years | 10 (9.0%) | $0 |
| 25 to 44 Years | 45 (40.5%) | $102,917 |
| 45 to 64 Years | 38 (34.2%) | $116,375 |
| 65+ Years | 18 (16.2%) | $0 |
| Total | 111 (100.0%) | $103,565 |
Poverty in Virginville
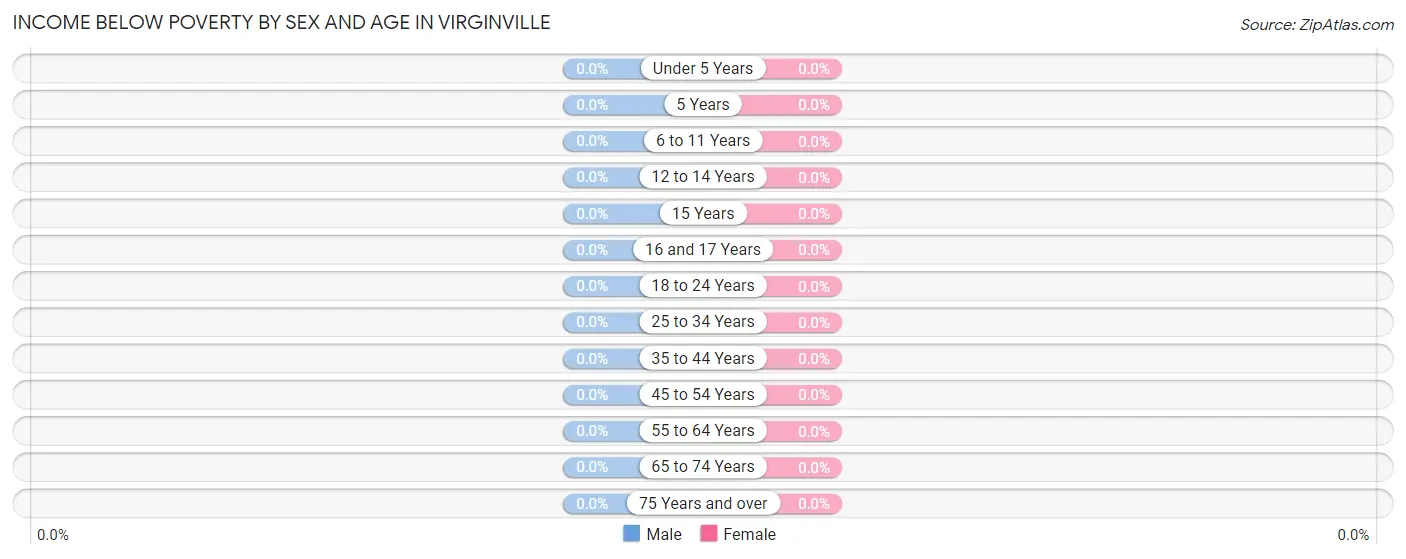
Income Below Poverty by Sex and Age in Virginville
| Age Bracket | Male | Female |
| Under 5 Years | 0 (0.0%) | 0 (0.0%) |
| 5 Years | 0 (0.0%) | 0 (0.0%) |
| 6 to 11 Years | 0 (0.0%) | 0 (0.0%) |
| 12 to 14 Years | 0 (0.0%) | 0 (0.0%) |
| 15 Years | 0 (0.0%) | 0 (0.0%) |
| 16 and 17 Years | 0 (0.0%) | 0 (0.0%) |
| 18 to 24 Years | 0 (0.0%) | 0 (0.0%) |
| 25 to 34 Years | 0 (0.0%) | 0 (0.0%) |
| 35 to 44 Years | 0 (0.0%) | 0 (0.0%) |
| 45 to 54 Years | 0 (0.0%) | 0 (0.0%) |
| 55 to 64 Years | 0 (0.0%) | 0 (0.0%) |
| 65 to 74 Years | 0 (0.0%) | 0 (0.0%) |
| 75 Years and over | 0 (0.0%) | 0 (0.0%) |
| Total | 0 (0.0%) | 0 (0.0%) |
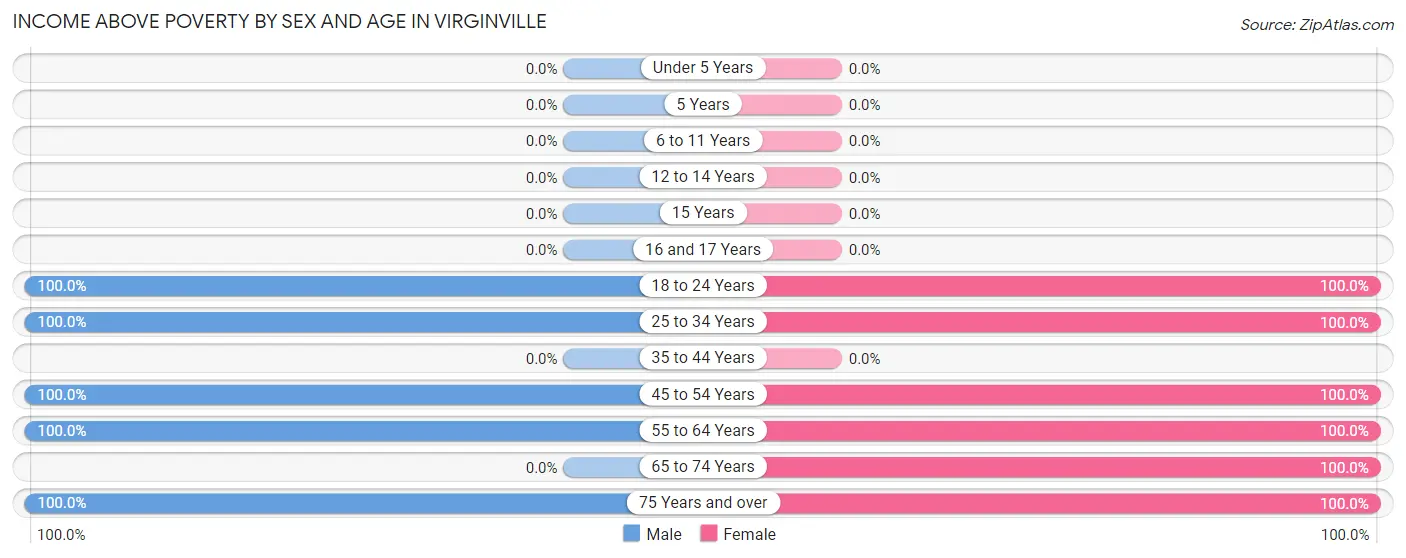
Income Above Poverty by Sex and Age in Virginville
According to the poverty statistics in Virginville, males aged 18 to 24 years and females aged 18 to 24 years are the age groups that are most secure financially, with 100.0% of males and 100.0% of females in these age groups living above the poverty line.
| Age Bracket | Male | Female |
| Under 5 Years | 0 (0.0%) | 0 (0.0%) |
| 5 Years | 0 (0.0%) | 0 (0.0%) |
| 6 to 11 Years | 0 (0.0%) | 0 (0.0%) |
| 12 to 14 Years | 0 (0.0%) | 0 (0.0%) |
| 15 Years | 0 (0.0%) | 0 (0.0%) |
| 16 and 17 Years | 0 (0.0%) | 0 (0.0%) |
| 18 to 24 Years | 7 (100.0%) | 52 (100.0%) |
| 25 to 34 Years | 54 (100.0%) | 18 (100.0%) |
| 35 to 44 Years | 0 (0.0%) | 0 (0.0%) |
| 45 to 54 Years | 26 (100.0%) | 28 (100.0%) |
| 55 to 64 Years | 13 (100.0%) | 12 (100.0%) |
| 65 to 74 Years | 0 (0.0%) | 9 (100.0%) |
| 75 Years and over | 9 (100.0%) | 10 (100.0%) |
| Total | 109 (100.0%) | 129 (100.0%) |
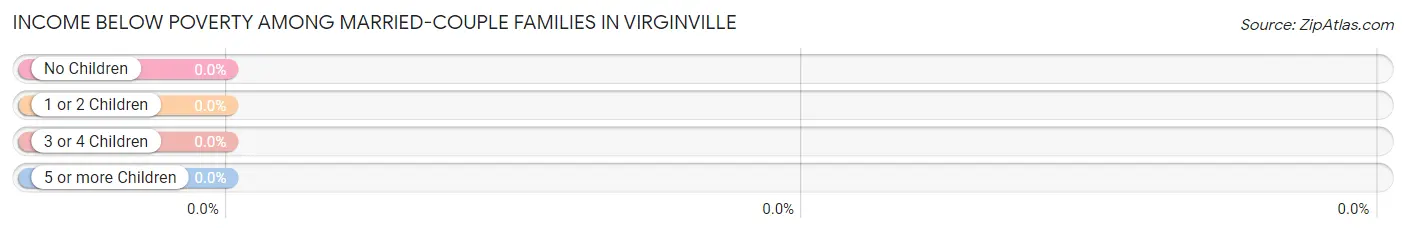
Income Below Poverty Among Married-Couple Families in Virginville
| Children | Above Poverty | Below Poverty |
| No Children | 56 (100.0%) | 0 (0.0%) |
| 1 or 2 Children | 0 (0.0%) | 0 (0.0%) |
| 3 or 4 Children | 0 (0.0%) | 0 (0.0%) |
| 5 or more Children | 0 (0.0%) | 0 (0.0%) |
| Total | 56 (100.0%) | 0 (0.0%) |
Income Below Poverty Among Single-Parent Households in Virginville
| Children | Single Father | Single Mother |
| No Children | 0 (0.0%) | 0 (0.0%) |
| 1 or 2 Children | 0 (0.0%) | 0 (0.0%) |
| 3 or 4 Children | 0 (0.0%) | 0 (0.0%) |
| 5 or more Children | 0 (0.0%) | 0 (0.0%) |
| Total | 0 (0.0%) | 0 (0.0%) |
Income Below Poverty Among Married-Couple vs Single-Parent Households in Virginville
| Children | Married-Couple Families | Single-Parent Households |
| No Children | 0 (0.0%) | 0 (0.0%) |
| 1 or 2 Children | 0 (0.0%) | 0 (0.0%) |
| 3 or 4 Children | 0 (0.0%) | 0 (0.0%) |
| 5 or more Children | 0 (0.0%) | 0 (0.0%) |
| Total | 0 (0.0%) | 0 (0.0%) |
Race in Virginville
The most populous races in Virginville are , and White / Caucasian (238 | 100.0%).
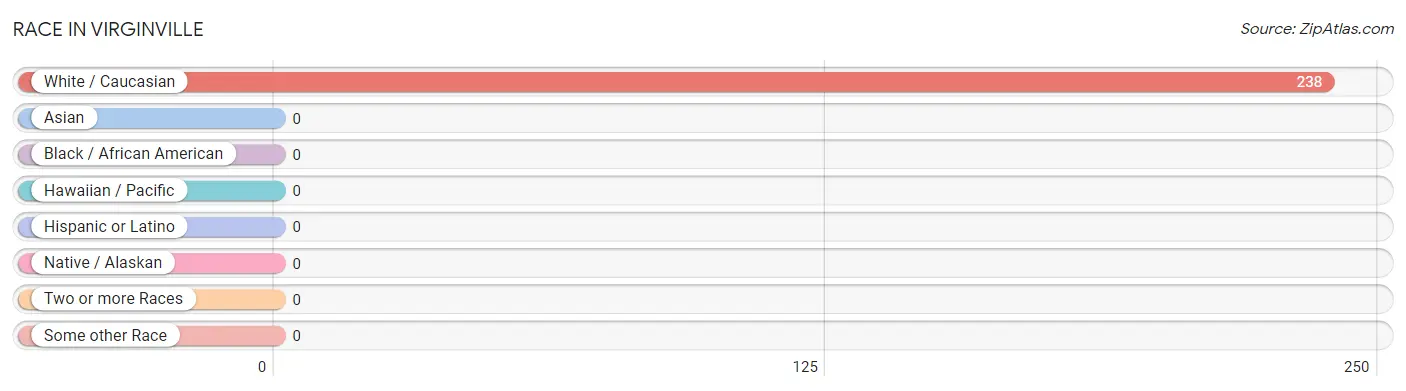
| Race | # Population | % Population |
| Asian | 0 | 0.0% |
| Black / African American | 0 | 0.0% |
| Hawaiian / Pacific | 0 | 0.0% |
| Hispanic or Latino | 0 | 0.0% |
| Native / Alaskan | 0 | 0.0% |
| White / Caucasian | 238 | 100.0% |
| Two or more Races | 0 | 0.0% |
| Some other Race | 0 | 0.0% |
| Total | 238 | 100.0% |
Ancestry in Virginville
The most populous ancestries reported in Virginville are Pennsylvania German (90 | 37.8%), German (75 | 31.5%), English (27 | 11.3%), Italian (17 | 7.1%), and Lithuanian (10 | 4.2%), together accounting for 92.0% of all Virginville residents.
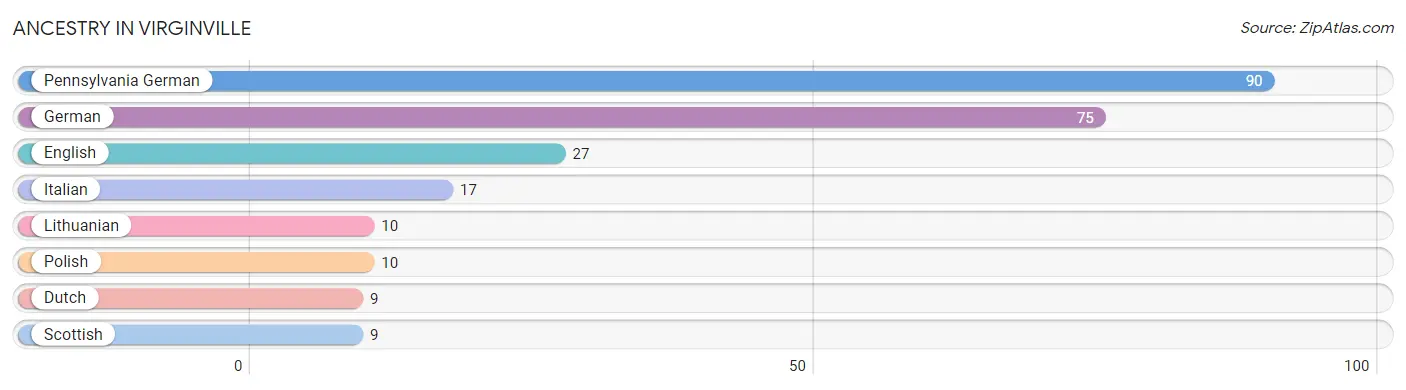
| Ancestry | # Population | % Population |
| Dutch | 9 | 3.8% |
| English | 27 | 11.3% |
| German | 75 | 31.5% |
| Italian | 17 | 7.1% |
| Lithuanian | 10 | 4.2% |
| Pennsylvania German | 90 | 37.8% |
| Polish | 10 | 4.2% |
| Scottish | 9 | 3.8% | View All 8 Rows |
Immigrants in Virginville

| Immigration Origin | # Population | % Population | View All 0 Rows |
Sex and Age in Virginville
Sex and Age in Virginville
The most populous age groups in Virginville are 30 to 34 Years (36 | 33.0%) for men and 20 to 24 Years (32 | 24.8%) for women.
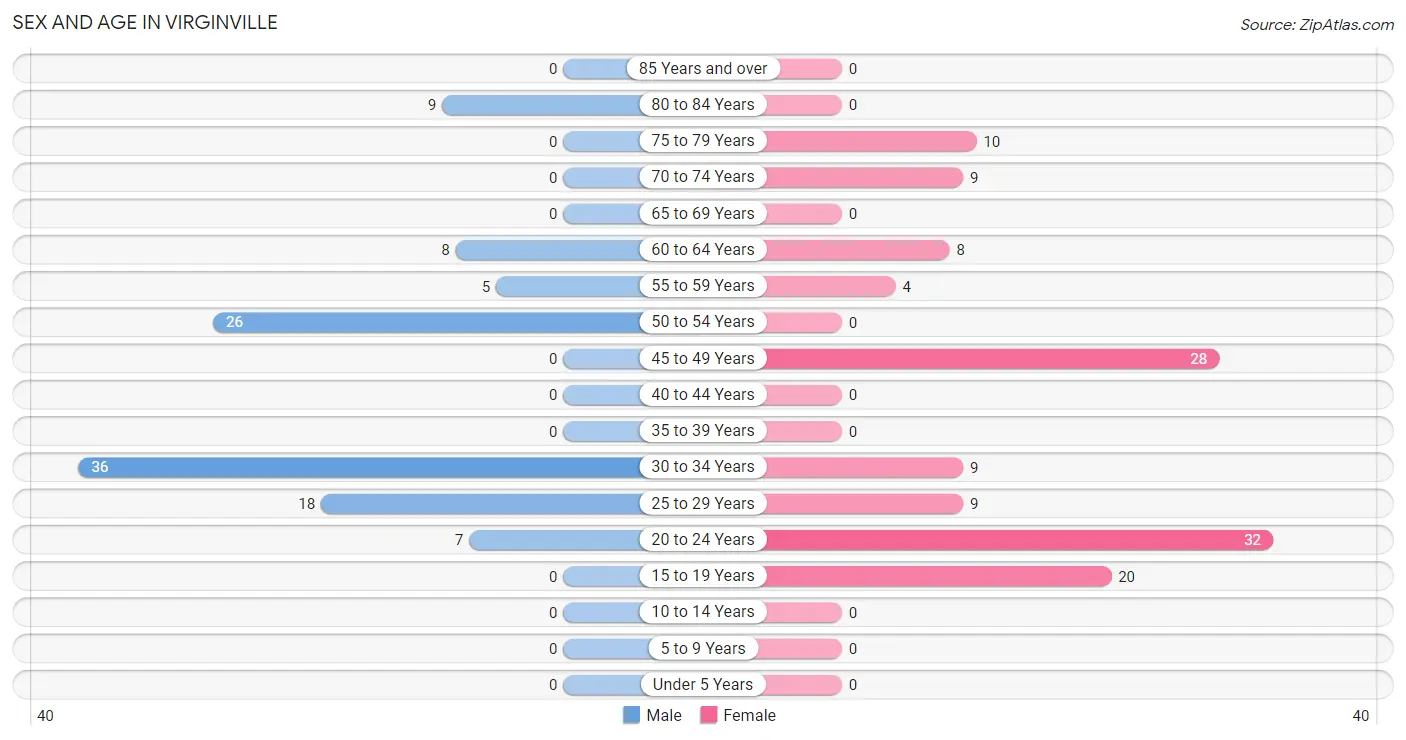
| Age Bracket | Male | Female |
| Under 5 Years | 0 (0.0%) | 0 (0.0%) |
| 5 to 9 Years | 0 (0.0%) | 0 (0.0%) |
| 10 to 14 Years | 0 (0.0%) | 0 (0.0%) |
| 15 to 19 Years | 0 (0.0%) | 20 (15.5%) |
| 20 to 24 Years | 7 (6.4%) | 32 (24.8%) |
| 25 to 29 Years | 18 (16.5%) | 9 (7.0%) |
| 30 to 34 Years | 36 (33.0%) | 9 (7.0%) |
| 35 to 39 Years | 0 (0.0%) | 0 (0.0%) |
| 40 to 44 Years | 0 (0.0%) | 0 (0.0%) |
| 45 to 49 Years | 0 (0.0%) | 28 (21.7%) |
| 50 to 54 Years | 26 (23.8%) | 0 (0.0%) |
| 55 to 59 Years | 5 (4.6%) | 4 (3.1%) |
| 60 to 64 Years | 8 (7.3%) | 8 (6.2%) |
| 65 to 69 Years | 0 (0.0%) | 0 (0.0%) |
| 70 to 74 Years | 0 (0.0%) | 9 (7.0%) |
| 75 to 79 Years | 0 (0.0%) | 10 (7.7%) |
| 80 to 84 Years | 9 (8.3%) | 0 (0.0%) |
| 85 Years and over | 0 (0.0%) | 0 (0.0%) |
| Total | 109 (100.0%) | 129 (100.0%) |
Families and Households in Virginville
Median Family Size in Virginville
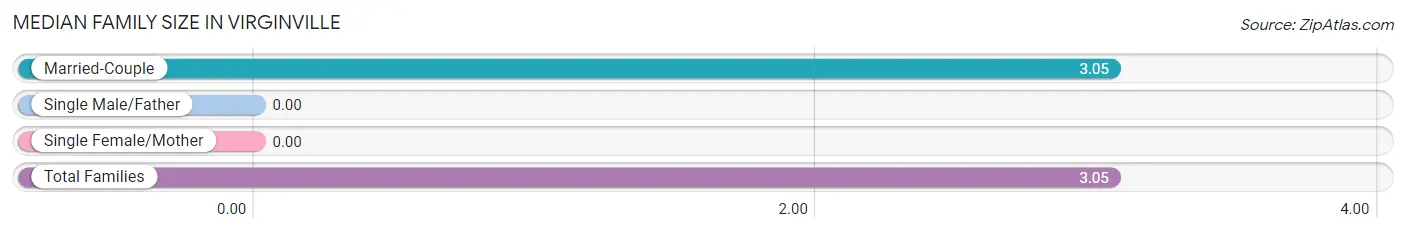
| Family Type | # Families | Family Size |
| Married-Couple | 56 (100.0%) | 3.05 |
| Single Male/Father | 0 (0.0%) | - |
| Single Female/Mother | 0 (0.0%) | - |
| Total Families | 56 (100.0%) | 3.05 |
Median Household Size in Virginville
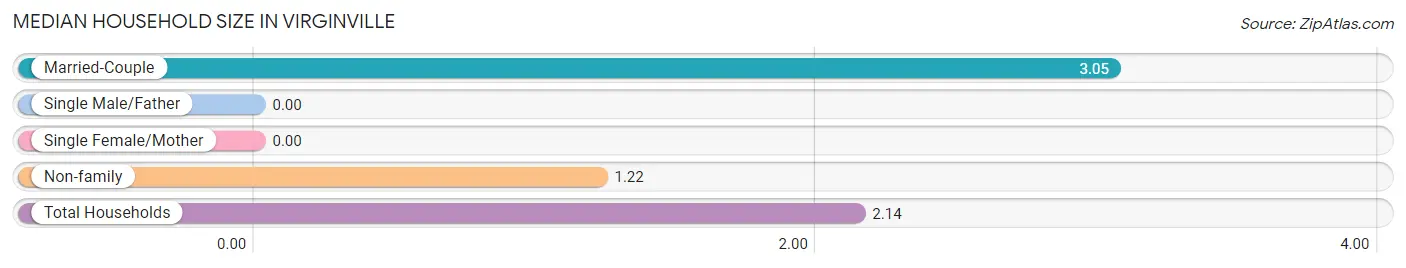
| Household Type | # Households | Household Size |
| Married-Couple | 56 (50.4%) | 3.05 |
| Single Male/Father | 0 (0.0%) | - |
| Single Female/Mother | 0 (0.0%) | - |
| Non-family | 55 (49.5%) | 1.22 |
| Total Households | 111 (100.0%) | 2.14 |
Household Size by Marriage Status in Virginville
Out of a total of 111 households in Virginville, 56 (50.4%) are family households, while 55 (49.5%) are nonfamily households. The most numerous type of family households are 2-person households, comprising 26, and the most common type of nonfamily households are 1-person households, comprising 45.
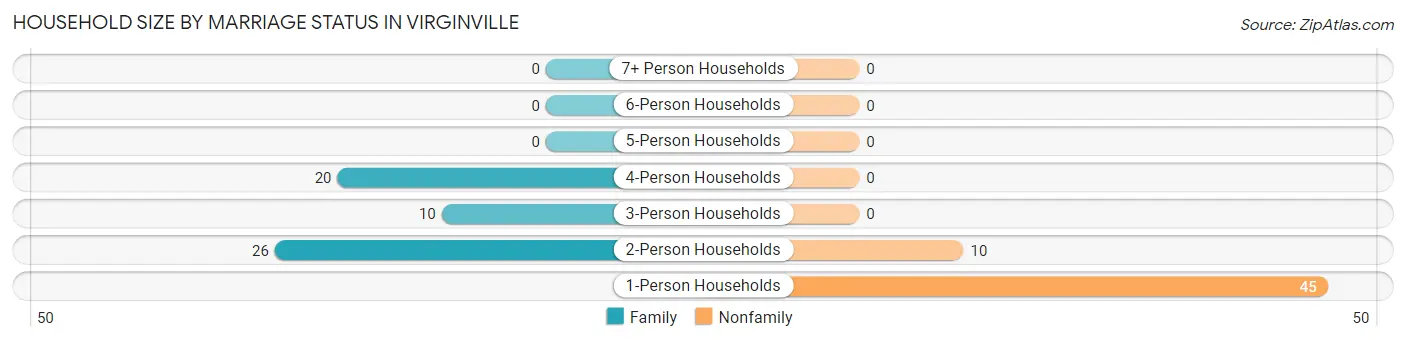
| Household Size | Family Households | Nonfamily Households |
| 1-Person Households | - | 45 (40.5%) |
| 2-Person Households | 26 (23.4%) | 10 (9.0%) |
| 3-Person Households | 10 (9.0%) | 0 (0.0%) |
| 4-Person Households | 20 (18.0%) | 0 (0.0%) |
| 5-Person Households | 0 (0.0%) | 0 (0.0%) |
| 6-Person Households | 0 (0.0%) | 0 (0.0%) |
| 7+ Person Households | 0 (0.0%) | 0 (0.0%) |
| Total | 56 (50.4%) | 55 (49.5%) |
Female Fertility in Virginville
Fertility by Age in Virginville
| Age Bracket | Women with Births | Births / 1,000 Women |
| 15 to 19 years | 0 (0.0%) | 0.0 |
| 20 to 34 years | 0 (0.0%) | 0.0 |
| 35 to 50 years | 0 (0.0%) | 0.0 |
| Total | 0 (0.0%) | 0.0 |
Fertility by Age by Marriage Status in Virginville
| Age Bracket | Married | Unmarried |
| 15 to 19 years | 0 (0.0%) | 0 (0.0%) |
| 20 to 34 years | 0 (0.0%) | 0 (0.0%) |
| 35 to 50 years | 0 (0.0%) | 0 (0.0%) |
| Total | 0 (0.0%) | 0 (0.0%) |
Fertility by Education in Virginville
| Educational Attainment | Women with Births | Births / 1,000 Women |
| Less than High School | 0 (0.0%) | 0.0 |
| High School Diploma | 0 (0.0%) | 0.0 |
| College or Associate's Degree | 0 (0.0%) | 0.0 |
| Bachelor's Degree | 0 (0.0%) | 0.0 |
| Graduate Degree | 0 (0.0%) | 0.0 |
| Total | 0 (0.0%) | 0.0 |
Fertility by Education by Marriage Status in Virginville
| Educational Attainment | Married | Unmarried |
| Less than High School | 0 (0.0%) | 0 (0.0%) |
| High School Diploma | 0 (0.0%) | 0 (0.0%) |
| College or Associate's Degree | 0 (0.0%) | 0 (0.0%) |
| Bachelor's Degree | 0 (0.0%) | 0 (0.0%) |
| Graduate Degree | 0 (0.0%) | 0 (0.0%) |
| Total | 0 (0.0%) | 0 (0.0%) |
Employment Characteristics in Virginville
Employment by Class of Employer in Virginville
Among the 195 employed individuals in Virginville, private company employees (127 | 65.1%), state government employees (48 | 24.6%), and self-employed (not incorporated) (20 | 10.3%) make up the most common classes of employment.
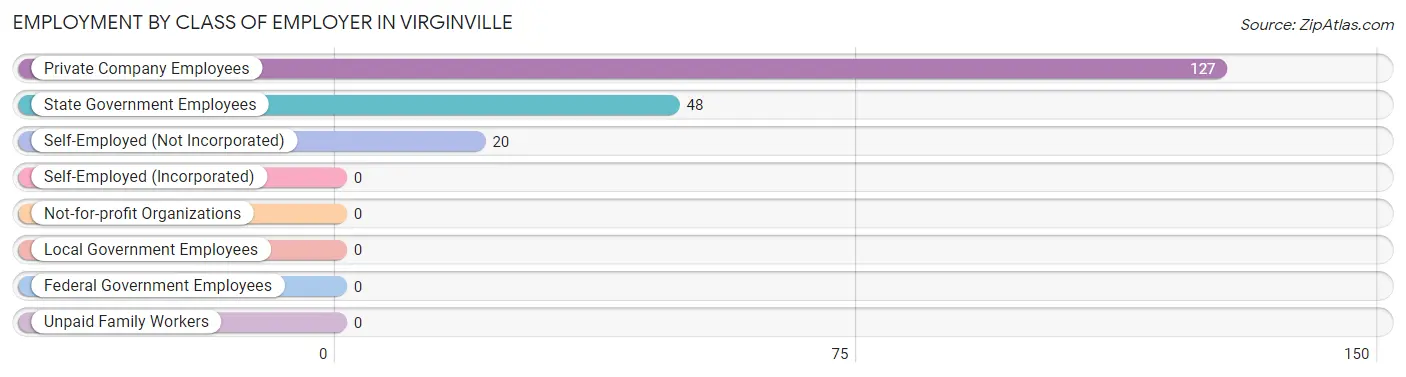
| Employer Class | # Employees | % Employees |
| Private Company Employees | 127 | 65.1% |
| Self-Employed (Incorporated) | 0 | 0.0% |
| Self-Employed (Not Incorporated) | 20 | 10.3% |
| Not-for-profit Organizations | 0 | 0.0% |
| Local Government Employees | 0 | 0.0% |
| State Government Employees | 48 | 24.6% |
| Federal Government Employees | 0 | 0.0% |
| Unpaid Family Workers | 0 | 0.0% |
| Total | 195 | 100.0% |
Employment Status by Age in Virginville
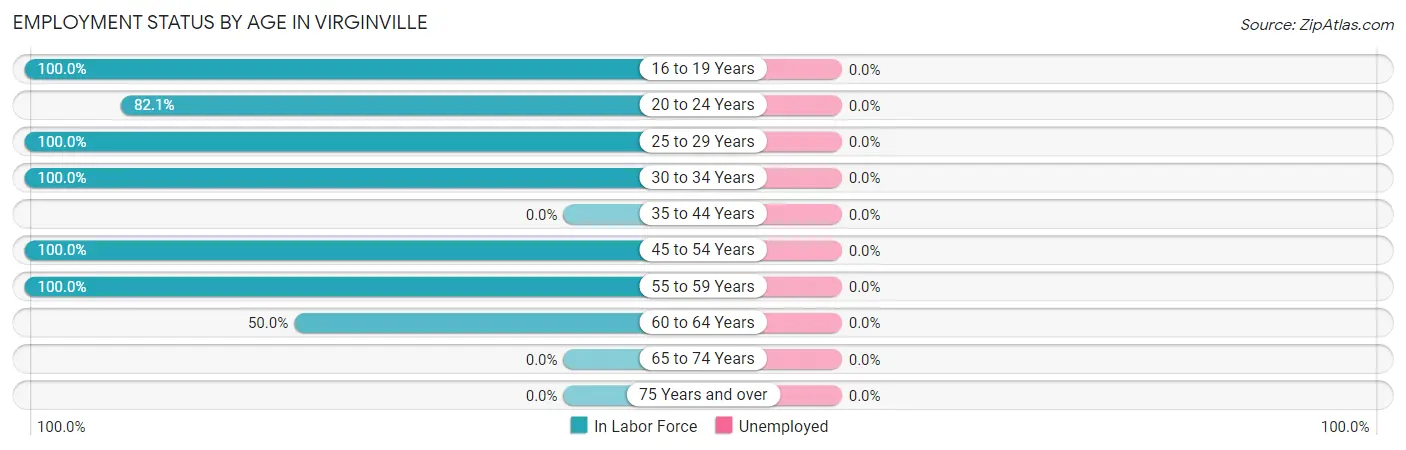
| Age Bracket | In Labor Force | Unemployed |
| 16 to 19 Years | 20 (100.0%) | 0 (0.0%) |
| 20 to 24 Years | 32 (82.1%) | 0 (0.0%) |
| 25 to 29 Years | 27 (100.0%) | 0 (0.0%) |
| 30 to 34 Years | 45 (100.0%) | 0 (0.0%) |
| 35 to 44 Years | 0 (0.0%) | 0 (0.0%) |
| 45 to 54 Years | 54 (100.0%) | 0 (0.0%) |
| 55 to 59 Years | 9 (100.0%) | 0 (0.0%) |
| 60 to 64 Years | 8 (50.0%) | 0 (0.0%) |
| 65 to 74 Years | 0 (0.0%) | 0 (0.0%) |
| 75 Years and over | 0 (0.0%) | 0 (0.0%) |
| Total | 195 (81.9%) | 0 (0.0%) |
Employment Status by Educational Attainment in Virginville
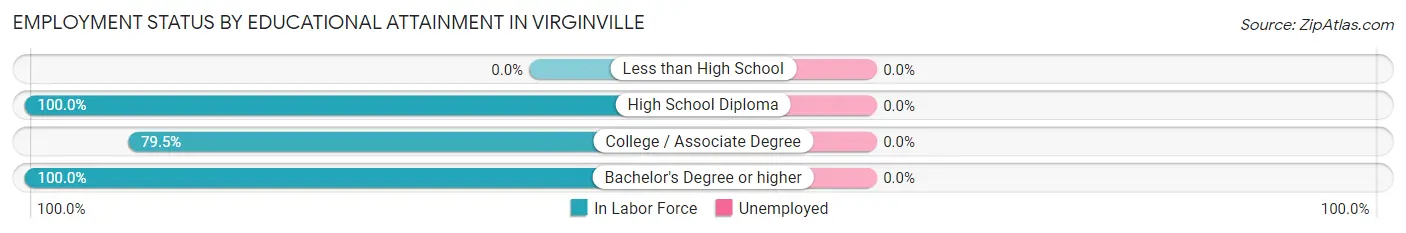
| Educational Attainment | In Labor Force | Unemployed |
| Less than High School | 0 (0.0%) | 0 (0.0%) |
| High School Diploma | 79 (100.0%) | 0 (0.0%) |
| College / Associate Degree | 31 (79.5%) | 0 (0.0%) |
| Bachelor's Degree or higher | 33 (100.0%) | 0 (0.0%) |
| Total | 143 (94.7%) | 0 (0.0%) |
Employment Occupations by Sex in Virginville
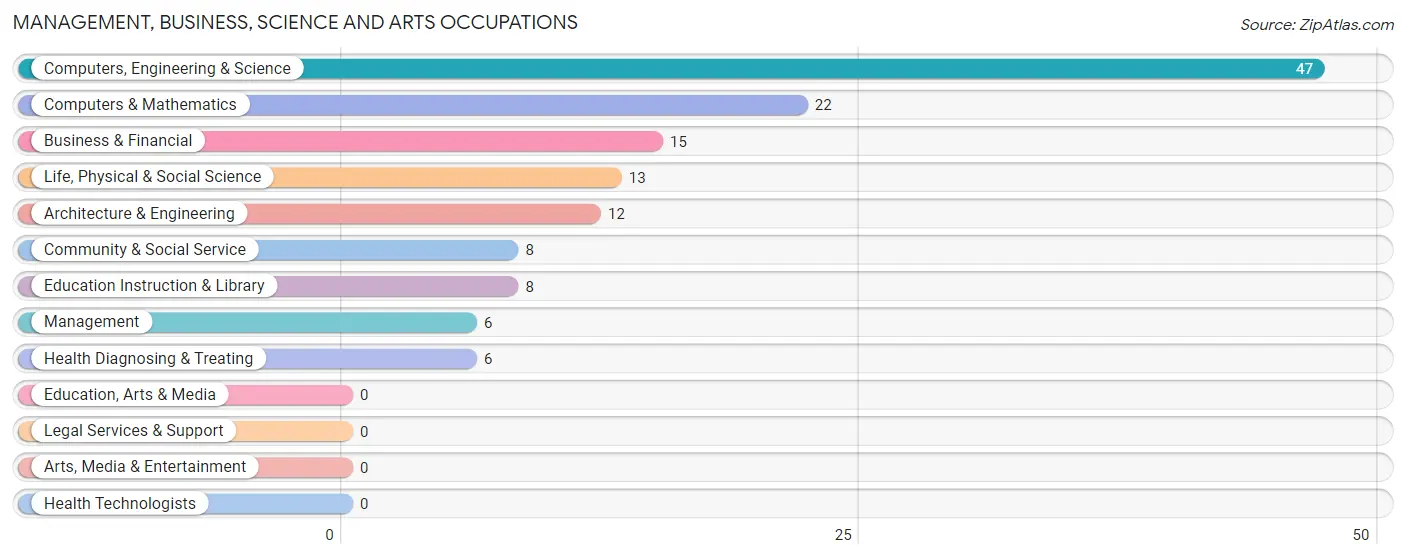
Management, Business, Science and Arts Occupations
The most common Management, Business, Science and Arts occupations in Virginville are Computers, Engineering & Science (47 | 24.1%), Computers & Mathematics (22 | 11.3%), Business & Financial (15 | 7.7%), Life, Physical & Social Science (13 | 6.7%), and Architecture & Engineering (12 | 6.1%).
Management, Business, Science and Arts Occupations by Sex
Within the Management, Business, Science and Arts occupations in Virginville, the most male-oriented occupations are Management (100.0%), Architecture & Engineering (100.0%), and Life, Physical & Social Science (69.2%), while the most female-oriented occupations are Computers & Mathematics (100.0%), Community & Social Service (100.0%), and Education Instruction & Library (100.0%).
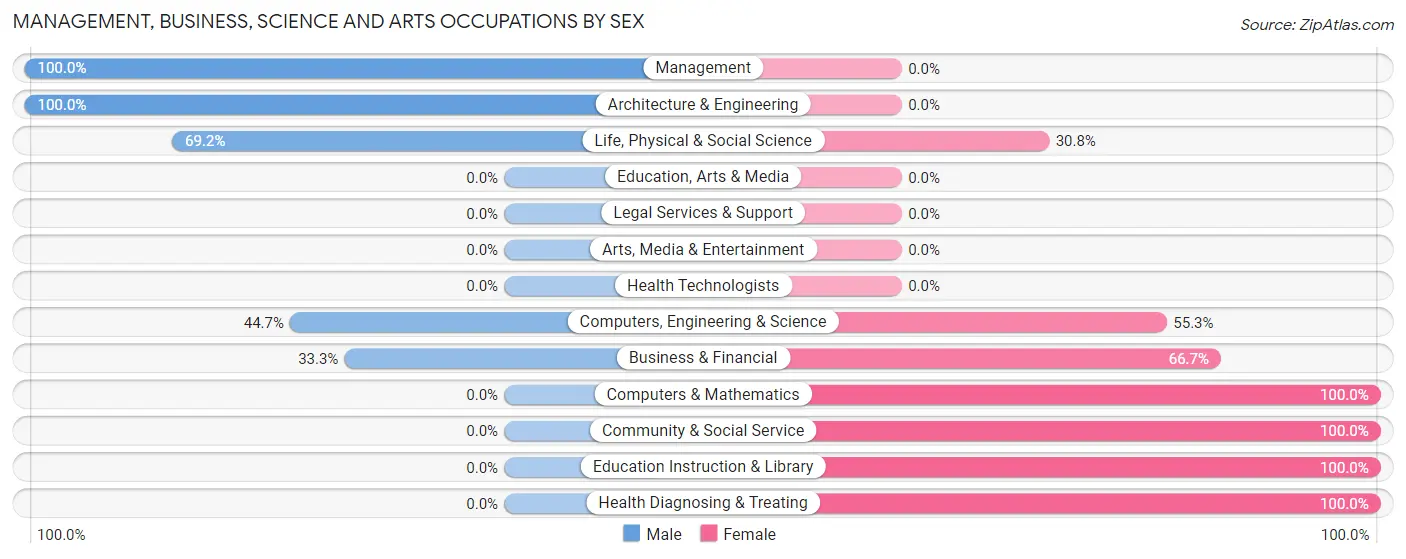
| Occupation | Male | Female |
| Management | 6 (100.0%) | 0 (0.0%) |
| Business & Financial | 5 (33.3%) | 10 (66.7%) |
| Computers, Engineering & Science | 21 (44.7%) | 26 (55.3%) |
| Computers & Mathematics | 0 (0.0%) | 22 (100.0%) |
| Architecture & Engineering | 12 (100.0%) | 0 (0.0%) |
| Life, Physical & Social Science | 9 (69.2%) | 4 (30.8%) |
| Community & Social Service | 0 (0.0%) | 8 (100.0%) |
| Education, Arts & Media | 0 (0.0%) | 0 (0.0%) |
| Legal Services & Support | 0 (0.0%) | 0 (0.0%) |
| Education Instruction & Library | 0 (0.0%) | 8 (100.0%) |
| Arts, Media & Entertainment | 0 (0.0%) | 0 (0.0%) |
| Health Diagnosing & Treating | 0 (0.0%) | 6 (100.0%) |
| Health Technologists | 0 (0.0%) | 0 (0.0%) |
| Total (Category) | 32 (39.0%) | 50 (61.0%) |
| Total (Overall) | 85 (43.6%) | 110 (56.4%) |
Services Occupations
The most common Services occupations in Virginville are , and Food Preparation & Serving (6 | 3.1%).
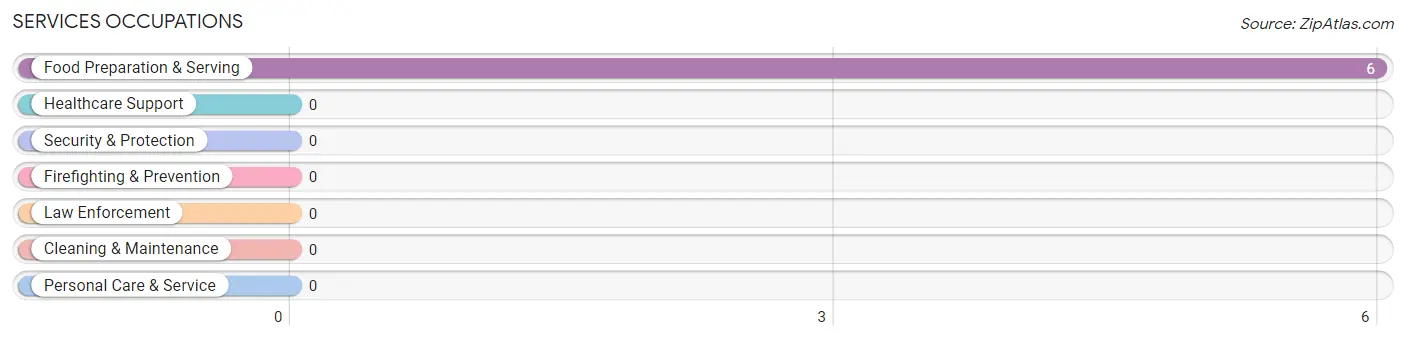
Services Occupations by Sex
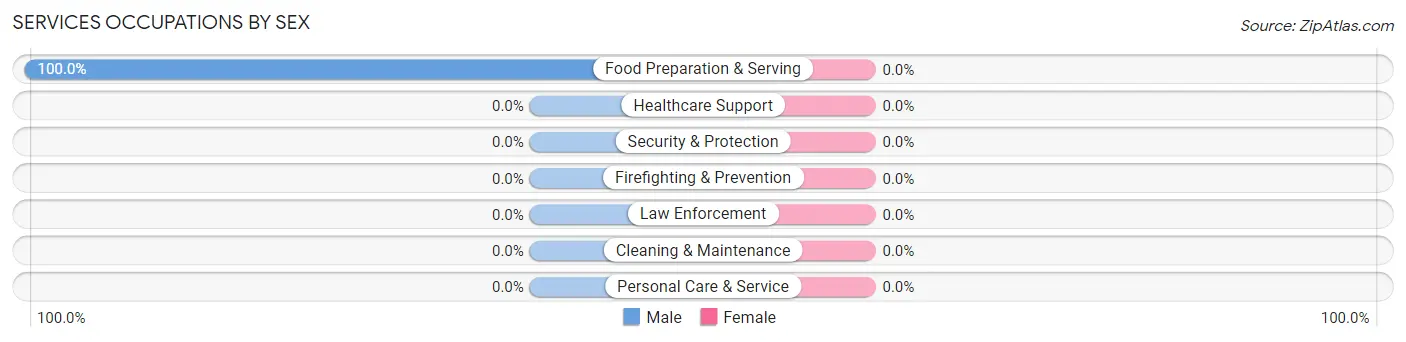
| Occupation | Male | Female |
| Healthcare Support | 0 (0.0%) | 0 (0.0%) |
| Security & Protection | 0 (0.0%) | 0 (0.0%) |
| Firefighting & Prevention | 0 (0.0%) | 0 (0.0%) |
| Law Enforcement | 0 (0.0%) | 0 (0.0%) |
| Food Preparation & Serving | 6 (100.0%) | 0 (0.0%) |
| Cleaning & Maintenance | 0 (0.0%) | 0 (0.0%) |
| Personal Care & Service | 0 (0.0%) | 0 (0.0%) |
| Total (Category) | 6 (100.0%) | 0 (0.0%) |
| Total (Overall) | 85 (43.6%) | 110 (56.4%) |
Sales and Office Occupations
The most common Sales and Office occupations in Virginville are Sales & Related (51 | 26.2%), and Office & Administration (9 | 4.6%).
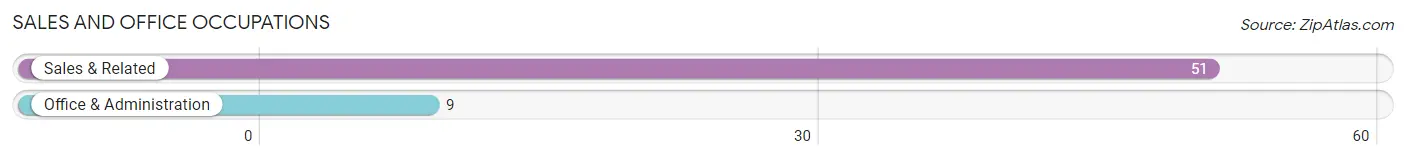
Sales and Office Occupations by Sex
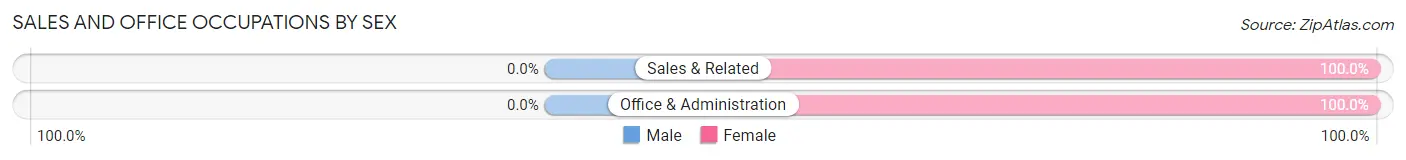
| Occupation | Male | Female |
| Sales & Related | 0 (0.0%) | 51 (100.0%) |
| Office & Administration | 0 (0.0%) | 9 (100.0%) |
| Total (Category) | 0 (0.0%) | 60 (100.0%) |
| Total (Overall) | 85 (43.6%) | 110 (56.4%) |
Natural Resources, Construction and Maintenance Occupations
The most common Natural Resources, Construction and Maintenance occupations in Virginville are , and Installation, Maintenance & Repair (20 | 10.3%).
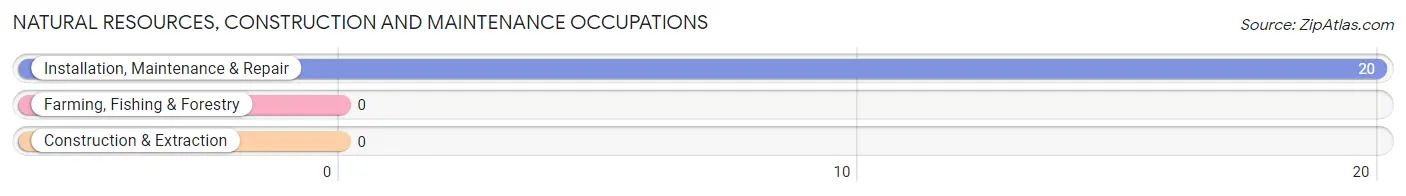
Natural Resources, Construction and Maintenance Occupations by Sex
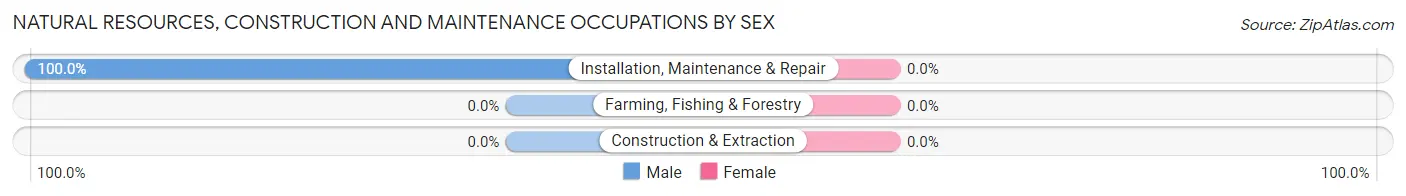
| Occupation | Male | Female |
| Farming, Fishing & Forestry | 0 (0.0%) | 0 (0.0%) |
| Construction & Extraction | 0 (0.0%) | 0 (0.0%) |
| Installation, Maintenance & Repair | 20 (100.0%) | 0 (0.0%) |
| Total (Category) | 20 (100.0%) | 0 (0.0%) |
| Total (Overall) | 85 (43.6%) | 110 (56.4%) |
Production, Transportation and Moving Occupations
The most common Production, Transportation and Moving occupations in Virginville are , and Production (27 | 13.9%).
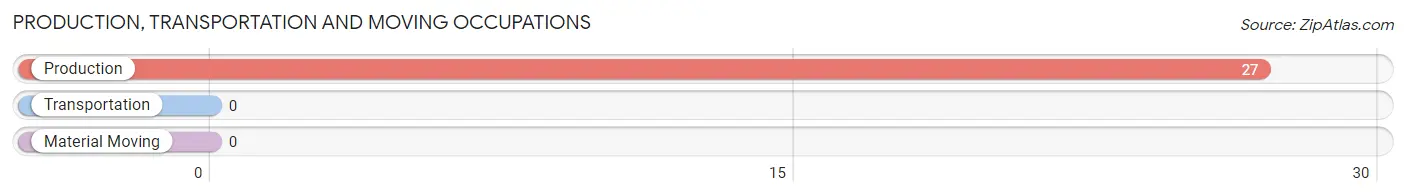
Production, Transportation and Moving Occupations by Sex
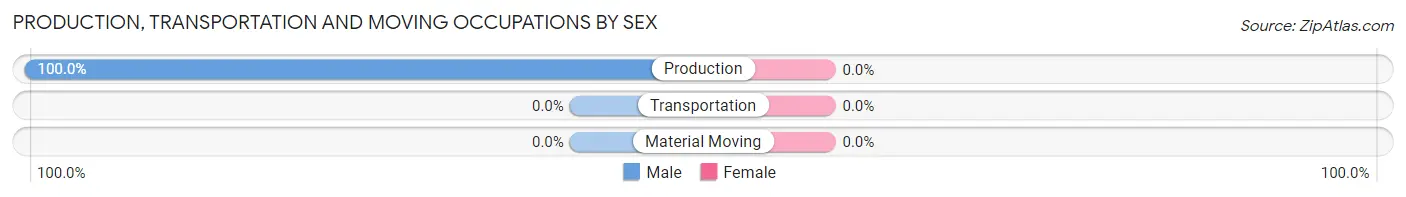
| Occupation | Male | Female |
| Production | 27 (100.0%) | 0 (0.0%) |
| Transportation | 0 (0.0%) | 0 (0.0%) |
| Material Moving | 0 (0.0%) | 0 (0.0%) |
| Total (Category) | 27 (100.0%) | 0 (0.0%) |
| Total (Overall) | 85 (43.6%) | 110 (56.4%) |
Employment Industries by Sex in Virginville
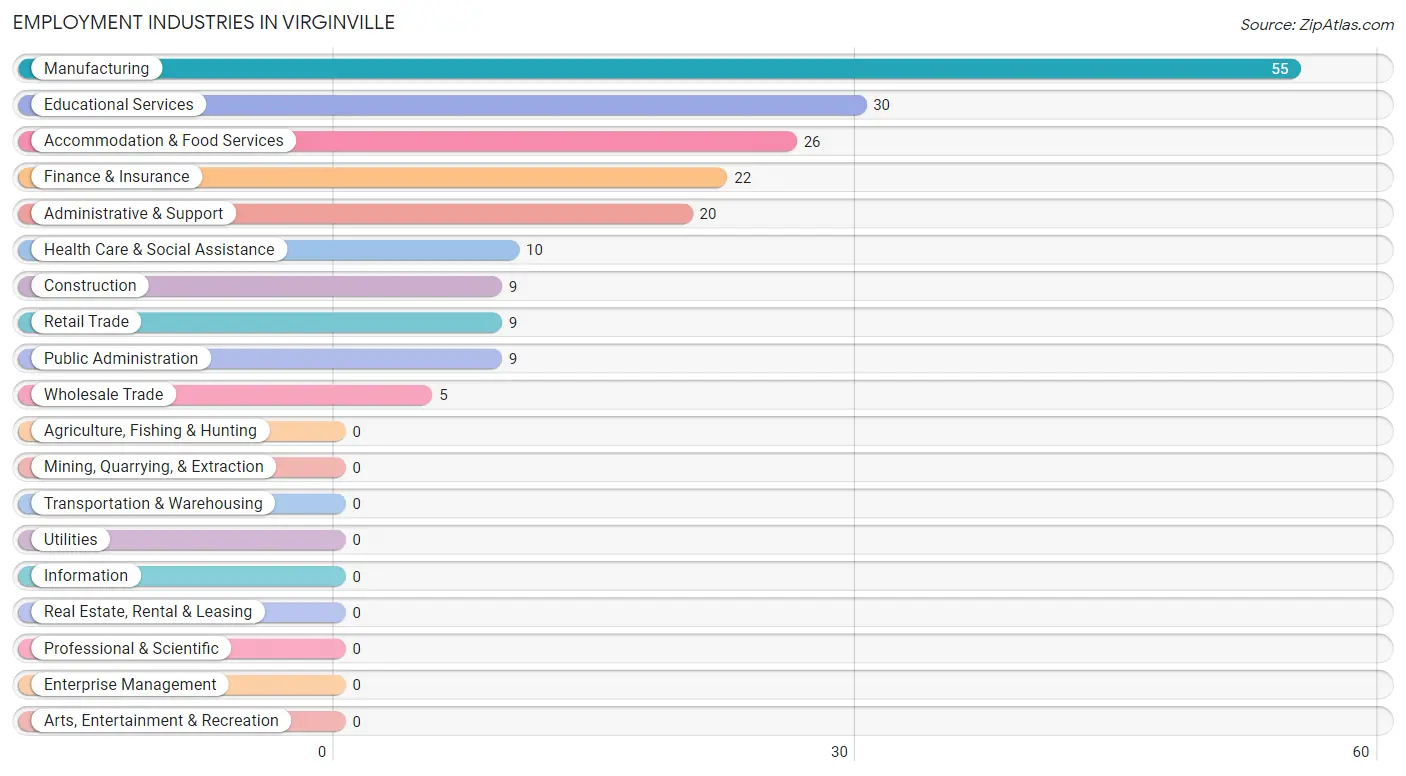
Employment Industries in Virginville
The major employment industries in Virginville include Manufacturing (55 | 28.2%), Educational Services (30 | 15.4%), Accommodation & Food Services (26 | 13.3%), Finance & Insurance (22 | 11.3%), and Administrative & Support (20 | 10.3%).
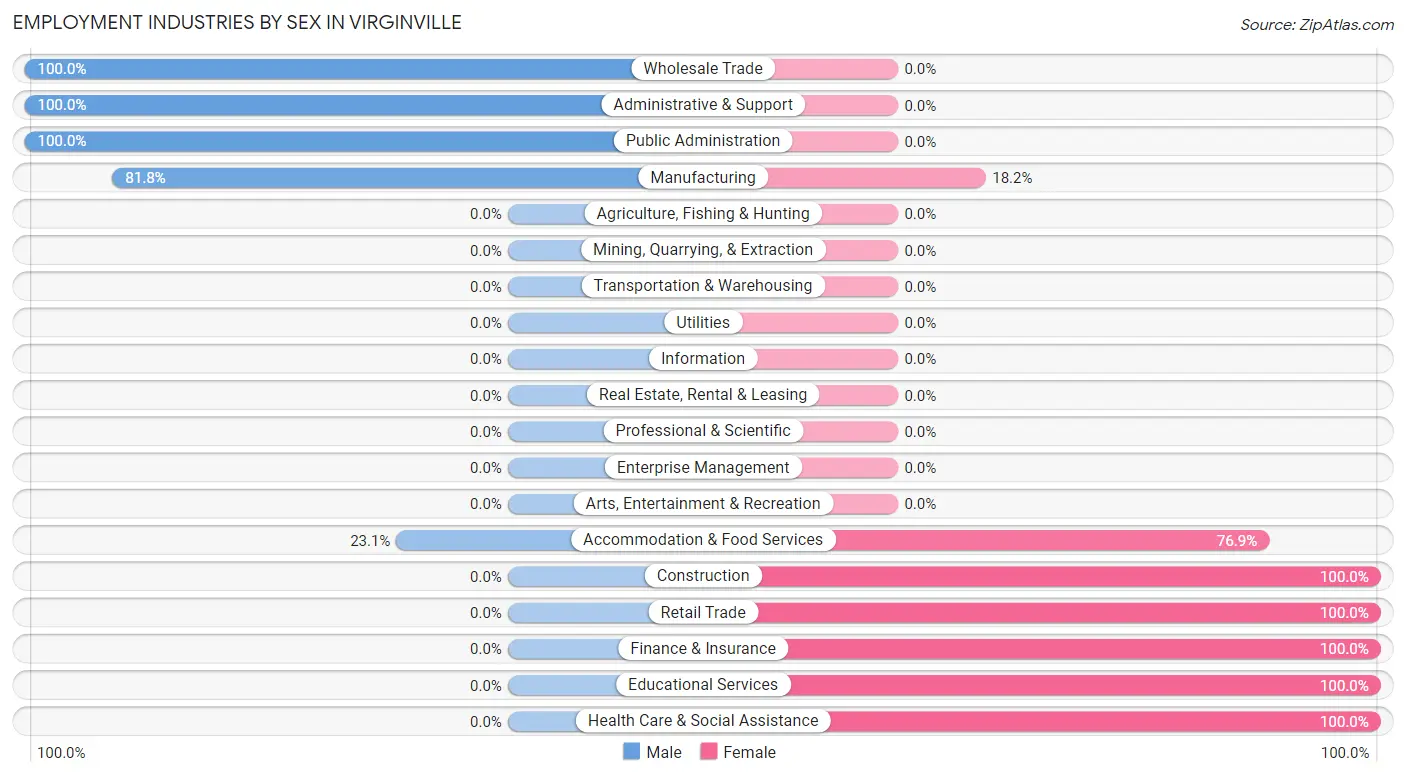
Employment Industries by Sex in Virginville
The Virginville industries that see more men than women are Wholesale Trade (100.0%), Administrative & Support (100.0%), and Public Administration (100.0%), whereas the industries that tend to have a higher number of women are Construction (100.0%), Retail Trade (100.0%), and Finance & Insurance (100.0%).
| Industry | Male | Female |
| Agriculture, Fishing & Hunting | 0 (0.0%) | 0 (0.0%) |
| Mining, Quarrying, & Extraction | 0 (0.0%) | 0 (0.0%) |
| Construction | 0 (0.0%) | 9 (100.0%) |
| Manufacturing | 45 (81.8%) | 10 (18.2%) |
| Wholesale Trade | 5 (100.0%) | 0 (0.0%) |
| Retail Trade | 0 (0.0%) | 9 (100.0%) |
| Transportation & Warehousing | 0 (0.0%) | 0 (0.0%) |
| Utilities | 0 (0.0%) | 0 (0.0%) |
| Information | 0 (0.0%) | 0 (0.0%) |
| Finance & Insurance | 0 (0.0%) | 22 (100.0%) |
| Real Estate, Rental & Leasing | 0 (0.0%) | 0 (0.0%) |
| Professional & Scientific | 0 (0.0%) | 0 (0.0%) |
| Enterprise Management | 0 (0.0%) | 0 (0.0%) |
| Administrative & Support | 20 (100.0%) | 0 (0.0%) |
| Educational Services | 0 (0.0%) | 30 (100.0%) |
| Health Care & Social Assistance | 0 (0.0%) | 10 (100.0%) |
| Arts, Entertainment & Recreation | 0 (0.0%) | 0 (0.0%) |
| Accommodation & Food Services | 6 (23.1%) | 20 (76.9%) |
| Public Administration | 9 (100.0%) | 0 (0.0%) |
| Total | 85 (43.6%) | 110 (56.4%) |
Education in Virginville
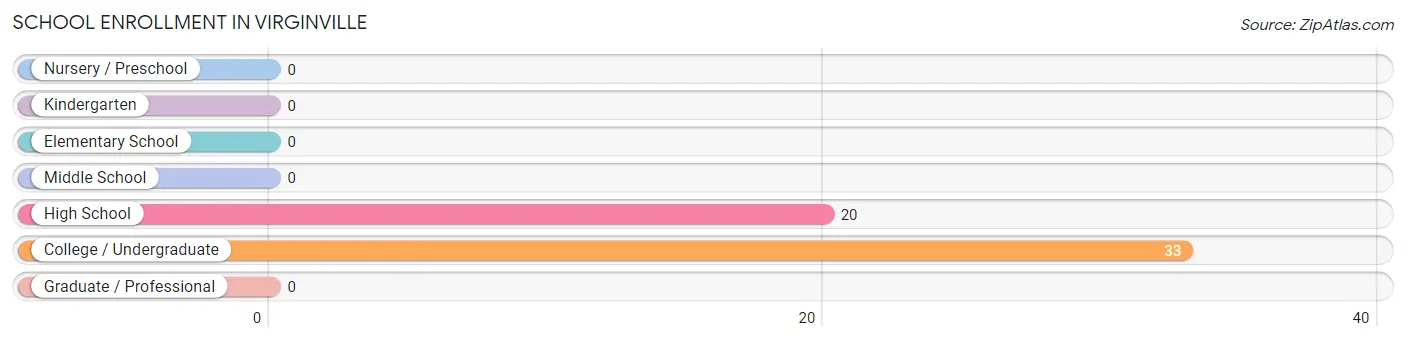
School Enrollment in Virginville
The most common levels of schooling among the 53 students in Virginville are college / undergraduate (33 | 62.3%), and high school (20 | 37.7%).
| School Level | # Students | % Students |
| Nursery / Preschool | 0 | 0.0% |
| Kindergarten | 0 | 0.0% |
| Elementary School | 0 | 0.0% |
| Middle School | 0 | 0.0% |
| High School | 20 | 37.7% |
| College / Undergraduate | 33 | 62.3% |
| Graduate / Professional | 0 | 0.0% |
| Total | 53 | 100.0% |
School Enrollment by Age by Funding Source in Virginville
Out of a total of 53 students who are enrolled in schools in Virginville, 4 (7.5%) attend a private institution, while the remaining 49 (92.5%) are enrolled in public schools. The age group of 35 years and over has the highest likelihood of being enrolled in private schools, with 4 (100.0% in the age bracket) enrolled. Conversely, the age group of 18 to 19 year olds has the lowest likelihood of being enrolled in a private school, with 20 (100.0% in the age bracket) attending a public institution.
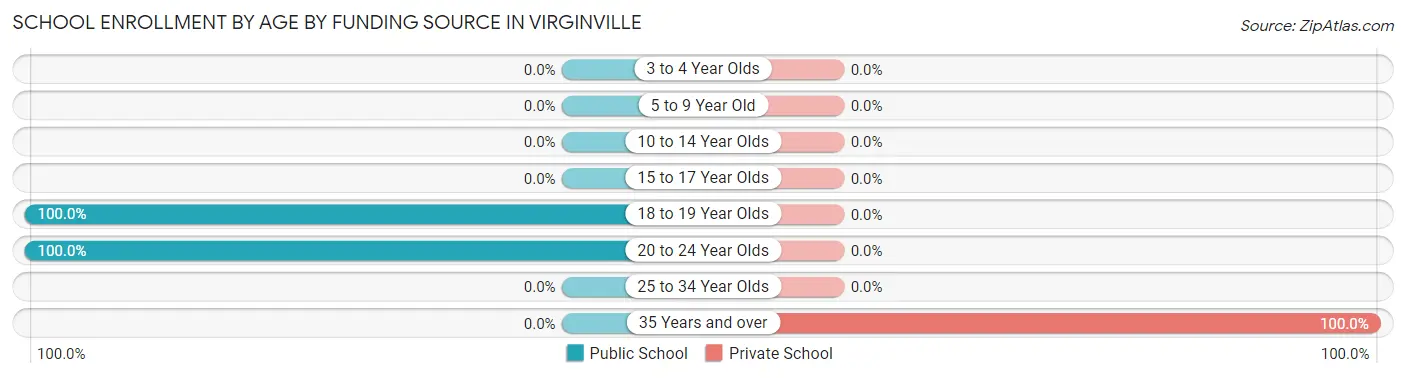
| Age Bracket | Public School | Private School |
| 3 to 4 Year Olds | 0 (0.0%) | 0 (0.0%) |
| 5 to 9 Year Old | 0 (0.0%) | 0 (0.0%) |
| 10 to 14 Year Olds | 0 (0.0%) | 0 (0.0%) |
| 15 to 17 Year Olds | 0 (0.0%) | 0 (0.0%) |
| 18 to 19 Year Olds | 20 (100.0%) | 0 (0.0%) |
| 20 to 24 Year Olds | 29 (100.0%) | 0 (0.0%) |
| 25 to 34 Year Olds | 0 (0.0%) | 0 (0.0%) |
| 35 Years and over | 0 (0.0%) | 4 (100.0%) |
| Total | 49 (92.5%) | 4 (7.5%) |
Educational Attainment by Field of Study in Virginville
Engineering (12 | 36.4%), business (9 | 27.3%), education (8 | 24.2%), and science & technology (4 | 12.1%) are the most common fields of study among 33 individuals in Virginville who have obtained a bachelor's degree or higher.
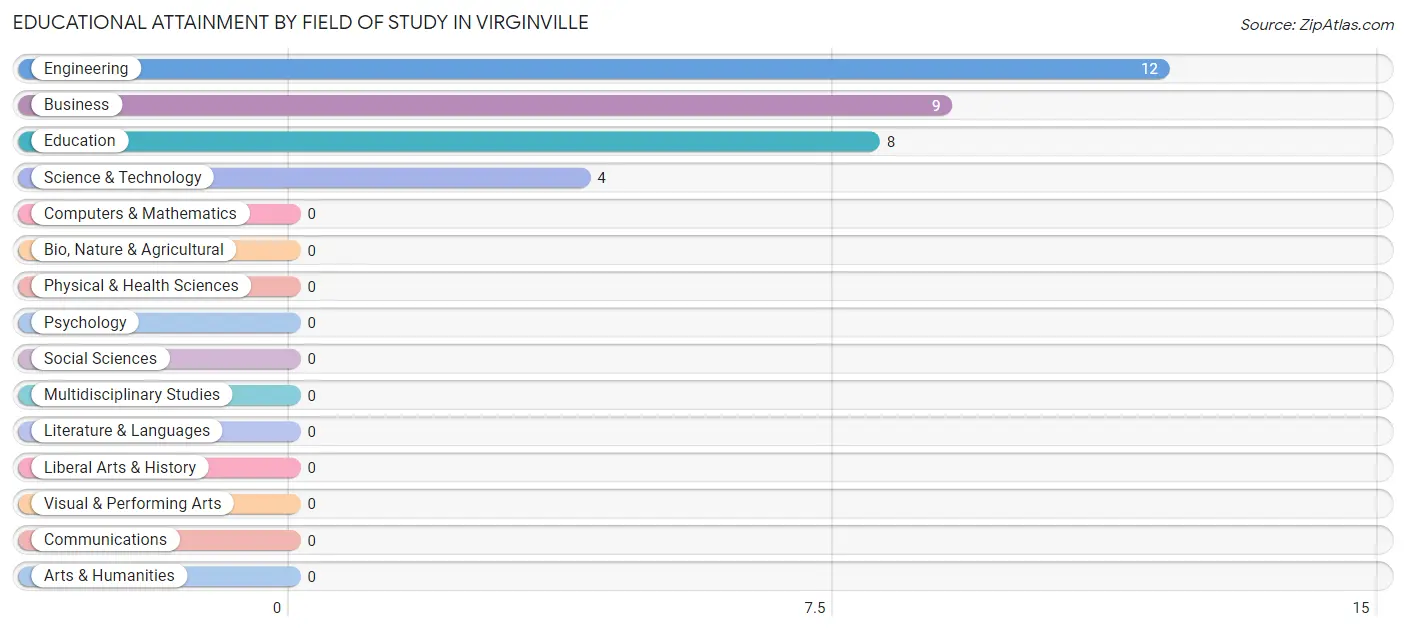
| Field of Study | # Graduates | % Graduates |
| Computers & Mathematics | 0 | 0.0% |
| Bio, Nature & Agricultural | 0 | 0.0% |
| Physical & Health Sciences | 0 | 0.0% |
| Psychology | 0 | 0.0% |
| Social Sciences | 0 | 0.0% |
| Engineering | 12 | 36.4% |
| Multidisciplinary Studies | 0 | 0.0% |
| Science & Technology | 4 | 12.1% |
| Business | 9 | 27.3% |
| Education | 8 | 24.2% |
| Literature & Languages | 0 | 0.0% |
| Liberal Arts & History | 0 | 0.0% |
| Visual & Performing Arts | 0 | 0.0% |
| Communications | 0 | 0.0% |
| Arts & Humanities | 0 | 0.0% |
| Total | 33 | 100.0% |
Transportation & Commute in Virginville
Vehicle Availability by Sex in Virginville
The most prevalent vehicle ownership categories in Virginville are males with 4 vehicles (31, accounting for 36.5%) and females with 4 vehicles (68, making up 28.2%).
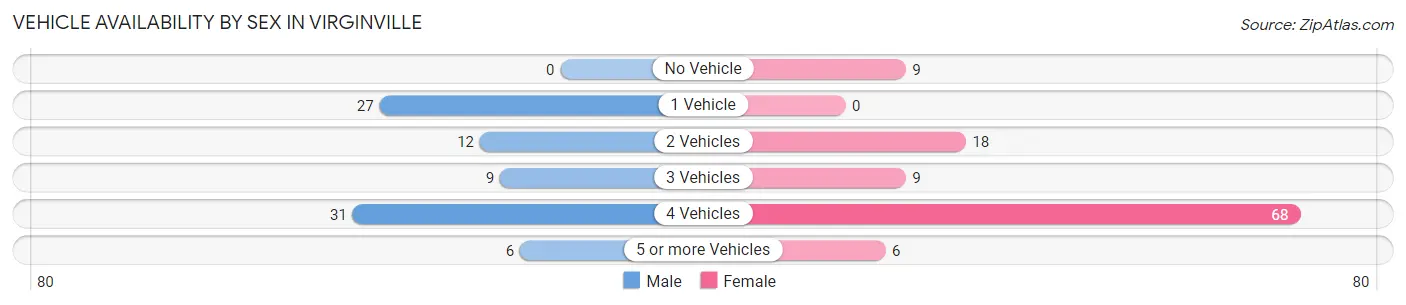
| Vehicles Available | Male | Female |
| No Vehicle | 0 (0.0%) | 9 (8.2%) |
| 1 Vehicle | 27 (31.8%) | 0 (0.0%) |
| 2 Vehicles | 12 (14.1%) | 18 (16.4%) |
| 3 Vehicles | 9 (10.6%) | 9 (8.2%) |
| 4 Vehicles | 31 (36.5%) | 68 (61.8%) |
| 5 or more Vehicles | 6 (7.1%) | 6 (5.4%) |
| Total | 85 (100.0%) | 110 (100.0%) |
Commute Time in Virginville
The most frequently occuring commute durations in Virginville are 20 to 24 minutes (42 commuters, 26.4%), 30 to 34 minutes (42 commuters, 26.4%), and 25 to 29 minutes (36 commuters, 22.6%).
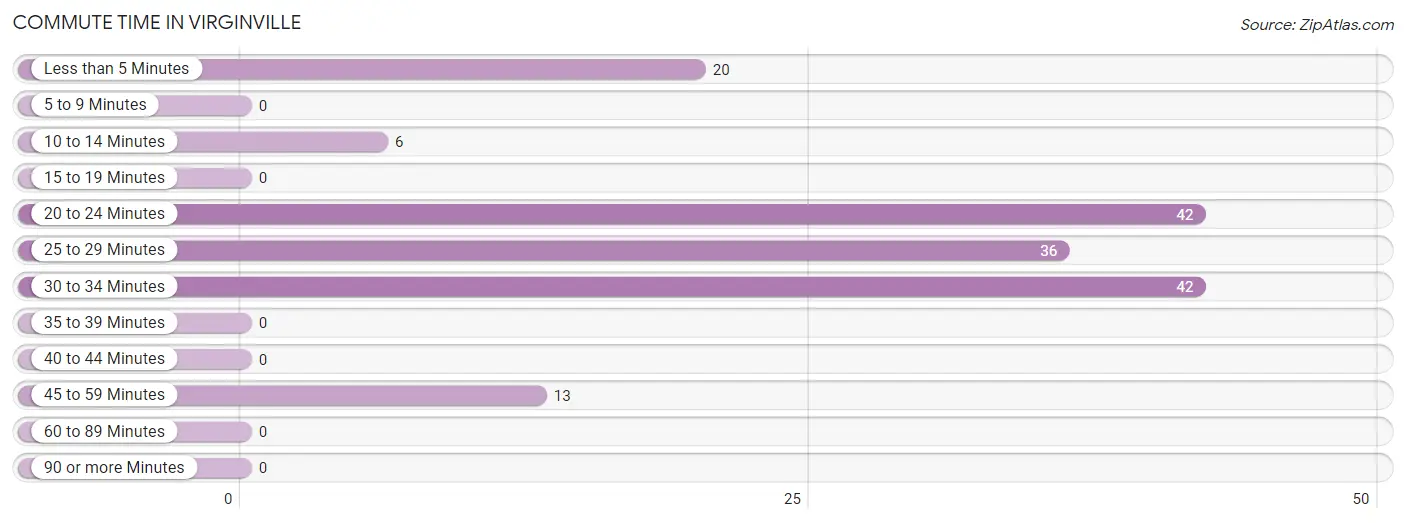
| Commute Time | # Commuters | % Commuters |
| Less than 5 Minutes | 20 | 12.6% |
| 5 to 9 Minutes | 0 | 0.0% |
| 10 to 14 Minutes | 6 | 3.8% |
| 15 to 19 Minutes | 0 | 0.0% |
| 20 to 24 Minutes | 42 | 26.4% |
| 25 to 29 Minutes | 36 | 22.6% |
| 30 to 34 Minutes | 42 | 26.4% |
| 35 to 39 Minutes | 0 | 0.0% |
| 40 to 44 Minutes | 0 | 0.0% |
| 45 to 59 Minutes | 13 | 8.2% |
| 60 to 89 Minutes | 0 | 0.0% |
| 90 or more Minutes | 0 | 0.0% |
Commute Time by Sex in Virginville
The most common commute times in Virginville are 25 to 29 minutes (27 commuters, 38.0%) for males and 30 to 34 minutes (42 commuters, 47.7%) for females.
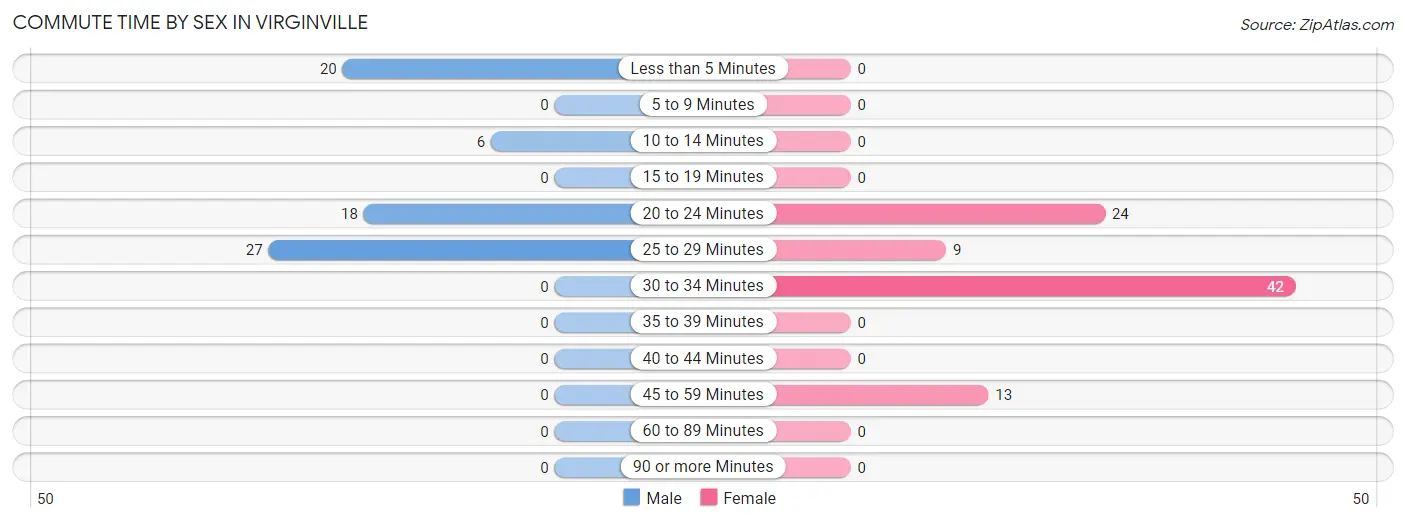
| Commute Time | Male | Female |
| Less than 5 Minutes | 20 (28.2%) | 0 (0.0%) |
| 5 to 9 Minutes | 0 (0.0%) | 0 (0.0%) |
| 10 to 14 Minutes | 6 (8.5%) | 0 (0.0%) |
| 15 to 19 Minutes | 0 (0.0%) | 0 (0.0%) |
| 20 to 24 Minutes | 18 (25.4%) | 24 (27.3%) |
| 25 to 29 Minutes | 27 (38.0%) | 9 (10.2%) |
| 30 to 34 Minutes | 0 (0.0%) | 42 (47.7%) |
| 35 to 39 Minutes | 0 (0.0%) | 0 (0.0%) |
| 40 to 44 Minutes | 0 (0.0%) | 0 (0.0%) |
| 45 to 59 Minutes | 0 (0.0%) | 13 (14.8%) |
| 60 to 89 Minutes | 0 (0.0%) | 0 (0.0%) |
| 90 or more Minutes | 0 (0.0%) | 0 (0.0%) |
Time of Departure to Work by Sex in Virginville
The most frequent times of departure to work in Virginville are 12:00 AM to 4:59 AM (27, 38.0%) for males and 7:00 AM to 7:29 AM (33, 37.5%) for females.
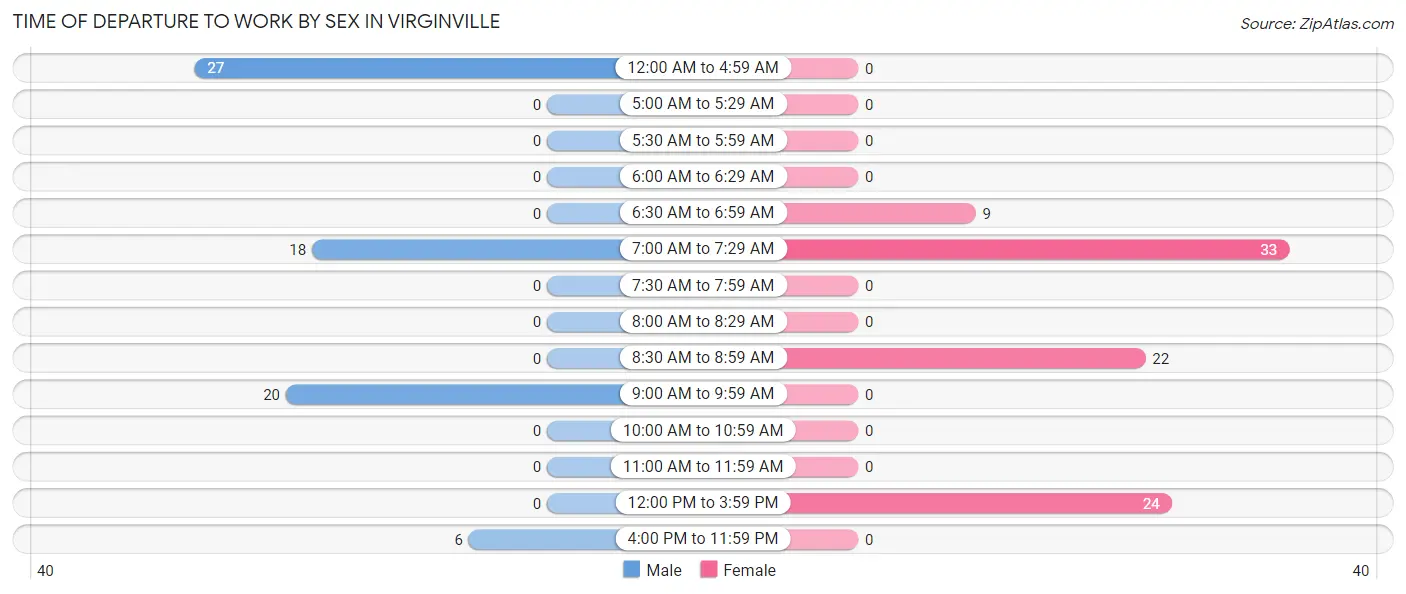
| Time of Departure | Male | Female |
| 12:00 AM to 4:59 AM | 27 (38.0%) | 0 (0.0%) |
| 5:00 AM to 5:29 AM | 0 (0.0%) | 0 (0.0%) |
| 5:30 AM to 5:59 AM | 0 (0.0%) | 0 (0.0%) |
| 6:00 AM to 6:29 AM | 0 (0.0%) | 0 (0.0%) |
| 6:30 AM to 6:59 AM | 0 (0.0%) | 9 (10.2%) |
| 7:00 AM to 7:29 AM | 18 (25.4%) | 33 (37.5%) |
| 7:30 AM to 7:59 AM | 0 (0.0%) | 0 (0.0%) |
| 8:00 AM to 8:29 AM | 0 (0.0%) | 0 (0.0%) |
| 8:30 AM to 8:59 AM | 0 (0.0%) | 22 (25.0%) |
| 9:00 AM to 9:59 AM | 20 (28.2%) | 0 (0.0%) |
| 10:00 AM to 10:59 AM | 0 (0.0%) | 0 (0.0%) |
| 11:00 AM to 11:59 AM | 0 (0.0%) | 0 (0.0%) |
| 12:00 PM to 3:59 PM | 0 (0.0%) | 24 (27.3%) |
| 4:00 PM to 11:59 PM | 6 (8.5%) | 0 (0.0%) |
| Total | 71 (100.0%) | 88 (100.0%) |
Housing Occupancy in Virginville
Occupancy by Ownership in Virginville
Of the total 111 dwellings in Virginville, owner-occupied units account for 84 (75.7%), while renter-occupied units make up 27 (24.3%).
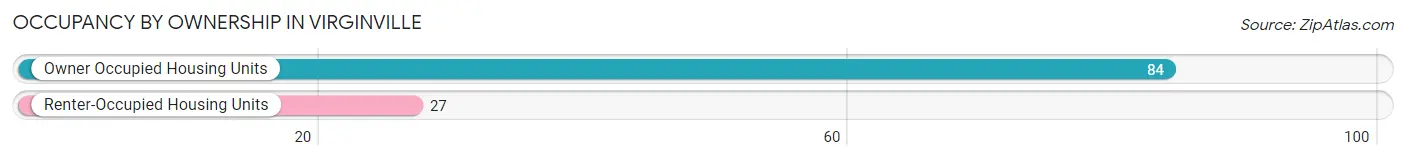
| Occupancy | # Housing Units | % Housing Units |
| Owner Occupied Housing Units | 84 | 75.7% |
| Renter-Occupied Housing Units | 27 | 24.3% |
| Total Occupied Housing Units | 111 | 100.0% |
Occupancy by Household Size in Virginville
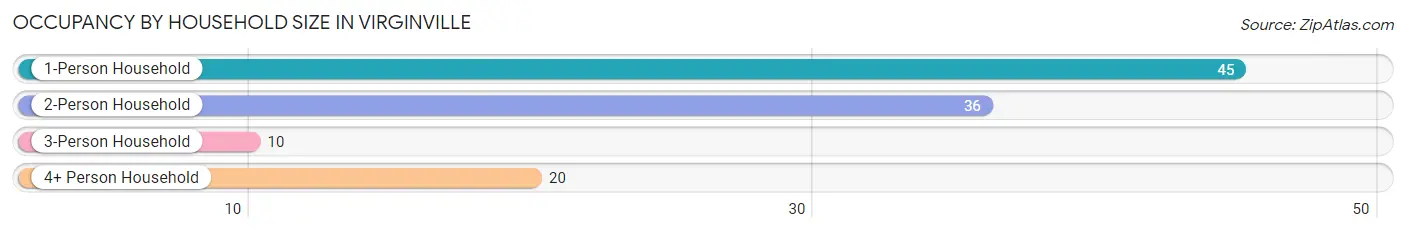
| Household Size | # Housing Units | % Housing Units |
| 1-Person Household | 45 | 40.5% |
| 2-Person Household | 36 | 32.4% |
| 3-Person Household | 10 | 9.0% |
| 4+ Person Household | 20 | 18.0% |
| Total Housing Units | 111 | 100.0% |
Occupancy by Ownership by Household Size in Virginville
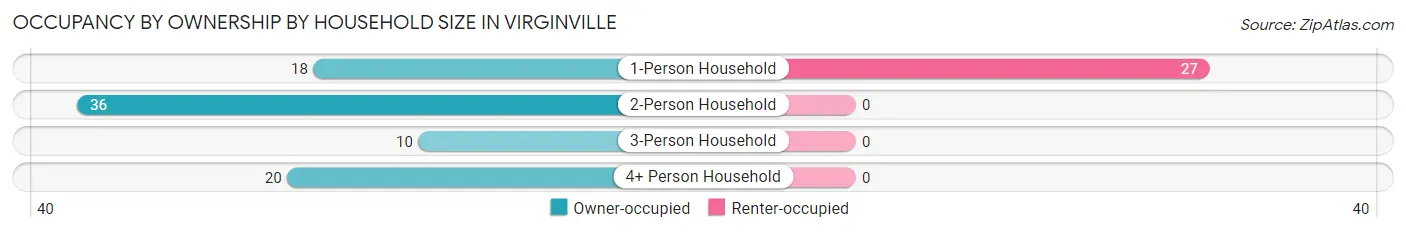
| Household Size | Owner-occupied | Renter-occupied |
| 1-Person Household | 18 (40.0%) | 27 (60.0%) |
| 2-Person Household | 36 (100.0%) | 0 (0.0%) |
| 3-Person Household | 10 (100.0%) | 0 (0.0%) |
| 4+ Person Household | 20 (100.0%) | 0 (0.0%) |
| Total Housing Units | 84 (75.7%) | 27 (24.3%) |
Occupancy by Educational Attainment in Virginville
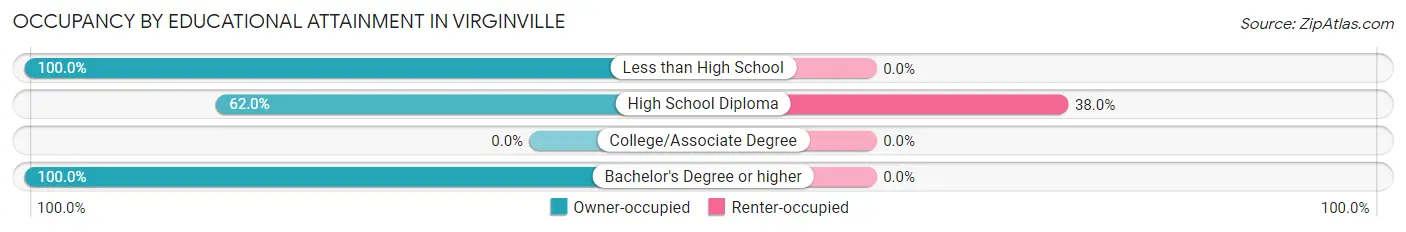
| Household Size | Owner-occupied | Renter-occupied |
| Less than High School | 9 (100.0%) | 0 (0.0%) |
| High School Diploma | 44 (62.0%) | 27 (38.0%) |
| College/Associate Degree | 0 (0.0%) | 0 (0.0%) |
| Bachelor's Degree or higher | 31 (100.0%) | 0 (0.0%) |
Occupancy by Age of Householder in Virginville
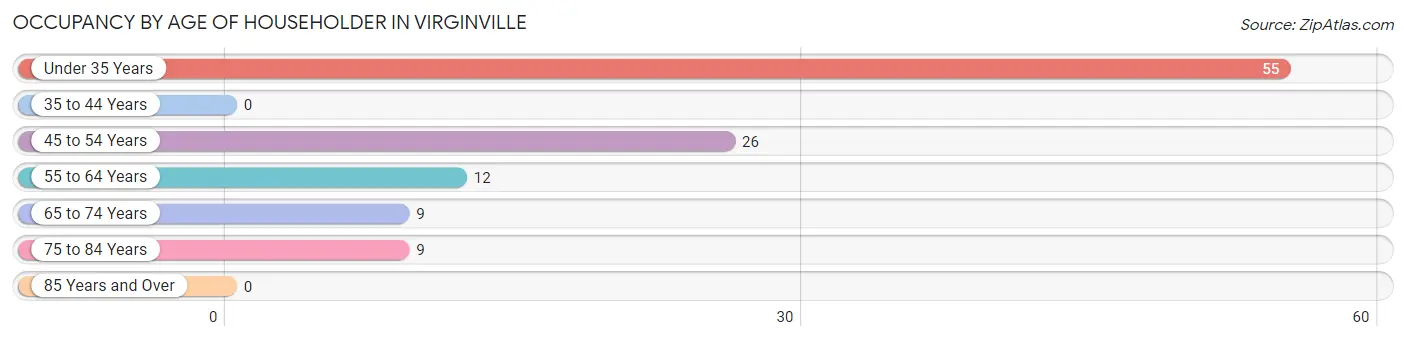
| Age Bracket | # Households | % Households |
| Under 35 Years | 55 | 49.5% |
| 35 to 44 Years | 0 | 0.0% |
| 45 to 54 Years | 26 | 23.4% |
| 55 to 64 Years | 12 | 10.8% |
| 65 to 74 Years | 9 | 8.1% |
| 75 to 84 Years | 9 | 8.1% |
| 85 Years and Over | 0 | 0.0% |
| Total | 111 | 100.0% |
Housing Finances in Virginville
Median Income by Occupancy in Virginville
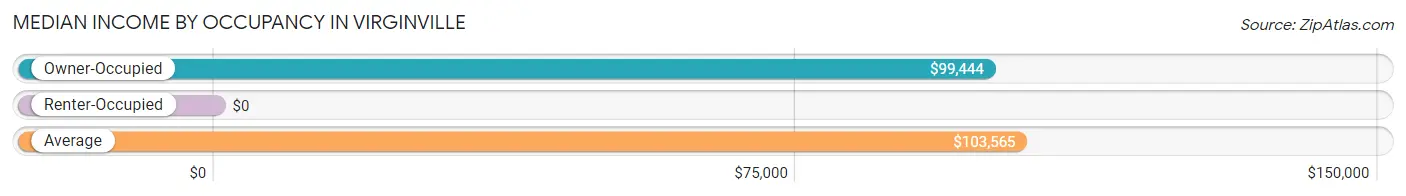
| Occupancy Type | # Households | Median Income |
| Owner-Occupied | 84 (75.7%) | $99,444 |
| Renter-Occupied | 27 (24.3%) | $0 |
| Average | 111 (100.0%) | $103,565 |
Occupancy by Householder Income Bracket in Virginville
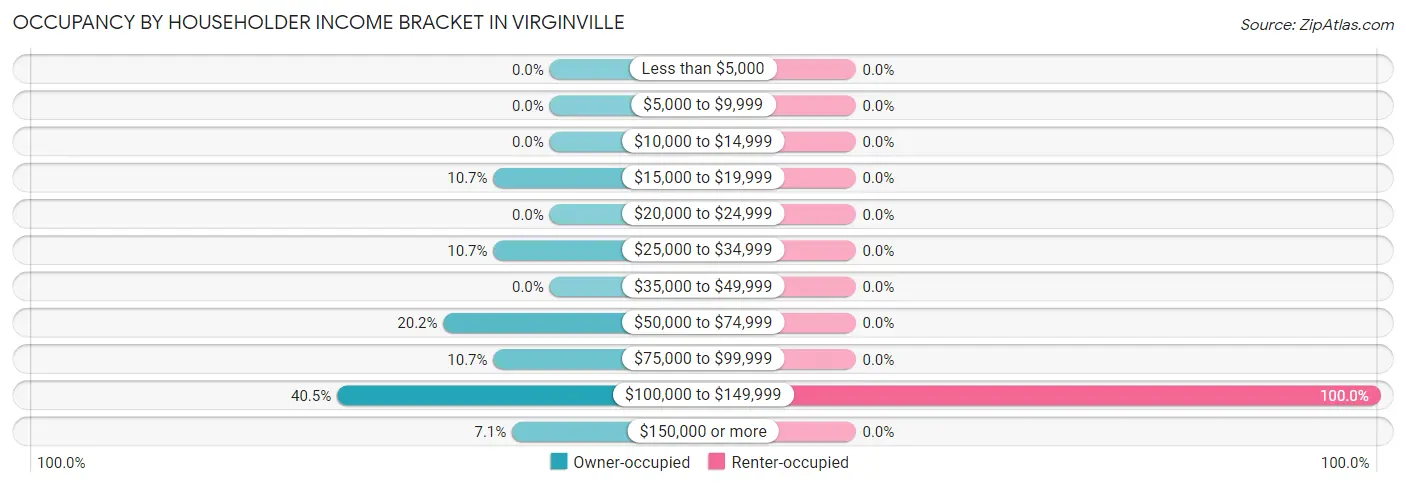
| Income Bracket | Owner-occupied | Renter-occupied |
| Less than $5,000 | 0 (0.0%) | 0 (0.0%) |
| $5,000 to $9,999 | 0 (0.0%) | 0 (0.0%) |
| $10,000 to $14,999 | 0 (0.0%) | 0 (0.0%) |
| $15,000 to $19,999 | 9 (10.7%) | 0 (0.0%) |
| $20,000 to $24,999 | 0 (0.0%) | 0 (0.0%) |
| $25,000 to $34,999 | 9 (10.7%) | 0 (0.0%) |
| $35,000 to $49,999 | 0 (0.0%) | 0 (0.0%) |
| $50,000 to $74,999 | 17 (20.2%) | 0 (0.0%) |
| $75,000 to $99,999 | 9 (10.7%) | 0 (0.0%) |
| $100,000 to $149,999 | 34 (40.5%) | 27 (100.0%) |
| $150,000 or more | 6 (7.1%) | 0 (0.0%) |
| Total | 84 (100.0%) | 27 (100.0%) |
Monthly Housing Cost Tiers in Virginville
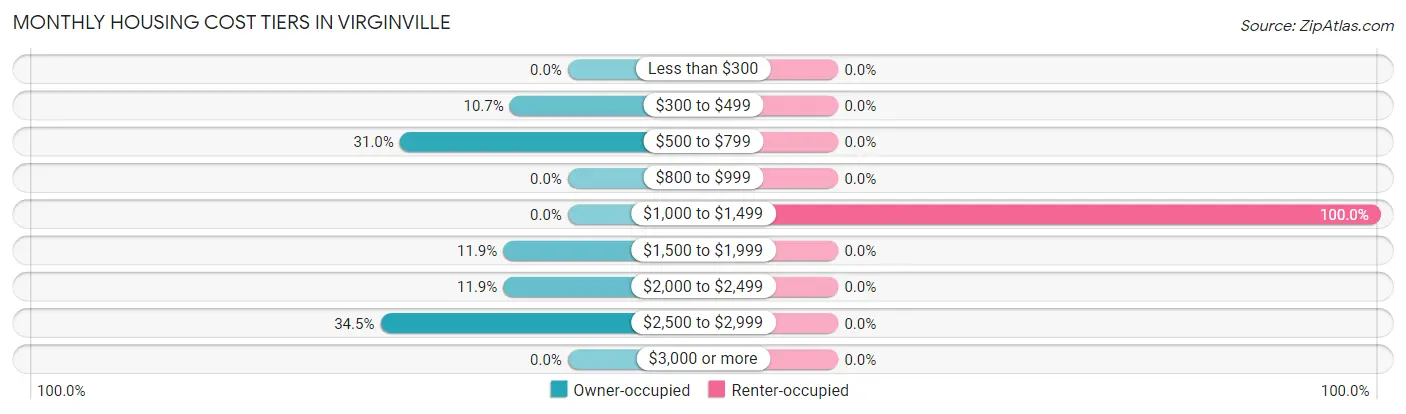
| Monthly Cost | Owner-occupied | Renter-occupied |
| Less than $300 | 0 (0.0%) | 0 (0.0%) |
| $300 to $499 | 9 (10.7%) | 0 (0.0%) |
| $500 to $799 | 26 (30.9%) | 0 (0.0%) |
| $800 to $999 | 0 (0.0%) | 0 (0.0%) |
| $1,000 to $1,499 | 0 (0.0%) | 27 (100.0%) |
| $1,500 to $1,999 | 10 (11.9%) | 0 (0.0%) |
| $2,000 to $2,499 | 10 (11.9%) | 0 (0.0%) |
| $2,500 to $2,999 | 29 (34.5%) | 0 (0.0%) |
| $3,000 or more | 0 (0.0%) | 0 (0.0%) |
| Total | 84 (100.0%) | 27 (100.0%) |
Physical Housing Characteristics in Virginville
Housing Structures in Virginville
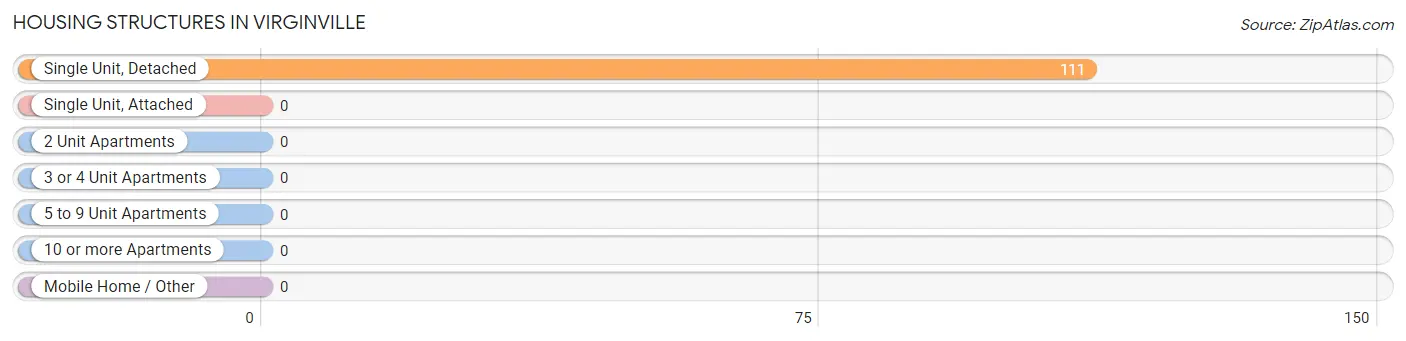
| Structure Type | # Housing Units | % Housing Units |
| Single Unit, Detached | 111 | 100.0% |
| Single Unit, Attached | 0 | 0.0% |
| 2 Unit Apartments | 0 | 0.0% |
| 3 or 4 Unit Apartments | 0 | 0.0% |
| 5 to 9 Unit Apartments | 0 | 0.0% |
| 10 or more Apartments | 0 | 0.0% |
| Mobile Home / Other | 0 | 0.0% |
| Total | 111 | 100.0% |
Housing Structures by Occupancy in Virginville
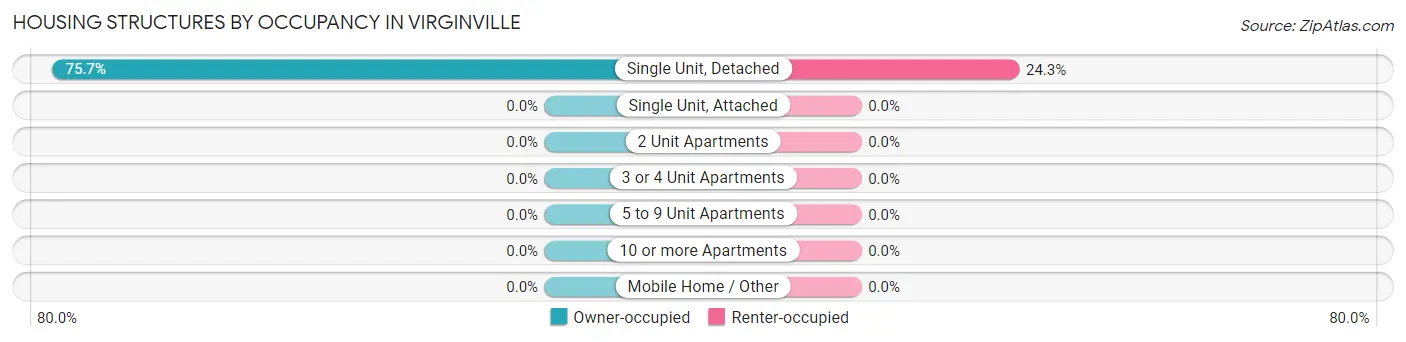
| Structure Type | Owner-occupied | Renter-occupied |
| Single Unit, Detached | 84 (75.7%) | 27 (24.3%) |
| Single Unit, Attached | 0 (0.0%) | 0 (0.0%) |
| 2 Unit Apartments | 0 (0.0%) | 0 (0.0%) |
| 3 or 4 Unit Apartments | 0 (0.0%) | 0 (0.0%) |
| 5 to 9 Unit Apartments | 0 (0.0%) | 0 (0.0%) |
| 10 or more Apartments | 0 (0.0%) | 0 (0.0%) |
| Mobile Home / Other | 0 (0.0%) | 0 (0.0%) |
| Total | 84 (75.7%) | 27 (24.3%) |
Housing Structures by Number of Rooms in Virginville
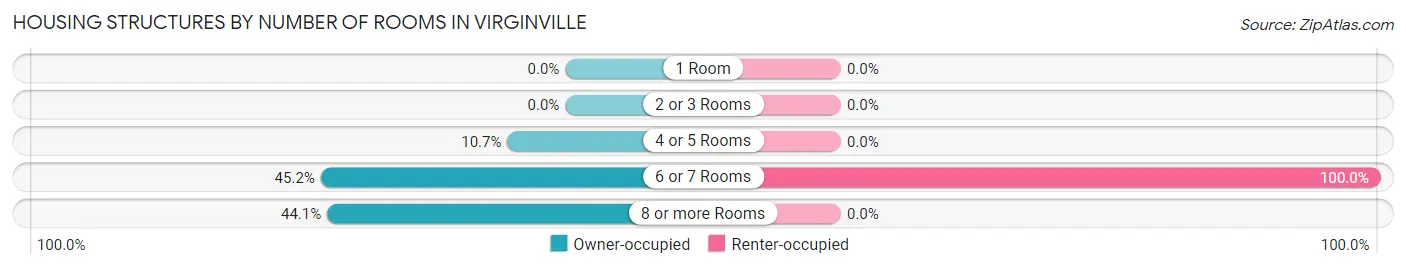
| Number of Rooms | Owner-occupied | Renter-occupied |
| 1 Room | 0 (0.0%) | 0 (0.0%) |
| 2 or 3 Rooms | 0 (0.0%) | 0 (0.0%) |
| 4 or 5 Rooms | 9 (10.7%) | 0 (0.0%) |
| 6 or 7 Rooms | 38 (45.2%) | 27 (100.0%) |
| 8 or more Rooms | 37 (44.1%) | 0 (0.0%) |
| Total | 84 (100.0%) | 27 (100.0%) |
Housing Structure by Heating Type in Virginville
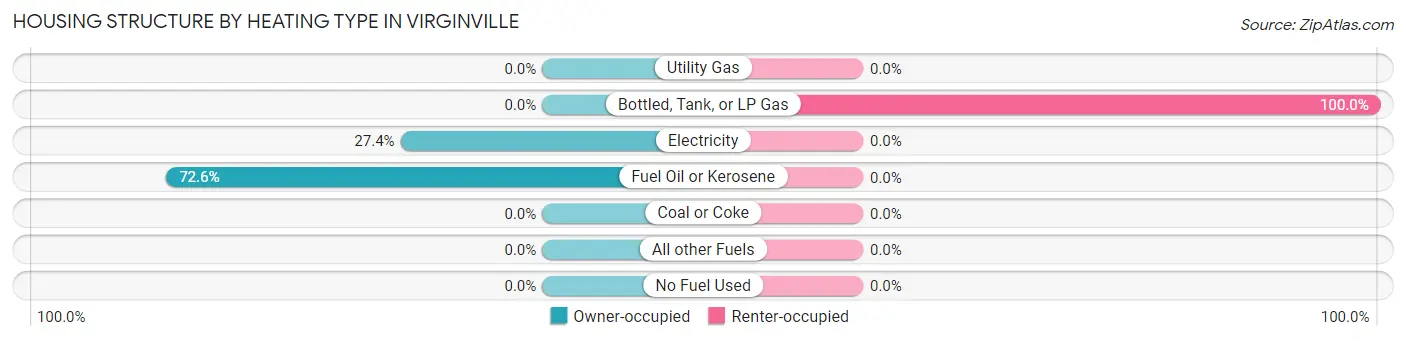
| Heating Type | Owner-occupied | Renter-occupied |
| Utility Gas | 0 (0.0%) | 0 (0.0%) |
| Bottled, Tank, or LP Gas | 0 (0.0%) | 27 (100.0%) |
| Electricity | 23 (27.4%) | 0 (0.0%) |
| Fuel Oil or Kerosene | 61 (72.6%) | 0 (0.0%) |
| Coal or Coke | 0 (0.0%) | 0 (0.0%) |
| All other Fuels | 0 (0.0%) | 0 (0.0%) |
| No Fuel Used | 0 (0.0%) | 0 (0.0%) |
| Total | 84 (100.0%) | 27 (100.0%) |
Household Vehicle Usage in Virginville
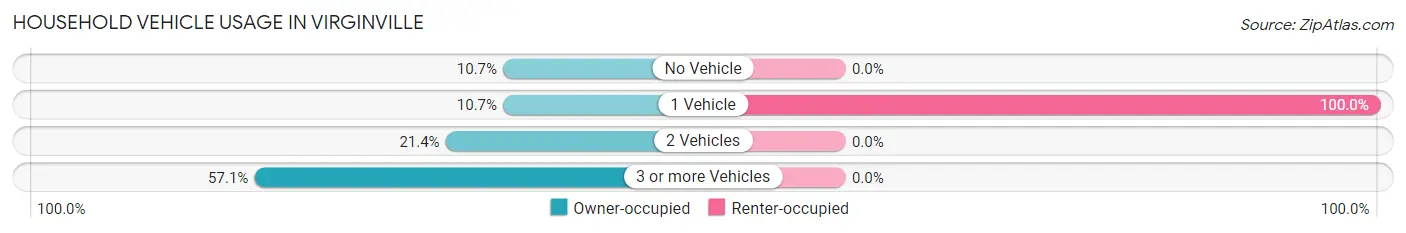
| Vehicles per Household | Owner-occupied | Renter-occupied |
| No Vehicle | 9 (10.7%) | 0 (0.0%) |
| 1 Vehicle | 9 (10.7%) | 27 (100.0%) |
| 2 Vehicles | 18 (21.4%) | 0 (0.0%) |
| 3 or more Vehicles | 48 (57.1%) | 0 (0.0%) |
| Total | 84 (100.0%) | 27 (100.0%) |
Real Estate & Mortgages in Virginville
Real Estate and Mortgage Overview in Virginville
| Characteristic | Without Mortgage | With Mortgage |
| Housing Units | 35 | 49 |
| Median Property Value | $302,800 | $201,700 |
| Median Household Income | - | - |
| Monthly Housing Costs | $633 | $0 |
| Real Estate Taxes | - | - |
Property Value by Mortgage Status in Virginville
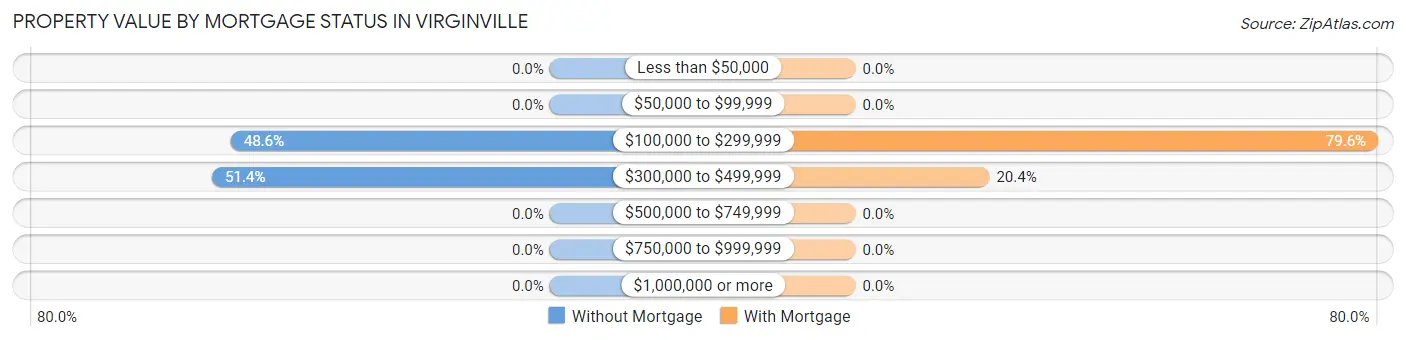
| Property Value | Without Mortgage | With Mortgage |
| Less than $50,000 | 0 (0.0%) | 0 (0.0%) |
| $50,000 to $99,999 | 0 (0.0%) | 0 (0.0%) |
| $100,000 to $299,999 | 17 (48.6%) | 39 (79.6%) |
| $300,000 to $499,999 | 18 (51.4%) | 10 (20.4%) |
| $500,000 to $749,999 | 0 (0.0%) | 0 (0.0%) |
| $750,000 to $999,999 | 0 (0.0%) | 0 (0.0%) |
| $1,000,000 or more | 0 (0.0%) | 0 (0.0%) |
| Total | 35 (100.0%) | 49 (100.0%) |
Household Income by Mortgage Status in Virginville
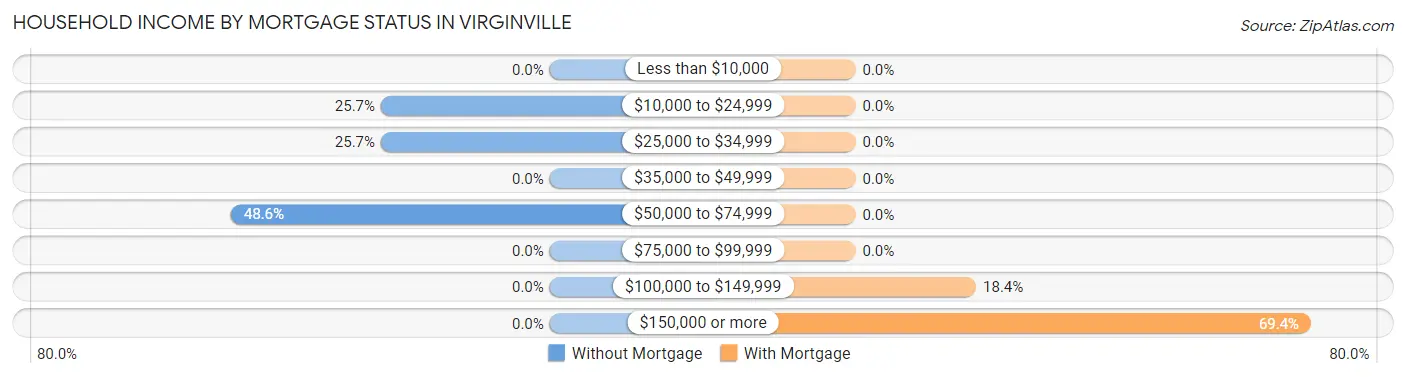
| Household Income | Without Mortgage | With Mortgage |
| Less than $10,000 | 0 (0.0%) | 0 (0.0%) |
| $10,000 to $24,999 | 9 (25.7%) | 0 (0.0%) |
| $25,000 to $34,999 | 9 (25.7%) | 0 (0.0%) |
| $35,000 to $49,999 | 0 (0.0%) | 0 (0.0%) |
| $50,000 to $74,999 | 17 (48.6%) | 0 (0.0%) |
| $75,000 to $99,999 | 0 (0.0%) | 0 (0.0%) |
| $100,000 to $149,999 | 0 (0.0%) | 9 (18.4%) |
| $150,000 or more | 0 (0.0%) | 34 (69.4%) |
| Total | 35 (100.0%) | 49 (100.0%) |
Property Value to Household Income Ratio in Virginville
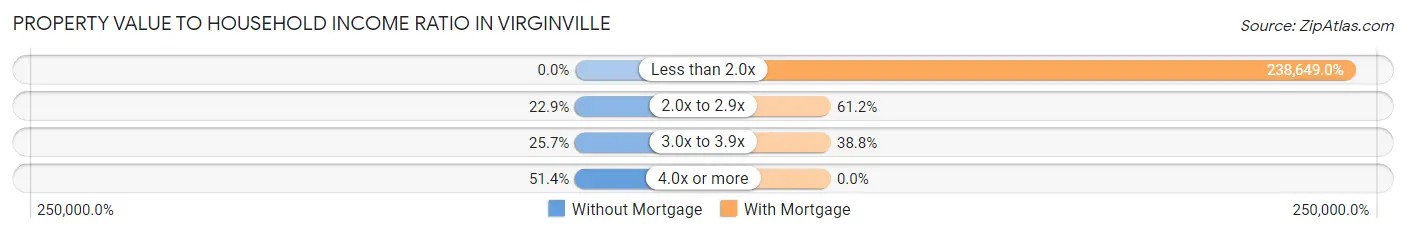
| Value-to-Income Ratio | Without Mortgage | With Mortgage |
| Less than 2.0x | 0 (0.0%) | 116,938 (238,649.0%) |
| 2.0x to 2.9x | 8 (22.9%) | 30 (61.2%) |
| 3.0x to 3.9x | 9 (25.7%) | 19 (38.8%) |
| 4.0x or more | 18 (51.4%) | 0 (0.0%) |
| Total | 35 (100.0%) | 49 (100.0%) |
Real Estate Taxes by Mortgage Status in Virginville
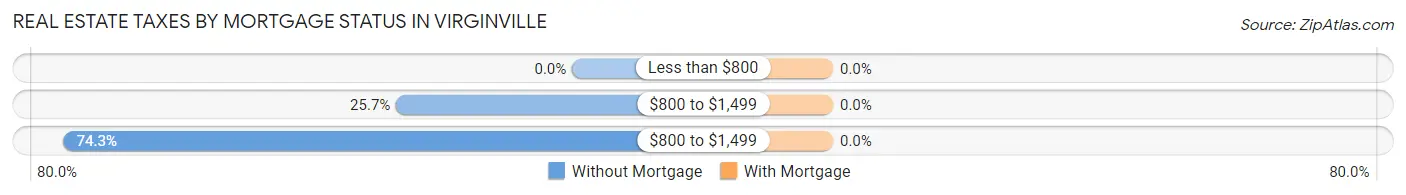
| Property Taxes | Without Mortgage | With Mortgage |
| Less than $800 | 0 (0.0%) | 0 (0.0%) |
| $800 to $1,499 | 9 (25.7%) | 0 (0.0%) |
| $800 to $1,499 | 26 (74.3%) | 0 (0.0%) |
| Total | 35 (100.0%) | 49 (100.0%) |
Health & Disability in Virginville
Health Insurance Coverage by Age in Virginville
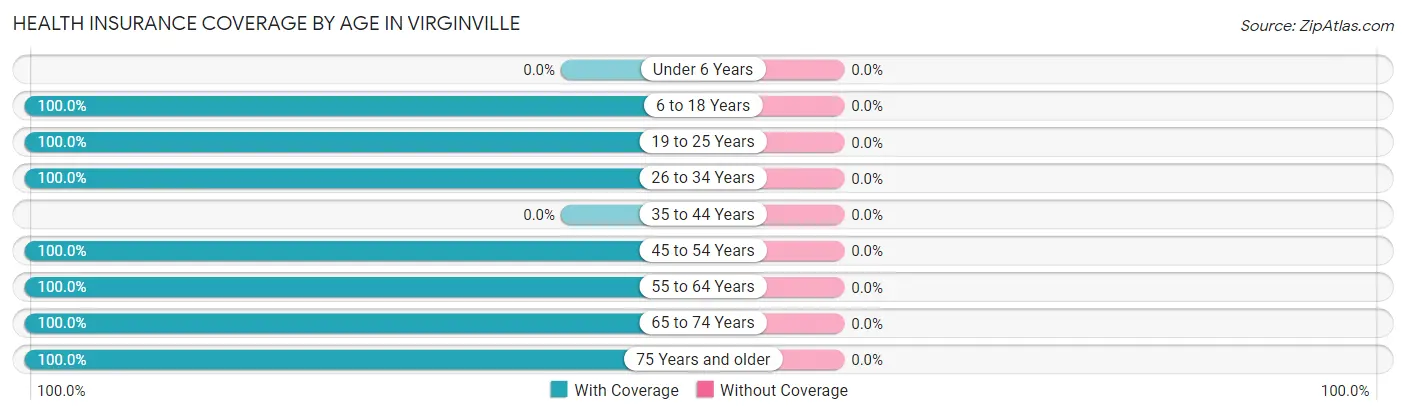
| Age Bracket | With Coverage | Without Coverage |
| Under 6 Years | 0 (0.0%) | 0 (0.0%) |
| 6 to 18 Years | 20 (100.0%) | 0 (0.0%) |
| 19 to 25 Years | 51 (100.0%) | 0 (0.0%) |
| 26 to 34 Years | 60 (100.0%) | 0 (0.0%) |
| 35 to 44 Years | 0 (0.0%) | 0 (0.0%) |
| 45 to 54 Years | 54 (100.0%) | 0 (0.0%) |
| 55 to 64 Years | 25 (100.0%) | 0 (0.0%) |
| 65 to 74 Years | 9 (100.0%) | 0 (0.0%) |
| 75 Years and older | 19 (100.0%) | 0 (0.0%) |
| Total | 238 (100.0%) | 0 (0.0%) |
Health Insurance Coverage by Citizenship Status in Virginville
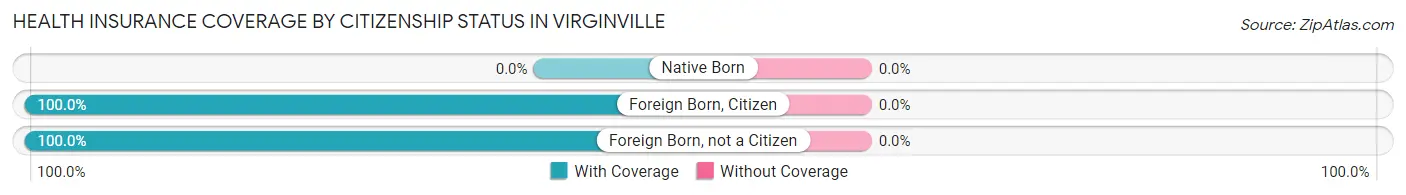
| Citizenship Status | With Coverage | Without Coverage |
| Native Born | 0 (0.0%) | 0 (0.0%) |
| Foreign Born, Citizen | 20 (100.0%) | 0 (0.0%) |
| Foreign Born, not a Citizen | 51 (100.0%) | 0 (0.0%) |
Health Insurance Coverage by Household Income in Virginville
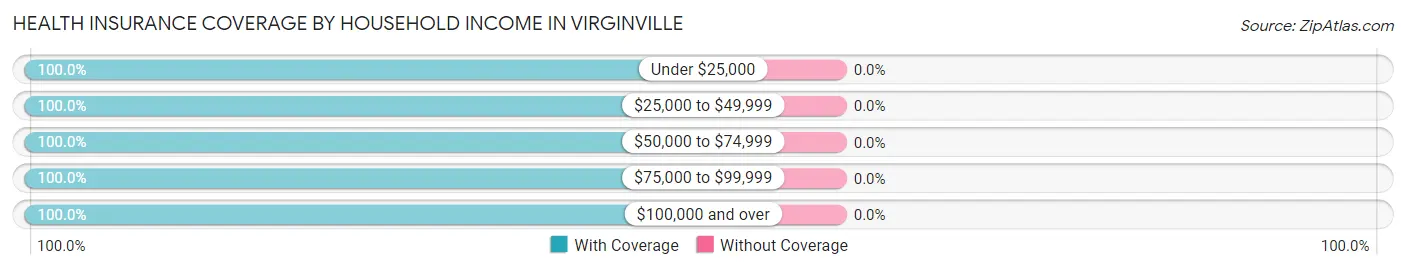
| Household Income | With Coverage | Without Coverage |
| Under $25,000 | 19 (100.0%) | 0 (0.0%) |
| $25,000 to $49,999 | 9 (100.0%) | 0 (0.0%) |
| $50,000 to $74,999 | 25 (100.0%) | 0 (0.0%) |
| $75,000 to $99,999 | 18 (100.0%) | 0 (0.0%) |
| $100,000 and over | 167 (100.0%) | 0 (0.0%) |
Public vs Private Health Insurance Coverage by Age in Virginville
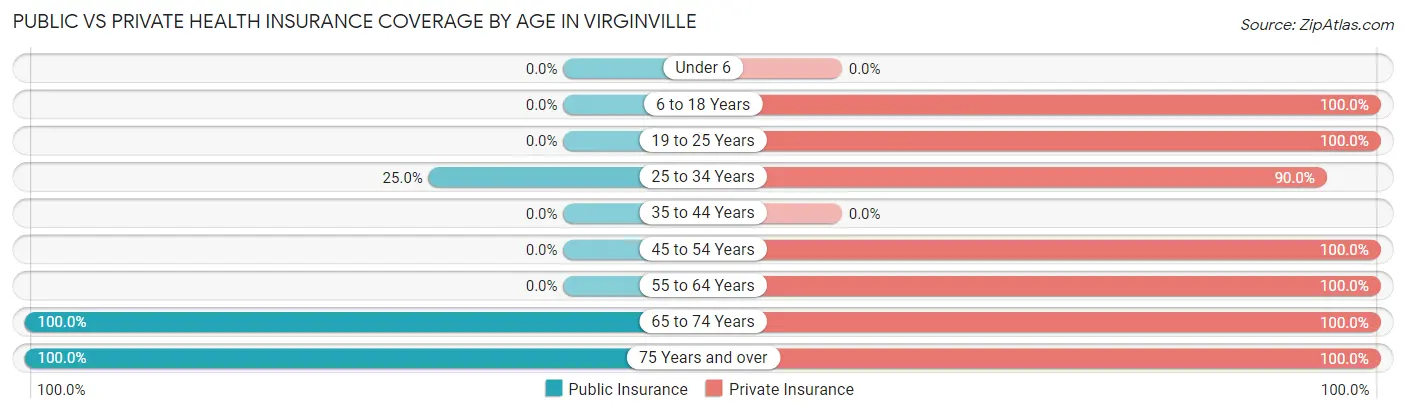
| Age Bracket | Public Insurance | Private Insurance |
| Under 6 | 0 (0.0%) | 0 (0.0%) |
| 6 to 18 Years | 0 (0.0%) | 20 (100.0%) |
| 19 to 25 Years | 0 (0.0%) | 51 (100.0%) |
| 25 to 34 Years | 15 (25.0%) | 54 (90.0%) |
| 35 to 44 Years | 0 (0.0%) | 0 (0.0%) |
| 45 to 54 Years | 0 (0.0%) | 54 (100.0%) |
| 55 to 64 Years | 0 (0.0%) | 25 (100.0%) |
| 65 to 74 Years | 9 (100.0%) | 9 (100.0%) |
| 75 Years and over | 19 (100.0%) | 19 (100.0%) |
| Total | 43 (18.1%) | 232 (97.5%) |
Disability Status by Sex by Age in Virginville
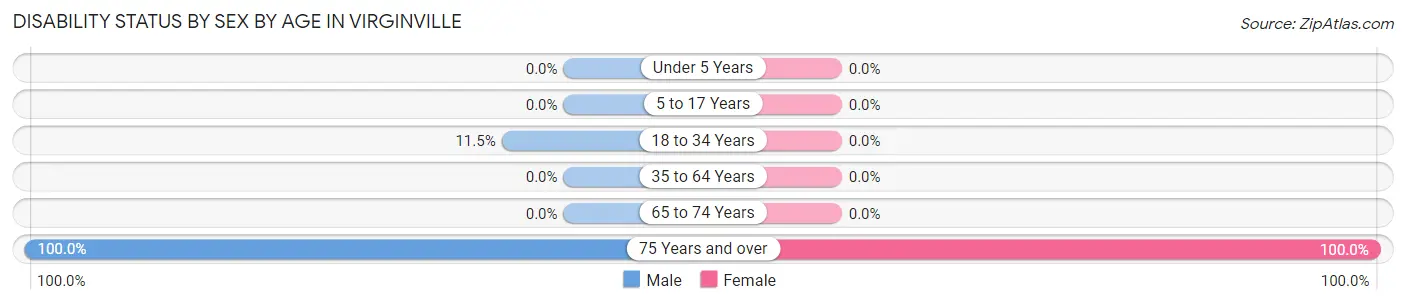
| Age Bracket | Male | Female |
| Under 5 Years | 0 (0.0%) | 0 (0.0%) |
| 5 to 17 Years | 0 (0.0%) | 0 (0.0%) |
| 18 to 34 Years | 7 (11.5%) | 0 (0.0%) |
| 35 to 64 Years | 0 (0.0%) | 0 (0.0%) |
| 65 to 74 Years | 0 (0.0%) | 0 (0.0%) |
| 75 Years and over | 9 (100.0%) | 10 (100.0%) |
Disability Class by Sex by Age in Virginville
Disability Class: Hearing Difficulty
| Age Bracket | Male | Female |
| Under 5 Years | 0 (0.0%) | 0 (0.0%) |
| 5 to 17 Years | 0 (0.0%) | 0 (0.0%) |
| 18 to 34 Years | 0 (0.0%) | 0 (0.0%) |
| 35 to 64 Years | 0 (0.0%) | 0 (0.0%) |
| 65 to 74 Years | 0 (0.0%) | 0 (0.0%) |
| 75 Years and over | 0 (0.0%) | 0 (0.0%) |
Disability Class: Vision Difficulty
| Age Bracket | Male | Female |
| Under 5 Years | 0 (0.0%) | 0 (0.0%) |
| 5 to 17 Years | 0 (0.0%) | 0 (0.0%) |
| 18 to 34 Years | 0 (0.0%) | 0 (0.0%) |
| 35 to 64 Years | 0 (0.0%) | 0 (0.0%) |
| 65 to 74 Years | 0 (0.0%) | 0 (0.0%) |
| 75 Years and over | 9 (100.0%) | 10 (100.0%) |
Disability Class: Cognitive Difficulty
| Age Bracket | Male | Female |
| 5 to 17 Years | 0 (0.0%) | 0 (0.0%) |
| 18 to 34 Years | 7 (11.5%) | 0 (0.0%) |
| 35 to 64 Years | 0 (0.0%) | 0 (0.0%) |
| 65 to 74 Years | 0 (0.0%) | 0 (0.0%) |
| 75 Years and over | 0 (0.0%) | 0 (0.0%) |
Disability Class: Ambulatory Difficulty
| Age Bracket | Male | Female |
| 5 to 17 Years | 0 (0.0%) | 0 (0.0%) |
| 18 to 34 Years | 0 (0.0%) | 0 (0.0%) |
| 35 to 64 Years | 0 (0.0%) | 0 (0.0%) |
| 65 to 74 Years | 0 (0.0%) | 0 (0.0%) |
| 75 Years and over | 0 (0.0%) | 0 (0.0%) |
Disability Class: Self-Care Difficulty
| Age Bracket | Male | Female |
| 5 to 17 Years | 0 (0.0%) | 0 (0.0%) |
| 18 to 34 Years | 0 (0.0%) | 0 (0.0%) |
| 35 to 64 Years | 0 (0.0%) | 0 (0.0%) |
| 65 to 74 Years | 0 (0.0%) | 0 (0.0%) |
| 75 Years and over | 0 (0.0%) | 0 (0.0%) |
Technology Access in Virginville
Computing Device Access in Virginville
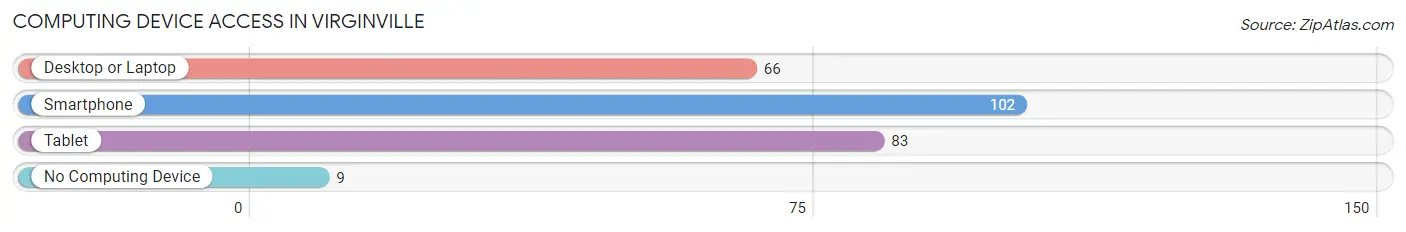
| Device Type | # Households | % Households |
| Desktop or Laptop | 66 | 59.5% |
| Smartphone | 102 | 91.9% |
| Tablet | 83 | 74.8% |
| No Computing Device | 9 | 8.1% |
| Total | 111 | 100.0% |
Internet Access in Virginville
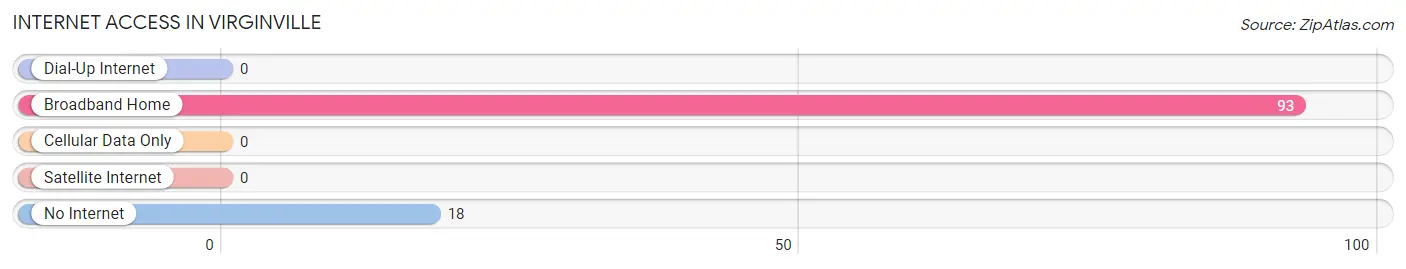
| Internet Type | # Households | % Households |
| Dial-Up Internet | 0 | 0.0% |
| Broadband Home | 93 | 83.8% |
| Cellular Data Only | 0 | 0.0% |
| Satellite Internet | 0 | 0.0% |
| No Internet | 18 | 16.2% |
| Total | 111 | 100.0% |
Virginville Summary
Village of Virginville Pennsylvania
The village of Virginville, Pennsylvania is located in Berks County, Pennsylvania, approximately 10 miles south of the city of Reading. The village is situated in the northern part of the county, near the border of Lehigh County. The village is located in the Oley Valley, a region of rolling hills and farmland. The village is home to a population of approximately 1,000 people, and is a small, rural community.
History
The village of Virginville was founded in 1750 by a group of German settlers. The settlers named the village after the Virgin Mary, and the village was originally known as “Mariendorf”. The village was officially incorporated in 1845, and the name was changed to Virginville.
The village was a small farming community for many years, and the main industry was agriculture. The village was also home to several small businesses, including a general store, a blacksmith, and a mill.
In the late 19th century, the village began to grow and develop. The village was connected to the Reading and Columbia Railroad in 1891, and the railroad provided a link to the larger cities of Reading and Philadelphia. The village also had a post office, which opened in 1892.
In the early 20th century, the village continued to grow and develop. The village was home to several churches, a school, and a library. The village also had a fire company, which was established in 1910.
Geography
The village of Virginville is located in the northern part of Berks County, near the border of Lehigh County. The village is situated in the Oley Valley, a region of rolling hills and farmland. The village is located approximately 10 miles south of the city of Reading.
The village is located in a rural area, and is surrounded by farmland. The village is located near several small towns, including Oley, Fleetwood, and Kutztown. The village is also located near several state parks, including Nolde Forest Environmental Education Center, French Creek State Park, and Hawk Mountain Sanctuary.
Economy
The village of Virginville is a small, rural community, and the main industry is agriculture. The village is home to several small businesses, including a general store, a blacksmith, and a mill. The village is also home to several churches, a school, and a library.
The village is also home to several small manufacturing companies, including a furniture manufacturer, a metal fabrication company, and a printing company. The village is also home to several small restaurants and shops.
Demographics
The village of Virginville is home to a population of approximately 1,000 people. The population is predominantly white, with a small percentage of African Americans and Hispanics. The median household income is approximately $50,000, and the median home value is approximately $150,000. The village is served by the Oley Valley School District.
Common Questions
What is Per Capita Income in Virginville?
Per Capita income in Virginville is $46,146.
What is the Median Family Income in Virginville?
Median Family Income in Virginville is $115,250.
What is the Median Household income in Virginville?
Median Household Income in Virginville is $103,565.
What is Income or Wage Gap in Virginville?
Income or Wage Gap in Virginville is 39.8%.
Women in Virginville earn 60.2 cents for every dollar earned by a man.
What is Inequality or Gini Index in Virginville?
Inequality or Gini Index in Virginville is 0.22.
What is the Total Population of Virginville?
Total Population of Virginville is 238.
What is the Total Male Population of Virginville?
Total Male Population of Virginville is 109.
What is the Total Female Population of Virginville?
Total Female Population of Virginville is 129.
What is the Ratio of Males per 100 Females in Virginville?
There are 84.50 Males per 100 Females in Virginville.
What is the Ratio of Females per 100 Males in Virginville?
There are 118.35 Females per 100 Males in Virginville.
What is the Median Population Age in Virginville?
Median Population Age in Virginville is 32.9 Years.
What is the Average Family Size in Virginville
Average Family Size in Virginville is 3.0 People.
What is the Average Household Size in Virginville
Average Household Size in Virginville is 2.1 People.
How Large is the Labor Force in Virginville?
There are 195 People in the Labor Forcein in Virginville.
What is the Percentage of People in the Labor Force in Virginville?
81.9% of People are in the Labor Force in Virginville.