Hokendauqua, PA Map & Demographics
Hokendauqua Map
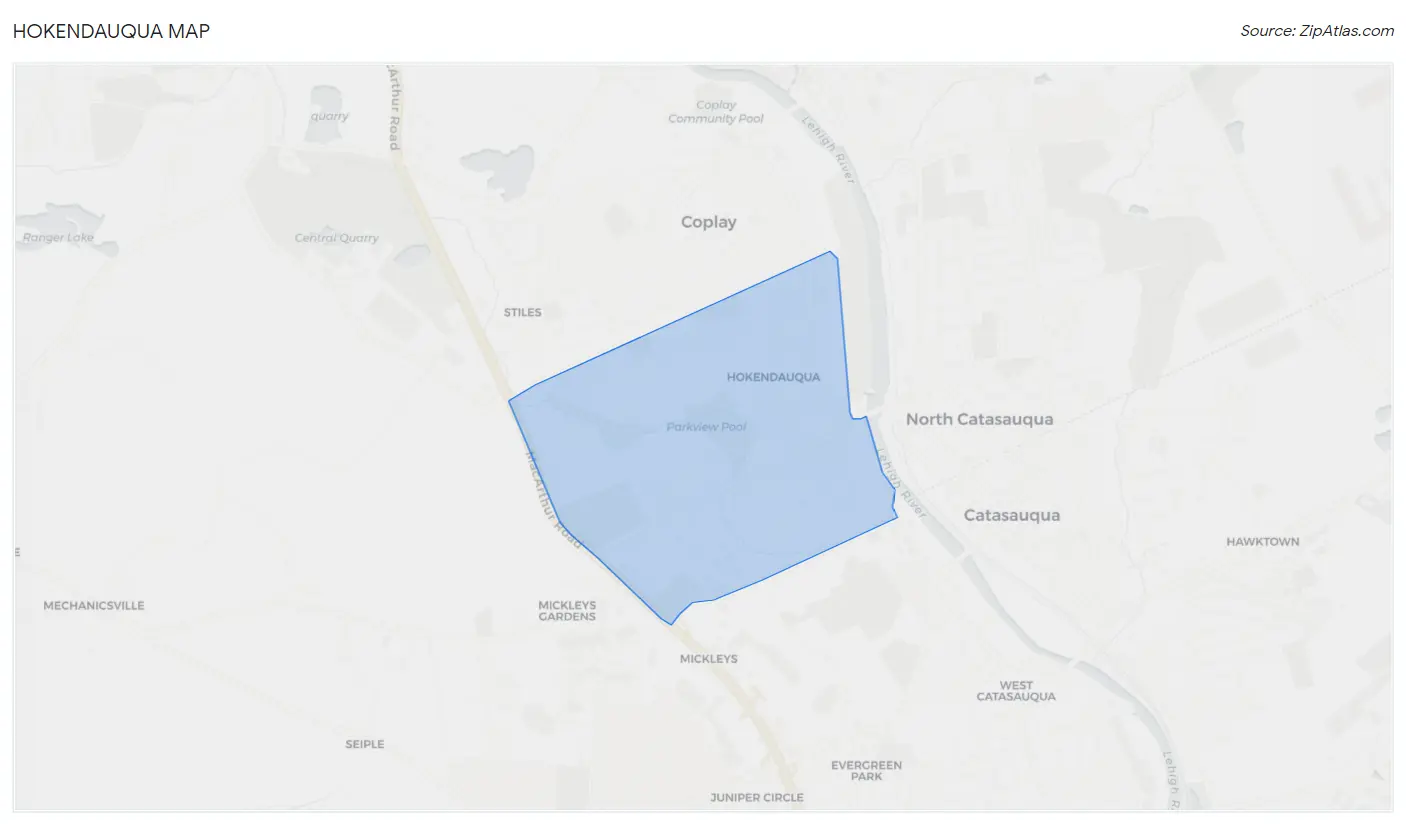
Hokendauqua Overview
$43,470
PER CAPITA INCOME
$112,639
AVG FAMILY INCOME
$83,750
AVG HOUSEHOLD INCOME
25.0%
WAGE / INCOME GAP [ % ]
75.0¢/ $1
WAGE / INCOME GAP [ $ ]
0.43
INEQUALITY / GINI INDEX
2,960
TOTAL POPULATION
1,428
MALE POPULATION
1,532
FEMALE POPULATION
93.21
MALES / 100 FEMALES
107.28
FEMALES / 100 MALES
42.6
MEDIAN AGE
3.3
AVG FAMILY SIZE
2.4
AVG HOUSEHOLD SIZE
1,947
LABOR FORCE [ PEOPLE ]
73.8%
PERCENT IN LABOR FORCE
4.6%
UNEMPLOYMENT RATE
Hokendauqua Area Codes
Income in Hokendauqua
Income Overview in Hokendauqua
Per Capita Income in Hokendauqua is $43,470, while median incomes of families and households are $112,639 and $83,750 respectively.
| Characteristic | Number | Measure |
| Per Capita Income | 2,960 | $43,470 |
| Median Family Income | 697 | $112,639 |
| Mean Family Income | 697 | $127,228 |
| Median Household Income | 1,220 | $83,750 |
| Mean Household Income | 1,220 | $102,582 |
| Income Deficit | 697 | $0 |
| Wage / Income Gap (%) | 2,960 | 25.04% |
| Wage / Income Gap ($) | 2,960 | 74.96¢ per $1 |
| Gini / Inequality Index | 2,960 | 0.43 |
Earnings by Sex in Hokendauqua
Average Earnings in Hokendauqua are $31,867, $39,762 for men and $29,804 for women, a difference of 25.0%.
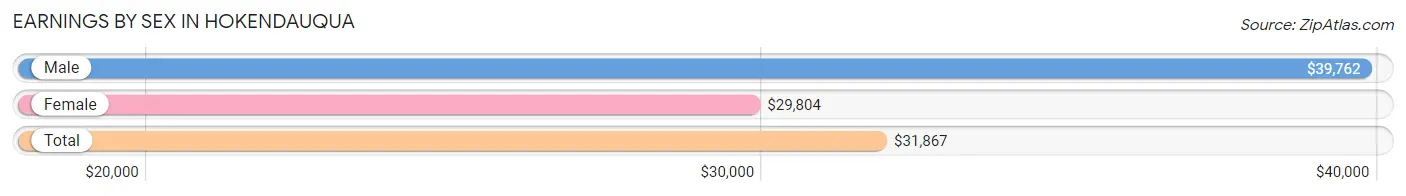
| Sex | Number | Average Earnings |
| Male | 1,082 (54.4%) | $39,762 |
| Female | 908 (45.6%) | $29,804 |
| Total | 1,990 (100.0%) | $31,867 |
Earnings by Sex by Income Bracket in Hokendauqua
The most common earnings brackets in Hokendauqua are $25,000 to $29,999 for men (261 | 24.1%) and $25,000 to $29,999 for women (204 | 22.5%).
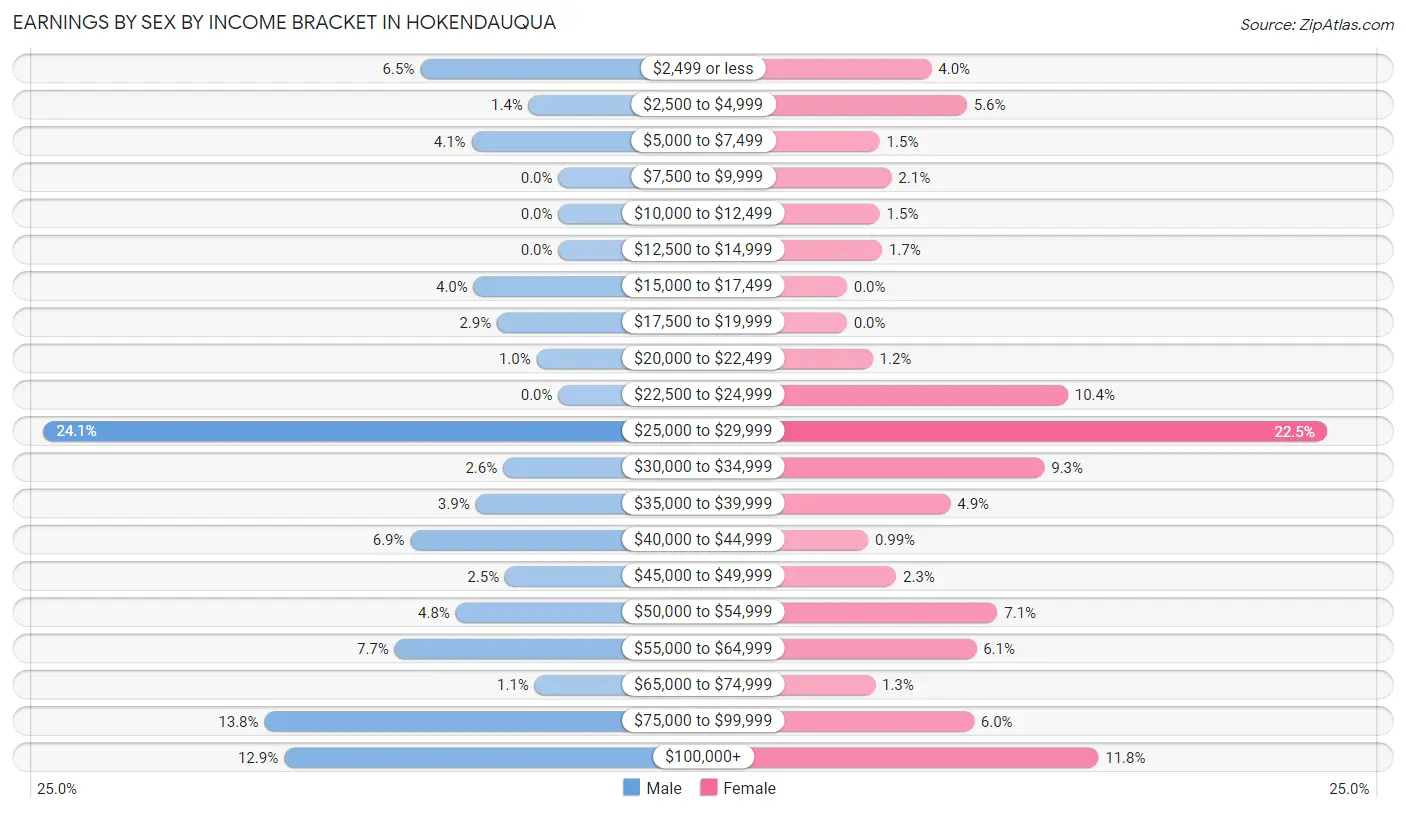
| Income | Male | Female |
| $2,499 or less | 70 (6.5%) | 36 (4.0%) |
| $2,500 to $4,999 | 15 (1.4%) | 51 (5.6%) |
| $5,000 to $7,499 | 44 (4.1%) | 14 (1.5%) |
| $7,500 to $9,999 | 0 (0.0%) | 19 (2.1%) |
| $10,000 to $12,499 | 0 (0.0%) | 14 (1.5%) |
| $12,500 to $14,999 | 0 (0.0%) | 15 (1.7%) |
| $15,000 to $17,499 | 43 (4.0%) | 0 (0.0%) |
| $17,500 to $19,999 | 31 (2.9%) | 0 (0.0%) |
| $20,000 to $22,499 | 11 (1.0%) | 11 (1.2%) |
| $22,500 to $24,999 | 0 (0.0%) | 94 (10.3%) |
| $25,000 to $29,999 | 261 (24.1%) | 204 (22.5%) |
| $30,000 to $34,999 | 28 (2.6%) | 84 (9.2%) |
| $35,000 to $39,999 | 42 (3.9%) | 44 (4.9%) |
| $40,000 to $44,999 | 75 (6.9%) | 9 (1.0%) |
| $45,000 to $49,999 | 27 (2.5%) | 21 (2.3%) |
| $50,000 to $54,999 | 52 (4.8%) | 64 (7.0%) |
| $55,000 to $64,999 | 83 (7.7%) | 55 (6.1%) |
| $65,000 to $74,999 | 12 (1.1%) | 12 (1.3%) |
| $75,000 to $99,999 | 149 (13.8%) | 54 (5.9%) |
| $100,000+ | 139 (12.9%) | 107 (11.8%) |
| Total | 1,082 (100.0%) | 908 (100.0%) |
Earnings by Sex by Educational Attainment in Hokendauqua
Average earnings in Hokendauqua are $44,714 for men and $31,932 for women, a difference of 28.6%. Men with an educational attainment of graduate degree enjoy the highest average annual earnings of $141,452, while those with college or associate's degree education earn the least with $29,926. Women with an educational attainment of graduate degree earn the most with the average annual earnings of $101,023, while those with bachelor's degree education have the smallest earnings of $26,408.
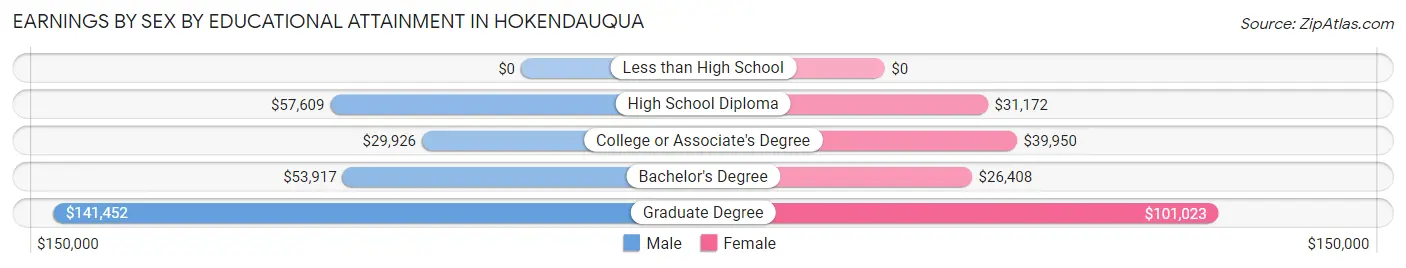
| Educational Attainment | Male Income | Female Income |
| Less than High School | - | - |
| High School Diploma | $57,609 | $31,172 |
| College or Associate's Degree | $29,926 | $39,950 |
| Bachelor's Degree | $53,917 | $26,408 |
| Graduate Degree | $141,452 | $101,023 |
| Total | $44,714 | $31,932 |
Family Income in Hokendauqua
Family Income Brackets in Hokendauqua
According to the Hokendauqua family income data, there are 185 families falling into the $100,000 to $149,999 income range, which is the most common income bracket and makes up 26.5% of all families.
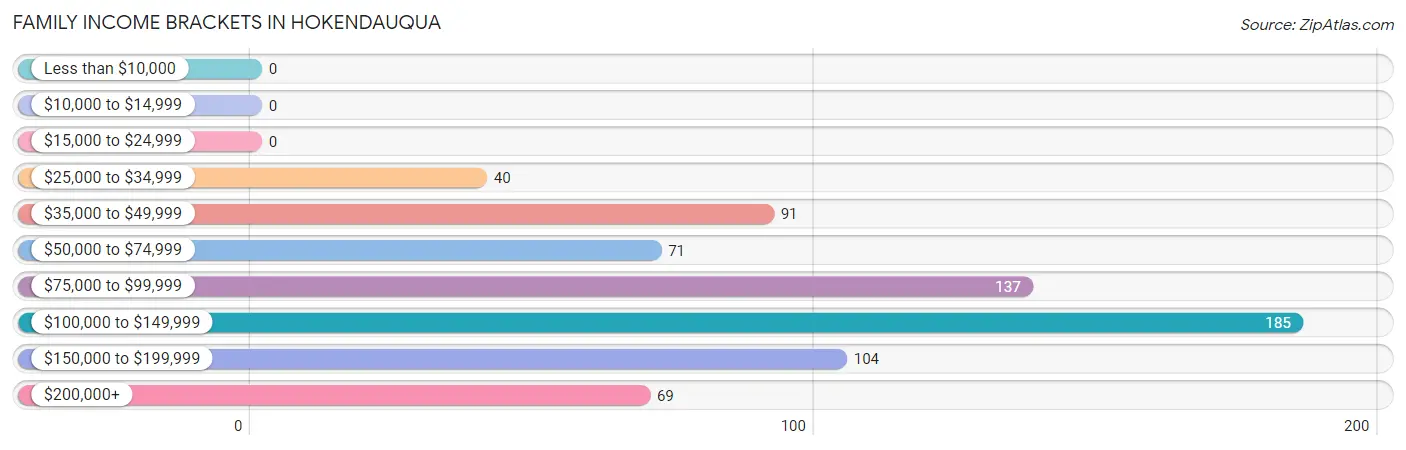
| Income Bracket | # Families | % Families |
| Less than $10,000 | 0 | 0.0% |
| $10,000 to $14,999 | 0 | 0.0% |
| $15,000 to $24,999 | 0 | 0.0% |
| $25,000 to $34,999 | 40 | 5.7% |
| $35,000 to $49,999 | 91 | 13.1% |
| $50,000 to $74,999 | 71 | 10.2% |
| $75,000 to $99,999 | 137 | 19.7% |
| $100,000 to $149,999 | 185 | 26.5% |
| $150,000 to $199,999 | 104 | 14.9% |
| $200,000+ | 69 | 9.9% |
Family Income by Famaliy Size in Hokendauqua
3-person families (110 | 15.8%) account for the highest median family income in Hokendauqua with $151,250 per family, while 3-person families (110 | 15.8%) have the highest median income of $50,417 per family member.
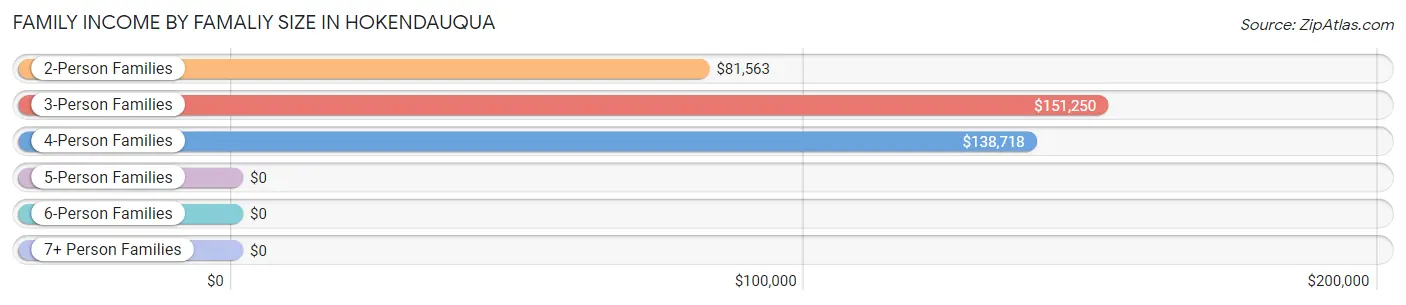
| Income Bracket | # Families | Median Income |
| 2-Person Families | 355 (50.9%) | $81,563 |
| 3-Person Families | 110 (15.8%) | $151,250 |
| 4-Person Families | 121 (17.4%) | $138,718 |
| 5-Person Families | 38 (5.4%) | $0 |
| 6-Person Families | 57 (8.2%) | $0 |
| 7+ Person Families | 16 (2.3%) | $0 |
| Total | 697 (100.0%) | $112,639 |
Family Income by Number of Earners in Hokendauqua
The median family income in Hokendauqua is $112,639, with families comprising 3+ earners (228) having the highest median family income of $139,968, while families with no earners (51) have the lowest median family income of $46,250, accounting for 32.7% and 7.3% of families, respectively.
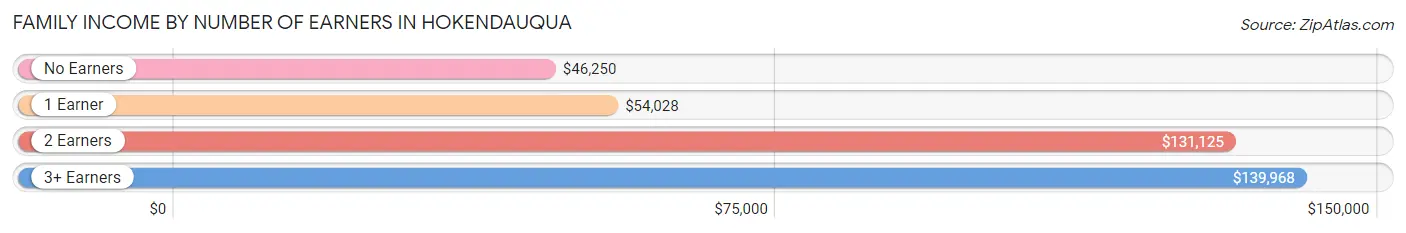
| Number of Earners | # Families | Median Income |
| No Earners | 51 (7.3%) | $46,250 |
| 1 Earner | 211 (30.3%) | $54,028 |
| 2 Earners | 207 (29.7%) | $131,125 |
| 3+ Earners | 228 (32.7%) | $139,968 |
| Total | 697 (100.0%) | $112,639 |
Household Income in Hokendauqua
Household Income Brackets in Hokendauqua
With 260 households falling in the category, the $75,000 to $99,999 income range is the most frequent in Hokendauqua, accounting for 21.3% of all households. In contrast, only 13 households (1.1%) fall into the $10,000 to $14,999 income bracket, making it the least populous group.
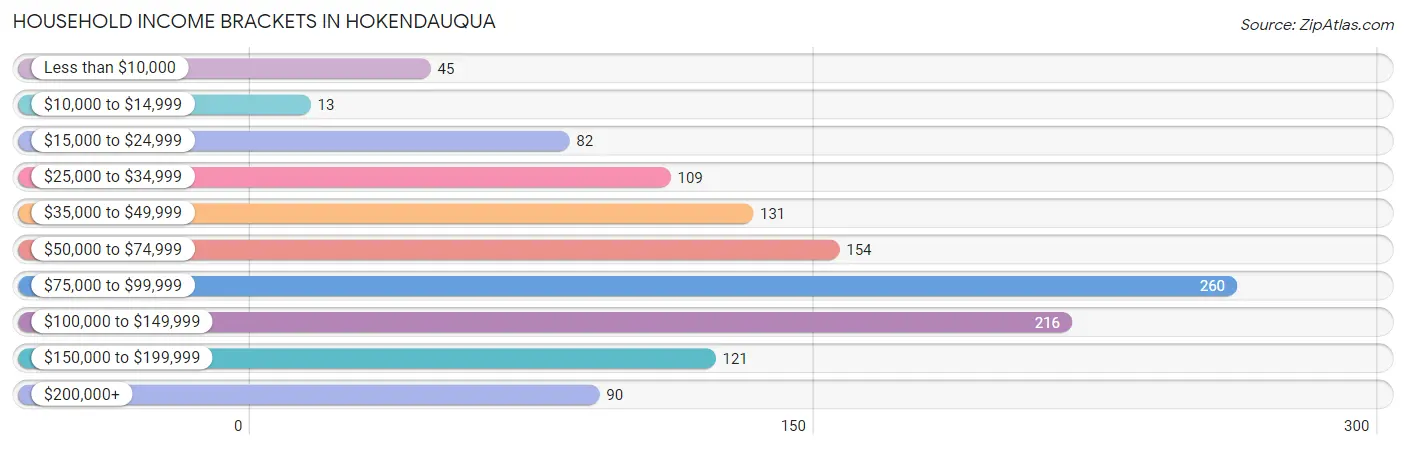
| Income Bracket | # Households | % Households |
| Less than $10,000 | 45 | 3.7% |
| $10,000 to $14,999 | 13 | 1.1% |
| $15,000 to $24,999 | 82 | 6.7% |
| $25,000 to $34,999 | 109 | 8.9% |
| $35,000 to $49,999 | 131 | 10.7% |
| $50,000 to $74,999 | 154 | 12.6% |
| $75,000 to $99,999 | 260 | 21.3% |
| $100,000 to $149,999 | 216 | 17.7% |
| $150,000 to $199,999 | 121 | 9.9% |
| $200,000+ | 90 | 7.4% |
Household Income by Householder Age in Hokendauqua
The median household income in Hokendauqua is $83,750, with the highest median household income of $138,896 found in the 45 to 64 years age bracket for the primary householder. A total of 424 households (34.7%) fall into this category. Meanwhile, the 15 to 24 years age bracket for the primary householder has the lowest median household income of $0, with 22 households (1.8%) in this group.
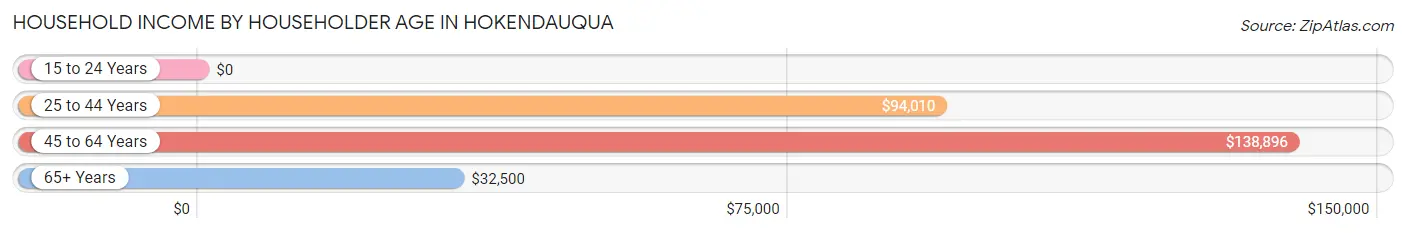
| Income Bracket | # Households | Median Income |
| 15 to 24 Years | 22 (1.8%) | $0 |
| 25 to 44 Years | 374 (30.7%) | $94,010 |
| 45 to 64 Years | 424 (34.7%) | $138,896 |
| 65+ Years | 400 (32.8%) | $32,500 |
| Total | 1,220 (100.0%) | $83,750 |
Poverty in Hokendauqua
Income Below Poverty by Sex and Age in Hokendauqua
With 2.4% poverty level for males and 1.6% for females among the residents of Hokendauqua, 75 year old and over males and 65 to 74 year old females are the most vulnerable to poverty, with 10 males (19.6%) and 11 females (10.0%) in their respective age groups living below the poverty level.
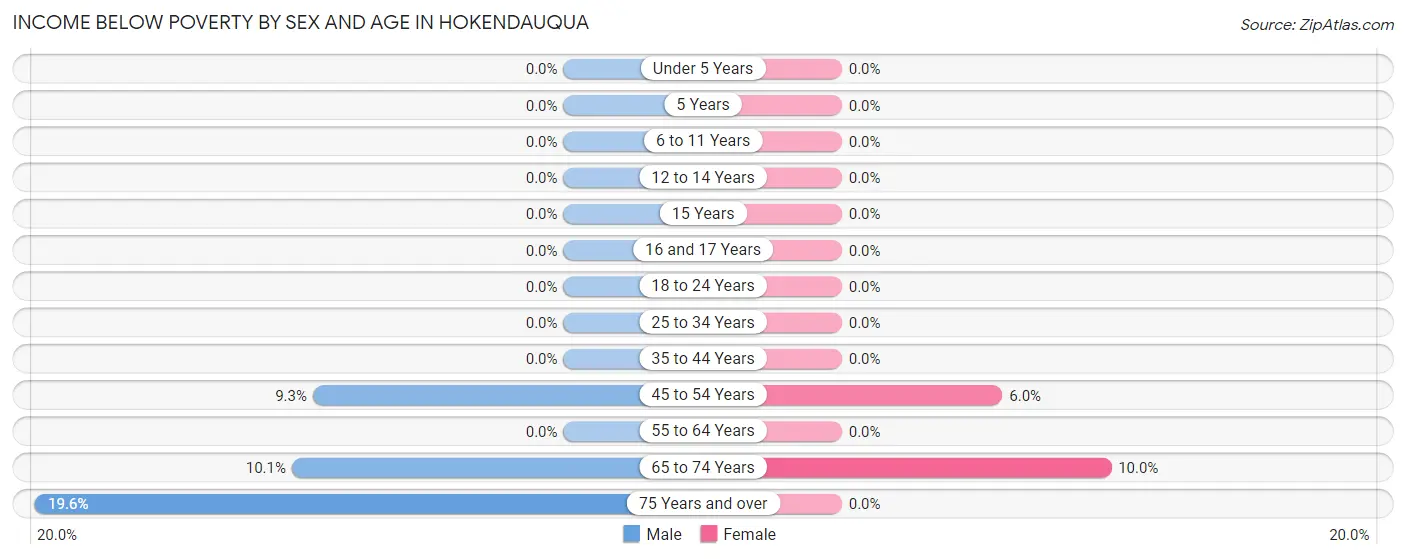
| Age Bracket | Male | Female |
| Under 5 Years | 0 (0.0%) | 0 (0.0%) |
| 5 Years | 0 (0.0%) | 0 (0.0%) |
| 6 to 11 Years | 0 (0.0%) | 0 (0.0%) |
| 12 to 14 Years | 0 (0.0%) | 0 (0.0%) |
| 15 Years | 0 (0.0%) | 0 (0.0%) |
| 16 and 17 Years | 0 (0.0%) | 0 (0.0%) |
| 18 to 24 Years | 0 (0.0%) | 0 (0.0%) |
| 25 to 34 Years | 0 (0.0%) | 0 (0.0%) |
| 35 to 44 Years | 0 (0.0%) | 0 (0.0%) |
| 45 to 54 Years | 12 (9.3%) | 13 (6.0%) |
| 55 to 64 Years | 0 (0.0%) | 0 (0.0%) |
| 65 to 74 Years | 12 (10.1%) | 11 (10.0%) |
| 75 Years and over | 10 (19.6%) | 0 (0.0%) |
| Total | 34 (2.4%) | 24 (1.6%) |
Income Above Poverty by Sex and Age in Hokendauqua
According to the poverty statistics in Hokendauqua, males aged under 5 years and females aged under 5 years are the age groups that are most secure financially, with 100.0% of males and 100.0% of females in these age groups living above the poverty line.
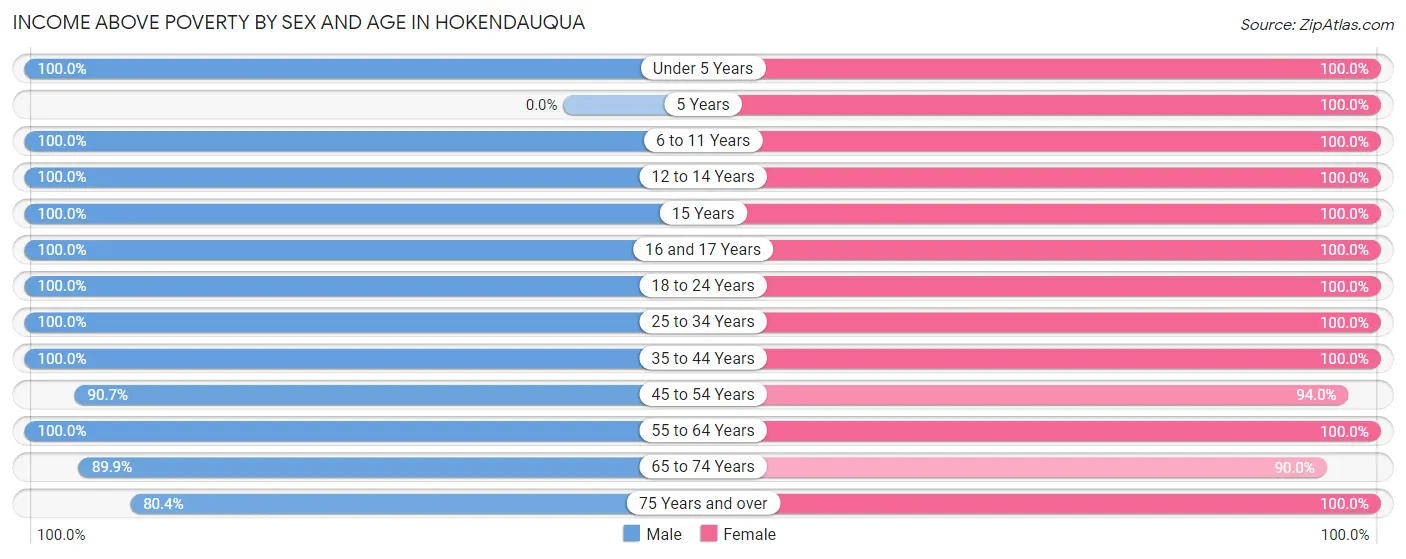
| Age Bracket | Male | Female |
| Under 5 Years | 72 (100.0%) | 17 (100.0%) |
| 5 Years | 0 (0.0%) | 27 (100.0%) |
| 6 to 11 Years | 44 (100.0%) | 62 (100.0%) |
| 12 to 14 Years | 11 (100.0%) | 32 (100.0%) |
| 15 Years | 12 (100.0%) | 45 (100.0%) |
| 16 and 17 Years | 26 (100.0%) | 29 (100.0%) |
| 18 to 24 Years | 135 (100.0%) | 106 (100.0%) |
| 25 to 34 Years | 229 (100.0%) | 310 (100.0%) |
| 35 to 44 Years | 314 (100.0%) | 74 (100.0%) |
| 45 to 54 Years | 117 (90.7%) | 205 (94.0%) |
| 55 to 64 Years | 286 (100.0%) | 232 (100.0%) |
| 65 to 74 Years | 107 (89.9%) | 99 (90.0%) |
| 75 Years and over | 41 (80.4%) | 270 (100.0%) |
| Total | 1,394 (97.6%) | 1,508 (98.4%) |
Income Below Poverty Among Married-Couple Families in Hokendauqua
| Children | Above Poverty | Below Poverty |
| No Children | 395 (100.0%) | 0 (0.0%) |
| 1 or 2 Children | 119 (100.0%) | 0 (0.0%) |
| 3 or 4 Children | 31 (100.0%) | 0 (0.0%) |
| 5 or more Children | 0 (0.0%) | 0 (0.0%) |
| Total | 545 (100.0%) | 0 (0.0%) |
Income Below Poverty Among Single-Parent Households in Hokendauqua
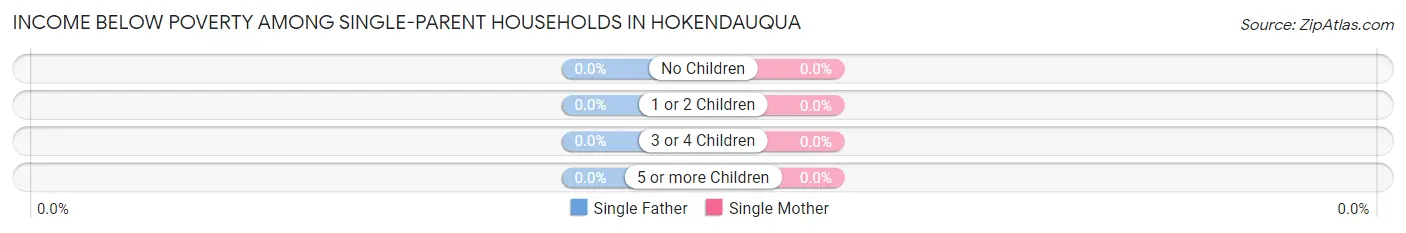
| Children | Single Father | Single Mother |
| No Children | 0 (0.0%) | 0 (0.0%) |
| 1 or 2 Children | 0 (0.0%) | 0 (0.0%) |
| 3 or 4 Children | 0 (0.0%) | 0 (0.0%) |
| 5 or more Children | 0 (0.0%) | 0 (0.0%) |
| Total | 0 (0.0%) | 0 (0.0%) |
Income Below Poverty Among Married-Couple vs Single-Parent Households in Hokendauqua
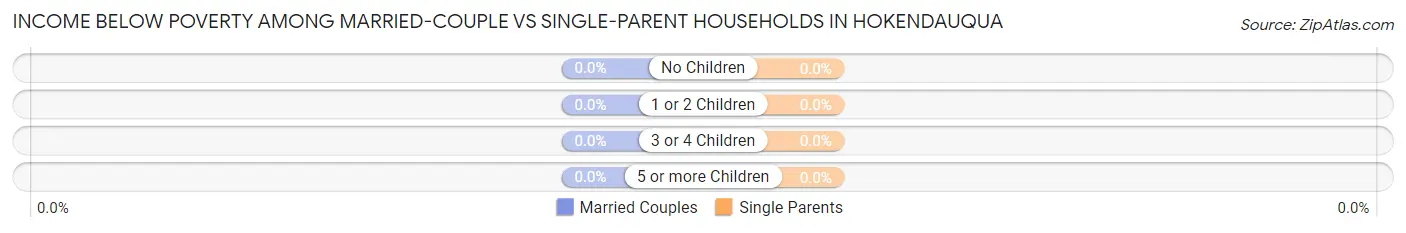
| Children | Married-Couple Families | Single-Parent Households |
| No Children | 0 (0.0%) | 0 (0.0%) |
| 1 or 2 Children | 0 (0.0%) | 0 (0.0%) |
| 3 or 4 Children | 0 (0.0%) | 0 (0.0%) |
| 5 or more Children | 0 (0.0%) | 0 (0.0%) |
| Total | 0 (0.0%) | 0 (0.0%) |
Race in Hokendauqua
The most populous races in Hokendauqua are White / Caucasian (2,661 | 89.9%), Asian (160 | 5.4%), and Hispanic or Latino (96 | 3.2%).
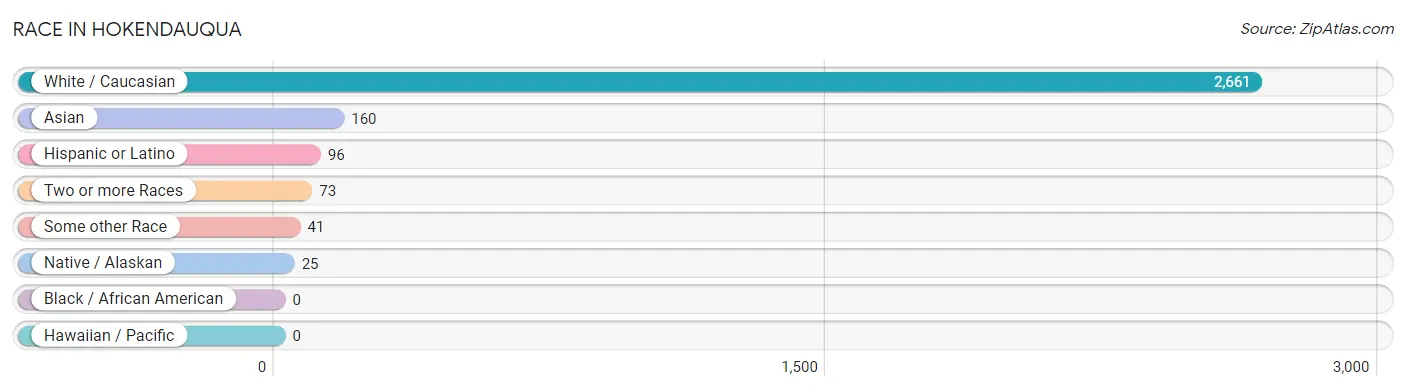
| Race | # Population | % Population |
| Asian | 160 | 5.4% |
| Black / African American | 0 | 0.0% |
| Hawaiian / Pacific | 0 | 0.0% |
| Hispanic or Latino | 96 | 3.2% |
| Native / Alaskan | 25 | 0.8% |
| White / Caucasian | 2,661 | 89.9% |
| Two or more Races | 73 | 2.5% |
| Some other Race | 41 | 1.4% |
| Total | 2,960 | 100.0% |
Ancestry in Hokendauqua
The most populous ancestries reported in Hokendauqua are German (734 | 24.8%), Irish (337 | 11.4%), Arab (328 | 11.1%), Syrian (328 | 11.1%), and Italian (222 | 7.5%), together accounting for 65.8% of all Hokendauqua residents.
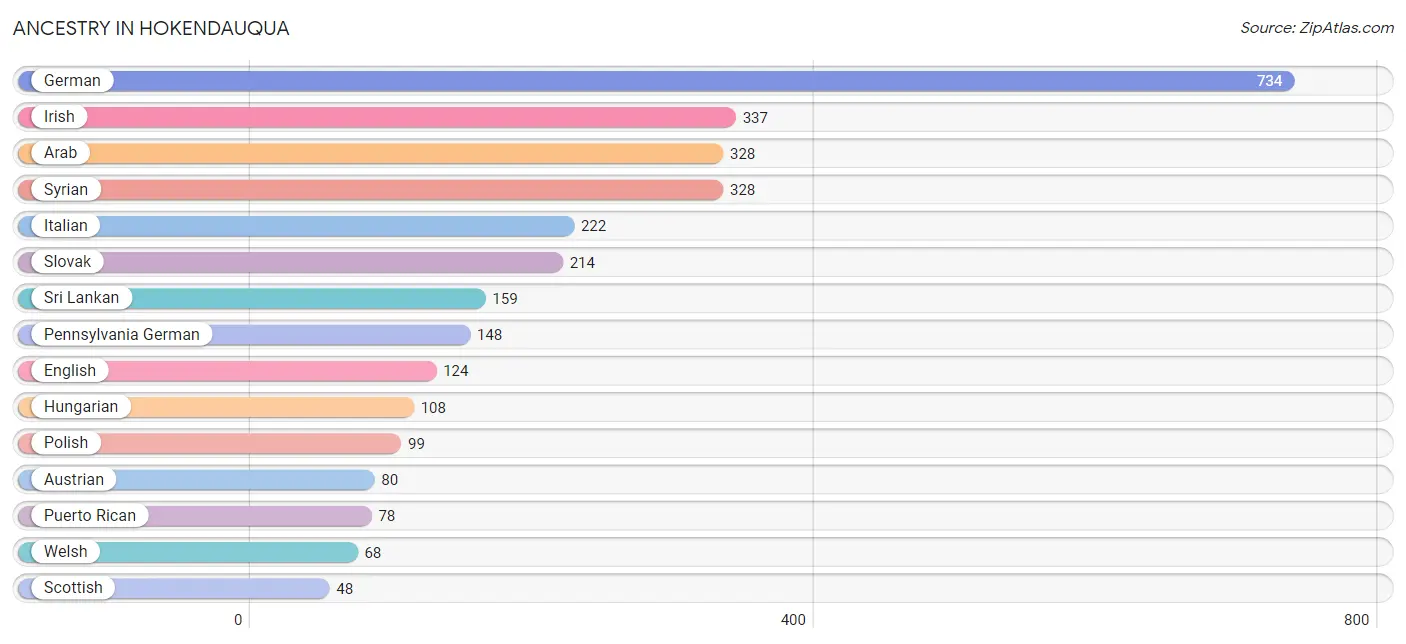
| Ancestry | # Population | % Population |
| American | 42 | 1.4% |
| Arab | 328 | 11.1% |
| Austrian | 80 | 2.7% |
| Bhutanese | 1 | 0.0% |
| Burmese | 25 | 0.8% |
| Canadian | 12 | 0.4% |
| Central American Indian | 25 | 0.8% |
| Cherokee | 33 | 1.1% |
| Czech | 28 | 0.9% |
| Dominican | 18 | 0.6% |
| Dutch | 32 | 1.1% |
| English | 124 | 4.2% |
| German | 734 | 24.8% |
| Hungarian | 108 | 3.6% |
| Irish | 337 | 11.4% |
| Italian | 222 | 7.5% |
| Pennsylvania German | 148 | 5.0% |
| Polish | 99 | 3.3% |
| Puerto Rican | 78 | 2.6% |
| Russian | 33 | 1.1% |
| Scotch-Irish | 12 | 0.4% |
| Scottish | 48 | 1.6% |
| Slovak | 214 | 7.2% |
| Sri Lankan | 159 | 5.4% |
| Syrian | 328 | 11.1% |
| Ukrainian | 11 | 0.4% |
| Welsh | 68 | 2.3% | View All 27 Rows |
Immigrants in Hokendauqua
The most numerous immigrant groups reported in Hokendauqua came from Asia (205 | 6.9%), Syria (172 | 5.8%), Western Asia (172 | 5.8%), Europe (44 | 1.5%), and Germany (32 | 1.1%), together accounting for 21.1% of all Hokendauqua residents.
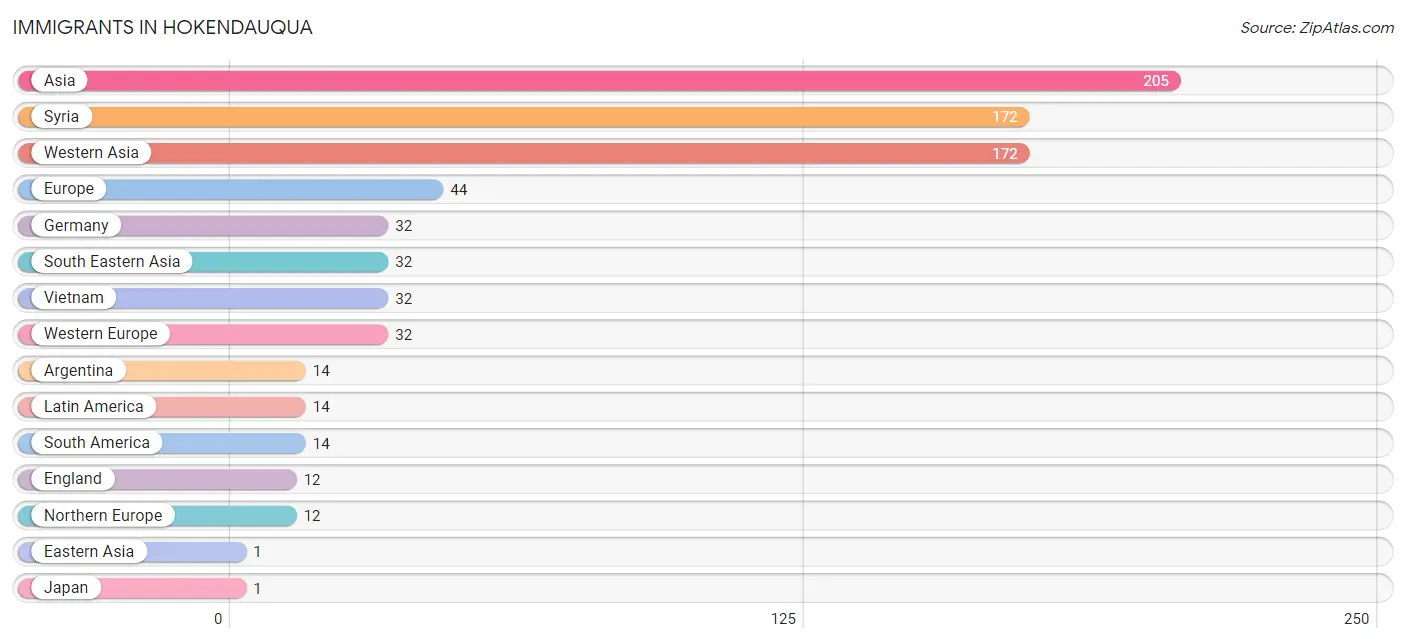
| Immigration Origin | # Population | % Population |
| Argentina | 14 | 0.5% |
| Asia | 205 | 6.9% |
| Eastern Asia | 1 | 0.0% |
| England | 12 | 0.4% |
| Europe | 44 | 1.5% |
| Germany | 32 | 1.1% |
| Japan | 1 | 0.0% |
| Latin America | 14 | 0.5% |
| Northern Europe | 12 | 0.4% |
| South America | 14 | 0.5% |
| South Eastern Asia | 32 | 1.1% |
| Syria | 172 | 5.8% |
| Vietnam | 32 | 1.1% |
| Western Asia | 172 | 5.8% |
| Western Europe | 32 | 1.1% | View All 15 Rows |
Sex and Age in Hokendauqua
Sex and Age in Hokendauqua
The most populous age groups in Hokendauqua are 35 to 39 Years (215 | 15.1%) for men and 75 to 79 Years (180 | 11.7%) for women.
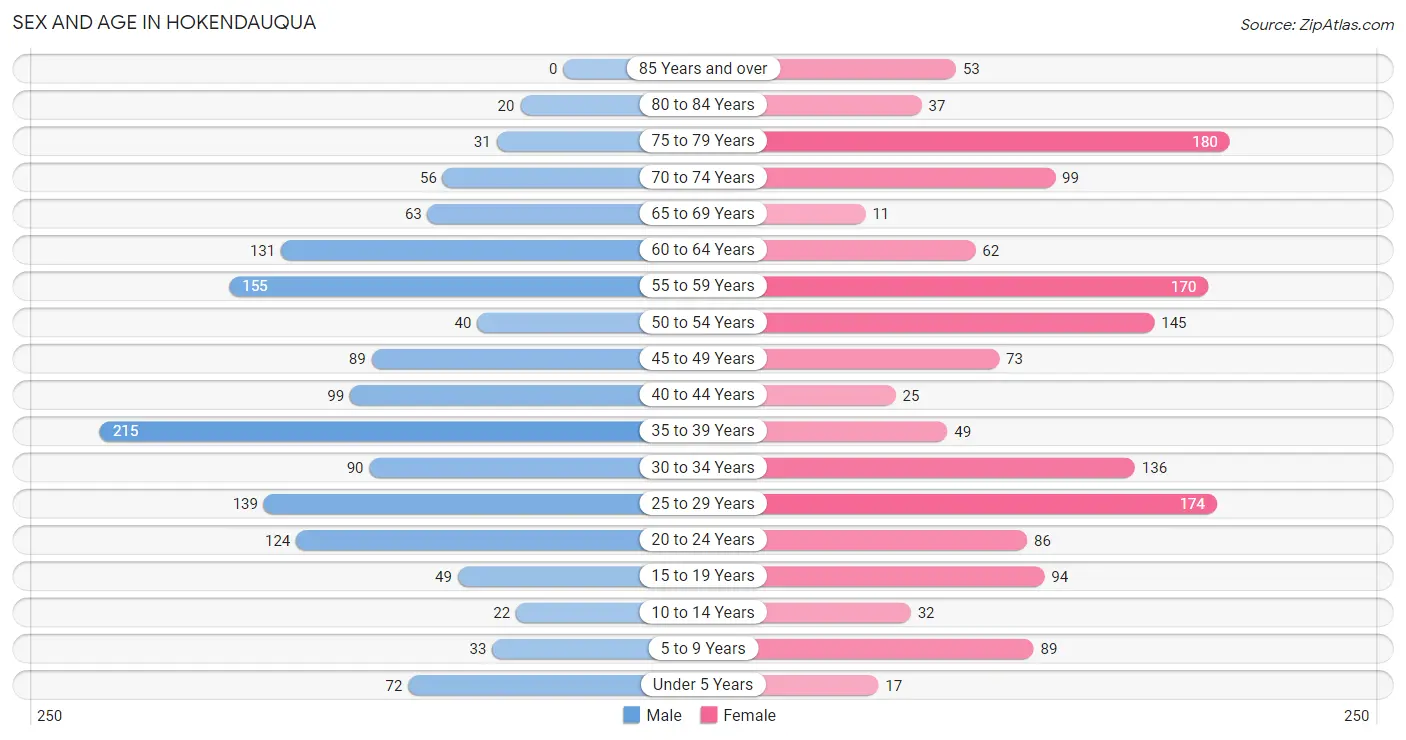
| Age Bracket | Male | Female |
| Under 5 Years | 72 (5.0%) | 17 (1.1%) |
| 5 to 9 Years | 33 (2.3%) | 89 (5.8%) |
| 10 to 14 Years | 22 (1.5%) | 32 (2.1%) |
| 15 to 19 Years | 49 (3.4%) | 94 (6.1%) |
| 20 to 24 Years | 124 (8.7%) | 86 (5.6%) |
| 25 to 29 Years | 139 (9.7%) | 174 (11.4%) |
| 30 to 34 Years | 90 (6.3%) | 136 (8.9%) |
| 35 to 39 Years | 215 (15.1%) | 49 (3.2%) |
| 40 to 44 Years | 99 (6.9%) | 25 (1.6%) |
| 45 to 49 Years | 89 (6.2%) | 73 (4.8%) |
| 50 to 54 Years | 40 (2.8%) | 145 (9.5%) |
| 55 to 59 Years | 155 (10.8%) | 170 (11.1%) |
| 60 to 64 Years | 131 (9.2%) | 62 (4.1%) |
| 65 to 69 Years | 63 (4.4%) | 11 (0.7%) |
| 70 to 74 Years | 56 (3.9%) | 99 (6.5%) |
| 75 to 79 Years | 31 (2.2%) | 180 (11.7%) |
| 80 to 84 Years | 20 (1.4%) | 37 (2.4%) |
| 85 Years and over | 0 (0.0%) | 53 (3.5%) |
| Total | 1,428 (100.0%) | 1,532 (100.0%) |
Families and Households in Hokendauqua
Median Family Size in Hokendauqua
The median family size in Hokendauqua is 3.32 persons per family, with married-couple families (545 | 78.2%) accounting for the largest median family size of 3.58 persons per family. On the other hand, single female/mother families (120 | 17.2%) represent the smallest median family size with 2.15 persons per family.
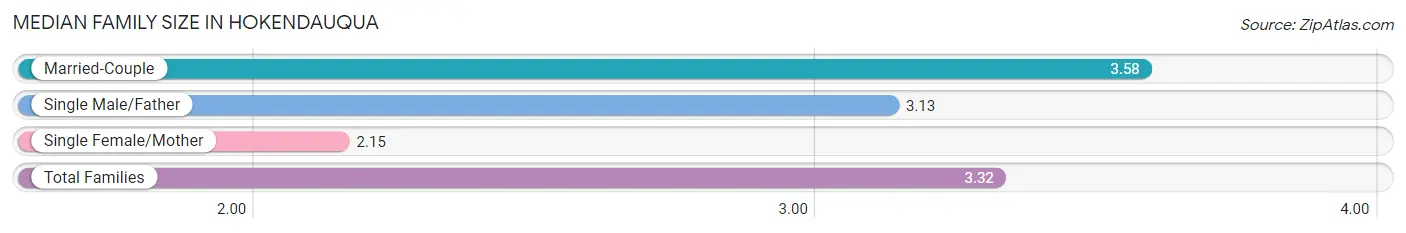
| Family Type | # Families | Family Size |
| Married-Couple | 545 (78.2%) | 3.58 |
| Single Male/Father | 32 (4.6%) | 3.13 |
| Single Female/Mother | 120 (17.2%) | 2.15 |
| Total Families | 697 (100.0%) | 3.32 |
Median Household Size in Hokendauqua
The median household size in Hokendauqua is 2.43 persons per household, with married-couple households (545 | 44.7%) accounting for the largest median household size of 3.58 persons per household. non-family households (523 | 42.9%) represent the smallest median household size with 1.22 persons per household.
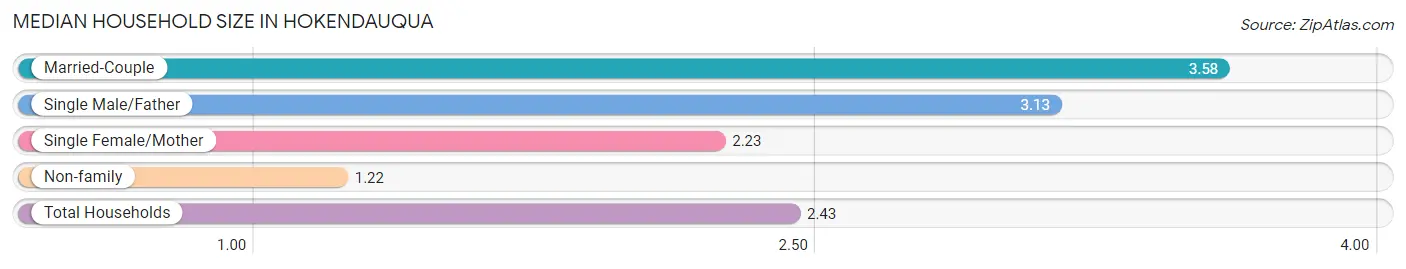
| Household Type | # Households | Household Size |
| Married-Couple | 545 (44.7%) | 3.58 |
| Single Male/Father | 32 (2.6%) | 3.13 |
| Single Female/Mother | 120 (9.8%) | 2.23 |
| Non-family | 523 (42.9%) | 1.22 |
| Total Households | 1,220 (100.0%) | 2.43 |
Household Size by Marriage Status in Hokendauqua
Out of a total of 1,220 households in Hokendauqua, 697 (57.1%) are family households, while 523 (42.9%) are nonfamily households. The most numerous type of family households are 2-person households, comprising 348, and the most common type of nonfamily households are 1-person households, comprising 412.
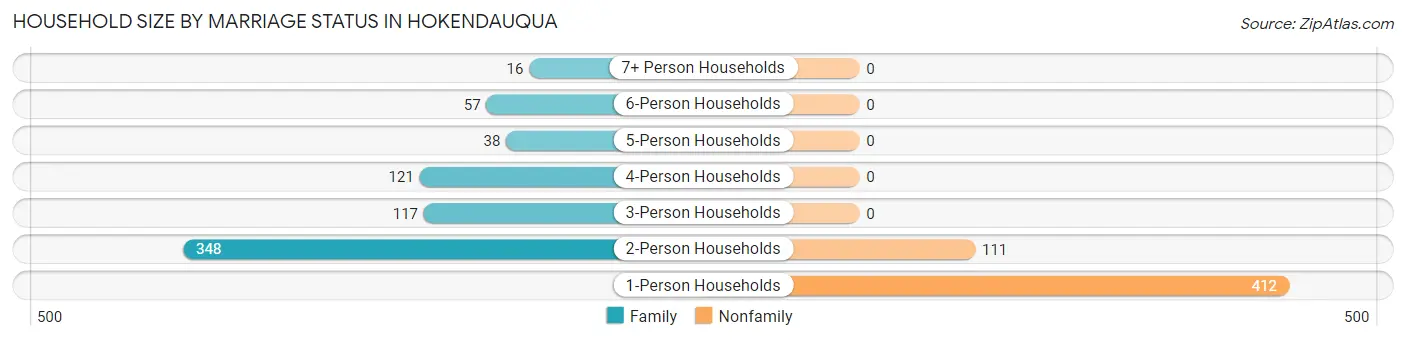
| Household Size | Family Households | Nonfamily Households |
| 1-Person Households | - | 412 (33.8%) |
| 2-Person Households | 348 (28.5%) | 111 (9.1%) |
| 3-Person Households | 117 (9.6%) | 0 (0.0%) |
| 4-Person Households | 121 (9.9%) | 0 (0.0%) |
| 5-Person Households | 38 (3.1%) | 0 (0.0%) |
| 6-Person Households | 57 (4.7%) | 0 (0.0%) |
| 7+ Person Households | 16 (1.3%) | 0 (0.0%) |
| Total | 697 (57.1%) | 523 (42.9%) |
Female Fertility in Hokendauqua
Fertility by Age in Hokendauqua
| Age Bracket | Women with Births | Births / 1,000 Women |
| 15 to 19 years | 0 (0.0%) | 0.0 |
| 20 to 34 years | 0 (0.0%) | 0.0 |
| 35 to 50 years | 0 (0.0%) | 0.0 |
| Total | 0 (0.0%) | 0.0 |
Fertility by Age by Marriage Status in Hokendauqua
| Age Bracket | Married | Unmarried |
| 15 to 19 years | 0 (0.0%) | 0 (0.0%) |
| 20 to 34 years | 0 (0.0%) | 0 (0.0%) |
| 35 to 50 years | 0 (0.0%) | 0 (0.0%) |
| Total | 0 (0.0%) | 0 (0.0%) |
Fertility by Education in Hokendauqua
| Educational Attainment | Women with Births | Births / 1,000 Women |
| Less than High School | 0 (0.0%) | 0.0 |
| High School Diploma | 0 (0.0%) | 0.0 |
| College or Associate's Degree | 0 (0.0%) | 0.0 |
| Bachelor's Degree | 0 (0.0%) | 0.0 |
| Graduate Degree | 0 (0.0%) | 0.0 |
| Total | 0 (0.0%) | 0.0 |
Fertility by Education by Marriage Status in Hokendauqua
| Educational Attainment | Married | Unmarried |
| Less than High School | 0 (0.0%) | 0 (0.0%) |
| High School Diploma | 0 (0.0%) | 0 (0.0%) |
| College or Associate's Degree | 0 (0.0%) | 0 (0.0%) |
| Bachelor's Degree | 0 (0.0%) | 0 (0.0%) |
| Graduate Degree | 0 (0.0%) | 0 (0.0%) |
| Total | 0 (0.0%) | 0 (0.0%) |
Employment Characteristics in Hokendauqua
Employment by Class of Employer in Hokendauqua
Among the 1,820 employed individuals in Hokendauqua, private company employees (1,273 | 70.0%), not-for-profit organizations (201 | 11.0%), and local government employees (187 | 10.3%) make up the most common classes of employment.
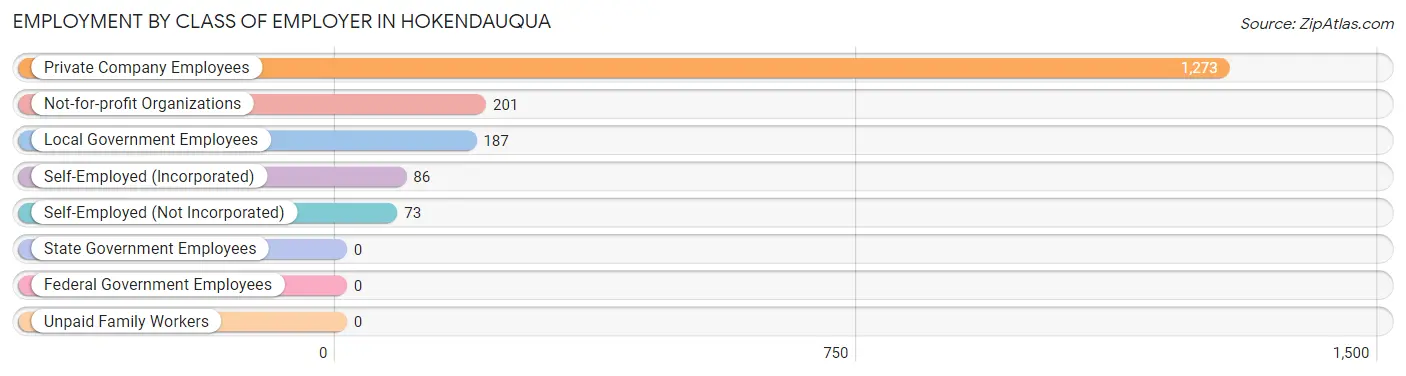
| Employer Class | # Employees | % Employees |
| Private Company Employees | 1,273 | 70.0% |
| Self-Employed (Incorporated) | 86 | 4.7% |
| Self-Employed (Not Incorporated) | 73 | 4.0% |
| Not-for-profit Organizations | 201 | 11.0% |
| Local Government Employees | 187 | 10.3% |
| State Government Employees | 0 | 0.0% |
| Federal Government Employees | 0 | 0.0% |
| Unpaid Family Workers | 0 | 0.0% |
| Total | 1,820 | 100.0% |
Employment Status by Age in Hokendauqua
According to the labor force statistics for Hokendauqua, out of the total population over 16 years of age (2,638), 73.8% or 1,947 individuals are in the labor force, with 4.6% or 90 of them unemployed. The age group with the highest labor force participation rate is 30 to 34 years, with 100.0% or 226 individuals in the labor force. Within the labor force, the 60 to 64 years age range has the highest percentage of unemployed individuals, with 46.1% or 77 of them being unemployed.
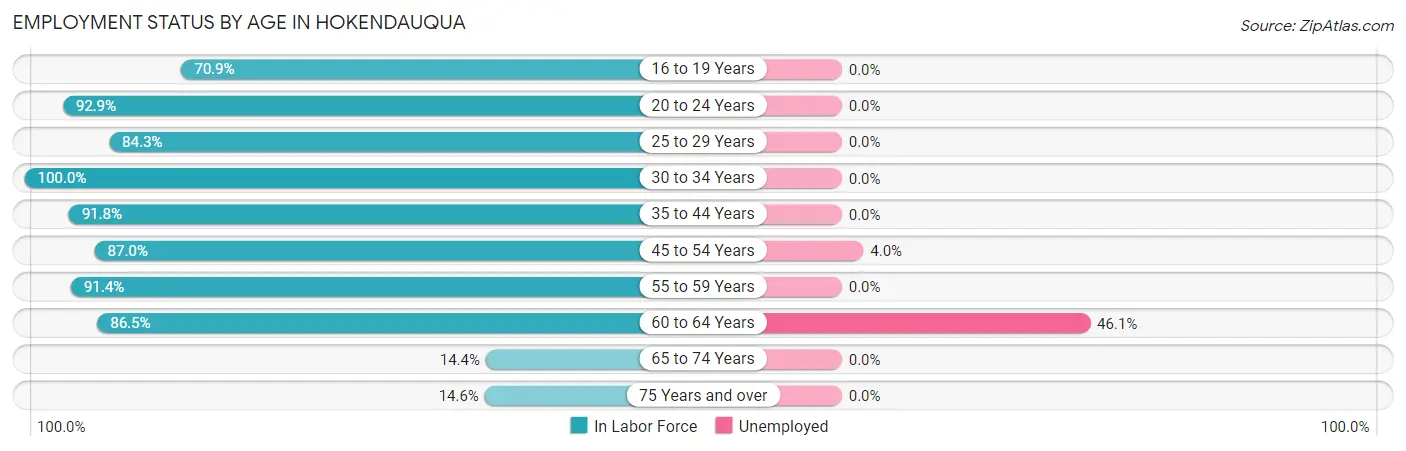
| Age Bracket | In Labor Force | Unemployed |
| 16 to 19 Years | 61 (70.9%) | 0 (0.0%) |
| 20 to 24 Years | 195 (92.9%) | 0 (0.0%) |
| 25 to 29 Years | 264 (84.3%) | 0 (0.0%) |
| 30 to 34 Years | 226 (100.0%) | 0 (0.0%) |
| 35 to 44 Years | 356 (91.8%) | 0 (0.0%) |
| 45 to 54 Years | 302 (87.0%) | 12 (4.0%) |
| 55 to 59 Years | 297 (91.4%) | 0 (0.0%) |
| 60 to 64 Years | 167 (86.5%) | 77 (46.1%) |
| 65 to 74 Years | 33 (14.4%) | 0 (0.0%) |
| 75 Years and over | 47 (14.6%) | 0 (0.0%) |
| Total | 1,947 (73.8%) | 90 (4.6%) |
Employment Status by Educational Attainment in Hokendauqua
According to labor force statistics for Hokendauqua, 90.0% of individuals (1,613) out of the total population between 25 and 64 years of age (1,792) are in the labor force, with 5.5% or 89 of them being unemployed. The group with the highest labor force participation rate are those with the educational attainment of bachelor's degree or higher, with 100.0% or 727 individuals in the labor force. Within the labor force, individuals with college / associate degree education have the highest percentage of unemployment, with 15.3% or 89 of them being unemployed.
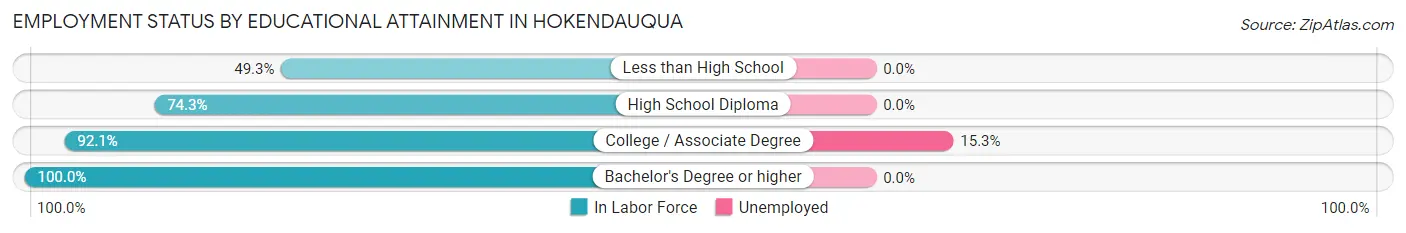
| Educational Attainment | In Labor Force | Unemployed |
| Less than High School | 37 (49.3%) | 0 (0.0%) |
| High School Diploma | 266 (74.3%) | 0 (0.0%) |
| College / Associate Degree | 582 (92.1%) | 97 (15.3%) |
| Bachelor's Degree or higher | 727 (100.0%) | 0 (0.0%) |
| Total | 1,613 (90.0%) | 99 (5.5%) |
Employment Occupations by Sex in Hokendauqua
Management, Business, Science and Arts Occupations
The most common Management, Business, Science and Arts occupations in Hokendauqua are Community & Social Service (287 | 15.4%), Computers, Engineering & Science (153 | 8.2%), Education Instruction & Library (141 | 7.6%), Business & Financial (100 | 5.4%), and Arts, Media & Entertainment (90 | 4.8%).
Management, Business, Science and Arts Occupations by Sex
Within the Management, Business, Science and Arts occupations in Hokendauqua, the most male-oriented occupations are Architecture & Engineering (100.0%), Arts, Media & Entertainment (90.0%), and Business & Financial (89.0%), while the most female-oriented occupations are Legal Services & Support (100.0%), Health Diagnosing & Treating (100.0%), and Health Technologists (100.0%).
| Occupation | Male | Female |
| Management | 19 (29.2%) | 46 (70.8%) |
| Business & Financial | 89 (89.0%) | 11 (11.0%) |
| Computers, Engineering & Science | 71 (46.4%) | 82 (53.6%) |
| Computers & Mathematics | 22 (48.9%) | 23 (51.1%) |
| Architecture & Engineering | 37 (100.0%) | 0 (0.0%) |
| Life, Physical & Social Science | 12 (16.9%) | 59 (83.1%) |
| Community & Social Service | 126 (43.9%) | 161 (56.1%) |
| Education, Arts & Media | 12 (31.6%) | 26 (68.4%) |
| Legal Services & Support | 0 (0.0%) | 18 (100.0%) |
| Education Instruction & Library | 33 (23.4%) | 108 (76.6%) |
| Arts, Media & Entertainment | 81 (90.0%) | 9 (10.0%) |
| Health Diagnosing & Treating | 0 (0.0%) | 78 (100.0%) |
| Health Technologists | 0 (0.0%) | 52 (100.0%) |
| Total (Category) | 305 (44.7%) | 378 (55.3%) |
| Total (Overall) | 967 (52.0%) | 892 (48.0%) |
Services Occupations
The most common Services occupations in Hokendauqua are Food Preparation & Serving (127 | 6.8%), Personal Care & Service (108 | 5.8%), Security & Protection (37 | 2.0%), Law Enforcement (37 | 2.0%), and Healthcare Support (29 | 1.6%).
Services Occupations by Sex
Within the Services occupations in Hokendauqua, the most male-oriented occupations are Security & Protection (100.0%), Law Enforcement (100.0%), and Food Preparation & Serving (11.8%), while the most female-oriented occupations are Healthcare Support (100.0%), Personal Care & Service (100.0%), and Food Preparation & Serving (88.2%).
| Occupation | Male | Female |
| Healthcare Support | 0 (0.0%) | 29 (100.0%) |
| Security & Protection | 37 (100.0%) | 0 (0.0%) |
| Firefighting & Prevention | 0 (0.0%) | 0 (0.0%) |
| Law Enforcement | 37 (100.0%) | 0 (0.0%) |
| Food Preparation & Serving | 15 (11.8%) | 112 (88.2%) |
| Cleaning & Maintenance | 0 (0.0%) | 0 (0.0%) |
| Personal Care & Service | 0 (0.0%) | 108 (100.0%) |
| Total (Category) | 52 (17.3%) | 249 (82.7%) |
| Total (Overall) | 967 (52.0%) | 892 (48.0%) |
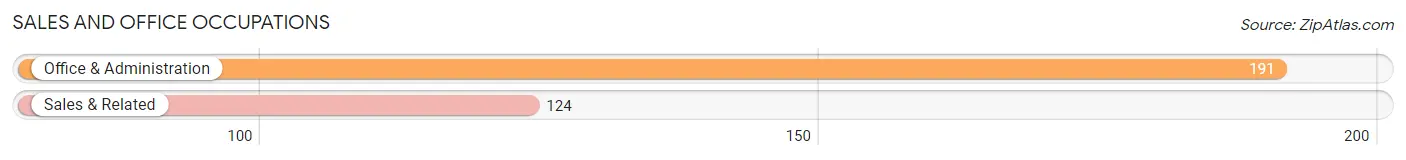
Sales and Office Occupations
The most common Sales and Office occupations in Hokendauqua are Office & Administration (191 | 10.3%), and Sales & Related (124 | 6.7%).
Sales and Office Occupations by Sex
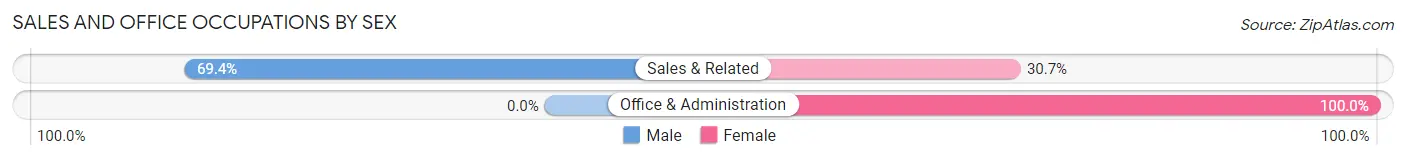
| Occupation | Male | Female |
| Sales & Related | 86 (69.4%) | 38 (30.6%) |
| Office & Administration | 0 (0.0%) | 191 (100.0%) |
| Total (Category) | 86 (27.3%) | 229 (72.7%) |
| Total (Overall) | 967 (52.0%) | 892 (48.0%) |
Natural Resources, Construction and Maintenance Occupations
The most common Natural Resources, Construction and Maintenance occupations in Hokendauqua are Construction & Extraction (192 | 10.3%), and Installation, Maintenance & Repair (51 | 2.7%).
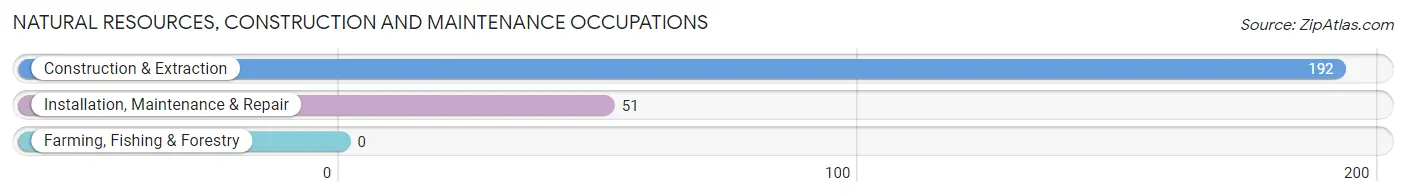
Natural Resources, Construction and Maintenance Occupations by Sex
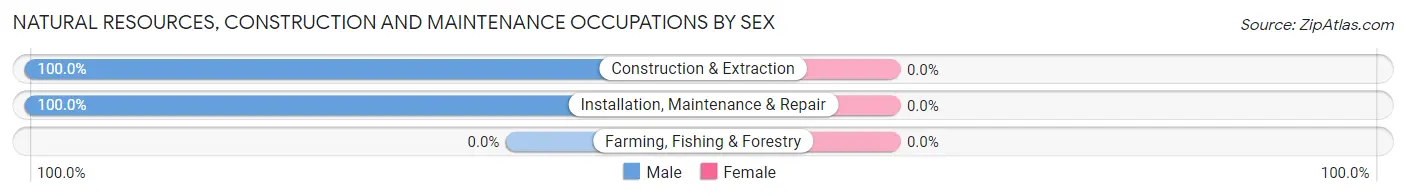
| Occupation | Male | Female |
| Farming, Fishing & Forestry | 0 (0.0%) | 0 (0.0%) |
| Construction & Extraction | 192 (100.0%) | 0 (0.0%) |
| Installation, Maintenance & Repair | 51 (100.0%) | 0 (0.0%) |
| Total (Category) | 243 (100.0%) | 0 (0.0%) |
| Total (Overall) | 967 (52.0%) | 892 (48.0%) |
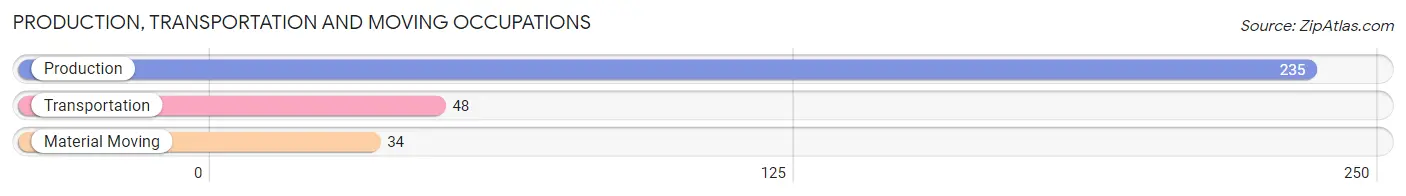
Production, Transportation and Moving Occupations
The most common Production, Transportation and Moving occupations in Hokendauqua are Production (235 | 12.6%), Transportation (48 | 2.6%), and Material Moving (34 | 1.8%).
Production, Transportation and Moving Occupations by Sex
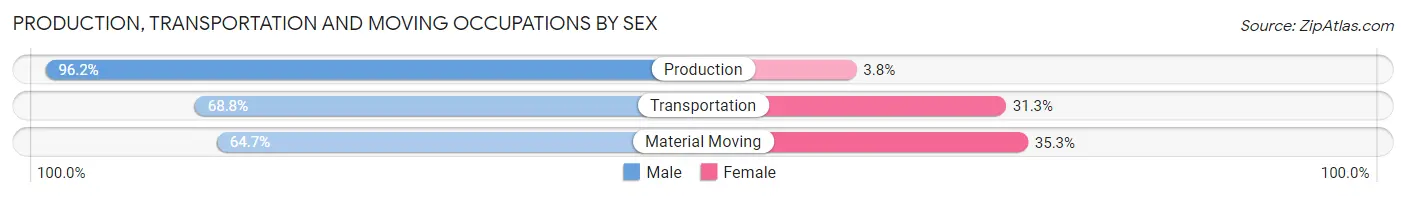
| Occupation | Male | Female |
| Production | 226 (96.2%) | 9 (3.8%) |
| Transportation | 33 (68.8%) | 15 (31.2%) |
| Material Moving | 22 (64.7%) | 12 (35.3%) |
| Total (Category) | 281 (88.6%) | 36 (11.4%) |
| Total (Overall) | 967 (52.0%) | 892 (48.0%) |
Employment Industries by Sex in Hokendauqua
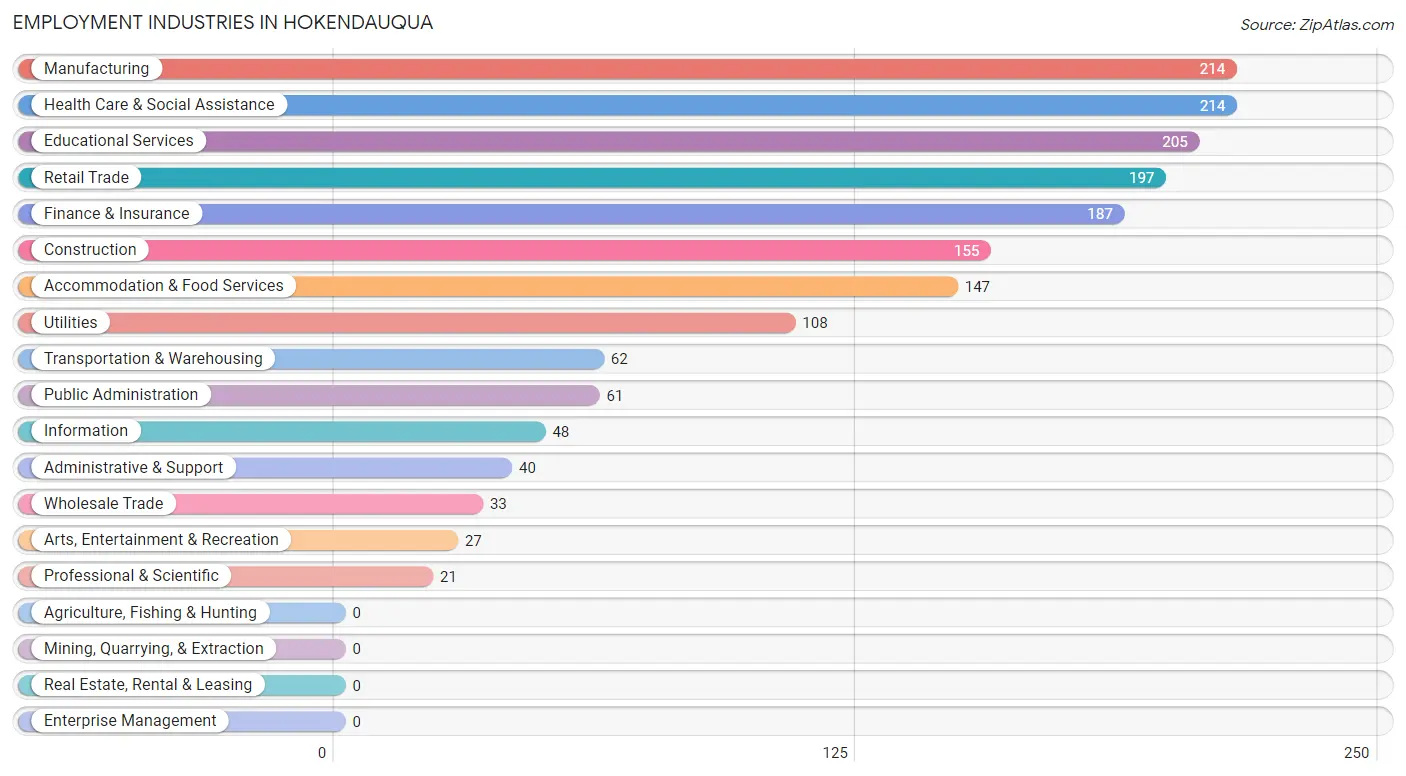
Employment Industries in Hokendauqua
The major employment industries in Hokendauqua include Manufacturing (214 | 11.5%), Health Care & Social Assistance (214 | 11.5%), Educational Services (205 | 11.0%), Retail Trade (197 | 10.6%), and Finance & Insurance (187 | 10.1%).
Employment Industries by Sex in Hokendauqua
The Hokendauqua industries that see more men than women are Construction (100.0%), Wholesale Trade (100.0%), and Utilities (100.0%), whereas the industries that tend to have a higher number of women are Arts, Entertainment & Recreation (100.0%), Health Care & Social Assistance (87.4%), and Educational Services (83.9%).
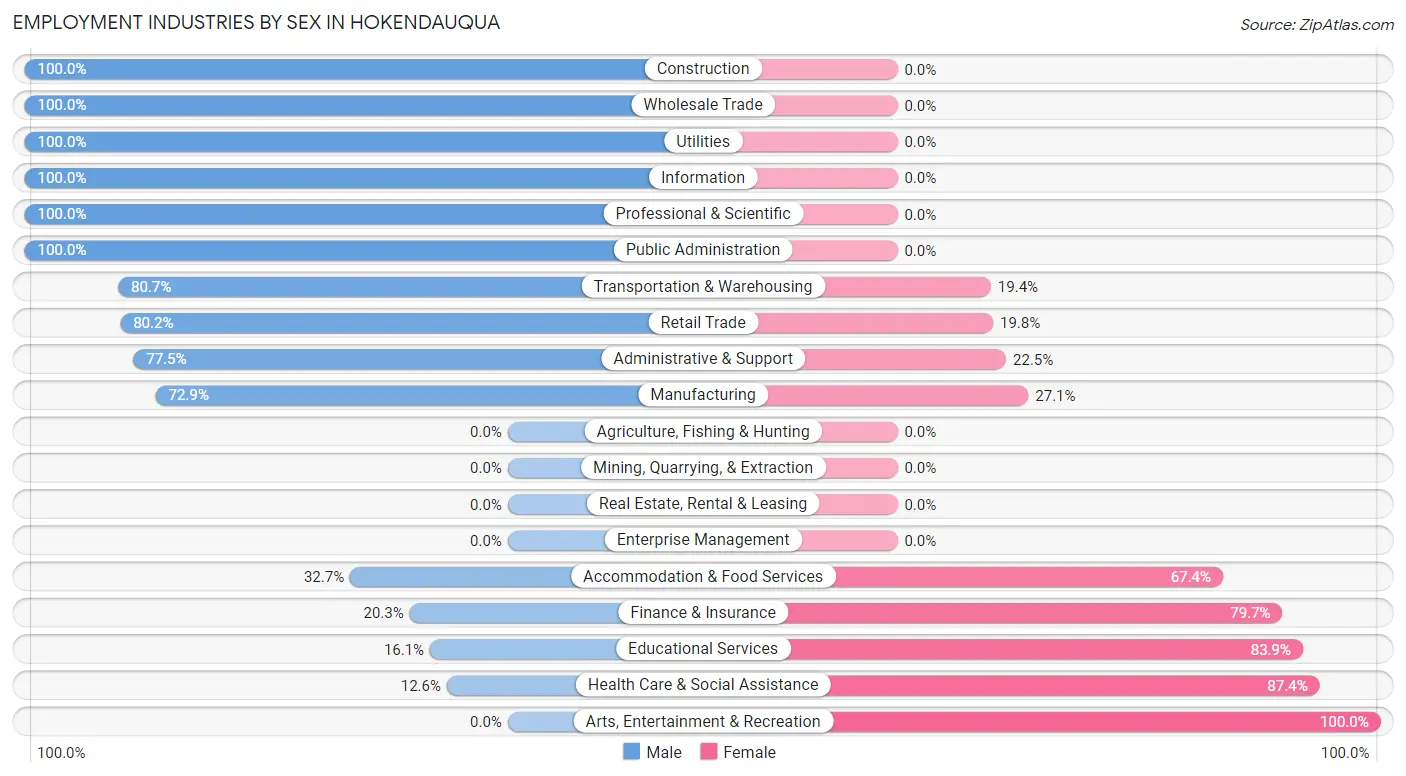
| Industry | Male | Female |
| Agriculture, Fishing & Hunting | 0 (0.0%) | 0 (0.0%) |
| Mining, Quarrying, & Extraction | 0 (0.0%) | 0 (0.0%) |
| Construction | 155 (100.0%) | 0 (0.0%) |
| Manufacturing | 156 (72.9%) | 58 (27.1%) |
| Wholesale Trade | 33 (100.0%) | 0 (0.0%) |
| Retail Trade | 158 (80.2%) | 39 (19.8%) |
| Transportation & Warehousing | 50 (80.6%) | 12 (19.4%) |
| Utilities | 108 (100.0%) | 0 (0.0%) |
| Information | 48 (100.0%) | 0 (0.0%) |
| Finance & Insurance | 38 (20.3%) | 149 (79.7%) |
| Real Estate, Rental & Leasing | 0 (0.0%) | 0 (0.0%) |
| Professional & Scientific | 21 (100.0%) | 0 (0.0%) |
| Enterprise Management | 0 (0.0%) | 0 (0.0%) |
| Administrative & Support | 31 (77.5%) | 9 (22.5%) |
| Educational Services | 33 (16.1%) | 172 (83.9%) |
| Health Care & Social Assistance | 27 (12.6%) | 187 (87.4%) |
| Arts, Entertainment & Recreation | 0 (0.0%) | 27 (100.0%) |
| Accommodation & Food Services | 48 (32.7%) | 99 (67.3%) |
| Public Administration | 61 (100.0%) | 0 (0.0%) |
| Total | 967 (52.0%) | 892 (48.0%) |
Education in Hokendauqua
School Enrollment in Hokendauqua
The most common levels of schooling among the 563 students in Hokendauqua are high school (139 | 24.7%), college / undergraduate (129 | 22.9%), and elementary school (106 | 18.8%).
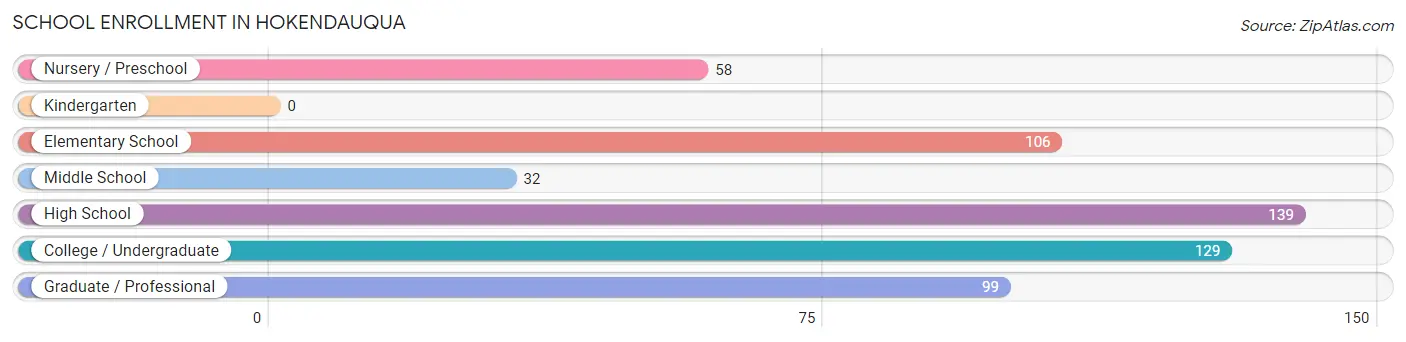
| School Level | # Students | % Students |
| Nursery / Preschool | 58 | 10.3% |
| Kindergarten | 0 | 0.0% |
| Elementary School | 106 | 18.8% |
| Middle School | 32 | 5.7% |
| High School | 139 | 24.7% |
| College / Undergraduate | 129 | 22.9% |
| Graduate / Professional | 99 | 17.6% |
| Total | 563 | 100.0% |
School Enrollment by Age by Funding Source in Hokendauqua
Out of a total of 563 students who are enrolled in schools in Hokendauqua, 23 (4.1%) attend a private institution, while the remaining 540 (95.9%) are enrolled in public schools. The age group of 10 to 14 year olds has the highest likelihood of being enrolled in private schools, with 23 (42.6% in the age bracket) enrolled. Conversely, the age group of 3 to 4 year olds has the lowest likelihood of being enrolled in a private school, with 31 (100.0% in the age bracket) attending a public institution.
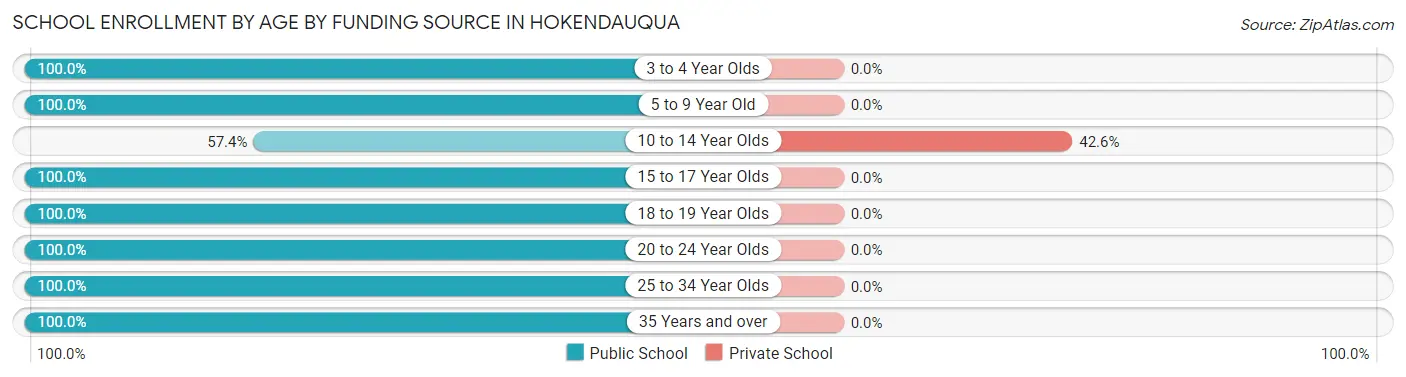
| Age Bracket | Public School | Private School |
| 3 to 4 Year Olds | 31 (100.0%) | 0 (0.0%) |
| 5 to 9 Year Old | 122 (100.0%) | 0 (0.0%) |
| 10 to 14 Year Olds | 31 (57.4%) | 23 (42.6%) |
| 15 to 17 Year Olds | 97 (100.0%) | 0 (0.0%) |
| 18 to 19 Year Olds | 31 (100.0%) | 0 (0.0%) |
| 20 to 24 Year Olds | 72 (100.0%) | 0 (0.0%) |
| 25 to 34 Year Olds | 77 (100.0%) | 0 (0.0%) |
| 35 Years and over | 79 (100.0%) | 0 (0.0%) |
| Total | 540 (95.9%) | 23 (4.1%) |
Educational Attainment by Field of Study in Hokendauqua
Business (204 | 23.4%), psychology (143 | 16.4%), engineering (115 | 13.2%), science & technology (84 | 9.6%), and education (74 | 8.5%) are the most common fields of study among 872 individuals in Hokendauqua who have obtained a bachelor's degree or higher.
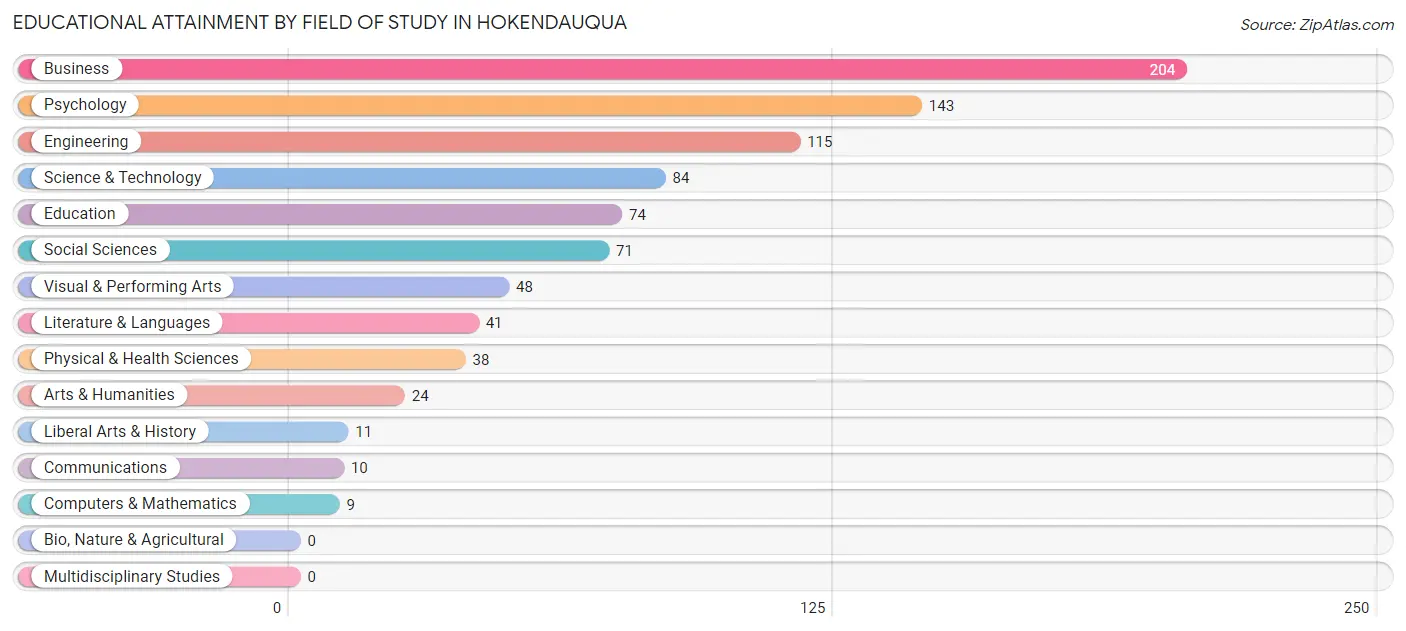
| Field of Study | # Graduates | % Graduates |
| Computers & Mathematics | 9 | 1.0% |
| Bio, Nature & Agricultural | 0 | 0.0% |
| Physical & Health Sciences | 38 | 4.4% |
| Psychology | 143 | 16.4% |
| Social Sciences | 71 | 8.1% |
| Engineering | 115 | 13.2% |
| Multidisciplinary Studies | 0 | 0.0% |
| Science & Technology | 84 | 9.6% |
| Business | 204 | 23.4% |
| Education | 74 | 8.5% |
| Literature & Languages | 41 | 4.7% |
| Liberal Arts & History | 11 | 1.3% |
| Visual & Performing Arts | 48 | 5.5% |
| Communications | 10 | 1.1% |
| Arts & Humanities | 24 | 2.8% |
| Total | 872 | 100.0% |
Transportation & Commute in Hokendauqua
Vehicle Availability by Sex in Hokendauqua
The most prevalent vehicle ownership categories in Hokendauqua are males with 2 vehicles (287, accounting for 29.7%) and females with 2 vehicles (422, making up 33.7%).
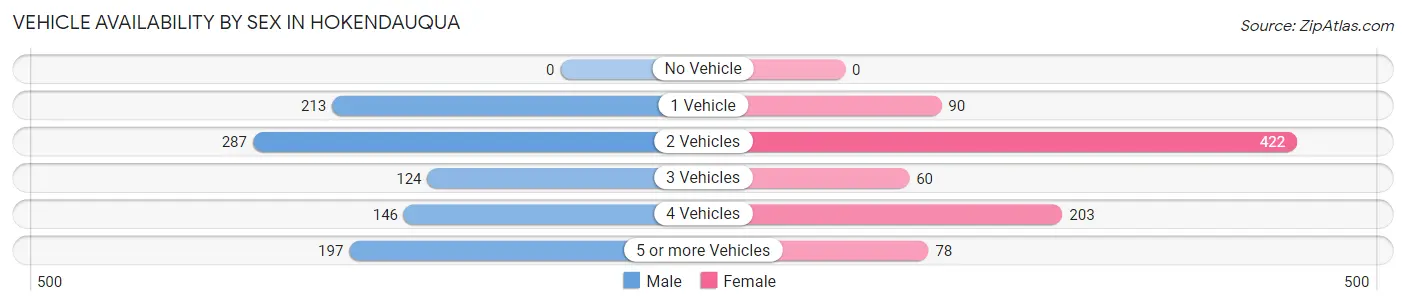
| Vehicles Available | Male | Female |
| No Vehicle | 0 (0.0%) | 0 (0.0%) |
| 1 Vehicle | 213 (22.0%) | 90 (10.5%) |
| 2 Vehicles | 287 (29.7%) | 422 (49.5%) |
| 3 Vehicles | 124 (12.8%) | 60 (7.0%) |
| 4 Vehicles | 146 (15.1%) | 203 (23.8%) |
| 5 or more Vehicles | 197 (20.4%) | 78 (9.1%) |
| Total | 967 (100.0%) | 853 (100.0%) |
Commute Time in Hokendauqua
The most frequently occuring commute durations in Hokendauqua are 20 to 24 minutes (338 commuters, 20.0%), 15 to 19 minutes (261 commuters, 15.4%), and 10 to 14 minutes (246 commuters, 14.6%).
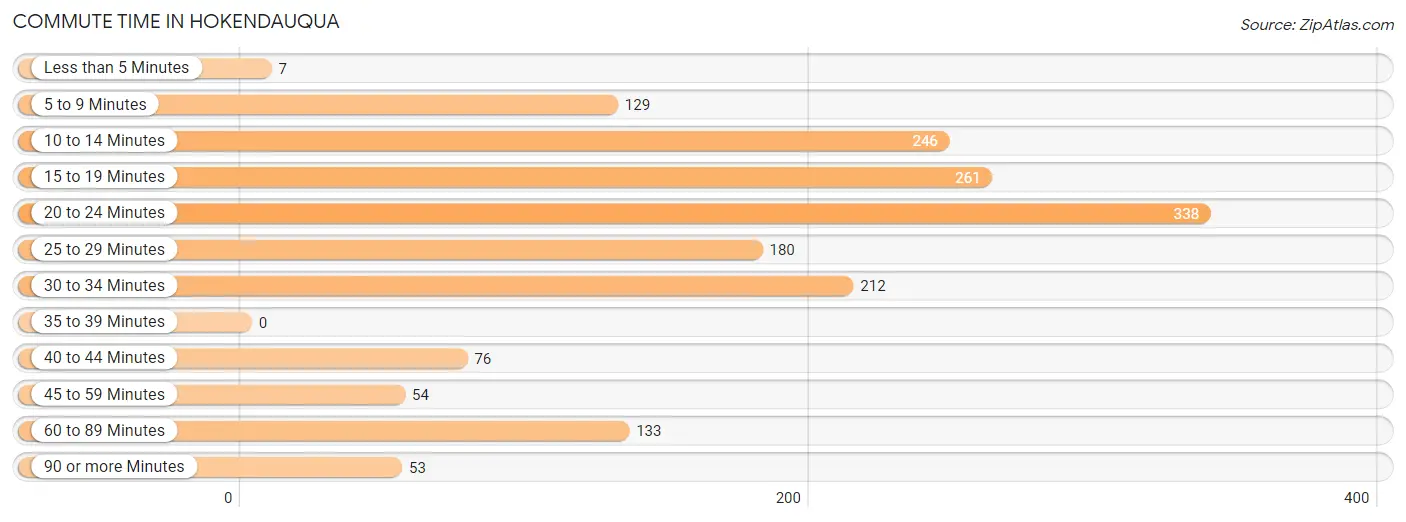
| Commute Time | # Commuters | % Commuters |
| Less than 5 Minutes | 7 | 0.4% |
| 5 to 9 Minutes | 129 | 7.6% |
| 10 to 14 Minutes | 246 | 14.6% |
| 15 to 19 Minutes | 261 | 15.4% |
| 20 to 24 Minutes | 338 | 20.0% |
| 25 to 29 Minutes | 180 | 10.7% |
| 30 to 34 Minutes | 212 | 12.6% |
| 35 to 39 Minutes | 0 | 0.0% |
| 40 to 44 Minutes | 76 | 4.5% |
| 45 to 59 Minutes | 54 | 3.2% |
| 60 to 89 Minutes | 133 | 7.9% |
| 90 or more Minutes | 53 | 3.1% |
Commute Time by Sex in Hokendauqua
The most common commute times in Hokendauqua are 20 to 24 minutes (156 commuters, 17.5%) for males and 20 to 24 minutes (182 commuters, 22.8%) for females.
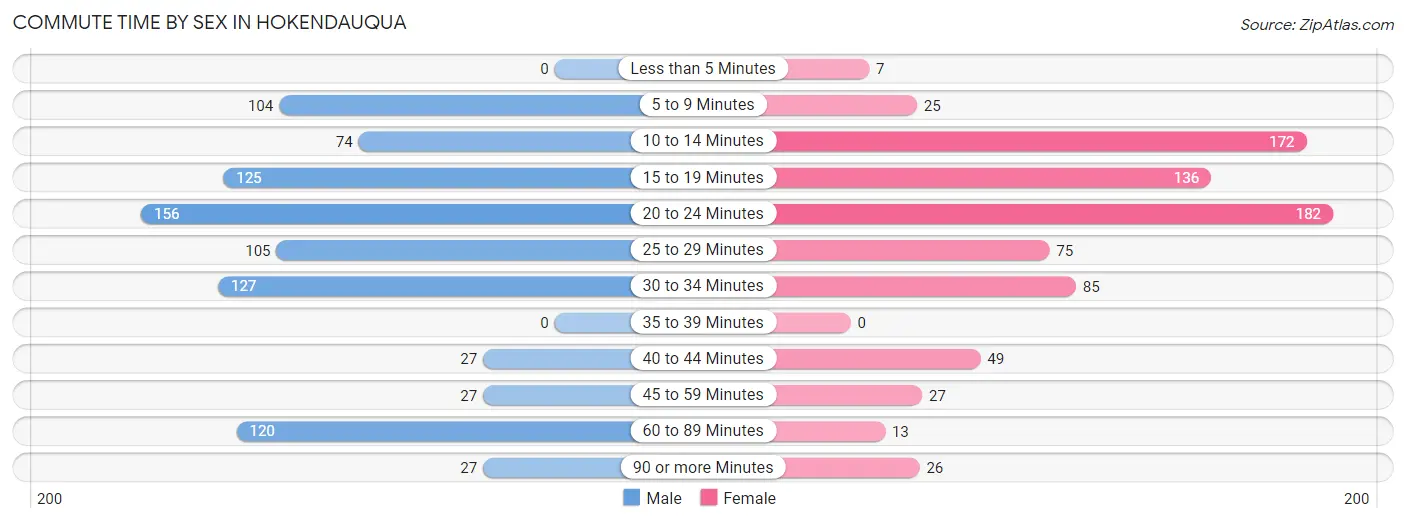
| Commute Time | Male | Female |
| Less than 5 Minutes | 0 (0.0%) | 7 (0.9%) |
| 5 to 9 Minutes | 104 (11.7%) | 25 (3.1%) |
| 10 to 14 Minutes | 74 (8.3%) | 172 (21.6%) |
| 15 to 19 Minutes | 125 (14.0%) | 136 (17.1%) |
| 20 to 24 Minutes | 156 (17.5%) | 182 (22.8%) |
| 25 to 29 Minutes | 105 (11.8%) | 75 (9.4%) |
| 30 to 34 Minutes | 127 (14.2%) | 85 (10.7%) |
| 35 to 39 Minutes | 0 (0.0%) | 0 (0.0%) |
| 40 to 44 Minutes | 27 (3.0%) | 49 (6.1%) |
| 45 to 59 Minutes | 27 (3.0%) | 27 (3.4%) |
| 60 to 89 Minutes | 120 (13.5%) | 13 (1.6%) |
| 90 or more Minutes | 27 (3.0%) | 26 (3.3%) |
Time of Departure to Work by Sex in Hokendauqua
The most frequent times of departure to work in Hokendauqua are 6:00 AM to 6:29 AM (172, 19.3%) for males and 7:30 AM to 7:59 AM (219, 27.5%) for females.
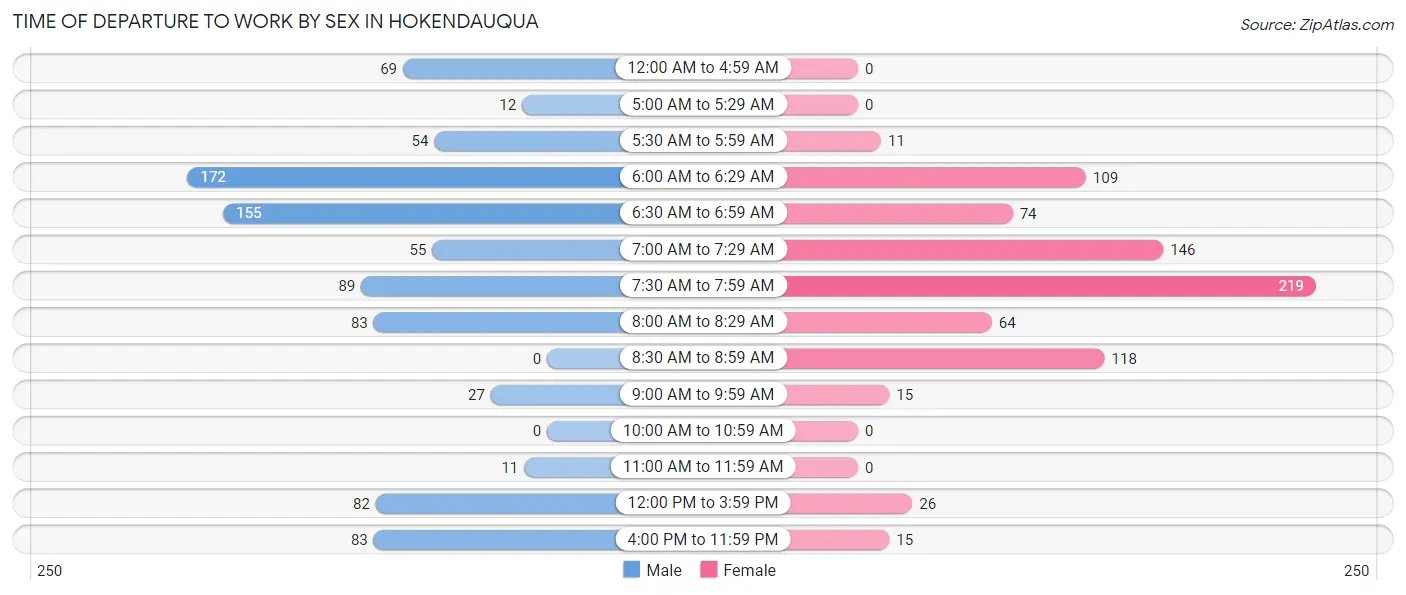
| Time of Departure | Male | Female |
| 12:00 AM to 4:59 AM | 69 (7.7%) | 0 (0.0%) |
| 5:00 AM to 5:29 AM | 12 (1.3%) | 0 (0.0%) |
| 5:30 AM to 5:59 AM | 54 (6.0%) | 11 (1.4%) |
| 6:00 AM to 6:29 AM | 172 (19.3%) | 109 (13.7%) |
| 6:30 AM to 6:59 AM | 155 (17.4%) | 74 (9.3%) |
| 7:00 AM to 7:29 AM | 55 (6.2%) | 146 (18.3%) |
| 7:30 AM to 7:59 AM | 89 (10.0%) | 219 (27.5%) |
| 8:00 AM to 8:29 AM | 83 (9.3%) | 64 (8.0%) |
| 8:30 AM to 8:59 AM | 0 (0.0%) | 118 (14.8%) |
| 9:00 AM to 9:59 AM | 27 (3.0%) | 15 (1.9%) |
| 10:00 AM to 10:59 AM | 0 (0.0%) | 0 (0.0%) |
| 11:00 AM to 11:59 AM | 11 (1.2%) | 0 (0.0%) |
| 12:00 PM to 3:59 PM | 82 (9.2%) | 26 (3.3%) |
| 4:00 PM to 11:59 PM | 83 (9.3%) | 15 (1.9%) |
| Total | 892 (100.0%) | 797 (100.0%) |
Housing Occupancy in Hokendauqua
Occupancy by Ownership in Hokendauqua
Of the total 1,220 dwellings in Hokendauqua, owner-occupied units account for 939 (77.0%), while renter-occupied units make up 281 (23.0%).
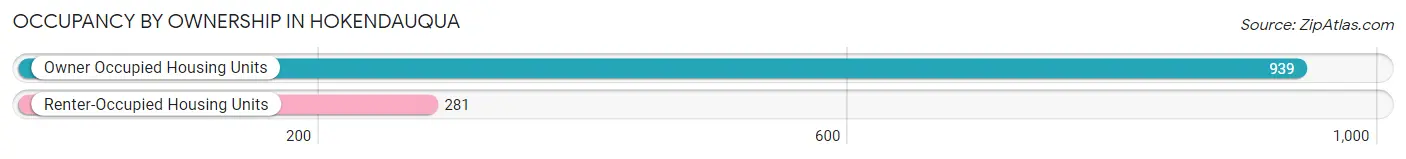
| Occupancy | # Housing Units | % Housing Units |
| Owner Occupied Housing Units | 939 | 77.0% |
| Renter-Occupied Housing Units | 281 | 23.0% |
| Total Occupied Housing Units | 1,220 | 100.0% |
Occupancy by Household Size in Hokendauqua
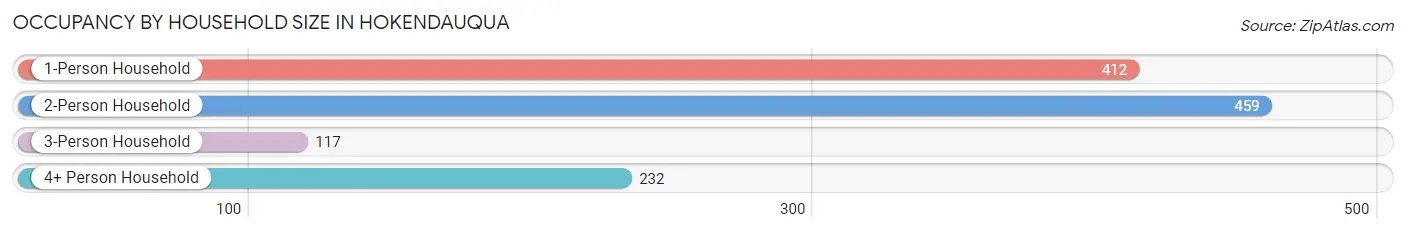
| Household Size | # Housing Units | % Housing Units |
| 1-Person Household | 412 | 33.8% |
| 2-Person Household | 459 | 37.6% |
| 3-Person Household | 117 | 9.6% |
| 4+ Person Household | 232 | 19.0% |
| Total Housing Units | 1,220 | 100.0% |
Occupancy by Ownership by Household Size in Hokendauqua
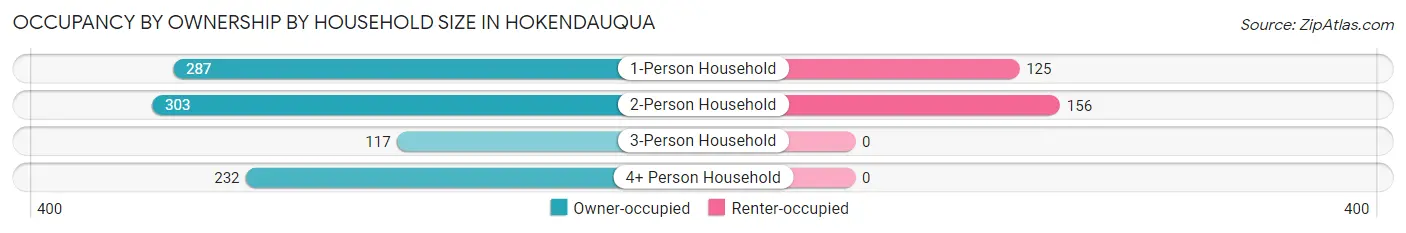
| Household Size | Owner-occupied | Renter-occupied |
| 1-Person Household | 287 (69.7%) | 125 (30.3%) |
| 2-Person Household | 303 (66.0%) | 156 (34.0%) |
| 3-Person Household | 117 (100.0%) | 0 (0.0%) |
| 4+ Person Household | 232 (100.0%) | 0 (0.0%) |
| Total Housing Units | 939 (77.0%) | 281 (23.0%) |
Occupancy by Educational Attainment in Hokendauqua
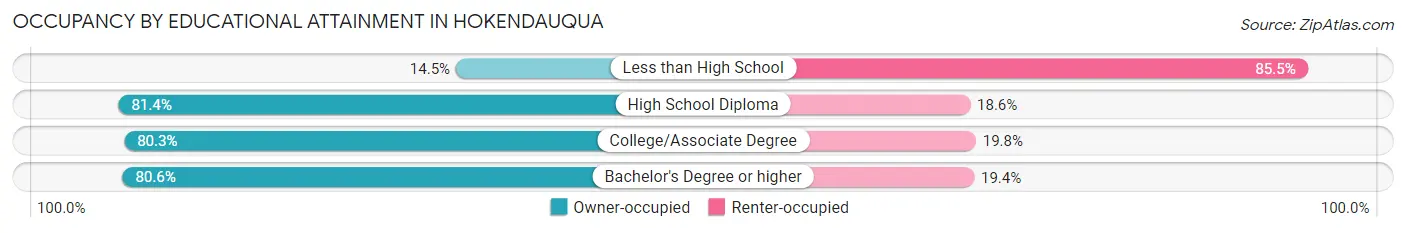
| Household Size | Owner-occupied | Renter-occupied |
| Less than High School | 10 (14.5%) | 59 (85.5%) |
| High School Diploma | 284 (81.4%) | 65 (18.6%) |
| College/Associate Degree | 317 (80.2%) | 78 (19.8%) |
| Bachelor's Degree or higher | 328 (80.6%) | 79 (19.4%) |
Occupancy by Age of Householder in Hokendauqua
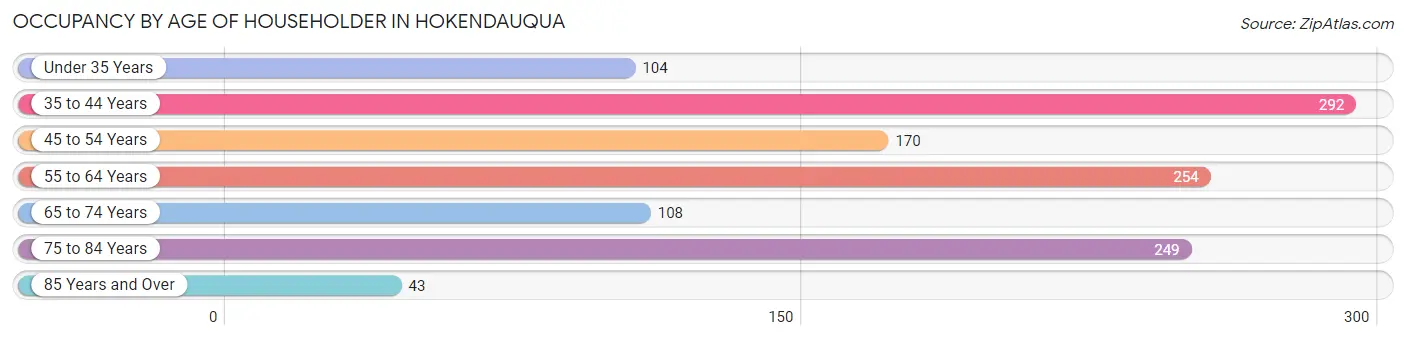
| Age Bracket | # Households | % Households |
| Under 35 Years | 104 | 8.5% |
| 35 to 44 Years | 292 | 23.9% |
| 45 to 54 Years | 170 | 13.9% |
| 55 to 64 Years | 254 | 20.8% |
| 65 to 74 Years | 108 | 8.8% |
| 75 to 84 Years | 249 | 20.4% |
| 85 Years and Over | 43 | 3.5% |
| Total | 1,220 | 100.0% |
Housing Finances in Hokendauqua
Median Income by Occupancy in Hokendauqua
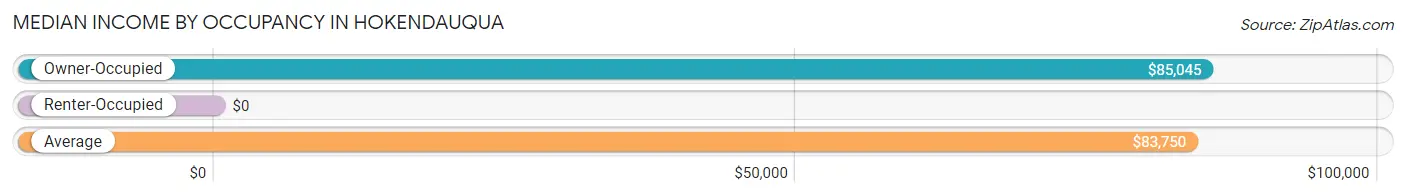
| Occupancy Type | # Households | Median Income |
| Owner-Occupied | 939 (77.0%) | $85,045 |
| Renter-Occupied | 281 (23.0%) | $0 |
| Average | 1,220 (100.0%) | $83,750 |
Occupancy by Householder Income Bracket in Hokendauqua
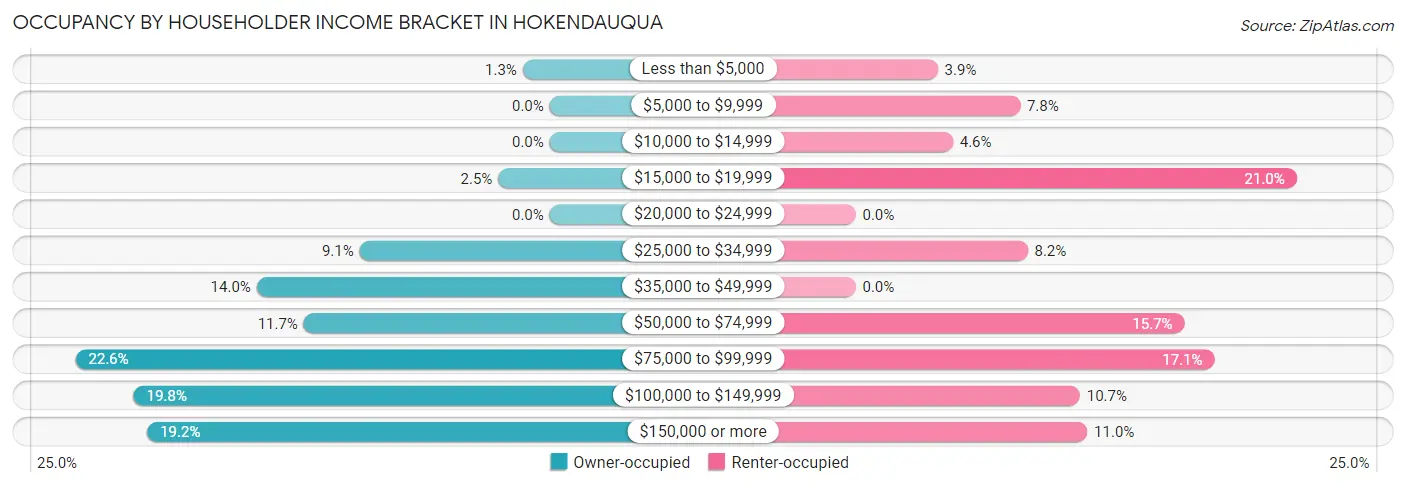
| Income Bracket | Owner-occupied | Renter-occupied |
| Less than $5,000 | 12 (1.3%) | 11 (3.9%) |
| $5,000 to $9,999 | 0 (0.0%) | 22 (7.8%) |
| $10,000 to $14,999 | 0 (0.0%) | 13 (4.6%) |
| $15,000 to $19,999 | 23 (2.5%) | 59 (21.0%) |
| $20,000 to $24,999 | 0 (0.0%) | 0 (0.0%) |
| $25,000 to $34,999 | 85 (9.0%) | 23 (8.2%) |
| $35,000 to $49,999 | 131 (14.0%) | 0 (0.0%) |
| $50,000 to $74,999 | 110 (11.7%) | 44 (15.7%) |
| $75,000 to $99,999 | 212 (22.6%) | 48 (17.1%) |
| $100,000 to $149,999 | 186 (19.8%) | 30 (10.7%) |
| $150,000 or more | 180 (19.2%) | 31 (11.0%) |
| Total | 939 (100.0%) | 281 (100.0%) |
Monthly Housing Cost Tiers in Hokendauqua
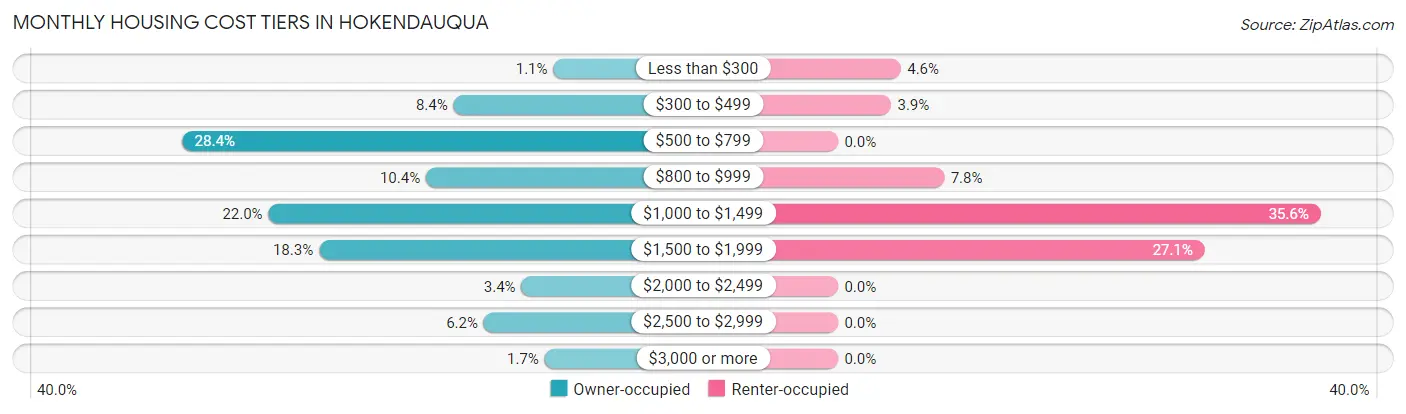
| Monthly Cost | Owner-occupied | Renter-occupied |
| Less than $300 | 10 (1.1%) | 13 (4.6%) |
| $300 to $499 | 79 (8.4%) | 11 (3.9%) |
| $500 to $799 | 267 (28.4%) | 0 (0.0%) |
| $800 to $999 | 98 (10.4%) | 22 (7.8%) |
| $1,000 to $1,499 | 207 (22.0%) | 100 (35.6%) |
| $1,500 to $1,999 | 172 (18.3%) | 76 (27.1%) |
| $2,000 to $2,499 | 32 (3.4%) | 0 (0.0%) |
| $2,500 to $2,999 | 58 (6.2%) | 0 (0.0%) |
| $3,000 or more | 16 (1.7%) | 0 (0.0%) |
| Total | 939 (100.0%) | 281 (100.0%) |
Physical Housing Characteristics in Hokendauqua
Housing Structures in Hokendauqua
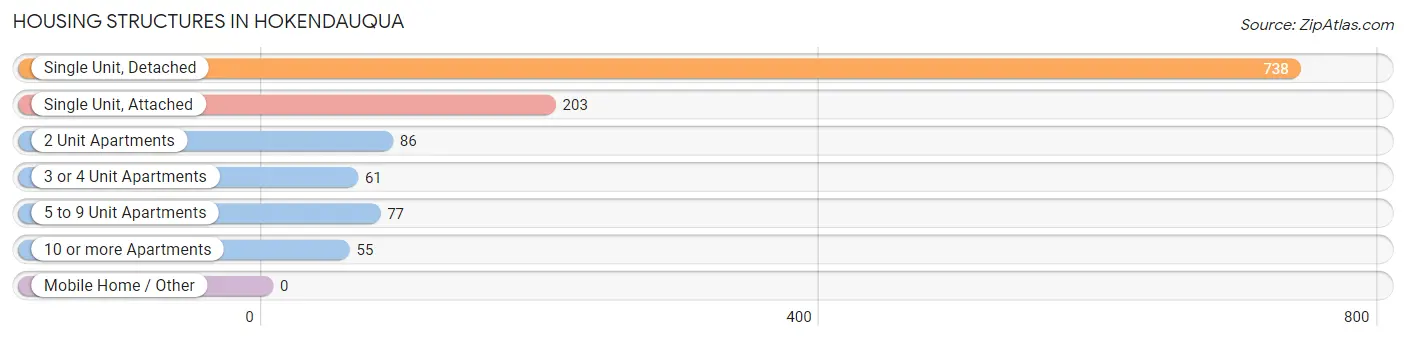
| Structure Type | # Housing Units | % Housing Units |
| Single Unit, Detached | 738 | 60.5% |
| Single Unit, Attached | 203 | 16.6% |
| 2 Unit Apartments | 86 | 7.0% |
| 3 or 4 Unit Apartments | 61 | 5.0% |
| 5 to 9 Unit Apartments | 77 | 6.3% |
| 10 or more Apartments | 55 | 4.5% |
| Mobile Home / Other | 0 | 0.0% |
| Total | 1,220 | 100.0% |
Housing Structures by Occupancy in Hokendauqua
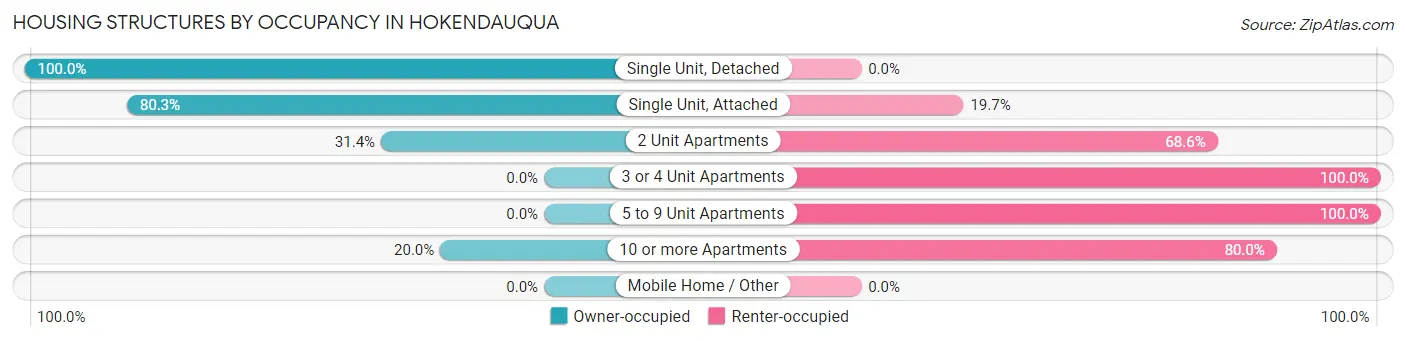
| Structure Type | Owner-occupied | Renter-occupied |
| Single Unit, Detached | 738 (100.0%) | 0 (0.0%) |
| Single Unit, Attached | 163 (80.3%) | 40 (19.7%) |
| 2 Unit Apartments | 27 (31.4%) | 59 (68.6%) |
| 3 or 4 Unit Apartments | 0 (0.0%) | 61 (100.0%) |
| 5 to 9 Unit Apartments | 0 (0.0%) | 77 (100.0%) |
| 10 or more Apartments | 11 (20.0%) | 44 (80.0%) |
| Mobile Home / Other | 0 (0.0%) | 0 (0.0%) |
| Total | 939 (77.0%) | 281 (23.0%) |
Housing Structures by Number of Rooms in Hokendauqua
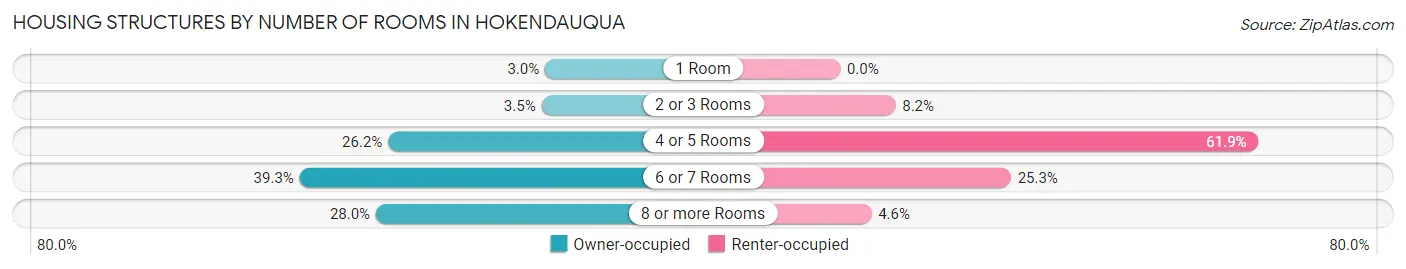
| Number of Rooms | Owner-occupied | Renter-occupied |
| 1 Room | 28 (3.0%) | 0 (0.0%) |
| 2 or 3 Rooms | 33 (3.5%) | 23 (8.2%) |
| 4 or 5 Rooms | 246 (26.2%) | 174 (61.9%) |
| 6 or 7 Rooms | 369 (39.3%) | 71 (25.3%) |
| 8 or more Rooms | 263 (28.0%) | 13 (4.6%) |
| Total | 939 (100.0%) | 281 (100.0%) |
Housing Structure by Heating Type in Hokendauqua
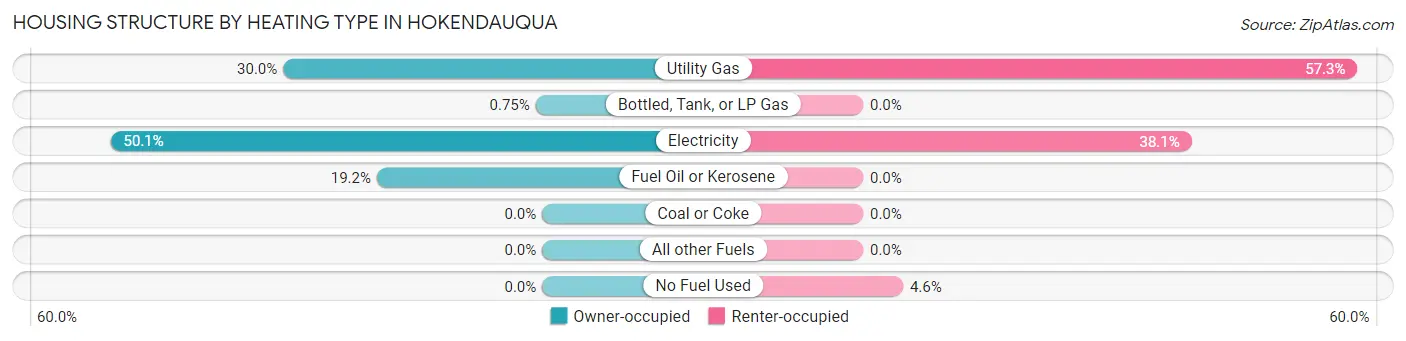
| Heating Type | Owner-occupied | Renter-occupied |
| Utility Gas | 282 (30.0%) | 161 (57.3%) |
| Bottled, Tank, or LP Gas | 7 (0.7%) | 0 (0.0%) |
| Electricity | 470 (50.0%) | 107 (38.1%) |
| Fuel Oil or Kerosene | 180 (19.2%) | 0 (0.0%) |
| Coal or Coke | 0 (0.0%) | 0 (0.0%) |
| All other Fuels | 0 (0.0%) | 0 (0.0%) |
| No Fuel Used | 0 (0.0%) | 13 (4.6%) |
| Total | 939 (100.0%) | 281 (100.0%) |
Household Vehicle Usage in Hokendauqua
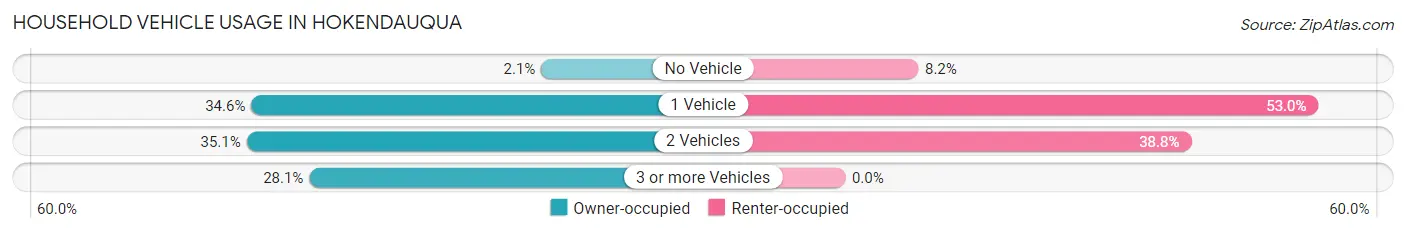
| Vehicles per Household | Owner-occupied | Renter-occupied |
| No Vehicle | 20 (2.1%) | 23 (8.2%) |
| 1 Vehicle | 325 (34.6%) | 149 (53.0%) |
| 2 Vehicles | 330 (35.1%) | 109 (38.8%) |
| 3 or more Vehicles | 264 (28.1%) | 0 (0.0%) |
| Total | 939 (100.0%) | 281 (100.0%) |
Real Estate & Mortgages in Hokendauqua
Real Estate and Mortgage Overview in Hokendauqua
| Characteristic | Without Mortgage | With Mortgage |
| Housing Units | 362 | 577 |
| Median Property Value | $213,100 | $234,700 |
| Median Household Income | $68,000 | $158 |
| Monthly Housing Costs | $644 | $16 |
| Real Estate Taxes | $3,980 | $12 |
Property Value by Mortgage Status in Hokendauqua
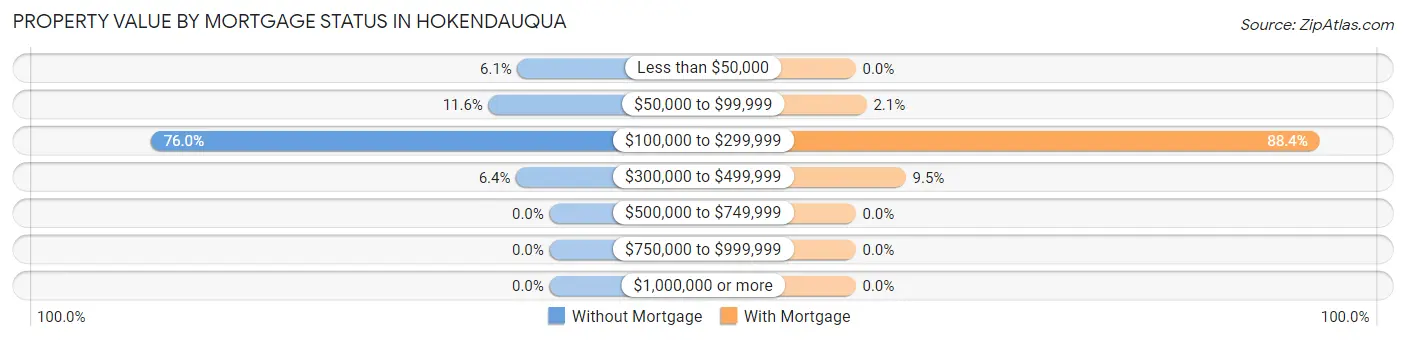
| Property Value | Without Mortgage | With Mortgage |
| Less than $50,000 | 22 (6.1%) | 0 (0.0%) |
| $50,000 to $99,999 | 42 (11.6%) | 12 (2.1%) |
| $100,000 to $299,999 | 275 (76.0%) | 510 (88.4%) |
| $300,000 to $499,999 | 23 (6.4%) | 55 (9.5%) |
| $500,000 to $749,999 | 0 (0.0%) | 0 (0.0%) |
| $750,000 to $999,999 | 0 (0.0%) | 0 (0.0%) |
| $1,000,000 or more | 0 (0.0%) | 0 (0.0%) |
| Total | 362 (100.0%) | 577 (100.0%) |
Household Income by Mortgage Status in Hokendauqua
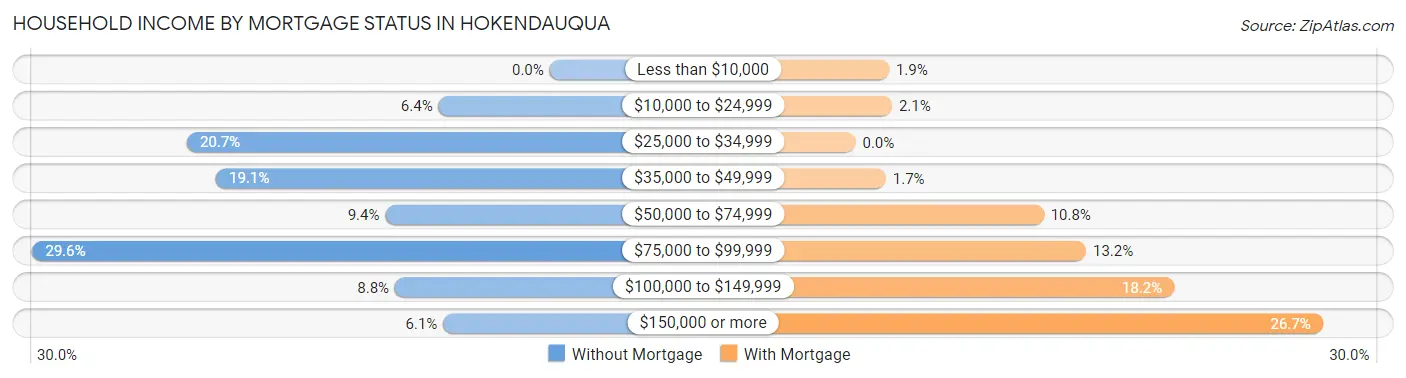
| Household Income | Without Mortgage | With Mortgage |
| Less than $10,000 | 0 (0.0%) | 11 (1.9%) |
| $10,000 to $24,999 | 23 (6.4%) | 12 (2.1%) |
| $25,000 to $34,999 | 75 (20.7%) | 0 (0.0%) |
| $35,000 to $49,999 | 69 (19.1%) | 10 (1.7%) |
| $50,000 to $74,999 | 34 (9.4%) | 62 (10.7%) |
| $75,000 to $99,999 | 107 (29.6%) | 76 (13.2%) |
| $100,000 to $149,999 | 32 (8.8%) | 105 (18.2%) |
| $150,000 or more | 22 (6.1%) | 154 (26.7%) |
| Total | 362 (100.0%) | 577 (100.0%) |
Property Value to Household Income Ratio in Hokendauqua
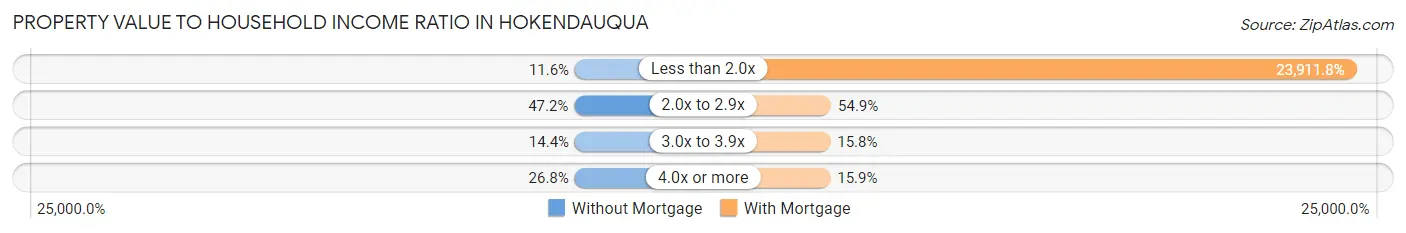
| Value-to-Income Ratio | Without Mortgage | With Mortgage |
| Less than 2.0x | 42 (11.6%) | 137,971 (23,911.8%) |
| 2.0x to 2.9x | 171 (47.2%) | 317 (54.9%) |
| 3.0x to 3.9x | 52 (14.4%) | 91 (15.8%) |
| 4.0x or more | 97 (26.8%) | 92 (15.9%) |
| Total | 362 (100.0%) | 577 (100.0%) |
Real Estate Taxes by Mortgage Status in Hokendauqua
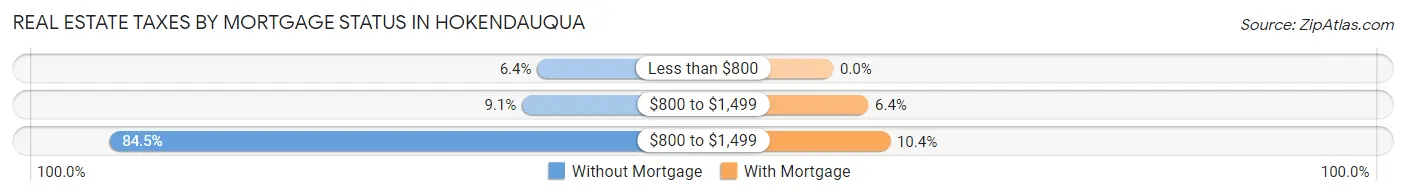
| Property Taxes | Without Mortgage | With Mortgage |
| Less than $800 | 23 (6.4%) | 0 (0.0%) |
| $800 to $1,499 | 33 (9.1%) | 37 (6.4%) |
| $800 to $1,499 | 306 (84.5%) | 60 (10.4%) |
| Total | 362 (100.0%) | 577 (100.0%) |
Health & Disability in Hokendauqua
Health Insurance Coverage by Age in Hokendauqua
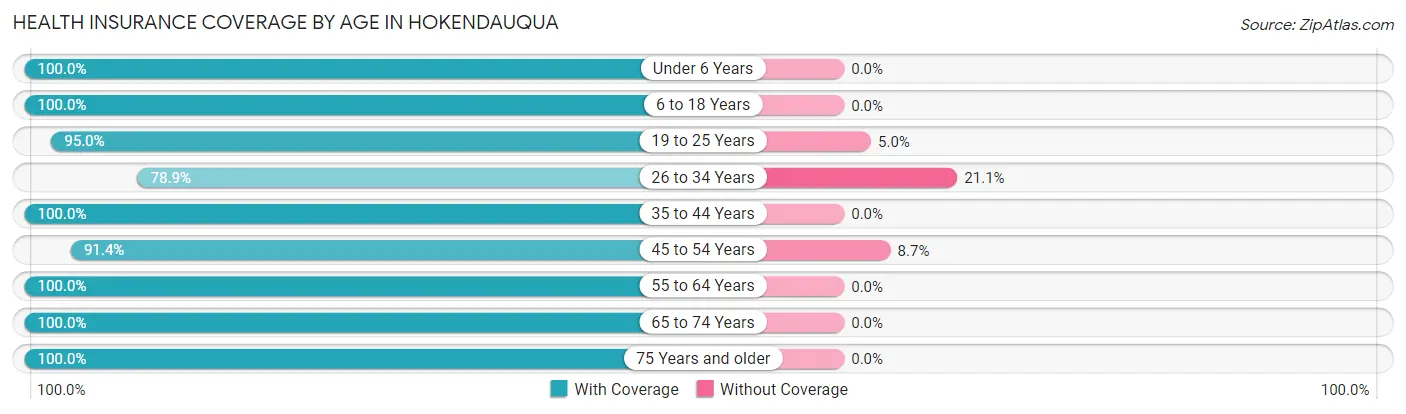
| Age Bracket | With Coverage | Without Coverage |
| Under 6 Years | 116 (100.0%) | 0 (0.0%) |
| 6 to 18 Years | 281 (100.0%) | 0 (0.0%) |
| 19 to 25 Years | 285 (95.0%) | 15 (5.0%) |
| 26 to 34 Years | 363 (78.9%) | 97 (21.1%) |
| 35 to 44 Years | 388 (100.0%) | 0 (0.0%) |
| 45 to 54 Years | 317 (91.3%) | 30 (8.6%) |
| 55 to 64 Years | 518 (100.0%) | 0 (0.0%) |
| 65 to 74 Years | 229 (100.0%) | 0 (0.0%) |
| 75 Years and older | 321 (100.0%) | 0 (0.0%) |
| Total | 2,818 (95.2%) | 142 (4.8%) |
Health Insurance Coverage by Citizenship Status in Hokendauqua
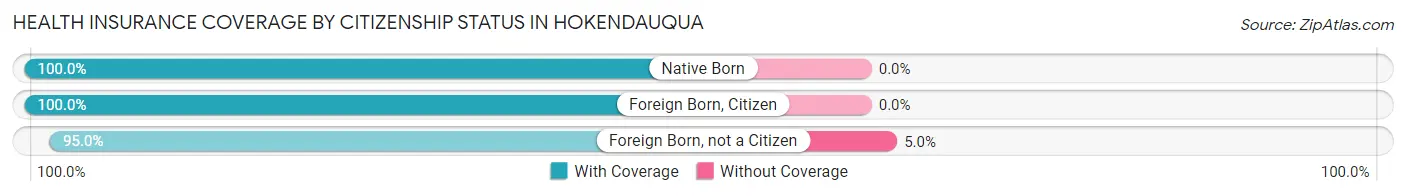
| Citizenship Status | With Coverage | Without Coverage |
| Native Born | 116 (100.0%) | 0 (0.0%) |
| Foreign Born, Citizen | 281 (100.0%) | 0 (0.0%) |
| Foreign Born, not a Citizen | 285 (95.0%) | 15 (5.0%) |
Health Insurance Coverage by Household Income in Hokendauqua
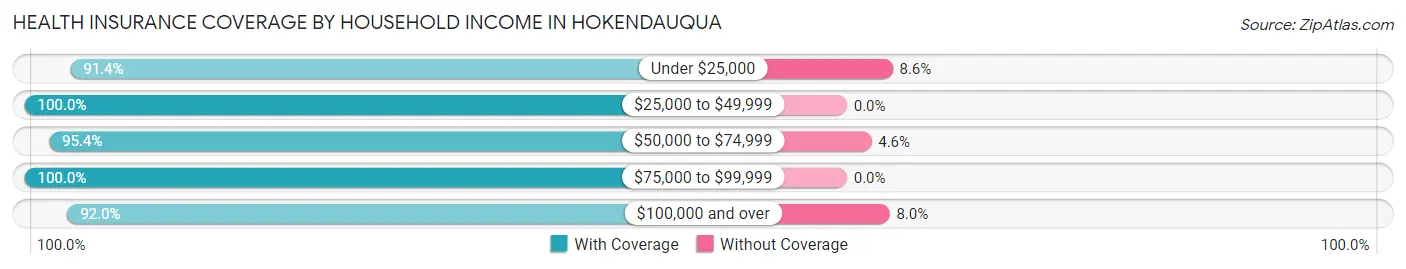
| Household Income | With Coverage | Without Coverage |
| Under $25,000 | 128 (91.4%) | 12 (8.6%) |
| $25,000 to $49,999 | 393 (100.0%) | 0 (0.0%) |
| $50,000 to $74,999 | 312 (95.4%) | 15 (4.6%) |
| $75,000 to $99,999 | 661 (100.0%) | 0 (0.0%) |
| $100,000 and over | 1,324 (92.0%) | 115 (8.0%) |
Public vs Private Health Insurance Coverage by Age in Hokendauqua
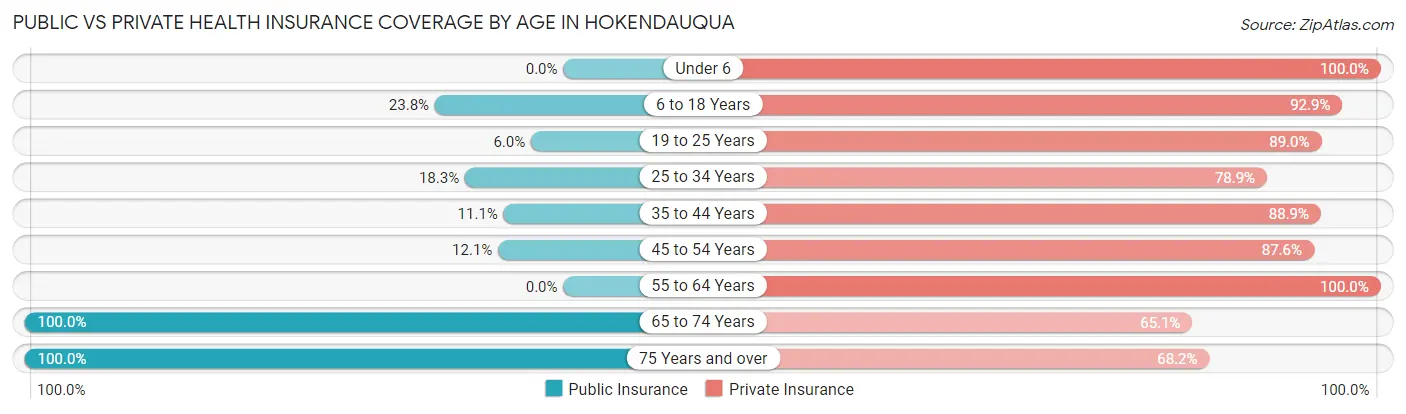
| Age Bracket | Public Insurance | Private Insurance |
| Under 6 | 0 (0.0%) | 116 (100.0%) |
| 6 to 18 Years | 67 (23.8%) | 261 (92.9%) |
| 19 to 25 Years | 18 (6.0%) | 267 (89.0%) |
| 25 to 34 Years | 84 (18.3%) | 363 (78.9%) |
| 35 to 44 Years | 43 (11.1%) | 345 (88.9%) |
| 45 to 54 Years | 42 (12.1%) | 304 (87.6%) |
| 55 to 64 Years | 0 (0.0%) | 518 (100.0%) |
| 65 to 74 Years | 229 (100.0%) | 149 (65.1%) |
| 75 Years and over | 321 (100.0%) | 219 (68.2%) |
| Total | 804 (27.2%) | 2,542 (85.9%) |
Disability Status by Sex by Age in Hokendauqua
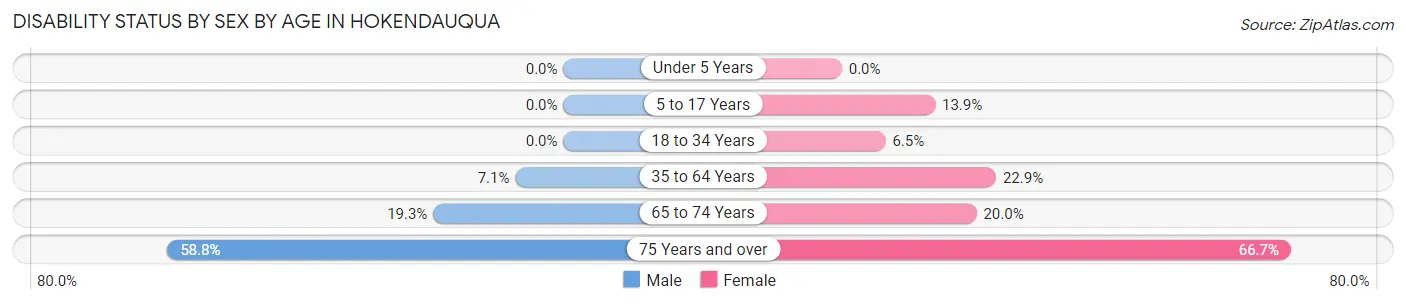
| Age Bracket | Male | Female |
| Under 5 Years | 0 (0.0%) | 0 (0.0%) |
| 5 to 17 Years | 0 (0.0%) | 27 (13.9%) |
| 18 to 34 Years | 0 (0.0%) | 27 (6.5%) |
| 35 to 64 Years | 52 (7.1%) | 120 (22.9%) |
| 65 to 74 Years | 23 (19.3%) | 22 (20.0%) |
| 75 Years and over | 30 (58.8%) | 180 (66.7%) |
Disability Class by Sex by Age in Hokendauqua
Disability Class: Hearing Difficulty
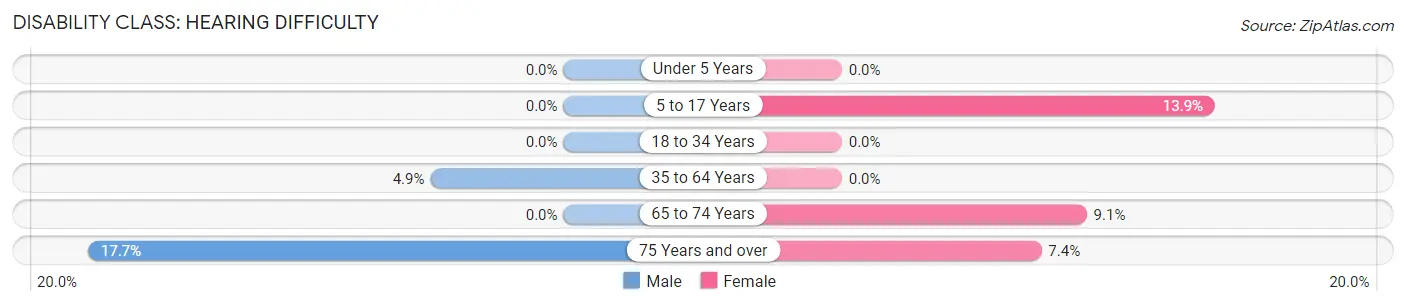
| Age Bracket | Male | Female |
| Under 5 Years | 0 (0.0%) | 0 (0.0%) |
| 5 to 17 Years | 0 (0.0%) | 27 (13.9%) |
| 18 to 34 Years | 0 (0.0%) | 0 (0.0%) |
| 35 to 64 Years | 36 (4.9%) | 0 (0.0%) |
| 65 to 74 Years | 0 (0.0%) | 10 (9.1%) |
| 75 Years and over | 9 (17.6%) | 20 (7.4%) |
Disability Class: Vision Difficulty
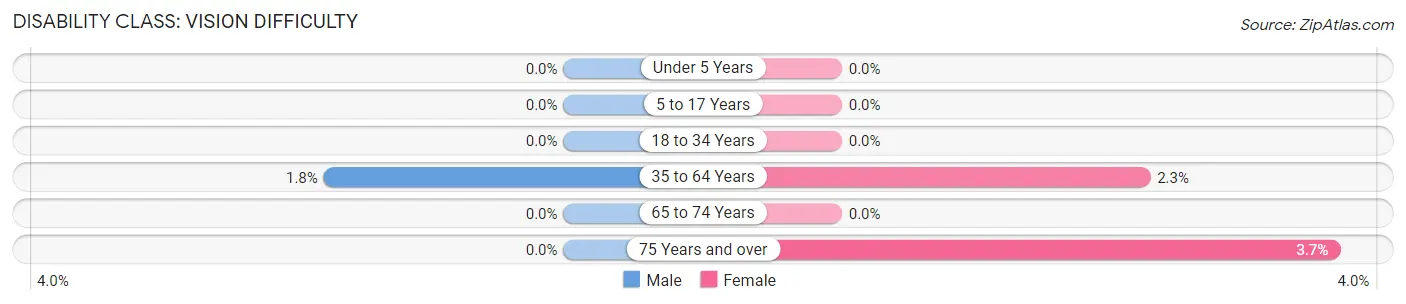
| Age Bracket | Male | Female |
| Under 5 Years | 0 (0.0%) | 0 (0.0%) |
| 5 to 17 Years | 0 (0.0%) | 0 (0.0%) |
| 18 to 34 Years | 0 (0.0%) | 0 (0.0%) |
| 35 to 64 Years | 13 (1.8%) | 12 (2.3%) |
| 65 to 74 Years | 0 (0.0%) | 0 (0.0%) |
| 75 Years and over | 0 (0.0%) | 10 (3.7%) |
Disability Class: Cognitive Difficulty
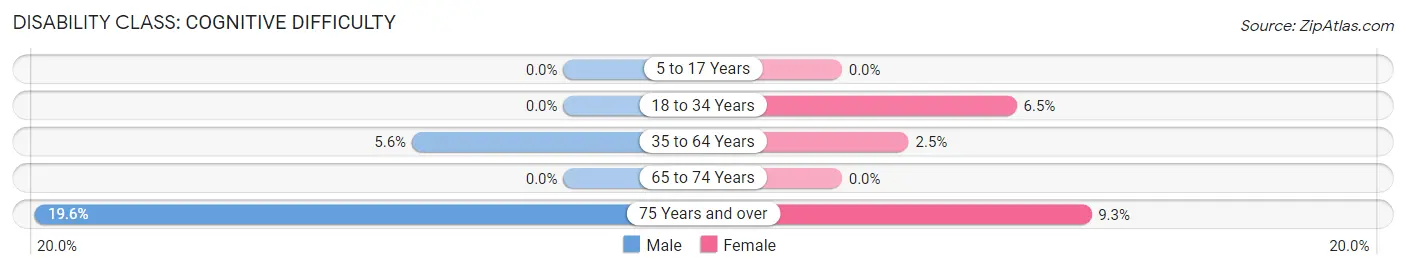
| Age Bracket | Male | Female |
| 5 to 17 Years | 0 (0.0%) | 0 (0.0%) |
| 18 to 34 Years | 0 (0.0%) | 27 (6.5%) |
| 35 to 64 Years | 41 (5.6%) | 13 (2.5%) |
| 65 to 74 Years | 0 (0.0%) | 0 (0.0%) |
| 75 Years and over | 10 (19.6%) | 25 (9.3%) |
Disability Class: Ambulatory Difficulty
| Age Bracket | Male | Female |
| 5 to 17 Years | 0 (0.0%) | 0 (0.0%) |
| 18 to 34 Years | 0 (0.0%) | 0 (0.0%) |
| 35 to 64 Years | 25 (3.4%) | 108 (20.6%) |
| 65 to 74 Years | 10 (8.4%) | 22 (20.0%) |
| 75 Years and over | 30 (58.8%) | 180 (66.7%) |
Disability Class: Self-Care Difficulty
| Age Bracket | Male | Female |
| 5 to 17 Years | 0 (0.0%) | 0 (0.0%) |
| 18 to 34 Years | 0 (0.0%) | 0 (0.0%) |
| 35 to 64 Years | 0 (0.0%) | 0 (0.0%) |
| 65 to 74 Years | 10 (8.4%) | 10 (9.1%) |
| 75 Years and over | 30 (58.8%) | 20 (7.4%) |
Technology Access in Hokendauqua
Computing Device Access in Hokendauqua
| Device Type | # Households | % Households |
| Desktop or Laptop | 982 | 80.5% |
| Smartphone | 1,051 | 86.2% |
| Tablet | 799 | 65.5% |
| No Computing Device | 75 | 6.1% |
| Total | 1,220 | 100.0% |
Internet Access in Hokendauqua
| Internet Type | # Households | % Households |
| Dial-Up Internet | 0 | 0.0% |
| Broadband Home | 958 | 78.5% |
| Cellular Data Only | 92 | 7.5% |
| Satellite Internet | 66 | 5.4% |
| No Internet | 140 | 11.5% |
| Total | 1,220 | 100.0% |
Hokendauqua Summary
Hokendauqua is a small borough located in Lehigh County, Pennsylvania. It is situated in the Lehigh Valley region of the state, and is part of the Allentown-Bethlehem-Easton metropolitan area. The borough has a population of approximately 2,500 people, and is located just north of the city of Allentown.
History
Hokendauqua was first settled in the late 1700s by German immigrants. The name of the borough is derived from the Lenape Indian word for “place of many springs”. The area was originally part of Whitehall Township, and was known as “Hokendauqua” until 1875, when it was incorporated as a borough.
The borough was an important industrial center in the late 19th and early 20th centuries. The Lehigh Valley Railroad ran through the borough, and the Lehigh Valley Coal Company operated a large coal mine in the area. The coal mine was the largest in the Lehigh Valley, and employed hundreds of people. The borough also had several factories, including a silk mill, a paper mill, and a brickyard.
Geography
Hokendauqua is located in the Lehigh Valley region of Pennsylvania. It is situated in the western part of Lehigh County, and is bordered by Whitehall Township to the south, North Catasauqua to the east, and Coplay to the north. The borough is located just north of the city of Allentown, and is approximately 10 miles from the city of Bethlehem.
The borough has a total area of 0.7 square miles, all of which is land. The terrain is mostly flat, with some rolling hills in the northern part of the borough. The Lehigh River runs through the borough, and there are several small creeks and streams in the area.
Economy
Hokendauqua’s economy is largely based on manufacturing and retail. The borough is home to several factories, including a paper mill, a brickyard, and a silk mill. The borough also has several retail stores, including a grocery store, a hardware store, and a pharmacy.
The borough is also home to several small businesses, including restaurants, auto repair shops, and a barber shop. The borough is also home to a few small office buildings, and there are several small industrial parks in the area.
Demographics
As of the 2010 census, the population of Hokendauqua was 2,521. The racial makeup of the borough was 94.3% White, 1.3% African American, 0.2% Native American, 1.2% Asian, 0.1% Pacific Islander, 1.2% from other races, and 1.7% from two or more races. Hispanic or Latino of any race were 3.3% of the population.
The median household income in the borough was $45,938, and the median family income was $54,844. The per capita income was $21,945. About 8.3% of the population was below the poverty line.
Hokendauqua is a small borough with a rich history and a diverse economy. The borough is home to several factories and retail stores, as well as small businesses and office buildings. The population of the borough is largely white, with a small percentage of African Americans, Asians, and Hispanics. The median household income is slightly above the national average, and the poverty rate is below the national average.
Common Questions
What is Per Capita Income in Hokendauqua?
Per Capita income in Hokendauqua is $43,470.
What is the Median Family Income in Hokendauqua?
Median Family Income in Hokendauqua is $112,639.
What is the Median Household income in Hokendauqua?
Median Household Income in Hokendauqua is $83,750.
What is Income or Wage Gap in Hokendauqua?
Income or Wage Gap in Hokendauqua is 25.0%.
Women in Hokendauqua earn 75.0 cents for every dollar earned by a man.
What is Inequality or Gini Index in Hokendauqua?
Inequality or Gini Index in Hokendauqua is 0.43.
What is the Total Population of Hokendauqua?
Total Population of Hokendauqua is 2,960.
What is the Total Male Population of Hokendauqua?
Total Male Population of Hokendauqua is 1,428.
What is the Total Female Population of Hokendauqua?
Total Female Population of Hokendauqua is 1,532.
What is the Ratio of Males per 100 Females in Hokendauqua?
There are 93.21 Males per 100 Females in Hokendauqua.
What is the Ratio of Females per 100 Males in Hokendauqua?
There are 107.28 Females per 100 Males in Hokendauqua.
What is the Median Population Age in Hokendauqua?
Median Population Age in Hokendauqua is 42.6 Years.
What is the Average Family Size in Hokendauqua
Average Family Size in Hokendauqua is 3.3 People.
What is the Average Household Size in Hokendauqua
Average Household Size in Hokendauqua is 2.4 People.
How Large is the Labor Force in Hokendauqua?
There are 1,947 People in the Labor Forcein in Hokendauqua.
What is the Percentage of People in the Labor Force in Hokendauqua?
73.8% of People are in the Labor Force in Hokendauqua.
What is the Unemployment Rate in Hokendauqua?
Unemployment Rate in Hokendauqua is 4.6%.