Larksville borough, PA Map & Demographics
Larksville borough Overview
$45,428
PER CAPITA INCOME
$88,910
AVG FAMILY INCOME
$69,769
AVG HOUSEHOLD INCOME
35.8%
WAGE / INCOME GAP [ % ]
64.2¢/ $1
WAGE / INCOME GAP [ $ ]
0.51
INEQUALITY / GINI INDEX
4,240
TOTAL POPULATION
1,844
MALE POPULATION
2,396
FEMALE POPULATION
76.96
MALES / 100 FEMALES
129.93
FEMALES / 100 MALES
50.2
MEDIAN AGE
2.9
AVG FAMILY SIZE
2.4
AVG HOUSEHOLD SIZE
2,277
LABOR FORCE [ PEOPLE ]
62.1%
PERCENT IN LABOR FORCE
8.2%
UNEMPLOYMENT RATE
Income in Larksville borough
Income Overview in Larksville borough
Per Capita Income in Larksville borough is $45,428, while median incomes of families and households are $88,910 and $69,769 respectively.
| Characteristic | Number | Measure |
| Per Capita Income | 4,240 | $45,428 |
| Median Family Income | 1,206 | $88,910 |
| Mean Family Income | 1,206 | $125,387 |
| Median Household Income | 1,751 | $69,769 |
| Mean Household Income | 1,751 | $104,360 |
| Income Deficit | 1,206 | $0 |
| Wage / Income Gap (%) | 4,240 | 35.82% |
| Wage / Income Gap ($) | 4,240 | 64.18¢ per $1 |
| Gini / Inequality Index | 4,240 | 0.51 |
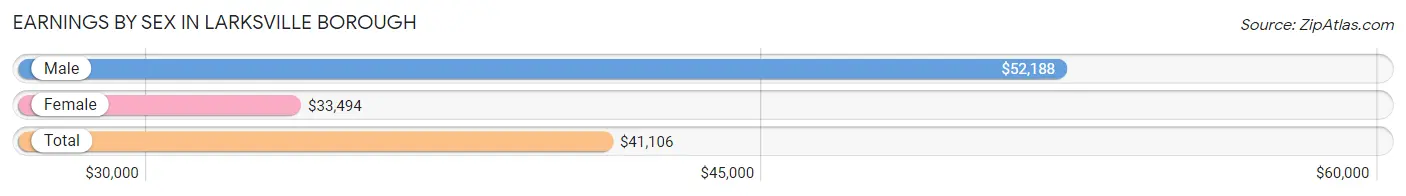
Earnings by Sex in Larksville borough
Average Earnings in Larksville borough are $41,106, $52,188 for men and $33,494 for women, a difference of 35.8%.
| Sex | Number | Average Earnings |
| Male | 946 (40.5%) | $52,188 |
| Female | 1,388 (59.5%) | $33,494 |
| Total | 2,334 (100.0%) | $41,106 |
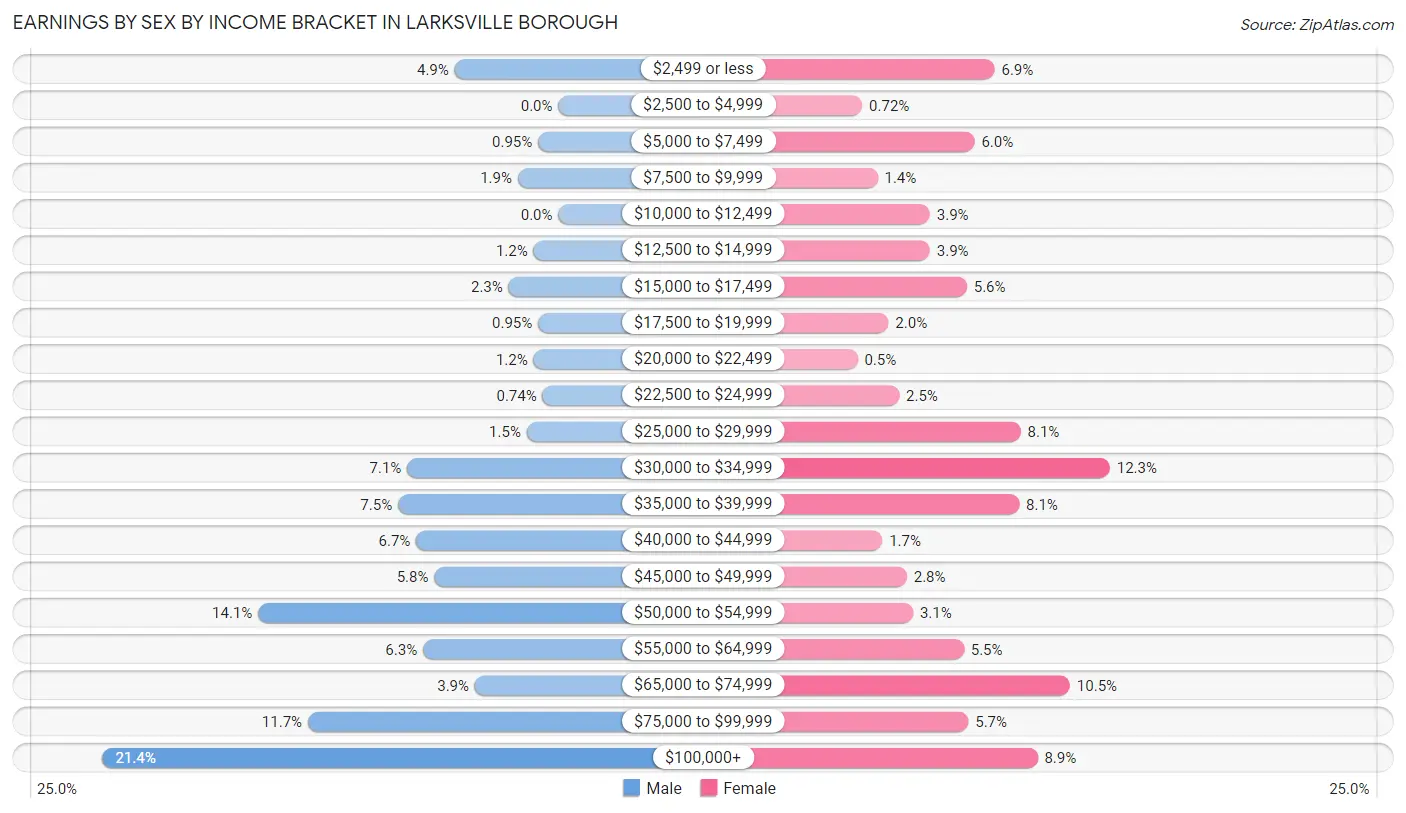
Earnings by Sex by Income Bracket in Larksville borough
The most common earnings brackets in Larksville borough are $100,000+ for men (202 | 21.3%) and $30,000 to $34,999 for women (171 | 12.3%).
| Income | Male | Female |
| $2,499 or less | 46 (4.9%) | 96 (6.9%) |
| $2,500 to $4,999 | 0 (0.0%) | 10 (0.7%) |
| $5,000 to $7,499 | 9 (0.9%) | 83 (6.0%) |
| $7,500 to $9,999 | 18 (1.9%) | 20 (1.4%) |
| $10,000 to $12,499 | 0 (0.0%) | 54 (3.9%) |
| $12,500 to $14,999 | 11 (1.2%) | 54 (3.9%) |
| $15,000 to $17,499 | 22 (2.3%) | 78 (5.6%) |
| $17,500 to $19,999 | 9 (0.9%) | 27 (1.9%) |
| $20,000 to $22,499 | 11 (1.2%) | 7 (0.5%) |
| $22,500 to $24,999 | 7 (0.7%) | 34 (2.5%) |
| $25,000 to $29,999 | 14 (1.5%) | 113 (8.1%) |
| $30,000 to $34,999 | 67 (7.1%) | 171 (12.3%) |
| $35,000 to $39,999 | 71 (7.5%) | 112 (8.1%) |
| $40,000 to $44,999 | 63 (6.7%) | 23 (1.7%) |
| $45,000 to $49,999 | 55 (5.8%) | 39 (2.8%) |
| $50,000 to $54,999 | 133 (14.1%) | 43 (3.1%) |
| $55,000 to $64,999 | 60 (6.3%) | 76 (5.5%) |
| $65,000 to $74,999 | 37 (3.9%) | 145 (10.4%) |
| $75,000 to $99,999 | 111 (11.7%) | 79 (5.7%) |
| $100,000+ | 202 (21.3%) | 124 (8.9%) |
| Total | 946 (100.0%) | 1,388 (100.0%) |
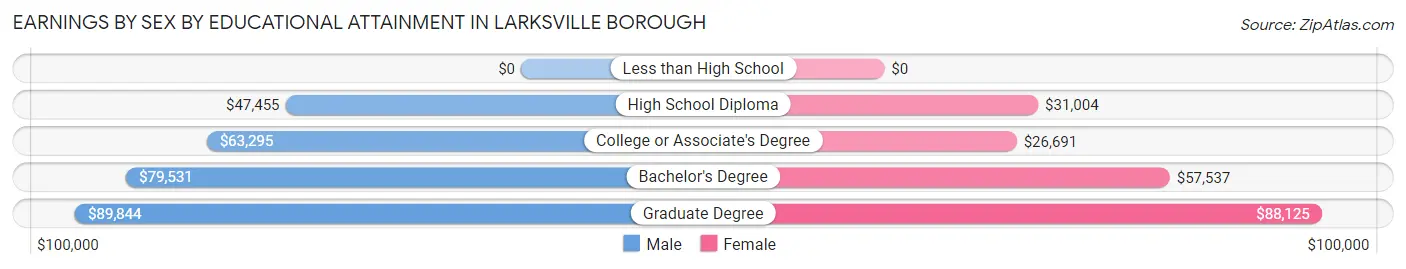
Earnings by Sex by Educational Attainment in Larksville borough
Average earnings in Larksville borough are $52,564 for men and $34,741 for women, a difference of 33.9%. Men with an educational attainment of graduate degree enjoy the highest average annual earnings of $89,844, while those with high school diploma education earn the least with $47,455. Women with an educational attainment of graduate degree earn the most with the average annual earnings of $88,125, while those with college or associate's degree education have the smallest earnings of $26,691.
| Educational Attainment | Male Income | Female Income |
| Less than High School | - | - |
| High School Diploma | $47,455 | $31,004 |
| College or Associate's Degree | $63,295 | $26,691 |
| Bachelor's Degree | $79,531 | $57,537 |
| Graduate Degree | $89,844 | $88,125 |
| Total | $52,564 | $34,741 |
Family Income in Larksville borough
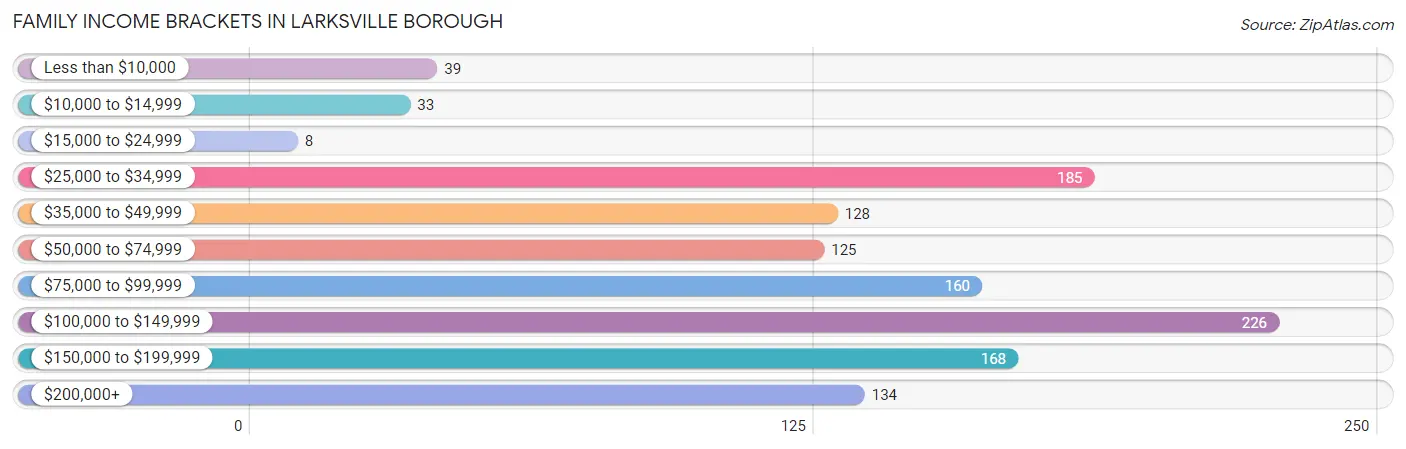
Family Income Brackets in Larksville borough
According to the Larksville borough family income data, there are 226 families falling into the $100,000 to $149,999 income range, which is the most common income bracket and makes up 18.7% of all families. Conversely, the $15,000 to $24,999 income bracket is the least frequent group with only 8 families (0.7%) belonging to this category.
| Income Bracket | # Families | % Families |
| Less than $10,000 | 39 | 3.2% |
| $10,000 to $14,999 | 33 | 2.7% |
| $15,000 to $24,999 | 8 | 0.7% |
| $25,000 to $34,999 | 185 | 15.3% |
| $35,000 to $49,999 | 128 | 10.6% |
| $50,000 to $74,999 | 125 | 10.4% |
| $75,000 to $99,999 | 160 | 13.3% |
| $100,000 to $149,999 | 226 | 18.7% |
| $150,000 to $199,999 | 168 | 13.9% |
| $200,000+ | 134 | 11.1% |
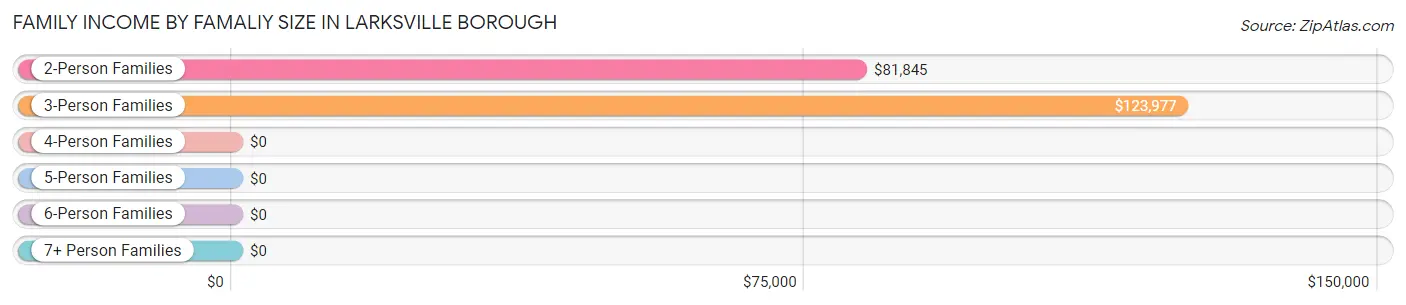
Family Income by Famaliy Size in Larksville borough
3-person families (393 | 32.6%) account for the highest median family income in Larksville borough with $123,977 per family, while 3-person families (393 | 32.6%) have the highest median income of $41,326 per family member.
| Income Bracket | # Families | Median Income |
| 2-Person Families | 587 (48.7%) | $81,845 |
| 3-Person Families | 393 (32.6%) | $123,977 |
| 4-Person Families | 206 (17.1%) | $0 |
| 5-Person Families | 11 (0.9%) | $0 |
| 6-Person Families | 9 (0.7%) | $0 |
| 7+ Person Families | 0 (0.0%) | $0 |
| Total | 1,206 (100.0%) | $88,910 |
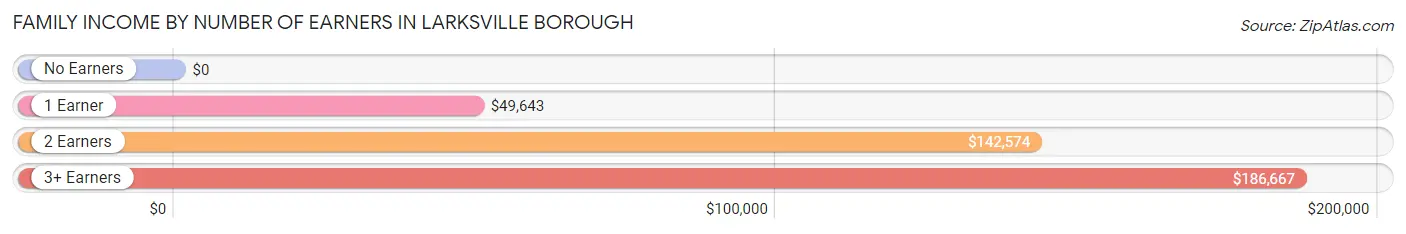
Family Income by Number of Earners in Larksville borough
| Number of Earners | # Families | Median Income |
| No Earners | 266 (22.1%) | $0 |
| 1 Earner | 378 (31.3%) | $49,643 |
| 2 Earners | 382 (31.7%) | $142,574 |
| 3+ Earners | 180 (14.9%) | $186,667 |
| Total | 1,206 (100.0%) | $88,910 |
Household Income in Larksville borough
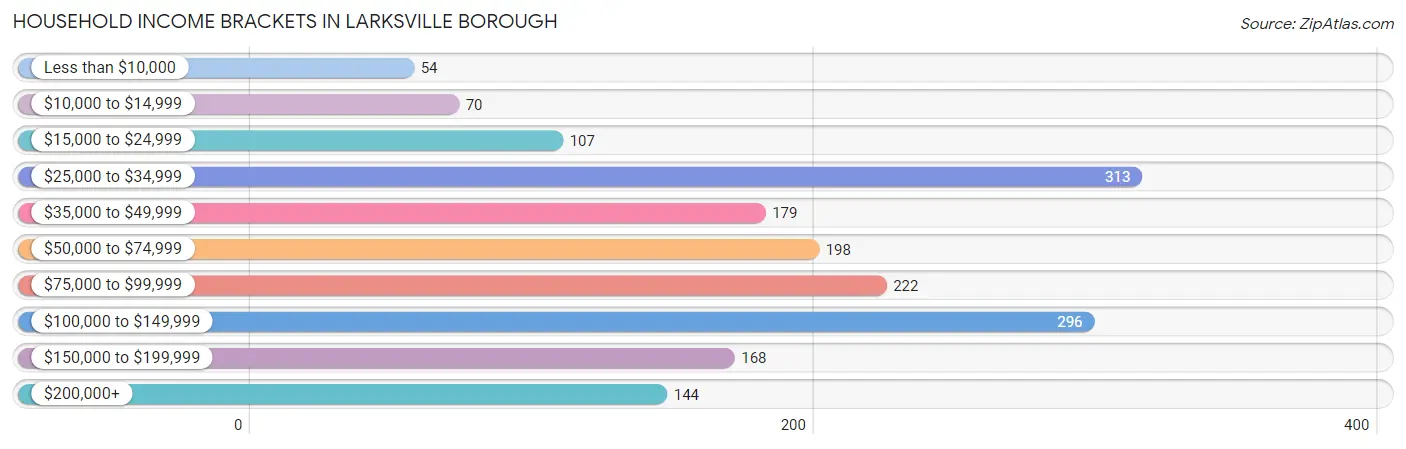
Household Income Brackets in Larksville borough
With 313 households falling in the category, the $25,000 to $34,999 income range is the most frequent in Larksville borough, accounting for 17.9% of all households. In contrast, only 54 households (3.1%) fall into the less than $10,000 income bracket, making it the least populous group.
| Income Bracket | # Households | % Households |
| Less than $10,000 | 54 | 3.1% |
| $10,000 to $14,999 | 70 | 4.0% |
| $15,000 to $24,999 | 107 | 6.1% |
| $25,000 to $34,999 | 313 | 17.9% |
| $35,000 to $49,999 | 179 | 10.2% |
| $50,000 to $74,999 | 198 | 11.3% |
| $75,000 to $99,999 | 222 | 12.7% |
| $100,000 to $149,999 | 296 | 16.9% |
| $150,000 to $199,999 | 168 | 9.6% |
| $200,000+ | 144 | 8.2% |
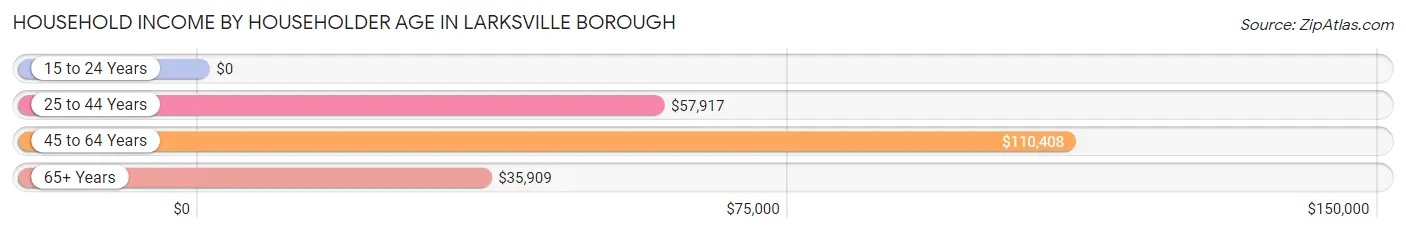
Household Income by Householder Age in Larksville borough
The median household income in Larksville borough is $69,769, with the highest median household income of $110,408 found in the 45 to 64 years age bracket for the primary householder. A total of 733 households (41.9%) fall into this category. Meanwhile, the 15 to 24 years age bracket for the primary householder has the lowest median household income of $0, with 20 households (1.1%) in this group.
| Income Bracket | # Households | Median Income |
| 15 to 24 Years | 20 (1.1%) | $0 |
| 25 to 44 Years | 300 (17.1%) | $57,917 |
| 45 to 64 Years | 733 (41.9%) | $110,408 |
| 65+ Years | 698 (39.9%) | $35,909 |
| Total | 1,751 (100.0%) | $69,769 |
Poverty in Larksville borough
Income Below Poverty by Sex and Age in Larksville borough
With 6.4% poverty level for males and 8.4% for females among the residents of Larksville borough, 6 to 11 year old males and 12 to 14 year old females are the most vulnerable to poverty, with 29 males (46.8%) and 26 females (36.1%) in their respective age groups living below the poverty level.
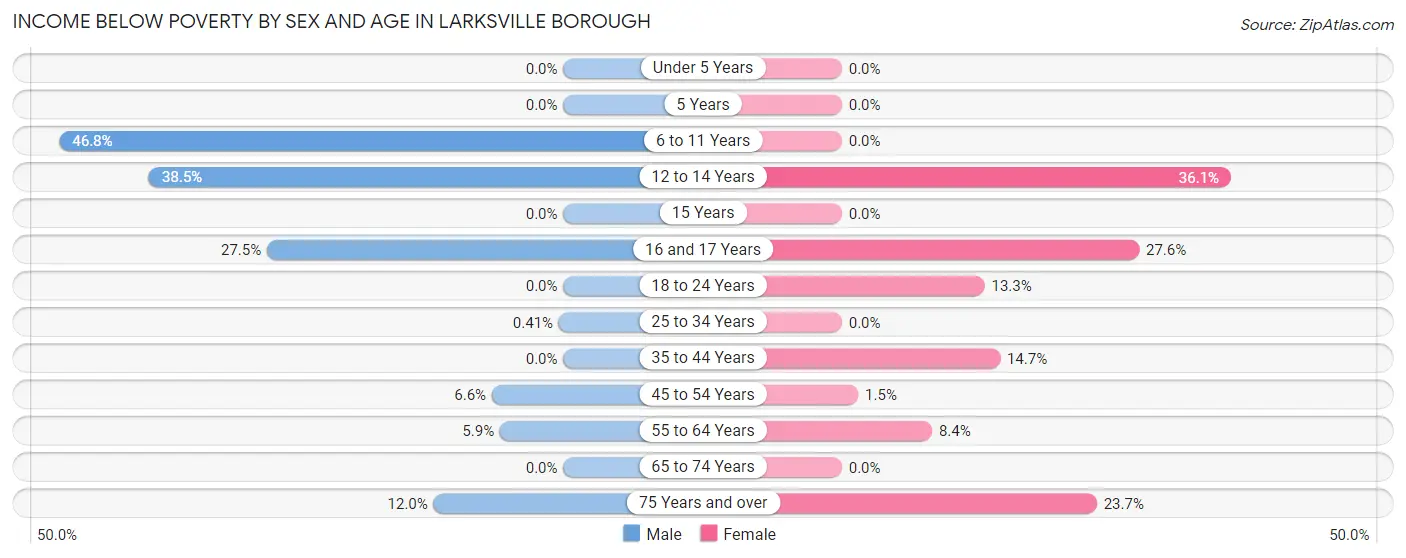
| Age Bracket | Male | Female |
| Under 5 Years | 0 (0.0%) | 0 (0.0%) |
| 5 Years | 0 (0.0%) | 0 (0.0%) |
| 6 to 11 Years | 29 (46.8%) | 0 (0.0%) |
| 12 to 14 Years | 10 (38.5%) | 26 (36.1%) |
| 15 Years | 0 (0.0%) | 0 (0.0%) |
| 16 and 17 Years | 11 (27.5%) | 8 (27.6%) |
| 18 to 24 Years | 0 (0.0%) | 33 (13.3%) |
| 25 to 34 Years | 1 (0.4%) | 0 (0.0%) |
| 35 to 44 Years | 0 (0.0%) | 37 (14.7%) |
| 45 to 54 Years | 22 (6.6%) | 5 (1.5%) |
| 55 to 64 Years | 22 (5.9%) | 39 (8.4%) |
| 65 to 74 Years | 0 (0.0%) | 0 (0.0%) |
| 75 Years and over | 23 (12.0%) | 53 (23.7%) |
| Total | 118 (6.4%) | 201 (8.4%) |
Income Above Poverty by Sex and Age in Larksville borough
According to the poverty statistics in Larksville borough, males aged under 5 years and females aged under 5 years are the age groups that are most secure financially, with 100.0% of males and 100.0% of females in these age groups living above the poverty line.

| Age Bracket | Male | Female |
| Under 5 Years | 127 (100.0%) | 151 (100.0%) |
| 5 Years | 35 (100.0%) | 0 (0.0%) |
| 6 to 11 Years | 33 (53.2%) | 69 (100.0%) |
| 12 to 14 Years | 16 (61.5%) | 46 (63.9%) |
| 15 Years | 0 (0.0%) | 31 (100.0%) |
| 16 and 17 Years | 29 (72.5%) | 21 (72.4%) |
| 18 to 24 Years | 39 (100.0%) | 216 (86.8%) |
| 25 to 34 Years | 244 (99.6%) | 178 (100.0%) |
| 35 to 44 Years | 150 (100.0%) | 215 (85.3%) |
| 45 to 54 Years | 310 (93.4%) | 323 (98.5%) |
| 55 to 64 Years | 352 (94.1%) | 427 (91.6%) |
| 65 to 74 Years | 223 (100.0%) | 347 (100.0%) |
| 75 Years and over | 168 (88.0%) | 171 (76.3%) |
| Total | 1,726 (93.6%) | 2,195 (91.6%) |
Income Below Poverty Among Married-Couple Families in Larksville borough
The poverty statistics for married-couple families in Larksville borough show that 1.3% or 12 of the total 941 families live below the poverty line. Families with no children have the highest poverty rate of 1.8%, comprising of 12 families. On the other hand, families with 1 or 2 children have the lowest poverty rate of 0.0%, which includes 0 families.
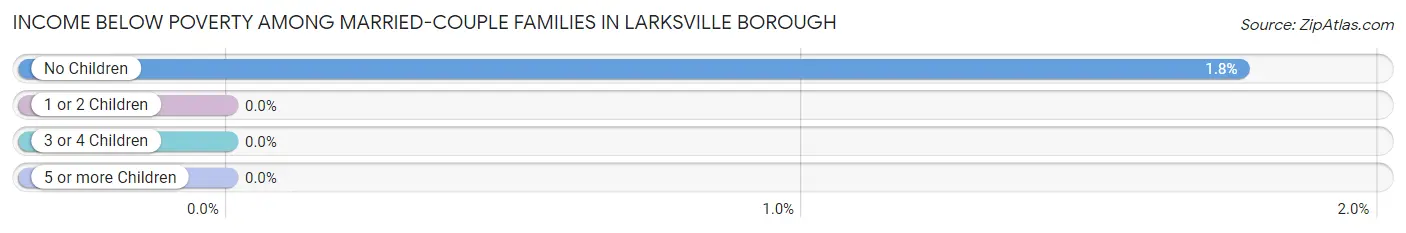
| Children | Above Poverty | Below Poverty |
| No Children | 671 (98.2%) | 12 (1.8%) |
| 1 or 2 Children | 238 (100.0%) | 0 (0.0%) |
| 3 or 4 Children | 20 (100.0%) | 0 (0.0%) |
| 5 or more Children | 0 (0.0%) | 0 (0.0%) |
| Total | 929 (98.7%) | 12 (1.3%) |
Income Below Poverty Among Single-Parent Households in Larksville borough
According to the poverty data in Larksville borough, 21.4% or 22 single-father households and 22.8% or 37 single-mother households are living below the poverty line. Among single-father households, those with no children have the highest poverty rate, with 11 households (24.4%) experiencing poverty. Likewise, among single-mother households, those with 1 or 2 children have the highest poverty rate, with 37 households (61.7%) falling below the poverty line.
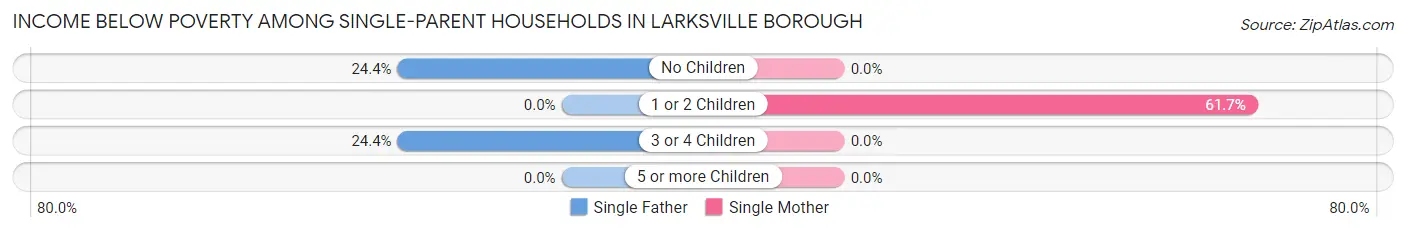
| Children | Single Father | Single Mother |
| No Children | 11 (24.4%) | 0 (0.0%) |
| 1 or 2 Children | 0 (0.0%) | 37 (61.7%) |
| 3 or 4 Children | 11 (24.4%) | 0 (0.0%) |
| 5 or more Children | 0 (0.0%) | 0 (0.0%) |
| Total | 22 (21.4%) | 37 (22.8%) |
Income Below Poverty Among Married-Couple vs Single-Parent Households in Larksville borough
The poverty data for Larksville borough shows that 12 of the married-couple family households (1.3%) and 59 of the single-parent households (22.3%) are living below the poverty level. Within the married-couple family households, those with no children have the highest poverty rate, with 12 households (1.8%) falling below the poverty line. Among the single-parent households, those with 1 or 2 children have the highest poverty rate, with 37 household (50.7%) living below poverty.
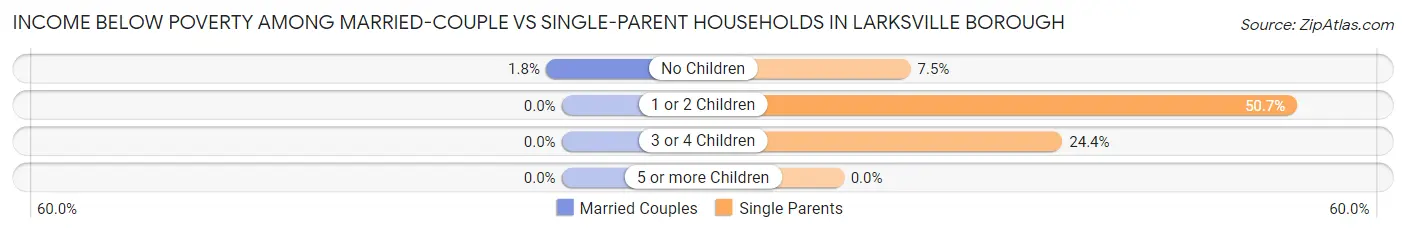
| Children | Married-Couple Families | Single-Parent Households |
| No Children | 12 (1.8%) | 11 (7.5%) |
| 1 or 2 Children | 0 (0.0%) | 37 (50.7%) |
| 3 or 4 Children | 0 (0.0%) | 11 (24.4%) |
| 5 or more Children | 0 (0.0%) | 0 (0.0%) |
| Total | 12 (1.3%) | 59 (22.3%) |
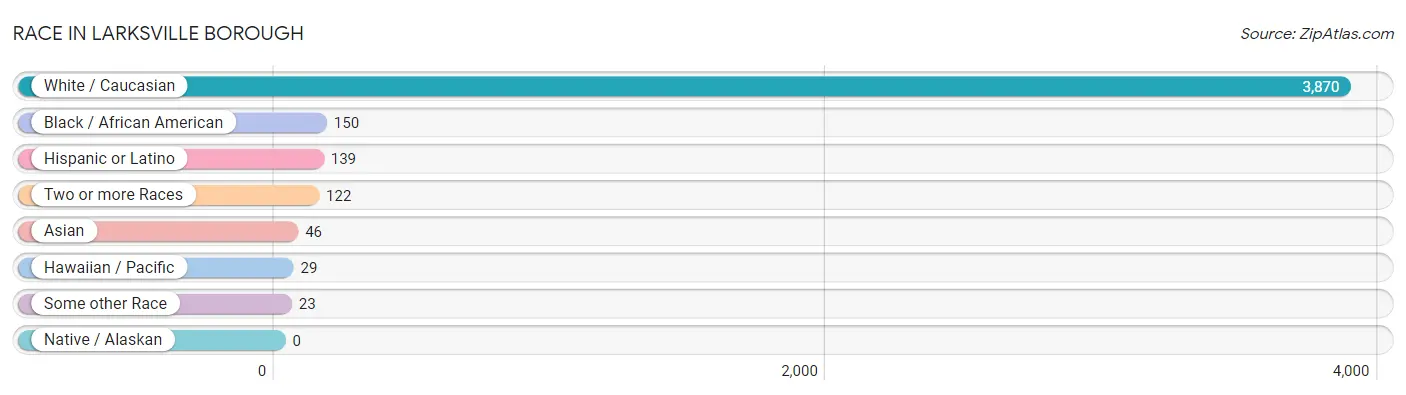
Race in Larksville borough
The most populous races in Larksville borough are White / Caucasian (3,870 | 91.3%), Black / African American (150 | 3.5%), and Hispanic or Latino (139 | 3.3%).
| Race | # Population | % Population |
| Asian | 46 | 1.1% |
| Black / African American | 150 | 3.5% |
| Hawaiian / Pacific | 29 | 0.7% |
| Hispanic or Latino | 139 | 3.3% |
| Native / Alaskan | 0 | 0.0% |
| White / Caucasian | 3,870 | 91.3% |
| Two or more Races | 122 | 2.9% |
| Some other Race | 23 | 0.5% |
| Total | 4,240 | 100.0% |
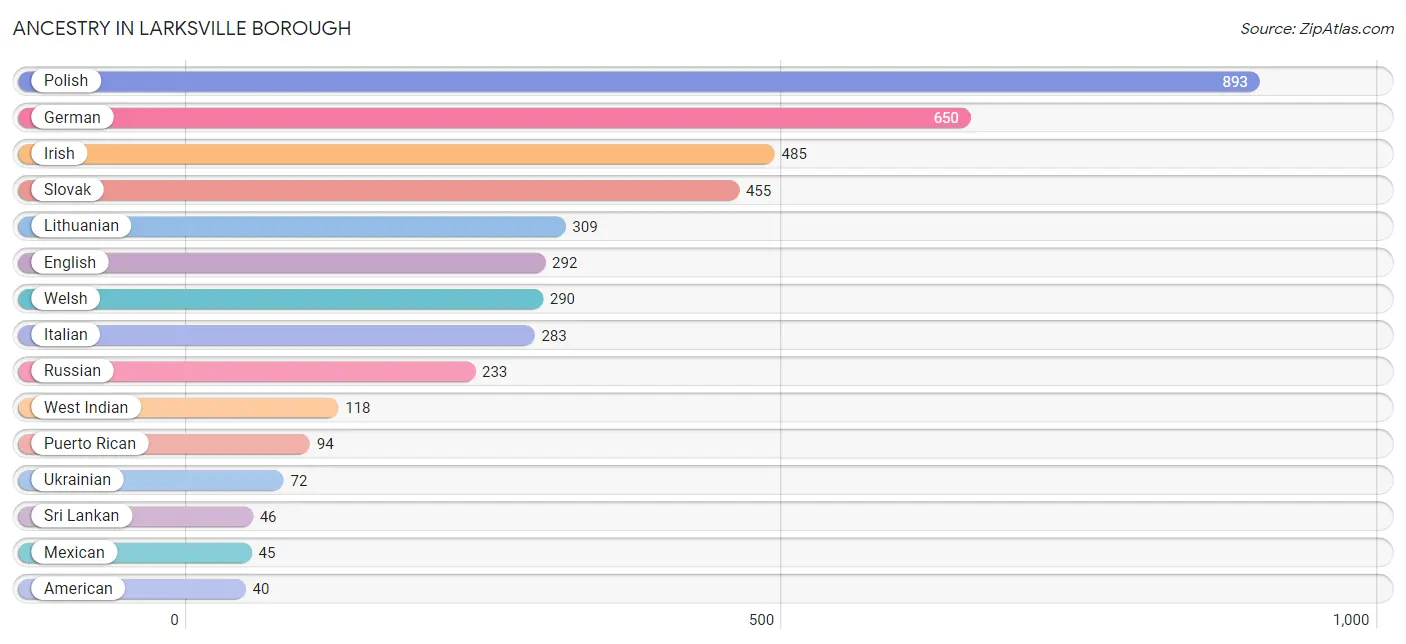
Ancestry in Larksville borough
The most populous ancestries reported in Larksville borough are Polish (893 | 21.1%), German (650 | 15.3%), Irish (485 | 11.4%), Slovak (455 | 10.7%), and Lithuanian (309 | 7.3%), together accounting for 65.8% of all Larksville borough residents.
| Ancestry | # Population | % Population |
| African | 1 | 0.0% |
| Albanian | 7 | 0.2% |
| American | 40 | 0.9% |
| Arab | 7 | 0.2% |
| Austrian | 22 | 0.5% |
| British | 7 | 0.2% |
| Czech | 8 | 0.2% |
| Dutch | 17 | 0.4% |
| Eastern European | 12 | 0.3% |
| English | 292 | 6.9% |
| European | 30 | 0.7% |
| French | 12 | 0.3% |
| German | 650 | 15.3% |
| Hungarian | 28 | 0.7% |
| Irish | 485 | 11.4% |
| Iroquois | 5 | 0.1% |
| Italian | 283 | 6.7% |
| Jamaican | 11 | 0.3% |
| Lebanese | 7 | 0.2% |
| Lithuanian | 309 | 7.3% |
| Mexican | 45 | 1.1% |
| Native Hawaiian | 29 | 0.7% |
| Norwegian | 37 | 0.9% |
| Pennsylvania German | 20 | 0.5% |
| Polish | 893 | 21.1% |
| Puerto Rican | 94 | 2.2% |
| Russian | 233 | 5.5% |
| Scottish | 35 | 0.8% |
| Serbian | 10 | 0.2% |
| Slovak | 455 | 10.7% |
| Sri Lankan | 46 | 1.1% |
| Subsaharan African | 1 | 0.0% |
| Swedish | 19 | 0.4% |
| Ukrainian | 72 | 1.7% |
| Welsh | 290 | 6.8% |
| West Indian | 118 | 2.8% | View All 36 Rows |
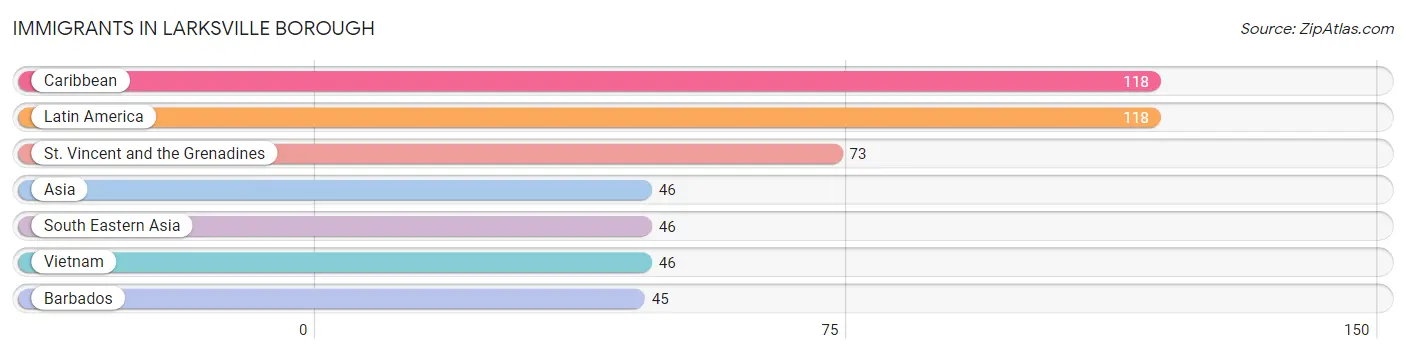
Immigrants in Larksville borough
The most numerous immigrant groups reported in Larksville borough came from Caribbean (118 | 2.8%), Latin America (118 | 2.8%), St. Vincent and the Grenadines (73 | 1.7%), Asia (46 | 1.1%), and South Eastern Asia (46 | 1.1%), together accounting for 9.4% of all Larksville borough residents.
| Immigration Origin | # Population | % Population |
| Asia | 46 | 1.1% |
| Barbados | 45 | 1.1% |
| Caribbean | 118 | 2.8% |
| Latin America | 118 | 2.8% |
| South Eastern Asia | 46 | 1.1% |
| St. Vincent and the Grenadines | 73 | 1.7% |
| Vietnam | 46 | 1.1% | View All 7 Rows |
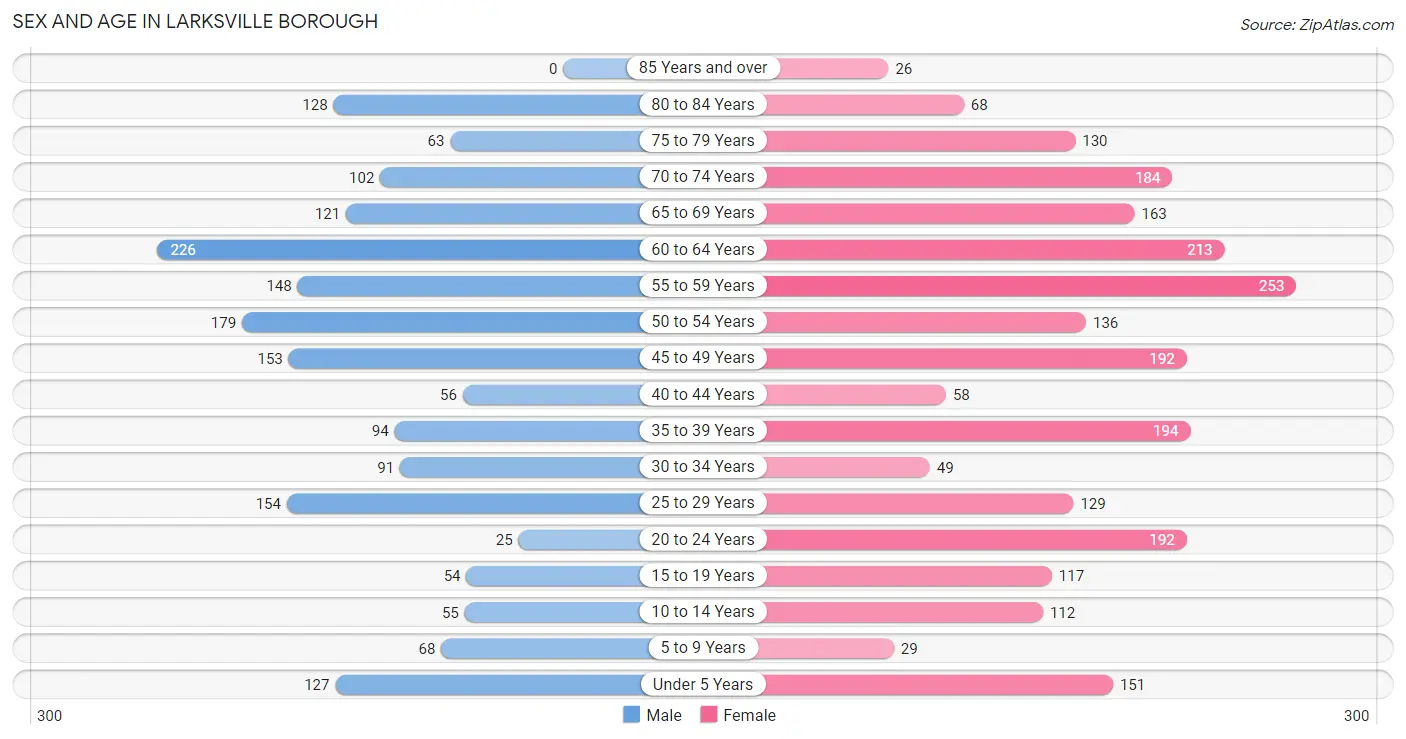
Sex and Age in Larksville borough
Sex and Age in Larksville borough
The most populous age groups in Larksville borough are 60 to 64 Years (226 | 12.3%) for men and 55 to 59 Years (253 | 10.6%) for women.
| Age Bracket | Male | Female |
| Under 5 Years | 127 (6.9%) | 151 (6.3%) |
| 5 to 9 Years | 68 (3.7%) | 29 (1.2%) |
| 10 to 14 Years | 55 (3.0%) | 112 (4.7%) |
| 15 to 19 Years | 54 (2.9%) | 117 (4.9%) |
| 20 to 24 Years | 25 (1.4%) | 192 (8.0%) |
| 25 to 29 Years | 154 (8.4%) | 129 (5.4%) |
| 30 to 34 Years | 91 (4.9%) | 49 (2.1%) |
| 35 to 39 Years | 94 (5.1%) | 194 (8.1%) |
| 40 to 44 Years | 56 (3.0%) | 58 (2.4%) |
| 45 to 49 Years | 153 (8.3%) | 192 (8.0%) |
| 50 to 54 Years | 179 (9.7%) | 136 (5.7%) |
| 55 to 59 Years | 148 (8.0%) | 253 (10.6%) |
| 60 to 64 Years | 226 (12.3%) | 213 (8.9%) |
| 65 to 69 Years | 121 (6.6%) | 163 (6.8%) |
| 70 to 74 Years | 102 (5.5%) | 184 (7.7%) |
| 75 to 79 Years | 63 (3.4%) | 130 (5.4%) |
| 80 to 84 Years | 128 (6.9%) | 68 (2.8%) |
| 85 Years and over | 0 (0.0%) | 26 (1.1%) |
| Total | 1,844 (100.0%) | 2,396 (100.0%) |
Families and Households in Larksville borough
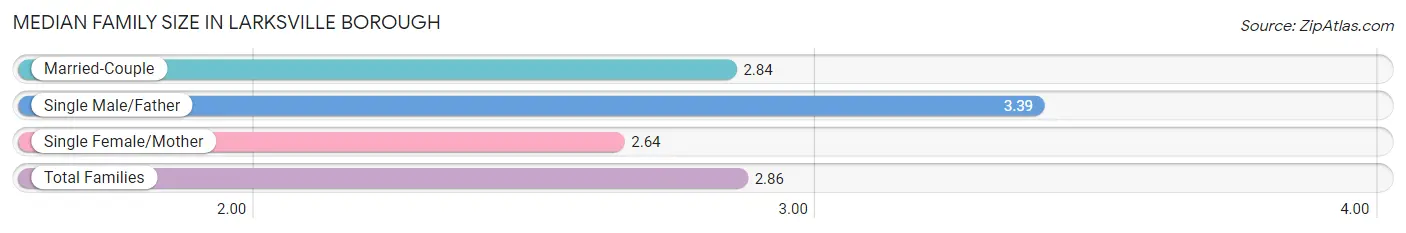
Median Family Size in Larksville borough
The median family size in Larksville borough is 2.86 persons per family, with single male/father families (103 | 8.5%) accounting for the largest median family size of 3.39 persons per family. On the other hand, single female/mother families (162 | 13.4%) represent the smallest median family size with 2.64 persons per family.
| Family Type | # Families | Family Size |
| Married-Couple | 941 (78.0%) | 2.84 |
| Single Male/Father | 103 (8.5%) | 3.39 |
| Single Female/Mother | 162 (13.4%) | 2.64 |
| Total Families | 1,206 (100.0%) | 2.86 |
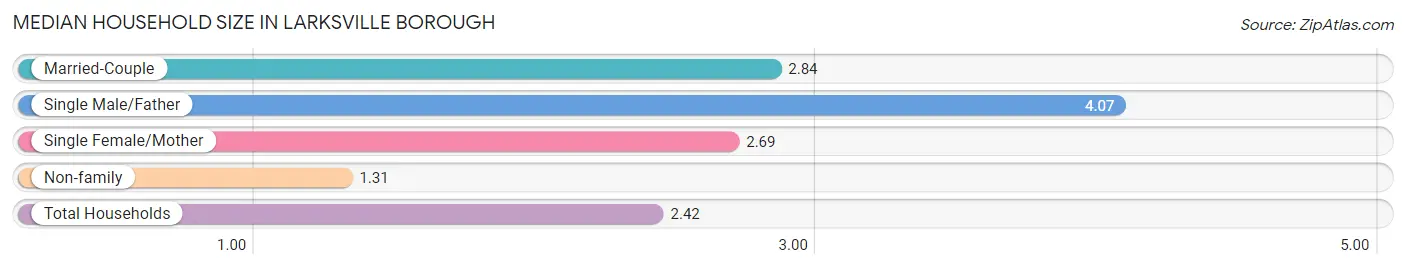
Median Household Size in Larksville borough
The median household size in Larksville borough is 2.42 persons per household, with single male/father households (103 | 5.9%) accounting for the largest median household size of 4.07 persons per household. non-family households (545 | 31.1%) represent the smallest median household size with 1.31 persons per household.
| Household Type | # Households | Household Size |
| Married-Couple | 941 (53.7%) | 2.84 |
| Single Male/Father | 103 (5.9%) | 4.07 |
| Single Female/Mother | 162 (9.2%) | 2.69 |
| Non-family | 545 (31.1%) | 1.31 |
| Total Households | 1,751 (100.0%) | 2.42 |
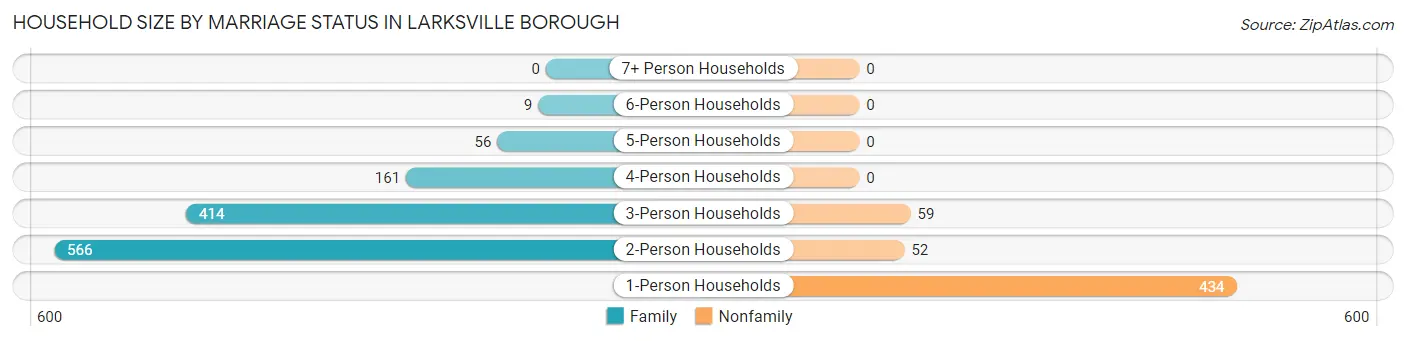
Household Size by Marriage Status in Larksville borough
Out of a total of 1,751 households in Larksville borough, 1,206 (68.9%) are family households, while 545 (31.1%) are nonfamily households. The most numerous type of family households are 2-person households, comprising 566, and the most common type of nonfamily households are 1-person households, comprising 434.
| Household Size | Family Households | Nonfamily Households |
| 1-Person Households | - | 434 (24.8%) |
| 2-Person Households | 566 (32.3%) | 52 (3.0%) |
| 3-Person Households | 414 (23.6%) | 59 (3.4%) |
| 4-Person Households | 161 (9.2%) | 0 (0.0%) |
| 5-Person Households | 56 (3.2%) | 0 (0.0%) |
| 6-Person Households | 9 (0.5%) | 0 (0.0%) |
| 7+ Person Households | 0 (0.0%) | 0 (0.0%) |
| Total | 1,206 (68.9%) | 545 (31.1%) |
Female Fertility in Larksville borough
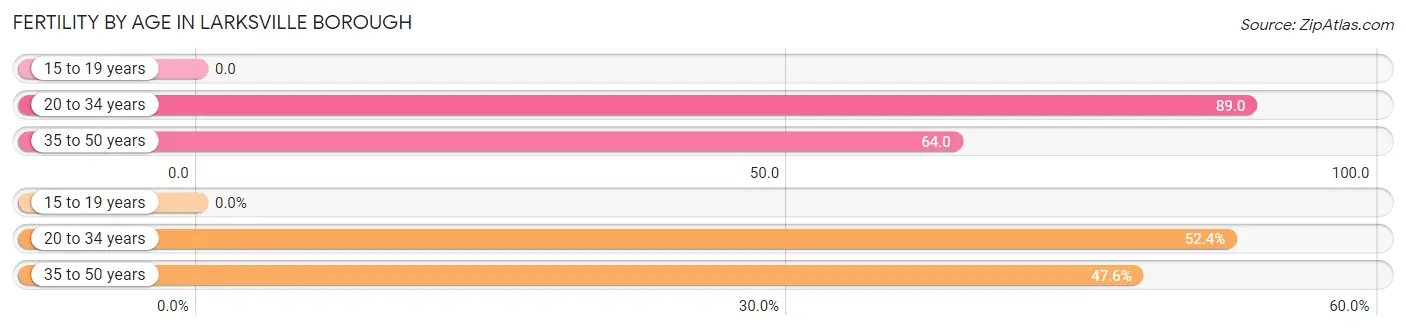
Fertility by Age in Larksville borough
Average fertility rate in Larksville borough is 66.0 births per 1,000 women. Women in the age bracket of 20 to 34 years have the highest fertility rate with 89.0 births per 1,000 women. Women in the age bracket of 20 to 34 years acount for 52.4% of all women with births.
| Age Bracket | Women with Births | Births / 1,000 Women |
| 15 to 19 years | 0 (0.0%) | 0.0 |
| 20 to 34 years | 33 (52.4%) | 89.0 |
| 35 to 50 years | 30 (47.6%) | 64.0 |
| Total | 63 (100.0%) | 66.0 |
Fertility by Age by Marriage Status in Larksville borough
47.6% of women with births (63) in Larksville borough are married. The highest percentage of unmarried women with births falls into 20 to 34 years age bracket with 100.0% of them unmarried at the time of birth, while the lowest percentage of unmarried women with births belong to 35 to 50 years age bracket with 0.0% of them unmarried.
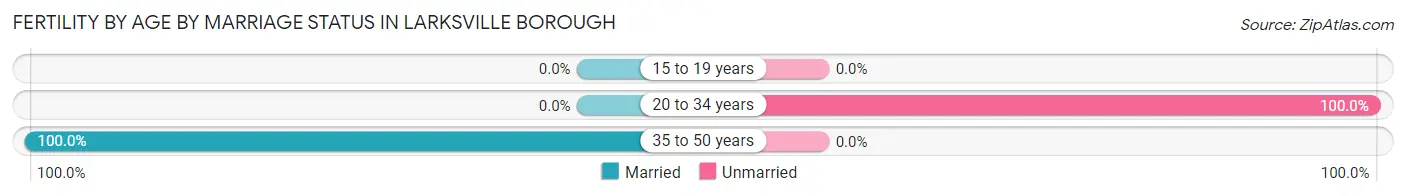
| Age Bracket | Married | Unmarried |
| 15 to 19 years | 0 (0.0%) | 0 (0.0%) |
| 20 to 34 years | 0 (0.0%) | 33 (100.0%) |
| 35 to 50 years | 30 (100.0%) | 0 (0.0%) |
| Total | 30 (47.6%) | 33 (52.4%) |
Fertility by Education in Larksville borough
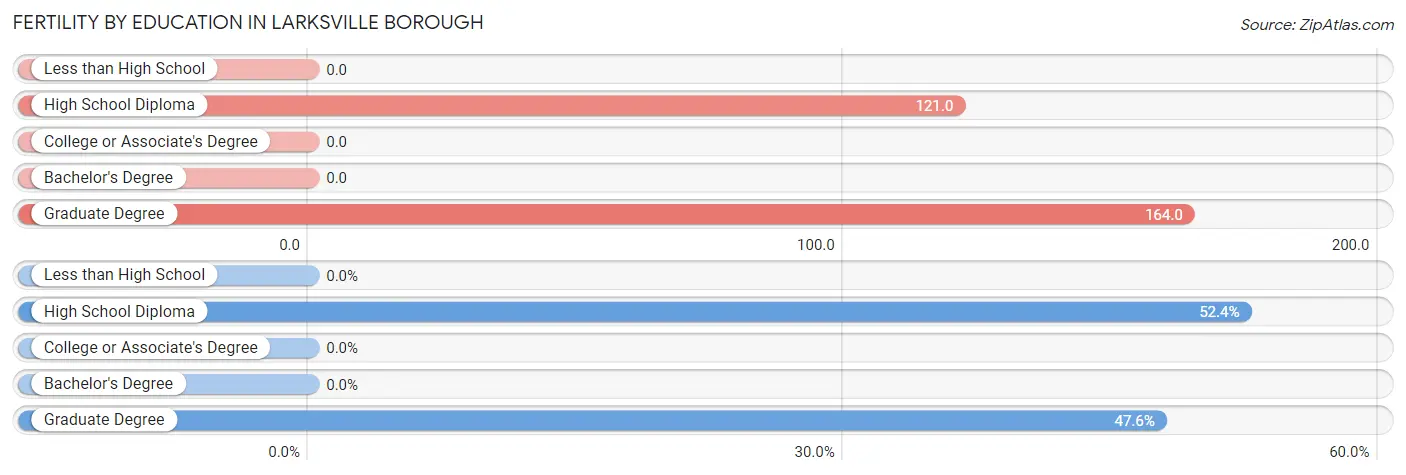
| Educational Attainment | Women with Births | Births / 1,000 Women |
| Less than High School | 0 (0.0%) | 0.0 |
| High School Diploma | 33 (52.4%) | 121.0 |
| College or Associate's Degree | 0 (0.0%) | 0.0 |
| Bachelor's Degree | 0 (0.0%) | 0.0 |
| Graduate Degree | 30 (47.6%) | 164.0 |
| Total | 63 (100.0%) | 66.0 |
Fertility by Education by Marriage Status in Larksville borough
52.4% of women with births in Larksville borough are unmarried. Women with the educational attainment of graduate degree are most likely to be married with 100.0% of them married at childbirth, while women with the educational attainment of high school diploma are least likely to be married with 100.0% of them unmarried at childbirth.
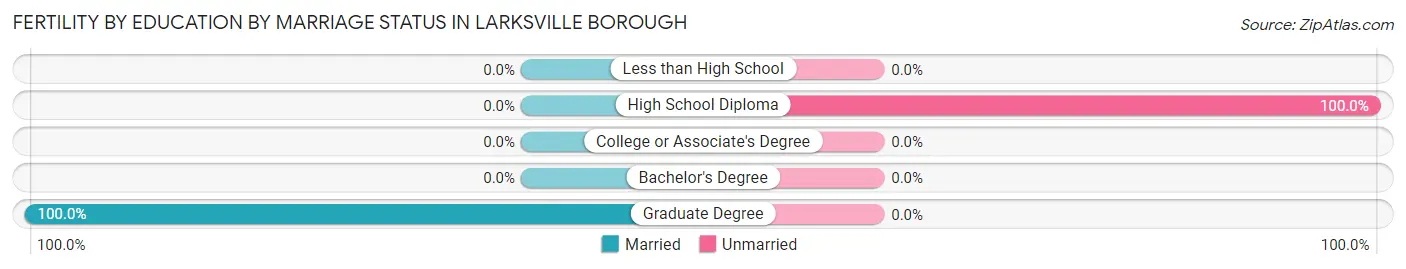
| Educational Attainment | Married | Unmarried |
| Less than High School | 0 (0.0%) | 0 (0.0%) |
| High School Diploma | 0 (0.0%) | 33 (100.0%) |
| College or Associate's Degree | 0 (0.0%) | 0 (0.0%) |
| Bachelor's Degree | 0 (0.0%) | 0 (0.0%) |
| Graduate Degree | 30 (100.0%) | 0 (0.0%) |
| Total | 30 (47.6%) | 33 (52.4%) |
Employment Characteristics in Larksville borough
Employment by Class of Employer in Larksville borough
Among the 2,052 employed individuals in Larksville borough, private company employees (1,400 | 68.2%), not-for-profit organizations (154 | 7.5%), and local government employees (153 | 7.5%) make up the most common classes of employment.
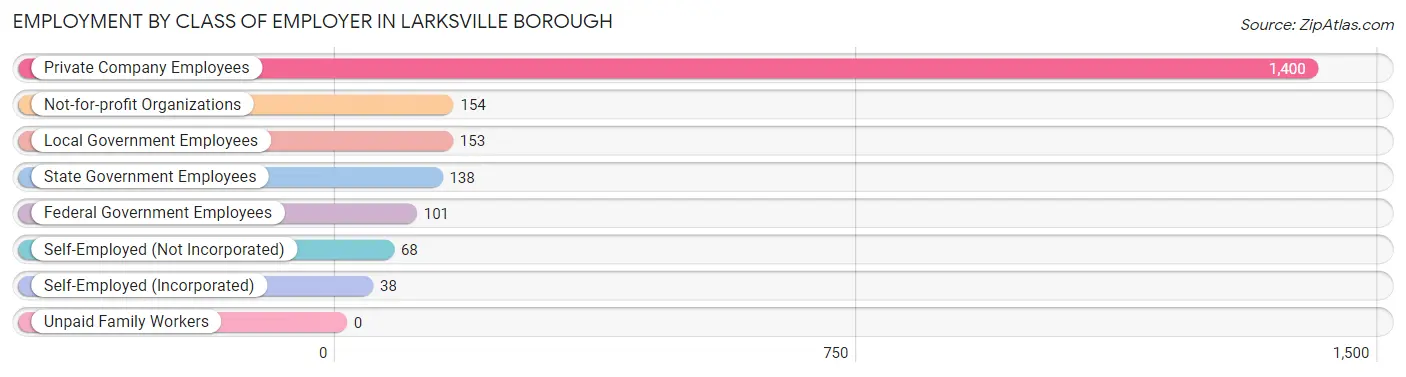
| Employer Class | # Employees | % Employees |
| Private Company Employees | 1,400 | 68.2% |
| Self-Employed (Incorporated) | 38 | 1.8% |
| Self-Employed (Not Incorporated) | 68 | 3.3% |
| Not-for-profit Organizations | 154 | 7.5% |
| Local Government Employees | 153 | 7.5% |
| State Government Employees | 138 | 6.7% |
| Federal Government Employees | 101 | 4.9% |
| Unpaid Family Workers | 0 | 0.0% |
| Total | 2,052 | 100.0% |
Employment Status by Age in Larksville borough
According to the labor force statistics for Larksville borough, out of the total population over 16 years of age (3,667), 62.1% or 2,277 individuals are in the labor force, with 8.2% or 187 of them unemployed. The age group with the highest labor force participation rate is 25 to 29 years, with 100.0% or 283 individuals in the labor force. Within the labor force, the 16 to 19 years age range has the highest percentage of unemployed individuals, with 46.1% or 41 of them being unemployed.
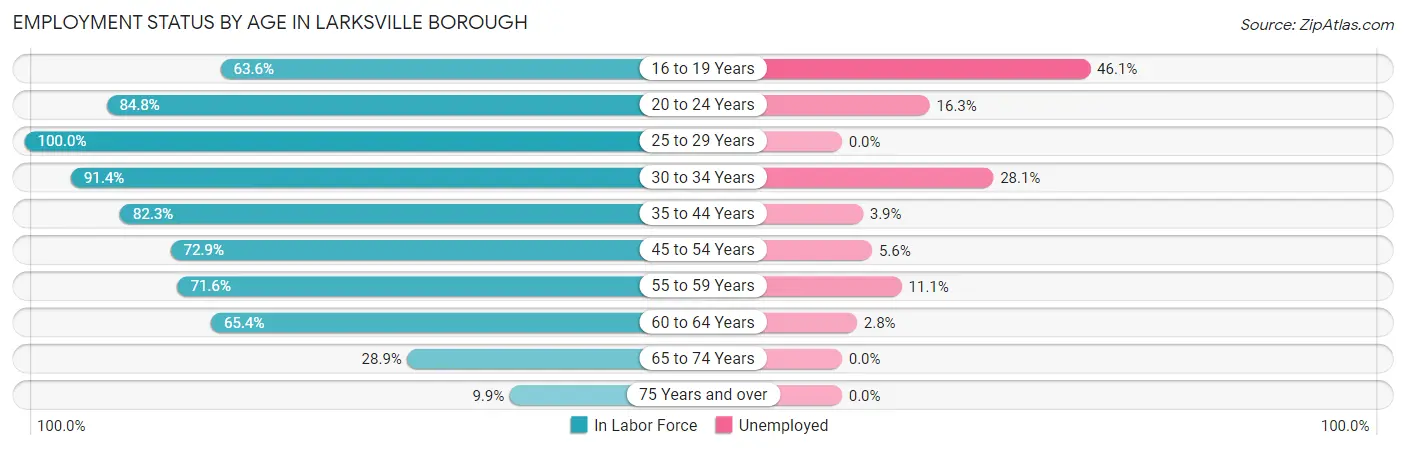
| Age Bracket | In Labor Force | Unemployed |
| 16 to 19 Years | 89 (63.6%) | 41 (46.1%) |
| 20 to 24 Years | 184 (84.8%) | 30 (16.3%) |
| 25 to 29 Years | 283 (100.0%) | 0 (0.0%) |
| 30 to 34 Years | 128 (91.4%) | 36 (28.1%) |
| 35 to 44 Years | 331 (82.3%) | 13 (3.9%) |
| 45 to 54 Years | 481 (72.9%) | 27 (5.6%) |
| 55 to 59 Years | 287 (71.6%) | 32 (11.1%) |
| 60 to 64 Years | 287 (65.4%) | 8 (2.8%) |
| 65 to 74 Years | 165 (28.9%) | 0 (0.0%) |
| 75 Years and over | 41 (9.9%) | 0 (0.0%) |
| Total | 2,277 (62.1%) | 187 (8.2%) |
Employment Status by Educational Attainment in Larksville borough
According to labor force statistics for Larksville borough, 77.3% of individuals (1,797) out of the total population between 25 and 64 years of age (2,325) are in the labor force, with 6.5% or 117 of them being unemployed. The group with the highest labor force participation rate are those with the educational attainment of bachelor's degree or higher, with 89.0% or 669 individuals in the labor force. Within the labor force, individuals with less than high school education have the highest percentage of unemployment, with 21.3% or 23 of them being unemployed.
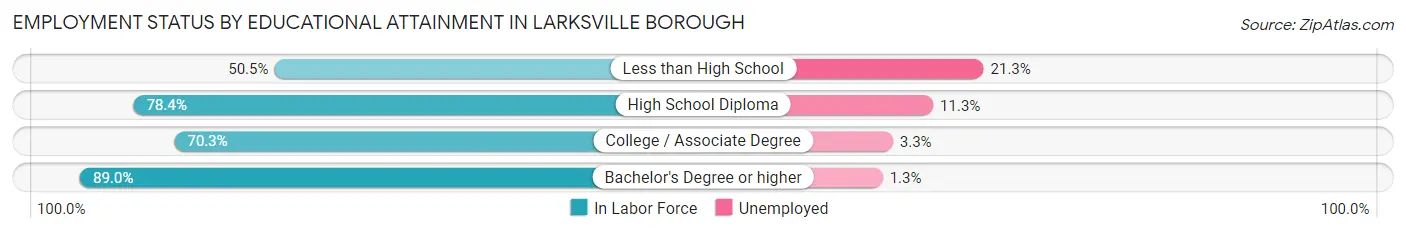
| Educational Attainment | In Labor Force | Unemployed |
| Less than High School | 108 (50.5%) | 46 (21.3%) |
| High School Diploma | 627 (78.4%) | 90 (11.3%) |
| College / Associate Degree | 393 (70.3%) | 18 (3.3%) |
| Bachelor's Degree or higher | 669 (89.0%) | 10 (1.3%) |
| Total | 1,797 (77.3%) | 151 (6.5%) |
Employment Occupations by Sex in Larksville borough
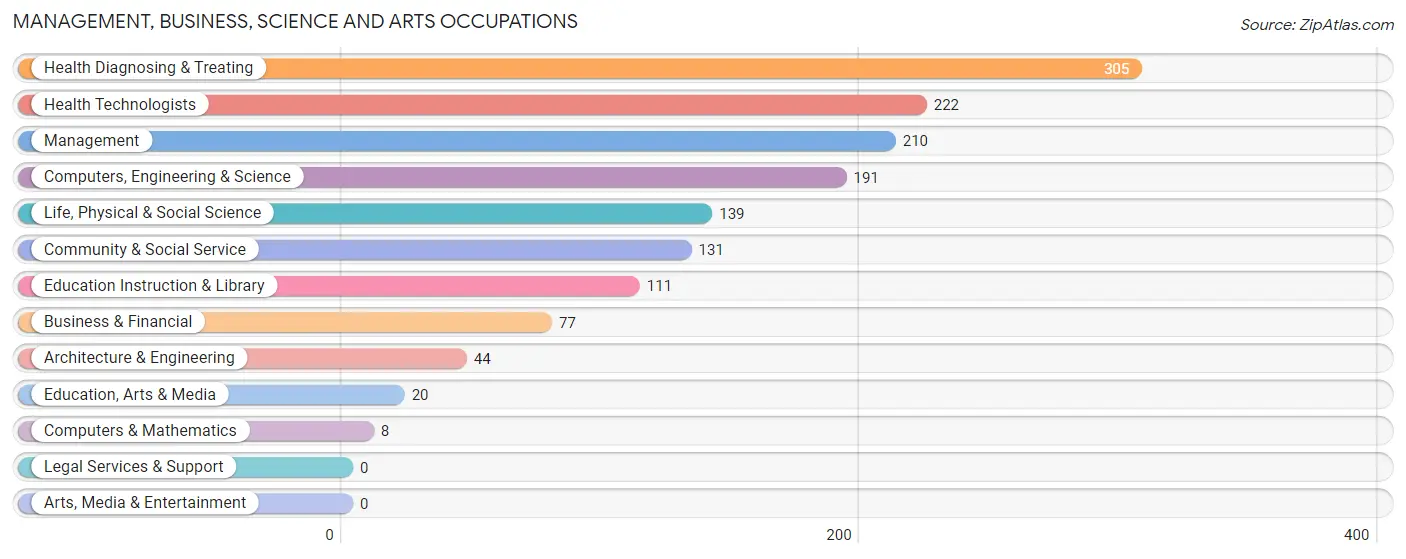
Management, Business, Science and Arts Occupations
The most common Management, Business, Science and Arts occupations in Larksville borough are Health Diagnosing & Treating (305 | 14.6%), Health Technologists (222 | 10.6%), Management (210 | 10.1%), Computers, Engineering & Science (191 | 9.1%), and Life, Physical & Social Science (139 | 6.7%).
Management, Business, Science and Arts Occupations by Sex
Within the Management, Business, Science and Arts occupations in Larksville borough, the most male-oriented occupations are Computers & Mathematics (100.0%), Business & Financial (85.7%), and Architecture & Engineering (72.7%), while the most female-oriented occupations are Health Diagnosing & Treating (97.4%), Health Technologists (96.4%), and Education Instruction & Library (82.9%).
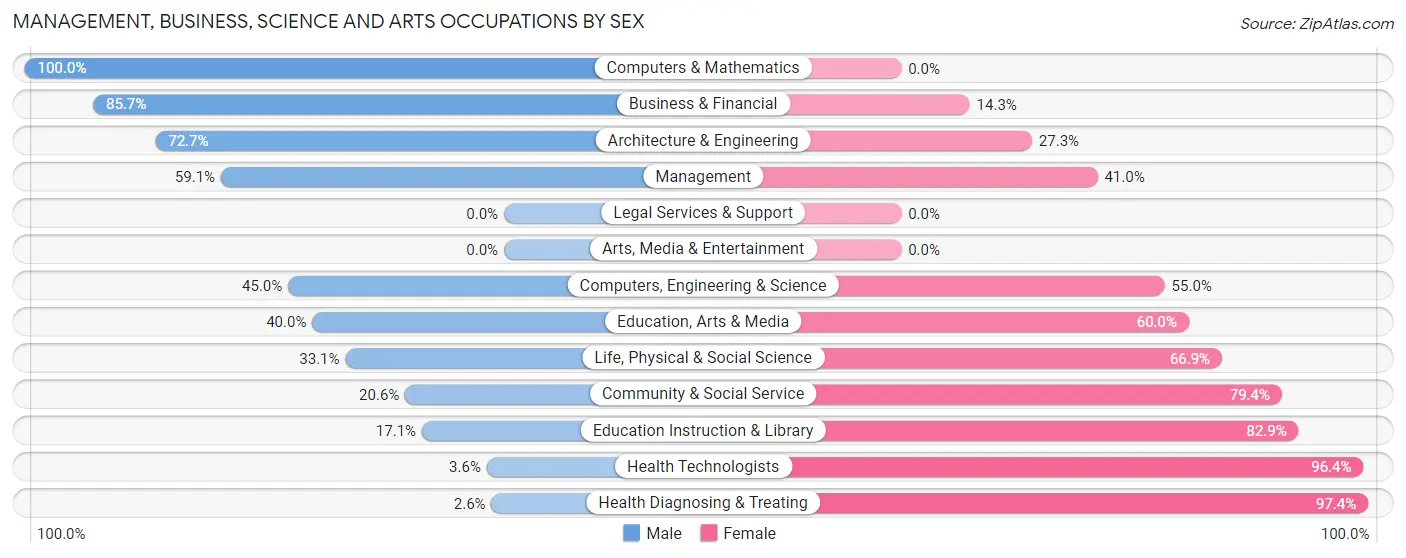
| Occupation | Male | Female |
| Management | 124 (59.1%) | 86 (40.9%) |
| Business & Financial | 66 (85.7%) | 11 (14.3%) |
| Computers, Engineering & Science | 86 (45.0%) | 105 (55.0%) |
| Computers & Mathematics | 8 (100.0%) | 0 (0.0%) |
| Architecture & Engineering | 32 (72.7%) | 12 (27.3%) |
| Life, Physical & Social Science | 46 (33.1%) | 93 (66.9%) |
| Community & Social Service | 27 (20.6%) | 104 (79.4%) |
| Education, Arts & Media | 8 (40.0%) | 12 (60.0%) |
| Legal Services & Support | 0 (0.0%) | 0 (0.0%) |
| Education Instruction & Library | 19 (17.1%) | 92 (82.9%) |
| Arts, Media & Entertainment | 0 (0.0%) | 0 (0.0%) |
| Health Diagnosing & Treating | 8 (2.6%) | 297 (97.4%) |
| Health Technologists | 8 (3.6%) | 214 (96.4%) |
| Total (Category) | 311 (34.0%) | 603 (66.0%) |
| Total (Overall) | 886 (42.4%) | 1,203 (57.6%) |
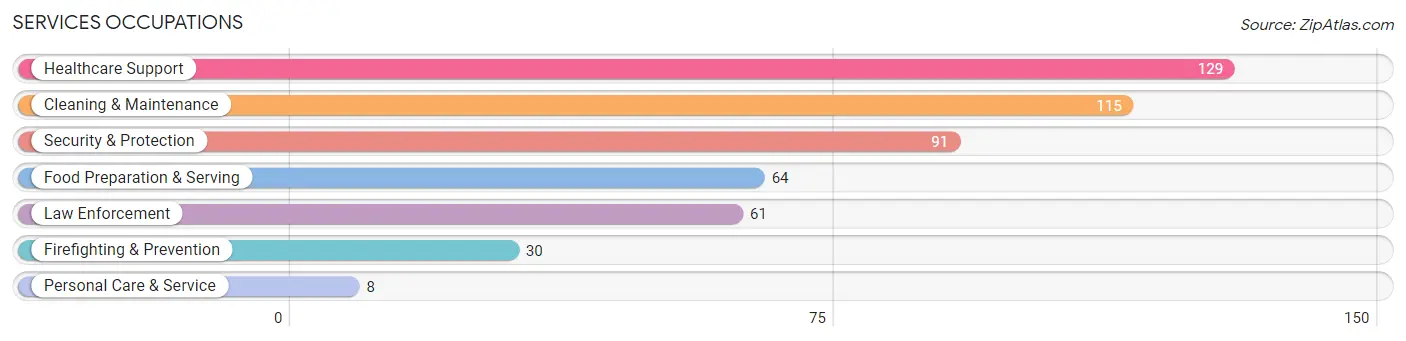
Services Occupations
The most common Services occupations in Larksville borough are Healthcare Support (129 | 6.2%), Cleaning & Maintenance (115 | 5.5%), Security & Protection (91 | 4.4%), Food Preparation & Serving (64 | 3.1%), and Law Enforcement (61 | 2.9%).
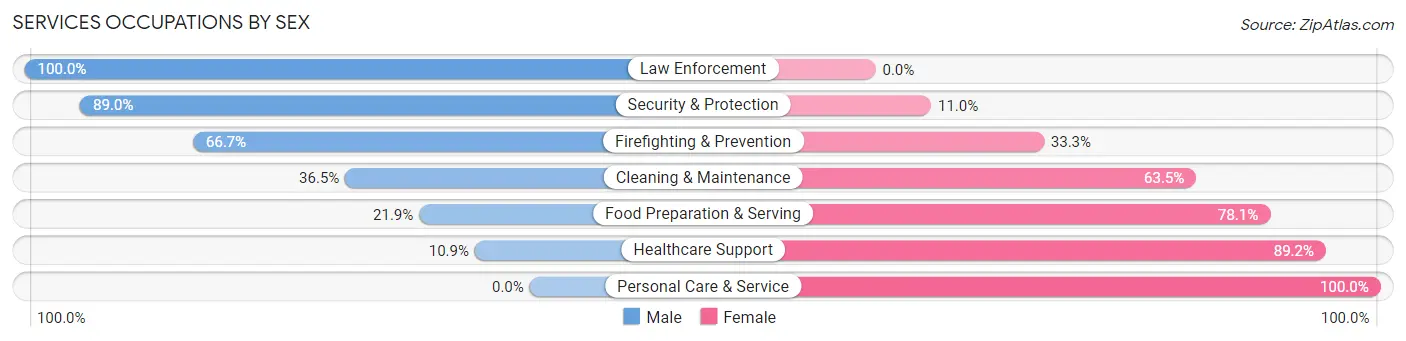
Services Occupations by Sex
Within the Services occupations in Larksville borough, the most male-oriented occupations are Law Enforcement (100.0%), Security & Protection (89.0%), and Firefighting & Prevention (66.7%), while the most female-oriented occupations are Personal Care & Service (100.0%), Healthcare Support (89.1%), and Food Preparation & Serving (78.1%).
| Occupation | Male | Female |
| Healthcare Support | 14 (10.8%) | 115 (89.1%) |
| Security & Protection | 81 (89.0%) | 10 (11.0%) |
| Firefighting & Prevention | 20 (66.7%) | 10 (33.3%) |
| Law Enforcement | 61 (100.0%) | 0 (0.0%) |
| Food Preparation & Serving | 14 (21.9%) | 50 (78.1%) |
| Cleaning & Maintenance | 42 (36.5%) | 73 (63.5%) |
| Personal Care & Service | 0 (0.0%) | 8 (100.0%) |
| Total (Category) | 151 (37.1%) | 256 (62.9%) |
| Total (Overall) | 886 (42.4%) | 1,203 (57.6%) |
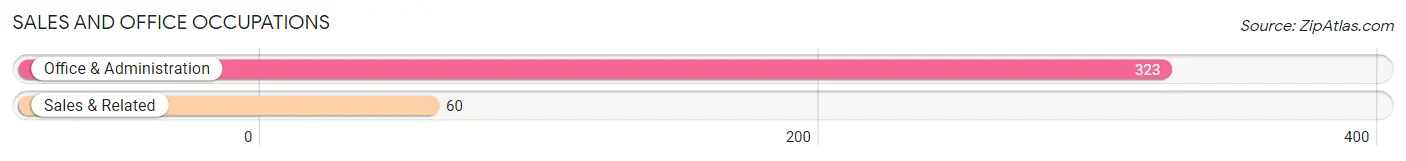
Sales and Office Occupations
The most common Sales and Office occupations in Larksville borough are Office & Administration (323 | 15.5%), and Sales & Related (60 | 2.9%).
Sales and Office Occupations by Sex

| Occupation | Male | Female |
| Sales & Related | 53 (88.3%) | 7 (11.7%) |
| Office & Administration | 28 (8.7%) | 295 (91.3%) |
| Total (Category) | 81 (21.1%) | 302 (78.8%) |
| Total (Overall) | 886 (42.4%) | 1,203 (57.6%) |
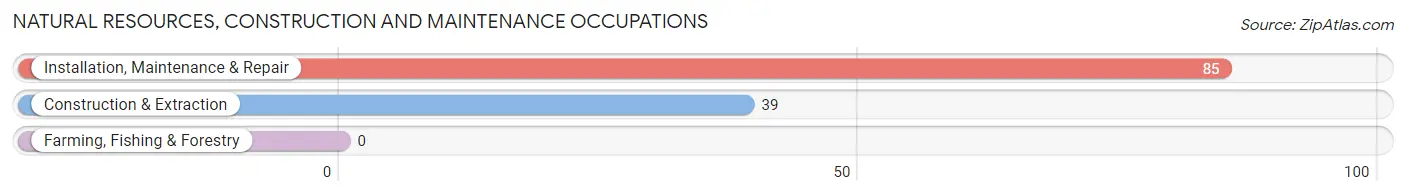
Natural Resources, Construction and Maintenance Occupations
The most common Natural Resources, Construction and Maintenance occupations in Larksville borough are Installation, Maintenance & Repair (85 | 4.1%), and Construction & Extraction (39 | 1.9%).
Natural Resources, Construction and Maintenance Occupations by Sex

| Occupation | Male | Female |
| Farming, Fishing & Forestry | 0 (0.0%) | 0 (0.0%) |
| Construction & Extraction | 39 (100.0%) | 0 (0.0%) |
| Installation, Maintenance & Repair | 85 (100.0%) | 0 (0.0%) |
| Total (Category) | 124 (100.0%) | 0 (0.0%) |
| Total (Overall) | 886 (42.4%) | 1,203 (57.6%) |
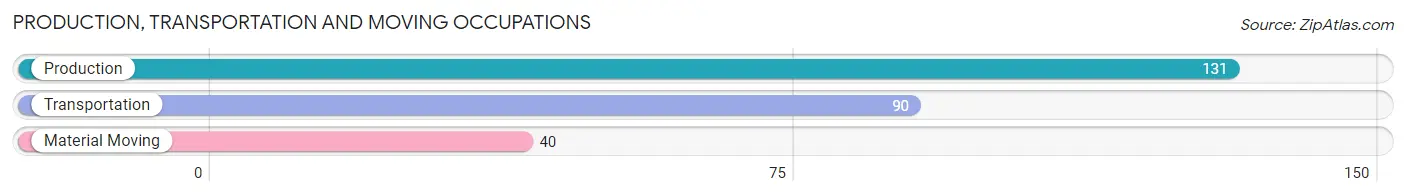
Production, Transportation and Moving Occupations
The most common Production, Transportation and Moving occupations in Larksville borough are Production (131 | 6.3%), Transportation (90 | 4.3%), and Material Moving (40 | 1.9%).
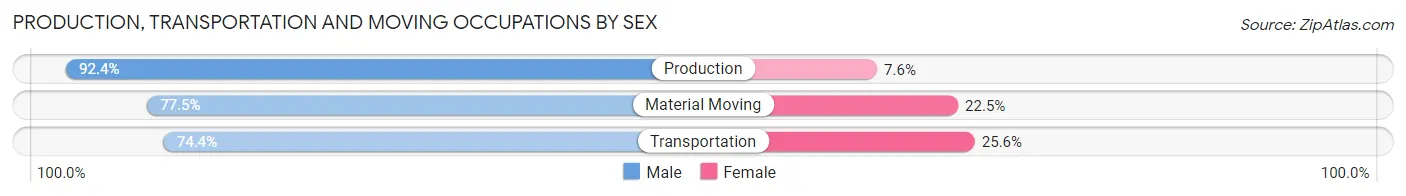
Production, Transportation and Moving Occupations by Sex
| Occupation | Male | Female |
| Production | 121 (92.4%) | 10 (7.6%) |
| Transportation | 67 (74.4%) | 23 (25.6%) |
| Material Moving | 31 (77.5%) | 9 (22.5%) |
| Total (Category) | 219 (83.9%) | 42 (16.1%) |
| Total (Overall) | 886 (42.4%) | 1,203 (57.6%) |
Employment Industries by Sex in Larksville borough
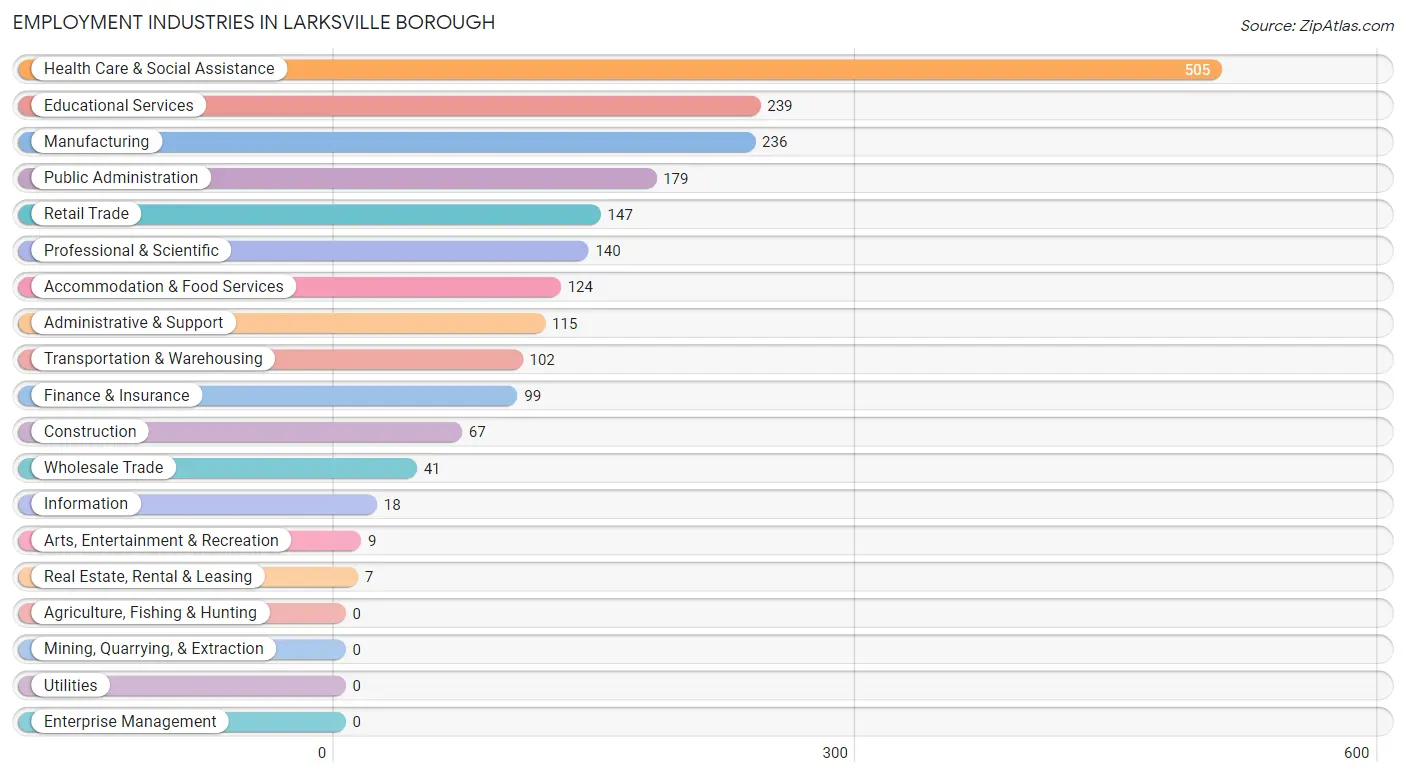
Employment Industries in Larksville borough
The major employment industries in Larksville borough include Health Care & Social Assistance (505 | 24.2%), Educational Services (239 | 11.4%), Manufacturing (236 | 11.3%), Public Administration (179 | 8.6%), and Retail Trade (147 | 7.0%).
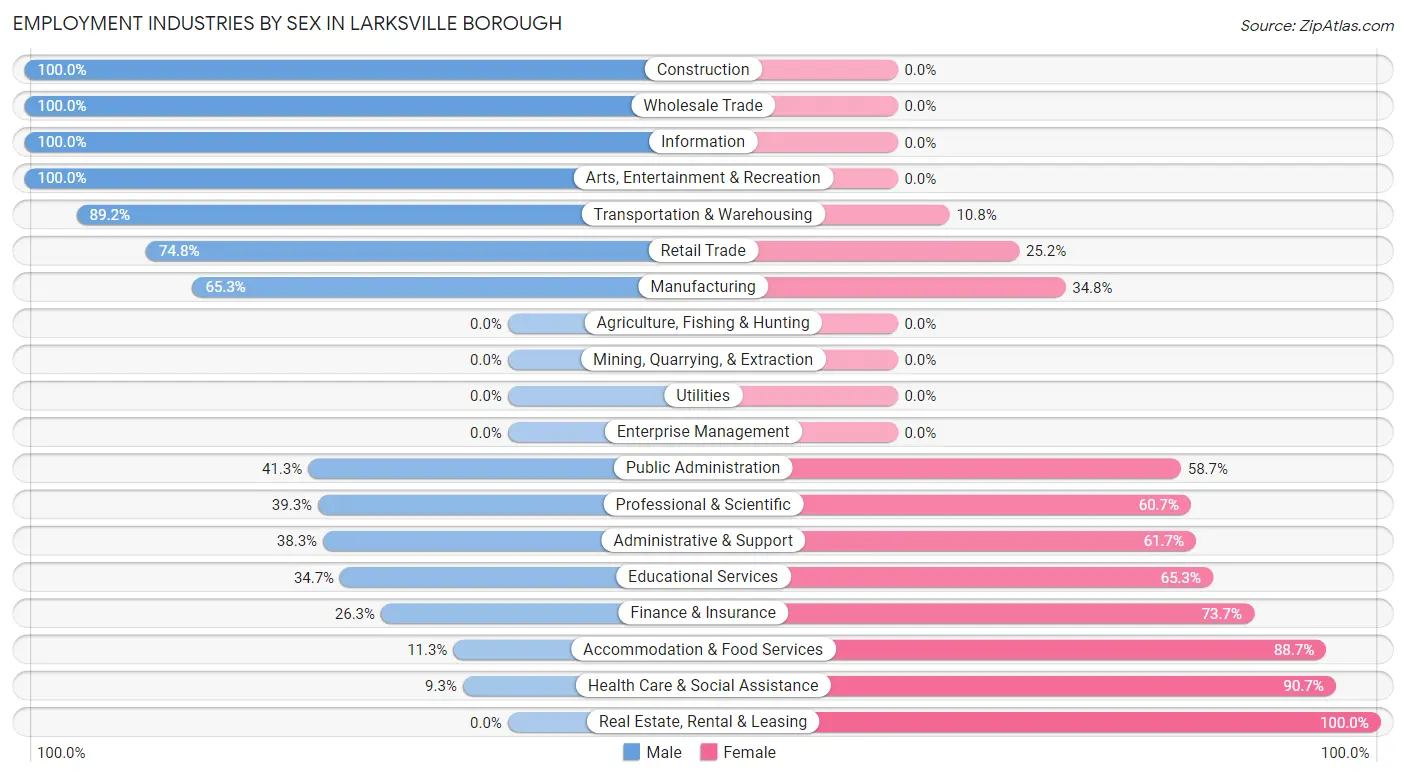
Employment Industries by Sex in Larksville borough
The Larksville borough industries that see more men than women are Construction (100.0%), Wholesale Trade (100.0%), and Information (100.0%), whereas the industries that tend to have a higher number of women are Real Estate, Rental & Leasing (100.0%), Health Care & Social Assistance (90.7%), and Accommodation & Food Services (88.7%).
| Industry | Male | Female |
| Agriculture, Fishing & Hunting | 0 (0.0%) | 0 (0.0%) |
| Mining, Quarrying, & Extraction | 0 (0.0%) | 0 (0.0%) |
| Construction | 67 (100.0%) | 0 (0.0%) |
| Manufacturing | 154 (65.2%) | 82 (34.7%) |
| Wholesale Trade | 41 (100.0%) | 0 (0.0%) |
| Retail Trade | 110 (74.8%) | 37 (25.2%) |
| Transportation & Warehousing | 91 (89.2%) | 11 (10.8%) |
| Utilities | 0 (0.0%) | 0 (0.0%) |
| Information | 18 (100.0%) | 0 (0.0%) |
| Finance & Insurance | 26 (26.3%) | 73 (73.7%) |
| Real Estate, Rental & Leasing | 0 (0.0%) | 7 (100.0%) |
| Professional & Scientific | 55 (39.3%) | 85 (60.7%) |
| Enterprise Management | 0 (0.0%) | 0 (0.0%) |
| Administrative & Support | 44 (38.3%) | 71 (61.7%) |
| Educational Services | 83 (34.7%) | 156 (65.3%) |
| Health Care & Social Assistance | 47 (9.3%) | 458 (90.7%) |
| Arts, Entertainment & Recreation | 9 (100.0%) | 0 (0.0%) |
| Accommodation & Food Services | 14 (11.3%) | 110 (88.7%) |
| Public Administration | 74 (41.3%) | 105 (58.7%) |
| Total | 886 (42.4%) | 1,203 (57.6%) |
Education in Larksville borough
School Enrollment in Larksville borough
The most common levels of schooling among the 521 students in Larksville borough are middle school (117 | 22.5%), high school (110 | 21.1%), and college / undergraduate (101 | 19.4%).
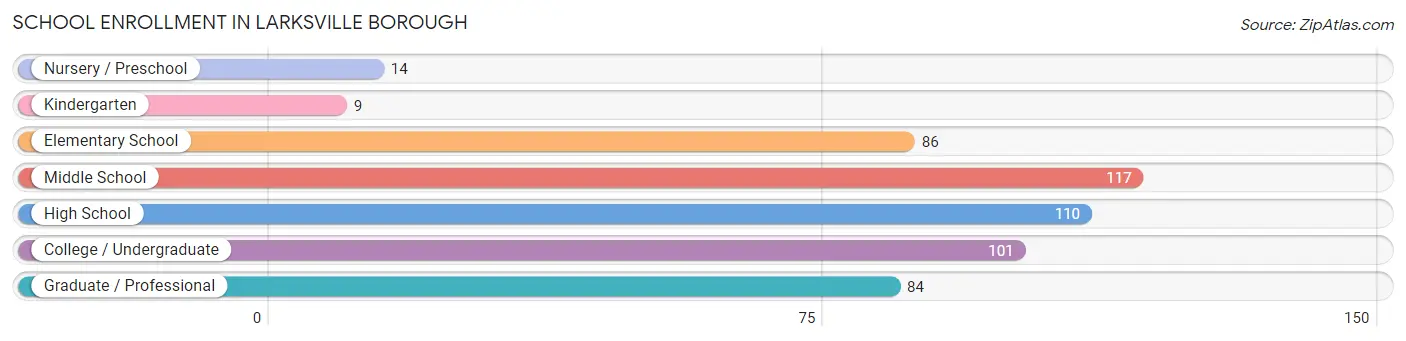
| School Level | # Students | % Students |
| Nursery / Preschool | 14 | 2.7% |
| Kindergarten | 9 | 1.7% |
| Elementary School | 86 | 16.5% |
| Middle School | 117 | 22.5% |
| High School | 110 | 21.1% |
| College / Undergraduate | 101 | 19.4% |
| Graduate / Professional | 84 | 16.1% |
| Total | 521 | 100.0% |
School Enrollment by Age by Funding Source in Larksville borough
Out of a total of 521 students who are enrolled in schools in Larksville borough, 49 (9.4%) attend a private institution, while the remaining 472 (90.6%) are enrolled in public schools. The age group of 15 to 17 year olds has the highest likelihood of being enrolled in private schools, with 20 (22.0% in the age bracket) enrolled. Conversely, the age group of 3 to 4 year olds has the lowest likelihood of being enrolled in a private school, with 11 (100.0% in the age bracket) attending a public institution.
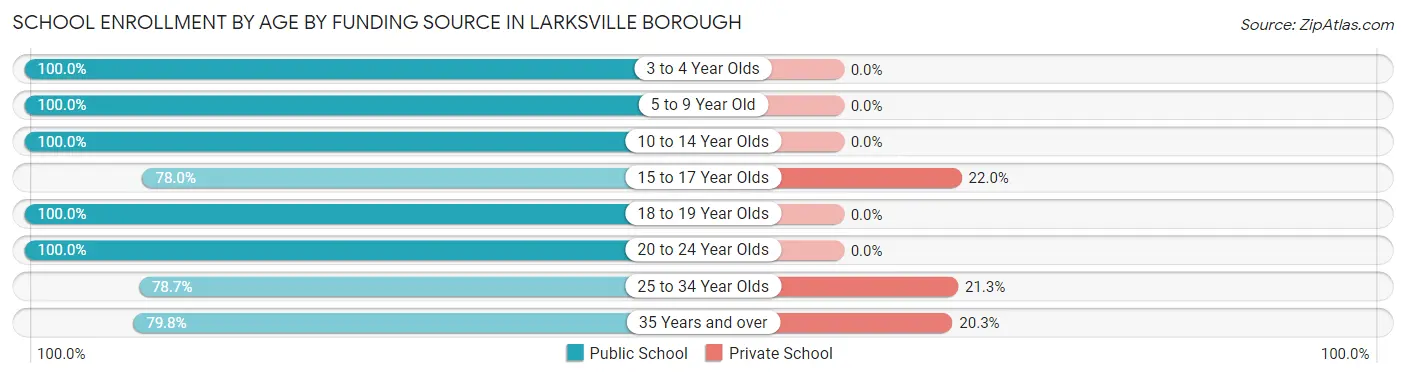
| Age Bracket | Public School | Private School |
| 3 to 4 Year Olds | 11 (100.0%) | 0 (0.0%) |
| 5 to 9 Year Old | 65 (100.0%) | 0 (0.0%) |
| 10 to 14 Year Olds | 157 (100.0%) | 0 (0.0%) |
| 15 to 17 Year Olds | 71 (78.0%) | 20 (22.0%) |
| 18 to 19 Year Olds | 12 (100.0%) | 0 (0.0%) |
| 20 to 24 Year Olds | 45 (100.0%) | 0 (0.0%) |
| 25 to 34 Year Olds | 48 (78.7%) | 13 (21.3%) |
| 35 Years and over | 63 (79.7%) | 16 (20.3%) |
| Total | 472 (90.6%) | 49 (9.4%) |
Educational Attainment by Field of Study in Larksville borough
Education (246 | 26.1%), science & technology (149 | 15.8%), business (137 | 14.6%), physical & health sciences (89 | 9.5%), and psychology (58 | 6.2%) are the most common fields of study among 941 individuals in Larksville borough who have obtained a bachelor's degree or higher.
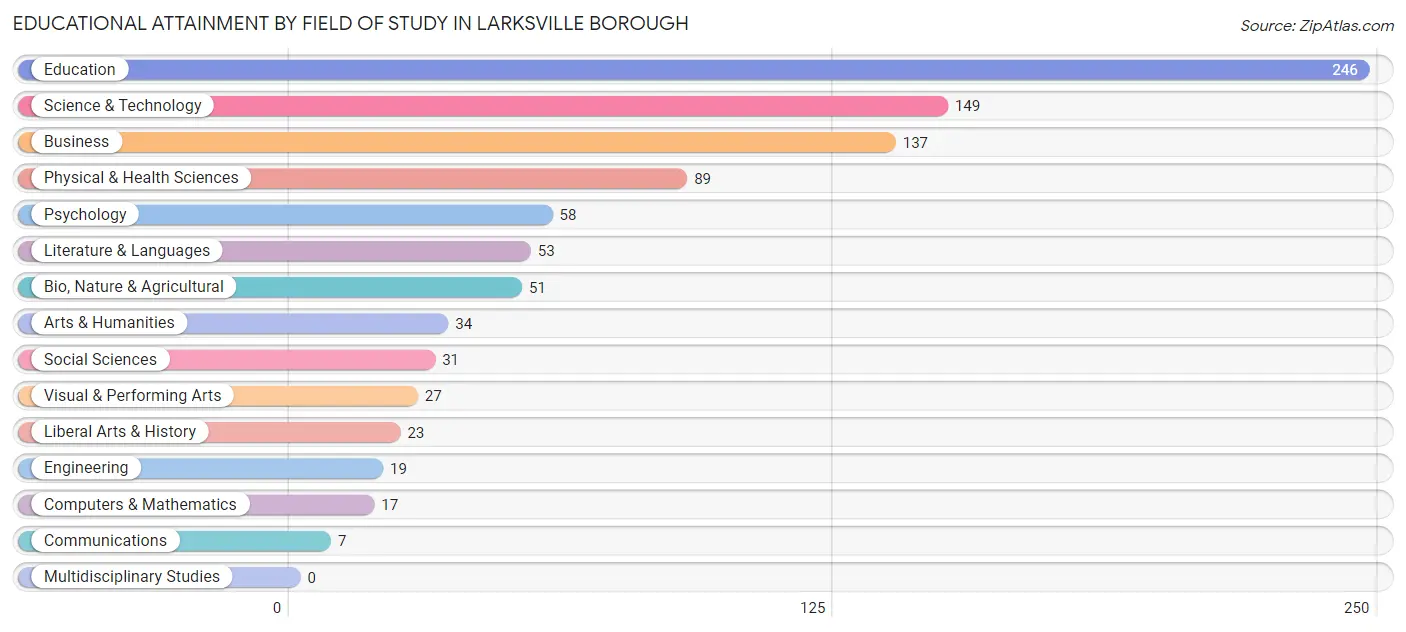
| Field of Study | # Graduates | % Graduates |
| Computers & Mathematics | 17 | 1.8% |
| Bio, Nature & Agricultural | 51 | 5.4% |
| Physical & Health Sciences | 89 | 9.5% |
| Psychology | 58 | 6.2% |
| Social Sciences | 31 | 3.3% |
| Engineering | 19 | 2.0% |
| Multidisciplinary Studies | 0 | 0.0% |
| Science & Technology | 149 | 15.8% |
| Business | 137 | 14.6% |
| Education | 246 | 26.1% |
| Literature & Languages | 53 | 5.6% |
| Liberal Arts & History | 23 | 2.4% |
| Visual & Performing Arts | 27 | 2.9% |
| Communications | 7 | 0.7% |
| Arts & Humanities | 34 | 3.6% |
| Total | 941 | 100.0% |
Transportation & Commute in Larksville borough
Vehicle Availability by Sex in Larksville borough
The most prevalent vehicle ownership categories in Larksville borough are males with 2 vehicles (395, accounting for 44.6%) and females with 2 vehicles (625, making up 33.9%).
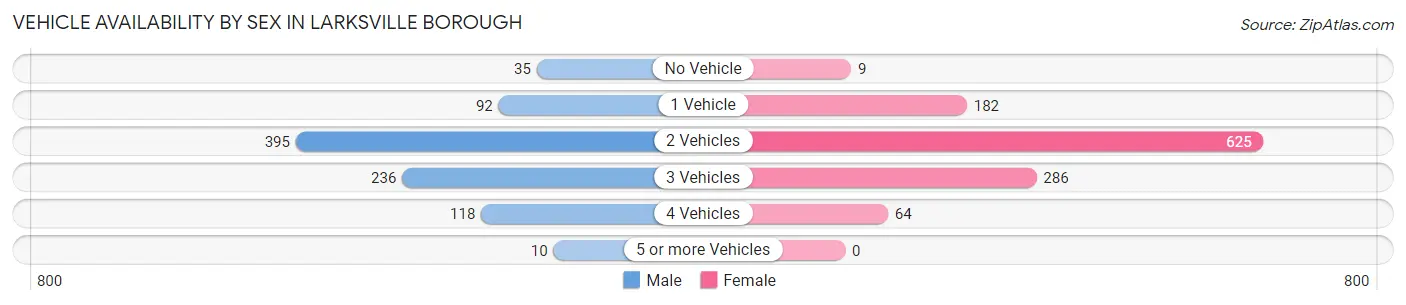
| Vehicles Available | Male | Female |
| No Vehicle | 35 (4.0%) | 9 (0.8%) |
| 1 Vehicle | 92 (10.4%) | 182 (15.6%) |
| 2 Vehicles | 395 (44.6%) | 625 (53.6%) |
| 3 Vehicles | 236 (26.6%) | 286 (24.5%) |
| 4 Vehicles | 118 (13.3%) | 64 (5.5%) |
| 5 or more Vehicles | 10 (1.1%) | 0 (0.0%) |
| Total | 886 (100.0%) | 1,166 (100.0%) |
Commute Time in Larksville borough
The most frequently occuring commute durations in Larksville borough are 15 to 19 minutes (631 commuters, 33.8%), 20 to 24 minutes (413 commuters, 22.1%), and 5 to 9 minutes (168 commuters, 9.0%).
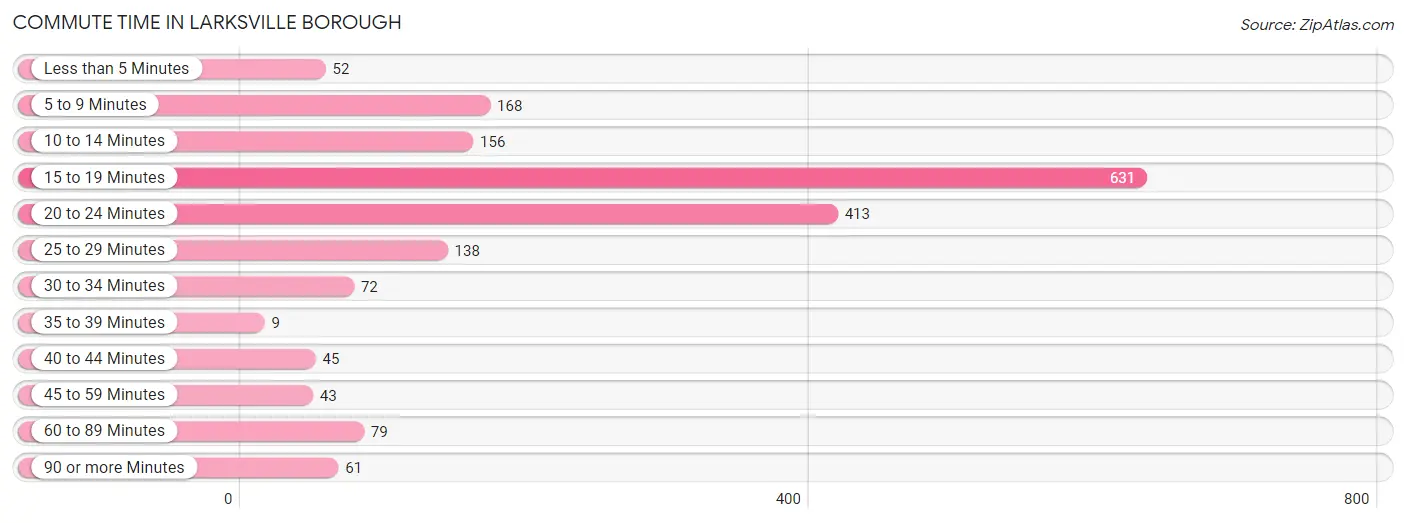
| Commute Time | # Commuters | % Commuters |
| Less than 5 Minutes | 52 | 2.8% |
| 5 to 9 Minutes | 168 | 9.0% |
| 10 to 14 Minutes | 156 | 8.4% |
| 15 to 19 Minutes | 631 | 33.8% |
| 20 to 24 Minutes | 413 | 22.1% |
| 25 to 29 Minutes | 138 | 7.4% |
| 30 to 34 Minutes | 72 | 3.9% |
| 35 to 39 Minutes | 9 | 0.5% |
| 40 to 44 Minutes | 45 | 2.4% |
| 45 to 59 Minutes | 43 | 2.3% |
| 60 to 89 Minutes | 79 | 4.2% |
| 90 or more Minutes | 61 | 3.3% |
Commute Time by Sex in Larksville borough
The most common commute times in Larksville borough are 20 to 24 minutes (203 commuters, 23.7%) for males and 15 to 19 minutes (444 commuters, 43.9%) for females.
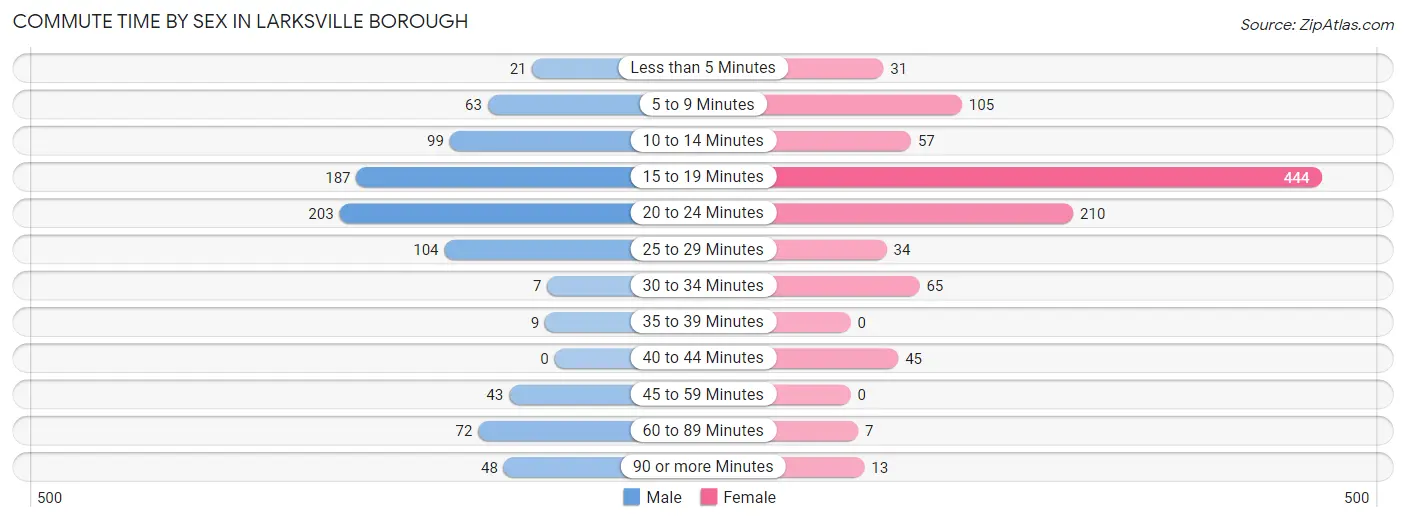
| Commute Time | Male | Female |
| Less than 5 Minutes | 21 (2.5%) | 31 (3.1%) |
| 5 to 9 Minutes | 63 (7.4%) | 105 (10.4%) |
| 10 to 14 Minutes | 99 (11.6%) | 57 (5.6%) |
| 15 to 19 Minutes | 187 (21.8%) | 444 (43.9%) |
| 20 to 24 Minutes | 203 (23.7%) | 210 (20.8%) |
| 25 to 29 Minutes | 104 (12.1%) | 34 (3.4%) |
| 30 to 34 Minutes | 7 (0.8%) | 65 (6.4%) |
| 35 to 39 Minutes | 9 (1.1%) | 0 (0.0%) |
| 40 to 44 Minutes | 0 (0.0%) | 45 (4.4%) |
| 45 to 59 Minutes | 43 (5.0%) | 0 (0.0%) |
| 60 to 89 Minutes | 72 (8.4%) | 7 (0.7%) |
| 90 or more Minutes | 48 (5.6%) | 13 (1.3%) |
Time of Departure to Work by Sex in Larksville borough
The most frequent times of departure to work in Larksville borough are 12:00 PM to 3:59 PM (147, 17.2%) for males and 7:30 AM to 7:59 AM (278, 27.5%) for females.
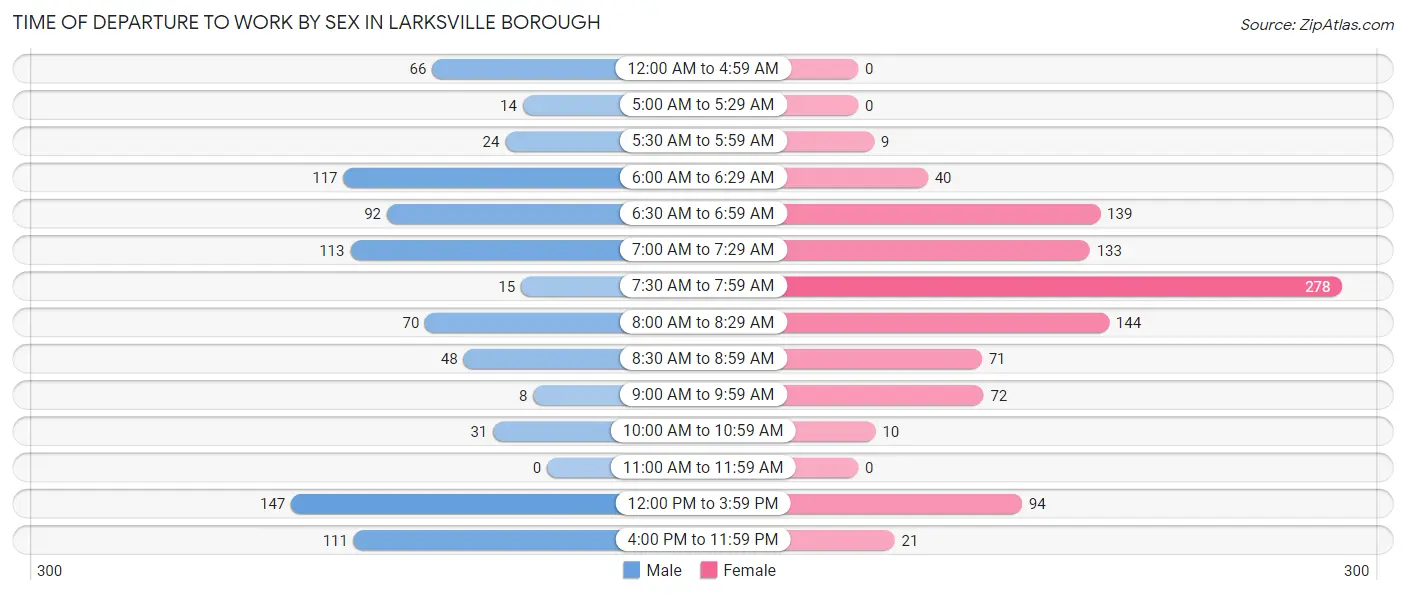
| Time of Departure | Male | Female |
| 12:00 AM to 4:59 AM | 66 (7.7%) | 0 (0.0%) |
| 5:00 AM to 5:29 AM | 14 (1.6%) | 0 (0.0%) |
| 5:30 AM to 5:59 AM | 24 (2.8%) | 9 (0.9%) |
| 6:00 AM to 6:29 AM | 117 (13.7%) | 40 (4.0%) |
| 6:30 AM to 6:59 AM | 92 (10.7%) | 139 (13.8%) |
| 7:00 AM to 7:29 AM | 113 (13.2%) | 133 (13.2%) |
| 7:30 AM to 7:59 AM | 15 (1.8%) | 278 (27.5%) |
| 8:00 AM to 8:29 AM | 70 (8.2%) | 144 (14.2%) |
| 8:30 AM to 8:59 AM | 48 (5.6%) | 71 (7.0%) |
| 9:00 AM to 9:59 AM | 8 (0.9%) | 72 (7.1%) |
| 10:00 AM to 10:59 AM | 31 (3.6%) | 10 (1.0%) |
| 11:00 AM to 11:59 AM | 0 (0.0%) | 0 (0.0%) |
| 12:00 PM to 3:59 PM | 147 (17.2%) | 94 (9.3%) |
| 4:00 PM to 11:59 PM | 111 (13.0%) | 21 (2.1%) |
| Total | 856 (100.0%) | 1,011 (100.0%) |
Housing Occupancy in Larksville borough
Occupancy by Ownership in Larksville borough
Of the total 1,751 dwellings in Larksville borough, owner-occupied units account for 1,362 (77.8%), while renter-occupied units make up 389 (22.2%).
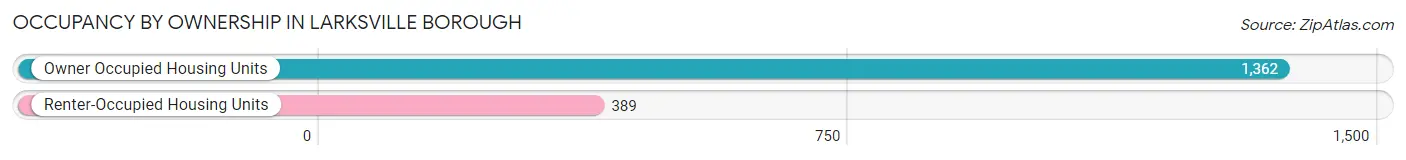
| Occupancy | # Housing Units | % Housing Units |
| Owner Occupied Housing Units | 1,362 | 77.8% |
| Renter-Occupied Housing Units | 389 | 22.2% |
| Total Occupied Housing Units | 1,751 | 100.0% |
Occupancy by Household Size in Larksville borough
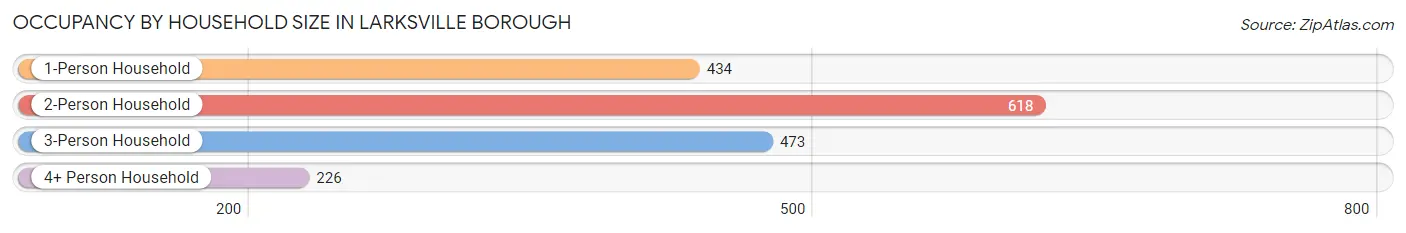
| Household Size | # Housing Units | % Housing Units |
| 1-Person Household | 434 | 24.8% |
| 2-Person Household | 618 | 35.3% |
| 3-Person Household | 473 | 27.0% |
| 4+ Person Household | 226 | 12.9% |
| Total Housing Units | 1,751 | 100.0% |
Occupancy by Ownership by Household Size in Larksville borough
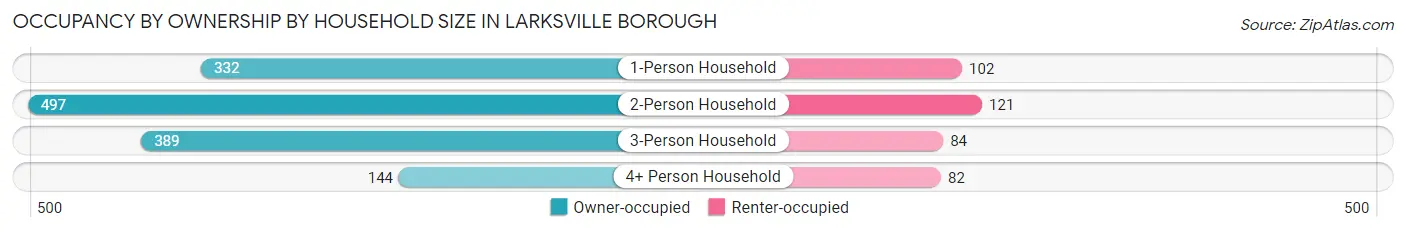
| Household Size | Owner-occupied | Renter-occupied |
| 1-Person Household | 332 (76.5%) | 102 (23.5%) |
| 2-Person Household | 497 (80.4%) | 121 (19.6%) |
| 3-Person Household | 389 (82.2%) | 84 (17.8%) |
| 4+ Person Household | 144 (63.7%) | 82 (36.3%) |
| Total Housing Units | 1,362 (77.8%) | 389 (22.2%) |
Occupancy by Educational Attainment in Larksville borough
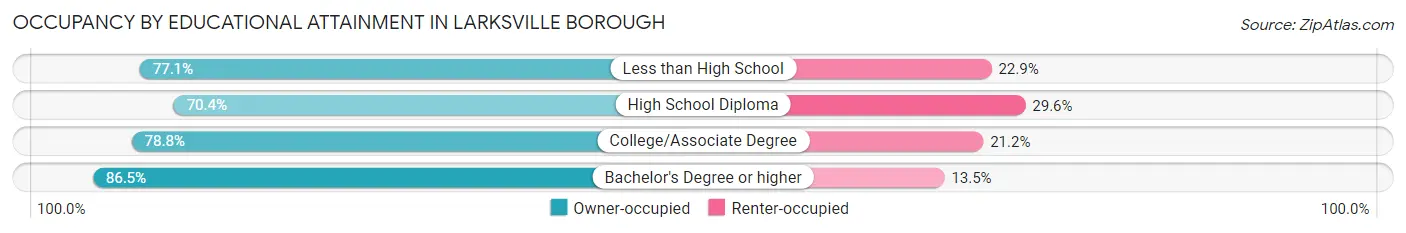
| Household Size | Owner-occupied | Renter-occupied |
| Less than High School | 81 (77.1%) | 24 (22.9%) |
| High School Diploma | 481 (70.4%) | 202 (29.6%) |
| College/Associate Degree | 334 (78.8%) | 90 (21.2%) |
| Bachelor's Degree or higher | 466 (86.5%) | 73 (13.5%) |
Occupancy by Age of Householder in Larksville borough
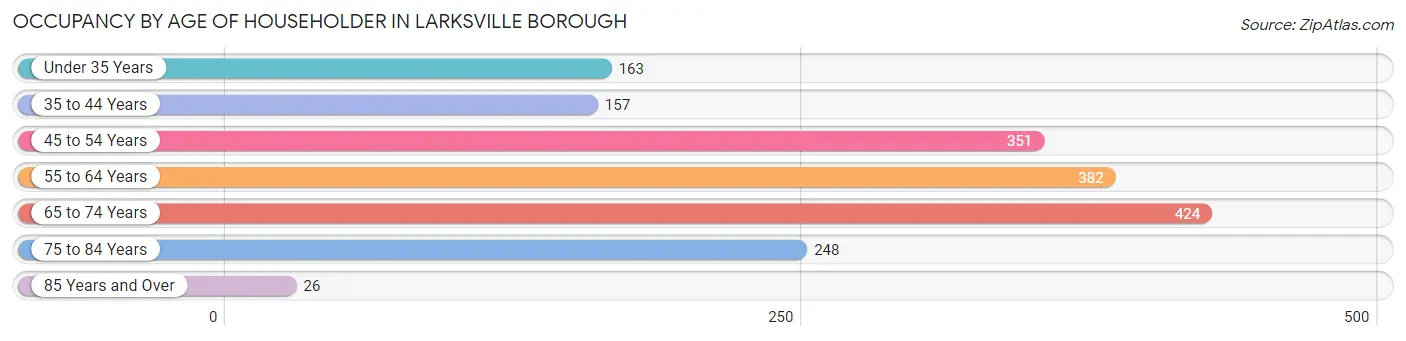
| Age Bracket | # Households | % Households |
| Under 35 Years | 163 | 9.3% |
| 35 to 44 Years | 157 | 9.0% |
| 45 to 54 Years | 351 | 20.1% |
| 55 to 64 Years | 382 | 21.8% |
| 65 to 74 Years | 424 | 24.2% |
| 75 to 84 Years | 248 | 14.2% |
| 85 Years and Over | 26 | 1.5% |
| Total | 1,751 | 100.0% |
Housing Finances in Larksville borough
Median Income by Occupancy in Larksville borough
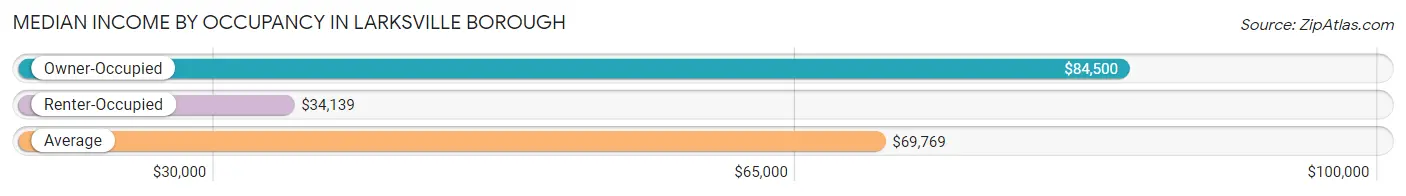
| Occupancy Type | # Households | Median Income |
| Owner-Occupied | 1,362 (77.8%) | $84,500 |
| Renter-Occupied | 389 (22.2%) | $34,139 |
| Average | 1,751 (100.0%) | $69,769 |
Occupancy by Householder Income Bracket in Larksville borough
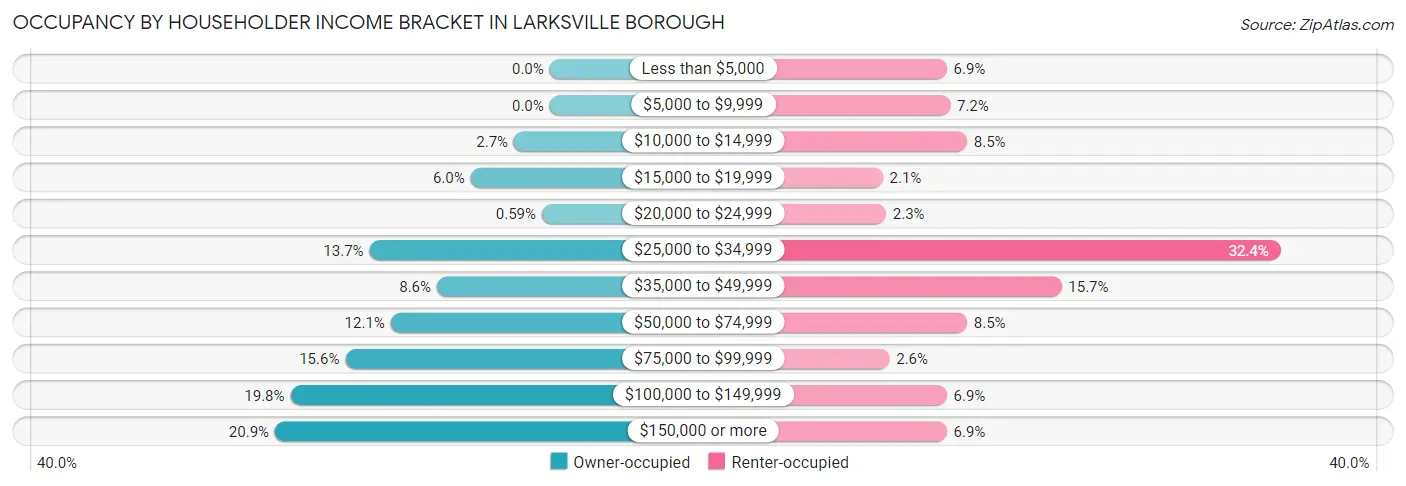
| Income Bracket | Owner-occupied | Renter-occupied |
| Less than $5,000 | 0 (0.0%) | 27 (6.9%) |
| $5,000 to $9,999 | 0 (0.0%) | 28 (7.2%) |
| $10,000 to $14,999 | 37 (2.7%) | 33 (8.5%) |
| $15,000 to $19,999 | 82 (6.0%) | 8 (2.1%) |
| $20,000 to $24,999 | 8 (0.6%) | 9 (2.3%) |
| $25,000 to $34,999 | 187 (13.7%) | 126 (32.4%) |
| $35,000 to $49,999 | 117 (8.6%) | 61 (15.7%) |
| $50,000 to $74,999 | 165 (12.1%) | 33 (8.5%) |
| $75,000 to $99,999 | 212 (15.6%) | 10 (2.6%) |
| $100,000 to $149,999 | 269 (19.8%) | 27 (6.9%) |
| $150,000 or more | 285 (20.9%) | 27 (6.9%) |
| Total | 1,362 (100.0%) | 389 (100.0%) |
Monthly Housing Cost Tiers in Larksville borough
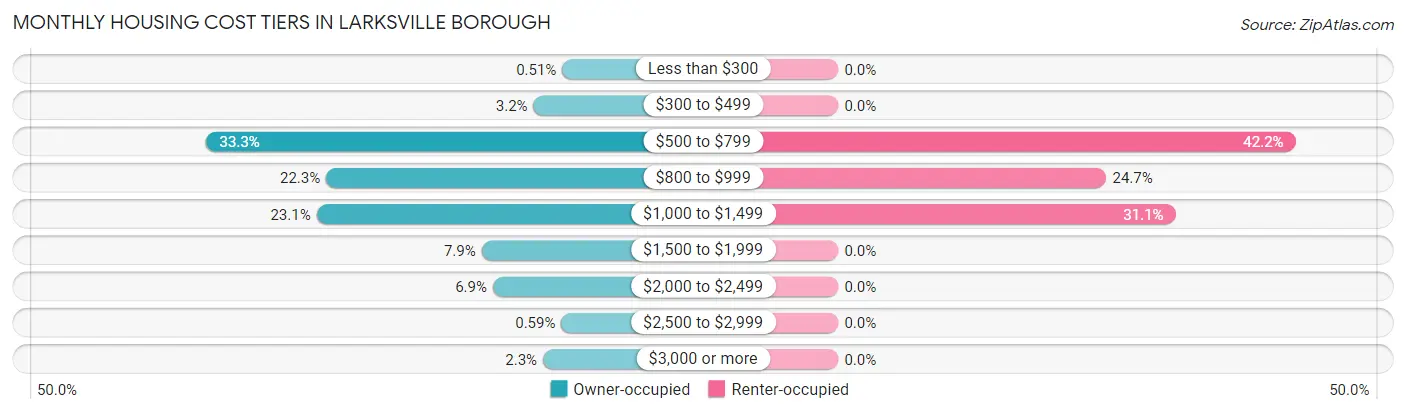
| Monthly Cost | Owner-occupied | Renter-occupied |
| Less than $300 | 7 (0.5%) | 0 (0.0%) |
| $300 to $499 | 43 (3.2%) | 0 (0.0%) |
| $500 to $799 | 453 (33.3%) | 164 (42.2%) |
| $800 to $999 | 303 (22.3%) | 96 (24.7%) |
| $1,000 to $1,499 | 315 (23.1%) | 121 (31.1%) |
| $1,500 to $1,999 | 108 (7.9%) | 0 (0.0%) |
| $2,000 to $2,499 | 94 (6.9%) | 0 (0.0%) |
| $2,500 to $2,999 | 8 (0.6%) | 0 (0.0%) |
| $3,000 or more | 31 (2.3%) | 0 (0.0%) |
| Total | 1,362 (100.0%) | 389 (100.0%) |
Physical Housing Characteristics in Larksville borough
Housing Structures in Larksville borough
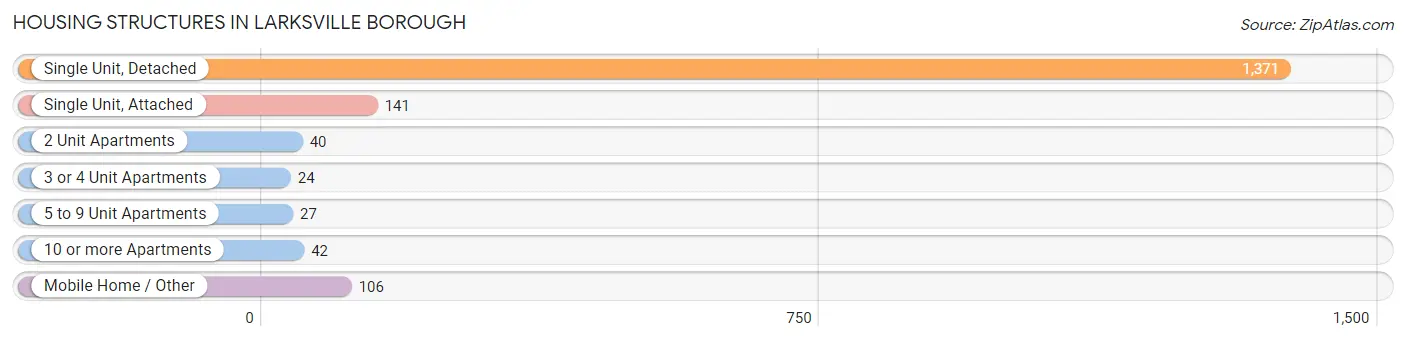
| Structure Type | # Housing Units | % Housing Units |
| Single Unit, Detached | 1,371 | 78.3% |
| Single Unit, Attached | 141 | 8.1% |
| 2 Unit Apartments | 40 | 2.3% |
| 3 or 4 Unit Apartments | 24 | 1.4% |
| 5 to 9 Unit Apartments | 27 | 1.5% |
| 10 or more Apartments | 42 | 2.4% |
| Mobile Home / Other | 106 | 6.0% |
| Total | 1,751 | 100.0% |
Housing Structures by Occupancy in Larksville borough
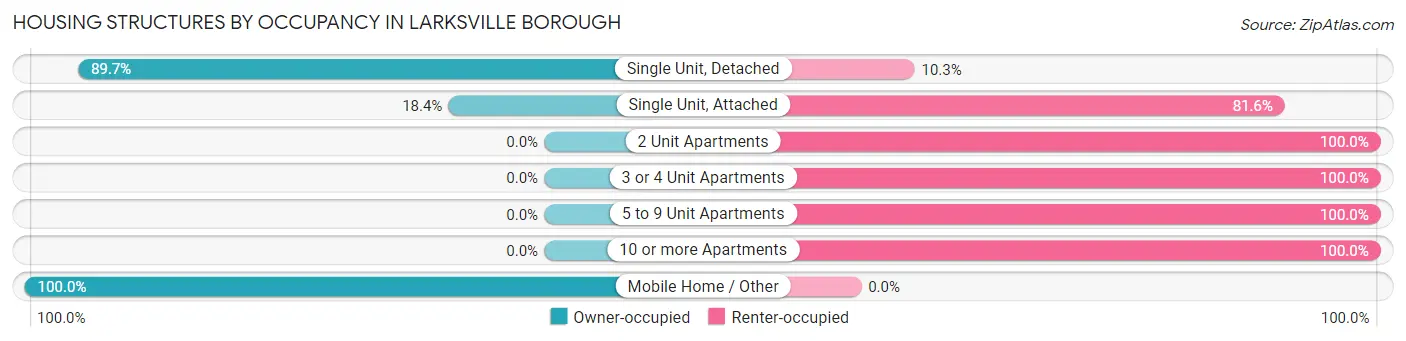
| Structure Type | Owner-occupied | Renter-occupied |
| Single Unit, Detached | 1,230 (89.7%) | 141 (10.3%) |
| Single Unit, Attached | 26 (18.4%) | 115 (81.6%) |
| 2 Unit Apartments | 0 (0.0%) | 40 (100.0%) |
| 3 or 4 Unit Apartments | 0 (0.0%) | 24 (100.0%) |
| 5 to 9 Unit Apartments | 0 (0.0%) | 27 (100.0%) |
| 10 or more Apartments | 0 (0.0%) | 42 (100.0%) |
| Mobile Home / Other | 106 (100.0%) | 0 (0.0%) |
| Total | 1,362 (77.8%) | 389 (22.2%) |
Housing Structures by Number of Rooms in Larksville borough
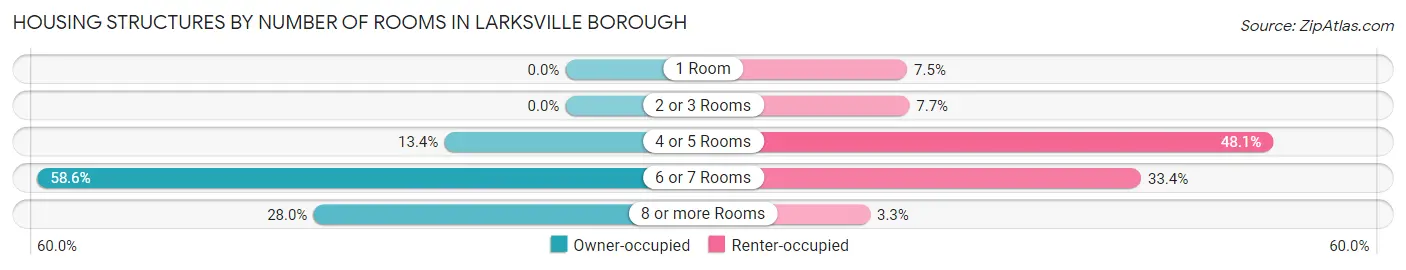
| Number of Rooms | Owner-occupied | Renter-occupied |
| 1 Room | 0 (0.0%) | 29 (7.5%) |
| 2 or 3 Rooms | 0 (0.0%) | 30 (7.7%) |
| 4 or 5 Rooms | 183 (13.4%) | 187 (48.1%) |
| 6 or 7 Rooms | 798 (58.6%) | 130 (33.4%) |
| 8 or more Rooms | 381 (28.0%) | 13 (3.3%) |
| Total | 1,362 (100.0%) | 389 (100.0%) |
Housing Structure by Heating Type in Larksville borough
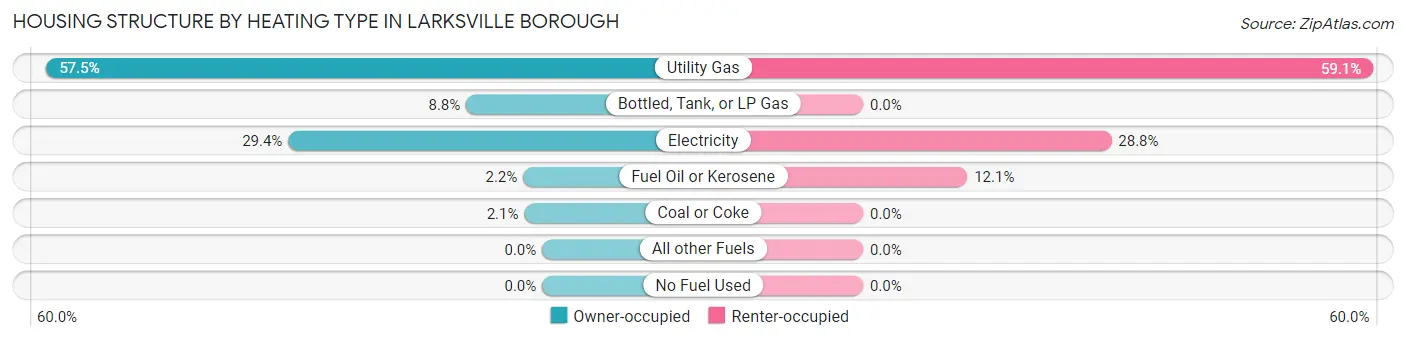
| Heating Type | Owner-occupied | Renter-occupied |
| Utility Gas | 783 (57.5%) | 230 (59.1%) |
| Bottled, Tank, or LP Gas | 120 (8.8%) | 0 (0.0%) |
| Electricity | 401 (29.4%) | 112 (28.8%) |
| Fuel Oil or Kerosene | 30 (2.2%) | 47 (12.1%) |
| Coal or Coke | 28 (2.1%) | 0 (0.0%) |
| All other Fuels | 0 (0.0%) | 0 (0.0%) |
| No Fuel Used | 0 (0.0%) | 0 (0.0%) |
| Total | 1,362 (100.0%) | 389 (100.0%) |
Household Vehicle Usage in Larksville borough
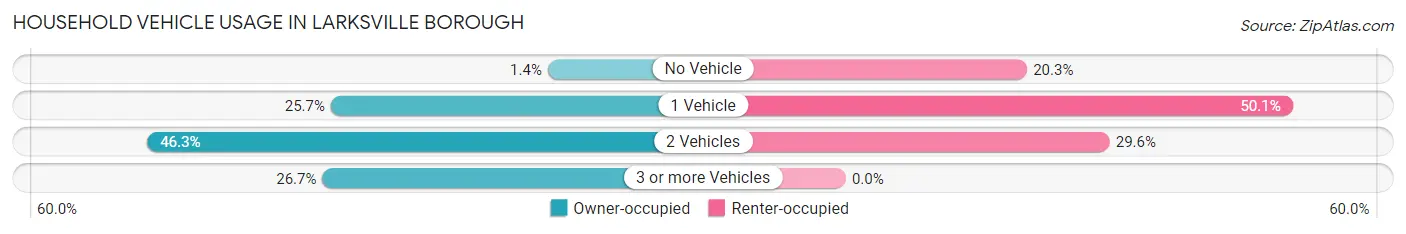
| Vehicles per Household | Owner-occupied | Renter-occupied |
| No Vehicle | 19 (1.4%) | 79 (20.3%) |
| 1 Vehicle | 350 (25.7%) | 195 (50.1%) |
| 2 Vehicles | 630 (46.3%) | 115 (29.6%) |
| 3 or more Vehicles | 363 (26.7%) | 0 (0.0%) |
| Total | 1,362 (100.0%) | 389 (100.0%) |
Real Estate & Mortgages in Larksville borough
Real Estate and Mortgage Overview in Larksville borough
| Characteristic | Without Mortgage | With Mortgage |
| Housing Units | 595 | 767 |
| Median Property Value | $138,100 | $151,200 |
| Median Household Income | $61,313 | $176 |
| Monthly Housing Costs | $666 | $31 |
| Real Estate Taxes | $2,846 | $0 |
Property Value by Mortgage Status in Larksville borough
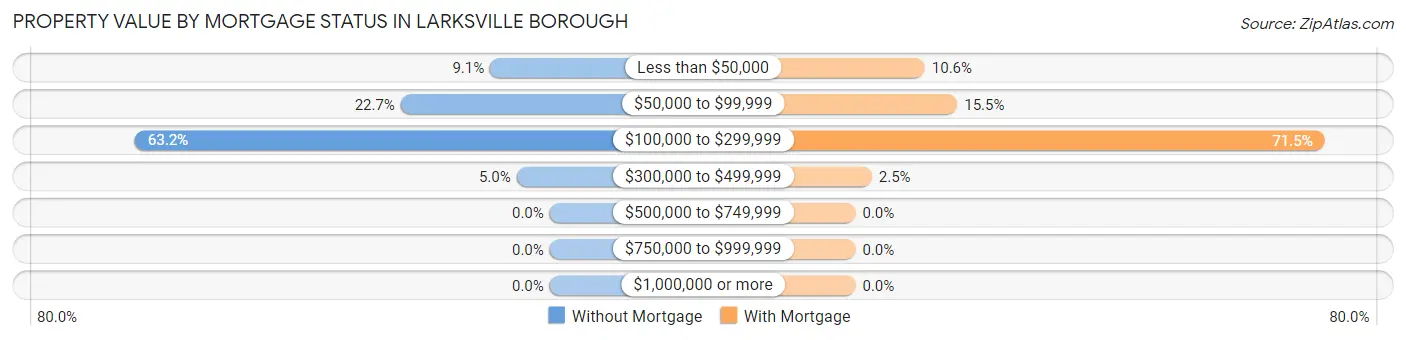
| Property Value | Without Mortgage | With Mortgage |
| Less than $50,000 | 54 (9.1%) | 81 (10.6%) |
| $50,000 to $99,999 | 135 (22.7%) | 119 (15.5%) |
| $100,000 to $299,999 | 376 (63.2%) | 548 (71.5%) |
| $300,000 to $499,999 | 30 (5.0%) | 19 (2.5%) |
| $500,000 to $749,999 | 0 (0.0%) | 0 (0.0%) |
| $750,000 to $999,999 | 0 (0.0%) | 0 (0.0%) |
| $1,000,000 or more | 0 (0.0%) | 0 (0.0%) |
| Total | 595 (100.0%) | 767 (100.0%) |
Household Income by Mortgage Status in Larksville borough
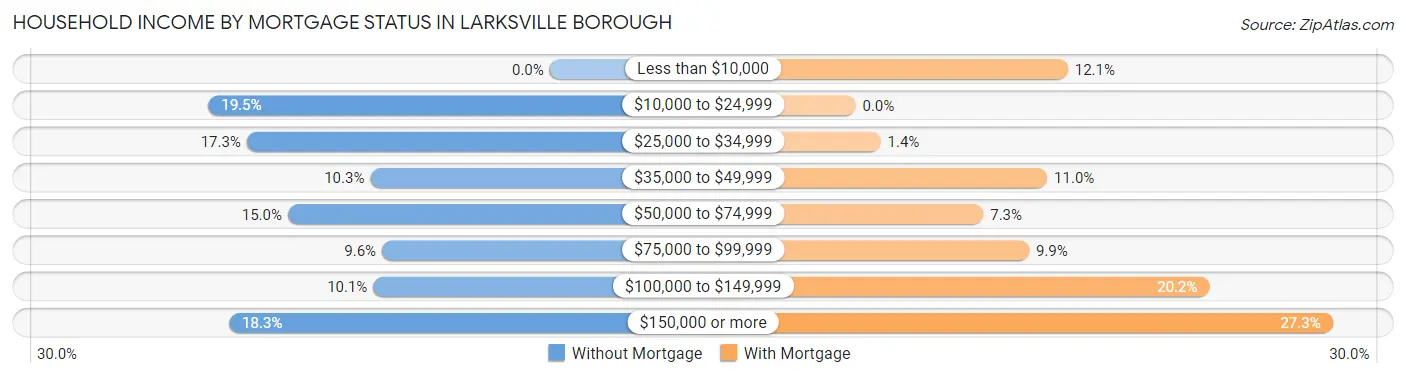
| Household Income | Without Mortgage | With Mortgage |
| Less than $10,000 | 0 (0.0%) | 93 (12.1%) |
| $10,000 to $24,999 | 116 (19.5%) | 0 (0.0%) |
| $25,000 to $34,999 | 103 (17.3%) | 11 (1.4%) |
| $35,000 to $49,999 | 61 (10.2%) | 84 (11.0%) |
| $50,000 to $74,999 | 89 (15.0%) | 56 (7.3%) |
| $75,000 to $99,999 | 57 (9.6%) | 76 (9.9%) |
| $100,000 to $149,999 | 60 (10.1%) | 155 (20.2%) |
| $150,000 or more | 109 (18.3%) | 209 (27.3%) |
| Total | 595 (100.0%) | 767 (100.0%) |
Property Value to Household Income Ratio in Larksville borough
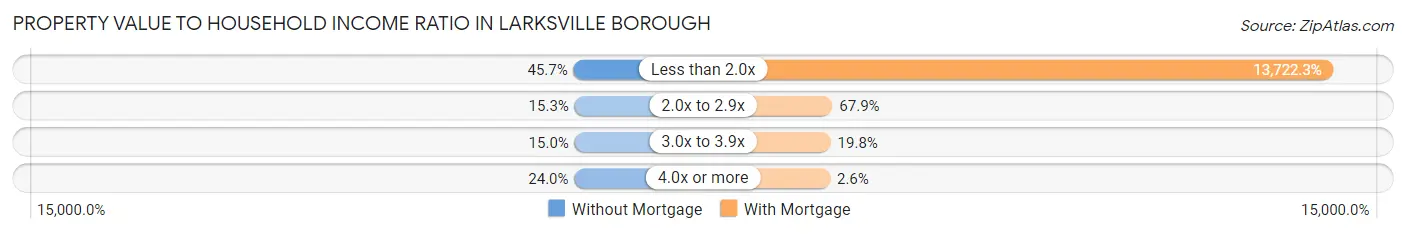
| Value-to-Income Ratio | Without Mortgage | With Mortgage |
| Less than 2.0x | 272 (45.7%) | 105,250 (13,722.3%) |
| 2.0x to 2.9x | 91 (15.3%) | 521 (67.9%) |
| 3.0x to 3.9x | 89 (15.0%) | 152 (19.8%) |
| 4.0x or more | 143 (24.0%) | 20 (2.6%) |
| Total | 595 (100.0%) | 767 (100.0%) |
Real Estate Taxes by Mortgage Status in Larksville borough
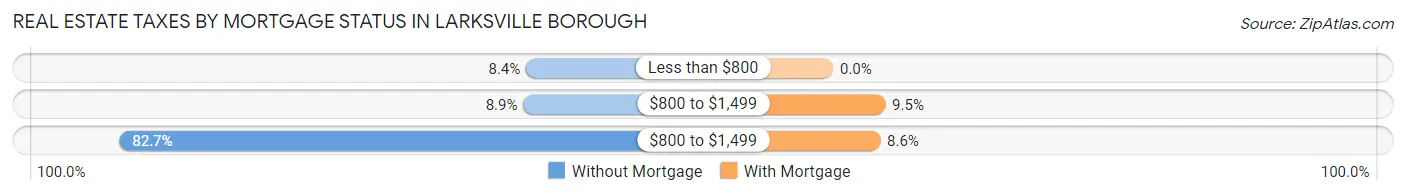
| Property Taxes | Without Mortgage | With Mortgage |
| Less than $800 | 50 (8.4%) | 0 (0.0%) |
| $800 to $1,499 | 53 (8.9%) | 73 (9.5%) |
| $800 to $1,499 | 492 (82.7%) | 66 (8.6%) |
| Total | 595 (100.0%) | 767 (100.0%) |
Health & Disability in Larksville borough
Health Insurance Coverage by Age in Larksville borough
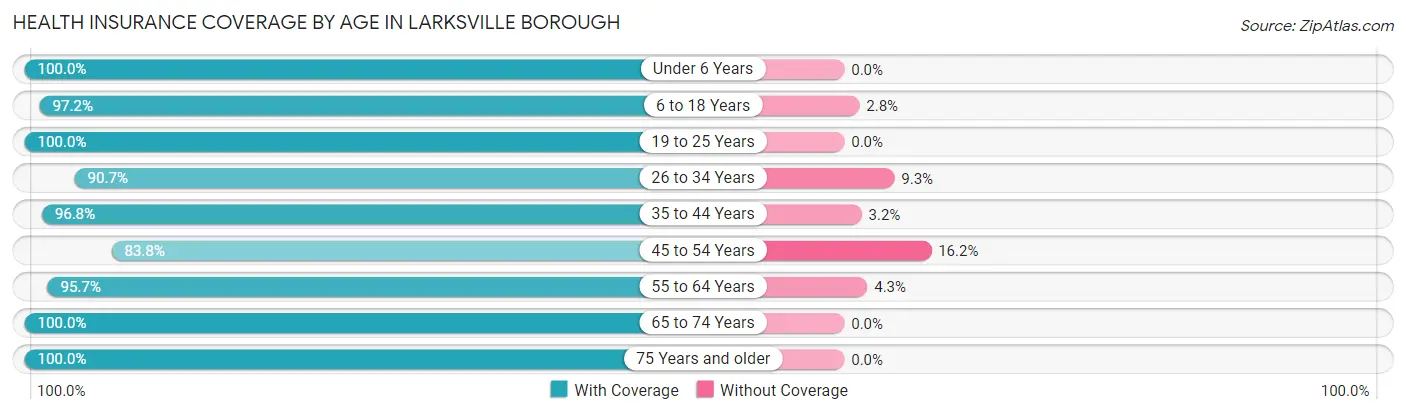
| Age Bracket | With Coverage | Without Coverage |
| Under 6 Years | 313 (100.0%) | 0 (0.0%) |
| 6 to 18 Years | 346 (97.2%) | 10 (2.8%) |
| 19 to 25 Years | 320 (100.0%) | 0 (0.0%) |
| 26 to 34 Years | 330 (90.7%) | 34 (9.3%) |
| 35 to 44 Years | 389 (96.8%) | 13 (3.2%) |
| 45 to 54 Years | 553 (83.8%) | 107 (16.2%) |
| 55 to 64 Years | 804 (95.7%) | 36 (4.3%) |
| 65 to 74 Years | 570 (100.0%) | 0 (0.0%) |
| 75 Years and older | 415 (100.0%) | 0 (0.0%) |
| Total | 4,040 (95.3%) | 200 (4.7%) |
Health Insurance Coverage by Citizenship Status in Larksville borough
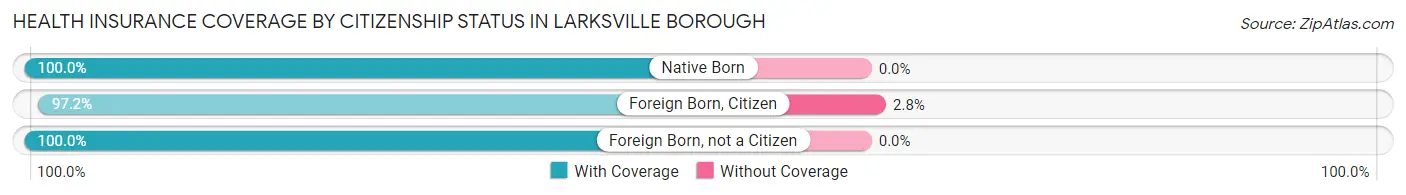
| Citizenship Status | With Coverage | Without Coverage |
| Native Born | 313 (100.0%) | 0 (0.0%) |
| Foreign Born, Citizen | 346 (97.2%) | 10 (2.8%) |
| Foreign Born, not a Citizen | 320 (100.0%) | 0 (0.0%) |
Health Insurance Coverage by Household Income in Larksville borough
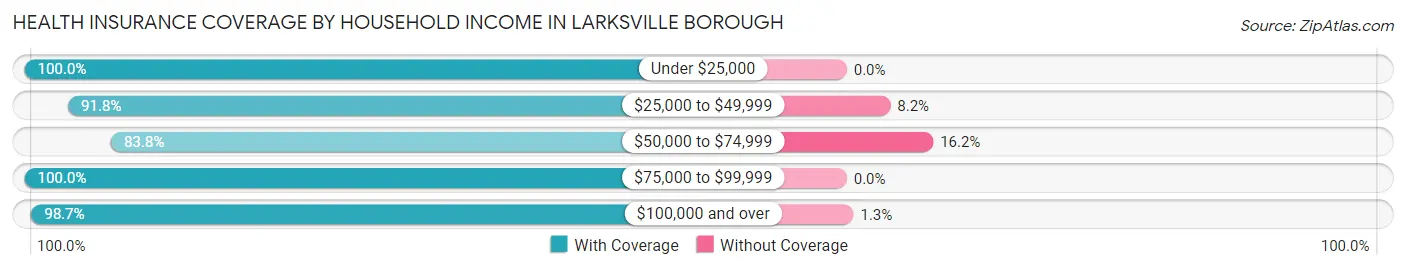
| Household Income | With Coverage | Without Coverage |
| Under $25,000 | 313 (100.0%) | 0 (0.0%) |
| $25,000 to $49,999 | 1,091 (91.8%) | 97 (8.2%) |
| $50,000 to $74,999 | 414 (83.8%) | 80 (16.2%) |
| $75,000 to $99,999 | 423 (100.0%) | 0 (0.0%) |
| $100,000 and over | 1,798 (98.7%) | 23 (1.3%) |
Public vs Private Health Insurance Coverage by Age in Larksville borough
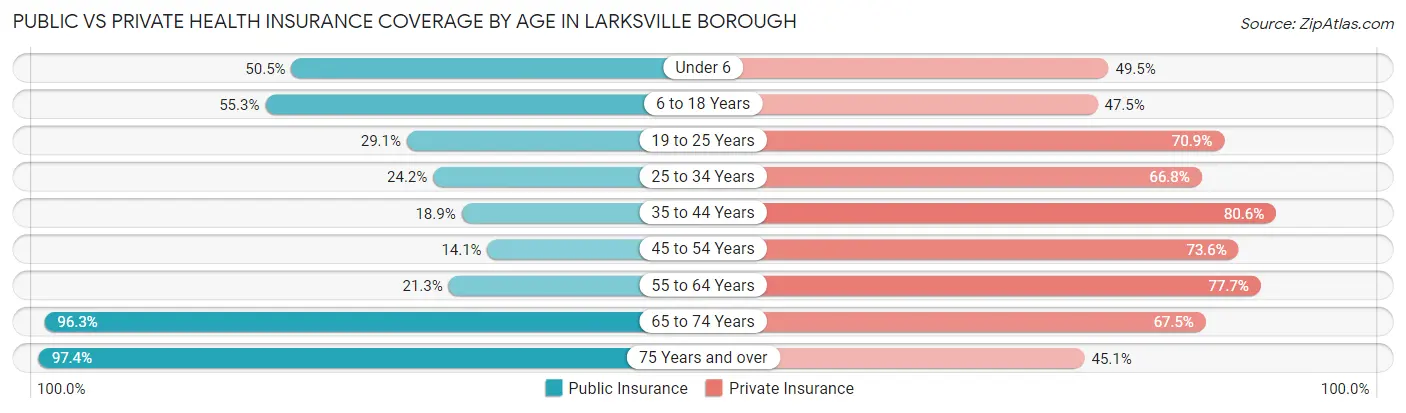
| Age Bracket | Public Insurance | Private Insurance |
| Under 6 | 158 (50.5%) | 155 (49.5%) |
| 6 to 18 Years | 197 (55.3%) | 169 (47.5%) |
| 19 to 25 Years | 93 (29.1%) | 227 (70.9%) |
| 25 to 34 Years | 88 (24.2%) | 243 (66.8%) |
| 35 to 44 Years | 76 (18.9%) | 324 (80.6%) |
| 45 to 54 Years | 93 (14.1%) | 486 (73.6%) |
| 55 to 64 Years | 179 (21.3%) | 653 (77.7%) |
| 65 to 74 Years | 549 (96.3%) | 385 (67.5%) |
| 75 Years and over | 404 (97.4%) | 187 (45.1%) |
| Total | 1,837 (43.3%) | 2,829 (66.7%) |
Disability Status by Sex by Age in Larksville borough
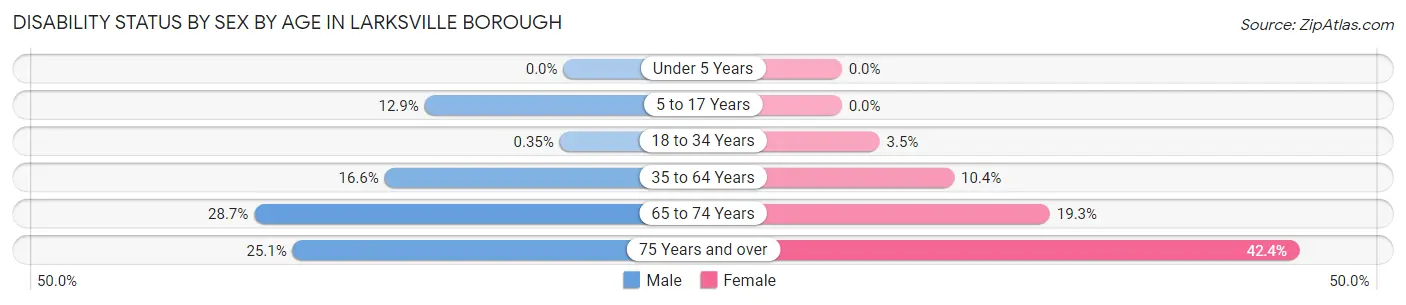
| Age Bracket | Male | Female |
| Under 5 Years | 0 (0.0%) | 0 (0.0%) |
| 5 to 17 Years | 21 (12.9%) | 0 (0.0%) |
| 18 to 34 Years | 1 (0.4%) | 15 (3.5%) |
| 35 to 64 Years | 142 (16.6%) | 109 (10.4%) |
| 65 to 74 Years | 64 (28.7%) | 67 (19.3%) |
| 75 Years and over | 48 (25.1%) | 95 (42.4%) |
Disability Class by Sex by Age in Larksville borough
Disability Class: Hearing Difficulty
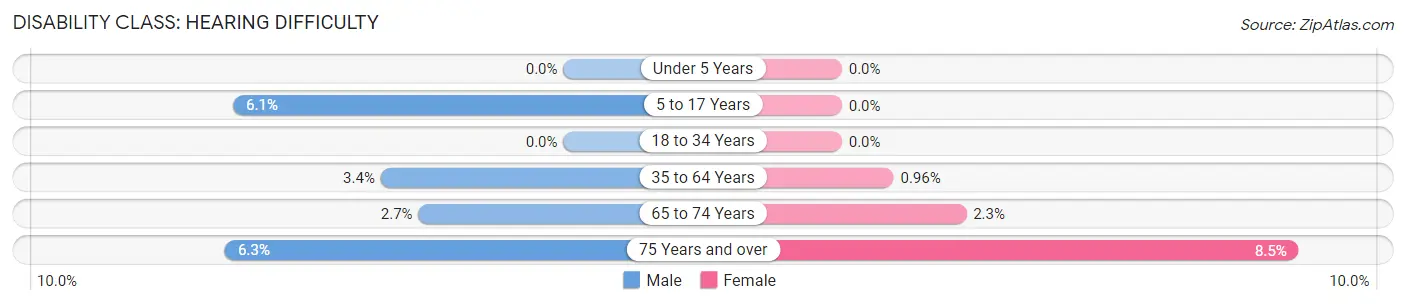
| Age Bracket | Male | Female |
| Under 5 Years | 0 (0.0%) | 0 (0.0%) |
| 5 to 17 Years | 10 (6.1%) | 0 (0.0%) |
| 18 to 34 Years | 0 (0.0%) | 0 (0.0%) |
| 35 to 64 Years | 29 (3.4%) | 10 (1.0%) |
| 65 to 74 Years | 6 (2.7%) | 8 (2.3%) |
| 75 Years and over | 12 (6.3%) | 19 (8.5%) |
Disability Class: Vision Difficulty
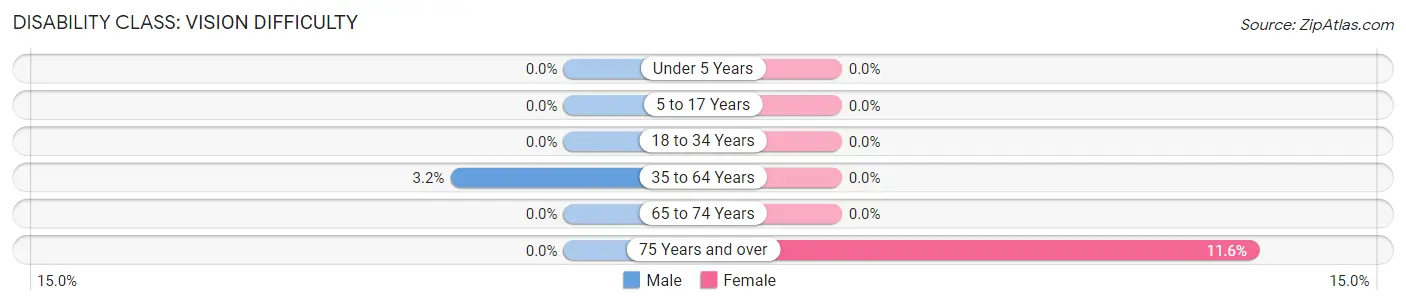
| Age Bracket | Male | Female |
| Under 5 Years | 0 (0.0%) | 0 (0.0%) |
| 5 to 17 Years | 0 (0.0%) | 0 (0.0%) |
| 18 to 34 Years | 0 (0.0%) | 0 (0.0%) |
| 35 to 64 Years | 27 (3.2%) | 0 (0.0%) |
| 65 to 74 Years | 0 (0.0%) | 0 (0.0%) |
| 75 Years and over | 0 (0.0%) | 26 (11.6%) |
Disability Class: Cognitive Difficulty
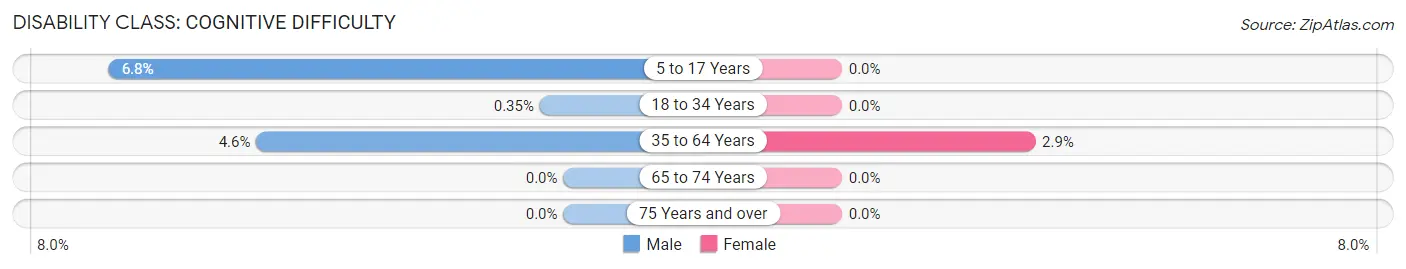
| Age Bracket | Male | Female |
| 5 to 17 Years | 11 (6.8%) | 0 (0.0%) |
| 18 to 34 Years | 1 (0.4%) | 0 (0.0%) |
| 35 to 64 Years | 39 (4.6%) | 30 (2.9%) |
| 65 to 74 Years | 0 (0.0%) | 0 (0.0%) |
| 75 Years and over | 0 (0.0%) | 0 (0.0%) |
Disability Class: Ambulatory Difficulty
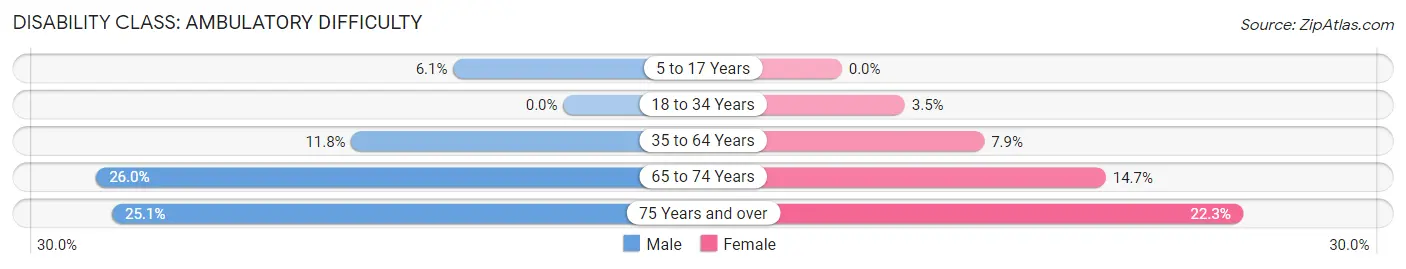
| Age Bracket | Male | Female |
| 5 to 17 Years | 10 (6.1%) | 0 (0.0%) |
| 18 to 34 Years | 0 (0.0%) | 15 (3.5%) |
| 35 to 64 Years | 101 (11.8%) | 83 (7.9%) |
| 65 to 74 Years | 58 (26.0%) | 51 (14.7%) |
| 75 Years and over | 48 (25.1%) | 50 (22.3%) |
Disability Class: Self-Care Difficulty
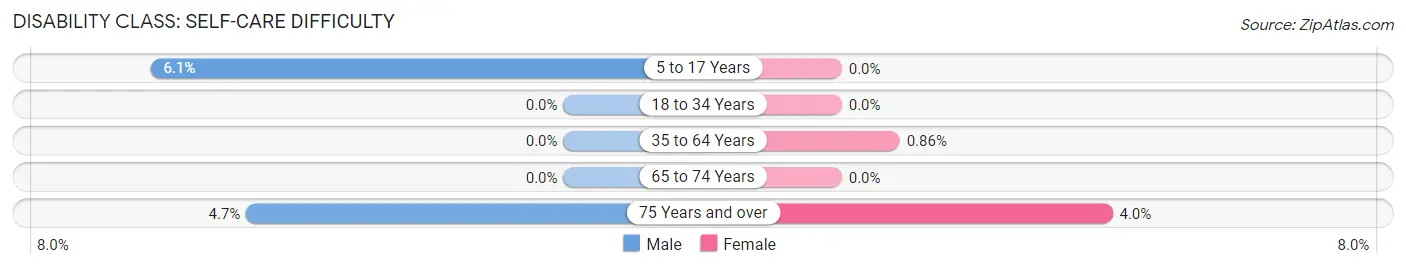
| Age Bracket | Male | Female |
| 5 to 17 Years | 10 (6.1%) | 0 (0.0%) |
| 18 to 34 Years | 0 (0.0%) | 0 (0.0%) |
| 35 to 64 Years | 0 (0.0%) | 9 (0.9%) |
| 65 to 74 Years | 0 (0.0%) | 0 (0.0%) |
| 75 Years and over | 9 (4.7%) | 9 (4.0%) |
Technology Access in Larksville borough
Computing Device Access in Larksville borough
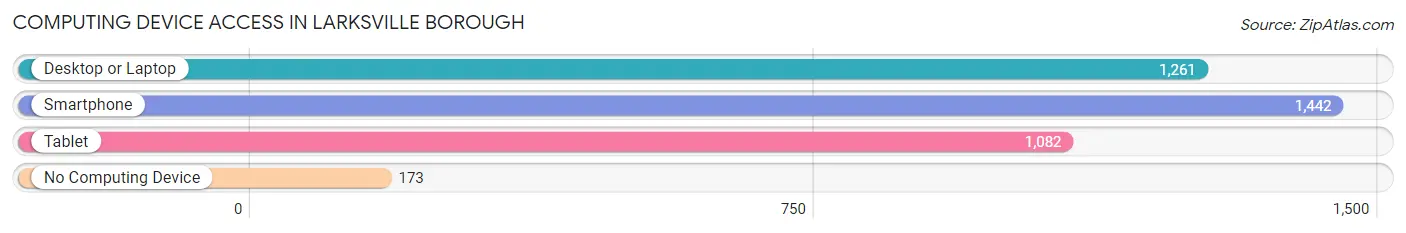
| Device Type | # Households | % Households |
| Desktop or Laptop | 1,261 | 72.0% |
| Smartphone | 1,442 | 82.4% |
| Tablet | 1,082 | 61.8% |
| No Computing Device | 173 | 9.9% |
| Total | 1,751 | 100.0% |
Internet Access in Larksville borough
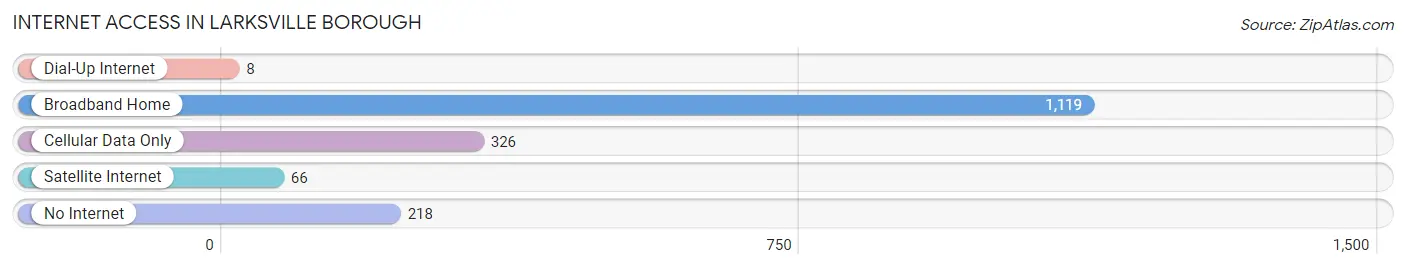
| Internet Type | # Households | % Households |
| Dial-Up Internet | 8 | 0.5% |
| Broadband Home | 1,119 | 63.9% |
| Cellular Data Only | 326 | 18.6% |
| Satellite Internet | 66 | 3.8% |
| No Internet | 218 | 12.4% |
| Total | 1,751 | 100.0% |
Larksville borough Summary
Larksville Borough is a small borough located in Luzerne County, Pennsylvania. It is situated in the Wyoming Valley, a region of the Northeastern United States. The borough is located along the Susquehanna River and is bordered by the townships of Plymouth, Kingston, and Edwardsville. The population of Larksville Borough was 2,845 at the 2010 census.
History
Larksville Borough was first settled in 1790 by a group of settlers from Connecticut. The town was originally known as “Lark’s Landing” after the first settler, John Lark. The town was officially incorporated in 1851 and was named after Lark.
The town was an important stop on the Lehigh Valley Railroad, which ran through the town from 1855 to 1972. The railroad was a major factor in the growth of the town, as it allowed for the transportation of goods and people to and from the area.
The town was also home to a number of coal mines, which provided employment for many of the town’s residents. The coal industry was a major factor in the town’s economy until the mid-20th century, when the industry began to decline.
Geography
Larksville Borough is located at 41°14'17" North, 75°54'45" West (41.238, -75.912). According to the United States Census Bureau, the borough has a total area of 1.2 square miles (3.1 km2), all of it land.
The borough is located in the Wyoming Valley, a region of the Northeastern United States. The Susquehanna River runs through the borough, and the town is bordered by the townships of Plymouth, Kingston, and Edwardsville.
Economy
The economy of Larksville Borough is largely based on the service industry. The town is home to a number of small businesses, including restaurants, retail stores, and professional services. The town is also home to a number of manufacturing companies, including a paper mill and a plastics factory.
The town is also home to a number of small farms, which produce a variety of crops, including corn, soybeans, and hay.
Demographics
As of the 2010 census, the population of Larksville Borough was 2,845. The racial makeup of the borough was 97.3% White, 0.7% African American, 0.2% Native American, 0.3% Asian, 0.1% from other races, and 1.4% from two or more races. Hispanic or Latino of any race were 1.2% of the population.
The median income for a household in the borough was $37,917, and the median income for a family was $45,625. The per capita income for the borough was $17,945. About 11.2% of families and 13.2% of the population were below the poverty line, including 17.2% of those under age 18 and 8.2% of those age 65 or over.
Common Questions
What is Per Capita Income in Larksville borough?
Per Capita income in Larksville borough is $45,428.
What is the Median Family Income in Larksville borough?
Median Family Income in Larksville borough is $88,910.
What is the Median Household income in Larksville borough?
Median Household Income in Larksville borough is $69,769.
What is Income or Wage Gap in Larksville borough?
Income or Wage Gap in Larksville borough is 35.8%.
Women in Larksville borough earn 64.2 cents for every dollar earned by a man.
What is Inequality or Gini Index in Larksville borough?
Inequality or Gini Index in Larksville borough is 0.51.
What is the Total Population of Larksville borough?
Total Population of Larksville borough is 4,240.
What is the Total Male Population of Larksville borough?
Total Male Population of Larksville borough is 1,844.
What is the Total Female Population of Larksville borough?
Total Female Population of Larksville borough is 2,396.
What is the Ratio of Males per 100 Females in Larksville borough?
There are 76.96 Males per 100 Females in Larksville borough.
What is the Ratio of Females per 100 Males in Larksville borough?
There are 129.93 Females per 100 Males in Larksville borough.
What is the Median Population Age in Larksville borough?
Median Population Age in Larksville borough is 50.2 Years.
What is the Average Family Size in Larksville borough
Average Family Size in Larksville borough is 2.9 People.
What is the Average Household Size in Larksville borough
Average Household Size in Larksville borough is 2.4 People.
How Large is the Labor Force in Larksville borough?
There are 2,277 People in the Labor Forcein in Larksville borough.
What is the Percentage of People in the Labor Force in Larksville borough?
62.1% of People are in the Labor Force in Larksville borough.
What is the Unemployment Rate in Larksville borough?
Unemployment Rate in Larksville borough is 8.2%.