Masthope, PA Map & Demographics
Masthope Map
Masthope Overview
$45,390
PER CAPITA INCOME
$97,264
AVG FAMILY INCOME
$86,719
AVG HOUSEHOLD INCOME
0.43
INEQUALITY / GINI INDEX
597
TOTAL POPULATION
335
MALE POPULATION
262
FEMALE POPULATION
127.86
MALES / 100 FEMALES
78.21
FEMALES / 100 MALES
66.7
MEDIAN AGE
2.3
AVG FAMILY SIZE
2.0
AVG HOUSEHOLD SIZE
150
LABOR FORCE [ PEOPLE ]
25.8%
PERCENT IN LABOR FORCE
24.0%
UNEMPLOYMENT RATE
Income in Masthope
Income Overview in Masthope
Per Capita Income in Masthope is $45,390, while median incomes of families and households are $97,264 and $86,719 respectively.
| Characteristic | Number | Measure |
| Per Capita Income | 597 | $45,390 |
| Median Family Income | 196 | $97,264 |
| Mean Family Income | 196 | $120,005 |
| Median Household Income | 297 | $86,719 |
| Mean Household Income | 297 | $90,635 |
| Income Deficit | 196 | $0 |
| Wage / Income Gap (%) | 597 | 0.00% |
| Wage / Income Gap ($) | 597 | 100.00¢ per $1 |
| Gini / Inequality Index | 597 | 0.43 |
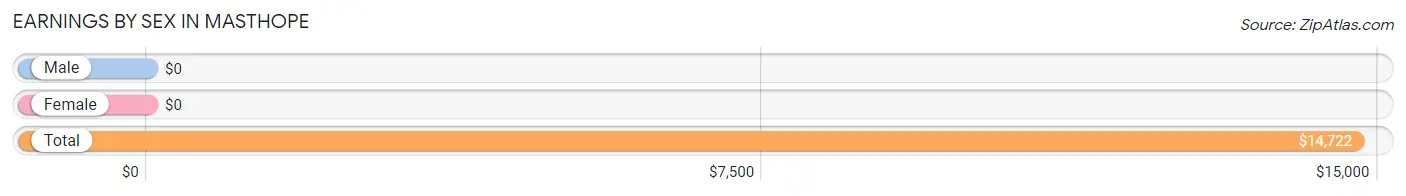
Earnings by Sex in Masthope
| Sex | Number | Average Earnings |
| Male | 109 (45.8%) | $0 |
| Female | 129 (54.2%) | $0 |
| Total | 238 (100.0%) | $14,722 |
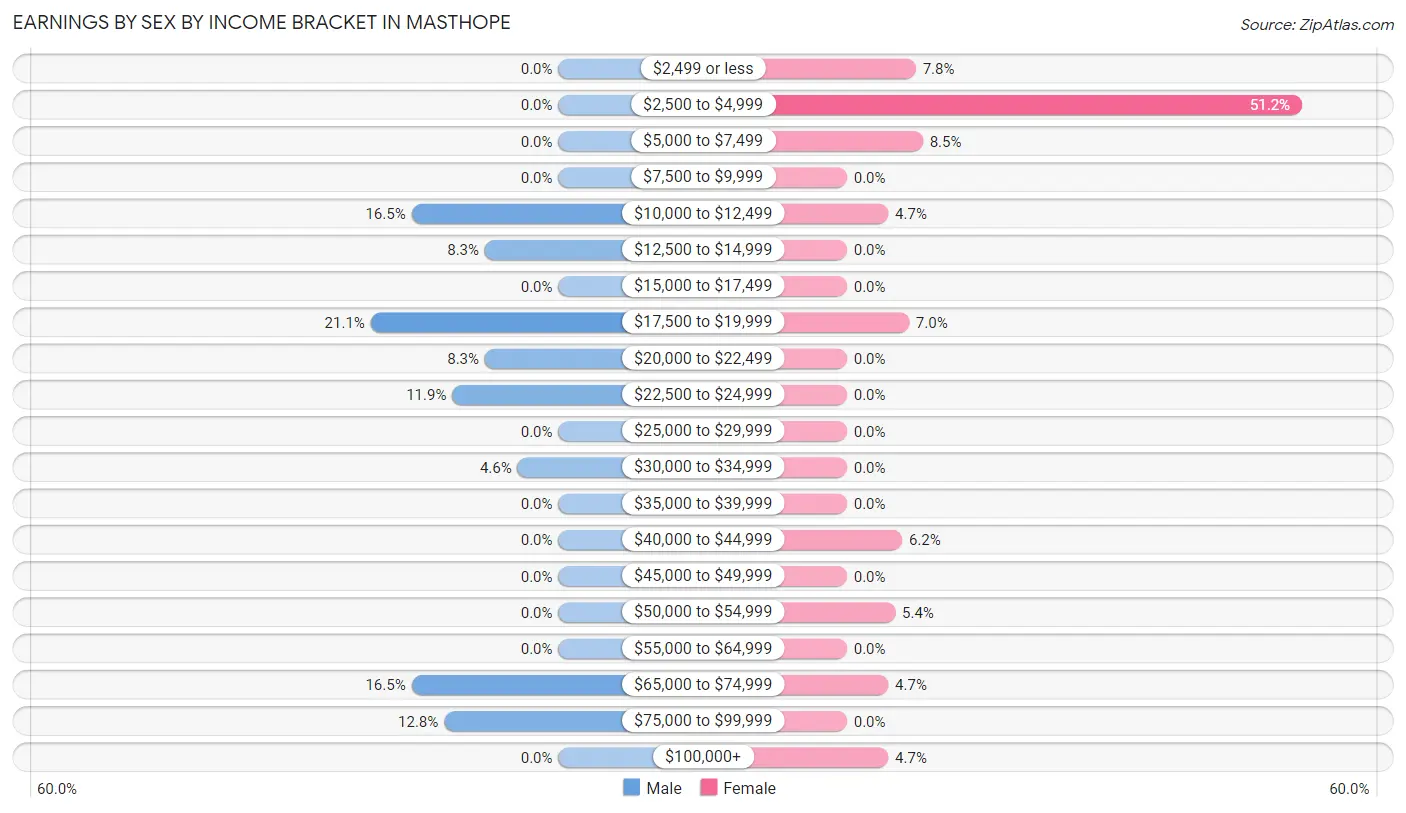
Earnings by Sex by Income Bracket in Masthope
The most common earnings brackets in Masthope are $17,500 to $19,999 for men (23 | 21.1%) and $2,500 to $4,999 for women (66 | 51.2%).
| Income | Male | Female |
| $2,499 or less | 0 (0.0%) | 10 (7.7%) |
| $2,500 to $4,999 | 0 (0.0%) | 66 (51.2%) |
| $5,000 to $7,499 | 0 (0.0%) | 11 (8.5%) |
| $7,500 to $9,999 | 0 (0.0%) | 0 (0.0%) |
| $10,000 to $12,499 | 18 (16.5%) | 6 (4.6%) |
| $12,500 to $14,999 | 9 (8.3%) | 0 (0.0%) |
| $15,000 to $17,499 | 0 (0.0%) | 0 (0.0%) |
| $17,500 to $19,999 | 23 (21.1%) | 9 (7.0%) |
| $20,000 to $22,499 | 9 (8.3%) | 0 (0.0%) |
| $22,500 to $24,999 | 13 (11.9%) | 0 (0.0%) |
| $25,000 to $29,999 | 0 (0.0%) | 0 (0.0%) |
| $30,000 to $34,999 | 5 (4.6%) | 0 (0.0%) |
| $35,000 to $39,999 | 0 (0.0%) | 0 (0.0%) |
| $40,000 to $44,999 | 0 (0.0%) | 8 (6.2%) |
| $45,000 to $49,999 | 0 (0.0%) | 0 (0.0%) |
| $50,000 to $54,999 | 0 (0.0%) | 7 (5.4%) |
| $55,000 to $64,999 | 0 (0.0%) | 0 (0.0%) |
| $65,000 to $74,999 | 18 (16.5%) | 6 (4.6%) |
| $75,000 to $99,999 | 14 (12.8%) | 0 (0.0%) |
| $100,000+ | 0 (0.0%) | 6 (4.6%) |
| Total | 109 (100.0%) | 129 (100.0%) |
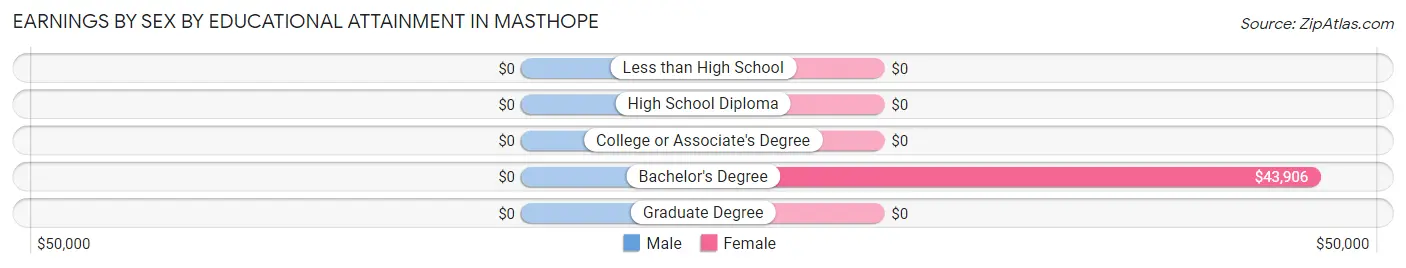
Earnings by Sex by Educational Attainment in Masthope
| Educational Attainment | Male Income | Female Income |
| Less than High School | - | - |
| High School Diploma | - | - |
| College or Associate's Degree | - | - |
| Bachelor's Degree | - | - |
| Graduate Degree | - | - |
| Total | - | - |
Family Income in Masthope
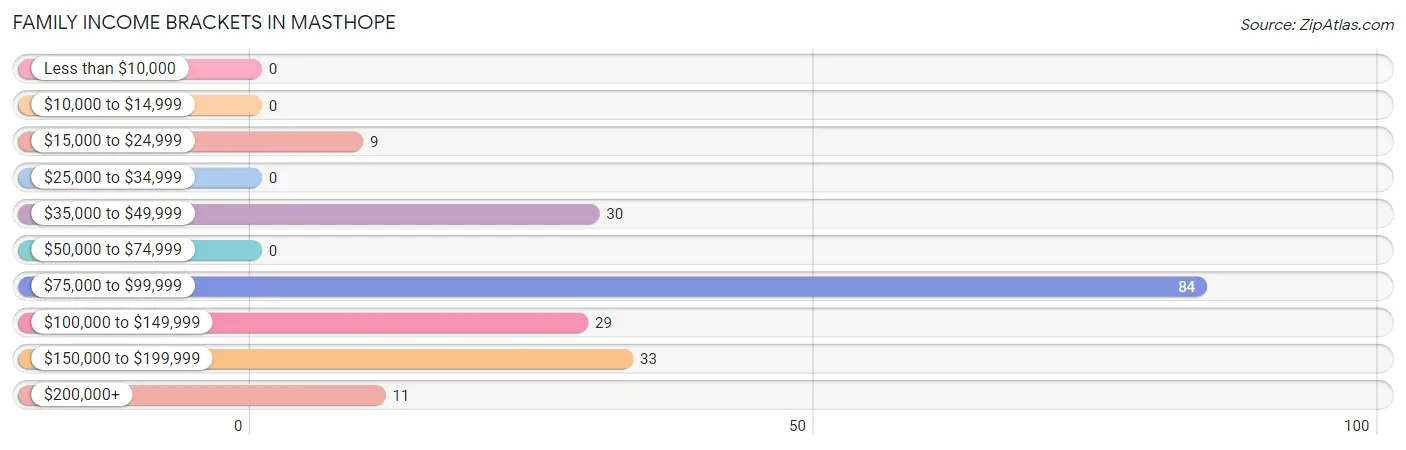
Family Income Brackets in Masthope
According to the Masthope family income data, there are 84 families falling into the $75,000 to $99,999 income range, which is the most common income bracket and makes up 42.9% of all families.
| Income Bracket | # Families | % Families |
| Less than $10,000 | 0 | 0.0% |
| $10,000 to $14,999 | 0 | 0.0% |
| $15,000 to $24,999 | 9 | 4.6% |
| $25,000 to $34,999 | 0 | 0.0% |
| $35,000 to $49,999 | 30 | 15.3% |
| $50,000 to $74,999 | 0 | 0.0% |
| $75,000 to $99,999 | 84 | 42.9% |
| $100,000 to $149,999 | 29 | 14.8% |
| $150,000 to $199,999 | 33 | 16.8% |
| $200,000+ | 11 | 5.6% |
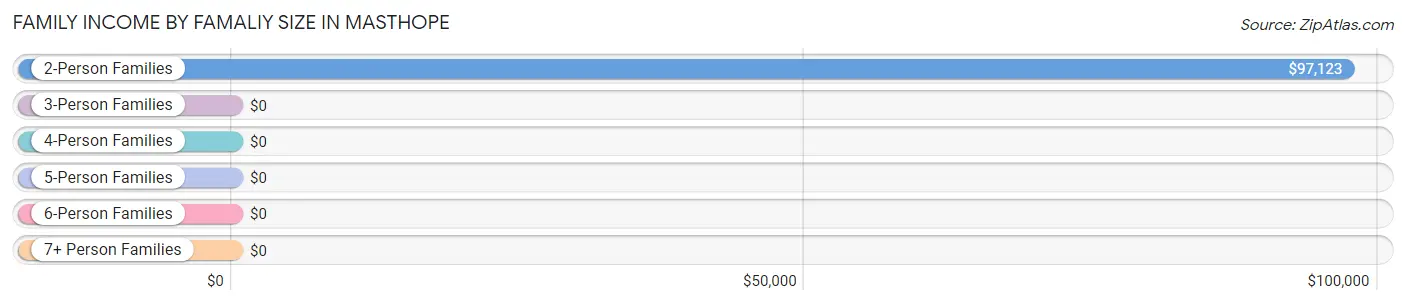
Family Income by Famaliy Size in Masthope
2-person families (172 | 87.8%) account for the highest median family income in Masthope with $97,123 per family, while 2-person families (172 | 87.8%) have the highest median income of $48,562 per family member.
| Income Bracket | # Families | Median Income |
| 2-Person Families | 172 (87.8%) | $97,123 |
| 3-Person Families | 15 (7.6%) | $0 |
| 4-Person Families | 9 (4.6%) | $0 |
| 5-Person Families | 0 (0.0%) | $0 |
| 6-Person Families | 0 (0.0%) | $0 |
| 7+ Person Families | 0 (0.0%) | $0 |
| Total | 196 (100.0%) | $97,264 |
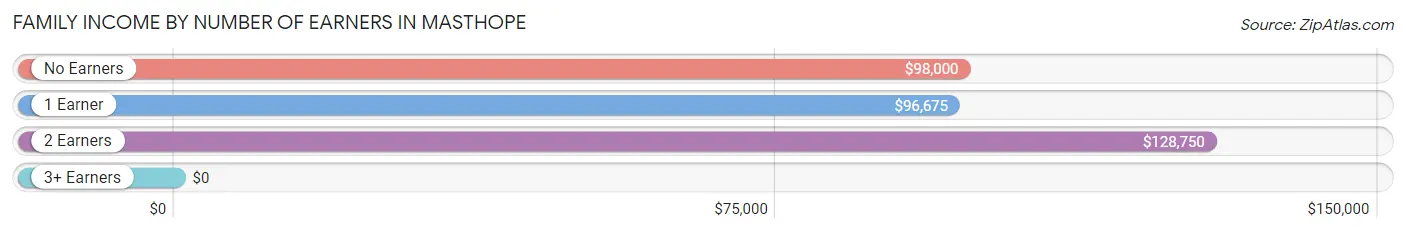
Family Income by Number of Earners in Masthope
| Number of Earners | # Families | Median Income |
| No Earners | 48 (24.5%) | $98,000 |
| 1 Earner | 119 (60.7%) | $96,675 |
| 2 Earners | 20 (10.2%) | $128,750 |
| 3+ Earners | 9 (4.6%) | $0 |
| Total | 196 (100.0%) | $97,264 |
Household Income in Masthope
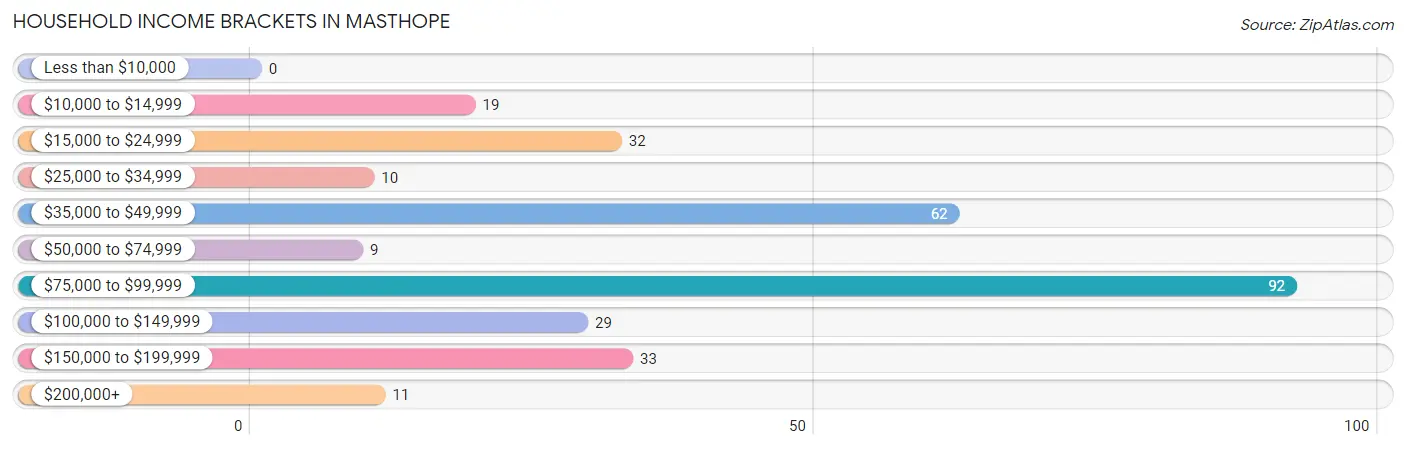
Household Income Brackets in Masthope
With 92 households falling in the category, the $75,000 to $99,999 income range is the most frequent in Masthope, accounting for 31.0% of all households.
| Income Bracket | # Households | % Households |
| Less than $10,000 | 0 | 0.0% |
| $10,000 to $14,999 | 19 | 6.4% |
| $15,000 to $24,999 | 32 | 10.8% |
| $25,000 to $34,999 | 10 | 3.4% |
| $35,000 to $49,999 | 62 | 20.9% |
| $50,000 to $74,999 | 9 | 3.0% |
| $75,000 to $99,999 | 92 | 31.0% |
| $100,000 to $149,999 | 29 | 9.8% |
| $150,000 to $199,999 | 33 | 11.1% |
| $200,000+ | 11 | 3.7% |
Household Income by Householder Age in Masthope
The median household income in Masthope is $86,719, with the highest median household income of $82,273 found in the 65+ years age bracket for the primary householder. A total of 246 households (82.8%) fall into this category.
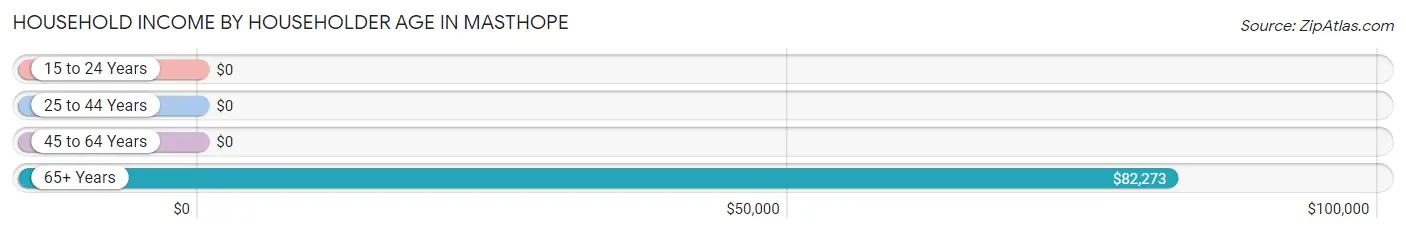
| Income Bracket | # Households | Median Income |
| 15 to 24 Years | 0 (0.0%) | $0 |
| 25 to 44 Years | 6 (2.0%) | $0 |
| 45 to 64 Years | 45 (15.1%) | $0 |
| 65+ Years | 246 (82.8%) | $82,273 |
| Total | 297 (100.0%) | $86,719 |
Poverty in Masthope
Income Below Poverty by Sex and Age in Masthope
With 21.5% poverty level for males and 15.7% for females among the residents of Masthope, 45 to 54 year old males and 35 to 44 year old females are the most vulnerable to poverty, with 31 males (100.0%) and 13 females (100.0%) in their respective age groups living below the poverty level.
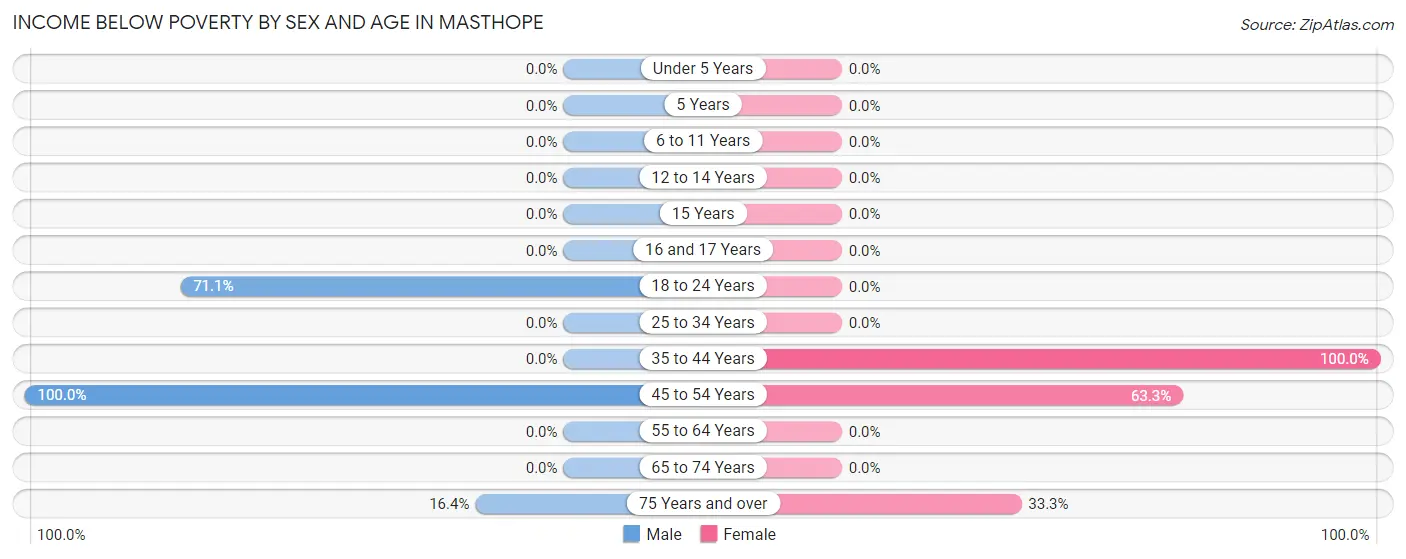
| Age Bracket | Male | Female |
| Under 5 Years | 0 (0.0%) | 0 (0.0%) |
| 5 Years | 0 (0.0%) | 0 (0.0%) |
| 6 to 11 Years | 0 (0.0%) | 0 (0.0%) |
| 12 to 14 Years | 0 (0.0%) | 0 (0.0%) |
| 15 Years | 0 (0.0%) | 0 (0.0%) |
| 16 and 17 Years | 0 (0.0%) | 0 (0.0%) |
| 18 to 24 Years | 32 (71.1%) | 0 (0.0%) |
| 25 to 34 Years | 0 (0.0%) | 0 (0.0%) |
| 35 to 44 Years | 0 (0.0%) | 13 (100.0%) |
| 45 to 54 Years | 31 (100.0%) | 19 (63.3%) |
| 55 to 64 Years | 0 (0.0%) | 0 (0.0%) |
| 65 to 74 Years | 0 (0.0%) | 0 (0.0%) |
| 75 Years and over | 9 (16.4%) | 9 (33.3%) |
| Total | 72 (21.5%) | 41 (15.7%) |
Income Above Poverty by Sex and Age in Masthope
According to the poverty statistics in Masthope, males aged under 5 years and females aged 25 to 34 years are the age groups that are most secure financially, with 100.0% of males and 100.0% of females in these age groups living above the poverty line.
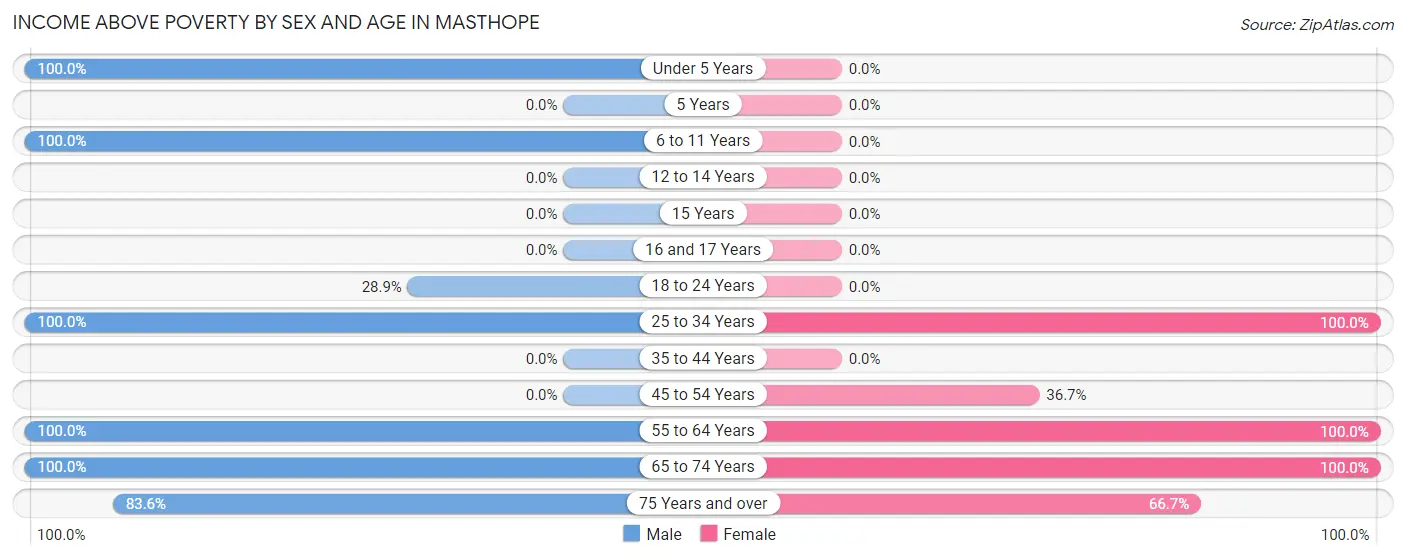
| Age Bracket | Male | Female |
| Under 5 Years | 5 (100.0%) | 0 (0.0%) |
| 5 Years | 0 (0.0%) | 0 (0.0%) |
| 6 to 11 Years | 10 (100.0%) | 0 (0.0%) |
| 12 to 14 Years | 0 (0.0%) | 0 (0.0%) |
| 15 Years | 0 (0.0%) | 0 (0.0%) |
| 16 and 17 Years | 0 (0.0%) | 0 (0.0%) |
| 18 to 24 Years | 13 (28.9%) | 0 (0.0%) |
| 25 to 34 Years | 7 (100.0%) | 6 (100.0%) |
| 35 to 44 Years | 0 (0.0%) | 0 (0.0%) |
| 45 to 54 Years | 0 (0.0%) | 11 (36.7%) |
| 55 to 64 Years | 49 (100.0%) | 24 (100.0%) |
| 65 to 74 Years | 133 (100.0%) | 162 (100.0%) |
| 75 Years and over | 46 (83.6%) | 18 (66.7%) |
| Total | 263 (78.5%) | 221 (84.4%) |
Income Below Poverty Among Married-Couple Families in Masthope
The poverty statistics for married-couple families in Masthope show that 4.9% or 9 of the total 185 families live below the poverty line. Families with no children have the highest poverty rate of 5.0%, comprising of 9 families. On the other hand, families with 1 or 2 children have the lowest poverty rate of 0.0%, which includes 0 families.
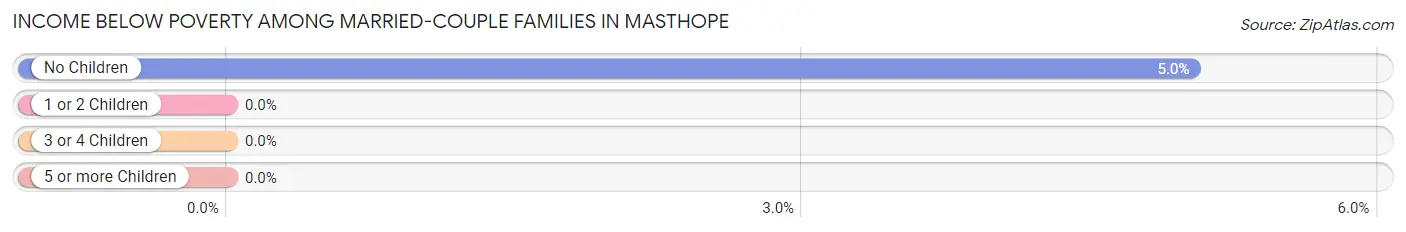
| Children | Above Poverty | Below Poverty |
| No Children | 170 (95.0%) | 9 (5.0%) |
| 1 or 2 Children | 6 (100.0%) | 0 (0.0%) |
| 3 or 4 Children | 0 (0.0%) | 0 (0.0%) |
| 5 or more Children | 0 (0.0%) | 0 (0.0%) |
| Total | 176 (95.1%) | 9 (4.9%) |
Income Below Poverty Among Single-Parent Households in Masthope
| Children | Single Father | Single Mother |
| No Children | 0 (0.0%) | 0 (0.0%) |
| 1 or 2 Children | 0 (0.0%) | 0 (0.0%) |
| 3 or 4 Children | 0 (0.0%) | 0 (0.0%) |
| 5 or more Children | 0 (0.0%) | 0 (0.0%) |
| Total | 0 (0.0%) | 0 (0.0%) |
Income Below Poverty Among Married-Couple vs Single-Parent Households in Masthope
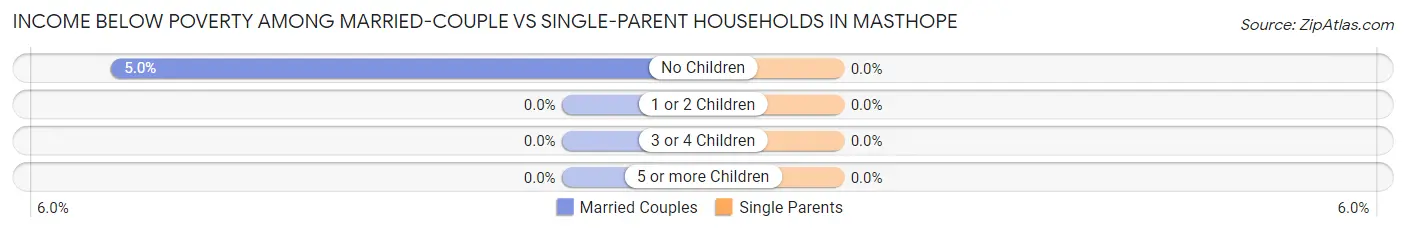
| Children | Married-Couple Families | Single-Parent Households |
| No Children | 9 (5.0%) | 0 (0.0%) |
| 1 or 2 Children | 0 (0.0%) | 0 (0.0%) |
| 3 or 4 Children | 0 (0.0%) | 0 (0.0%) |
| 5 or more Children | 0 (0.0%) | 0 (0.0%) |
| Total | 9 (4.9%) | 0 (0.0%) |
Race in Masthope
The most populous races in Masthope are White / Caucasian (558 | 93.5%), Hispanic or Latino (25 | 4.2%), and Two or more Races (20 | 3.4%).
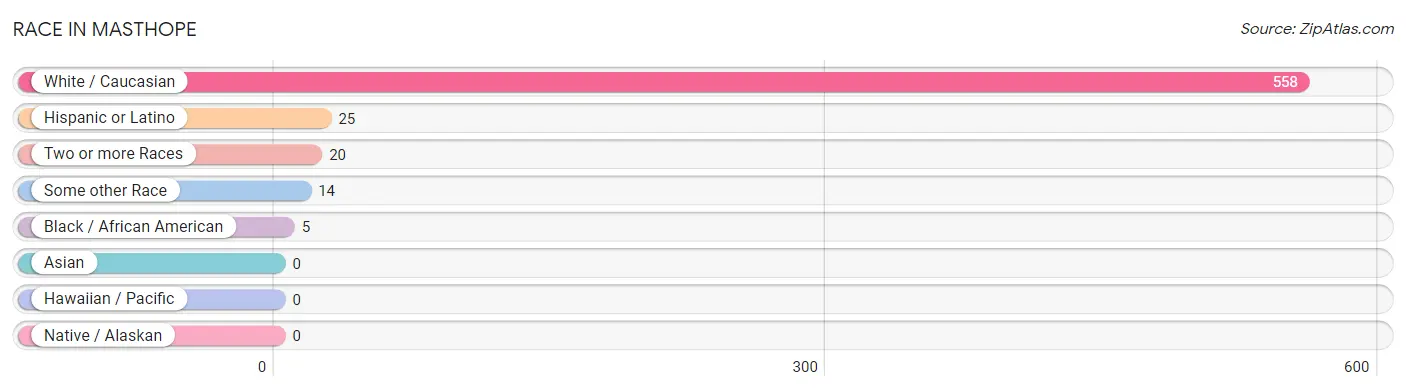
| Race | # Population | % Population |
| Asian | 0 | 0.0% |
| Black / African American | 5 | 0.8% |
| Hawaiian / Pacific | 0 | 0.0% |
| Hispanic or Latino | 25 | 4.2% |
| Native / Alaskan | 0 | 0.0% |
| White / Caucasian | 558 | 93.5% |
| Two or more Races | 20 | 3.4% |
| Some other Race | 14 | 2.4% |
| Total | 597 | 100.0% |
Ancestry in Masthope
The most populous ancestries reported in Masthope are Irish (209 | 35.0%), Italian (149 | 25.0%), American (57 | 9.6%), English (57 | 9.6%), and Eastern European (53 | 8.9%), together accounting for 88.0% of all Masthope residents.
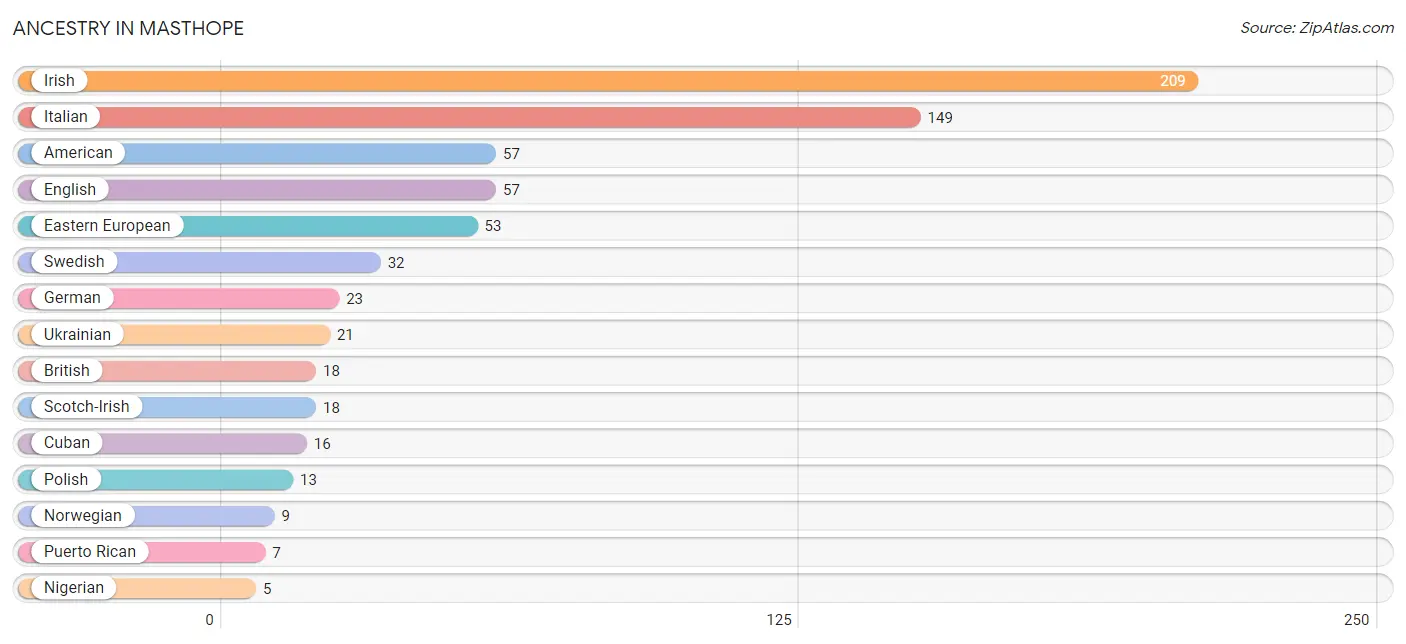
| Ancestry | # Population | % Population |
| American | 57 | 9.6% |
| British | 18 | 3.0% |
| Cuban | 16 | 2.7% |
| Eastern European | 53 | 8.9% |
| English | 57 | 9.6% |
| German | 23 | 3.8% |
| Irish | 209 | 35.0% |
| Italian | 149 | 25.0% |
| Nigerian | 5 | 0.8% |
| Norwegian | 9 | 1.5% |
| Polish | 13 | 2.2% |
| Puerto Rican | 7 | 1.2% |
| Scotch-Irish | 18 | 3.0% |
| Subsaharan African | 5 | 0.8% |
| Swedish | 32 | 5.4% |
| Ukrainian | 21 | 3.5% | View All 16 Rows |
Immigrants in Masthope
The most numerous immigrant groups reported in Masthope came from Europe (44 | 7.4%), Eastern Europe (21 | 3.5%), Ukraine (21 | 3.5%), Africa (10 | 1.7%), and Eastern Africa (10 | 1.7%), together accounting for 17.8% of all Masthope residents.
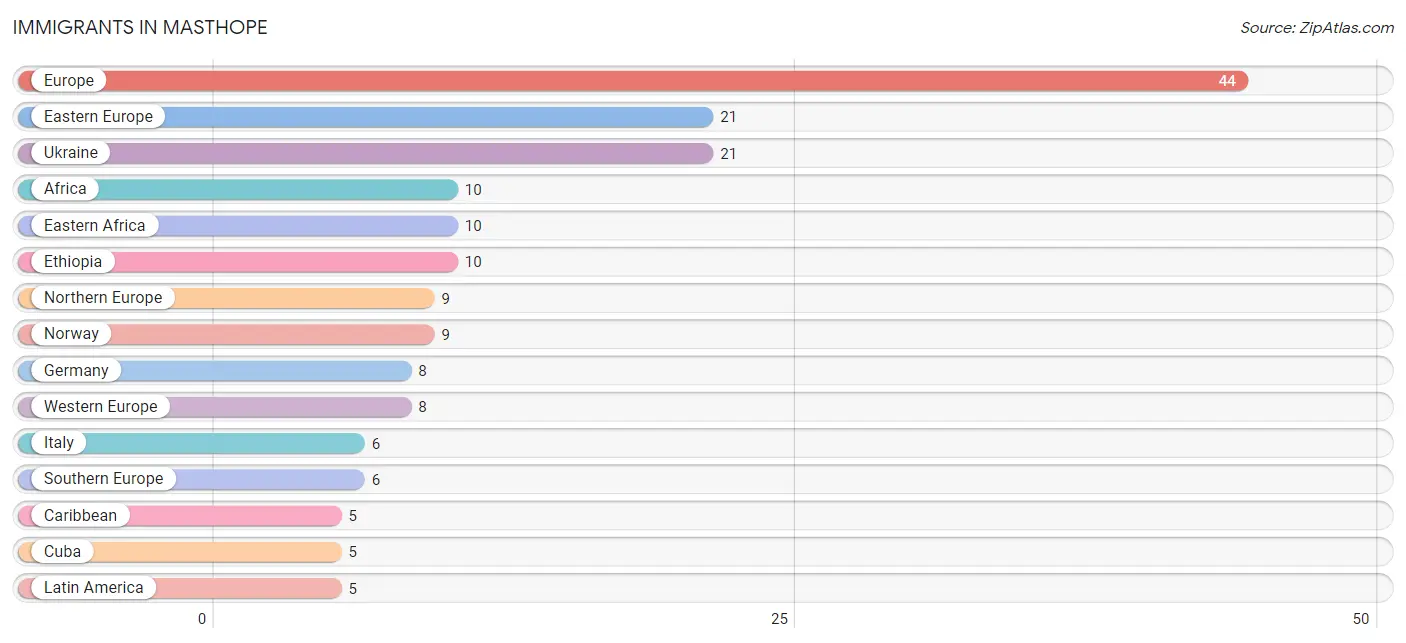
| Immigration Origin | # Population | % Population |
| Africa | 10 | 1.7% |
| Caribbean | 5 | 0.8% |
| Cuba | 5 | 0.8% |
| Eastern Africa | 10 | 1.7% |
| Eastern Europe | 21 | 3.5% |
| Ethiopia | 10 | 1.7% |
| Europe | 44 | 7.4% |
| Germany | 8 | 1.3% |
| Italy | 6 | 1.0% |
| Latin America | 5 | 0.8% |
| Northern Europe | 9 | 1.5% |
| Norway | 9 | 1.5% |
| Southern Europe | 6 | 1.0% |
| Ukraine | 21 | 3.5% |
| Western Europe | 8 | 1.3% | View All 15 Rows |
Sex and Age in Masthope
Sex and Age in Masthope
The most populous age groups in Masthope are 65 to 69 Years (82 | 24.5%) for men and 65 to 69 Years (98 | 37.4%) for women.
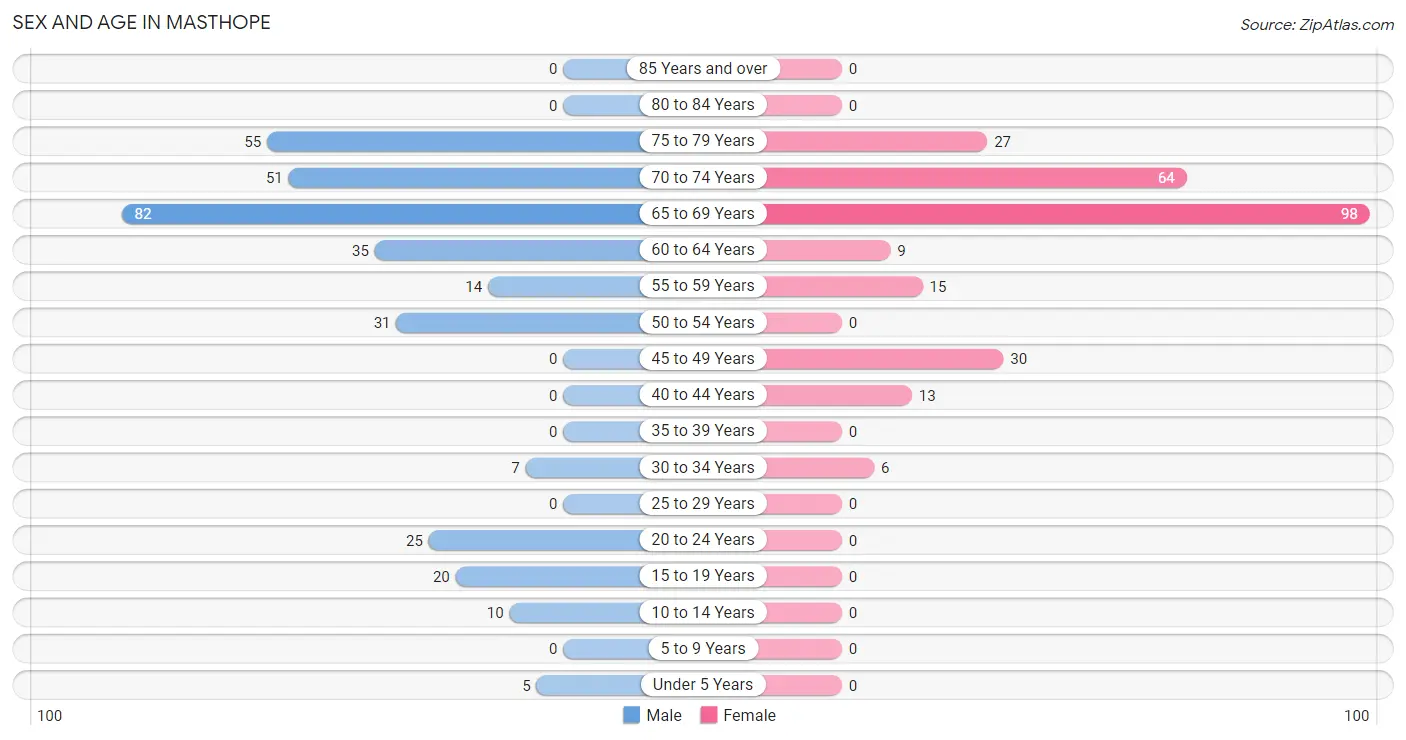
| Age Bracket | Male | Female |
| Under 5 Years | 5 (1.5%) | 0 (0.0%) |
| 5 to 9 Years | 0 (0.0%) | 0 (0.0%) |
| 10 to 14 Years | 10 (3.0%) | 0 (0.0%) |
| 15 to 19 Years | 20 (6.0%) | 0 (0.0%) |
| 20 to 24 Years | 25 (7.5%) | 0 (0.0%) |
| 25 to 29 Years | 0 (0.0%) | 0 (0.0%) |
| 30 to 34 Years | 7 (2.1%) | 6 (2.3%) |
| 35 to 39 Years | 0 (0.0%) | 0 (0.0%) |
| 40 to 44 Years | 0 (0.0%) | 13 (5.0%) |
| 45 to 49 Years | 0 (0.0%) | 30 (11.5%) |
| 50 to 54 Years | 31 (9.2%) | 0 (0.0%) |
| 55 to 59 Years | 14 (4.2%) | 15 (5.7%) |
| 60 to 64 Years | 35 (10.4%) | 9 (3.4%) |
| 65 to 69 Years | 82 (24.5%) | 98 (37.4%) |
| 70 to 74 Years | 51 (15.2%) | 64 (24.4%) |
| 75 to 79 Years | 55 (16.4%) | 27 (10.3%) |
| 80 to 84 Years | 0 (0.0%) | 0 (0.0%) |
| 85 Years and over | 0 (0.0%) | 0 (0.0%) |
| Total | 335 (100.0%) | 262 (100.0%) |
Families and Households in Masthope
Median Family Size in Masthope
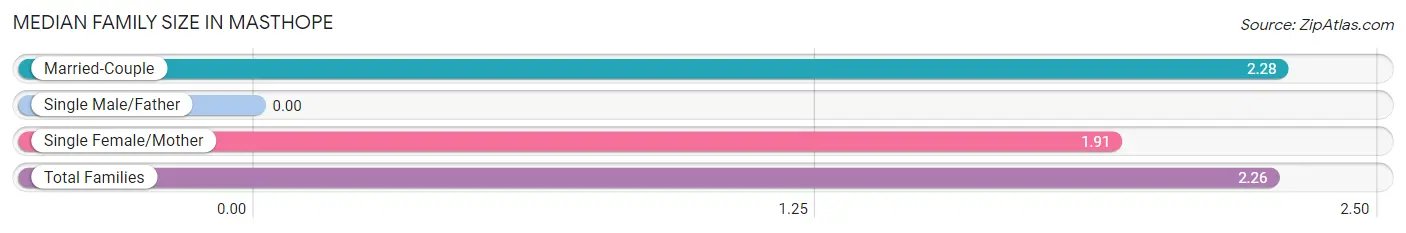
| Family Type | # Families | Family Size |
| Married-Couple | 185 (94.4%) | 2.28 |
| Single Male/Father | 0 (0.0%) | - |
| Single Female/Mother | 11 (5.6%) | 1.91 |
| Total Families | 196 (100.0%) | 2.26 |
Median Household Size in Masthope
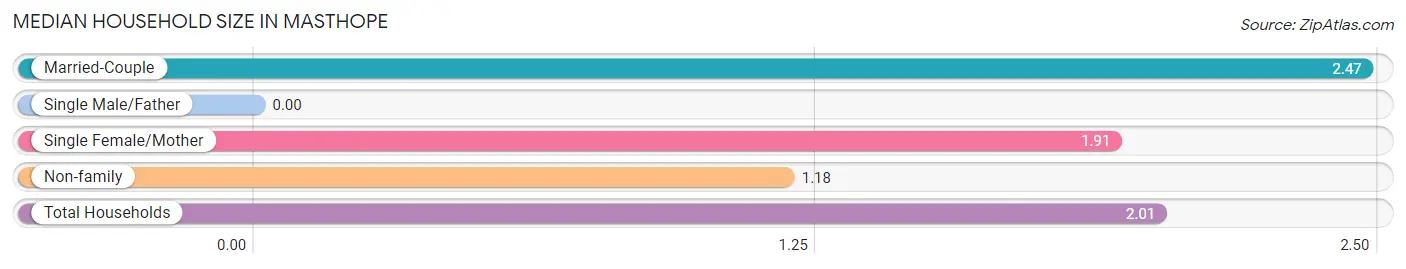
| Household Type | # Households | Household Size |
| Married-Couple | 185 (62.3%) | 2.47 |
| Single Male/Father | 0 (0.0%) | - |
| Single Female/Mother | 11 (3.7%) | 1.91 |
| Non-family | 101 (34.0%) | 1.18 |
| Total Households | 297 (100.0%) | 2.01 |
Household Size by Marriage Status in Masthope
Out of a total of 297 households in Masthope, 196 (66.0%) are family households, while 101 (34.0%) are nonfamily households. The most numerous type of family households are 2-person households, comprising 172, and the most common type of nonfamily households are 1-person households, comprising 82.
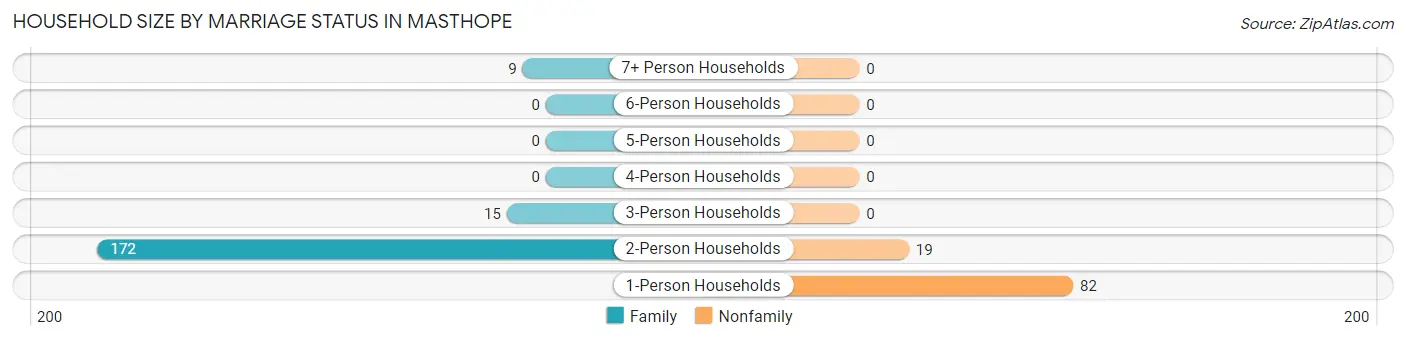
| Household Size | Family Households | Nonfamily Households |
| 1-Person Households | - | 82 (27.6%) |
| 2-Person Households | 172 (57.9%) | 19 (6.4%) |
| 3-Person Households | 15 (5.1%) | 0 (0.0%) |
| 4-Person Households | 0 (0.0%) | 0 (0.0%) |
| 5-Person Households | 0 (0.0%) | 0 (0.0%) |
| 6-Person Households | 0 (0.0%) | 0 (0.0%) |
| 7+ Person Households | 9 (3.0%) | 0 (0.0%) |
| Total | 196 (66.0%) | 101 (34.0%) |
Female Fertility in Masthope
Fertility by Age in Masthope
| Age Bracket | Women with Births | Births / 1,000 Women |
| 15 to 19 years | 0 (0.0%) | 0.0 |
| 20 to 34 years | 0 (0.0%) | 0.0 |
| 35 to 50 years | 0 (0.0%) | 0.0 |
| Total | 0 (0.0%) | 0.0 |
Fertility by Age by Marriage Status in Masthope
| Age Bracket | Married | Unmarried |
| 15 to 19 years | 0 (0.0%) | 0 (0.0%) |
| 20 to 34 years | 0 (0.0%) | 0 (0.0%) |
| 35 to 50 years | 0 (0.0%) | 0 (0.0%) |
| Total | 0 (0.0%) | 0 (0.0%) |
Fertility by Education in Masthope
| Educational Attainment | Women with Births | Births / 1,000 Women |
| Less than High School | 0 (0.0%) | 0.0 |
| High School Diploma | 0 (0.0%) | 0.0 |
| College or Associate's Degree | 0 (0.0%) | 0.0 |
| Bachelor's Degree | 0 (0.0%) | 0.0 |
| Graduate Degree | 0 (0.0%) | 0.0 |
| Total | 0 (0.0%) | 0.0 |
Fertility by Education by Marriage Status in Masthope
| Educational Attainment | Married | Unmarried |
| Less than High School | 0 (0.0%) | 0 (0.0%) |
| High School Diploma | 0 (0.0%) | 0 (0.0%) |
| College or Associate's Degree | 0 (0.0%) | 0 (0.0%) |
| Bachelor's Degree | 0 (0.0%) | 0 (0.0%) |
| Graduate Degree | 0 (0.0%) | 0 (0.0%) |
| Total | 0 (0.0%) | 0 (0.0%) |
Employment Characteristics in Masthope
Employment by Class of Employer in Masthope
Among the 114 employed individuals in Masthope, private company employees (41 | 36.0%), not-for-profit organizations (37 | 32.5%), and self-employed (incorporated) (23 | 20.2%) make up the most common classes of employment.
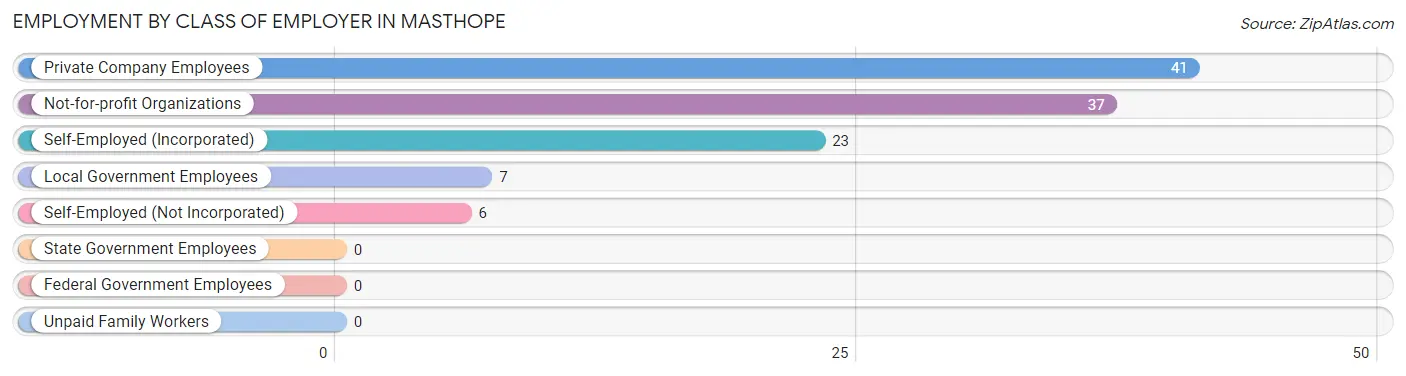
| Employer Class | # Employees | % Employees |
| Private Company Employees | 41 | 36.0% |
| Self-Employed (Incorporated) | 23 | 20.2% |
| Self-Employed (Not Incorporated) | 6 | 5.3% |
| Not-for-profit Organizations | 37 | 32.5% |
| Local Government Employees | 7 | 6.1% |
| State Government Employees | 0 | 0.0% |
| Federal Government Employees | 0 | 0.0% |
| Unpaid Family Workers | 0 | 0.0% |
| Total | 114 | 100.0% |
Employment Status by Age in Masthope
According to the labor force statistics for Masthope, out of the total population over 16 years of age (582), 25.8% or 150 individuals are in the labor force, with 24.0% or 36 of them unemployed. The age group with the highest labor force participation rate is 30 to 34 years, with 100.0% or 13 individuals in the labor force. Within the labor force, the 55 to 59 years age range has the highest percentage of unemployed individuals, with 75.0% or 18 of them being unemployed.
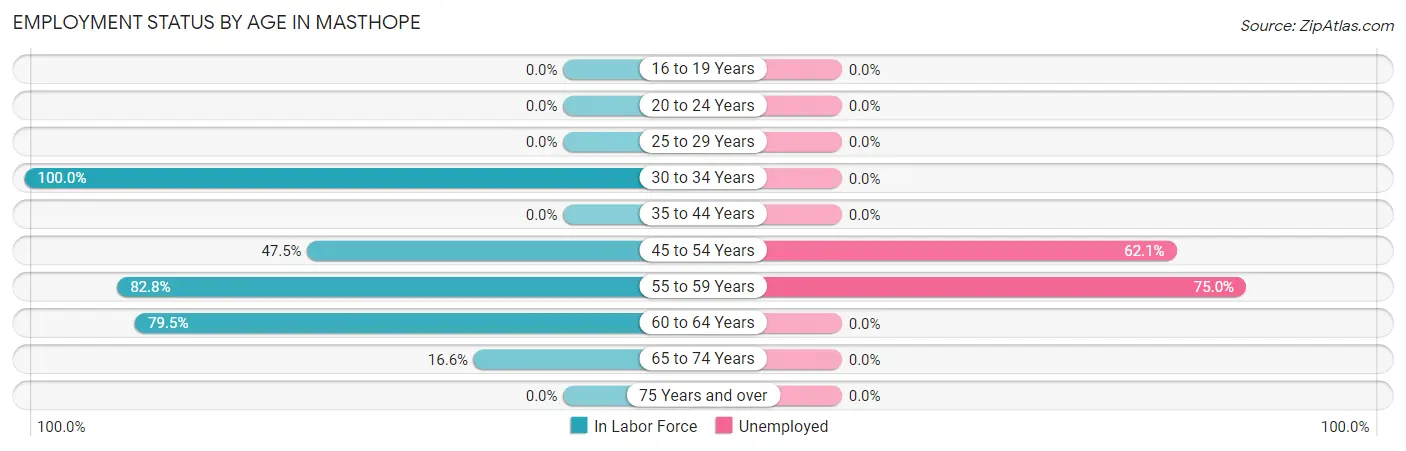
| Age Bracket | In Labor Force | Unemployed |
| 16 to 19 Years | 0 (0.0%) | 0 (0.0%) |
| 20 to 24 Years | 0 (0.0%) | 0 (0.0%) |
| 25 to 29 Years | 0 (0.0%) | 0 (0.0%) |
| 30 to 34 Years | 13 (100.0%) | 0 (0.0%) |
| 35 to 44 Years | 0 (0.0%) | 0 (0.0%) |
| 45 to 54 Years | 29 (47.5%) | 18 (62.1%) |
| 55 to 59 Years | 24 (82.8%) | 18 (75.0%) |
| 60 to 64 Years | 35 (79.5%) | 0 (0.0%) |
| 65 to 74 Years | 49 (16.6%) | 0 (0.0%) |
| 75 Years and over | 0 (0.0%) | 0 (0.0%) |
| Total | 150 (25.8%) | 36 (24.0%) |
Employment Status by Educational Attainment in Masthope
According to labor force statistics for Masthope, 63.1% of individuals (101) out of the total population between 25 and 64 years of age (160) are in the labor force, with 35.6% or 36 of them being unemployed. The group with the highest labor force participation rate are those with the educational attainment of less than high school, with 100.0% or 18 individuals in the labor force. Within the labor force, individuals with less than high school education have the highest percentage of unemployment, with 100.0% or 18 of them being unemployed.
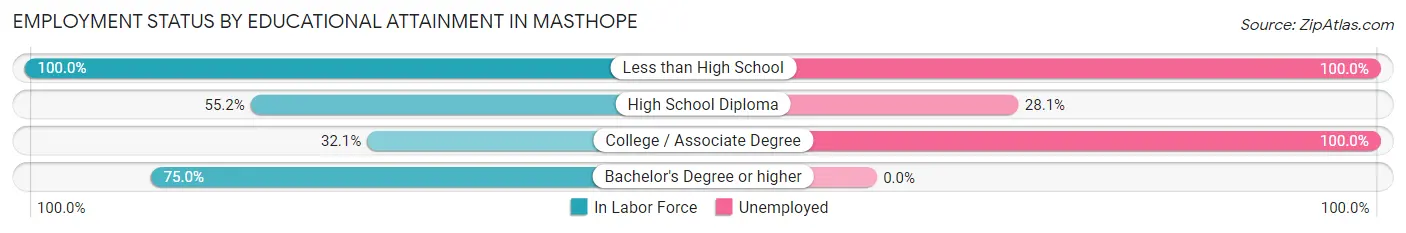
| Educational Attainment | In Labor Force | Unemployed |
| Less than High School | 18 (100.0%) | 18 (100.0%) |
| High School Diploma | 32 (55.2%) | 16 (28.1%) |
| College / Associate Degree | 9 (32.1%) | 28 (100.0%) |
| Bachelor's Degree or higher | 42 (75.0%) | 0 (0.0%) |
| Total | 101 (63.1%) | 57 (35.6%) |
Employment Occupations by Sex in Masthope
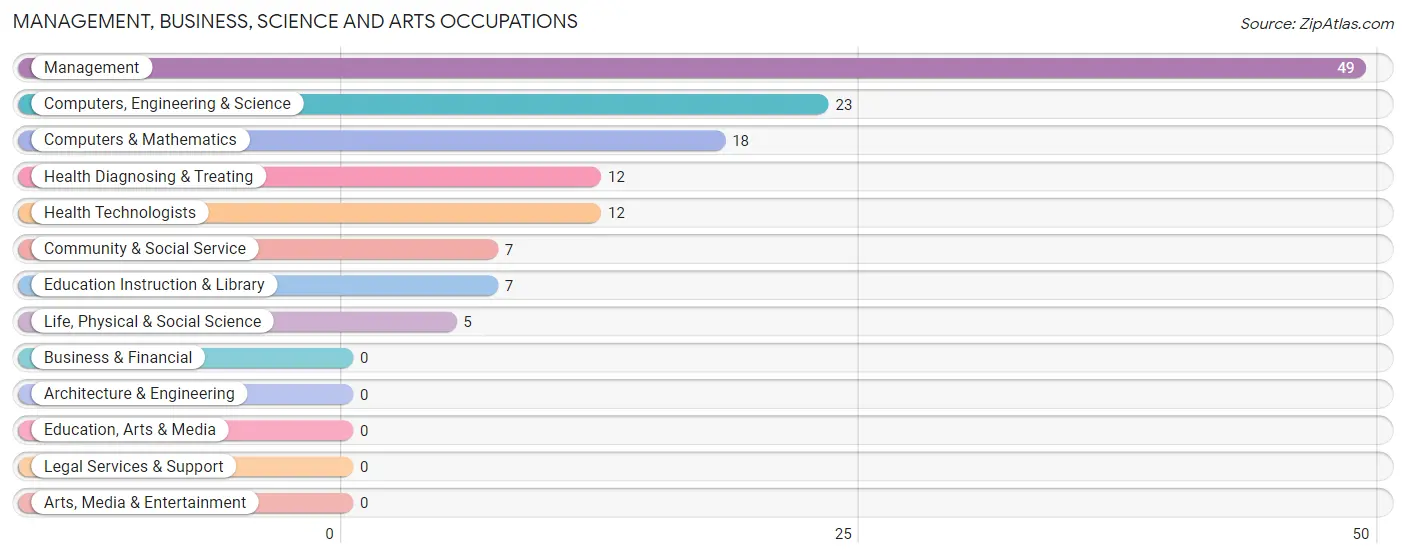
Management, Business, Science and Arts Occupations
The most common Management, Business, Science and Arts occupations in Masthope are Management (49 | 43.0%), Computers, Engineering & Science (23 | 20.2%), Computers & Mathematics (18 | 15.8%), Health Diagnosing & Treating (12 | 10.5%), and Health Technologists (12 | 10.5%).
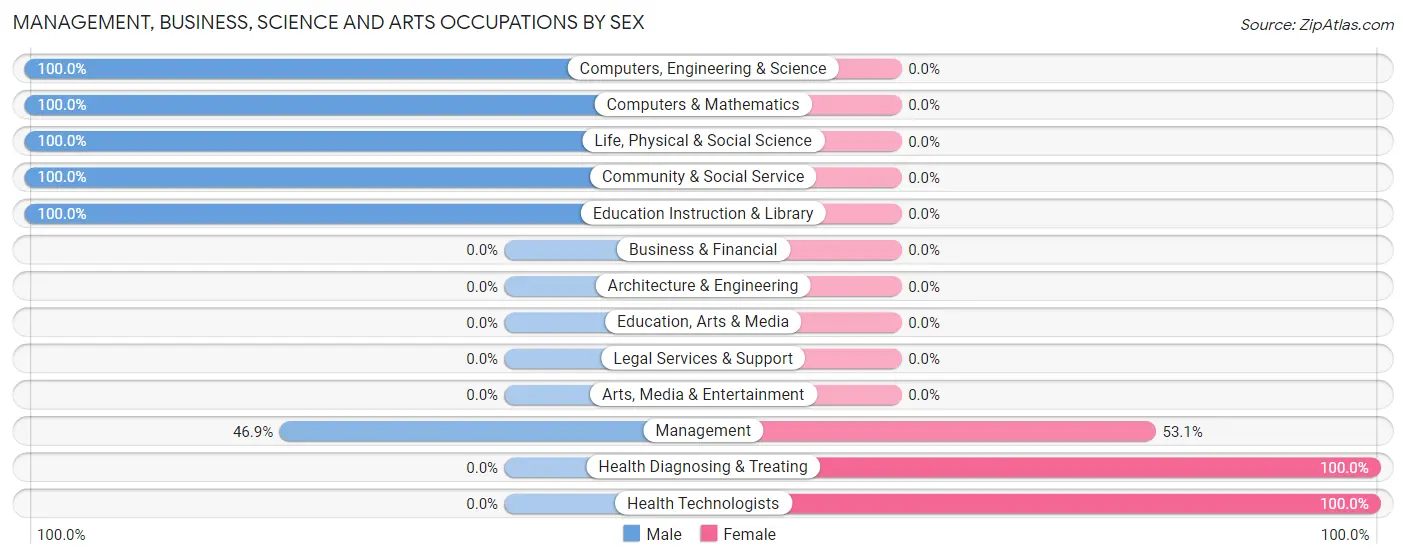
Management, Business, Science and Arts Occupations by Sex
Within the Management, Business, Science and Arts occupations in Masthope, the most male-oriented occupations are Computers, Engineering & Science (100.0%), Computers & Mathematics (100.0%), and Life, Physical & Social Science (100.0%), while the most female-oriented occupations are Health Diagnosing & Treating (100.0%), Health Technologists (100.0%), and Management (53.1%).
| Occupation | Male | Female |
| Management | 23 (46.9%) | 26 (53.1%) |
| Business & Financial | 0 (0.0%) | 0 (0.0%) |
| Computers, Engineering & Science | 23 (100.0%) | 0 (0.0%) |
| Computers & Mathematics | 18 (100.0%) | 0 (0.0%) |
| Architecture & Engineering | 0 (0.0%) | 0 (0.0%) |
| Life, Physical & Social Science | 5 (100.0%) | 0 (0.0%) |
| Community & Social Service | 7 (100.0%) | 0 (0.0%) |
| Education, Arts & Media | 0 (0.0%) | 0 (0.0%) |
| Legal Services & Support | 0 (0.0%) | 0 (0.0%) |
| Education Instruction & Library | 7 (100.0%) | 0 (0.0%) |
| Arts, Media & Entertainment | 0 (0.0%) | 0 (0.0%) |
| Health Diagnosing & Treating | 0 (0.0%) | 12 (100.0%) |
| Health Technologists | 0 (0.0%) | 12 (100.0%) |
| Total (Category) | 53 (58.2%) | 38 (41.8%) |
| Total (Overall) | 60 (52.6%) | 54 (47.4%) |
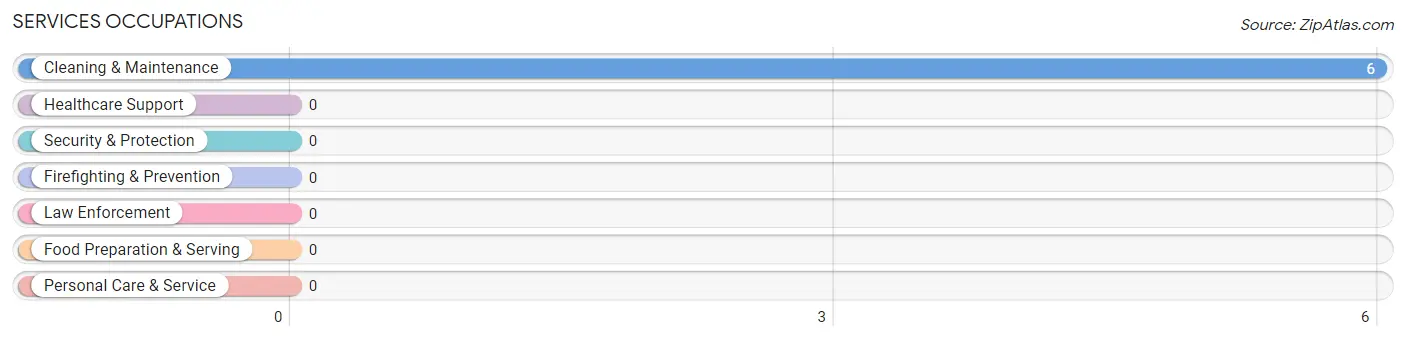
Services Occupations
The most common Services occupations in Masthope are , and Cleaning & Maintenance (6 | 5.3%).
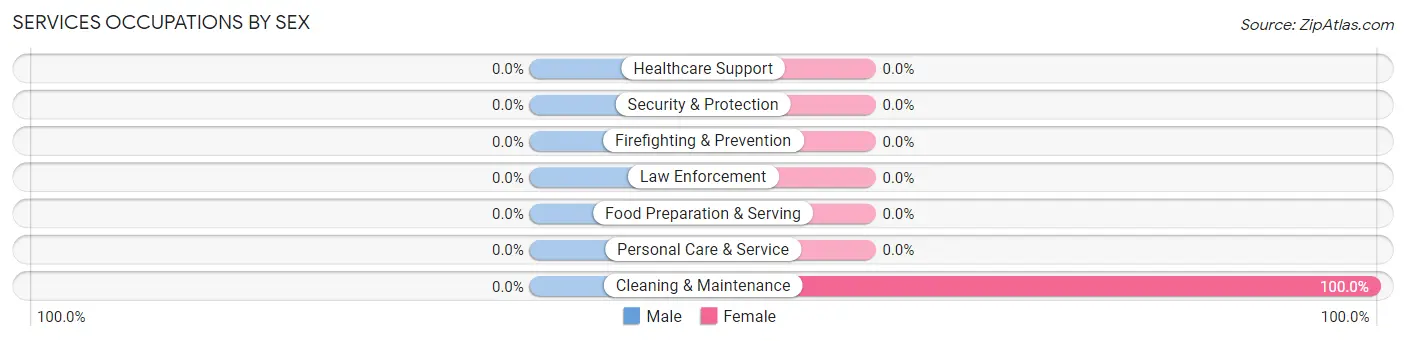
Services Occupations by Sex
| Occupation | Male | Female |
| Healthcare Support | 0 (0.0%) | 0 (0.0%) |
| Security & Protection | 0 (0.0%) | 0 (0.0%) |
| Firefighting & Prevention | 0 (0.0%) | 0 (0.0%) |
| Law Enforcement | 0 (0.0%) | 0 (0.0%) |
| Food Preparation & Serving | 0 (0.0%) | 0 (0.0%) |
| Cleaning & Maintenance | 0 (0.0%) | 6 (100.0%) |
| Personal Care & Service | 0 (0.0%) | 0 (0.0%) |
| Total (Category) | 0 (0.0%) | 6 (100.0%) |
| Total (Overall) | 60 (52.6%) | 54 (47.4%) |
Sales and Office Occupations
The most common Sales and Office occupations in Masthope are , and Office & Administration (17 | 14.9%).
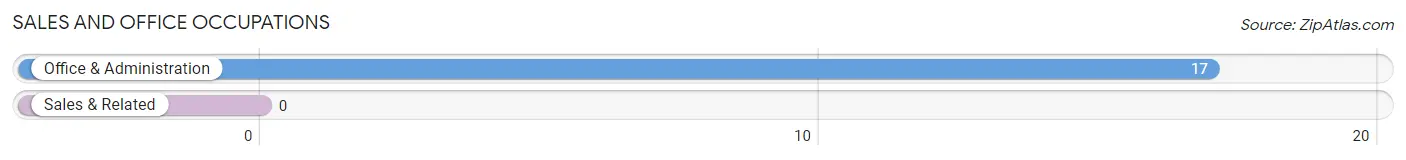
Sales and Office Occupations by Sex
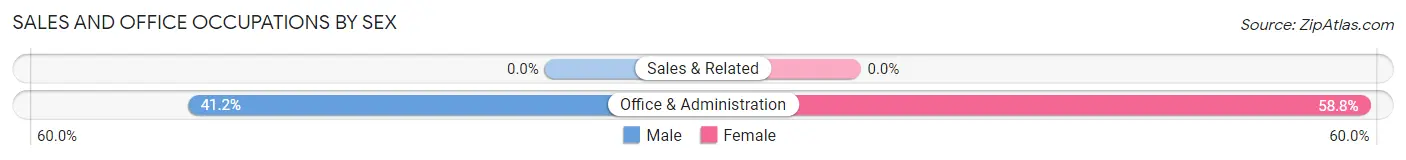
| Occupation | Male | Female |
| Sales & Related | 0 (0.0%) | 0 (0.0%) |
| Office & Administration | 7 (41.2%) | 10 (58.8%) |
| Total (Category) | 7 (41.2%) | 10 (58.8%) |
| Total (Overall) | 60 (52.6%) | 54 (47.4%) |
Natural Resources, Construction and Maintenance Occupations
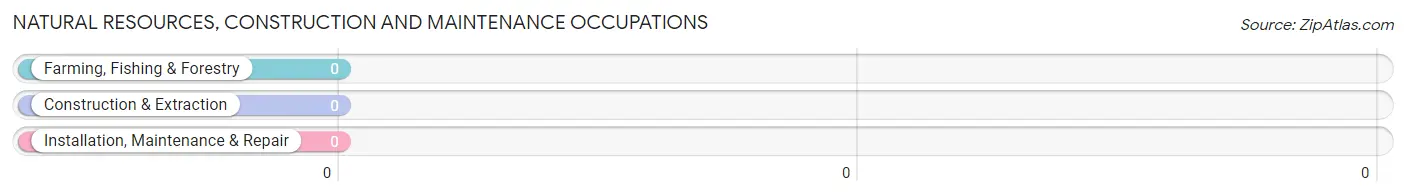
Natural Resources, Construction and Maintenance Occupations by Sex
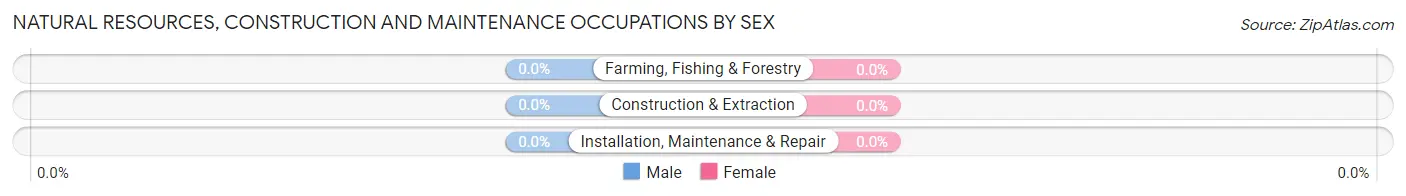
| Occupation | Male | Female |
| Farming, Fishing & Forestry | 0 (0.0%) | 0 (0.0%) |
| Construction & Extraction | 0 (0.0%) | 0 (0.0%) |
| Installation, Maintenance & Repair | 0 (0.0%) | 0 (0.0%) |
| Total (Category) | 0 (0.0%) | 0 (0.0%) |
| Total (Overall) | 60 (52.6%) | 54 (47.4%) |
Production, Transportation and Moving Occupations
Production, Transportation and Moving Occupations by Sex
| Occupation | Male | Female |
| Production | 0 (0.0%) | 0 (0.0%) |
| Transportation | 0 (0.0%) | 0 (0.0%) |
| Material Moving | 0 (0.0%) | 0 (0.0%) |
| Total (Category) | 0 (0.0%) | 0 (0.0%) |
| Total (Overall) | 60 (52.6%) | 54 (47.4%) |
Employment Industries by Sex in Masthope
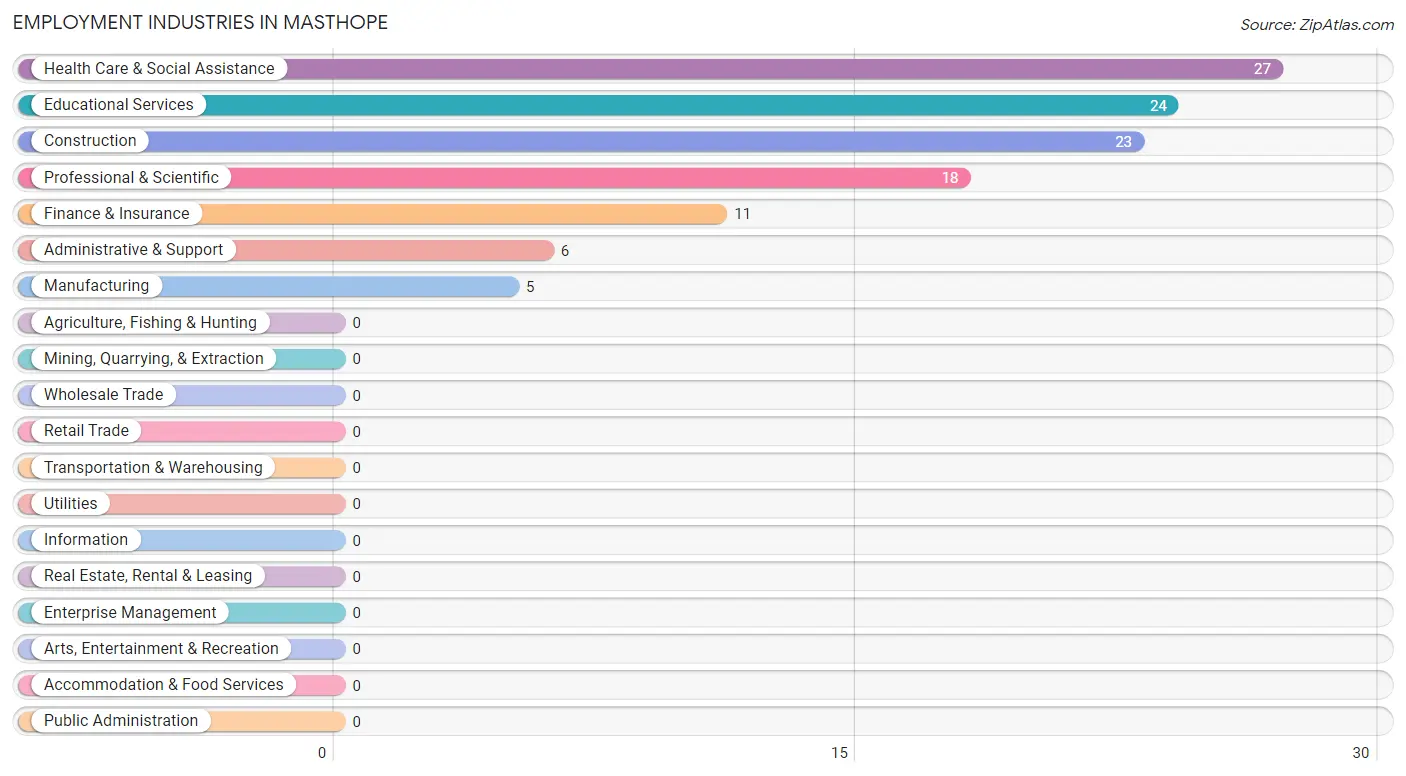
Employment Industries in Masthope
The major employment industries in Masthope include Health Care & Social Assistance (27 | 23.7%), Educational Services (24 | 21.0%), Construction (23 | 20.2%), Professional & Scientific (18 | 15.8%), and Finance & Insurance (11 | 9.7%).
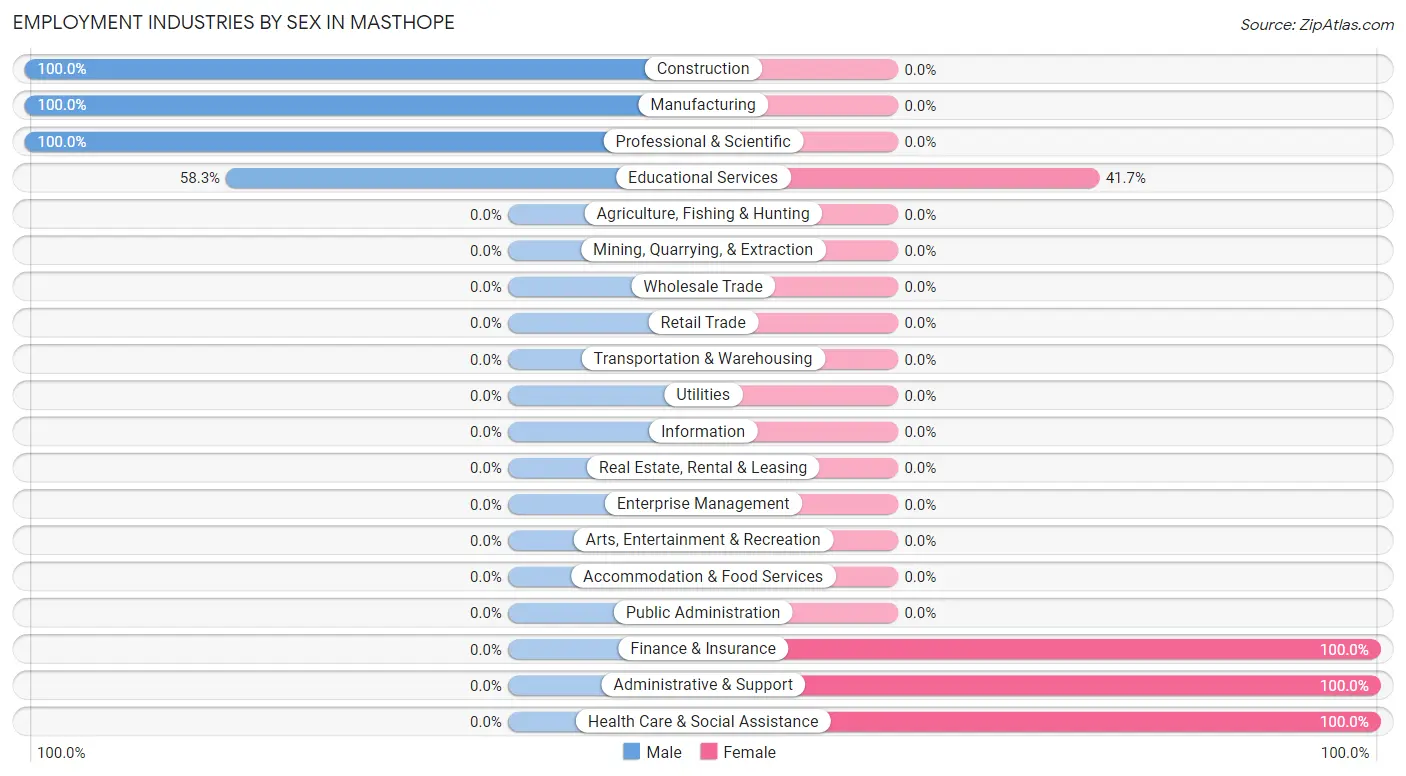
Employment Industries by Sex in Masthope
The Masthope industries that see more men than women are Construction (100.0%), Manufacturing (100.0%), and Professional & Scientific (100.0%), whereas the industries that tend to have a higher number of women are Finance & Insurance (100.0%), Administrative & Support (100.0%), and Health Care & Social Assistance (100.0%).
| Industry | Male | Female |
| Agriculture, Fishing & Hunting | 0 (0.0%) | 0 (0.0%) |
| Mining, Quarrying, & Extraction | 0 (0.0%) | 0 (0.0%) |
| Construction | 23 (100.0%) | 0 (0.0%) |
| Manufacturing | 5 (100.0%) | 0 (0.0%) |
| Wholesale Trade | 0 (0.0%) | 0 (0.0%) |
| Retail Trade | 0 (0.0%) | 0 (0.0%) |
| Transportation & Warehousing | 0 (0.0%) | 0 (0.0%) |
| Utilities | 0 (0.0%) | 0 (0.0%) |
| Information | 0 (0.0%) | 0 (0.0%) |
| Finance & Insurance | 0 (0.0%) | 11 (100.0%) |
| Real Estate, Rental & Leasing | 0 (0.0%) | 0 (0.0%) |
| Professional & Scientific | 18 (100.0%) | 0 (0.0%) |
| Enterprise Management | 0 (0.0%) | 0 (0.0%) |
| Administrative & Support | 0 (0.0%) | 6 (100.0%) |
| Educational Services | 14 (58.3%) | 10 (41.7%) |
| Health Care & Social Assistance | 0 (0.0%) | 27 (100.0%) |
| Arts, Entertainment & Recreation | 0 (0.0%) | 0 (0.0%) |
| Accommodation & Food Services | 0 (0.0%) | 0 (0.0%) |
| Public Administration | 0 (0.0%) | 0 (0.0%) |
| Total | 60 (52.6%) | 54 (47.4%) |
Education in Masthope
School Enrollment in Masthope
The most common levels of schooling among the 36 students in Masthope are college / undergraduate (13 | 36.1%), graduate / professional (13 | 36.1%), and elementary school (10 | 27.8%).
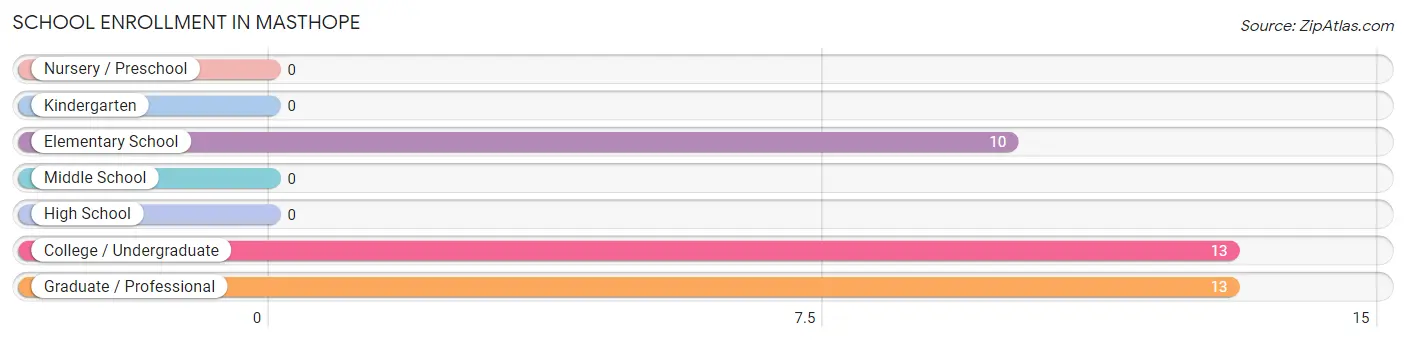
| School Level | # Students | % Students |
| Nursery / Preschool | 0 | 0.0% |
| Kindergarten | 0 | 0.0% |
| Elementary School | 10 | 27.8% |
| Middle School | 0 | 0.0% |
| High School | 0 | 0.0% |
| College / Undergraduate | 13 | 36.1% |
| Graduate / Professional | 13 | 36.1% |
| Total | 36 | 100.0% |
School Enrollment by Age by Funding Source in Masthope
Out of a total of 36 students who are enrolled in schools in Masthope, 10 (27.8%) attend a private institution, while the remaining 26 (72.2%) are enrolled in public schools. The age group of 10 to 14 year olds has the highest likelihood of being enrolled in private schools, with 10 (100.0% in the age bracket) enrolled. Conversely, the age group of 20 to 24 year olds has the lowest likelihood of being enrolled in a private school, with 13 (100.0% in the age bracket) attending a public institution.
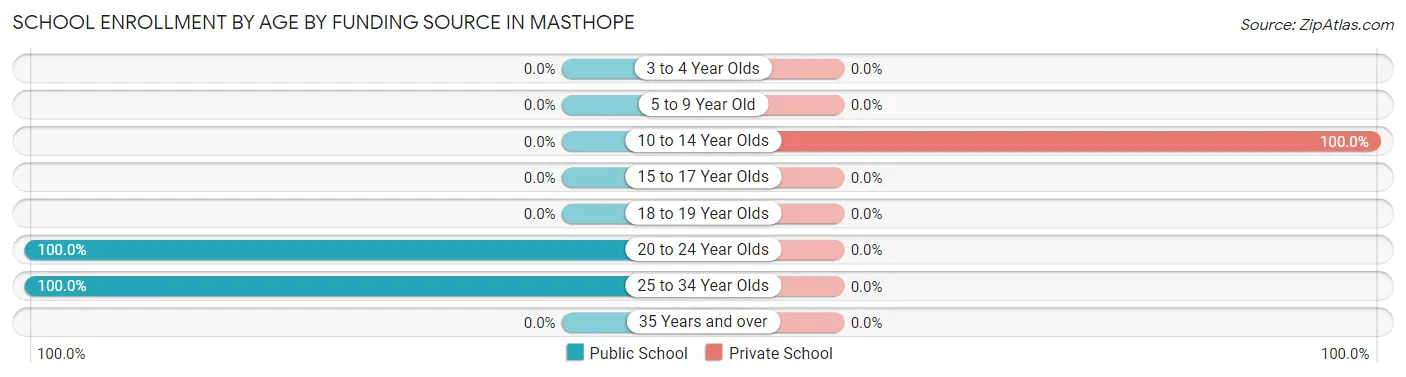
| Age Bracket | Public School | Private School |
| 3 to 4 Year Olds | 0 (0.0%) | 0 (0.0%) |
| 5 to 9 Year Old | 0 (0.0%) | 0 (0.0%) |
| 10 to 14 Year Olds | 0 (0.0%) | 10 (100.0%) |
| 15 to 17 Year Olds | 0 (0.0%) | 0 (0.0%) |
| 18 to 19 Year Olds | 0 (0.0%) | 0 (0.0%) |
| 20 to 24 Year Olds | 13 (100.0%) | 0 (0.0%) |
| 25 to 34 Year Olds | 13 (100.0%) | 0 (0.0%) |
| 35 Years and over | 0 (0.0%) | 0 (0.0%) |
| Total | 26 (72.2%) | 10 (27.8%) |
Educational Attainment by Field of Study in Masthope
Education (141 | 50.7%), social sciences (29 | 10.4%), science & technology (28 | 10.1%), psychology (20 | 7.2%), and bio, nature & agricultural (18 | 6.5%) are the most common fields of study among 278 individuals in Masthope who have obtained a bachelor's degree or higher.
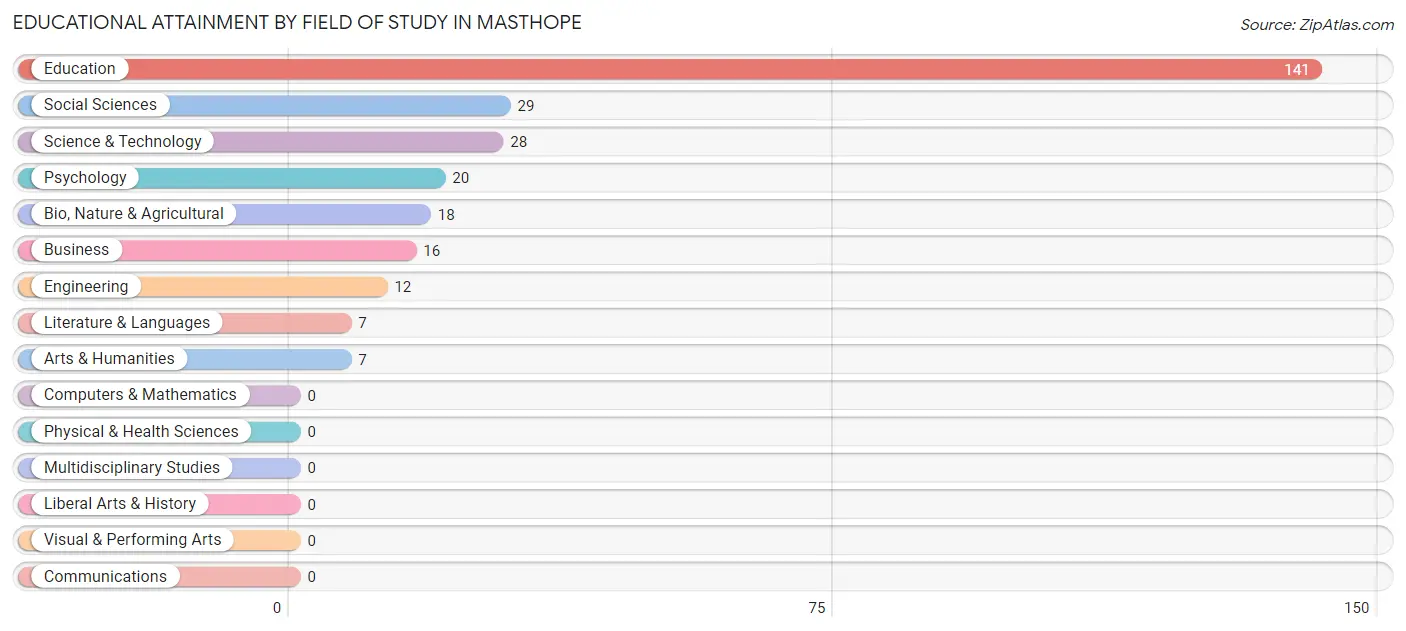
| Field of Study | # Graduates | % Graduates |
| Computers & Mathematics | 0 | 0.0% |
| Bio, Nature & Agricultural | 18 | 6.5% |
| Physical & Health Sciences | 0 | 0.0% |
| Psychology | 20 | 7.2% |
| Social Sciences | 29 | 10.4% |
| Engineering | 12 | 4.3% |
| Multidisciplinary Studies | 0 | 0.0% |
| Science & Technology | 28 | 10.1% |
| Business | 16 | 5.8% |
| Education | 141 | 50.7% |
| Literature & Languages | 7 | 2.5% |
| Liberal Arts & History | 0 | 0.0% |
| Visual & Performing Arts | 0 | 0.0% |
| Communications | 0 | 0.0% |
| Arts & Humanities | 7 | 2.5% |
| Total | 278 | 100.0% |
Transportation & Commute in Masthope
Vehicle Availability by Sex in Masthope
The most prevalent vehicle ownership categories in Masthope are males with 3 vehicles (23, accounting for 38.3%) and females with 3 vehicles (0, making up 42.6%).
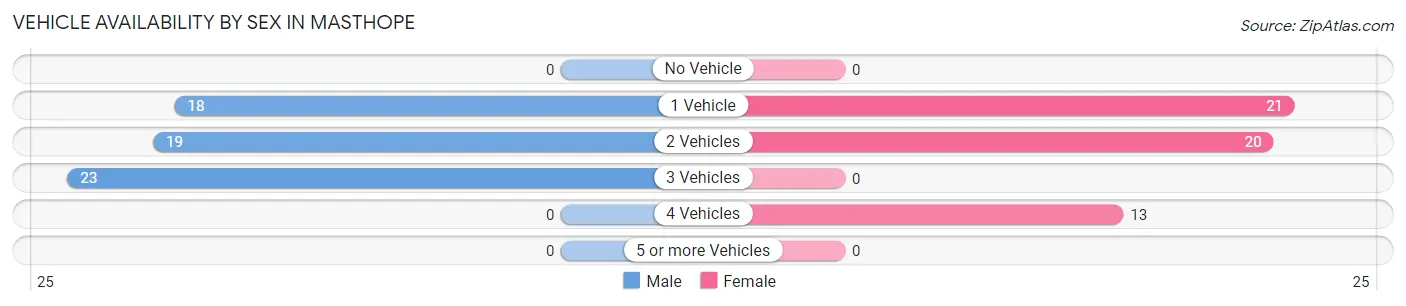
| Vehicles Available | Male | Female |
| No Vehicle | 0 (0.0%) | 0 (0.0%) |
| 1 Vehicle | 18 (30.0%) | 21 (38.9%) |
| 2 Vehicles | 19 (31.7%) | 20 (37.0%) |
| 3 Vehicles | 23 (38.3%) | 0 (0.0%) |
| 4 Vehicles | 0 (0.0%) | 13 (24.1%) |
| 5 or more Vehicles | 0 (0.0%) | 0 (0.0%) |
| Total | 60 (100.0%) | 54 (100.0%) |
Commute Time in Masthope
The most frequently occuring commute durations in Masthope are 5 to 9 minutes (55 commuters, 57.3%), 45 to 59 minutes (17 commuters, 17.7%), and 90 or more minutes (17 commuters, 17.7%).
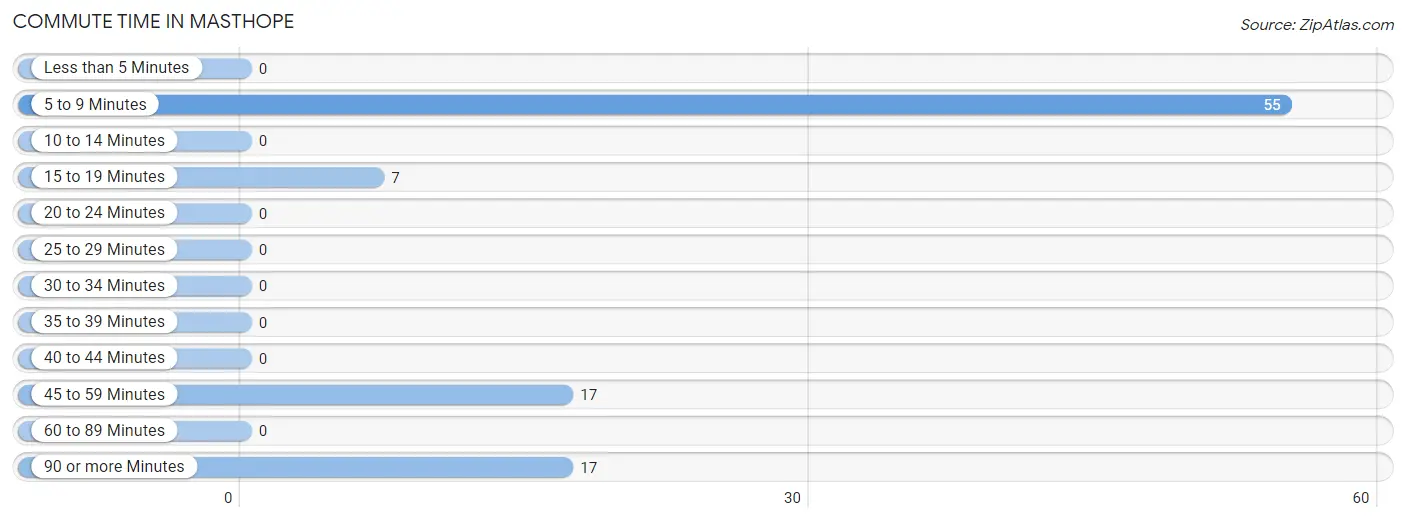
| Commute Time | # Commuters | % Commuters |
| Less than 5 Minutes | 0 | 0.0% |
| 5 to 9 Minutes | 55 | 57.3% |
| 10 to 14 Minutes | 0 | 0.0% |
| 15 to 19 Minutes | 7 | 7.3% |
| 20 to 24 Minutes | 0 | 0.0% |
| 25 to 29 Minutes | 0 | 0.0% |
| 30 to 34 Minutes | 0 | 0.0% |
| 35 to 39 Minutes | 0 | 0.0% |
| 40 to 44 Minutes | 0 | 0.0% |
| 45 to 59 Minutes | 17 | 17.7% |
| 60 to 89 Minutes | 0 | 0.0% |
| 90 or more Minutes | 17 | 17.7% |
Commute Time by Sex in Masthope
The most common commute times in Masthope are 5 to 9 minutes (30 commuters, 71.4%) for males and 5 to 9 minutes (25 commuters, 46.3%) for females.
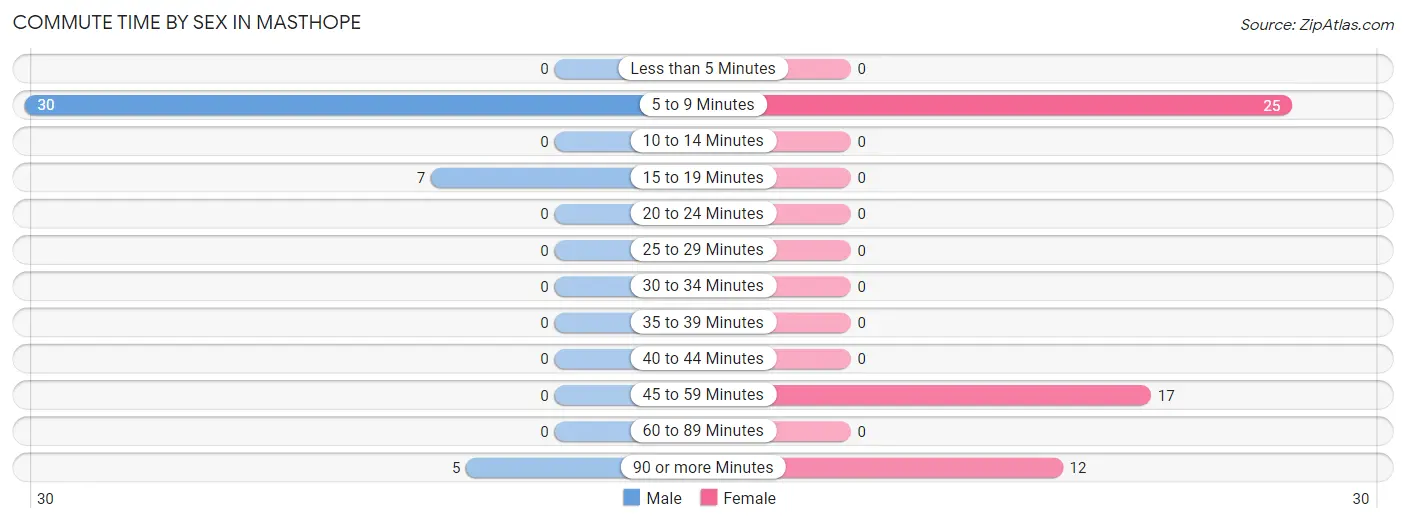
| Commute Time | Male | Female |
| Less than 5 Minutes | 0 (0.0%) | 0 (0.0%) |
| 5 to 9 Minutes | 30 (71.4%) | 25 (46.3%) |
| 10 to 14 Minutes | 0 (0.0%) | 0 (0.0%) |
| 15 to 19 Minutes | 7 (16.7%) | 0 (0.0%) |
| 20 to 24 Minutes | 0 (0.0%) | 0 (0.0%) |
| 25 to 29 Minutes | 0 (0.0%) | 0 (0.0%) |
| 30 to 34 Minutes | 0 (0.0%) | 0 (0.0%) |
| 35 to 39 Minutes | 0 (0.0%) | 0 (0.0%) |
| 40 to 44 Minutes | 0 (0.0%) | 0 (0.0%) |
| 45 to 59 Minutes | 0 (0.0%) | 17 (31.5%) |
| 60 to 89 Minutes | 0 (0.0%) | 0 (0.0%) |
| 90 or more Minutes | 5 (11.9%) | 12 (22.2%) |
Time of Departure to Work by Sex in Masthope
The most frequent times of departure to work in Masthope are 9:00 AM to 9:59 AM (23, 54.8%) for males and 7:30 AM to 7:59 AM (11, 20.4%) for females.
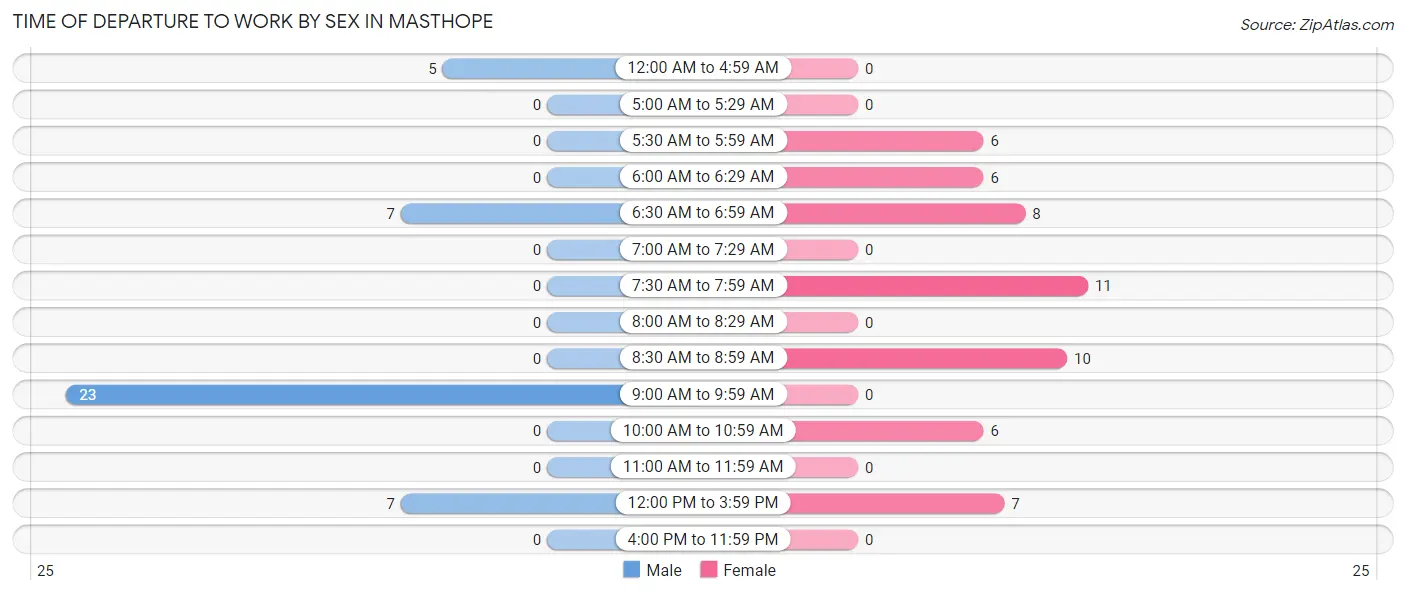
| Time of Departure | Male | Female |
| 12:00 AM to 4:59 AM | 5 (11.9%) | 0 (0.0%) |
| 5:00 AM to 5:29 AM | 0 (0.0%) | 0 (0.0%) |
| 5:30 AM to 5:59 AM | 0 (0.0%) | 6 (11.1%) |
| 6:00 AM to 6:29 AM | 0 (0.0%) | 6 (11.1%) |
| 6:30 AM to 6:59 AM | 7 (16.7%) | 8 (14.8%) |
| 7:00 AM to 7:29 AM | 0 (0.0%) | 0 (0.0%) |
| 7:30 AM to 7:59 AM | 0 (0.0%) | 11 (20.4%) |
| 8:00 AM to 8:29 AM | 0 (0.0%) | 0 (0.0%) |
| 8:30 AM to 8:59 AM | 0 (0.0%) | 10 (18.5%) |
| 9:00 AM to 9:59 AM | 23 (54.8%) | 0 (0.0%) |
| 10:00 AM to 10:59 AM | 0 (0.0%) | 6 (11.1%) |
| 11:00 AM to 11:59 AM | 0 (0.0%) | 0 (0.0%) |
| 12:00 PM to 3:59 PM | 7 (16.7%) | 7 (13.0%) |
| 4:00 PM to 11:59 PM | 0 (0.0%) | 0 (0.0%) |
| Total | 42 (100.0%) | 54 (100.0%) |
Housing Occupancy in Masthope
Occupancy by Ownership in Masthope
Of the total 297 dwellings in Masthope, owner-occupied units account for 297 (100.0%), while renter-occupied units make up 0 (0.0%).
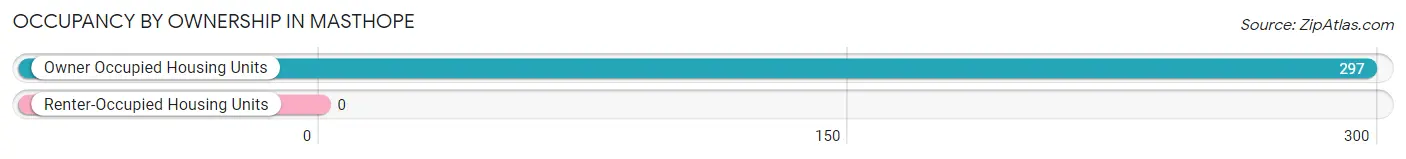
| Occupancy | # Housing Units | % Housing Units |
| Owner Occupied Housing Units | 297 | 100.0% |
| Renter-Occupied Housing Units | 0 | 0.0% |
| Total Occupied Housing Units | 297 | 100.0% |
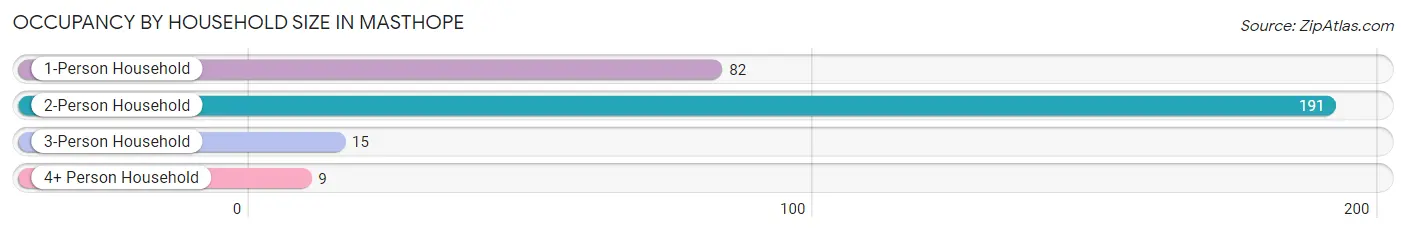
Occupancy by Household Size in Masthope
| Household Size | # Housing Units | % Housing Units |
| 1-Person Household | 82 | 27.6% |
| 2-Person Household | 191 | 64.3% |
| 3-Person Household | 15 | 5.1% |
| 4+ Person Household | 9 | 3.0% |
| Total Housing Units | 297 | 100.0% |
Occupancy by Ownership by Household Size in Masthope
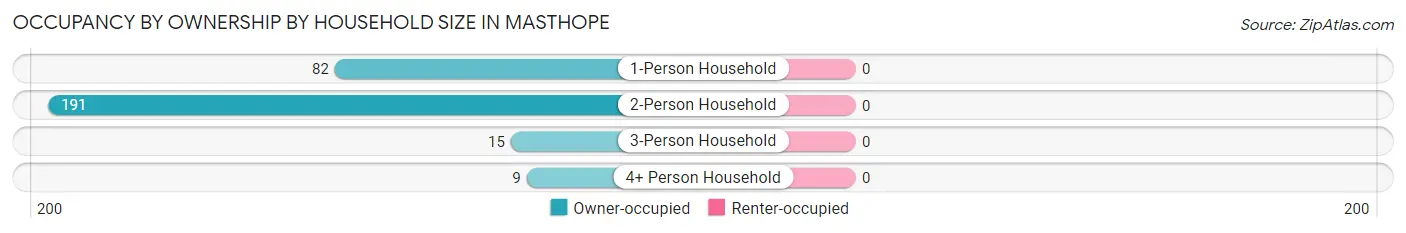
| Household Size | Owner-occupied | Renter-occupied |
| 1-Person Household | 82 (100.0%) | 0 (0.0%) |
| 2-Person Household | 191 (100.0%) | 0 (0.0%) |
| 3-Person Household | 15 (100.0%) | 0 (0.0%) |
| 4+ Person Household | 9 (100.0%) | 0 (0.0%) |
| Total Housing Units | 297 (100.0%) | 0 (0.0%) |
Occupancy by Educational Attainment in Masthope
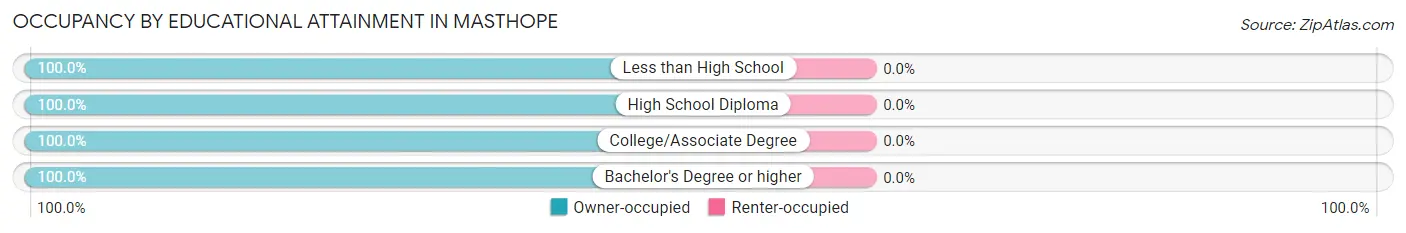
| Household Size | Owner-occupied | Renter-occupied |
| Less than High School | 17 (100.0%) | 0 (0.0%) |
| High School Diploma | 61 (100.0%) | 0 (0.0%) |
| College/Associate Degree | 55 (100.0%) | 0 (0.0%) |
| Bachelor's Degree or higher | 164 (100.0%) | 0 (0.0%) |
Occupancy by Age of Householder in Masthope
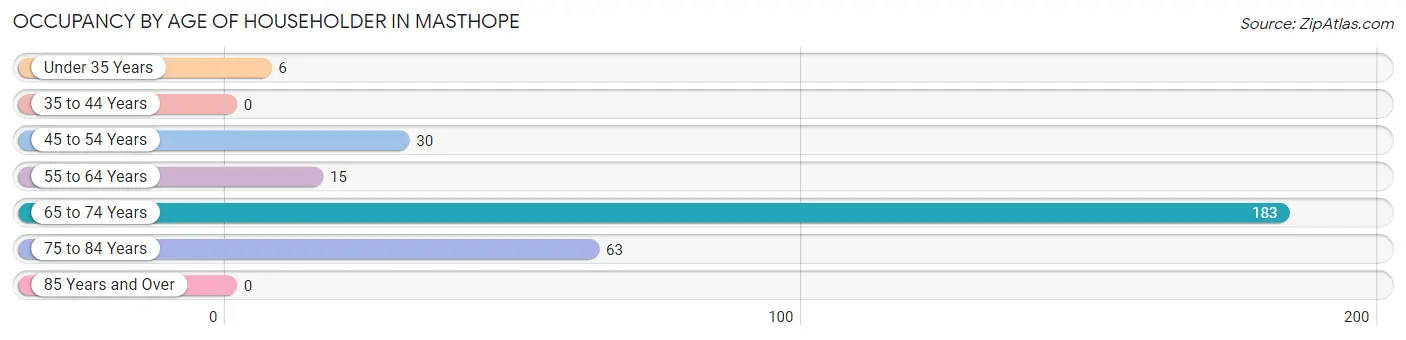
| Age Bracket | # Households | % Households |
| Under 35 Years | 6 | 2.0% |
| 35 to 44 Years | 0 | 0.0% |
| 45 to 54 Years | 30 | 10.1% |
| 55 to 64 Years | 15 | 5.1% |
| 65 to 74 Years | 183 | 61.6% |
| 75 to 84 Years | 63 | 21.2% |
| 85 Years and Over | 0 | 0.0% |
| Total | 297 | 100.0% |
Housing Finances in Masthope
Median Income by Occupancy in Masthope
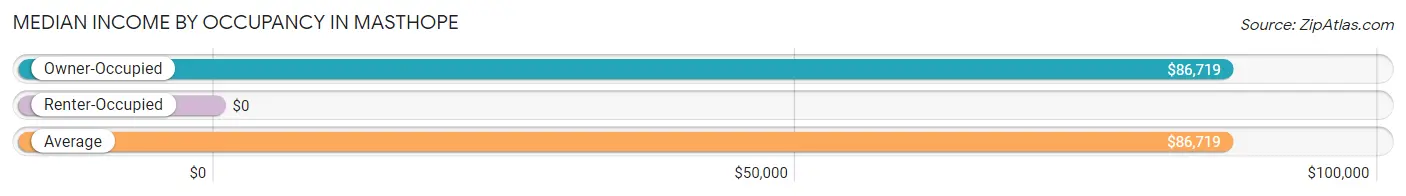
| Occupancy Type | # Households | Median Income |
| Owner-Occupied | 297 (100.0%) | $86,719 |
| Renter-Occupied | 0 (0.0%) | $0 |
| Average | 297 (100.0%) | $86,719 |
Occupancy by Householder Income Bracket in Masthope
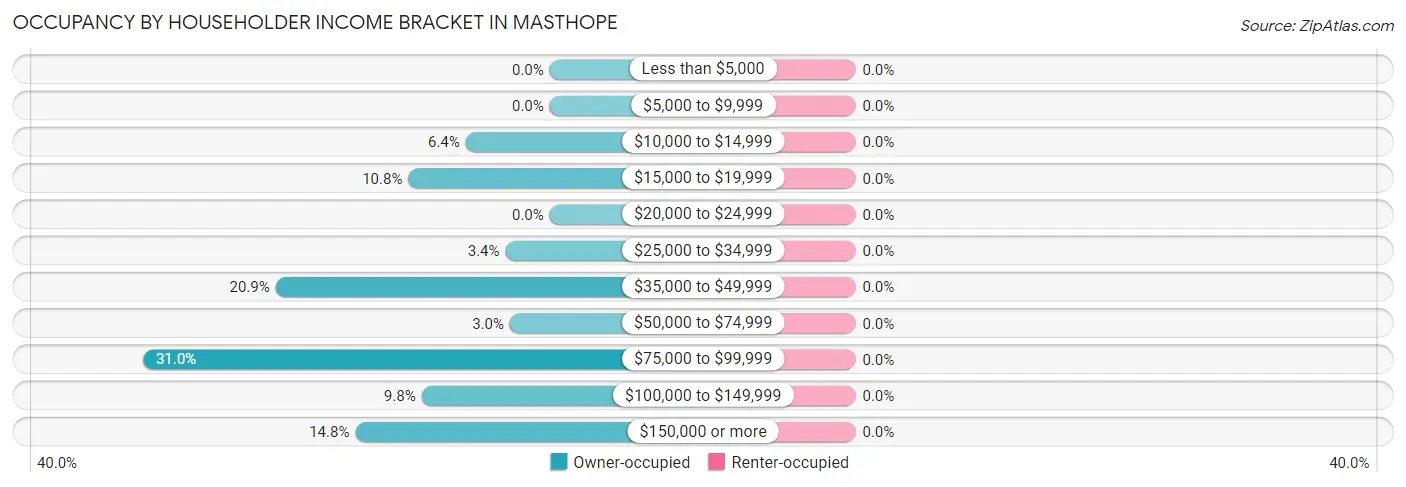
| Income Bracket | Owner-occupied | Renter-occupied |
| Less than $5,000 | 0 (0.0%) | 0 (0.0%) |
| $5,000 to $9,999 | 0 (0.0%) | 0 (0.0%) |
| $10,000 to $14,999 | 19 (6.4%) | 0 (0.0%) |
| $15,000 to $19,999 | 32 (10.8%) | 0 (0.0%) |
| $20,000 to $24,999 | 0 (0.0%) | 0 (0.0%) |
| $25,000 to $34,999 | 10 (3.4%) | 0 (0.0%) |
| $35,000 to $49,999 | 62 (20.9%) | 0 (0.0%) |
| $50,000 to $74,999 | 9 (3.0%) | 0 (0.0%) |
| $75,000 to $99,999 | 92 (31.0%) | 0 (0.0%) |
| $100,000 to $149,999 | 29 (9.8%) | 0 (0.0%) |
| $150,000 or more | 44 (14.8%) | 0 (0.0%) |
| Total | 297 (100.0%) | 0 (0.0%) |
Monthly Housing Cost Tiers in Masthope
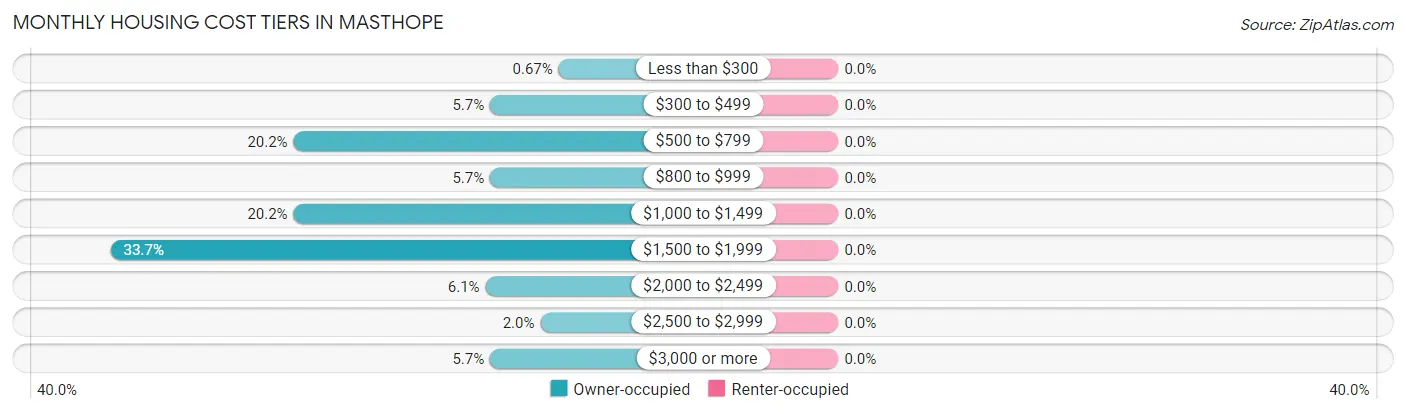
| Monthly Cost | Owner-occupied | Renter-occupied |
| Less than $300 | 2 (0.7%) | 0 (0.0%) |
| $300 to $499 | 17 (5.7%) | 0 (0.0%) |
| $500 to $799 | 60 (20.2%) | 0 (0.0%) |
| $800 to $999 | 17 (5.7%) | 0 (0.0%) |
| $1,000 to $1,499 | 60 (20.2%) | 0 (0.0%) |
| $1,500 to $1,999 | 100 (33.7%) | 0 (0.0%) |
| $2,000 to $2,499 | 18 (6.1%) | 0 (0.0%) |
| $2,500 to $2,999 | 6 (2.0%) | 0 (0.0%) |
| $3,000 or more | 17 (5.7%) | 0 (0.0%) |
| Total | 297 (100.0%) | 0 (0.0%) |
Physical Housing Characteristics in Masthope
Housing Structures in Masthope
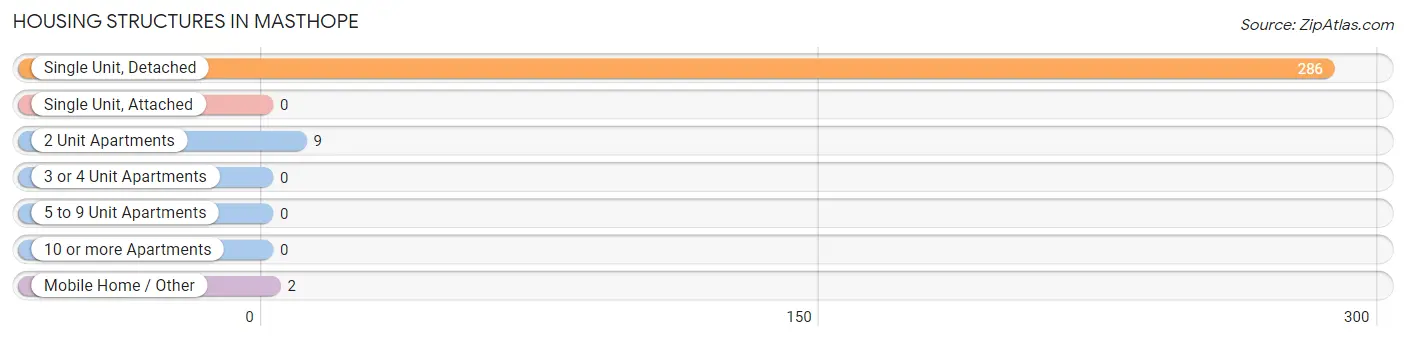
| Structure Type | # Housing Units | % Housing Units |
| Single Unit, Detached | 286 | 96.3% |
| Single Unit, Attached | 0 | 0.0% |
| 2 Unit Apartments | 9 | 3.0% |
| 3 or 4 Unit Apartments | 0 | 0.0% |
| 5 to 9 Unit Apartments | 0 | 0.0% |
| 10 or more Apartments | 0 | 0.0% |
| Mobile Home / Other | 2 | 0.7% |
| Total | 297 | 100.0% |
Housing Structures by Occupancy in Masthope
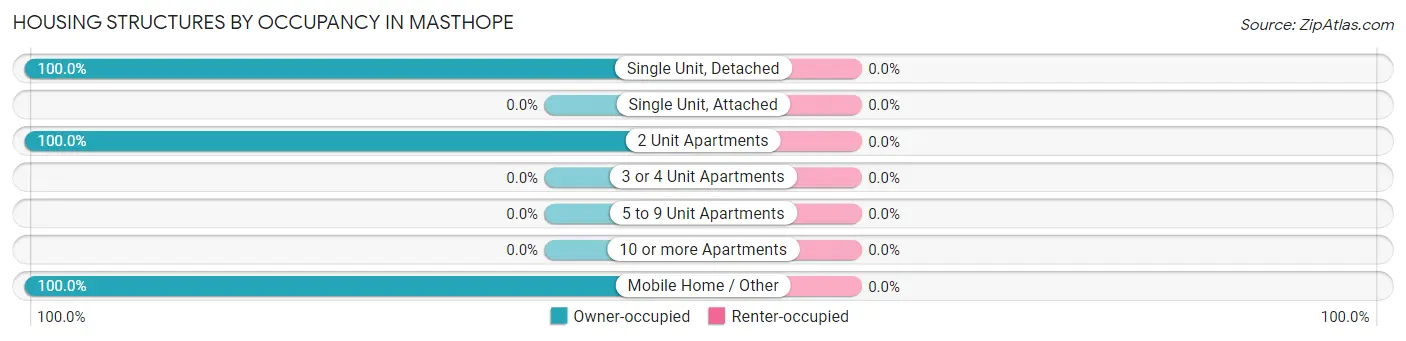
| Structure Type | Owner-occupied | Renter-occupied |
| Single Unit, Detached | 286 (100.0%) | 0 (0.0%) |
| Single Unit, Attached | 0 (0.0%) | 0 (0.0%) |
| 2 Unit Apartments | 9 (100.0%) | 0 (0.0%) |
| 3 or 4 Unit Apartments | 0 (0.0%) | 0 (0.0%) |
| 5 to 9 Unit Apartments | 0 (0.0%) | 0 (0.0%) |
| 10 or more Apartments | 0 (0.0%) | 0 (0.0%) |
| Mobile Home / Other | 2 (100.0%) | 0 (0.0%) |
| Total | 297 (100.0%) | 0 (0.0%) |
Housing Structures by Number of Rooms in Masthope
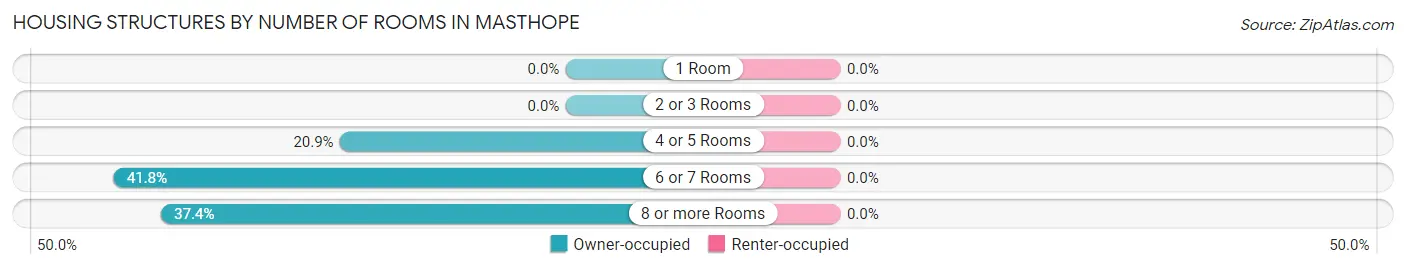
| Number of Rooms | Owner-occupied | Renter-occupied |
| 1 Room | 0 (0.0%) | 0 (0.0%) |
| 2 or 3 Rooms | 0 (0.0%) | 0 (0.0%) |
| 4 or 5 Rooms | 62 (20.9%) | 0 (0.0%) |
| 6 or 7 Rooms | 124 (41.7%) | 0 (0.0%) |
| 8 or more Rooms | 111 (37.4%) | 0 (0.0%) |
| Total | 297 (100.0%) | 0 (0.0%) |
Housing Structure by Heating Type in Masthope
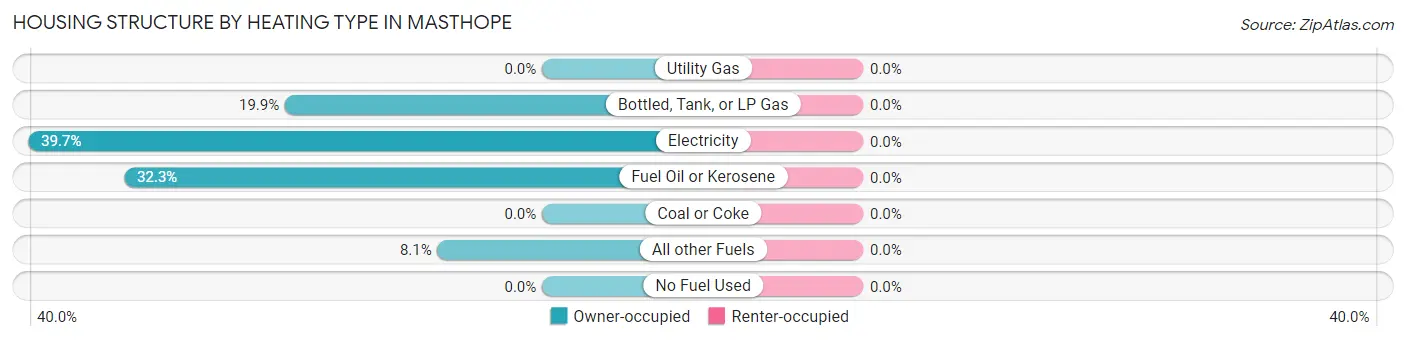
| Heating Type | Owner-occupied | Renter-occupied |
| Utility Gas | 0 (0.0%) | 0 (0.0%) |
| Bottled, Tank, or LP Gas | 59 (19.9%) | 0 (0.0%) |
| Electricity | 118 (39.7%) | 0 (0.0%) |
| Fuel Oil or Kerosene | 96 (32.3%) | 0 (0.0%) |
| Coal or Coke | 0 (0.0%) | 0 (0.0%) |
| All other Fuels | 24 (8.1%) | 0 (0.0%) |
| No Fuel Used | 0 (0.0%) | 0 (0.0%) |
| Total | 297 (100.0%) | 0 (0.0%) |
Household Vehicle Usage in Masthope
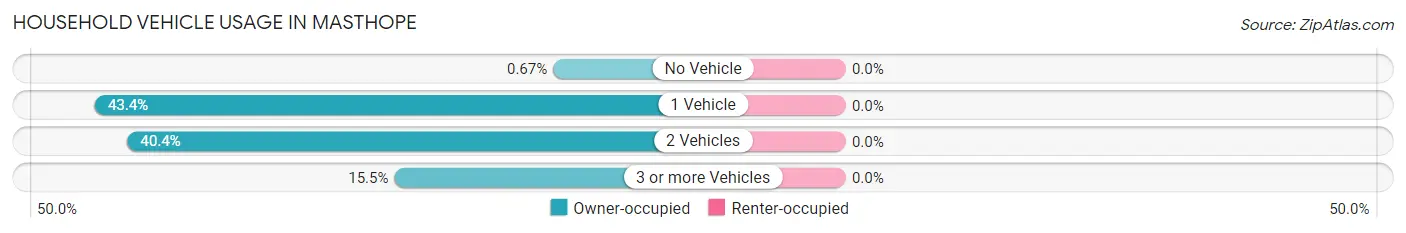
| Vehicles per Household | Owner-occupied | Renter-occupied |
| No Vehicle | 2 (0.7%) | 0 (0.0%) |
| 1 Vehicle | 129 (43.4%) | 0 (0.0%) |
| 2 Vehicles | 120 (40.4%) | 0 (0.0%) |
| 3 or more Vehicles | 46 (15.5%) | 0 (0.0%) |
| Total | 297 (100.0%) | 0 (0.0%) |
Real Estate & Mortgages in Masthope
Real Estate and Mortgage Overview in Masthope
| Characteristic | Without Mortgage | With Mortgage |
| Housing Units | 120 | 177 |
| Median Property Value | $243,100 | $305,700 |
| Median Household Income | $36,406 | $44 |
| Monthly Housing Costs | $754 | $17 |
| Real Estate Taxes | $3,689 | $0 |
Property Value by Mortgage Status in Masthope
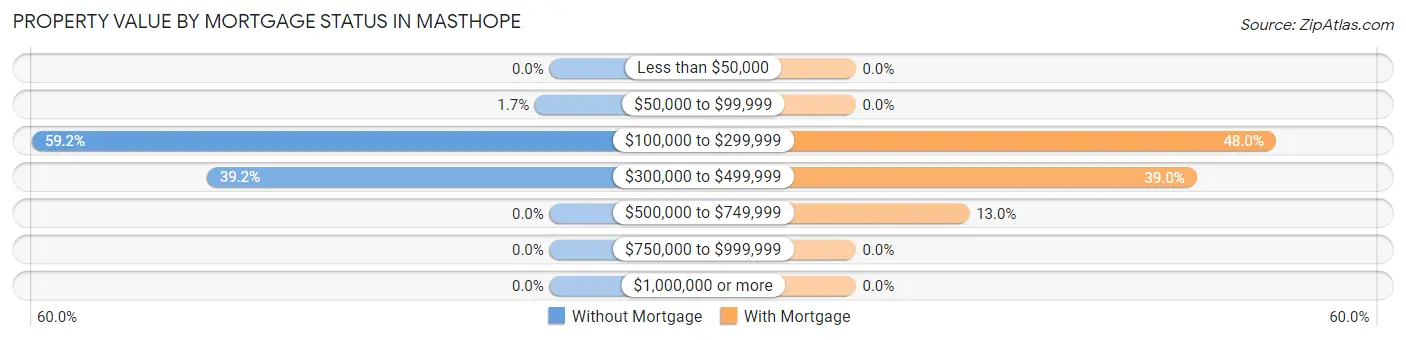
| Property Value | Without Mortgage | With Mortgage |
| Less than $50,000 | 0 (0.0%) | 0 (0.0%) |
| $50,000 to $99,999 | 2 (1.7%) | 0 (0.0%) |
| $100,000 to $299,999 | 71 (59.2%) | 85 (48.0%) |
| $300,000 to $499,999 | 47 (39.2%) | 69 (39.0%) |
| $500,000 to $749,999 | 0 (0.0%) | 23 (13.0%) |
| $750,000 to $999,999 | 0 (0.0%) | 0 (0.0%) |
| $1,000,000 or more | 0 (0.0%) | 0 (0.0%) |
| Total | 120 (100.0%) | 177 (100.0%) |
Household Income by Mortgage Status in Masthope
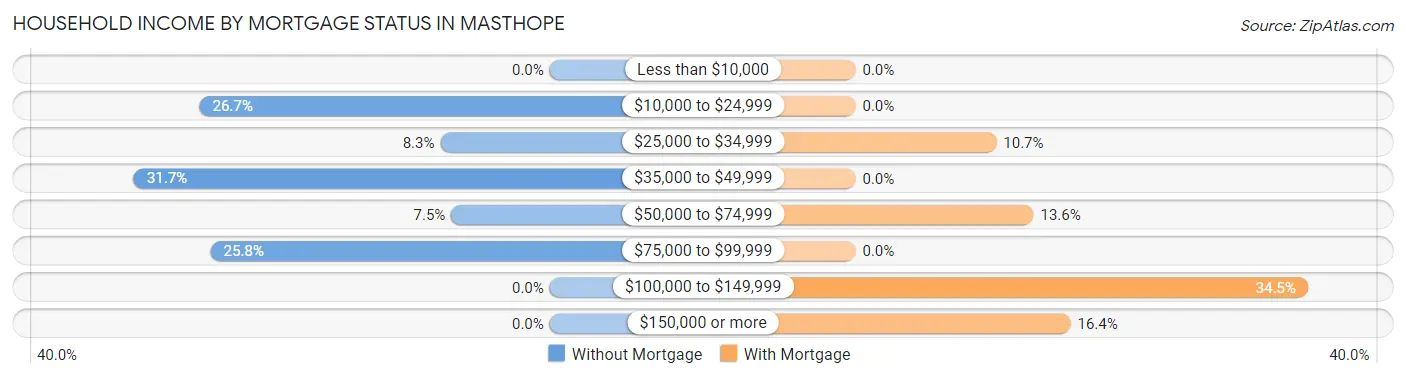
| Household Income | Without Mortgage | With Mortgage |
| Less than $10,000 | 0 (0.0%) | 0 (0.0%) |
| $10,000 to $24,999 | 32 (26.7%) | 0 (0.0%) |
| $25,000 to $34,999 | 10 (8.3%) | 19 (10.7%) |
| $35,000 to $49,999 | 38 (31.7%) | 0 (0.0%) |
| $50,000 to $74,999 | 9 (7.5%) | 24 (13.6%) |
| $75,000 to $99,999 | 31 (25.8%) | 0 (0.0%) |
| $100,000 to $149,999 | 0 (0.0%) | 61 (34.5%) |
| $150,000 or more | 0 (0.0%) | 29 (16.4%) |
| Total | 120 (100.0%) | 177 (100.0%) |
Property Value to Household Income Ratio in Masthope
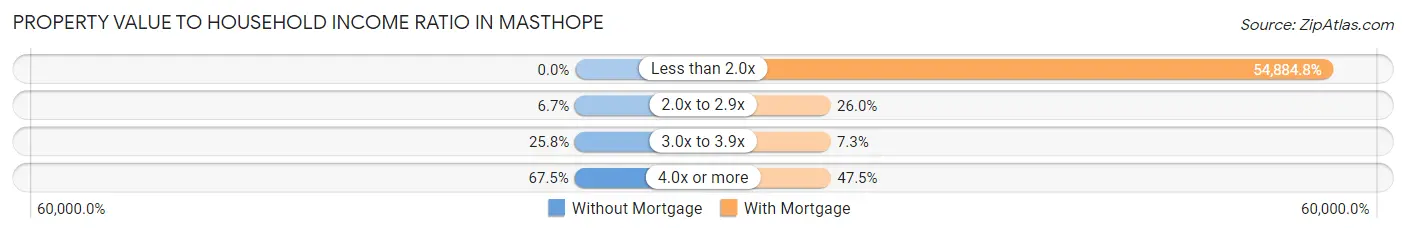
| Value-to-Income Ratio | Without Mortgage | With Mortgage |
| Less than 2.0x | 0 (0.0%) | 97,146 (54,884.7%) |
| 2.0x to 2.9x | 8 (6.7%) | 46 (26.0%) |
| 3.0x to 3.9x | 31 (25.8%) | 13 (7.3%) |
| 4.0x or more | 81 (67.5%) | 84 (47.5%) |
| Total | 120 (100.0%) | 177 (100.0%) |
Real Estate Taxes by Mortgage Status in Masthope
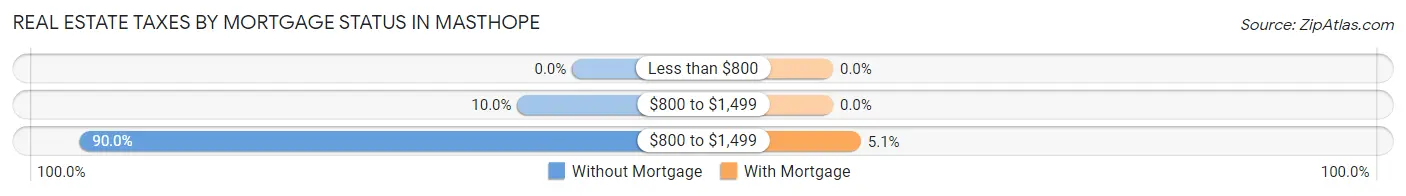
| Property Taxes | Without Mortgage | With Mortgage |
| Less than $800 | 0 (0.0%) | 0 (0.0%) |
| $800 to $1,499 | 12 (10.0%) | 0 (0.0%) |
| $800 to $1,499 | 108 (90.0%) | 9 (5.1%) |
| Total | 120 (100.0%) | 177 (100.0%) |
Health & Disability in Masthope
Health Insurance Coverage by Age in Masthope
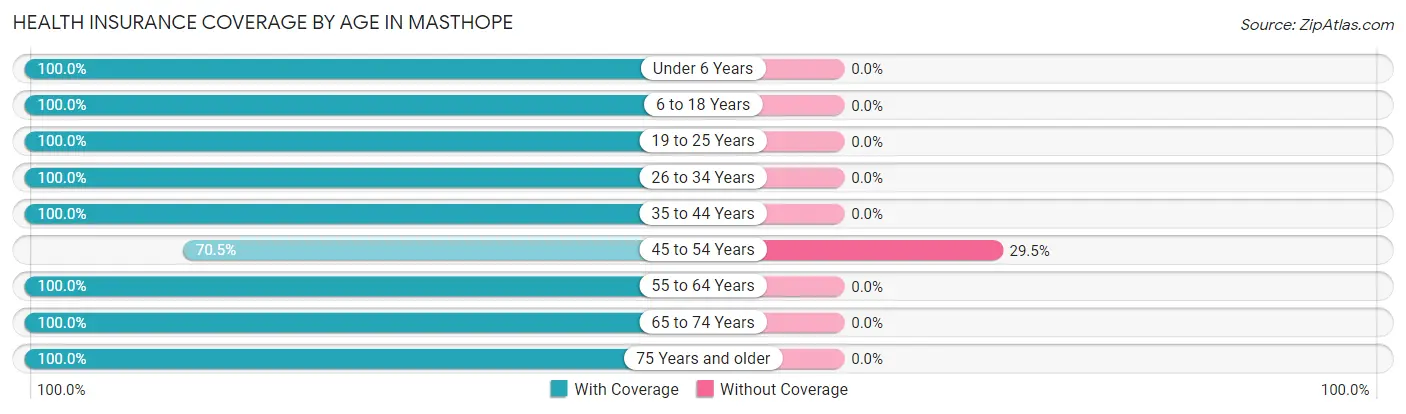
| Age Bracket | With Coverage | Without Coverage |
| Under 6 Years | 5 (100.0%) | 0 (0.0%) |
| 6 to 18 Years | 20 (100.0%) | 0 (0.0%) |
| 19 to 25 Years | 35 (100.0%) | 0 (0.0%) |
| 26 to 34 Years | 13 (100.0%) | 0 (0.0%) |
| 35 to 44 Years | 13 (100.0%) | 0 (0.0%) |
| 45 to 54 Years | 43 (70.5%) | 18 (29.5%) |
| 55 to 64 Years | 73 (100.0%) | 0 (0.0%) |
| 65 to 74 Years | 295 (100.0%) | 0 (0.0%) |
| 75 Years and older | 82 (100.0%) | 0 (0.0%) |
| Total | 579 (97.0%) | 18 (3.0%) |
Health Insurance Coverage by Citizenship Status in Masthope
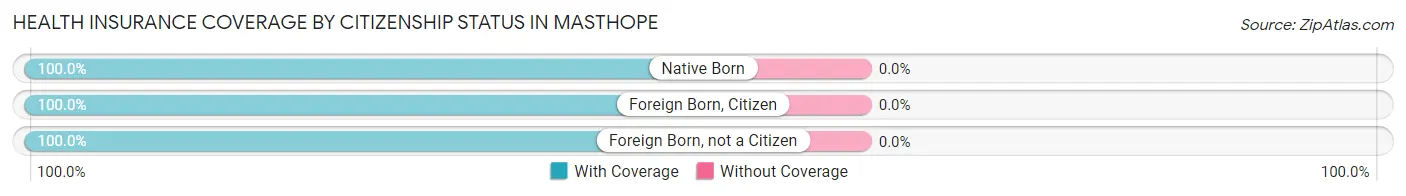
| Citizenship Status | With Coverage | Without Coverage |
| Native Born | 5 (100.0%) | 0 (0.0%) |
| Foreign Born, Citizen | 20 (100.0%) | 0 (0.0%) |
| Foreign Born, not a Citizen | 35 (100.0%) | 0 (0.0%) |
Health Insurance Coverage by Household Income in Masthope
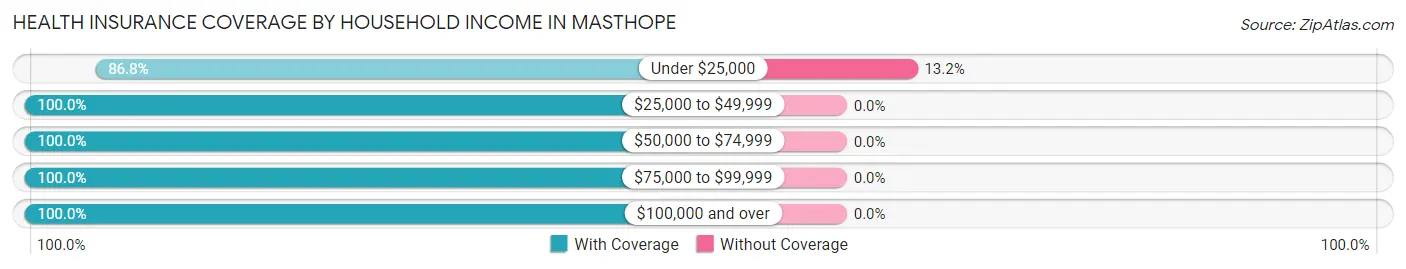
| Household Income | With Coverage | Without Coverage |
| Under $25,000 | 118 (86.8%) | 18 (13.2%) |
| $25,000 to $49,999 | 100 (100.0%) | 0 (0.0%) |
| $50,000 to $74,999 | 9 (100.0%) | 0 (0.0%) |
| $75,000 to $99,999 | 188 (100.0%) | 0 (0.0%) |
| $100,000 and over | 164 (100.0%) | 0 (0.0%) |
Public vs Private Health Insurance Coverage by Age in Masthope
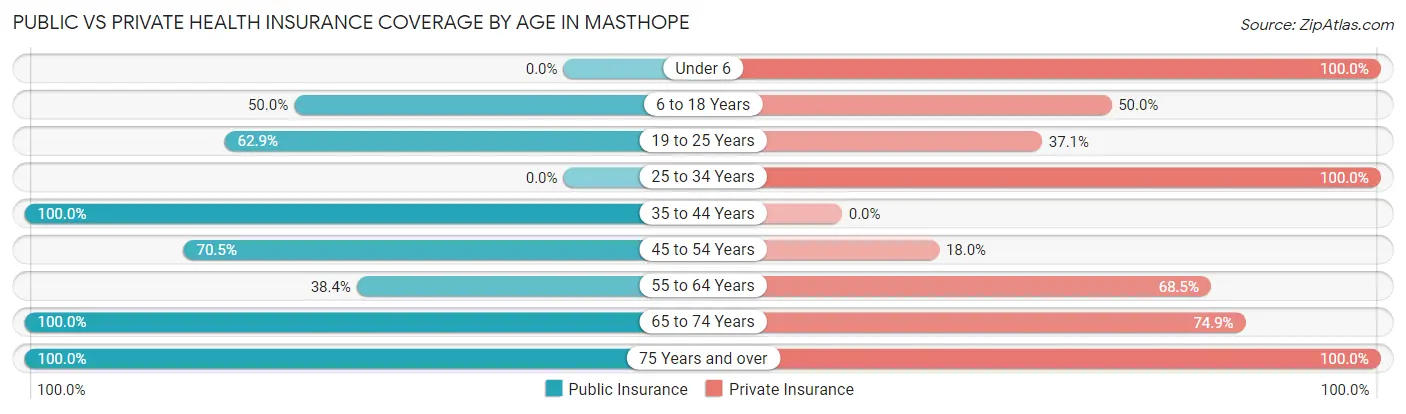
| Age Bracket | Public Insurance | Private Insurance |
| Under 6 | 0 (0.0%) | 5 (100.0%) |
| 6 to 18 Years | 10 (50.0%) | 10 (50.0%) |
| 19 to 25 Years | 22 (62.9%) | 13 (37.1%) |
| 25 to 34 Years | 0 (0.0%) | 13 (100.0%) |
| 35 to 44 Years | 13 (100.0%) | 0 (0.0%) |
| 45 to 54 Years | 43 (70.5%) | 11 (18.0%) |
| 55 to 64 Years | 28 (38.4%) | 50 (68.5%) |
| 65 to 74 Years | 295 (100.0%) | 221 (74.9%) |
| 75 Years and over | 82 (100.0%) | 82 (100.0%) |
| Total | 493 (82.6%) | 405 (67.8%) |
Disability Status by Sex by Age in Masthope
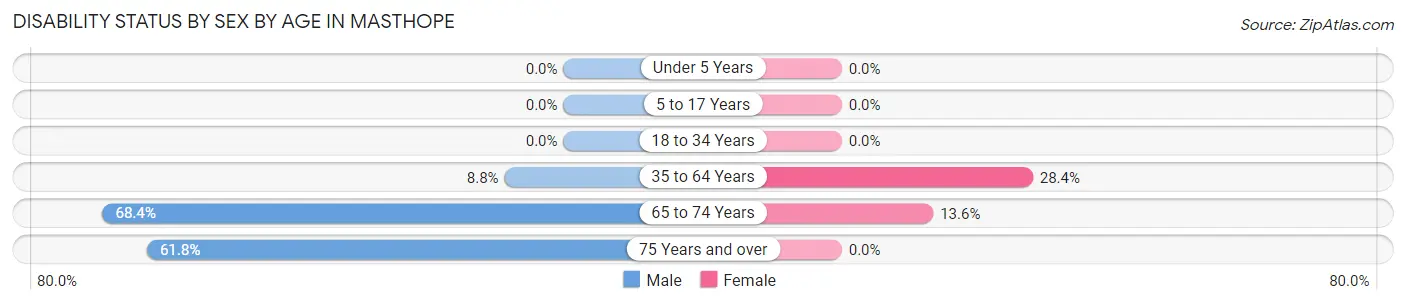
| Age Bracket | Male | Female |
| Under 5 Years | 0 (0.0%) | 0 (0.0%) |
| 5 to 17 Years | 0 (0.0%) | 0 (0.0%) |
| 18 to 34 Years | 0 (0.0%) | 0 (0.0%) |
| 35 to 64 Years | 7 (8.7%) | 19 (28.4%) |
| 65 to 74 Years | 91 (68.4%) | 22 (13.6%) |
| 75 Years and over | 34 (61.8%) | 0 (0.0%) |
Disability Class by Sex by Age in Masthope
Disability Class: Hearing Difficulty
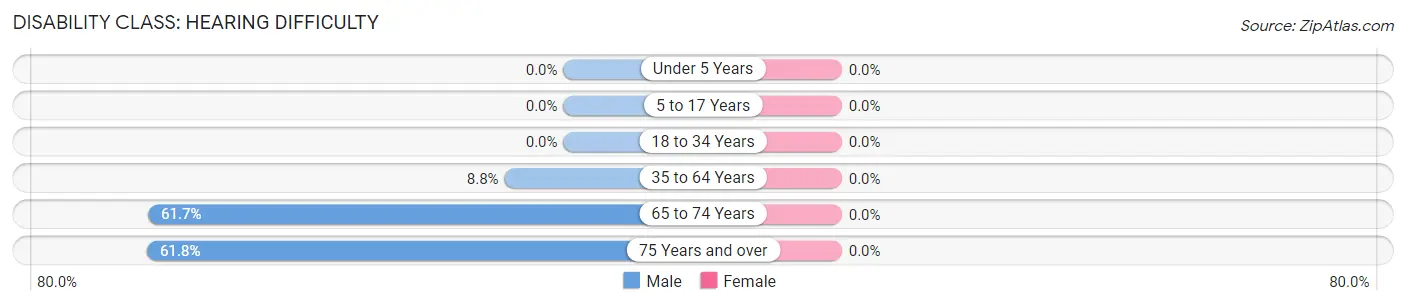
| Age Bracket | Male | Female |
| Under 5 Years | 0 (0.0%) | 0 (0.0%) |
| 5 to 17 Years | 0 (0.0%) | 0 (0.0%) |
| 18 to 34 Years | 0 (0.0%) | 0 (0.0%) |
| 35 to 64 Years | 7 (8.7%) | 0 (0.0%) |
| 65 to 74 Years | 82 (61.7%) | 0 (0.0%) |
| 75 Years and over | 34 (61.8%) | 0 (0.0%) |
Disability Class: Vision Difficulty
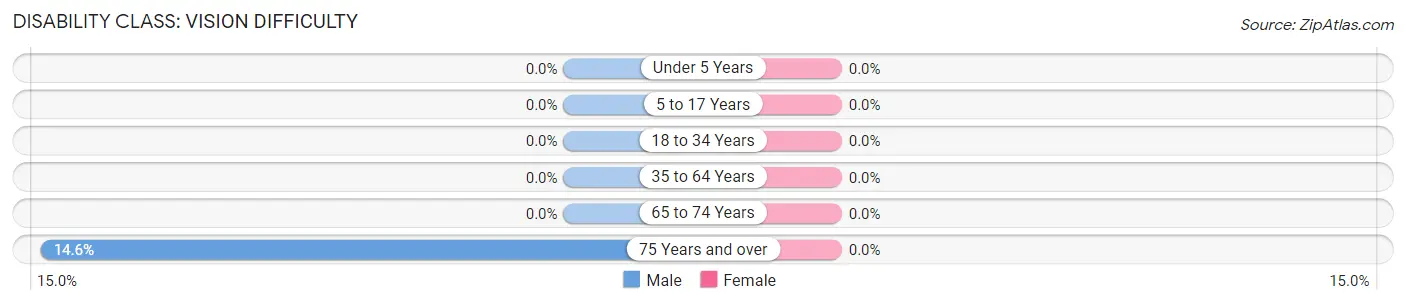
| Age Bracket | Male | Female |
| Under 5 Years | 0 (0.0%) | 0 (0.0%) |
| 5 to 17 Years | 0 (0.0%) | 0 (0.0%) |
| 18 to 34 Years | 0 (0.0%) | 0 (0.0%) |
| 35 to 64 Years | 0 (0.0%) | 0 (0.0%) |
| 65 to 74 Years | 0 (0.0%) | 0 (0.0%) |
| 75 Years and over | 8 (14.5%) | 0 (0.0%) |
Disability Class: Cognitive Difficulty
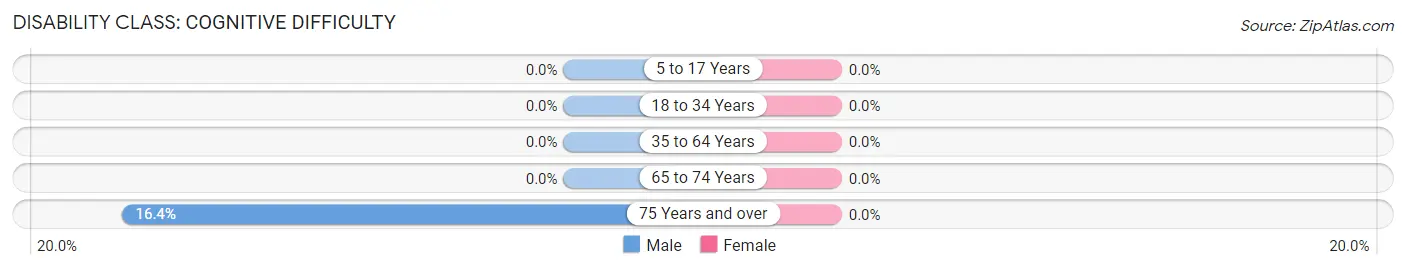
| Age Bracket | Male | Female |
| 5 to 17 Years | 0 (0.0%) | 0 (0.0%) |
| 18 to 34 Years | 0 (0.0%) | 0 (0.0%) |
| 35 to 64 Years | 0 (0.0%) | 0 (0.0%) |
| 65 to 74 Years | 0 (0.0%) | 0 (0.0%) |
| 75 Years and over | 9 (16.4%) | 0 (0.0%) |
Disability Class: Ambulatory Difficulty
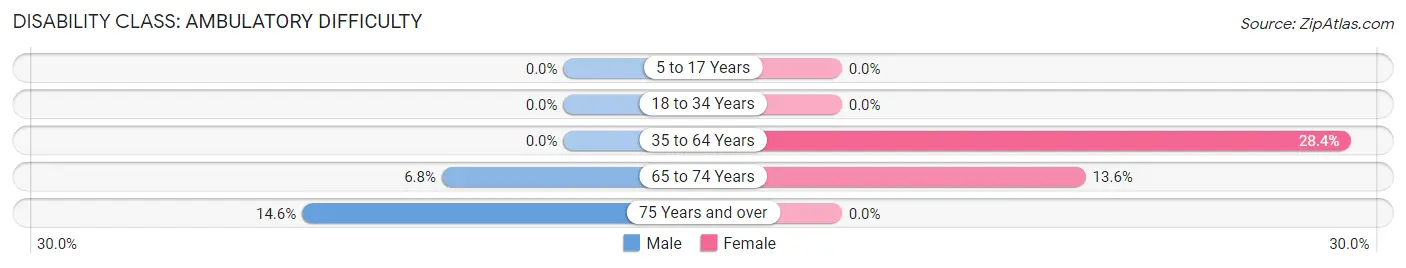
| Age Bracket | Male | Female |
| 5 to 17 Years | 0 (0.0%) | 0 (0.0%) |
| 18 to 34 Years | 0 (0.0%) | 0 (0.0%) |
| 35 to 64 Years | 0 (0.0%) | 19 (28.4%) |
| 65 to 74 Years | 9 (6.8%) | 22 (13.6%) |
| 75 Years and over | 8 (14.5%) | 0 (0.0%) |
Disability Class: Self-Care Difficulty
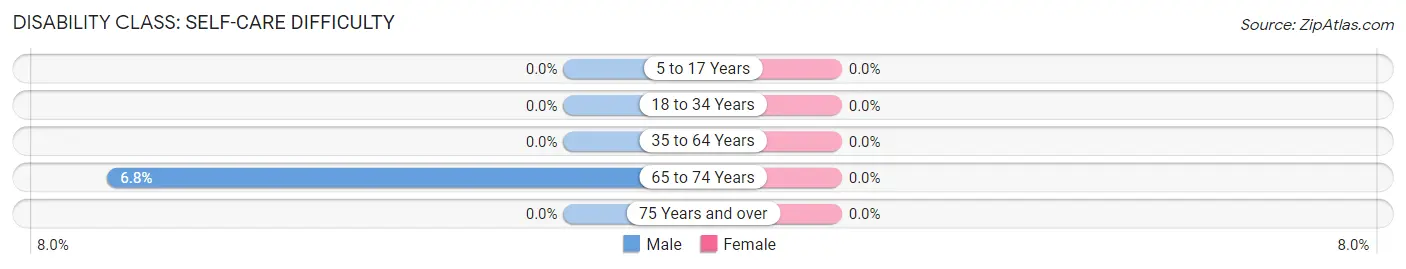
| Age Bracket | Male | Female |
| 5 to 17 Years | 0 (0.0%) | 0 (0.0%) |
| 18 to 34 Years | 0 (0.0%) | 0 (0.0%) |
| 35 to 64 Years | 0 (0.0%) | 0 (0.0%) |
| 65 to 74 Years | 9 (6.8%) | 0 (0.0%) |
| 75 Years and over | 0 (0.0%) | 0 (0.0%) |
Technology Access in Masthope
Computing Device Access in Masthope
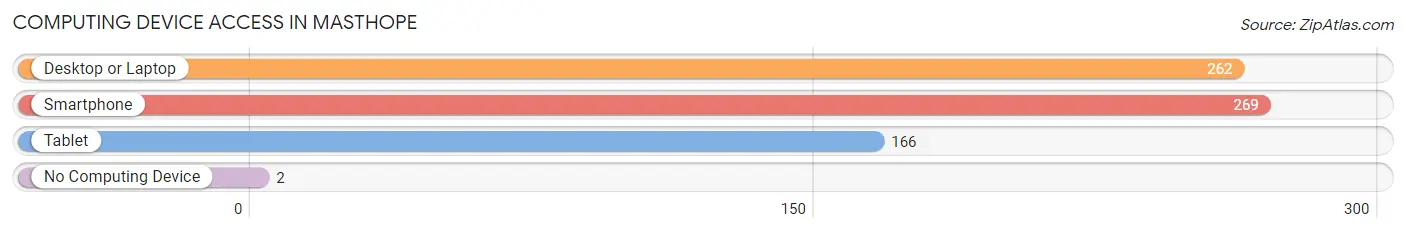
| Device Type | # Households | % Households |
| Desktop or Laptop | 262 | 88.2% |
| Smartphone | 269 | 90.6% |
| Tablet | 166 | 55.9% |
| No Computing Device | 2 | 0.7% |
| Total | 297 | 100.0% |
Internet Access in Masthope
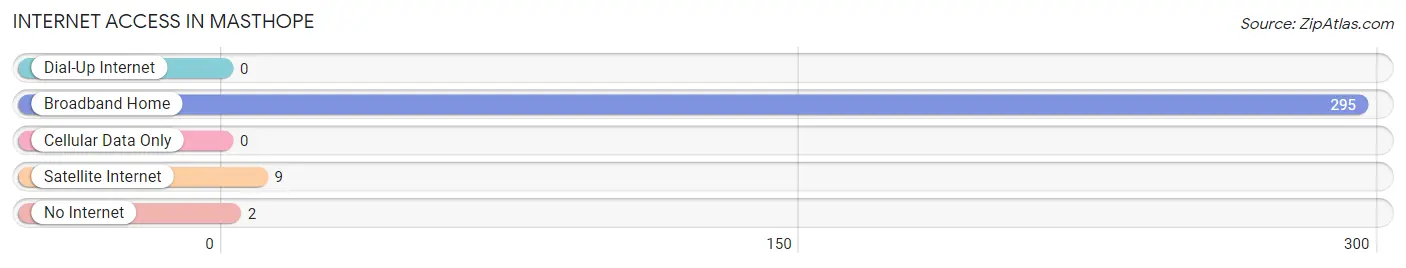
| Internet Type | # Households | % Households |
| Dial-Up Internet | 0 | 0.0% |
| Broadband Home | 295 | 99.3% |
| Cellular Data Only | 0 | 0.0% |
| Satellite Internet | 9 | 3.0% |
| No Internet | 2 | 0.7% |
| Total | 297 | 100.0% |
Masthope Summary
Mastope, Pennsylvania is a small community located in the Pocono Mountains of northeastern Pennsylvania. It is situated in Pike County, approximately two hours from New York City and Philadelphia. The area is known for its natural beauty, outdoor recreation, and small-town charm.
History
Mastope was first settled in the late 1700s by German and Dutch immigrants. The area was originally known as “Mastope”, which is derived from the Lenape word for “place of many trees”. The area was primarily used for farming and logging until the early 1900s, when the first resort was built. The resort, known as the Masthope Mountain House, was a popular destination for vacationers from New York City and Philadelphia.
In the 1950s, the area began to develop into a residential community. The Masthope Mountain House was converted into a residential development, and the area began to attract more and more people. Today, Mastope is a popular destination for vacationers and second-home owners.
Geography
Mastope is located in the Pocono Mountains of northeastern Pennsylvania. The area is known for its rolling hills, lush forests, and picturesque lakes. The area is also home to several ski resorts, including Masthope Mountain, Big Bear, and Skytop.
The climate in Mastope is typical of the northeastern United States. Summers are warm and humid, while winters are cold and snowy. The area receives an average of 40 inches of precipitation per year.
Economy
Mastope’s economy is largely driven by tourism. The area is home to several ski resorts, as well as numerous restaurants, shops, and other attractions. The area also has a thriving real estate market, with many second-home owners and vacationers purchasing property in the area.
Demographics
As of the 2010 census, the population of Mastope was 1,845. The population is primarily white (94.3%), with a small percentage of African Americans (2.2%) and Hispanics (2.2%). The median household income is $50,000, and the median home value is $200,000.
Mastope is a small, rural community with a strong sense of community. The area is known for its natural beauty, outdoor recreation, and small-town charm. It is a popular destination for vacationers and second-home owners, and is a great place to live and work.
Common Questions
What is Per Capita Income in Masthope?
Per Capita income in Masthope is $45,390.
What is the Median Family Income in Masthope?
Median Family Income in Masthope is $97,264.
What is the Median Household income in Masthope?
Median Household Income in Masthope is $86,719.
What is Inequality or Gini Index in Masthope?
Inequality or Gini Index in Masthope is 0.43.
What is the Total Population of Masthope?
Total Population of Masthope is 597.
What is the Total Male Population of Masthope?
Total Male Population of Masthope is 335.
What is the Total Female Population of Masthope?
Total Female Population of Masthope is 262.
What is the Ratio of Males per 100 Females in Masthope?
There are 127.86 Males per 100 Females in Masthope.
What is the Ratio of Females per 100 Males in Masthope?
There are 78.21 Females per 100 Males in Masthope.
What is the Median Population Age in Masthope?
Median Population Age in Masthope is 66.7 Years.
What is the Average Family Size in Masthope
Average Family Size in Masthope is 2.3 People.
What is the Average Household Size in Masthope
Average Household Size in Masthope is 2.0 People.
How Large is the Labor Force in Masthope?
There are 150 People in the Labor Forcein in Masthope.
What is the Percentage of People in the Labor Force in Masthope?
25.8% of People are in the Labor Force in Masthope.
What is the Unemployment Rate in Masthope?
Unemployment Rate in Masthope is 24.0%.