Blawnox borough, PA Map & Demographics
Blawnox borough Overview
$40,216
PER CAPITA INCOME
$87,500
AVG FAMILY INCOME
$43,333
AVG HOUSEHOLD INCOME
29.5%
WAGE / INCOME GAP [ % ]
70.5¢/ $1
WAGE / INCOME GAP [ $ ]
$11,109
FAMILY INCOME DEFICIT
0.48
INEQUALITY / GINI INDEX
1,532
TOTAL POPULATION
835
MALE POPULATION
697
FEMALE POPULATION
119.80
MALES / 100 FEMALES
83.47
FEMALES / 100 MALES
50.5
MEDIAN AGE
2.8
AVG FAMILY SIZE
1.7
AVG HOUSEHOLD SIZE
801
LABOR FORCE [ PEOPLE ]
59.5%
PERCENT IN LABOR FORCE
4.4%
UNEMPLOYMENT RATE
Income in Blawnox borough
Income Overview in Blawnox borough
Per Capita Income in Blawnox borough is $40,216, while median incomes of families and households are $87,500 and $43,333 respectively.
| Characteristic | Number | Measure |
| Per Capita Income | 1,532 | $40,216 |
| Median Family Income | 334 | $87,500 |
| Mean Family Income | 334 | $99,289 |
| Median Household Income | 902 | $43,333 |
| Mean Household Income | 902 | $67,375 |
| Income Deficit | 334 | $11,109 |
| Wage / Income Gap (%) | 1,532 | 29.48% |
| Wage / Income Gap ($) | 1,532 | 70.52¢ per $1 |
| Gini / Inequality Index | 1,532 | 0.48 |
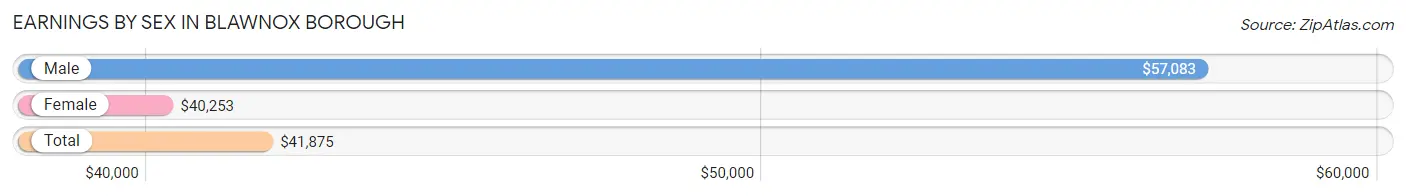
Earnings by Sex in Blawnox borough
Average Earnings in Blawnox borough are $41,875, $57,083 for men and $40,253 for women, a difference of 29.5%.
| Sex | Number | Average Earnings |
| Male | 453 (55.5%) | $57,083 |
| Female | 363 (44.5%) | $40,253 |
| Total | 816 (100.0%) | $41,875 |
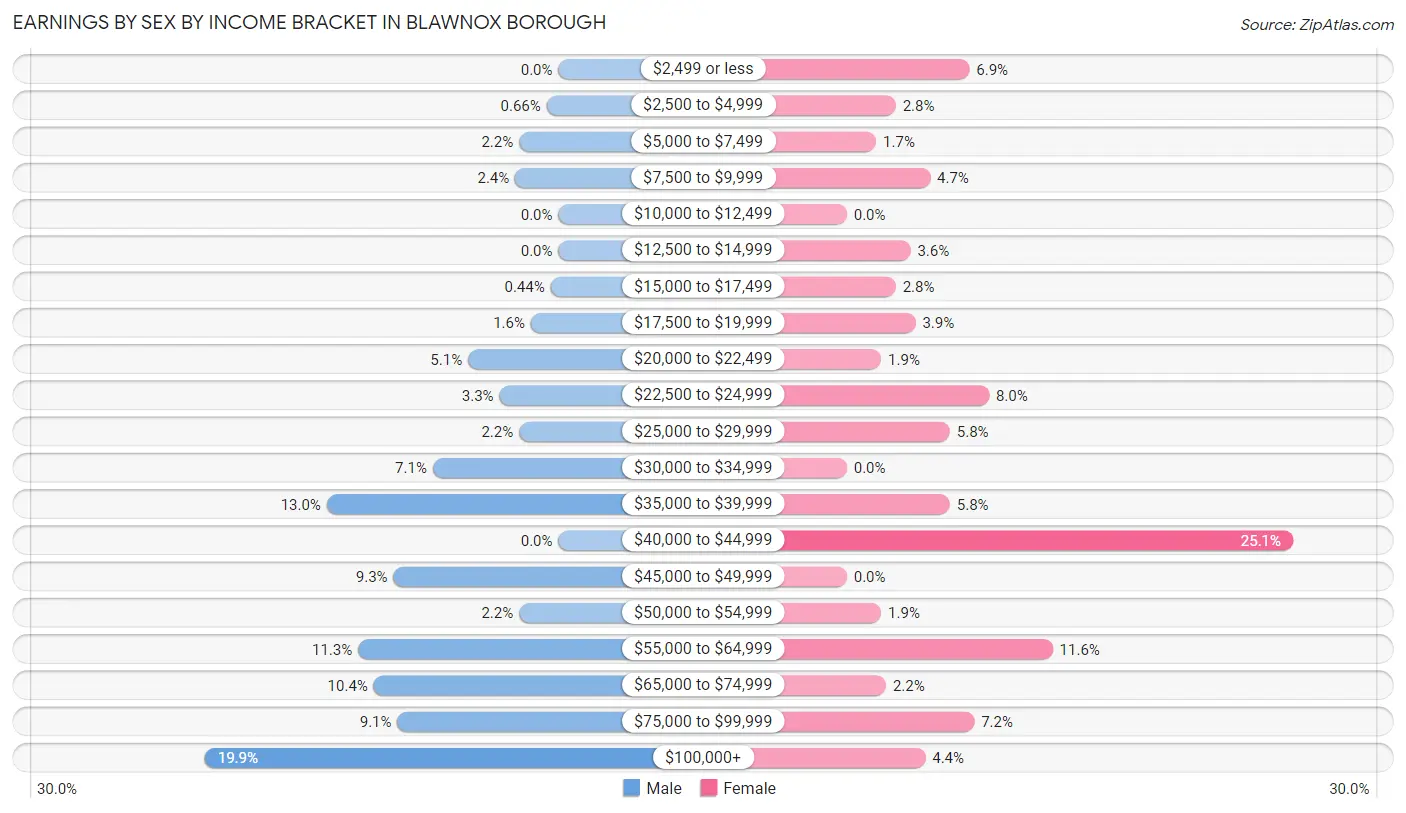
Earnings by Sex by Income Bracket in Blawnox borough
The most common earnings brackets in Blawnox borough are $100,000+ for men (90 | 19.9%) and $40,000 to $44,999 for women (91 | 25.1%).
| Income | Male | Female |
| $2,499 or less | 0 (0.0%) | 25 (6.9%) |
| $2,500 to $4,999 | 3 (0.7%) | 10 (2.8%) |
| $5,000 to $7,499 | 10 (2.2%) | 6 (1.7%) |
| $7,500 to $9,999 | 11 (2.4%) | 17 (4.7%) |
| $10,000 to $12,499 | 0 (0.0%) | 0 (0.0%) |
| $12,500 to $14,999 | 0 (0.0%) | 13 (3.6%) |
| $15,000 to $17,499 | 2 (0.4%) | 10 (2.8%) |
| $17,500 to $19,999 | 7 (1.5%) | 14 (3.9%) |
| $20,000 to $22,499 | 23 (5.1%) | 7 (1.9%) |
| $22,500 to $24,999 | 15 (3.3%) | 29 (8.0%) |
| $25,000 to $29,999 | 10 (2.2%) | 21 (5.8%) |
| $30,000 to $34,999 | 32 (7.1%) | 0 (0.0%) |
| $35,000 to $39,999 | 59 (13.0%) | 21 (5.8%) |
| $40,000 to $44,999 | 0 (0.0%) | 91 (25.1%) |
| $45,000 to $49,999 | 42 (9.3%) | 0 (0.0%) |
| $50,000 to $54,999 | 10 (2.2%) | 7 (1.9%) |
| $55,000 to $64,999 | 51 (11.3%) | 42 (11.6%) |
| $65,000 to $74,999 | 47 (10.4%) | 8 (2.2%) |
| $75,000 to $99,999 | 41 (9.0%) | 26 (7.2%) |
| $100,000+ | 90 (19.9%) | 16 (4.4%) |
| Total | 453 (100.0%) | 363 (100.0%) |
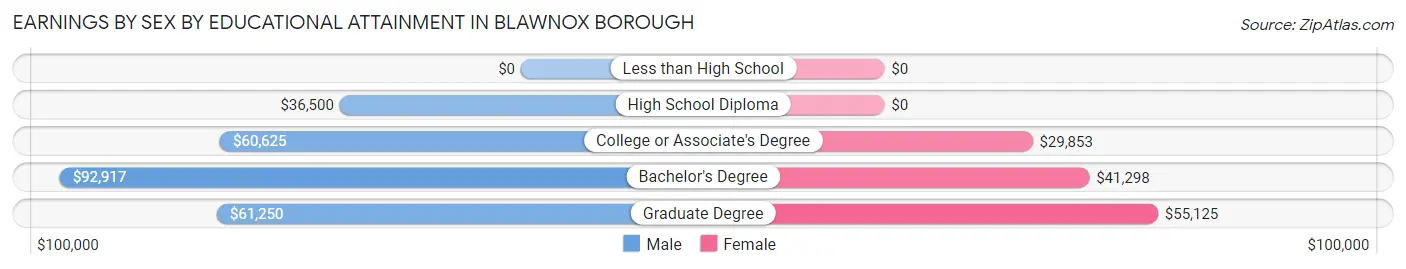
Earnings by Sex by Educational Attainment in Blawnox borough
Average earnings in Blawnox borough are $57,500 for men and $40,313 for women, a difference of 29.9%. Men with an educational attainment of bachelor's degree enjoy the highest average annual earnings of $92,917, while those with high school diploma education earn the least with $36,500. Women with an educational attainment of graduate degree earn the most with the average annual earnings of $55,125, while those with college or associate's degree education have the smallest earnings of $29,853.
| Educational Attainment | Male Income | Female Income |
| Less than High School | - | - |
| High School Diploma | $36,500 | $0 |
| College or Associate's Degree | $60,625 | $29,853 |
| Bachelor's Degree | $92,917 | $41,298 |
| Graduate Degree | $61,250 | $55,125 |
| Total | $57,500 | $40,313 |
Family Income in Blawnox borough
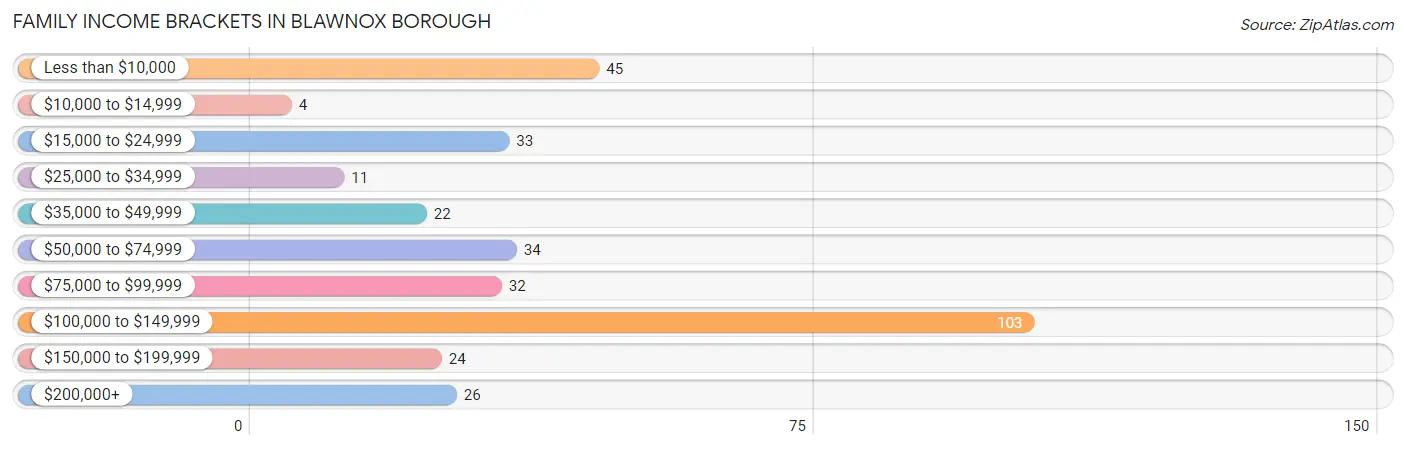
Family Income Brackets in Blawnox borough
According to the Blawnox borough family income data, there are 103 families falling into the $100,000 to $149,999 income range, which is the most common income bracket and makes up 30.8% of all families. Conversely, the $10,000 to $14,999 income bracket is the least frequent group with only 4 families (1.2%) belonging to this category.
| Income Bracket | # Families | % Families |
| Less than $10,000 | 45 | 13.5% |
| $10,000 to $14,999 | 4 | 1.2% |
| $15,000 to $24,999 | 33 | 9.9% |
| $25,000 to $34,999 | 11 | 3.3% |
| $35,000 to $49,999 | 22 | 6.6% |
| $50,000 to $74,999 | 34 | 10.2% |
| $75,000 to $99,999 | 32 | 9.6% |
| $100,000 to $149,999 | 103 | 30.8% |
| $150,000 to $199,999 | 24 | 7.2% |
| $200,000+ | 26 | 7.8% |
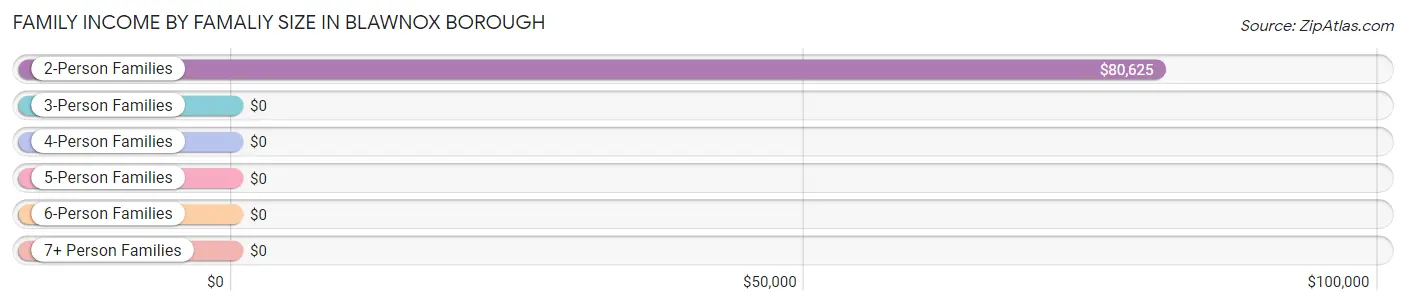
Family Income by Famaliy Size in Blawnox borough
2-person families (210 | 62.9%) account for the highest median family income in Blawnox borough with $80,625 per family, while 2-person families (210 | 62.9%) have the highest median income of $40,312 per family member.
| Income Bracket | # Families | Median Income |
| 2-Person Families | 210 (62.9%) | $80,625 |
| 3-Person Families | 89 (26.7%) | $0 |
| 4-Person Families | 22 (6.6%) | $0 |
| 5-Person Families | 10 (3.0%) | $0 |
| 6-Person Families | 3 (0.9%) | $0 |
| 7+ Person Families | 0 (0.0%) | $0 |
| Total | 334 (100.0%) | $87,500 |
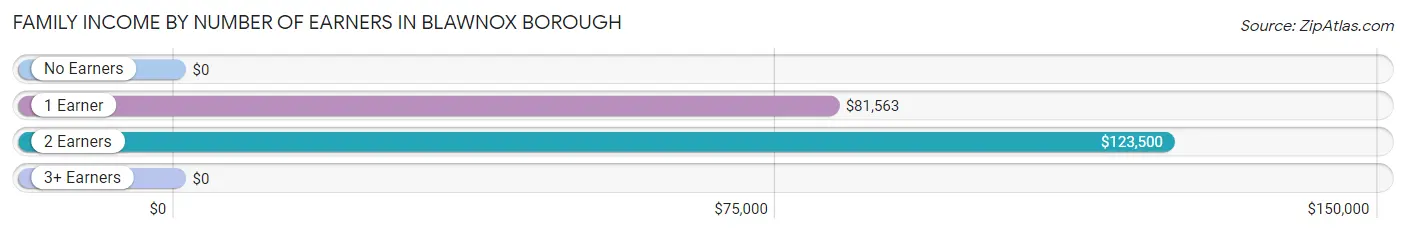
Family Income by Number of Earners in Blawnox borough
| Number of Earners | # Families | Median Income |
| No Earners | 82 (24.5%) | $0 |
| 1 Earner | 95 (28.4%) | $81,563 |
| 2 Earners | 132 (39.5%) | $123,500 |
| 3+ Earners | 25 (7.5%) | $0 |
| Total | 334 (100.0%) | $87,500 |
Household Income in Blawnox borough
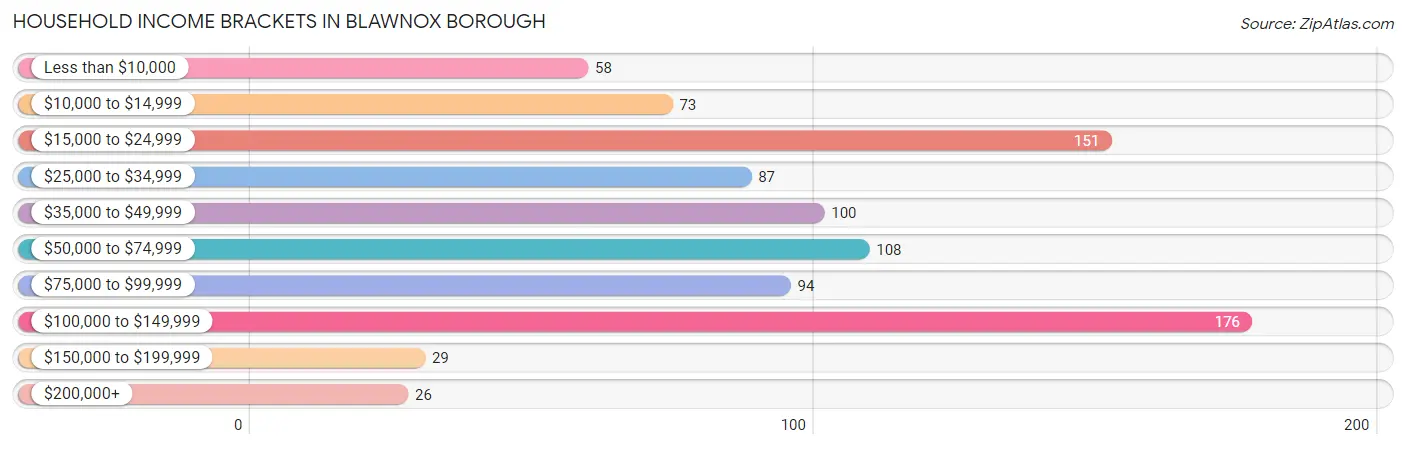
Household Income Brackets in Blawnox borough
With 176 households falling in the category, the $100,000 to $149,999 income range is the most frequent in Blawnox borough, accounting for 19.5% of all households. In contrast, only 26 households (2.9%) fall into the $200,000+ income bracket, making it the least populous group.
| Income Bracket | # Households | % Households |
| Less than $10,000 | 58 | 6.4% |
| $10,000 to $14,999 | 73 | 8.1% |
| $15,000 to $24,999 | 151 | 16.7% |
| $25,000 to $34,999 | 87 | 9.6% |
| $35,000 to $49,999 | 100 | 11.1% |
| $50,000 to $74,999 | 108 | 12.0% |
| $75,000 to $99,999 | 94 | 10.4% |
| $100,000 to $149,999 | 176 | 19.5% |
| $150,000 to $199,999 | 29 | 3.2% |
| $200,000+ | 26 | 2.9% |
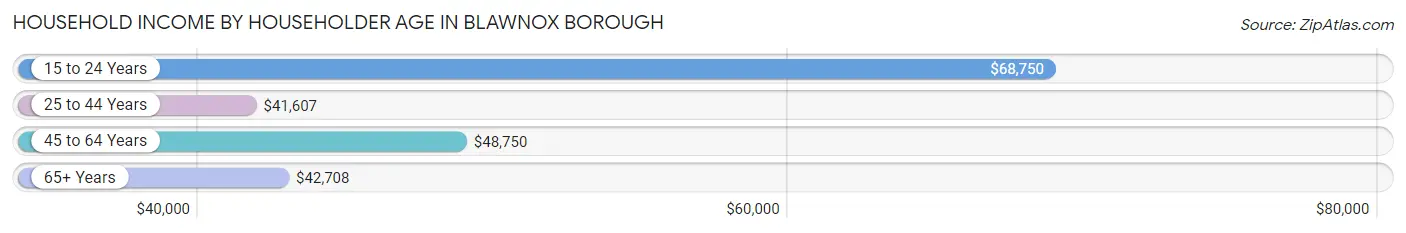
Household Income by Householder Age in Blawnox borough
The median household income in Blawnox borough is $43,333, with the highest median household income of $68,750 found in the 15 to 24 years age bracket for the primary householder. A total of 22 households (2.4%) fall into this category. Meanwhile, the 25 to 44 years age bracket for the primary householder has the lowest median household income of $41,607, with 202 households (22.4%) in this group.
| Income Bracket | # Households | Median Income |
| 15 to 24 Years | 22 (2.4%) | $68,750 |
| 25 to 44 Years | 202 (22.4%) | $41,607 |
| 45 to 64 Years | 316 (35.0%) | $48,750 |
| 65+ Years | 362 (40.1%) | $42,708 |
| Total | 902 (100.0%) | $43,333 |
Poverty in Blawnox borough
Income Below Poverty by Sex and Age in Blawnox borough
With 23.2% poverty level for males and 21.4% for females among the residents of Blawnox borough, 5 year old males and under 5 year old females are the most vulnerable to poverty, with 24 males (100.0%) and 3 females (100.0%) in their respective age groups living below the poverty level.
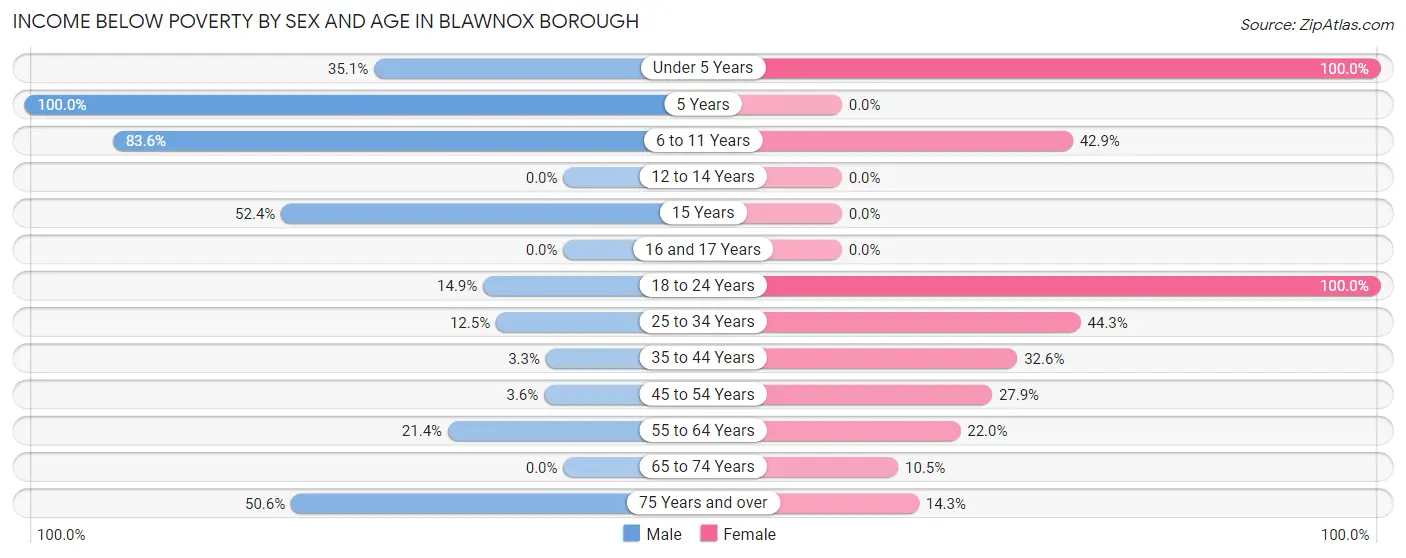
| Age Bracket | Male | Female |
| Under 5 Years | 13 (35.1%) | 3 (100.0%) |
| 5 Years | 24 (100.0%) | 0 (0.0%) |
| 6 to 11 Years | 46 (83.6%) | 3 (42.9%) |
| 12 to 14 Years | 0 (0.0%) | 0 (0.0%) |
| 15 Years | 11 (52.4%) | 0 (0.0%) |
| 16 and 17 Years | 0 (0.0%) | 0 (0.0%) |
| 18 to 24 Years | 7 (14.9%) | 4 (100.0%) |
| 25 to 34 Years | 18 (12.5%) | 43 (44.3%) |
| 35 to 44 Years | 3 (3.3%) | 14 (32.6%) |
| 45 to 54 Years | 5 (3.6%) | 17 (27.9%) |
| 55 to 64 Years | 21 (21.4%) | 31 (22.0%) |
| 65 to 74 Years | 0 (0.0%) | 21 (10.4%) |
| 75 Years and over | 46 (50.5%) | 13 (14.3%) |
| Total | 194 (23.2%) | 149 (21.4%) |
Income Above Poverty by Sex and Age in Blawnox borough
According to the poverty statistics in Blawnox borough, males aged 16 and 17 years and females aged 5 years are the age groups that are most secure financially, with 100.0% of males and 100.0% of females in these age groups living above the poverty line.
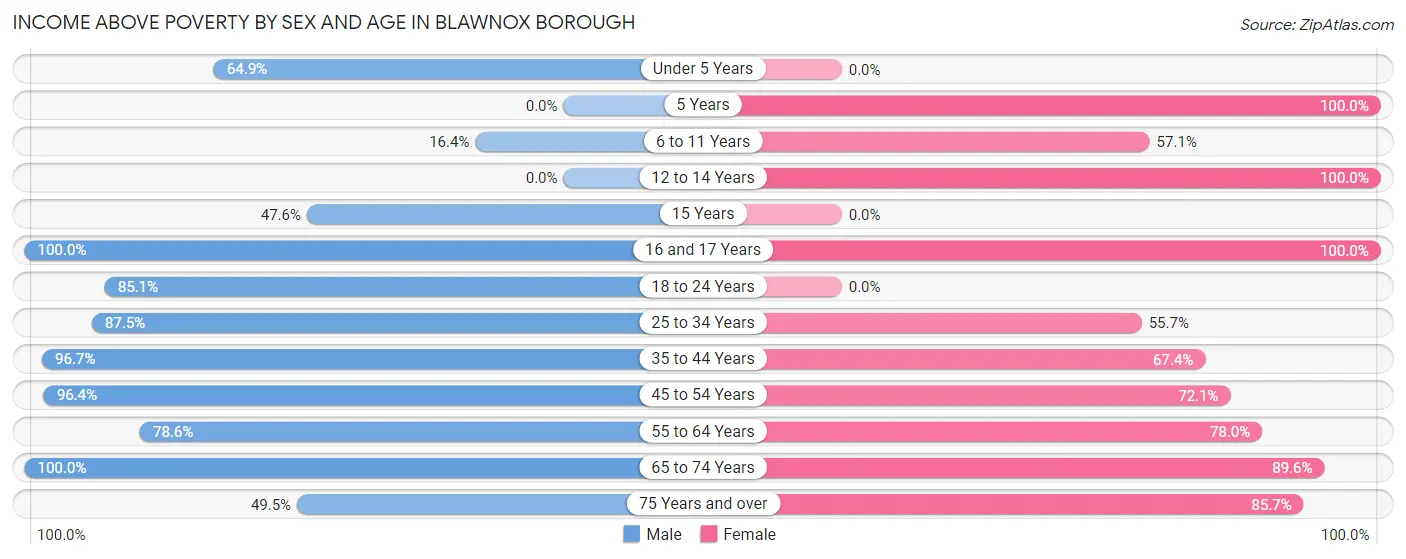
| Age Bracket | Male | Female |
| Under 5 Years | 24 (64.9%) | 0 (0.0%) |
| 5 Years | 0 (0.0%) | 5 (100.0%) |
| 6 to 11 Years | 9 (16.4%) | 4 (57.1%) |
| 12 to 14 Years | 0 (0.0%) | 34 (100.0%) |
| 15 Years | 10 (47.6%) | 0 (0.0%) |
| 16 and 17 Years | 9 (100.0%) | 10 (100.0%) |
| 18 to 24 Years | 40 (85.1%) | 0 (0.0%) |
| 25 to 34 Years | 126 (87.5%) | 54 (55.7%) |
| 35 to 44 Years | 89 (96.7%) | 29 (67.4%) |
| 45 to 54 Years | 135 (96.4%) | 44 (72.1%) |
| 55 to 64 Years | 77 (78.6%) | 110 (78.0%) |
| 65 to 74 Years | 77 (100.0%) | 180 (89.5%) |
| 75 Years and over | 45 (49.4%) | 78 (85.7%) |
| Total | 641 (76.8%) | 548 (78.6%) |
Income Below Poverty Among Married-Couple Families in Blawnox borough
The poverty statistics for married-couple families in Blawnox borough show that 12.4% or 23 of the total 186 families live below the poverty line. Families with 1 or 2 children have the highest poverty rate of 28.3%, comprising of 17 families. On the other hand, families with no children have the lowest poverty rate of 4.8%, which includes 6 families.
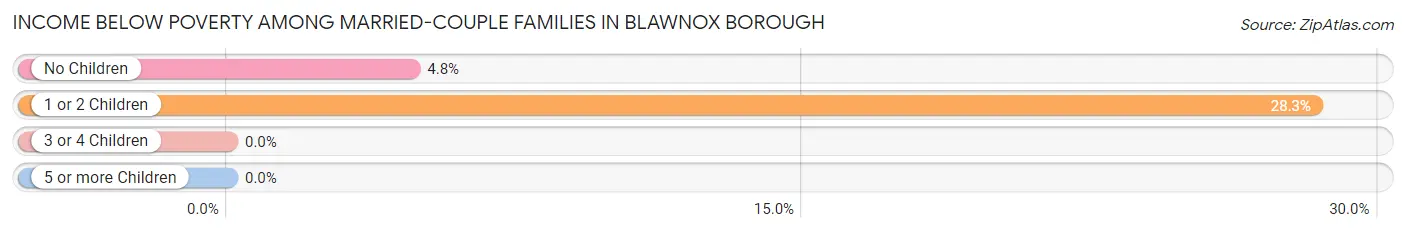
| Children | Above Poverty | Below Poverty |
| No Children | 120 (95.2%) | 6 (4.8%) |
| 1 or 2 Children | 43 (71.7%) | 17 (28.3%) |
| 3 or 4 Children | 0 (0.0%) | 0 (0.0%) |
| 5 or more Children | 0 (0.0%) | 0 (0.0%) |
| Total | 163 (87.6%) | 23 (12.4%) |
Income Below Poverty Among Single-Parent Households in Blawnox borough
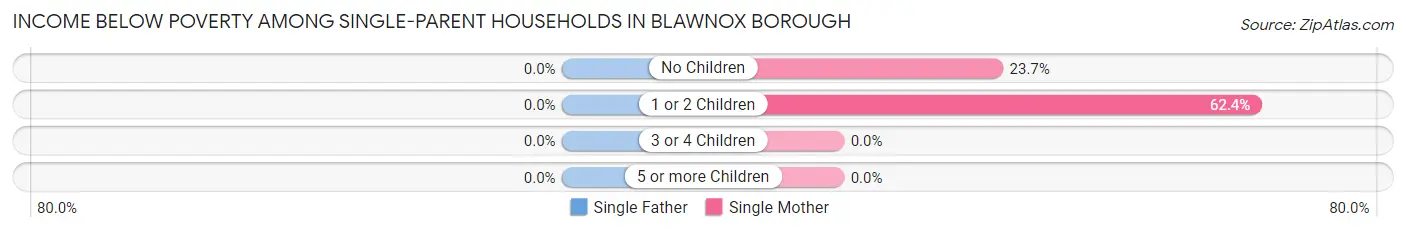
| Children | Single Father | Single Mother |
| No Children | 0 (0.0%) | 9 (23.7%) |
| 1 or 2 Children | 0 (0.0%) | 53 (62.4%) |
| 3 or 4 Children | 0 (0.0%) | 0 (0.0%) |
| 5 or more Children | 0 (0.0%) | 0 (0.0%) |
| Total | 0 (0.0%) | 62 (50.4%) |
Income Below Poverty Among Married-Couple vs Single-Parent Households in Blawnox borough
The poverty data for Blawnox borough shows that 23 of the married-couple family households (12.4%) and 62 of the single-parent households (41.9%) are living below the poverty level. Within the married-couple family households, those with 1 or 2 children have the highest poverty rate, with 17 households (28.3%) falling below the poverty line. Among the single-parent households, those with 1 or 2 children have the highest poverty rate, with 53 household (59.6%) living below poverty.
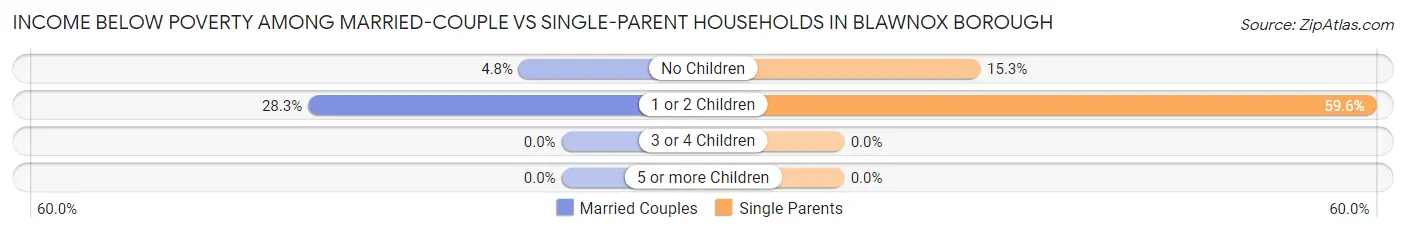
| Children | Married-Couple Families | Single-Parent Households |
| No Children | 6 (4.8%) | 9 (15.2%) |
| 1 or 2 Children | 17 (28.3%) | 53 (59.6%) |
| 3 or 4 Children | 0 (0.0%) | 0 (0.0%) |
| 5 or more Children | 0 (0.0%) | 0 (0.0%) |
| Total | 23 (12.4%) | 62 (41.9%) |
Race in Blawnox borough
The most populous races in Blawnox borough are White / Caucasian (1,249 | 81.5%), Asian (142 | 9.3%), and Black / African American (75 | 4.9%).
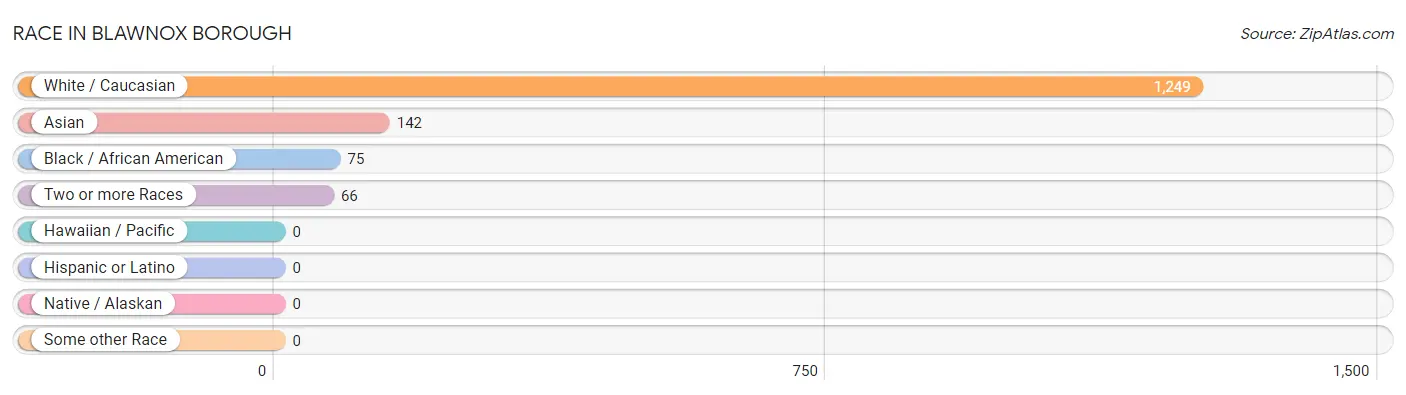
| Race | # Population | % Population |
| Asian | 142 | 9.3% |
| Black / African American | 75 | 4.9% |
| Hawaiian / Pacific | 0 | 0.0% |
| Hispanic or Latino | 0 | 0.0% |
| Native / Alaskan | 0 | 0.0% |
| White / Caucasian | 1,249 | 81.5% |
| Two or more Races | 66 | 4.3% |
| Some other Race | 0 | 0.0% |
| Total | 1,532 | 100.0% |
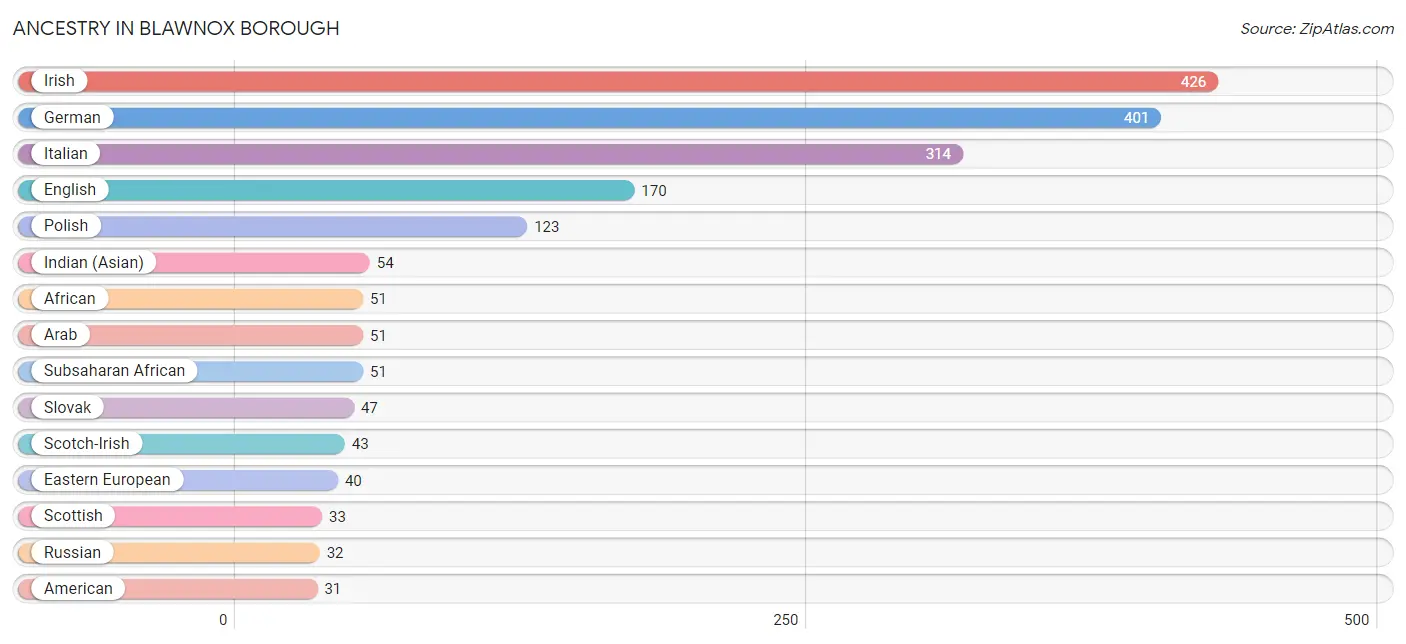
Ancestry in Blawnox borough
The most populous ancestries reported in Blawnox borough are Irish (426 | 27.8%), German (401 | 26.2%), Italian (314 | 20.5%), English (170 | 11.1%), and Polish (123 | 8.0%), together accounting for 93.6% of all Blawnox borough residents.
| Ancestry | # Population | % Population |
| African | 51 | 3.3% |
| American | 31 | 2.0% |
| Arab | 51 | 3.3% |
| Austrian | 3 | 0.2% |
| Brazilian | 9 | 0.6% |
| British | 16 | 1.0% |
| Croatian | 28 | 1.8% |
| Dutch | 11 | 0.7% |
| Eastern European | 40 | 2.6% |
| Egyptian | 29 | 1.9% |
| English | 170 | 11.1% |
| European | 12 | 0.8% |
| French | 12 | 0.8% |
| German | 401 | 26.2% |
| Greek | 7 | 0.5% |
| Hungarian | 18 | 1.2% |
| Indian (Asian) | 54 | 3.5% |
| Indonesian | 12 | 0.8% |
| Irish | 426 | 27.8% |
| Italian | 314 | 20.5% |
| Lithuanian | 2 | 0.1% |
| Polish | 123 | 8.0% |
| Russian | 32 | 2.1% |
| Scotch-Irish | 43 | 2.8% |
| Scottish | 33 | 2.1% |
| Slovak | 47 | 3.1% |
| Slovene | 10 | 0.6% |
| Subsaharan African | 51 | 3.3% |
| Swedish | 16 | 1.0% |
| Thai | 10 | 0.6% | View All 30 Rows |
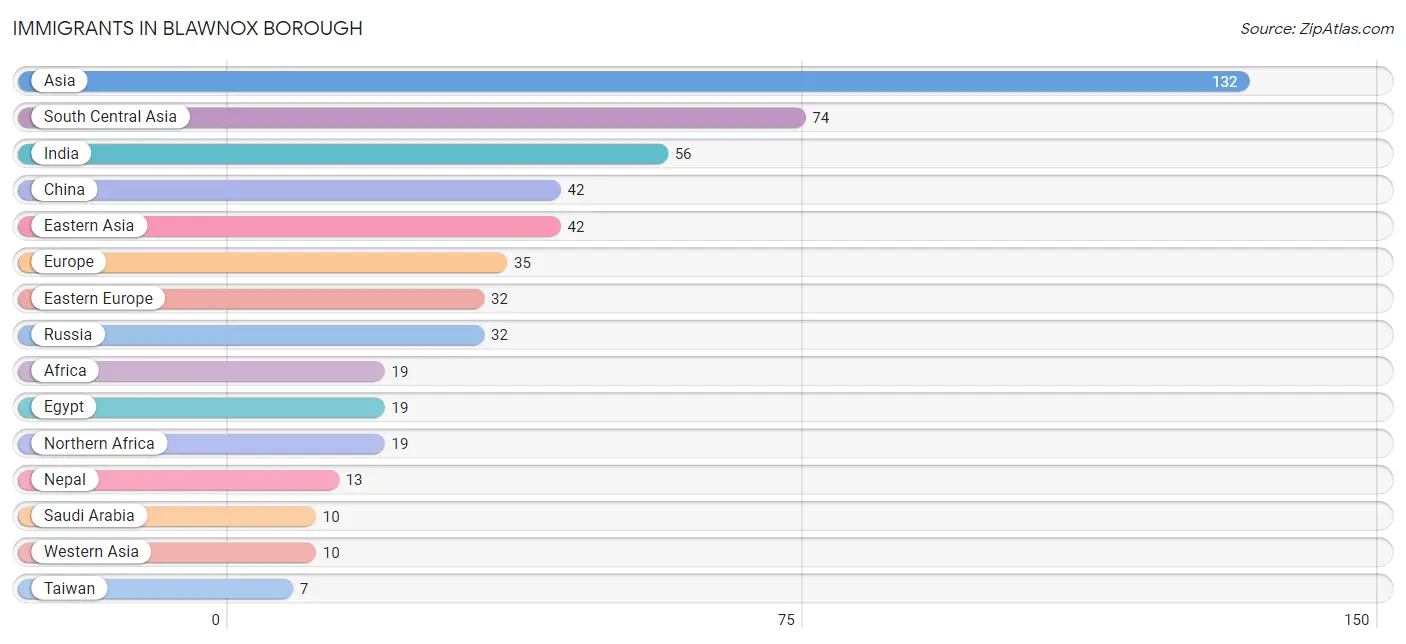
Immigrants in Blawnox borough
The most numerous immigrant groups reported in Blawnox borough came from Asia (132 | 8.6%), South Central Asia (74 | 4.8%), India (56 | 3.7%), China (42 | 2.7%), and Eastern Asia (42 | 2.7%), together accounting for 22.6% of all Blawnox borough residents.
| Immigration Origin | # Population | % Population |
| Africa | 19 | 1.2% |
| Asia | 132 | 8.6% |
| China | 42 | 2.7% |
| Eastern Asia | 42 | 2.7% |
| Eastern Europe | 32 | 2.1% |
| Egypt | 19 | 1.2% |
| Europe | 35 | 2.3% |
| India | 56 | 3.7% |
| Italy | 3 | 0.2% |
| Nepal | 13 | 0.9% |
| Northern Africa | 19 | 1.2% |
| Pakistan | 5 | 0.3% |
| Russia | 32 | 2.1% |
| Saudi Arabia | 10 | 0.6% |
| South Central Asia | 74 | 4.8% |
| South Eastern Asia | 6 | 0.4% |
| Southern Europe | 3 | 0.2% |
| Taiwan | 7 | 0.5% |
| Western Asia | 10 | 0.6% | View All 19 Rows |
Sex and Age in Blawnox borough
Sex and Age in Blawnox borough
The most populous age groups in Blawnox borough are 30 to 34 Years (101 | 12.1%) for men and 70 to 74 Years (156 | 22.4%) for women.
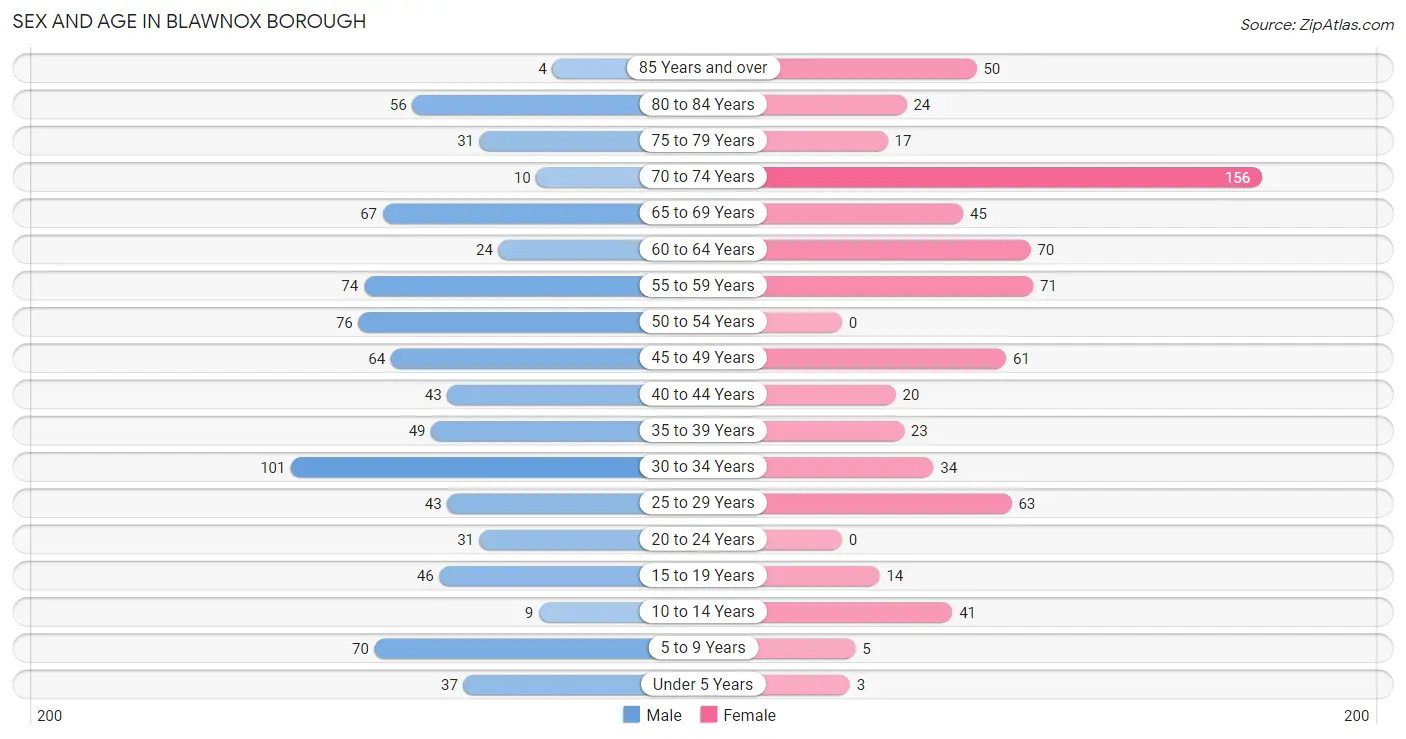
| Age Bracket | Male | Female |
| Under 5 Years | 37 (4.4%) | 3 (0.4%) |
| 5 to 9 Years | 70 (8.4%) | 5 (0.7%) |
| 10 to 14 Years | 9 (1.1%) | 41 (5.9%) |
| 15 to 19 Years | 46 (5.5%) | 14 (2.0%) |
| 20 to 24 Years | 31 (3.7%) | 0 (0.0%) |
| 25 to 29 Years | 43 (5.1%) | 63 (9.0%) |
| 30 to 34 Years | 101 (12.1%) | 34 (4.9%) |
| 35 to 39 Years | 49 (5.9%) | 23 (3.3%) |
| 40 to 44 Years | 43 (5.1%) | 20 (2.9%) |
| 45 to 49 Years | 64 (7.7%) | 61 (8.7%) |
| 50 to 54 Years | 76 (9.1%) | 0 (0.0%) |
| 55 to 59 Years | 74 (8.9%) | 71 (10.2%) |
| 60 to 64 Years | 24 (2.9%) | 70 (10.0%) |
| 65 to 69 Years | 67 (8.0%) | 45 (6.5%) |
| 70 to 74 Years | 10 (1.2%) | 156 (22.4%) |
| 75 to 79 Years | 31 (3.7%) | 17 (2.4%) |
| 80 to 84 Years | 56 (6.7%) | 24 (3.4%) |
| 85 Years and over | 4 (0.5%) | 50 (7.2%) |
| Total | 835 (100.0%) | 697 (100.0%) |
Families and Households in Blawnox borough
Median Family Size in Blawnox borough
The median family size in Blawnox borough is 2.77 persons per family, with single female/mother families (123 | 36.8%) accounting for the largest median family size of 2.98 persons per family. On the other hand, single male/father families (25 | 7.5%) represent the smallest median family size with 2.12 persons per family.
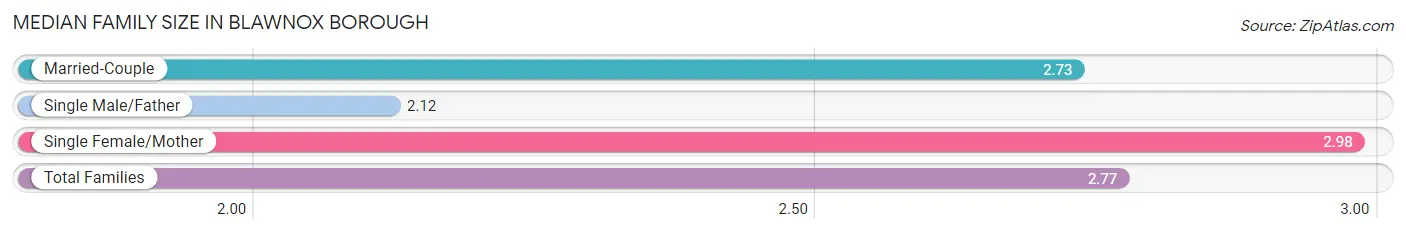
| Family Type | # Families | Family Size |
| Married-Couple | 186 (55.7%) | 2.73 |
| Single Male/Father | 25 (7.5%) | 2.12 |
| Single Female/Mother | 123 (36.8%) | 2.98 |
| Total Families | 334 (100.0%) | 2.77 |
Median Household Size in Blawnox borough
The median household size in Blawnox borough is 1.70 persons per household, with single female/mother households (123 | 13.6%) accounting for the largest median household size of 3.18 persons per household. non-family households (568 | 63.0%) represent the smallest median household size with 1.02 persons per household.
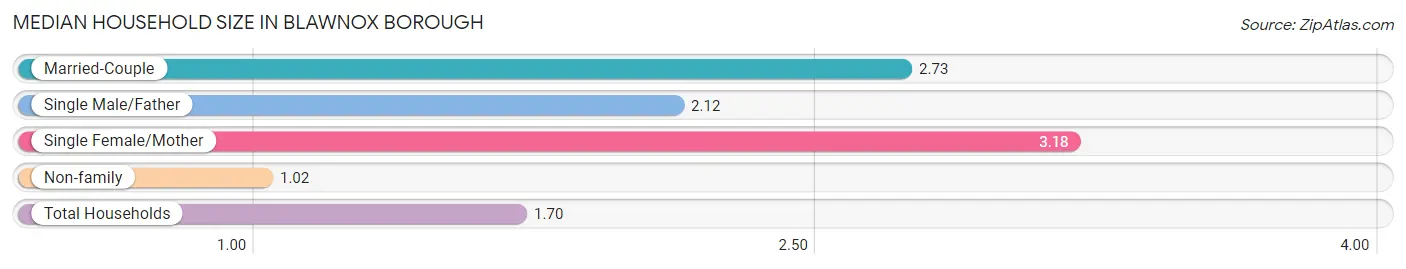
| Household Type | # Households | Household Size |
| Married-Couple | 186 (20.6%) | 2.73 |
| Single Male/Father | 25 (2.8%) | 2.12 |
| Single Female/Mother | 123 (13.6%) | 3.18 |
| Non-family | 568 (63.0%) | 1.02 |
| Total Households | 902 (100.0%) | 1.70 |
Household Size by Marriage Status in Blawnox borough
Out of a total of 902 households in Blawnox borough, 334 (37.0%) are family households, while 568 (63.0%) are nonfamily households. The most numerous type of family households are 2-person households, comprising 201, and the most common type of nonfamily households are 1-person households, comprising 554.
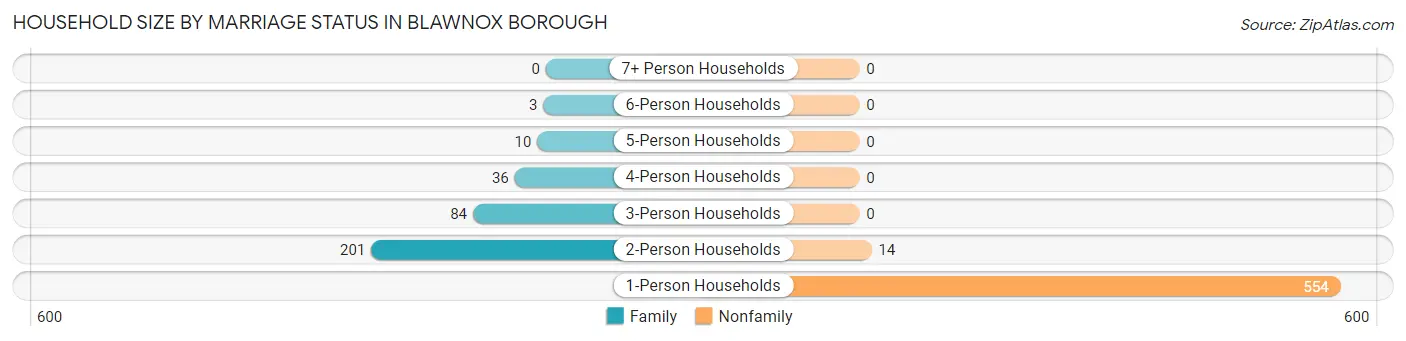
| Household Size | Family Households | Nonfamily Households |
| 1-Person Households | - | 554 (61.4%) |
| 2-Person Households | 201 (22.3%) | 14 (1.5%) |
| 3-Person Households | 84 (9.3%) | 0 (0.0%) |
| 4-Person Households | 36 (4.0%) | 0 (0.0%) |
| 5-Person Households | 10 (1.1%) | 0 (0.0%) |
| 6-Person Households | 3 (0.3%) | 0 (0.0%) |
| 7+ Person Households | 0 (0.0%) | 0 (0.0%) |
| Total | 334 (37.0%) | 568 (63.0%) |
Female Fertility in Blawnox borough
Fertility by Age in Blawnox borough
Average fertility rate in Blawnox borough is 42.0 births per 1,000 women. Women in the age bracket of 20 to 34 years have the highest fertility rate with 93.0 births per 1,000 women. Women in the age bracket of 20 to 34 years acount for 100.0% of all women with births.
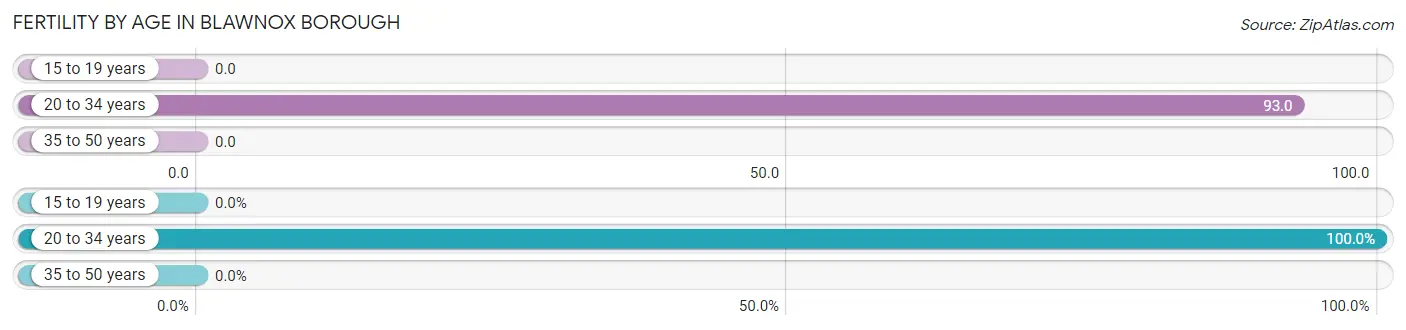
| Age Bracket | Women with Births | Births / 1,000 Women |
| 15 to 19 years | 0 (0.0%) | 0.0 |
| 20 to 34 years | 9 (100.0%) | 93.0 |
| 35 to 50 years | 0 (0.0%) | 0.0 |
| Total | 9 (100.0%) | 42.0 |
Fertility by Age by Marriage Status in Blawnox borough
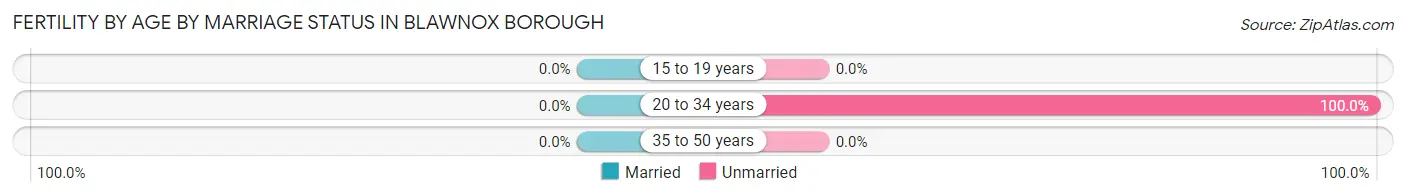
| Age Bracket | Married | Unmarried |
| 15 to 19 years | 0 (0.0%) | 0 (0.0%) |
| 20 to 34 years | 0 (0.0%) | 9 (100.0%) |
| 35 to 50 years | 0 (0.0%) | 0 (0.0%) |
| Total | 0 (0.0%) | 9 (100.0%) |
Fertility by Education in Blawnox borough
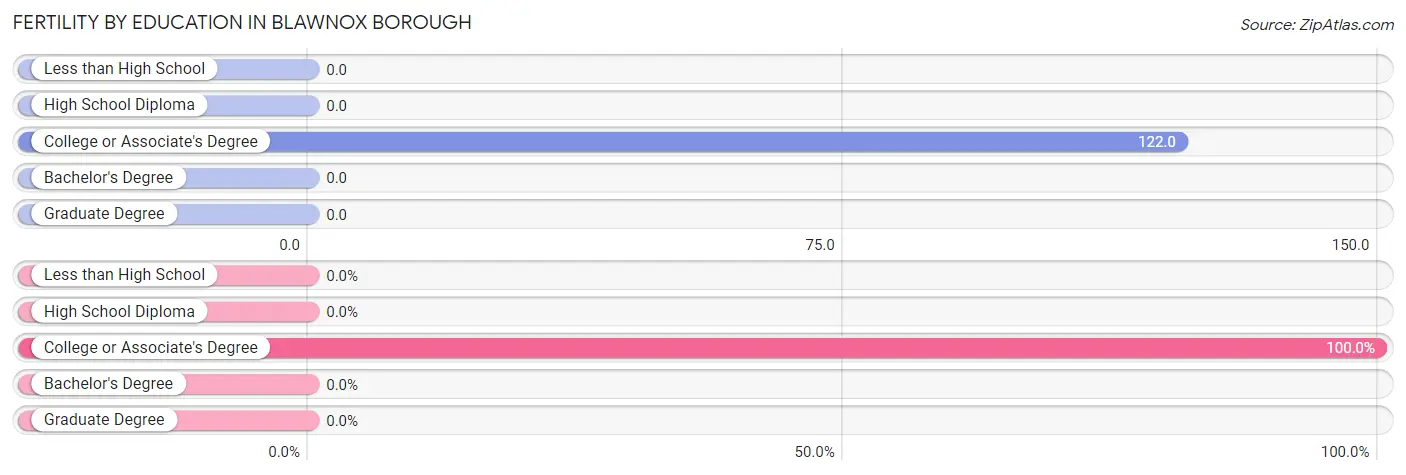
| Educational Attainment | Women with Births | Births / 1,000 Women |
| Less than High School | 0 (0.0%) | 0.0 |
| High School Diploma | 0 (0.0%) | 0.0 |
| College or Associate's Degree | 9 (100.0%) | 122.0 |
| Bachelor's Degree | 0 (0.0%) | 0.0 |
| Graduate Degree | 0 (0.0%) | 0.0 |
| Total | 9 (100.0%) | 42.0 |
Fertility by Education by Marriage Status in Blawnox borough
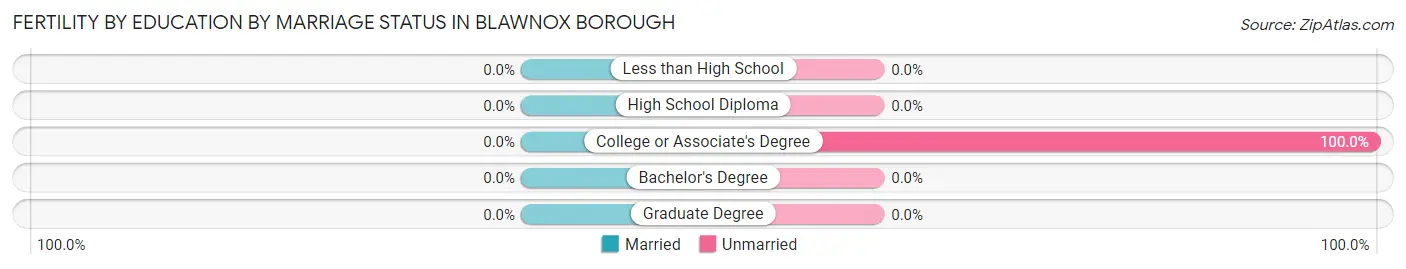
| Educational Attainment | Married | Unmarried |
| Less than High School | 0 (0.0%) | 0 (0.0%) |
| High School Diploma | 0 (0.0%) | 0 (0.0%) |
| College or Associate's Degree | 0 (0.0%) | 9 (100.0%) |
| Bachelor's Degree | 0 (0.0%) | 0 (0.0%) |
| Graduate Degree | 0 (0.0%) | 0 (0.0%) |
| Total | 0 (0.0%) | 9 (100.0%) |
Employment Characteristics in Blawnox borough
Employment by Class of Employer in Blawnox borough
Among the 766 employed individuals in Blawnox borough, private company employees (532 | 69.5%), not-for-profit organizations (89 | 11.6%), and self-employed (not incorporated) (60 | 7.8%) make up the most common classes of employment.
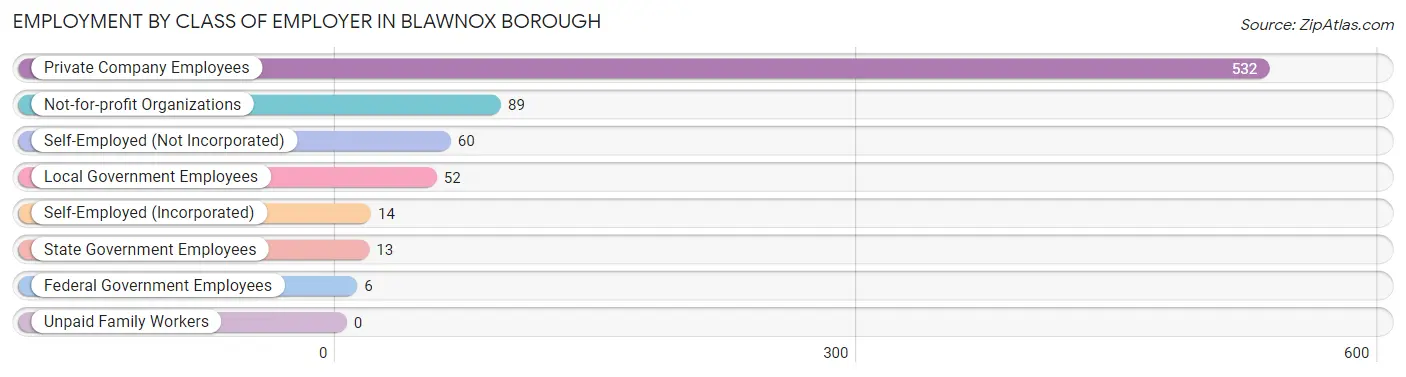
| Employer Class | # Employees | % Employees |
| Private Company Employees | 532 | 69.5% |
| Self-Employed (Incorporated) | 14 | 1.8% |
| Self-Employed (Not Incorporated) | 60 | 7.8% |
| Not-for-profit Organizations | 89 | 11.6% |
| Local Government Employees | 52 | 6.8% |
| State Government Employees | 13 | 1.7% |
| Federal Government Employees | 6 | 0.8% |
| Unpaid Family Workers | 0 | 0.0% |
| Total | 766 | 100.0% |
Employment Status by Age in Blawnox borough
According to the labor force statistics for Blawnox borough, out of the total population over 16 years of age (1,346), 59.5% or 801 individuals are in the labor force, with 4.4% or 35 of them unemployed. The age group with the highest labor force participation rate is 20 to 24 years, with 100.0% or 31 individuals in the labor force. Within the labor force, the 16 to 19 years age range has the highest percentage of unemployed individuals, with 100.0% or 9 of them being unemployed.
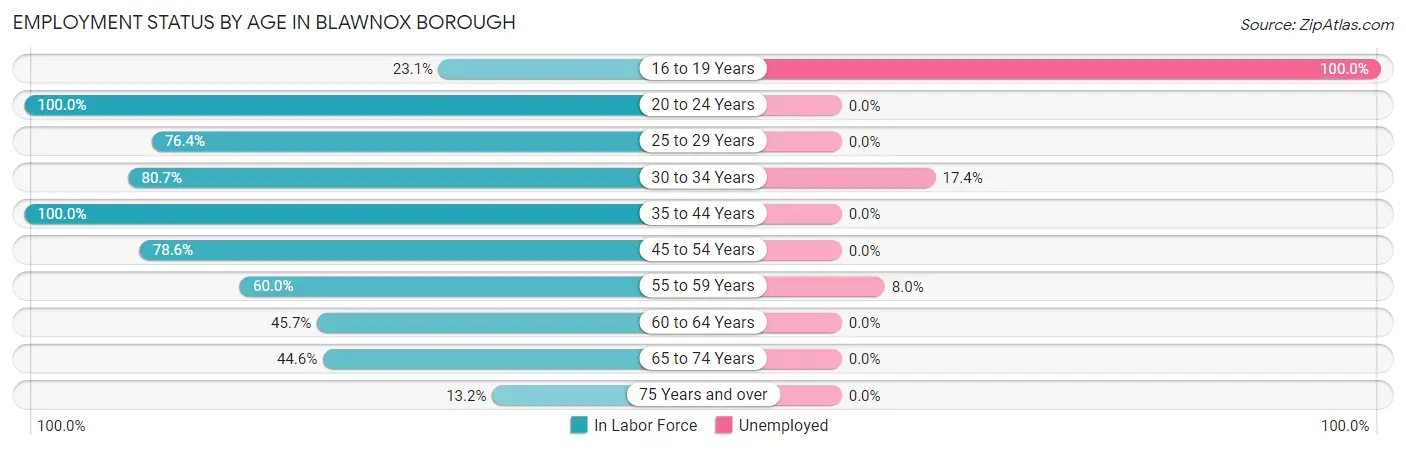
| Age Bracket | In Labor Force | Unemployed |
| 16 to 19 Years | 9 (23.1%) | 9 (100.0%) |
| 20 to 24 Years | 31 (100.0%) | 0 (0.0%) |
| 25 to 29 Years | 81 (76.4%) | 0 (0.0%) |
| 30 to 34 Years | 109 (80.7%) | 19 (17.4%) |
| 35 to 44 Years | 135 (100.0%) | 0 (0.0%) |
| 45 to 54 Years | 158 (78.6%) | 0 (0.0%) |
| 55 to 59 Years | 87 (60.0%) | 7 (8.0%) |
| 60 to 64 Years | 43 (45.7%) | 0 (0.0%) |
| 65 to 74 Years | 124 (44.6%) | 0 (0.0%) |
| 75 Years and over | 24 (13.2%) | 0 (0.0%) |
| Total | 801 (59.5%) | 35 (4.4%) |
Employment Status by Educational Attainment in Blawnox borough
According to labor force statistics for Blawnox borough, 75.1% of individuals (613) out of the total population between 25 and 64 years of age (816) are in the labor force, with 4.2% or 26 of them being unemployed. The group with the highest labor force participation rate are those with the educational attainment of bachelor's degree or higher, with 88.6% or 295 individuals in the labor force. Within the labor force, individuals with high school diploma education have the highest percentage of unemployment, with 13.3% or 19 of them being unemployed.
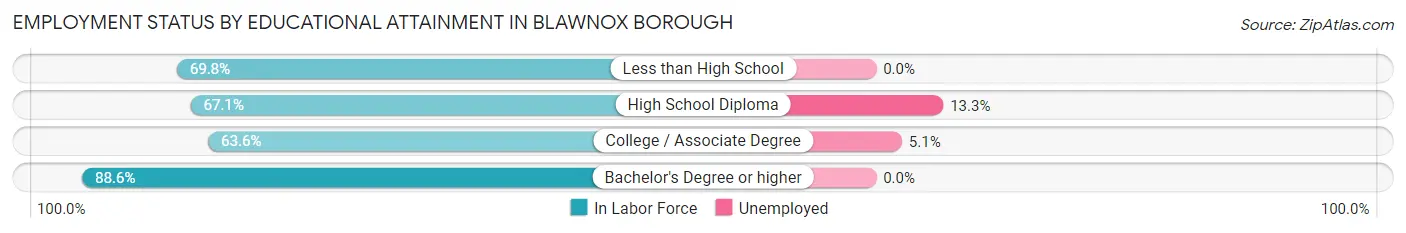
| Educational Attainment | In Labor Force | Unemployed |
| Less than High School | 37 (69.8%) | 0 (0.0%) |
| High School Diploma | 143 (67.1%) | 28 (13.3%) |
| College / Associate Degree | 138 (63.6%) | 11 (5.1%) |
| Bachelor's Degree or higher | 295 (88.6%) | 0 (0.0%) |
| Total | 613 (75.1%) | 34 (4.2%) |
Employment Occupations by Sex in Blawnox borough
Management, Business, Science and Arts Occupations
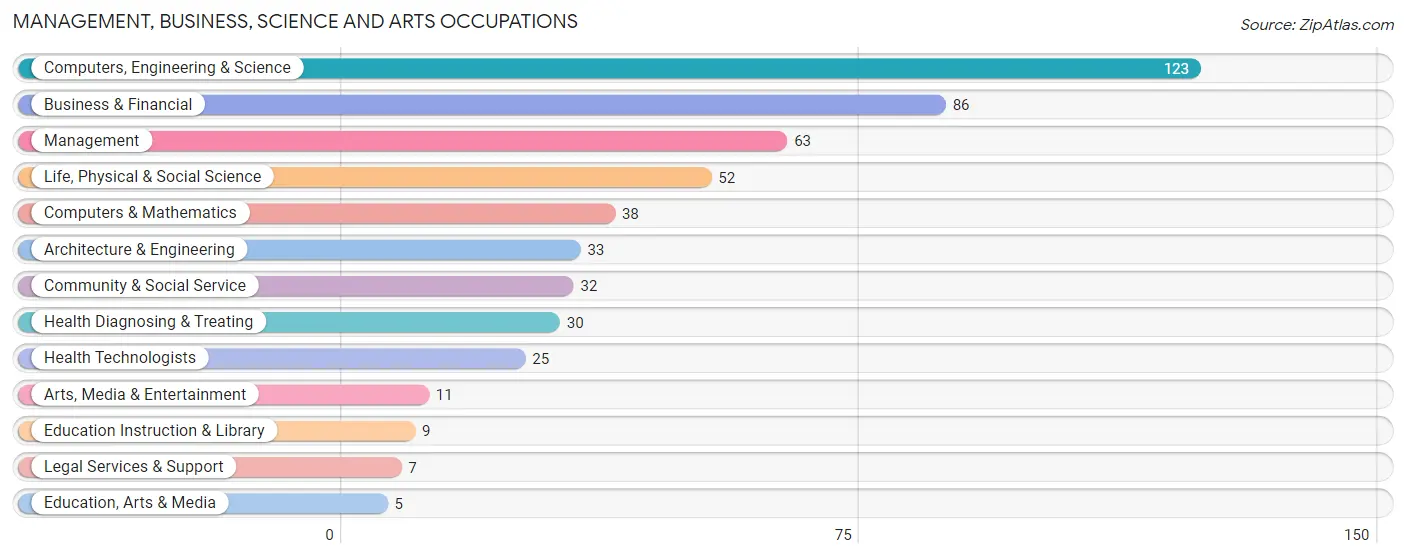
The most common Management, Business, Science and Arts occupations in Blawnox borough are Computers, Engineering & Science (123 | 16.1%), Business & Financial (86 | 11.2%), Management (63 | 8.2%), Life, Physical & Social Science (52 | 6.8%), and Computers & Mathematics (38 | 5.0%).
Management, Business, Science and Arts Occupations by Sex
Within the Management, Business, Science and Arts occupations in Blawnox borough, the most male-oriented occupations are Computers & Mathematics (100.0%), Legal Services & Support (100.0%), and Education Instruction & Library (100.0%), while the most female-oriented occupations are Education, Arts & Media (100.0%), Health Diagnosing & Treating (80.0%), and Health Technologists (76.0%).
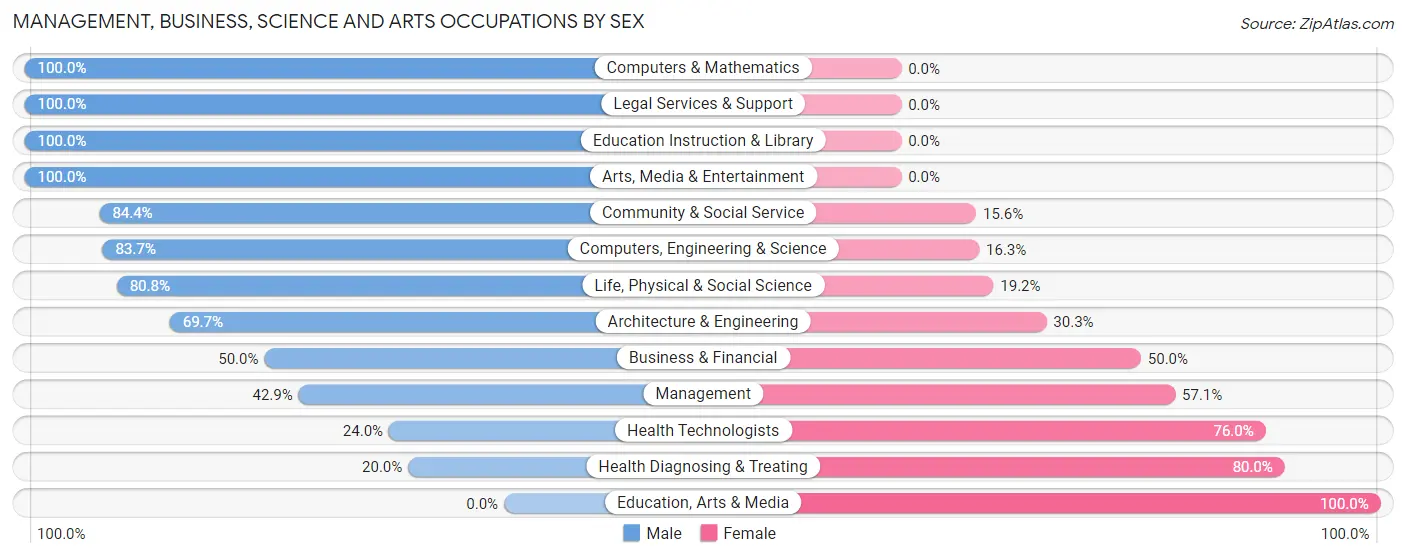
| Occupation | Male | Female |
| Management | 27 (42.9%) | 36 (57.1%) |
| Business & Financial | 43 (50.0%) | 43 (50.0%) |
| Computers, Engineering & Science | 103 (83.7%) | 20 (16.3%) |
| Computers & Mathematics | 38 (100.0%) | 0 (0.0%) |
| Architecture & Engineering | 23 (69.7%) | 10 (30.3%) |
| Life, Physical & Social Science | 42 (80.8%) | 10 (19.2%) |
| Community & Social Service | 27 (84.4%) | 5 (15.6%) |
| Education, Arts & Media | 0 (0.0%) | 5 (100.0%) |
| Legal Services & Support | 7 (100.0%) | 0 (0.0%) |
| Education Instruction & Library | 9 (100.0%) | 0 (0.0%) |
| Arts, Media & Entertainment | 11 (100.0%) | 0 (0.0%) |
| Health Diagnosing & Treating | 6 (20.0%) | 24 (80.0%) |
| Health Technologists | 6 (24.0%) | 19 (76.0%) |
| Total (Category) | 206 (61.7%) | 128 (38.3%) |
| Total (Overall) | 436 (56.9%) | 330 (43.1%) |
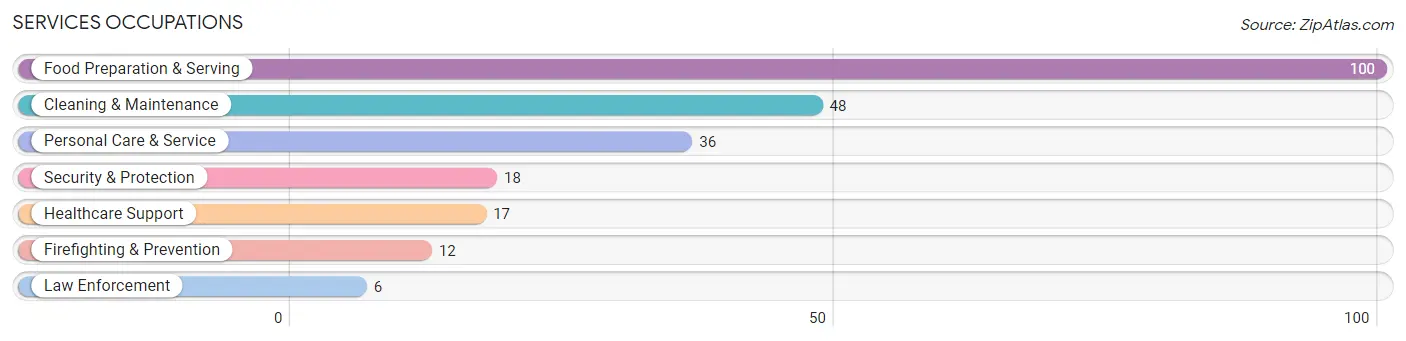
Services Occupations
The most common Services occupations in Blawnox borough are Food Preparation & Serving (100 | 13.1%), Cleaning & Maintenance (48 | 6.3%), Personal Care & Service (36 | 4.7%), Security & Protection (18 | 2.4%), and Healthcare Support (17 | 2.2%).
Services Occupations by Sex
Within the Services occupations in Blawnox borough, the most male-oriented occupations are Healthcare Support (100.0%), Law Enforcement (100.0%), and Cleaning & Maintenance (100.0%), while the most female-oriented occupations are Firefighting & Prevention (100.0%), Personal Care & Service (100.0%), and Food Preparation & Serving (69.0%).
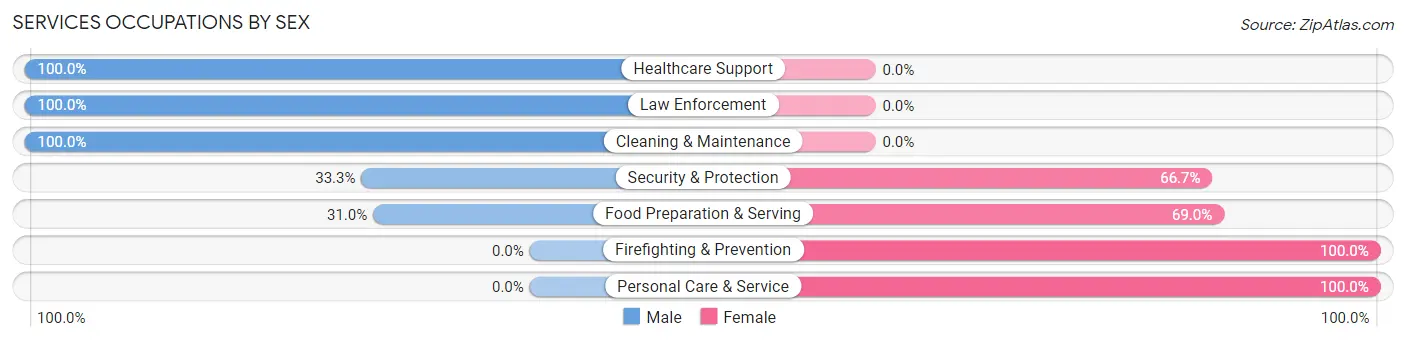
| Occupation | Male | Female |
| Healthcare Support | 17 (100.0%) | 0 (0.0%) |
| Security & Protection | 6 (33.3%) | 12 (66.7%) |
| Firefighting & Prevention | 0 (0.0%) | 12 (100.0%) |
| Law Enforcement | 6 (100.0%) | 0 (0.0%) |
| Food Preparation & Serving | 31 (31.0%) | 69 (69.0%) |
| Cleaning & Maintenance | 48 (100.0%) | 0 (0.0%) |
| Personal Care & Service | 0 (0.0%) | 36 (100.0%) |
| Total (Category) | 102 (46.6%) | 117 (53.4%) |
| Total (Overall) | 436 (56.9%) | 330 (43.1%) |
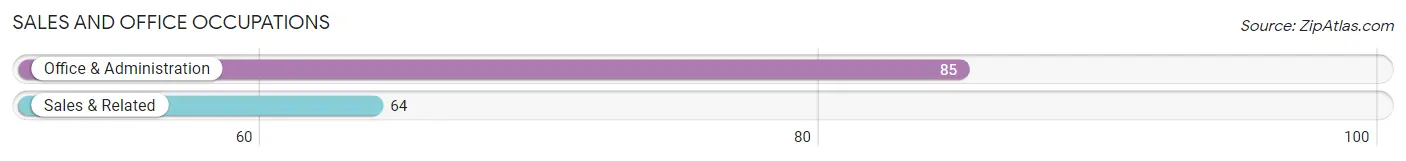
Sales and Office Occupations
The most common Sales and Office occupations in Blawnox borough are Office & Administration (85 | 11.1%), and Sales & Related (64 | 8.4%).
Sales and Office Occupations by Sex
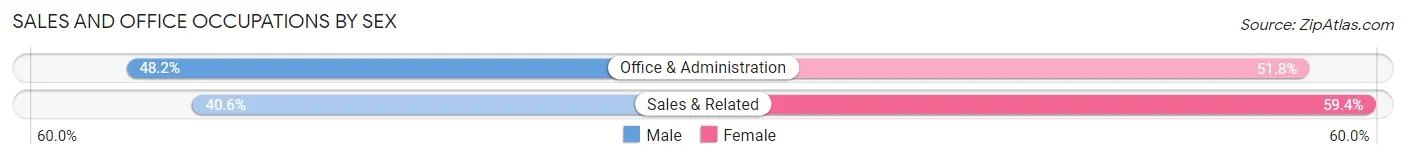
| Occupation | Male | Female |
| Sales & Related | 26 (40.6%) | 38 (59.4%) |
| Office & Administration | 41 (48.2%) | 44 (51.8%) |
| Total (Category) | 67 (45.0%) | 82 (55.0%) |
| Total (Overall) | 436 (56.9%) | 330 (43.1%) |
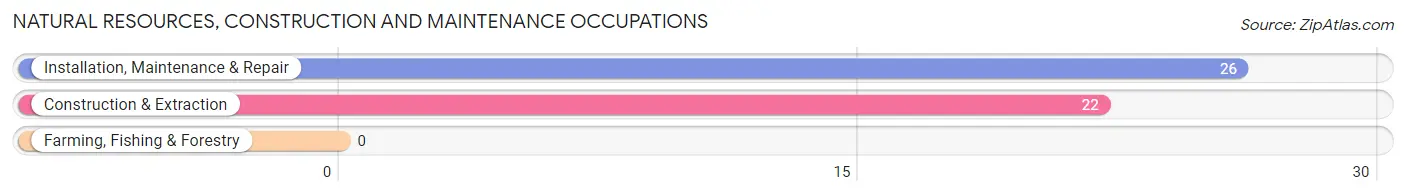
Natural Resources, Construction and Maintenance Occupations
The most common Natural Resources, Construction and Maintenance occupations in Blawnox borough are Installation, Maintenance & Repair (26 | 3.4%), and Construction & Extraction (22 | 2.9%).
Natural Resources, Construction and Maintenance Occupations by Sex
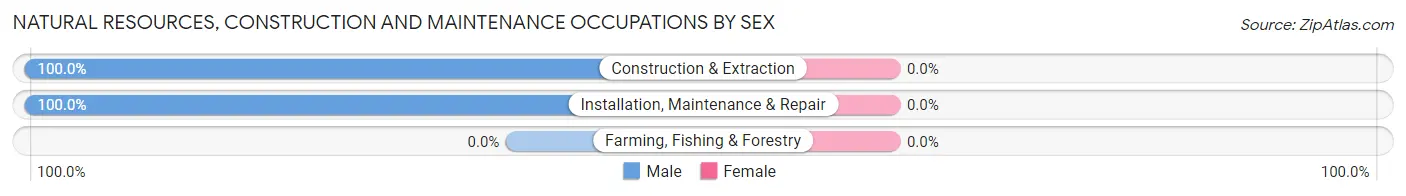
| Occupation | Male | Female |
| Farming, Fishing & Forestry | 0 (0.0%) | 0 (0.0%) |
| Construction & Extraction | 22 (100.0%) | 0 (0.0%) |
| Installation, Maintenance & Repair | 26 (100.0%) | 0 (0.0%) |
| Total (Category) | 48 (100.0%) | 0 (0.0%) |
| Total (Overall) | 436 (56.9%) | 330 (43.1%) |
Production, Transportation and Moving Occupations
The most common Production, Transportation and Moving occupations in Blawnox borough are Production (13 | 1.7%), and Material Moving (3 | 0.4%).
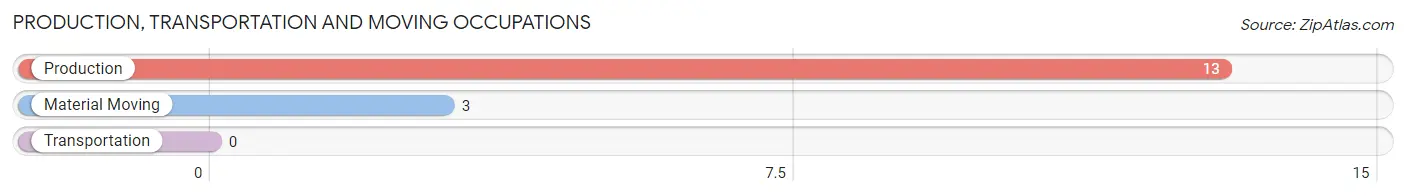
Production, Transportation and Moving Occupations by Sex
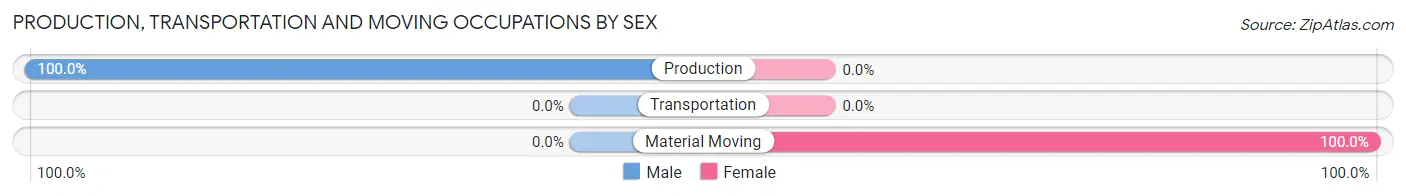
| Occupation | Male | Female |
| Production | 13 (100.0%) | 0 (0.0%) |
| Transportation | 0 (0.0%) | 0 (0.0%) |
| Material Moving | 0 (0.0%) | 3 (100.0%) |
| Total (Category) | 13 (81.2%) | 3 (18.8%) |
| Total (Overall) | 436 (56.9%) | 330 (43.1%) |
Employment Industries by Sex in Blawnox borough
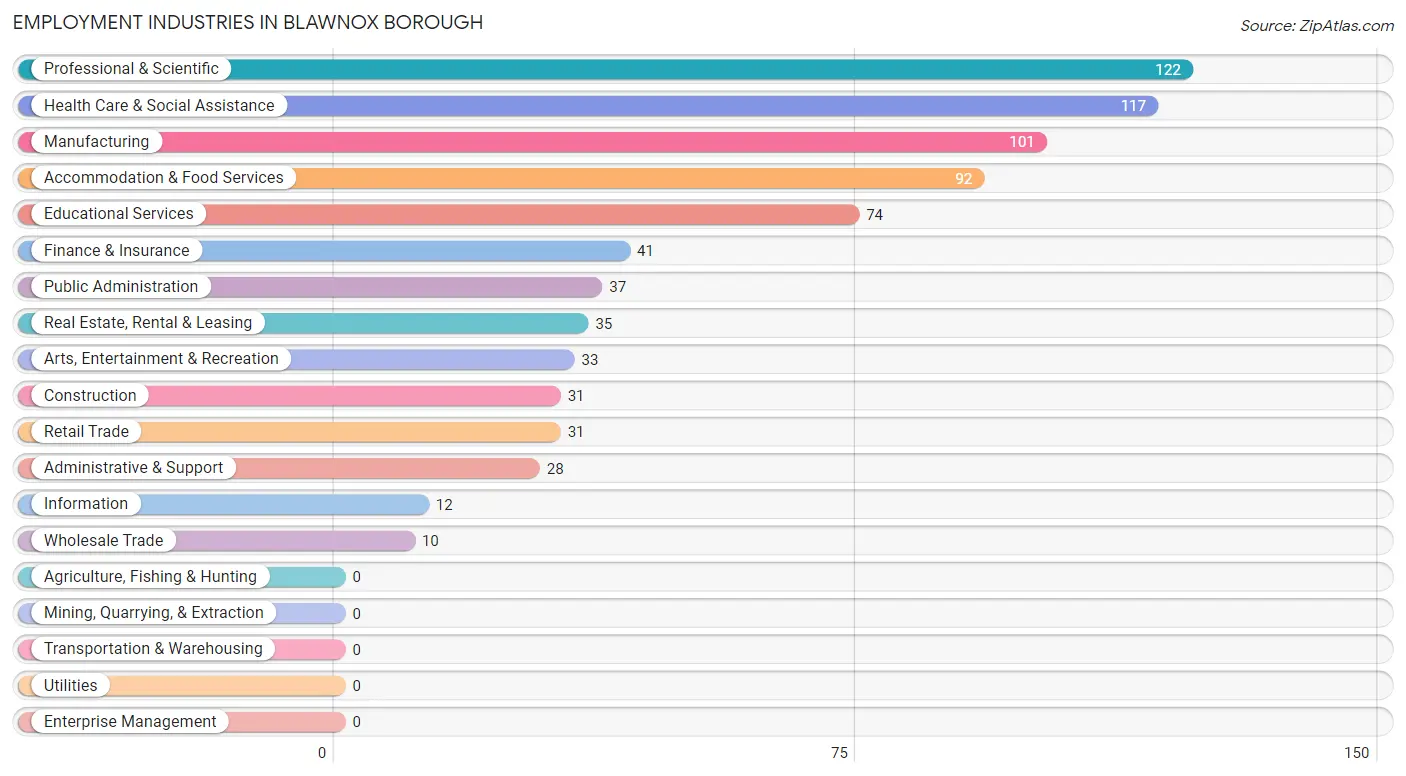
Employment Industries in Blawnox borough
The major employment industries in Blawnox borough include Professional & Scientific (122 | 15.9%), Health Care & Social Assistance (117 | 15.3%), Manufacturing (101 | 13.2%), Accommodation & Food Services (92 | 12.0%), and Educational Services (74 | 9.7%).
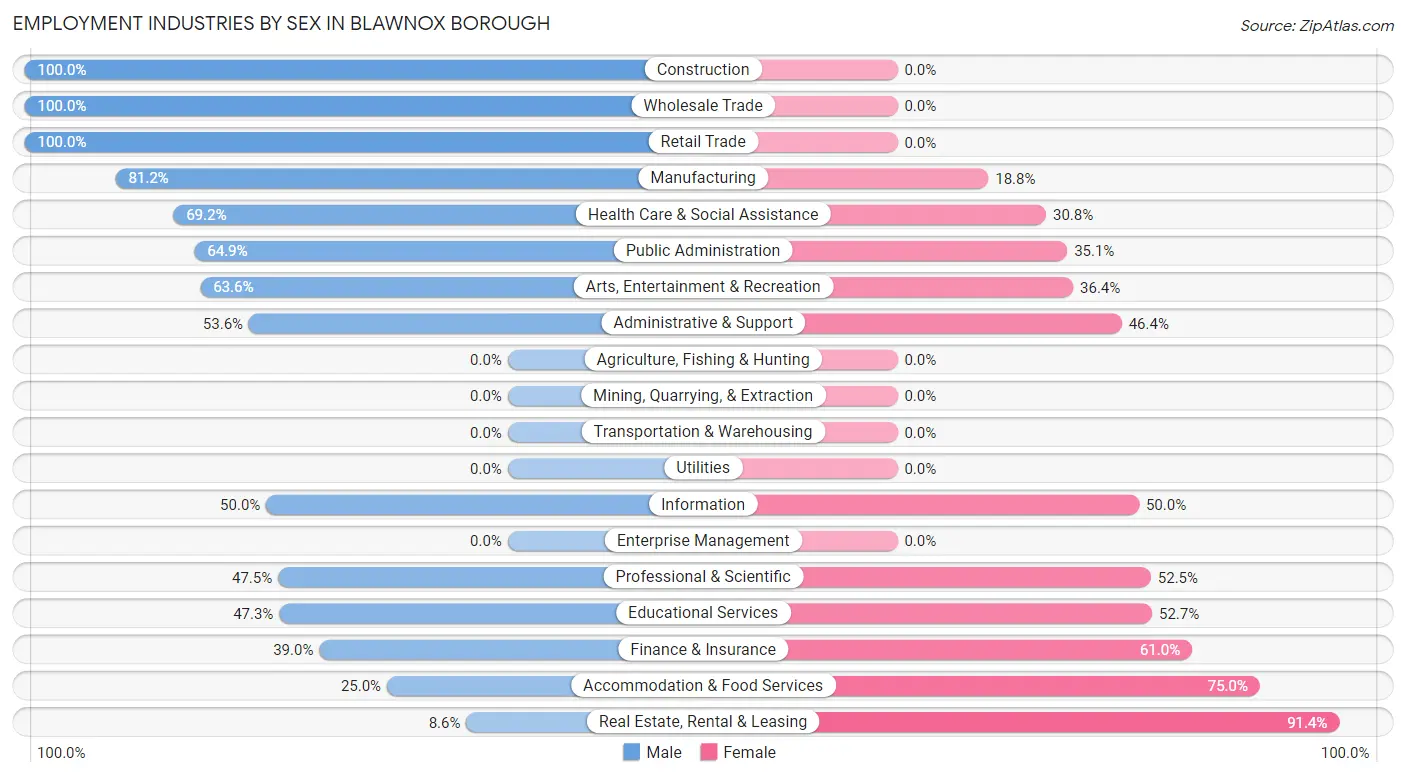
Employment Industries by Sex in Blawnox borough
The Blawnox borough industries that see more men than women are Construction (100.0%), Wholesale Trade (100.0%), and Retail Trade (100.0%), whereas the industries that tend to have a higher number of women are Real Estate, Rental & Leasing (91.4%), Accommodation & Food Services (75.0%), and Finance & Insurance (61.0%).
| Industry | Male | Female |
| Agriculture, Fishing & Hunting | 0 (0.0%) | 0 (0.0%) |
| Mining, Quarrying, & Extraction | 0 (0.0%) | 0 (0.0%) |
| Construction | 31 (100.0%) | 0 (0.0%) |
| Manufacturing | 82 (81.2%) | 19 (18.8%) |
| Wholesale Trade | 10 (100.0%) | 0 (0.0%) |
| Retail Trade | 31 (100.0%) | 0 (0.0%) |
| Transportation & Warehousing | 0 (0.0%) | 0 (0.0%) |
| Utilities | 0 (0.0%) | 0 (0.0%) |
| Information | 6 (50.0%) | 6 (50.0%) |
| Finance & Insurance | 16 (39.0%) | 25 (61.0%) |
| Real Estate, Rental & Leasing | 3 (8.6%) | 32 (91.4%) |
| Professional & Scientific | 58 (47.5%) | 64 (52.5%) |
| Enterprise Management | 0 (0.0%) | 0 (0.0%) |
| Administrative & Support | 15 (53.6%) | 13 (46.4%) |
| Educational Services | 35 (47.3%) | 39 (52.7%) |
| Health Care & Social Assistance | 81 (69.2%) | 36 (30.8%) |
| Arts, Entertainment & Recreation | 21 (63.6%) | 12 (36.4%) |
| Accommodation & Food Services | 23 (25.0%) | 69 (75.0%) |
| Public Administration | 24 (64.9%) | 13 (35.1%) |
| Total | 436 (56.9%) | 330 (43.1%) |
Education in Blawnox borough
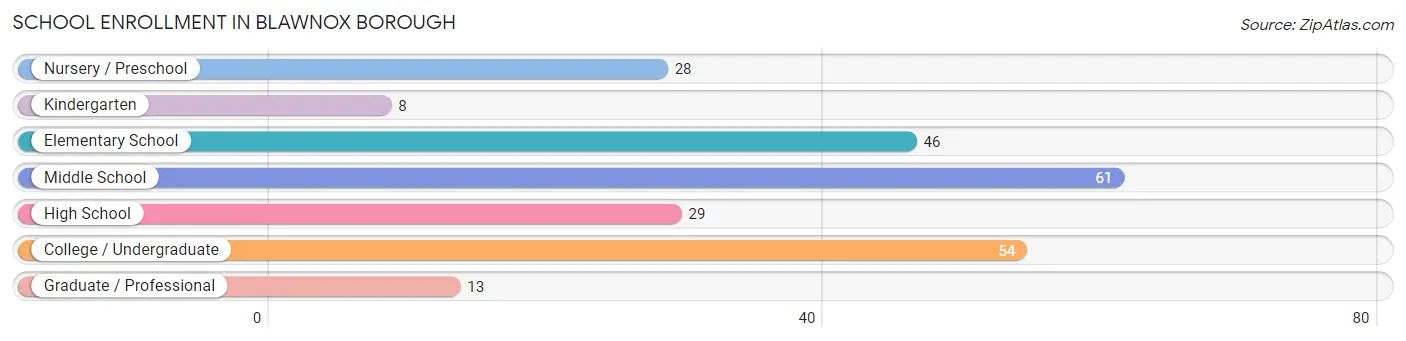
School Enrollment in Blawnox borough
The most common levels of schooling among the 239 students in Blawnox borough are middle school (61 | 25.5%), college / undergraduate (54 | 22.6%), and elementary school (46 | 19.3%).
| School Level | # Students | % Students |
| Nursery / Preschool | 28 | 11.7% |
| Kindergarten | 8 | 3.4% |
| Elementary School | 46 | 19.3% |
| Middle School | 61 | 25.5% |
| High School | 29 | 12.1% |
| College / Undergraduate | 54 | 22.6% |
| Graduate / Professional | 13 | 5.4% |
| Total | 239 | 100.0% |
School Enrollment by Age by Funding Source in Blawnox borough
Out of a total of 239 students who are enrolled in schools in Blawnox borough, 23 (9.6%) attend a private institution, while the remaining 216 (90.4%) are enrolled in public schools. The age group of 3 to 4 year olds has the highest likelihood of being enrolled in private schools, with 7 (100.0% in the age bracket) enrolled. Conversely, the age group of 5 to 9 year old has the lowest likelihood of being enrolled in a private school, with 75 (100.0% in the age bracket) attending a public institution.
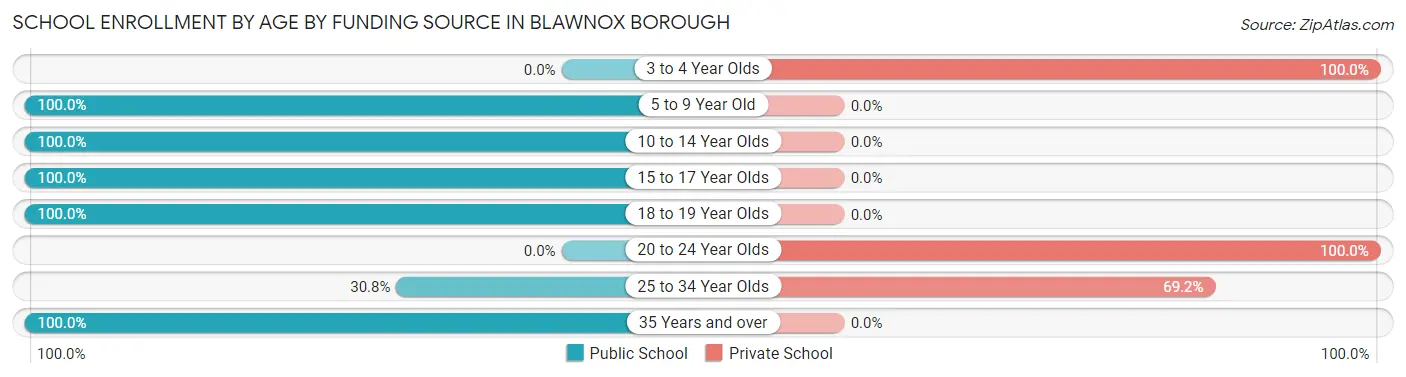
| Age Bracket | Public School | Private School |
| 3 to 4 Year Olds | 0 (0.0%) | 7 (100.0%) |
| 5 to 9 Year Old | 75 (100.0%) | 0 (0.0%) |
| 10 to 14 Year Olds | 50 (100.0%) | 0 (0.0%) |
| 15 to 17 Year Olds | 40 (100.0%) | 0 (0.0%) |
| 18 to 19 Year Olds | 4 (100.0%) | 0 (0.0%) |
| 20 to 24 Year Olds | 0 (0.0%) | 7 (100.0%) |
| 25 to 34 Year Olds | 4 (30.8%) | 9 (69.2%) |
| 35 Years and over | 43 (100.0%) | 0 (0.0%) |
| Total | 216 (90.4%) | 23 (9.6%) |
Educational Attainment by Field of Study in Blawnox borough
Business (163 | 26.3%), social sciences (105 | 16.9%), computers & mathematics (52 | 8.4%), education (49 | 7.9%), and liberal arts & history (48 | 7.7%) are the most common fields of study among 620 individuals in Blawnox borough who have obtained a bachelor's degree or higher.
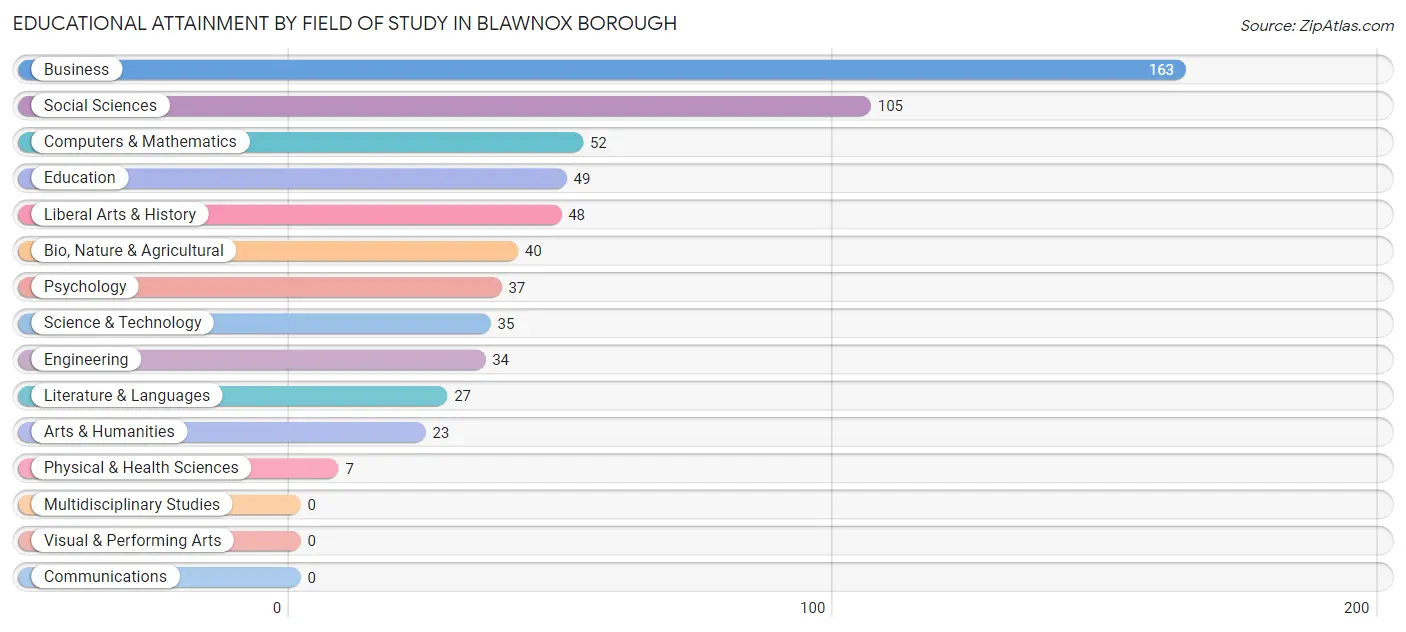
| Field of Study | # Graduates | % Graduates |
| Computers & Mathematics | 52 | 8.4% |
| Bio, Nature & Agricultural | 40 | 6.5% |
| Physical & Health Sciences | 7 | 1.1% |
| Psychology | 37 | 6.0% |
| Social Sciences | 105 | 16.9% |
| Engineering | 34 | 5.5% |
| Multidisciplinary Studies | 0 | 0.0% |
| Science & Technology | 35 | 5.7% |
| Business | 163 | 26.3% |
| Education | 49 | 7.9% |
| Literature & Languages | 27 | 4.3% |
| Liberal Arts & History | 48 | 7.7% |
| Visual & Performing Arts | 0 | 0.0% |
| Communications | 0 | 0.0% |
| Arts & Humanities | 23 | 3.7% |
| Total | 620 | 100.0% |
Transportation & Commute in Blawnox borough
Vehicle Availability by Sex in Blawnox borough
The most prevalent vehicle ownership categories in Blawnox borough are males with 1 vehicle (152, accounting for 34.9%) and females with 1 vehicle (154, making up 46.1%).
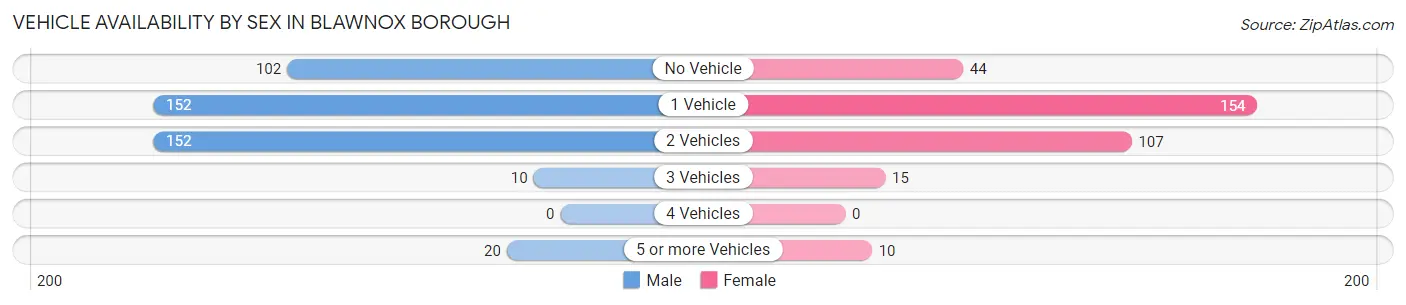
| Vehicles Available | Male | Female |
| No Vehicle | 102 (23.4%) | 44 (13.3%) |
| 1 Vehicle | 152 (34.9%) | 154 (46.7%) |
| 2 Vehicles | 152 (34.9%) | 107 (32.4%) |
| 3 Vehicles | 10 (2.3%) | 15 (4.5%) |
| 4 Vehicles | 0 (0.0%) | 0 (0.0%) |
| 5 or more Vehicles | 20 (4.6%) | 10 (3.0%) |
| Total | 436 (100.0%) | 330 (100.0%) |
Commute Time in Blawnox borough
The most frequently occuring commute durations in Blawnox borough are 5 to 9 minutes (140 commuters, 20.1%), 45 to 59 minutes (108 commuters, 15.5%), and 15 to 19 minutes (86 commuters, 12.4%).
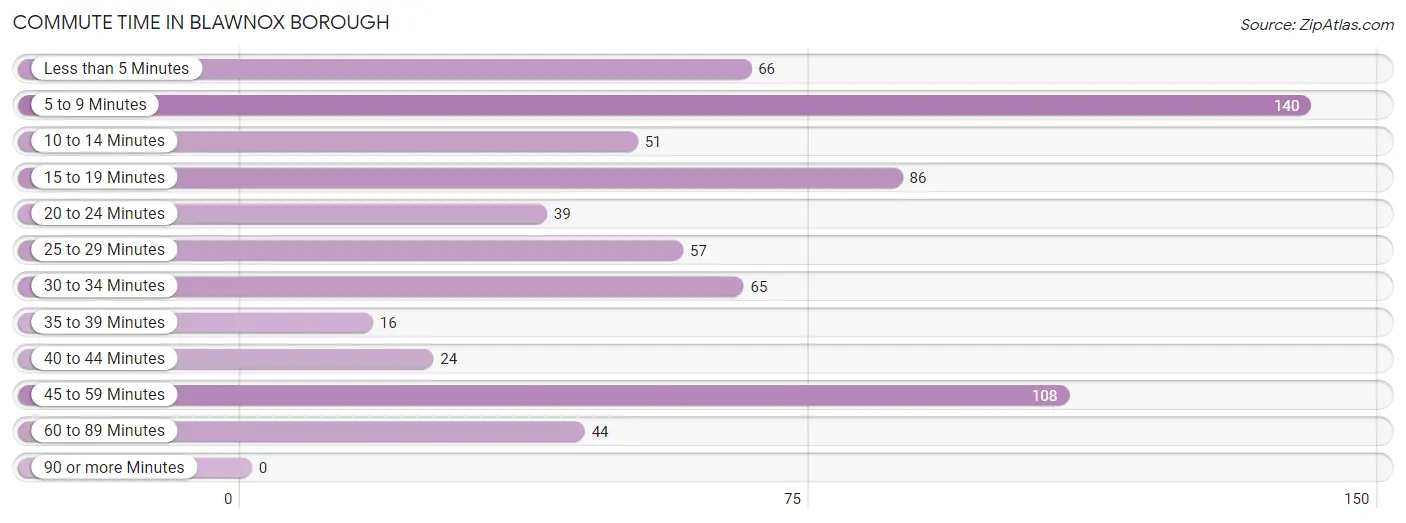
| Commute Time | # Commuters | % Commuters |
| Less than 5 Minutes | 66 | 9.5% |
| 5 to 9 Minutes | 140 | 20.1% |
| 10 to 14 Minutes | 51 | 7.3% |
| 15 to 19 Minutes | 86 | 12.4% |
| 20 to 24 Minutes | 39 | 5.6% |
| 25 to 29 Minutes | 57 | 8.2% |
| 30 to 34 Minutes | 65 | 9.3% |
| 35 to 39 Minutes | 16 | 2.3% |
| 40 to 44 Minutes | 24 | 3.5% |
| 45 to 59 Minutes | 108 | 15.5% |
| 60 to 89 Minutes | 44 | 6.3% |
| 90 or more Minutes | 0 | 0.0% |
Commute Time by Sex in Blawnox borough
The most common commute times in Blawnox borough are 45 to 59 minutes (73 commuters, 18.2%) for males and 5 to 9 minutes (72 commuters, 24.3%) for females.
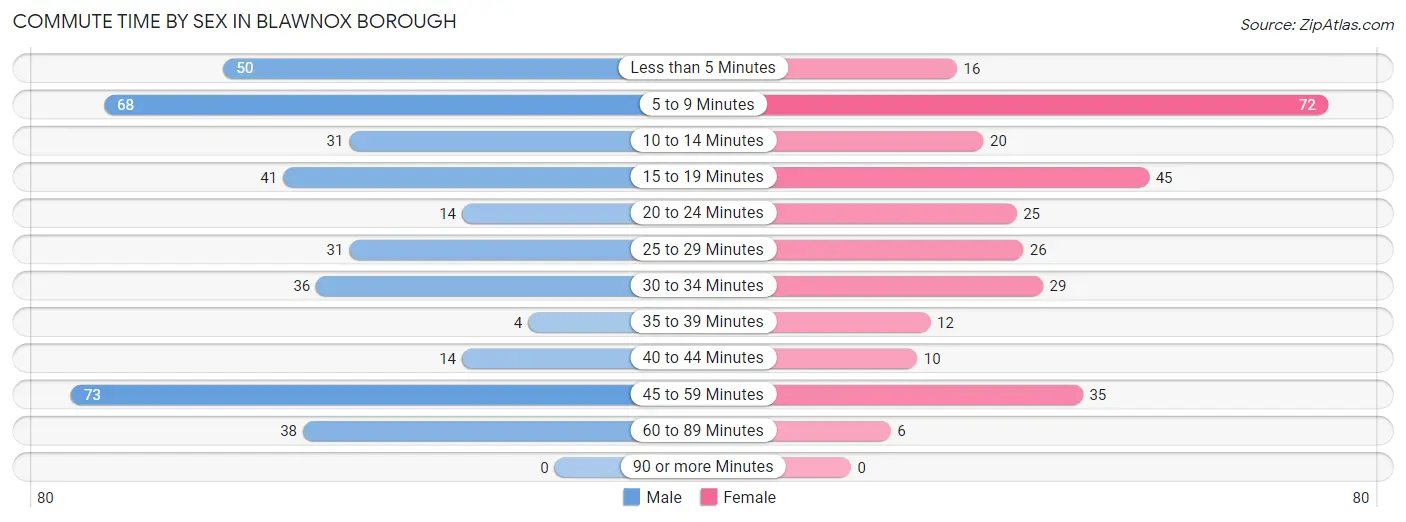
| Commute Time | Male | Female |
| Less than 5 Minutes | 50 (12.5%) | 16 (5.4%) |
| 5 to 9 Minutes | 68 (17.0%) | 72 (24.3%) |
| 10 to 14 Minutes | 31 (7.7%) | 20 (6.8%) |
| 15 to 19 Minutes | 41 (10.2%) | 45 (15.2%) |
| 20 to 24 Minutes | 14 (3.5%) | 25 (8.5%) |
| 25 to 29 Minutes | 31 (7.7%) | 26 (8.8%) |
| 30 to 34 Minutes | 36 (9.0%) | 29 (9.8%) |
| 35 to 39 Minutes | 4 (1.0%) | 12 (4.1%) |
| 40 to 44 Minutes | 14 (3.5%) | 10 (3.4%) |
| 45 to 59 Minutes | 73 (18.2%) | 35 (11.8%) |
| 60 to 89 Minutes | 38 (9.5%) | 6 (2.0%) |
| 90 or more Minutes | 0 (0.0%) | 0 (0.0%) |
Time of Departure to Work by Sex in Blawnox borough
The most frequent times of departure to work in Blawnox borough are 8:00 AM to 8:29 AM (78, 19.5%) for males and 9:00 AM to 9:59 AM (110, 37.2%) for females.
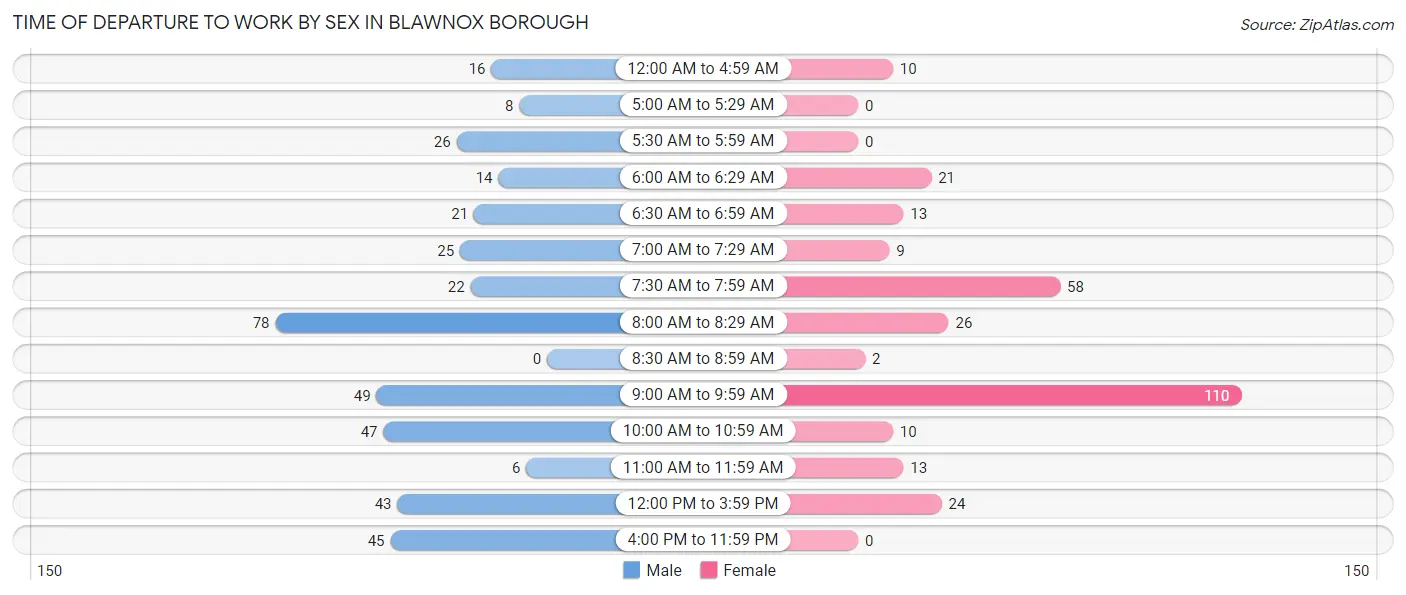
| Time of Departure | Male | Female |
| 12:00 AM to 4:59 AM | 16 (4.0%) | 10 (3.4%) |
| 5:00 AM to 5:29 AM | 8 (2.0%) | 0 (0.0%) |
| 5:30 AM to 5:59 AM | 26 (6.5%) | 0 (0.0%) |
| 6:00 AM to 6:29 AM | 14 (3.5%) | 21 (7.1%) |
| 6:30 AM to 6:59 AM | 21 (5.2%) | 13 (4.4%) |
| 7:00 AM to 7:29 AM | 25 (6.2%) | 9 (3.0%) |
| 7:30 AM to 7:59 AM | 22 (5.5%) | 58 (19.6%) |
| 8:00 AM to 8:29 AM | 78 (19.5%) | 26 (8.8%) |
| 8:30 AM to 8:59 AM | 0 (0.0%) | 2 (0.7%) |
| 9:00 AM to 9:59 AM | 49 (12.2%) | 110 (37.2%) |
| 10:00 AM to 10:59 AM | 47 (11.7%) | 10 (3.4%) |
| 11:00 AM to 11:59 AM | 6 (1.5%) | 13 (4.4%) |
| 12:00 PM to 3:59 PM | 43 (10.7%) | 24 (8.1%) |
| 4:00 PM to 11:59 PM | 45 (11.3%) | 0 (0.0%) |
| Total | 400 (100.0%) | 296 (100.0%) |
Housing Occupancy in Blawnox borough
Occupancy by Ownership in Blawnox borough
Of the total 902 dwellings in Blawnox borough, owner-occupied units account for 336 (37.2%), while renter-occupied units make up 566 (62.7%).
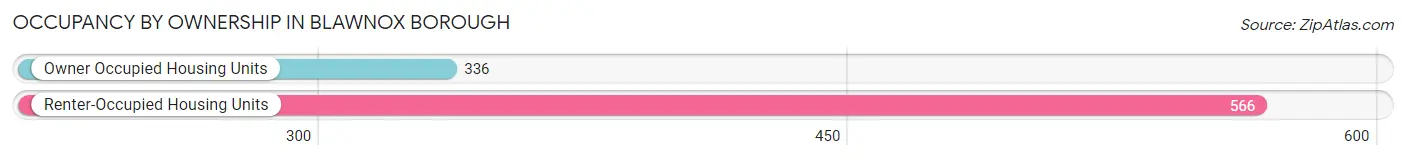
| Occupancy | # Housing Units | % Housing Units |
| Owner Occupied Housing Units | 336 | 37.2% |
| Renter-Occupied Housing Units | 566 | 62.7% |
| Total Occupied Housing Units | 902 | 100.0% |
Occupancy by Household Size in Blawnox borough
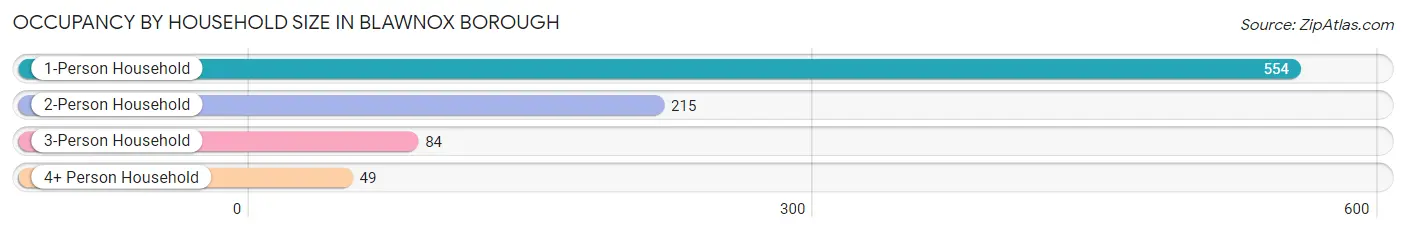
| Household Size | # Housing Units | % Housing Units |
| 1-Person Household | 554 | 61.4% |
| 2-Person Household | 215 | 23.8% |
| 3-Person Household | 84 | 9.3% |
| 4+ Person Household | 49 | 5.4% |
| Total Housing Units | 902 | 100.0% |
Occupancy by Ownership by Household Size in Blawnox borough
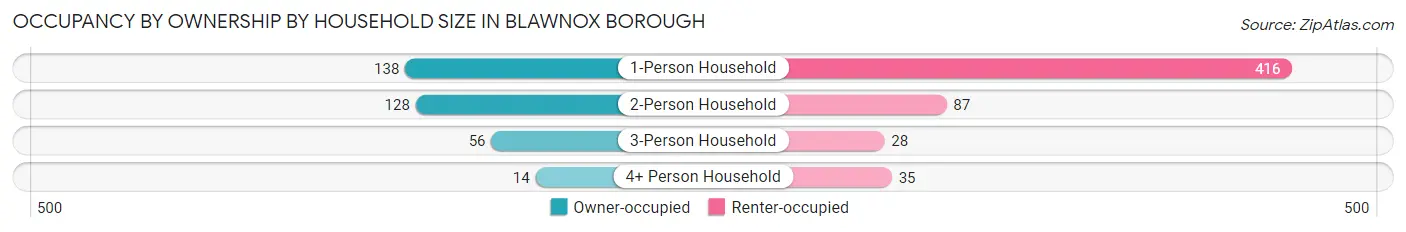
| Household Size | Owner-occupied | Renter-occupied |
| 1-Person Household | 138 (24.9%) | 416 (75.1%) |
| 2-Person Household | 128 (59.5%) | 87 (40.5%) |
| 3-Person Household | 56 (66.7%) | 28 (33.3%) |
| 4+ Person Household | 14 (28.6%) | 35 (71.4%) |
| Total Housing Units | 336 (37.2%) | 566 (62.7%) |
Occupancy by Educational Attainment in Blawnox borough
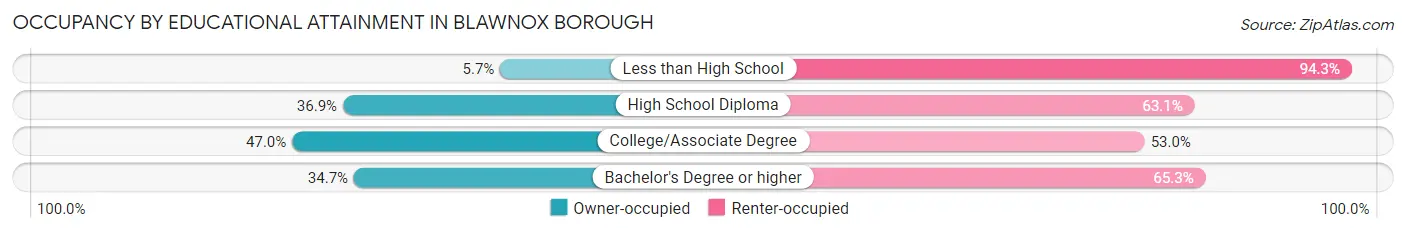
| Household Size | Owner-occupied | Renter-occupied |
| Less than High School | 2 (5.7%) | 33 (94.3%) |
| High School Diploma | 83 (36.9%) | 142 (63.1%) |
| College/Associate Degree | 108 (47.0%) | 122 (53.0%) |
| Bachelor's Degree or higher | 143 (34.7%) | 269 (65.3%) |
Occupancy by Age of Householder in Blawnox borough
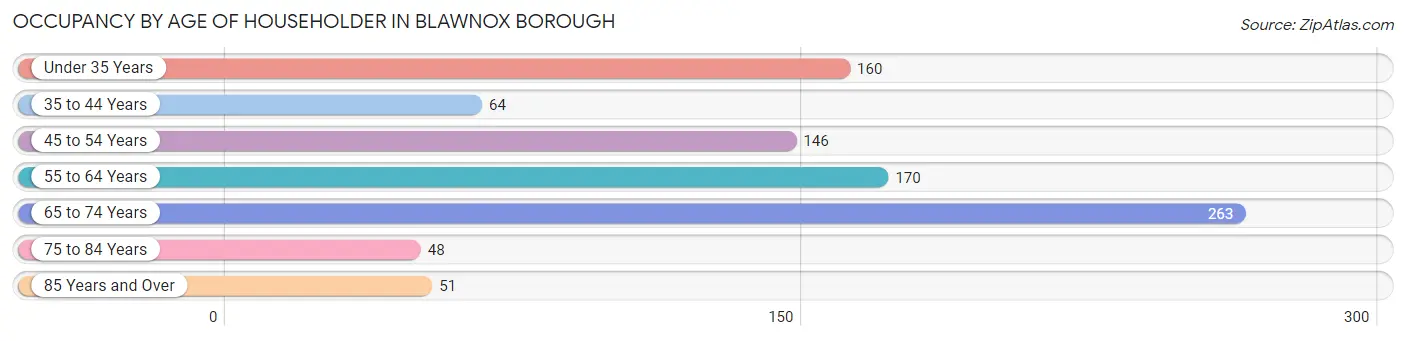
| Age Bracket | # Households | % Households |
| Under 35 Years | 160 | 17.7% |
| 35 to 44 Years | 64 | 7.1% |
| 45 to 54 Years | 146 | 16.2% |
| 55 to 64 Years | 170 | 18.9% |
| 65 to 74 Years | 263 | 29.2% |
| 75 to 84 Years | 48 | 5.3% |
| 85 Years and Over | 51 | 5.7% |
| Total | 902 | 100.0% |
Housing Finances in Blawnox borough
Median Income by Occupancy in Blawnox borough
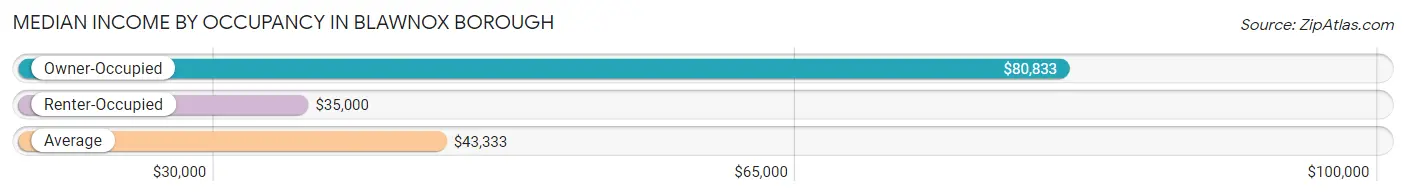
| Occupancy Type | # Households | Median Income |
| Owner-Occupied | 336 (37.2%) | $80,833 |
| Renter-Occupied | 566 (62.7%) | $35,000 |
| Average | 902 (100.0%) | $43,333 |
Occupancy by Householder Income Bracket in Blawnox borough
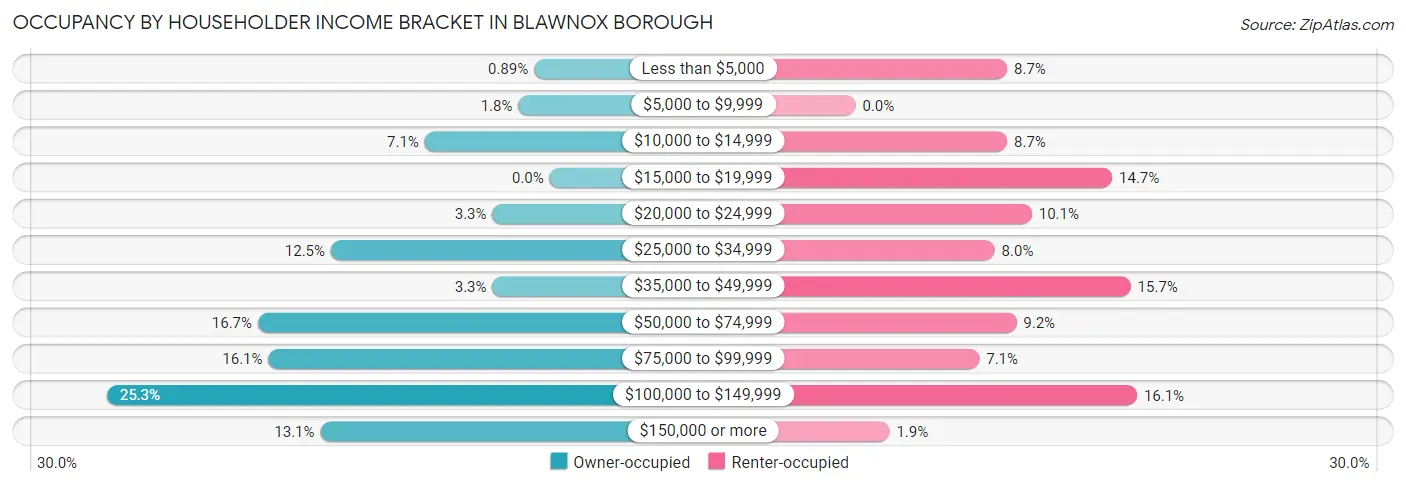
| Income Bracket | Owner-occupied | Renter-occupied |
| Less than $5,000 | 3 (0.9%) | 49 (8.7%) |
| $5,000 to $9,999 | 6 (1.8%) | 0 (0.0%) |
| $10,000 to $14,999 | 24 (7.1%) | 49 (8.7%) |
| $15,000 to $19,999 | 0 (0.0%) | 83 (14.7%) |
| $20,000 to $24,999 | 11 (3.3%) | 57 (10.1%) |
| $25,000 to $34,999 | 42 (12.5%) | 45 (8.0%) |
| $35,000 to $49,999 | 11 (3.3%) | 89 (15.7%) |
| $50,000 to $74,999 | 56 (16.7%) | 52 (9.2%) |
| $75,000 to $99,999 | 54 (16.1%) | 40 (7.1%) |
| $100,000 to $149,999 | 85 (25.3%) | 91 (16.1%) |
| $150,000 or more | 44 (13.1%) | 11 (1.9%) |
| Total | 336 (100.0%) | 566 (100.0%) |
Monthly Housing Cost Tiers in Blawnox borough
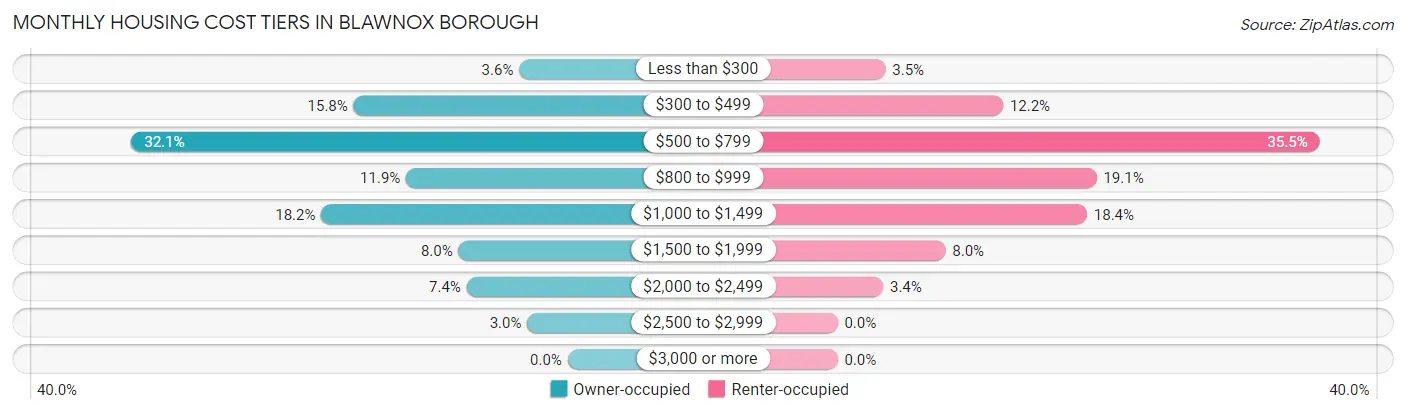
| Monthly Cost | Owner-occupied | Renter-occupied |
| Less than $300 | 12 (3.6%) | 20 (3.5%) |
| $300 to $499 | 53 (15.8%) | 69 (12.2%) |
| $500 to $799 | 108 (32.1%) | 201 (35.5%) |
| $800 to $999 | 40 (11.9%) | 108 (19.1%) |
| $1,000 to $1,499 | 61 (18.1%) | 104 (18.4%) |
| $1,500 to $1,999 | 27 (8.0%) | 45 (8.0%) |
| $2,000 to $2,499 | 25 (7.4%) | 19 (3.4%) |
| $2,500 to $2,999 | 10 (3.0%) | 0 (0.0%) |
| $3,000 or more | 0 (0.0%) | 0 (0.0%) |
| Total | 336 (100.0%) | 566 (100.0%) |
Physical Housing Characteristics in Blawnox borough
Housing Structures in Blawnox borough
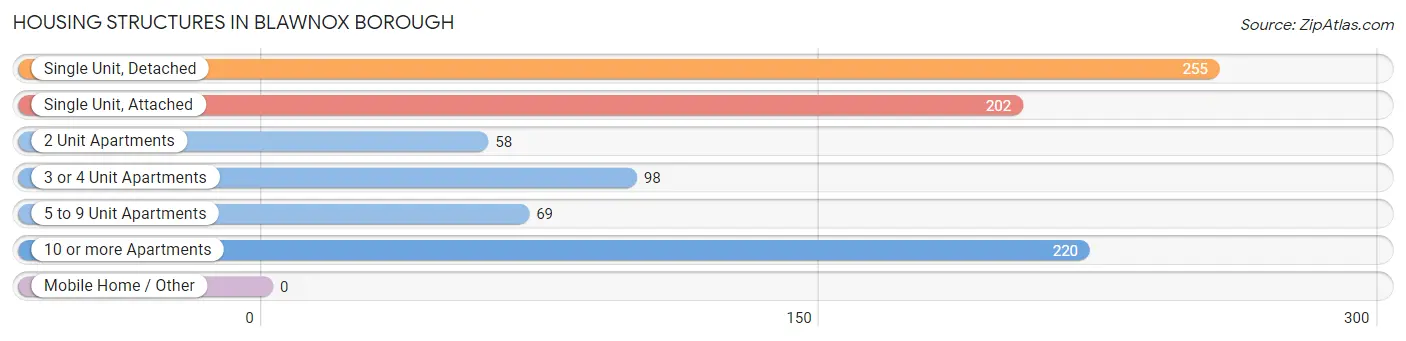
| Structure Type | # Housing Units | % Housing Units |
| Single Unit, Detached | 255 | 28.3% |
| Single Unit, Attached | 202 | 22.4% |
| 2 Unit Apartments | 58 | 6.4% |
| 3 or 4 Unit Apartments | 98 | 10.9% |
| 5 to 9 Unit Apartments | 69 | 7.6% |
| 10 or more Apartments | 220 | 24.4% |
| Mobile Home / Other | 0 | 0.0% |
| Total | 902 | 100.0% |
Housing Structures by Occupancy in Blawnox borough
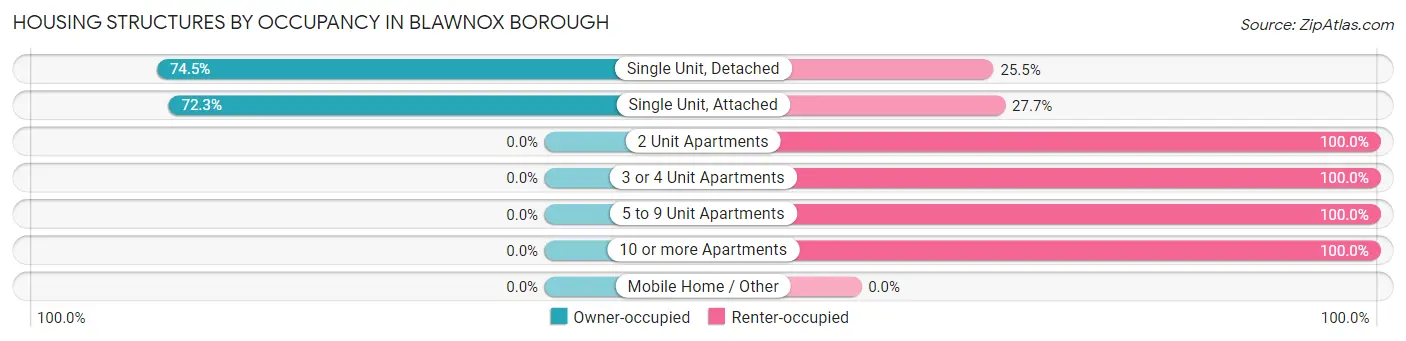
| Structure Type | Owner-occupied | Renter-occupied |
| Single Unit, Detached | 190 (74.5%) | 65 (25.5%) |
| Single Unit, Attached | 146 (72.3%) | 56 (27.7%) |
| 2 Unit Apartments | 0 (0.0%) | 58 (100.0%) |
| 3 or 4 Unit Apartments | 0 (0.0%) | 98 (100.0%) |
| 5 to 9 Unit Apartments | 0 (0.0%) | 69 (100.0%) |
| 10 or more Apartments | 0 (0.0%) | 220 (100.0%) |
| Mobile Home / Other | 0 (0.0%) | 0 (0.0%) |
| Total | 336 (37.2%) | 566 (62.7%) |
Housing Structures by Number of Rooms in Blawnox borough
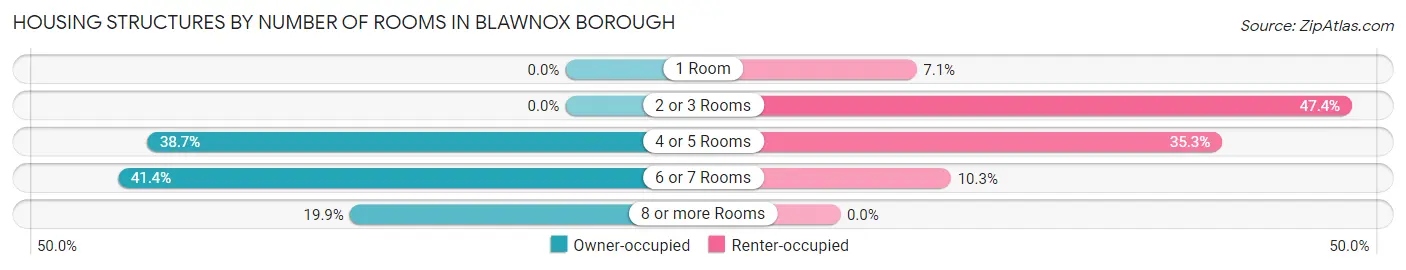
| Number of Rooms | Owner-occupied | Renter-occupied |
| 1 Room | 0 (0.0%) | 40 (7.1%) |
| 2 or 3 Rooms | 0 (0.0%) | 268 (47.3%) |
| 4 or 5 Rooms | 130 (38.7%) | 200 (35.3%) |
| 6 or 7 Rooms | 139 (41.4%) | 58 (10.2%) |
| 8 or more Rooms | 67 (19.9%) | 0 (0.0%) |
| Total | 336 (100.0%) | 566 (100.0%) |
Housing Structure by Heating Type in Blawnox borough
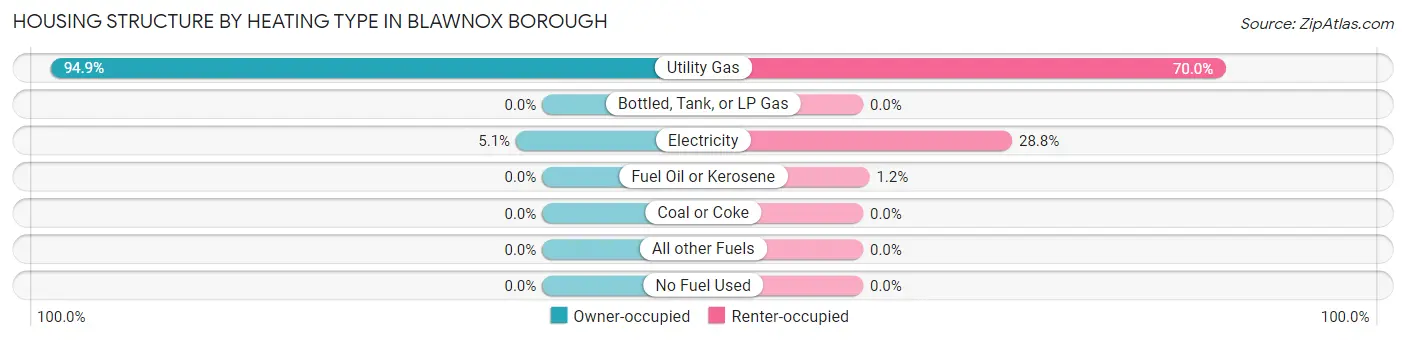
| Heating Type | Owner-occupied | Renter-occupied |
| Utility Gas | 319 (94.9%) | 396 (70.0%) |
| Bottled, Tank, or LP Gas | 0 (0.0%) | 0 (0.0%) |
| Electricity | 17 (5.1%) | 163 (28.8%) |
| Fuel Oil or Kerosene | 0 (0.0%) | 7 (1.2%) |
| Coal or Coke | 0 (0.0%) | 0 (0.0%) |
| All other Fuels | 0 (0.0%) | 0 (0.0%) |
| No Fuel Used | 0 (0.0%) | 0 (0.0%) |
| Total | 336 (100.0%) | 566 (100.0%) |
Household Vehicle Usage in Blawnox borough
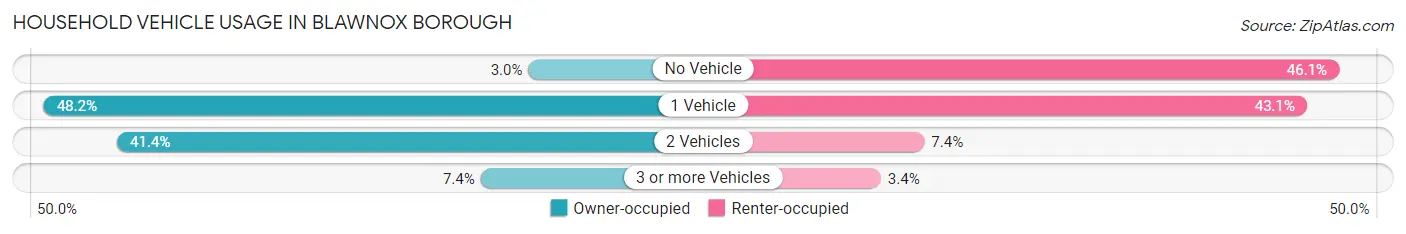
| Vehicles per Household | Owner-occupied | Renter-occupied |
| No Vehicle | 10 (3.0%) | 261 (46.1%) |
| 1 Vehicle | 162 (48.2%) | 244 (43.1%) |
| 2 Vehicles | 139 (41.4%) | 42 (7.4%) |
| 3 or more Vehicles | 25 (7.4%) | 19 (3.4%) |
| Total | 336 (100.0%) | 566 (100.0%) |
Real Estate & Mortgages in Blawnox borough
Real Estate and Mortgage Overview in Blawnox borough
| Characteristic | Without Mortgage | With Mortgage |
| Housing Units | 192 | 144 |
| Median Property Value | $151,200 | $186,300 |
| Median Household Income | $79,091 | $16 |
| Monthly Housing Costs | $576 | $0 |
| Real Estate Taxes | $2,957 | $0 |
Property Value by Mortgage Status in Blawnox borough
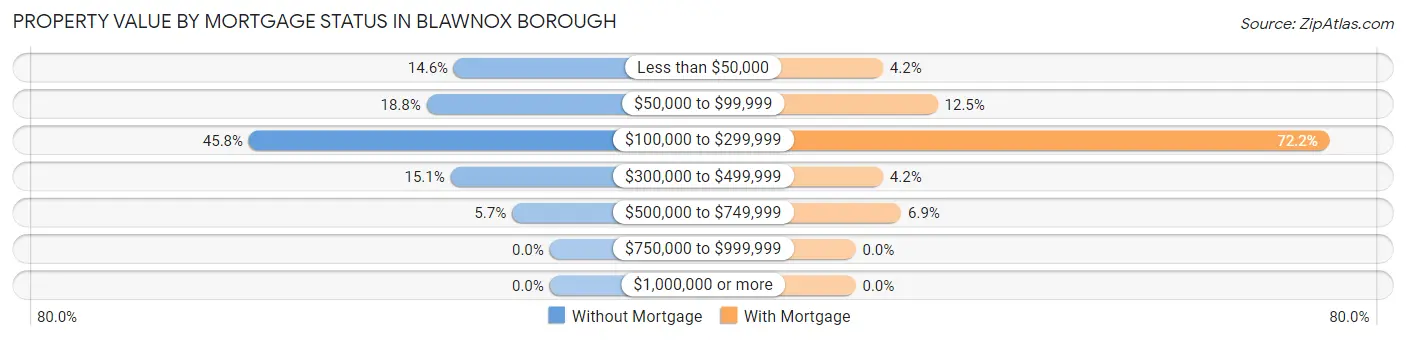
| Property Value | Without Mortgage | With Mortgage |
| Less than $50,000 | 28 (14.6%) | 6 (4.2%) |
| $50,000 to $99,999 | 36 (18.8%) | 18 (12.5%) |
| $100,000 to $299,999 | 88 (45.8%) | 104 (72.2%) |
| $300,000 to $499,999 | 29 (15.1%) | 6 (4.2%) |
| $500,000 to $749,999 | 11 (5.7%) | 10 (6.9%) |
| $750,000 to $999,999 | 0 (0.0%) | 0 (0.0%) |
| $1,000,000 or more | 0 (0.0%) | 0 (0.0%) |
| Total | 192 (100.0%) | 144 (100.0%) |
Household Income by Mortgage Status in Blawnox borough
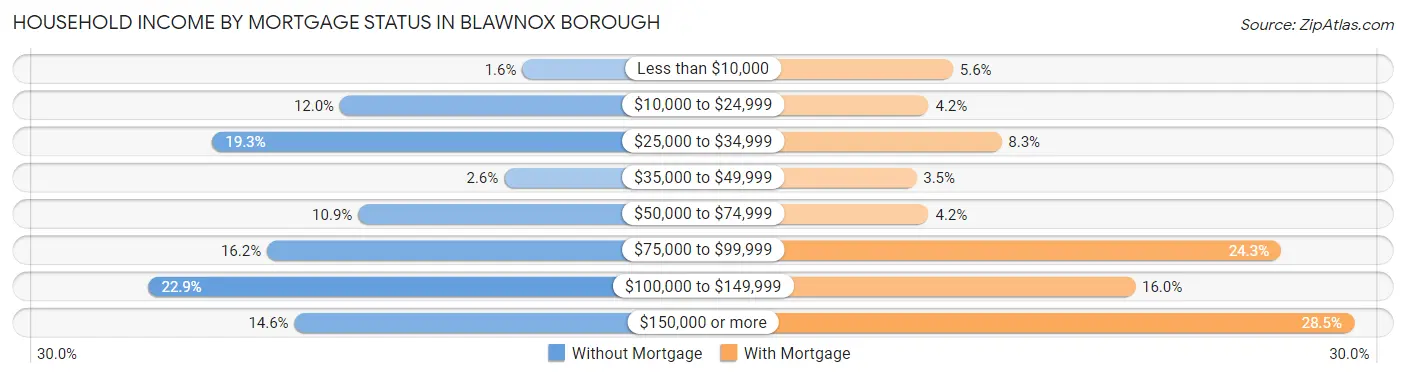
| Household Income | Without Mortgage | With Mortgage |
| Less than $10,000 | 3 (1.6%) | 8 (5.6%) |
| $10,000 to $24,999 | 23 (12.0%) | 6 (4.2%) |
| $25,000 to $34,999 | 37 (19.3%) | 12 (8.3%) |
| $35,000 to $49,999 | 5 (2.6%) | 5 (3.5%) |
| $50,000 to $74,999 | 21 (10.9%) | 6 (4.2%) |
| $75,000 to $99,999 | 31 (16.2%) | 35 (24.3%) |
| $100,000 to $149,999 | 44 (22.9%) | 23 (16.0%) |
| $150,000 or more | 28 (14.6%) | 41 (28.5%) |
| Total | 192 (100.0%) | 144 (100.0%) |
Property Value to Household Income Ratio in Blawnox borough
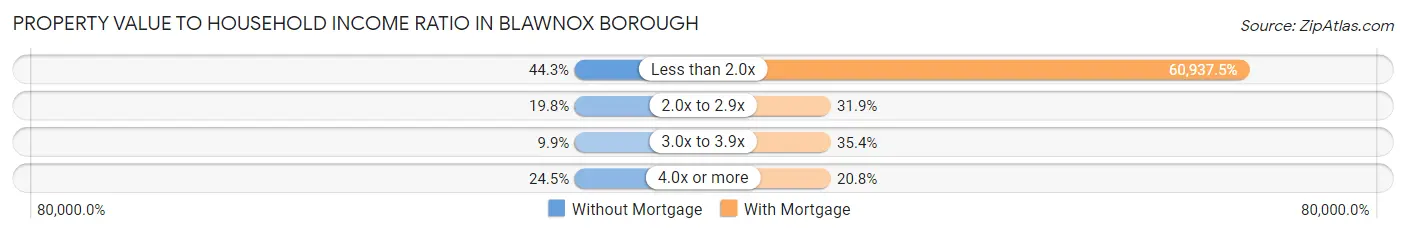
| Value-to-Income Ratio | Without Mortgage | With Mortgage |
| Less than 2.0x | 85 (44.3%) | 87,750 (60,937.5%) |
| 2.0x to 2.9x | 38 (19.8%) | 46 (31.9%) |
| 3.0x to 3.9x | 19 (9.9%) | 51 (35.4%) |
| 4.0x or more | 47 (24.5%) | 30 (20.8%) |
| Total | 192 (100.0%) | 144 (100.0%) |
Real Estate Taxes by Mortgage Status in Blawnox borough
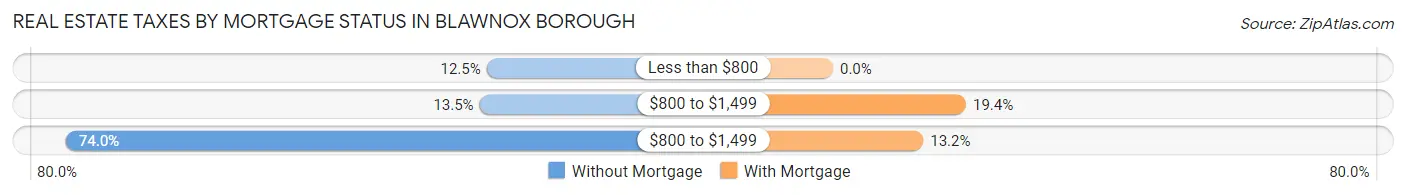
| Property Taxes | Without Mortgage | With Mortgage |
| Less than $800 | 24 (12.5%) | 0 (0.0%) |
| $800 to $1,499 | 26 (13.5%) | 28 (19.4%) |
| $800 to $1,499 | 142 (74.0%) | 19 (13.2%) |
| Total | 192 (100.0%) | 144 (100.0%) |
Health & Disability in Blawnox borough
Health Insurance Coverage by Age in Blawnox borough
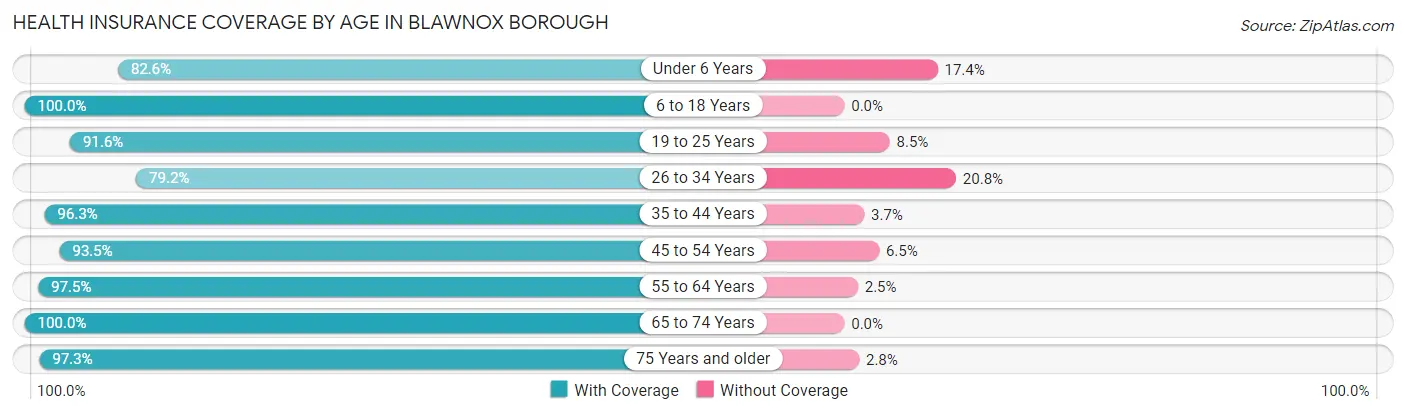
| Age Bracket | With Coverage | Without Coverage |
| Under 6 Years | 57 (82.6%) | 12 (17.4%) |
| 6 to 18 Years | 136 (100.0%) | 0 (0.0%) |
| 19 to 25 Years | 65 (91.5%) | 6 (8.5%) |
| 26 to 34 Years | 175 (79.2%) | 46 (20.8%) |
| 35 to 44 Years | 130 (96.3%) | 5 (3.7%) |
| 45 to 54 Years | 188 (93.5%) | 13 (6.5%) |
| 55 to 64 Years | 233 (97.5%) | 6 (2.5%) |
| 65 to 74 Years | 278 (100.0%) | 0 (0.0%) |
| 75 Years and older | 177 (97.3%) | 5 (2.8%) |
| Total | 1,439 (93.9%) | 93 (6.1%) |
Health Insurance Coverage by Citizenship Status in Blawnox borough
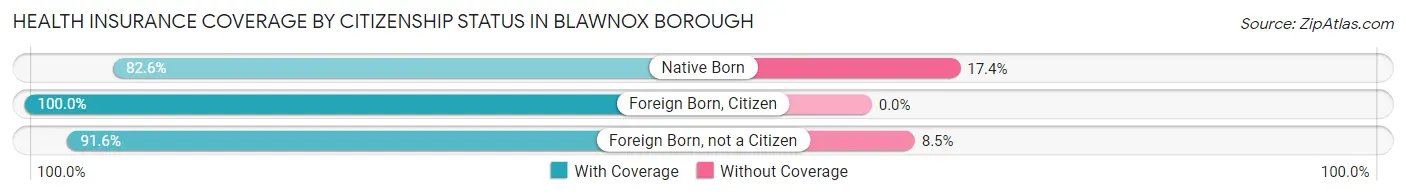
| Citizenship Status | With Coverage | Without Coverage |
| Native Born | 57 (82.6%) | 12 (17.4%) |
| Foreign Born, Citizen | 136 (100.0%) | 0 (0.0%) |
| Foreign Born, not a Citizen | 65 (91.5%) | 6 (8.5%) |
Health Insurance Coverage by Household Income in Blawnox borough
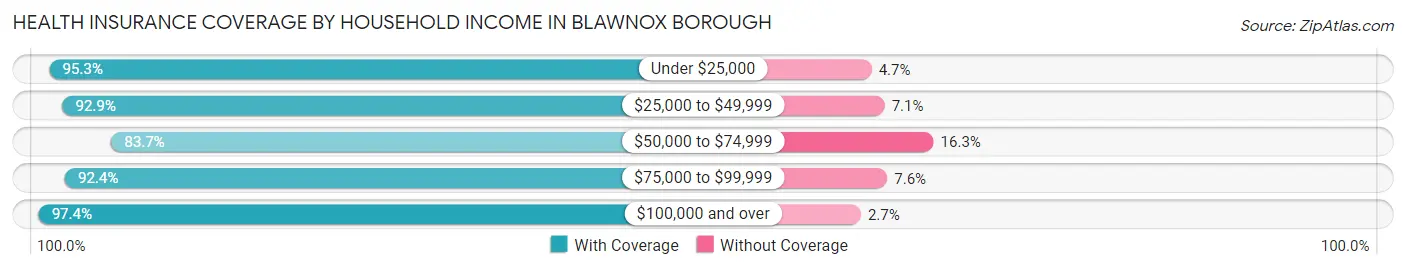
| Household Income | With Coverage | Without Coverage |
| Under $25,000 | 388 (95.3%) | 19 (4.7%) |
| $25,000 to $49,999 | 301 (92.9%) | 23 (7.1%) |
| $50,000 to $74,999 | 139 (83.7%) | 27 (16.3%) |
| $75,000 to $99,999 | 134 (92.4%) | 11 (7.6%) |
| $100,000 and over | 477 (97.4%) | 13 (2.6%) |
Public vs Private Health Insurance Coverage by Age in Blawnox borough
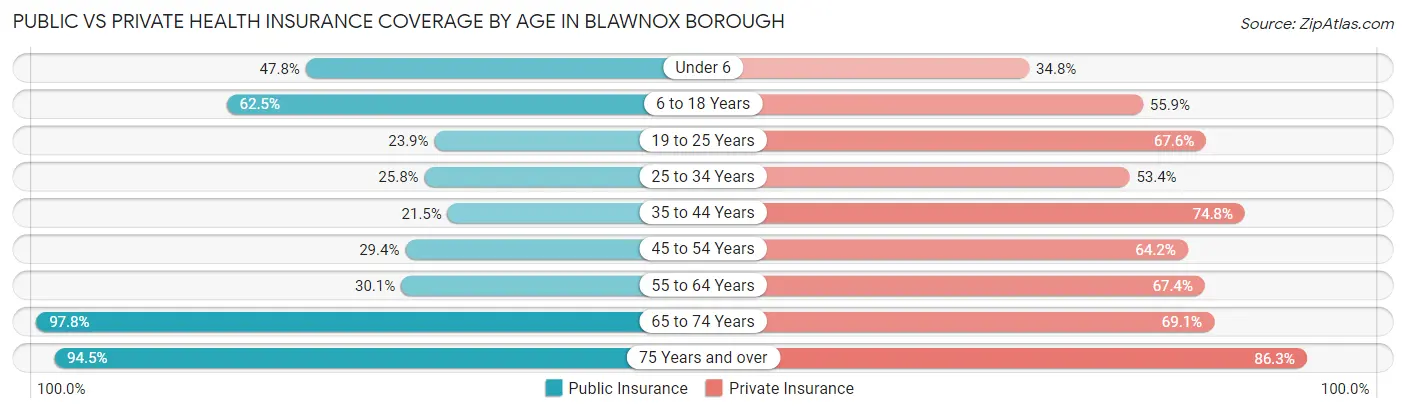
| Age Bracket | Public Insurance | Private Insurance |
| Under 6 | 33 (47.8%) | 24 (34.8%) |
| 6 to 18 Years | 85 (62.5%) | 76 (55.9%) |
| 19 to 25 Years | 17 (23.9%) | 48 (67.6%) |
| 25 to 34 Years | 57 (25.8%) | 118 (53.4%) |
| 35 to 44 Years | 29 (21.5%) | 101 (74.8%) |
| 45 to 54 Years | 59 (29.3%) | 129 (64.2%) |
| 55 to 64 Years | 72 (30.1%) | 161 (67.4%) |
| 65 to 74 Years | 272 (97.8%) | 192 (69.1%) |
| 75 Years and over | 172 (94.5%) | 157 (86.3%) |
| Total | 796 (52.0%) | 1,006 (65.7%) |
Disability Status by Sex by Age in Blawnox borough
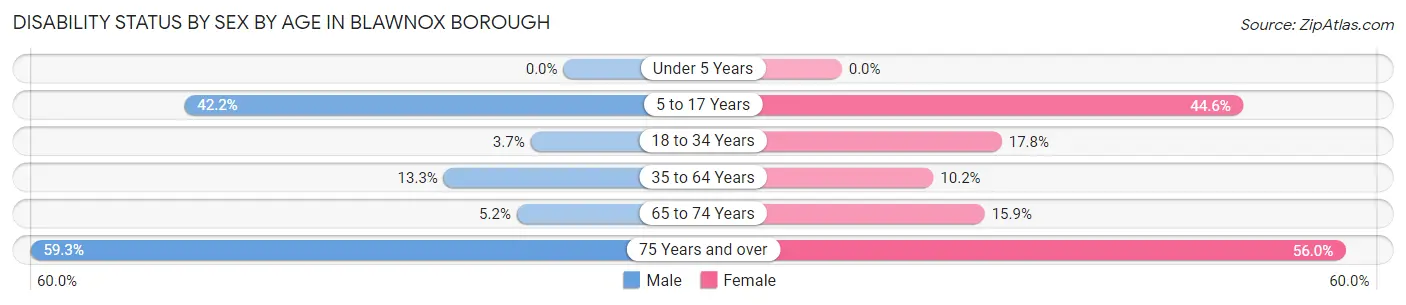
| Age Bracket | Male | Female |
| Under 5 Years | 0 (0.0%) | 0 (0.0%) |
| 5 to 17 Years | 46 (42.2%) | 25 (44.6%) |
| 18 to 34 Years | 7 (3.7%) | 18 (17.8%) |
| 35 to 64 Years | 44 (13.3%) | 25 (10.2%) |
| 65 to 74 Years | 4 (5.2%) | 32 (15.9%) |
| 75 Years and over | 54 (59.3%) | 51 (56.0%) |
Disability Class by Sex by Age in Blawnox borough
Disability Class: Hearing Difficulty
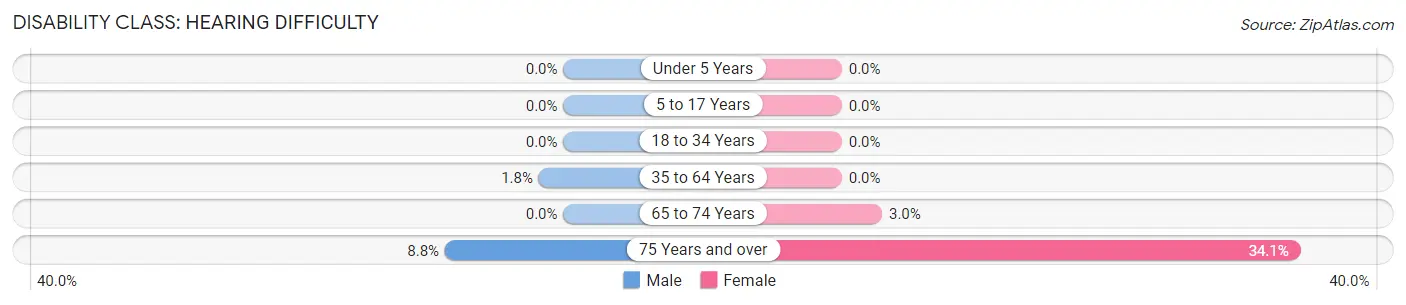
| Age Bracket | Male | Female |
| Under 5 Years | 0 (0.0%) | 0 (0.0%) |
| 5 to 17 Years | 0 (0.0%) | 0 (0.0%) |
| 18 to 34 Years | 0 (0.0%) | 0 (0.0%) |
| 35 to 64 Years | 6 (1.8%) | 0 (0.0%) |
| 65 to 74 Years | 0 (0.0%) | 6 (3.0%) |
| 75 Years and over | 8 (8.8%) | 31 (34.1%) |
Disability Class: Vision Difficulty
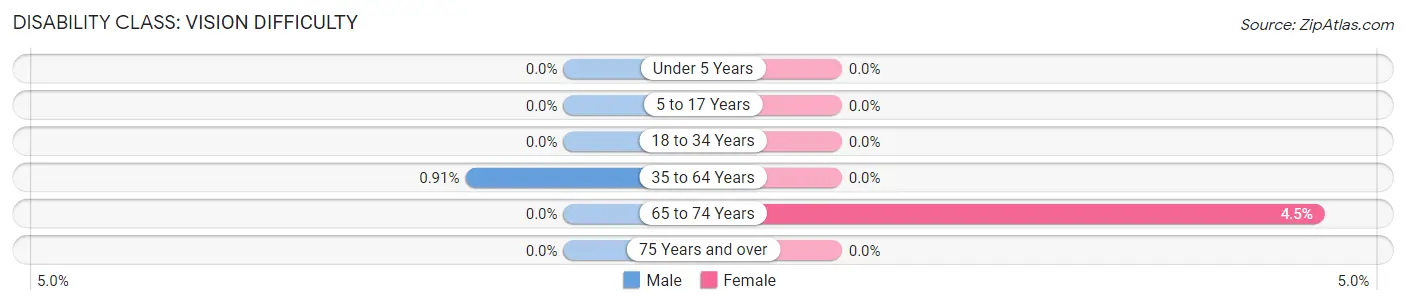
| Age Bracket | Male | Female |
| Under 5 Years | 0 (0.0%) | 0 (0.0%) |
| 5 to 17 Years | 0 (0.0%) | 0 (0.0%) |
| 18 to 34 Years | 0 (0.0%) | 0 (0.0%) |
| 35 to 64 Years | 3 (0.9%) | 0 (0.0%) |
| 65 to 74 Years | 0 (0.0%) | 9 (4.5%) |
| 75 Years and over | 0 (0.0%) | 0 (0.0%) |
Disability Class: Cognitive Difficulty
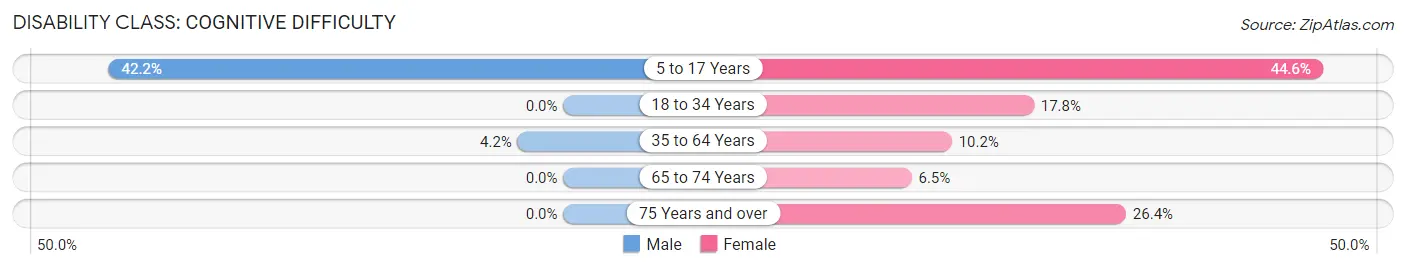
| Age Bracket | Male | Female |
| 5 to 17 Years | 46 (42.2%) | 25 (44.6%) |
| 18 to 34 Years | 0 (0.0%) | 18 (17.8%) |
| 35 to 64 Years | 14 (4.2%) | 25 (10.2%) |
| 65 to 74 Years | 0 (0.0%) | 13 (6.5%) |
| 75 Years and over | 0 (0.0%) | 24 (26.4%) |
Disability Class: Ambulatory Difficulty
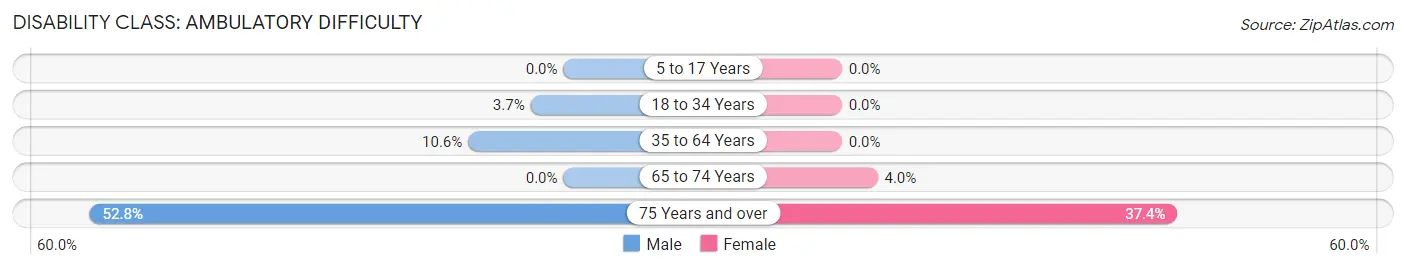
| Age Bracket | Male | Female |
| 5 to 17 Years | 0 (0.0%) | 0 (0.0%) |
| 18 to 34 Years | 7 (3.7%) | 0 (0.0%) |
| 35 to 64 Years | 35 (10.6%) | 0 (0.0%) |
| 65 to 74 Years | 0 (0.0%) | 8 (4.0%) |
| 75 Years and over | 48 (52.7%) | 34 (37.4%) |
Disability Class: Self-Care Difficulty
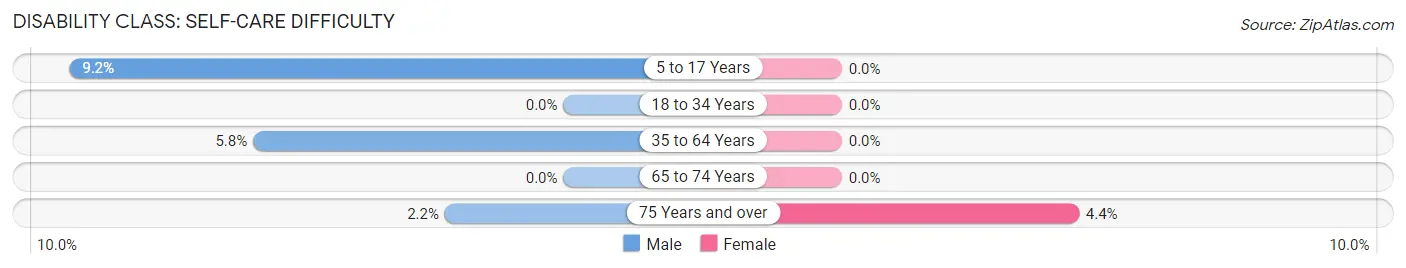
| Age Bracket | Male | Female |
| 5 to 17 Years | 10 (9.2%) | 0 (0.0%) |
| 18 to 34 Years | 0 (0.0%) | 0 (0.0%) |
| 35 to 64 Years | 19 (5.8%) | 0 (0.0%) |
| 65 to 74 Years | 0 (0.0%) | 0 (0.0%) |
| 75 Years and over | 2 (2.2%) | 4 (4.4%) |
Technology Access in Blawnox borough
Computing Device Access in Blawnox borough
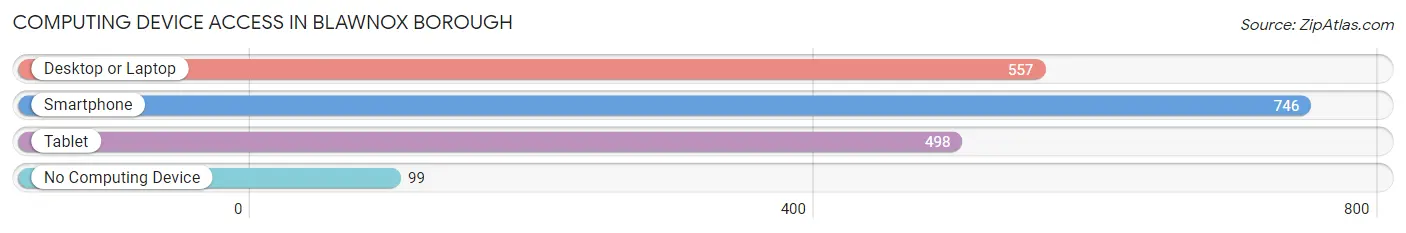
| Device Type | # Households | % Households |
| Desktop or Laptop | 557 | 61.8% |
| Smartphone | 746 | 82.7% |
| Tablet | 498 | 55.2% |
| No Computing Device | 99 | 11.0% |
| Total | 902 | 100.0% |
Internet Access in Blawnox borough
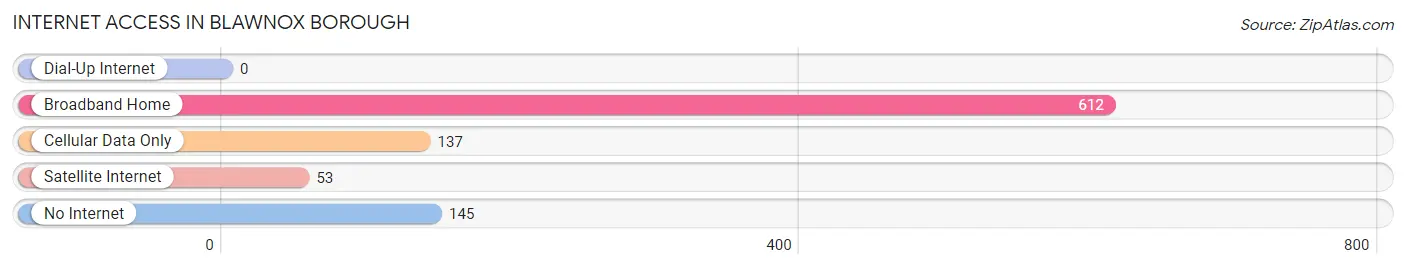
| Internet Type | # Households | % Households |
| Dial-Up Internet | 0 | 0.0% |
| Broadband Home | 612 | 67.8% |
| Cellular Data Only | 137 | 15.2% |
| Satellite Internet | 53 | 5.9% |
| No Internet | 145 | 16.1% |
| Total | 902 | 100.0% |
Blawnox borough Summary
Blawnox Borough is a small borough located in Allegheny County, Pennsylvania. It is situated along the Allegheny River, just north of Pittsburgh. The borough was incorporated in 1891 and has a population of approximately 2,000 people.
History
The area that is now Blawnox Borough was originally inhabited by the Lenape Native Americans. The first European settlers arrived in the area in the late 1700s. The area was originally known as “Blawnox”, which is derived from the Lenape word “Blawn”, meaning “place of the wild onions”. The area was first settled by the Blawn family, who established a farm in the area in 1790.
In 1891, the area was incorporated as a borough. The borough was named after the Blawn family, who had been living in the area for over a century. The borough was originally a rural farming community, but in the early 1900s, the area began to experience rapid growth due to the influx of immigrants from Europe. The borough was also home to several factories, including a steel mill and a glass factory.
Geography
Blawnox Borough is located in Allegheny County, Pennsylvania. It is situated along the Allegheny River, just north of Pittsburgh. The borough covers an area of 1.2 square miles and has a population of approximately 2,000 people. The borough is bordered by the boroughs of Fox Chapel, O’Hara Township, and Sharpsburg.
The borough is located in a hilly region of the Allegheny Plateau. The terrain is mostly wooded, with some open fields and meadows. The borough is home to several parks, including Blawnox Park, which features a playground, picnic area, and walking trails.
Economy
The economy of Blawnox Borough is largely based on manufacturing and retail. The borough is home to several factories, including a steel mill and a glass factory. The borough is also home to several retail stores, including a grocery store, a hardware store, and a pharmacy.
The borough is also home to several restaurants, bars, and cafes. The borough is also home to several professional services, such as lawyers, accountants, and doctors.
Demographics
As of the 2010 census, the population of Blawnox Borough was 2,000. The racial makeup of the borough was 94.2% White, 2.2% African American, 0.7% Asian, 0.3% Native American, and 2.6% from other races. The median household income was $45,000, and the median family income was $50,000.
The borough is home to a diverse population, with people from a variety of backgrounds and cultures. The borough is home to a large Italian-American population, as well as a growing Hispanic population. The borough is also home to a small Jewish community.
Conclusion
Blawnox Borough is a small borough located in Allegheny County, Pennsylvania. It is situated along the Allegheny River, just north of Pittsburgh. The borough was incorporated in 1891 and has a population of approximately 2,000 people. The economy of the borough is largely based on manufacturing and retail, and the borough is home to a diverse population, with people from a variety of backgrounds and cultures.
Common Questions
What is Per Capita Income in Blawnox borough?
Per Capita income in Blawnox borough is $40,216.
What is the Median Family Income in Blawnox borough?
Median Family Income in Blawnox borough is $87,500.
What is the Median Household income in Blawnox borough?
Median Household Income in Blawnox borough is $43,333.
What is Income or Wage Gap in Blawnox borough?
Income or Wage Gap in Blawnox borough is 29.5%.
Women in Blawnox borough earn 70.5 cents for every dollar earned by a man.
What is Family Income Deficit in Blawnox borough?
Family Income Deficit in Blawnox borough is $11,109.
Families that are below poverty line in Blawnox borough earn $11,109 less on average than the poverty threshold level.
What is Inequality or Gini Index in Blawnox borough?
Inequality or Gini Index in Blawnox borough is 0.48.
What is the Total Population of Blawnox borough?
Total Population of Blawnox borough is 1,532.
What is the Total Male Population of Blawnox borough?
Total Male Population of Blawnox borough is 835.
What is the Total Female Population of Blawnox borough?
Total Female Population of Blawnox borough is 697.
What is the Ratio of Males per 100 Females in Blawnox borough?
There are 119.80 Males per 100 Females in Blawnox borough.
What is the Ratio of Females per 100 Males in Blawnox borough?
There are 83.47 Females per 100 Males in Blawnox borough.
What is the Median Population Age in Blawnox borough?
Median Population Age in Blawnox borough is 50.5 Years.
What is the Average Family Size in Blawnox borough
Average Family Size in Blawnox borough is 2.8 People.
What is the Average Household Size in Blawnox borough
Average Household Size in Blawnox borough is 1.7 People.
How Large is the Labor Force in Blawnox borough?
There are 801 People in the Labor Forcein in Blawnox borough.
What is the Percentage of People in the Labor Force in Blawnox borough?
59.5% of People are in the Labor Force in Blawnox borough.
What is the Unemployment Rate in Blawnox borough?
Unemployment Rate in Blawnox borough is 4.4%.