Lewisburg borough, PA Map & Demographics
Lewisburg borough Overview
$28,706
PER CAPITA INCOME
$91,786
AVG FAMILY INCOME
$42,302
AVG HOUSEHOLD INCOME
8.3%
WAGE / INCOME GAP [ % ]
91.7¢/ $1
WAGE / INCOME GAP [ $ ]
0.54
INEQUALITY / GINI INDEX
5,284
TOTAL POPULATION
2,602
MALE POPULATION
2,682
FEMALE POPULATION
97.02
MALES / 100 FEMALES
103.07
FEMALES / 100 MALES
28.6
MEDIAN AGE
2.5
AVG FAMILY SIZE
1.6
AVG HOUSEHOLD SIZE
2,292
LABOR FORCE [ PEOPLE ]
46.5%
PERCENT IN LABOR FORCE
1.6%
UNEMPLOYMENT RATE
Income in Lewisburg borough
Income Overview in Lewisburg borough
Per Capita Income in Lewisburg borough is $28,706, while median incomes of families and households are $91,786 and $42,302 respectively.
| Characteristic | Number | Measure |
| Per Capita Income | 5,284 | $28,706 |
| Median Family Income | 674 | $91,786 |
| Mean Family Income | 674 | $105,836 |
| Median Household Income | 1,973 | $42,302 |
| Mean Household Income | 1,973 | $70,497 |
| Income Deficit | 674 | $0 |
| Wage / Income Gap (%) | 5,284 | 8.31% |
| Wage / Income Gap ($) | 5,284 | 91.69¢ per $1 |
| Gini / Inequality Index | 5,284 | 0.54 |
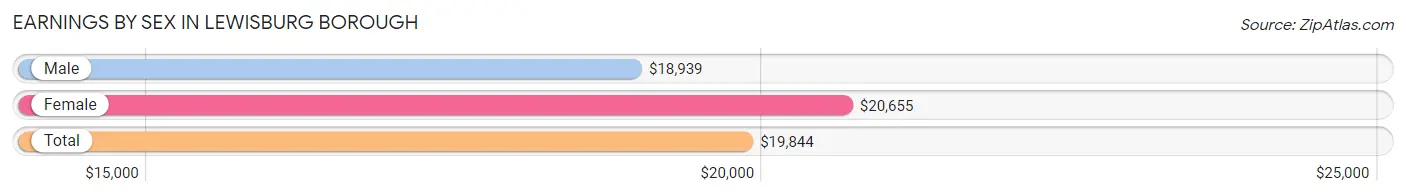
Earnings by Sex in Lewisburg borough
Average Earnings in Lewisburg borough are $19,844, $18,939 for men and $20,655 for women, a difference of 8.3%.
| Sex | Number | Average Earnings |
| Male | 1,476 (51.5%) | $18,939 |
| Female | 1,388 (48.5%) | $20,655 |
| Total | 2,864 (100.0%) | $19,844 |
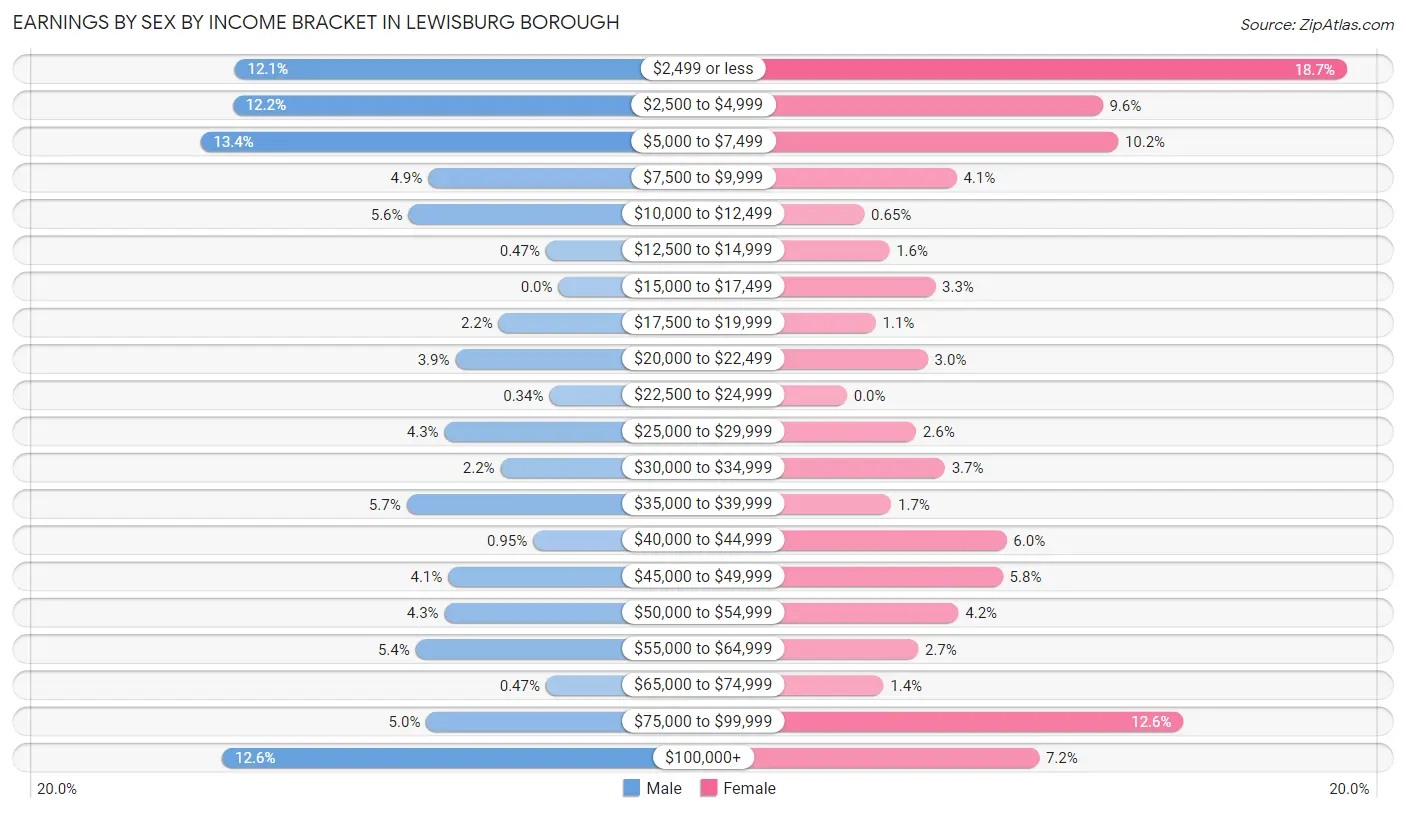
Earnings by Sex by Income Bracket in Lewisburg borough
The most common earnings brackets in Lewisburg borough are $5,000 to $7,499 for men (198 | 13.4%) and $2,499 or less for women (260 | 18.7%).
| Income | Male | Female |
| $2,499 or less | 179 (12.1%) | 260 (18.7%) |
| $2,500 to $4,999 | 180 (12.2%) | 133 (9.6%) |
| $5,000 to $7,499 | 198 (13.4%) | 141 (10.2%) |
| $7,500 to $9,999 | 72 (4.9%) | 57 (4.1%) |
| $10,000 to $12,499 | 83 (5.6%) | 9 (0.6%) |
| $12,500 to $14,999 | 7 (0.5%) | 22 (1.6%) |
| $15,000 to $17,499 | 0 (0.0%) | 46 (3.3%) |
| $17,500 to $19,999 | 33 (2.2%) | 15 (1.1%) |
| $20,000 to $22,499 | 57 (3.9%) | 42 (3.0%) |
| $22,500 to $24,999 | 5 (0.3%) | 0 (0.0%) |
| $25,000 to $29,999 | 63 (4.3%) | 36 (2.6%) |
| $30,000 to $34,999 | 32 (2.2%) | 51 (3.7%) |
| $35,000 to $39,999 | 84 (5.7%) | 23 (1.7%) |
| $40,000 to $44,999 | 14 (0.9%) | 83 (6.0%) |
| $45,000 to $49,999 | 61 (4.1%) | 81 (5.8%) |
| $50,000 to $54,999 | 63 (4.3%) | 58 (4.2%) |
| $55,000 to $64,999 | 79 (5.3%) | 37 (2.7%) |
| $65,000 to $74,999 | 7 (0.5%) | 19 (1.4%) |
| $75,000 to $99,999 | 73 (5.0%) | 175 (12.6%) |
| $100,000+ | 186 (12.6%) | 100 (7.2%) |
| Total | 1,476 (100.0%) | 1,388 (100.0%) |
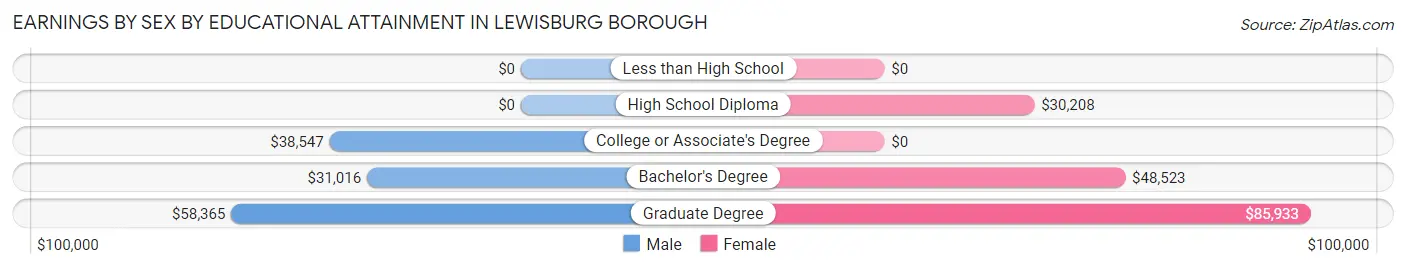
Earnings by Sex by Educational Attainment in Lewisburg borough
Average earnings in Lewisburg borough are $45,313 for men and $52,708 for women, a difference of 14.0%. Men with an educational attainment of graduate degree enjoy the highest average annual earnings of $58,365, while those with bachelor's degree education earn the least with $31,016. Women with an educational attainment of graduate degree earn the most with the average annual earnings of $85,933, while those with high school diploma education have the smallest earnings of $30,208.
| Educational Attainment | Male Income | Female Income |
| Less than High School | - | - |
| High School Diploma | - | - |
| College or Associate's Degree | $38,547 | $0 |
| Bachelor's Degree | $31,016 | $48,523 |
| Graduate Degree | $58,365 | $85,933 |
| Total | $45,313 | $52,708 |
Family Income in Lewisburg borough
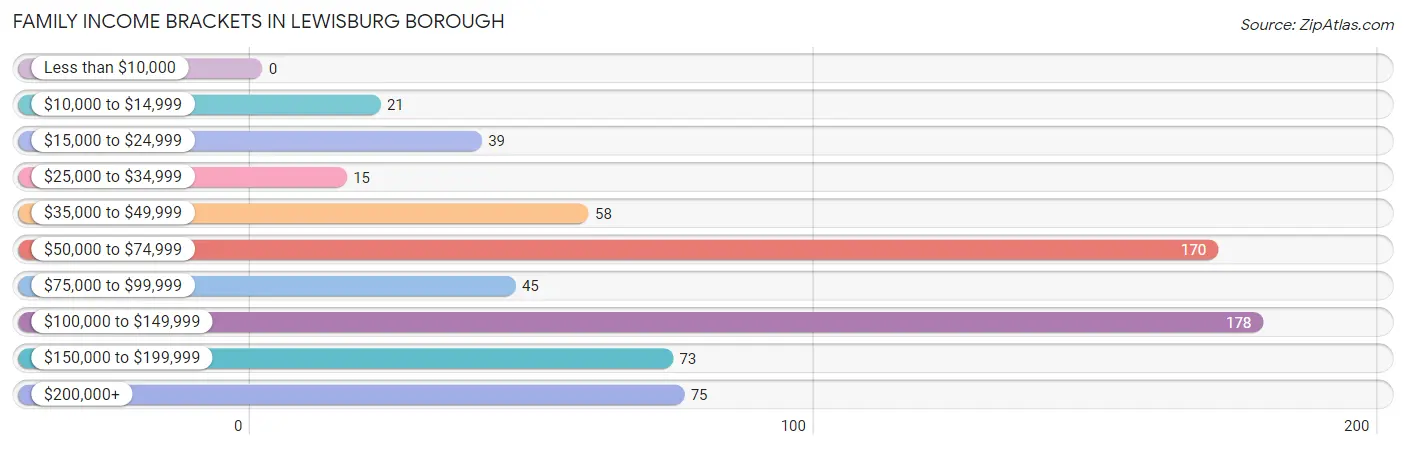
Family Income Brackets in Lewisburg borough
According to the Lewisburg borough family income data, there are 178 families falling into the $100,000 to $149,999 income range, which is the most common income bracket and makes up 26.4% of all families.
| Income Bracket | # Families | % Families |
| Less than $10,000 | 0 | 0.0% |
| $10,000 to $14,999 | 21 | 3.1% |
| $15,000 to $24,999 | 39 | 5.8% |
| $25,000 to $34,999 | 15 | 2.2% |
| $35,000 to $49,999 | 58 | 8.6% |
| $50,000 to $74,999 | 170 | 25.2% |
| $75,000 to $99,999 | 45 | 6.7% |
| $100,000 to $149,999 | 178 | 26.4% |
| $150,000 to $199,999 | 73 | 10.8% |
| $200,000+ | 75 | 11.1% |
Family Income by Famaliy Size in Lewisburg borough
4-person families (22 | 3.3%) account for the highest median family income in Lewisburg borough with $121,563 per family, while 3-person families (152 | 22.6%) have the highest median income of $35,417 per family member.
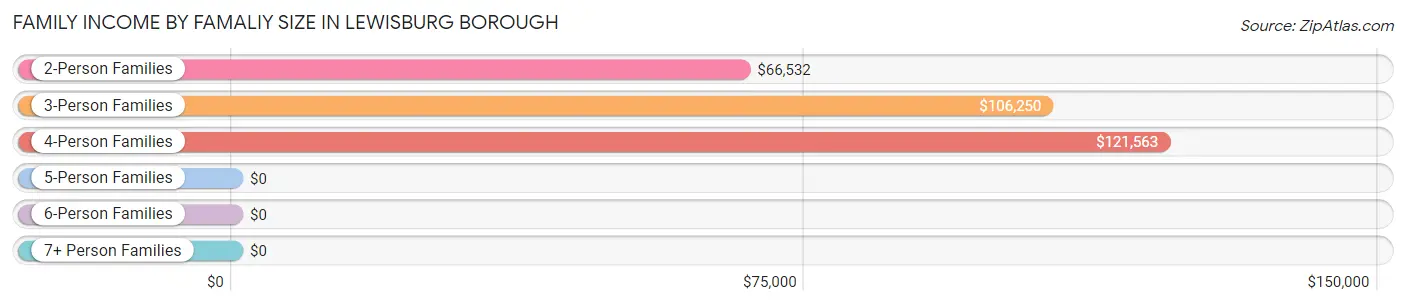
| Income Bracket | # Families | Median Income |
| 2-Person Families | 454 (67.4%) | $66,532 |
| 3-Person Families | 152 (22.6%) | $106,250 |
| 4-Person Families | 22 (3.3%) | $121,563 |
| 5-Person Families | 0 (0.0%) | $0 |
| 6-Person Families | 46 (6.8%) | $0 |
| 7+ Person Families | 0 (0.0%) | $0 |
| Total | 674 (100.0%) | $91,786 |
Family Income by Number of Earners in Lewisburg borough
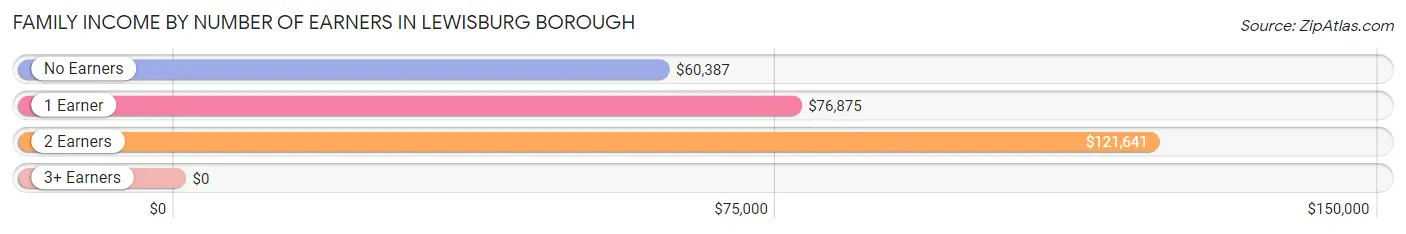
| Number of Earners | # Families | Median Income |
| No Earners | 163 (24.2%) | $60,387 |
| 1 Earner | 158 (23.4%) | $76,875 |
| 2 Earners | 339 (50.3%) | $121,641 |
| 3+ Earners | 14 (2.1%) | $0 |
| Total | 674 (100.0%) | $91,786 |
Household Income in Lewisburg borough
Household Income Brackets in Lewisburg borough
With 314 households falling in the category, the $50,000 to $74,999 income range is the most frequent in Lewisburg borough, accounting for 15.9% of all households. In contrast, only 77 households (3.9%) fall into the $150,000 to $199,999 income bracket, making it the least populous group.
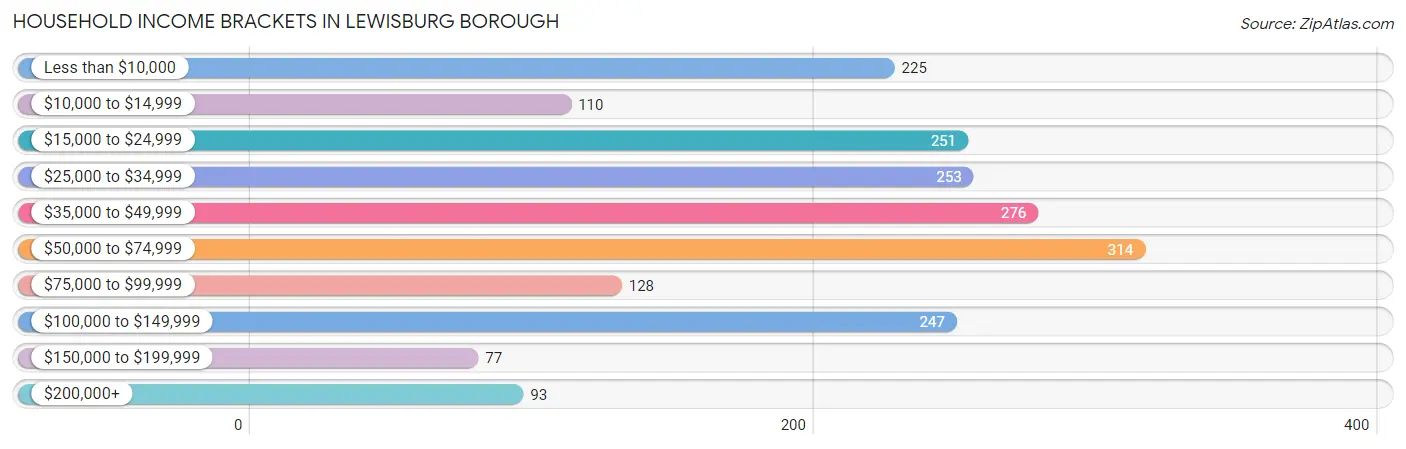
| Income Bracket | # Households | % Households |
| Less than $10,000 | 225 | 11.4% |
| $10,000 to $14,999 | 110 | 5.6% |
| $15,000 to $24,999 | 251 | 12.7% |
| $25,000 to $34,999 | 253 | 12.8% |
| $35,000 to $49,999 | 276 | 14.0% |
| $50,000 to $74,999 | 314 | 15.9% |
| $75,000 to $99,999 | 128 | 6.5% |
| $100,000 to $149,999 | 247 | 12.5% |
| $150,000 to $199,999 | 77 | 3.9% |
| $200,000+ | 93 | 4.7% |
Household Income by Householder Age in Lewisburg borough
The median household income in Lewisburg borough is $42,302, with the highest median household income of $60,651 found in the 45 to 64 years age bracket for the primary householder. A total of 711 households (36.0%) fall into this category. Meanwhile, the 15 to 24 years age bracket for the primary householder has the lowest median household income of $0, with 141 households (7.1%) in this group.
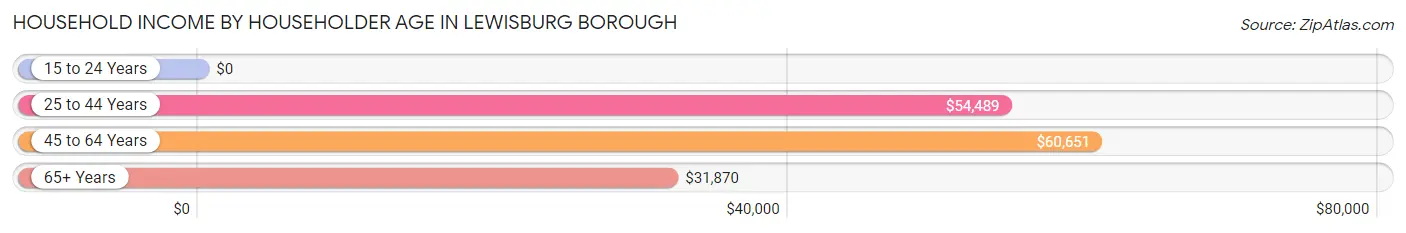
| Income Bracket | # Households | Median Income |
| 15 to 24 Years | 141 (7.1%) | $0 |
| 25 to 44 Years | 515 (26.1%) | $54,489 |
| 45 to 64 Years | 711 (36.0%) | $60,651 |
| 65+ Years | 606 (30.7%) | $31,870 |
| Total | 1,973 (100.0%) | $42,302 |
Poverty in Lewisburg borough
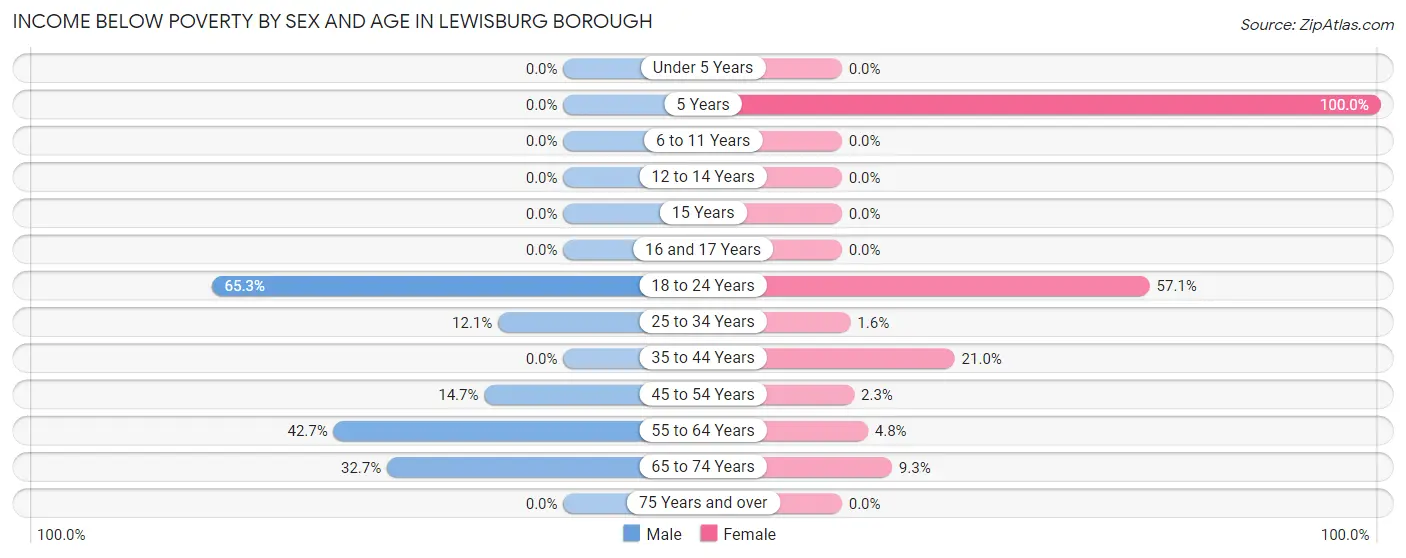
Income Below Poverty by Sex and Age in Lewisburg borough
With 21.7% poverty level for males and 11.1% for females among the residents of Lewisburg borough, 18 to 24 year old males and 5 year old females are the most vulnerable to poverty, with 47 males (65.3%) and 18 females (100.0%) in their respective age groups living below the poverty level.
| Age Bracket | Male | Female |
| Under 5 Years | 0 (0.0%) | 0 (0.0%) |
| 5 Years | 0 (0.0%) | 18 (100.0%) |
| 6 to 11 Years | 0 (0.0%) | 0 (0.0%) |
| 12 to 14 Years | 0 (0.0%) | 0 (0.0%) |
| 15 Years | 0 (0.0%) | 0 (0.0%) |
| 16 and 17 Years | 0 (0.0%) | 0 (0.0%) |
| 18 to 24 Years | 47 (65.3%) | 92 (57.1%) |
| 25 to 34 Years | 39 (12.1%) | 3 (1.6%) |
| 35 to 44 Years | 0 (0.0%) | 31 (20.9%) |
| 45 to 54 Years | 27 (14.7%) | 5 (2.3%) |
| 55 to 64 Years | 119 (42.6%) | 17 (4.8%) |
| 65 to 74 Years | 107 (32.7%) | 20 (9.3%) |
| 75 Years and over | 0 (0.0%) | 0 (0.0%) |
| Total | 339 (21.7%) | 186 (11.1%) |
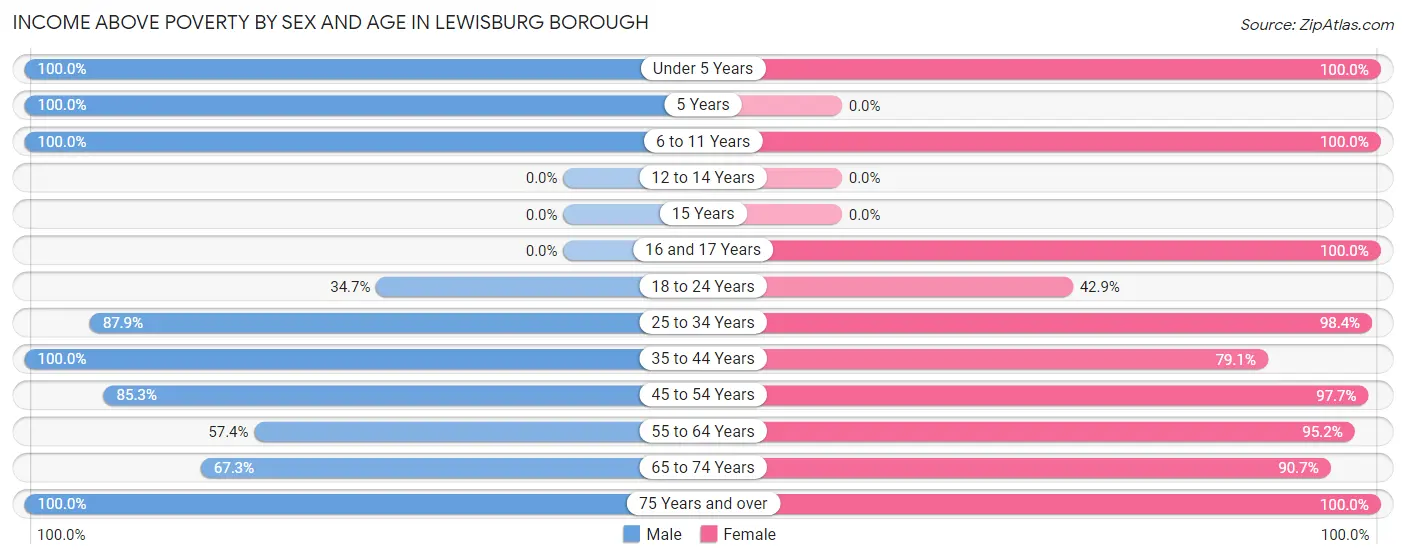
Income Above Poverty by Sex and Age in Lewisburg borough
According to the poverty statistics in Lewisburg borough, males aged under 5 years and females aged under 5 years are the age groups that are most secure financially, with 100.0% of males and 100.0% of females in these age groups living above the poverty line.
| Age Bracket | Male | Female |
| Under 5 Years | 43 (100.0%) | 44 (100.0%) |
| 5 Years | 9 (100.0%) | 0 (0.0%) |
| 6 to 11 Years | 102 (100.0%) | 140 (100.0%) |
| 12 to 14 Years | 0 (0.0%) | 0 (0.0%) |
| 15 Years | 0 (0.0%) | 0 (0.0%) |
| 16 and 17 Years | 0 (0.0%) | 14 (100.0%) |
| 18 to 24 Years | 25 (34.7%) | 69 (42.9%) |
| 25 to 34 Years | 283 (87.9%) | 184 (98.4%) |
| 35 to 44 Years | 165 (100.0%) | 117 (79.0%) |
| 45 to 54 Years | 157 (85.3%) | 214 (97.7%) |
| 55 to 64 Years | 160 (57.4%) | 335 (95.2%) |
| 65 to 74 Years | 220 (67.3%) | 195 (90.7%) |
| 75 Years and over | 56 (100.0%) | 177 (100.0%) |
| Total | 1,220 (78.3%) | 1,489 (88.9%) |
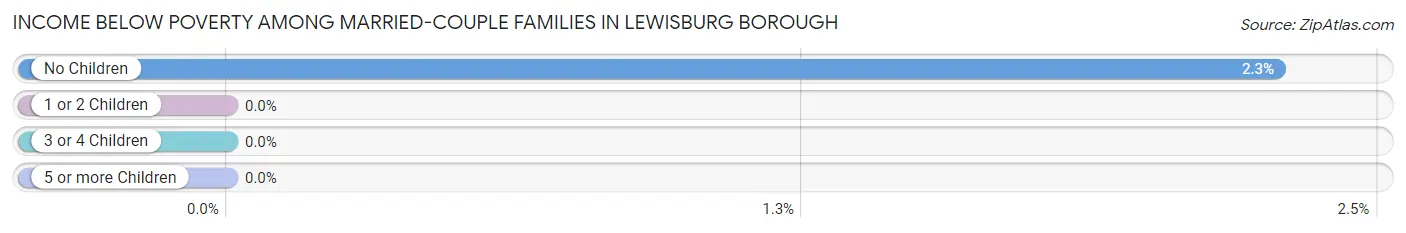
Income Below Poverty Among Married-Couple Families in Lewisburg borough
The poverty statistics for married-couple families in Lewisburg borough show that 1.6% or 9 of the total 571 families live below the poverty line. Families with no children have the highest poverty rate of 2.3%, comprising of 9 families. On the other hand, families with 1 or 2 children have the lowest poverty rate of 0.0%, which includes 0 families.
| Children | Above Poverty | Below Poverty |
| No Children | 385 (97.7%) | 9 (2.3%) |
| 1 or 2 Children | 131 (100.0%) | 0 (0.0%) |
| 3 or 4 Children | 46 (100.0%) | 0 (0.0%) |
| 5 or more Children | 0 (0.0%) | 0 (0.0%) |
| Total | 562 (98.4%) | 9 (1.6%) |
Income Below Poverty Among Single-Parent Households in Lewisburg borough
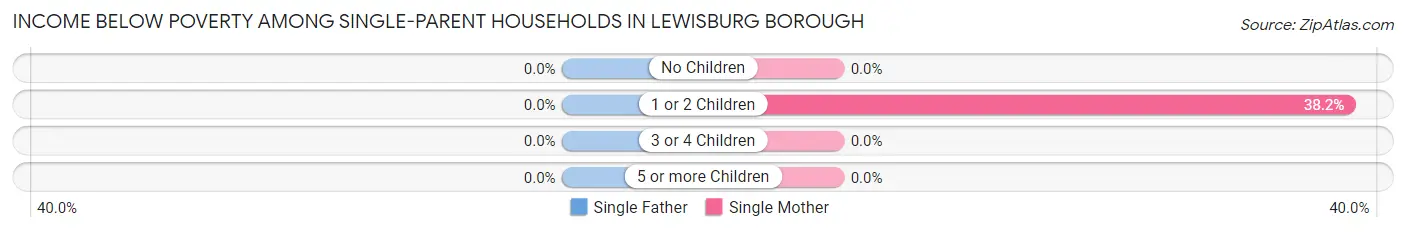
| Children | Single Father | Single Mother |
| No Children | 0 (0.0%) | 0 (0.0%) |
| 1 or 2 Children | 0 (0.0%) | 21 (38.2%) |
| 3 or 4 Children | 0 (0.0%) | 0 (0.0%) |
| 5 or more Children | 0 (0.0%) | 0 (0.0%) |
| Total | 0 (0.0%) | 21 (22.1%) |
Income Below Poverty Among Married-Couple vs Single-Parent Households in Lewisburg borough
The poverty data for Lewisburg borough shows that 9 of the married-couple family households (1.6%) and 21 of the single-parent households (20.4%) are living below the poverty level. Within the married-couple family households, those with no children have the highest poverty rate, with 9 households (2.3%) falling below the poverty line. Among the single-parent households, those with 1 or 2 children have the highest poverty rate, with 21 household (33.3%) living below poverty.
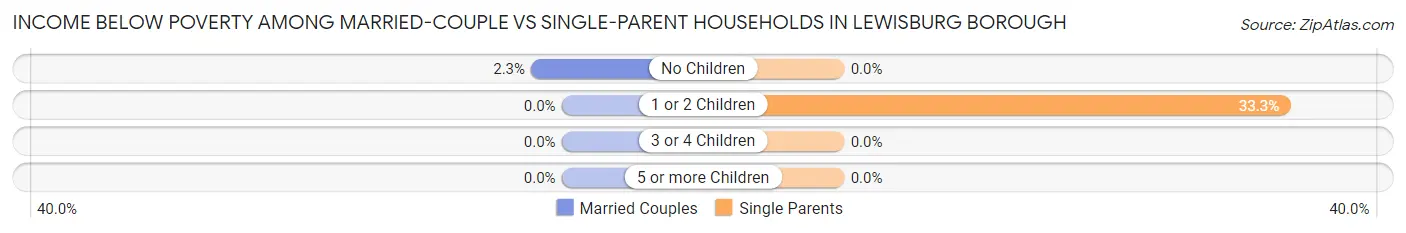
| Children | Married-Couple Families | Single-Parent Households |
| No Children | 9 (2.3%) | 0 (0.0%) |
| 1 or 2 Children | 0 (0.0%) | 21 (33.3%) |
| 3 or 4 Children | 0 (0.0%) | 0 (0.0%) |
| 5 or more Children | 0 (0.0%) | 0 (0.0%) |
| Total | 9 (1.6%) | 21 (20.4%) |
Race in Lewisburg borough
The most populous races in Lewisburg borough are White / Caucasian (4,915 | 93.0%), Hispanic or Latino (205 | 3.9%), and Black / African American (128 | 2.4%).
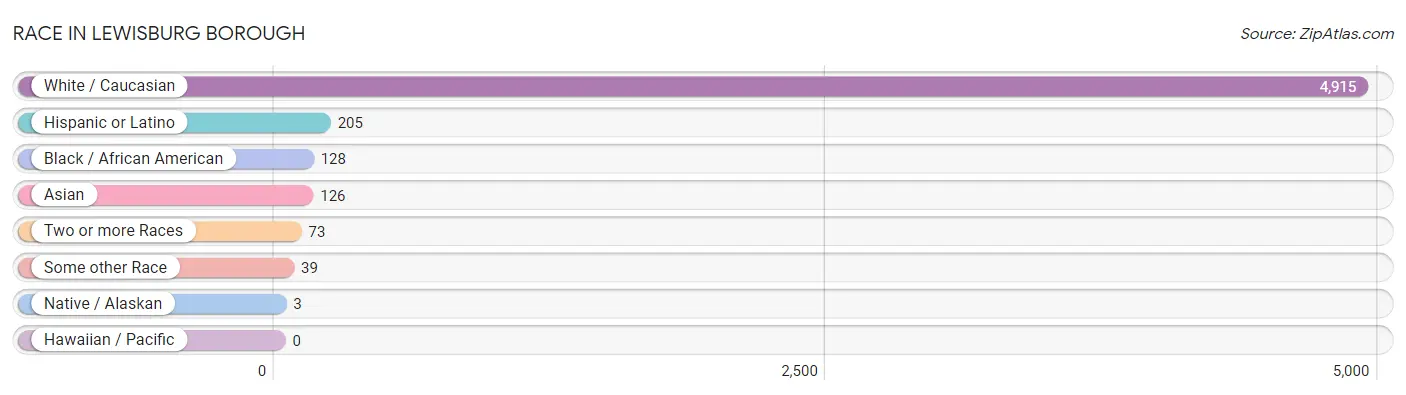
| Race | # Population | % Population |
| Asian | 126 | 2.4% |
| Black / African American | 128 | 2.4% |
| Hawaiian / Pacific | 0 | 0.0% |
| Hispanic or Latino | 205 | 3.9% |
| Native / Alaskan | 3 | 0.1% |
| White / Caucasian | 4,915 | 93.0% |
| Two or more Races | 73 | 1.4% |
| Some other Race | 39 | 0.7% |
| Total | 5,284 | 100.0% |
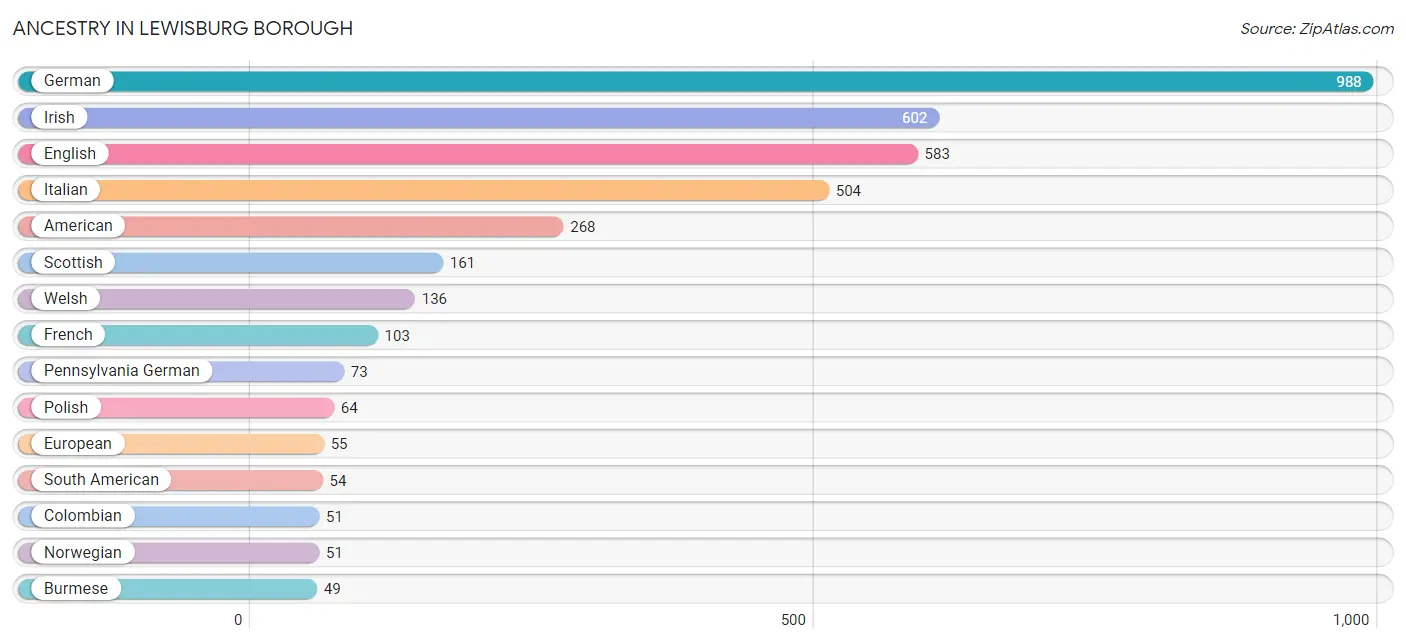
Ancestry in Lewisburg borough
The most populous ancestries reported in Lewisburg borough are German (988 | 18.7%), Irish (602 | 11.4%), English (583 | 11.0%), Italian (504 | 9.5%), and American (268 | 5.1%), together accounting for 55.7% of all Lewisburg borough residents.
| Ancestry | # Population | % Population |
| American | 268 | 5.1% |
| Belgian | 7 | 0.1% |
| Bhutanese | 11 | 0.2% |
| British | 2 | 0.0% |
| Burmese | 49 | 0.9% |
| Central American | 43 | 0.8% |
| Colombian | 51 | 1.0% |
| Costa Rican | 43 | 0.8% |
| Cuban | 18 | 0.3% |
| Czechoslovakian | 28 | 0.5% |
| Danish | 14 | 0.3% |
| Dutch | 19 | 0.4% |
| Eastern European | 15 | 0.3% |
| English | 583 | 11.0% |
| European | 55 | 1.0% |
| French | 103 | 1.9% |
| German | 988 | 18.7% |
| Greek | 14 | 0.3% |
| Hungarian | 18 | 0.3% |
| Indian (Asian) | 46 | 0.9% |
| Irish | 602 | 11.4% |
| Italian | 504 | 9.5% |
| Korean | 7 | 0.1% |
| Latvian | 34 | 0.6% |
| Lithuanian | 24 | 0.4% |
| Navajo | 5 | 0.1% |
| Norwegian | 51 | 1.0% |
| Osage | 3 | 0.1% |
| Pennsylvania German | 73 | 1.4% |
| Polish | 64 | 1.2% |
| Portuguese | 3 | 0.1% |
| Puerto Rican | 46 | 0.9% |
| Russian | 27 | 0.5% |
| Scotch-Irish | 38 | 0.7% |
| Scottish | 161 | 3.0% |
| Slovak | 21 | 0.4% |
| Slovene | 9 | 0.2% |
| South American | 54 | 1.0% |
| Sri Lankan | 9 | 0.2% |
| Swedish | 12 | 0.2% |
| Swiss | 4 | 0.1% |
| Turkish | 6 | 0.1% |
| Venezuelan | 3 | 0.1% |
| Vietnamese | 37 | 0.7% |
| Welsh | 136 | 2.6% | View All 45 Rows |
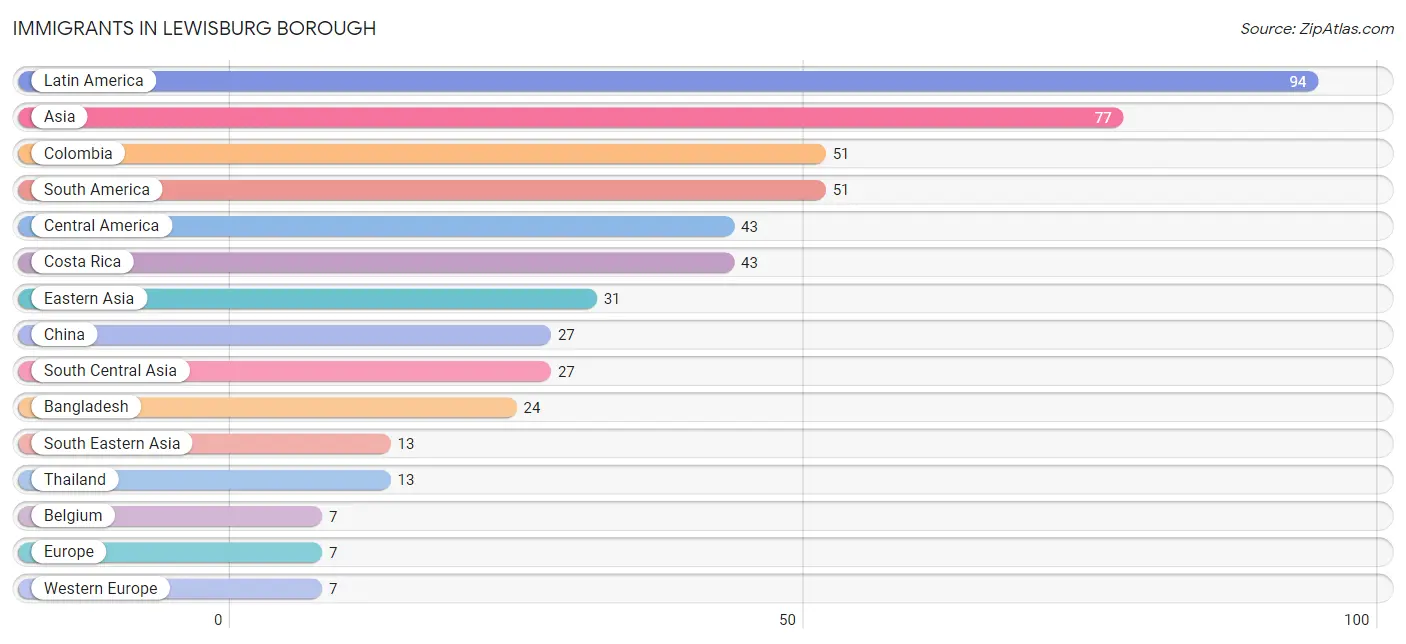
Immigrants in Lewisburg borough
The most numerous immigrant groups reported in Lewisburg borough came from Latin America (94 | 1.8%), Asia (77 | 1.5%), Colombia (51 | 1.0%), South America (51 | 1.0%), and Central America (43 | 0.8%), together accounting for 6.0% of all Lewisburg borough residents.
| Immigration Origin | # Population | % Population |
| Africa | 5 | 0.1% |
| Asia | 77 | 1.5% |
| Bangladesh | 24 | 0.4% |
| Belgium | 7 | 0.1% |
| Central America | 43 | 0.8% |
| China | 27 | 0.5% |
| Colombia | 51 | 1.0% |
| Costa Rica | 43 | 0.8% |
| Eastern Asia | 31 | 0.6% |
| Egypt | 5 | 0.1% |
| Europe | 7 | 0.1% |
| Korea | 4 | 0.1% |
| Latin America | 94 | 1.8% |
| Northern Africa | 5 | 0.1% |
| South America | 51 | 1.0% |
| South Central Asia | 27 | 0.5% |
| South Eastern Asia | 13 | 0.3% |
| Thailand | 13 | 0.3% |
| Turkey | 6 | 0.1% |
| Western Asia | 6 | 0.1% |
| Western Europe | 7 | 0.1% | View All 21 Rows |
Sex and Age in Lewisburg borough
Sex and Age in Lewisburg borough
The most populous age groups in Lewisburg borough are 15 to 19 Years (603 | 23.2%) for men and 15 to 19 Years (592 | 22.1%) for women.
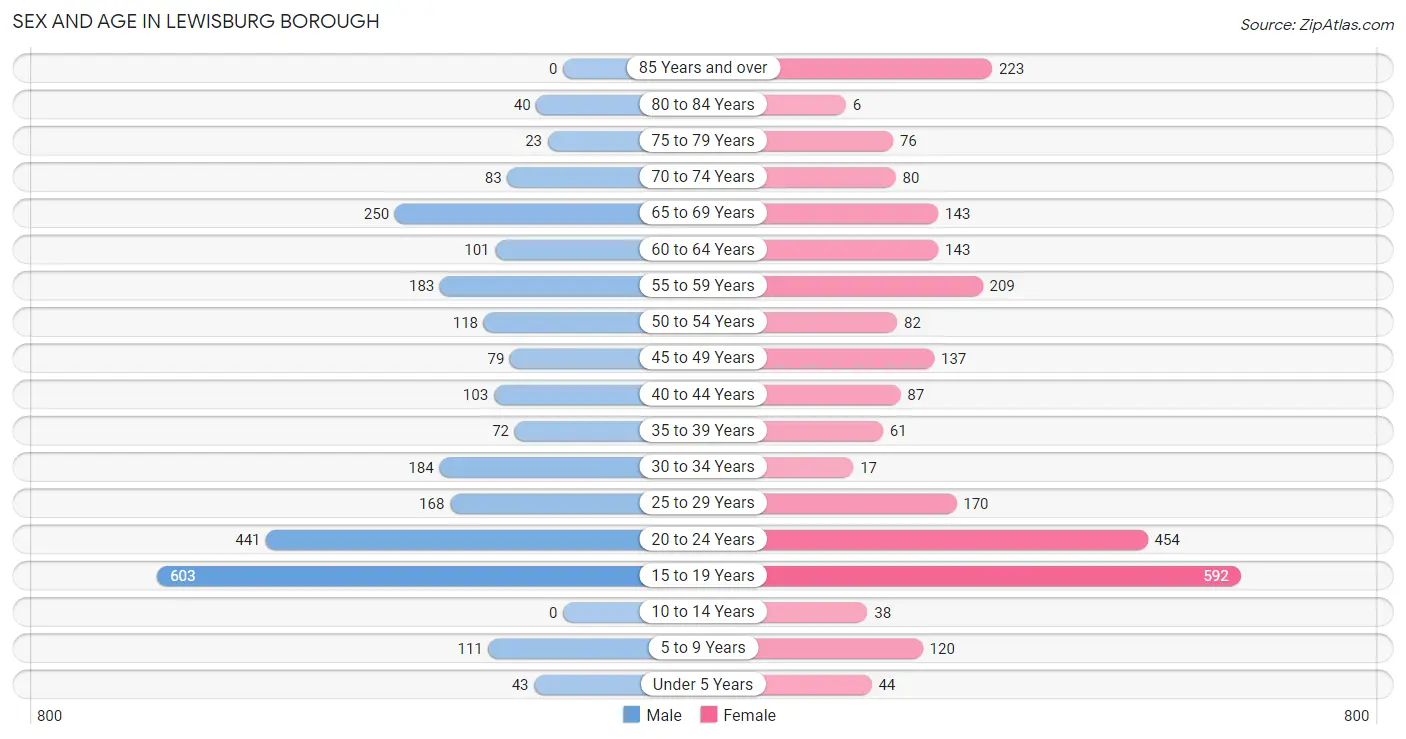
| Age Bracket | Male | Female |
| Under 5 Years | 43 (1.7%) | 44 (1.6%) |
| 5 to 9 Years | 111 (4.3%) | 120 (4.5%) |
| 10 to 14 Years | 0 (0.0%) | 38 (1.4%) |
| 15 to 19 Years | 603 (23.2%) | 592 (22.1%) |
| 20 to 24 Years | 441 (17.0%) | 454 (16.9%) |
| 25 to 29 Years | 168 (6.5%) | 170 (6.3%) |
| 30 to 34 Years | 184 (7.1%) | 17 (0.6%) |
| 35 to 39 Years | 72 (2.8%) | 61 (2.3%) |
| 40 to 44 Years | 103 (4.0%) | 87 (3.2%) |
| 45 to 49 Years | 79 (3.0%) | 137 (5.1%) |
| 50 to 54 Years | 118 (4.5%) | 82 (3.1%) |
| 55 to 59 Years | 183 (7.0%) | 209 (7.8%) |
| 60 to 64 Years | 101 (3.9%) | 143 (5.3%) |
| 65 to 69 Years | 250 (9.6%) | 143 (5.3%) |
| 70 to 74 Years | 83 (3.2%) | 80 (3.0%) |
| 75 to 79 Years | 23 (0.9%) | 76 (2.8%) |
| 80 to 84 Years | 40 (1.5%) | 6 (0.2%) |
| 85 Years and over | 0 (0.0%) | 223 (8.3%) |
| Total | 2,602 (100.0%) | 2,682 (100.0%) |
Families and Households in Lewisburg borough
Median Family Size in Lewisburg borough
The median family size in Lewisburg borough is 2.49 persons per family, with single male/father families (8 | 1.2%) accounting for the largest median family size of 3.13 persons per family. On the other hand, single female/mother families (95 | 14.1%) represent the smallest median family size with 2.47 persons per family.
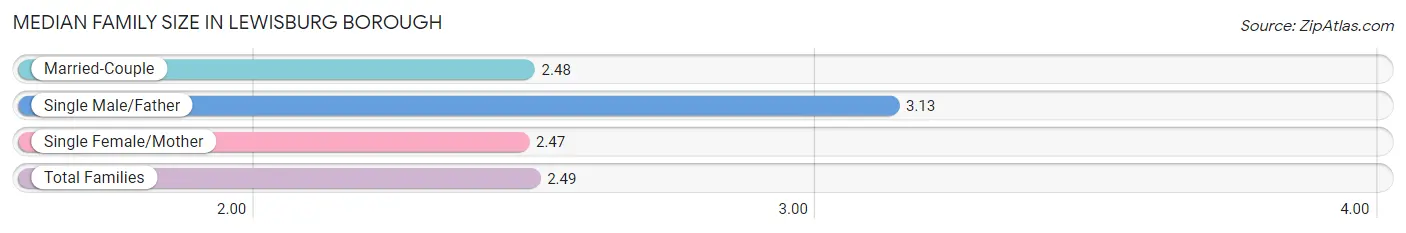
| Family Type | # Families | Family Size |
| Married-Couple | 571 (84.7%) | 2.48 |
| Single Male/Father | 8 (1.2%) | 3.13 |
| Single Female/Mother | 95 (14.1%) | 2.47 |
| Total Families | 674 (100.0%) | 2.49 |
Median Household Size in Lewisburg borough
The median household size in Lewisburg borough is 1.64 persons per household, with single male/father households (8 | 0.4%) accounting for the largest median household size of 3.13 persons per household. non-family households (1,299 | 65.8%) represent the smallest median household size with 1.18 persons per household.
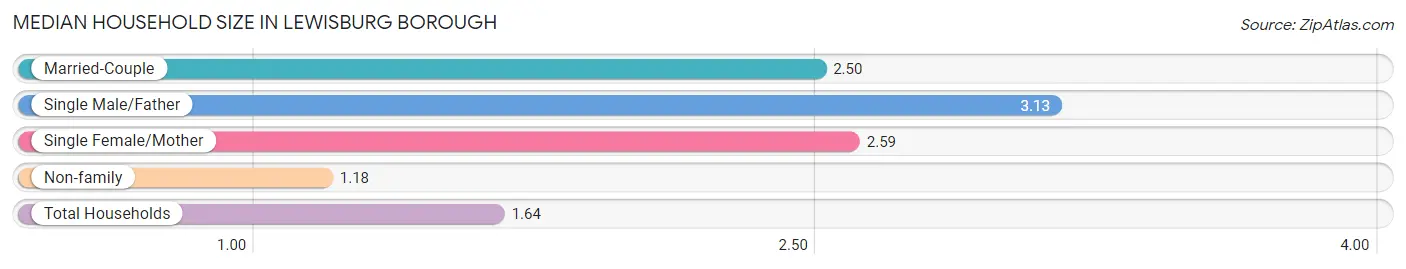
| Household Type | # Households | Household Size |
| Married-Couple | 571 (28.9%) | 2.50 |
| Single Male/Father | 8 (0.4%) | 3.13 |
| Single Female/Mother | 95 (4.8%) | 2.59 |
| Non-family | 1,299 (65.8%) | 1.18 |
| Total Households | 1,973 (100.0%) | 1.64 |
Household Size by Marriage Status in Lewisburg borough
Out of a total of 1,973 households in Lewisburg borough, 674 (34.2%) are family households, while 1,299 (65.8%) are nonfamily households. The most numerous type of family households are 2-person households, comprising 446, and the most common type of nonfamily households are 1-person households, comprising 1,160.
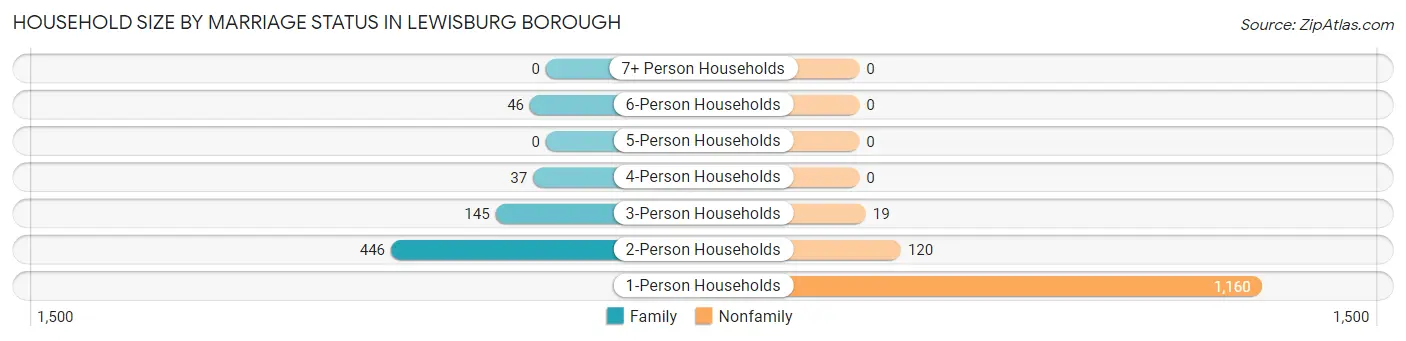
| Household Size | Family Households | Nonfamily Households |
| 1-Person Households | - | 1,160 (58.8%) |
| 2-Person Households | 446 (22.6%) | 120 (6.1%) |
| 3-Person Households | 145 (7.3%) | 19 (1.0%) |
| 4-Person Households | 37 (1.9%) | 0 (0.0%) |
| 5-Person Households | 0 (0.0%) | 0 (0.0%) |
| 6-Person Households | 46 (2.3%) | 0 (0.0%) |
| 7+ Person Households | 0 (0.0%) | 0 (0.0%) |
| Total | 674 (34.2%) | 1,299 (65.8%) |
Female Fertility in Lewisburg borough
Fertility by Age in Lewisburg borough
Average fertility rate in Lewisburg borough is 4.0 births per 1,000 women. Women in the age bracket of 20 to 34 years have the highest fertility rate with 9.0 births per 1,000 women. Women in the age bracket of 20 to 34 years acount for 100.0% of all women with births.
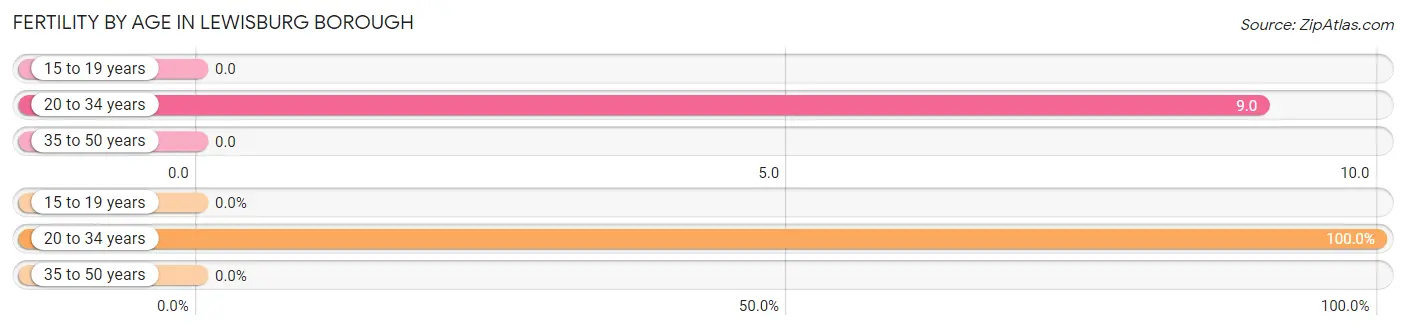
| Age Bracket | Women with Births | Births / 1,000 Women |
| 15 to 19 years | 0 (0.0%) | 0.0 |
| 20 to 34 years | 6 (100.0%) | 9.0 |
| 35 to 50 years | 0 (0.0%) | 0.0 |
| Total | 6 (100.0%) | 4.0 |
Fertility by Age by Marriage Status in Lewisburg borough
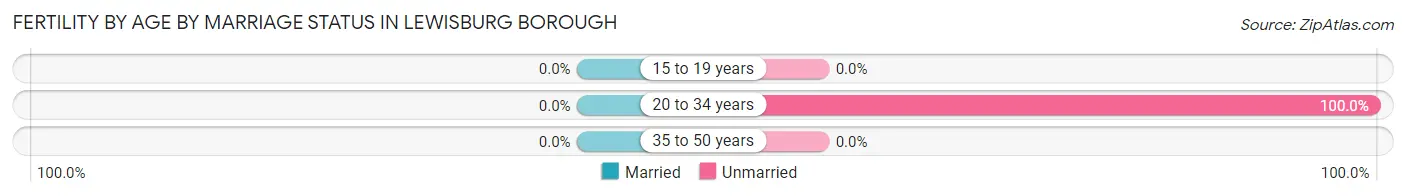
| Age Bracket | Married | Unmarried |
| 15 to 19 years | 0 (0.0%) | 0 (0.0%) |
| 20 to 34 years | 0 (0.0%) | 6 (100.0%) |
| 35 to 50 years | 0 (0.0%) | 0 (0.0%) |
| Total | 0 (0.0%) | 6 (100.0%) |
Fertility by Education in Lewisburg borough
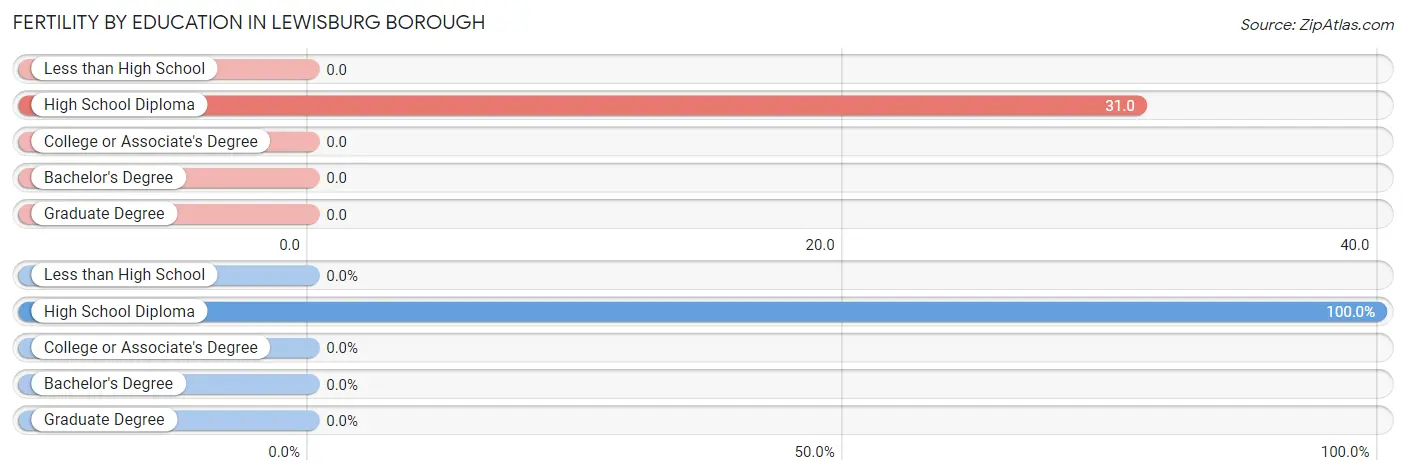
| Educational Attainment | Women with Births | Births / 1,000 Women |
| Less than High School | 0 (0.0%) | 0.0 |
| High School Diploma | 6 (100.0%) | 31.0 |
| College or Associate's Degree | 0 (0.0%) | 0.0 |
| Bachelor's Degree | 0 (0.0%) | 0.0 |
| Graduate Degree | 0 (0.0%) | 0.0 |
| Total | 6 (100.0%) | 4.0 |
Fertility by Education by Marriage Status in Lewisburg borough
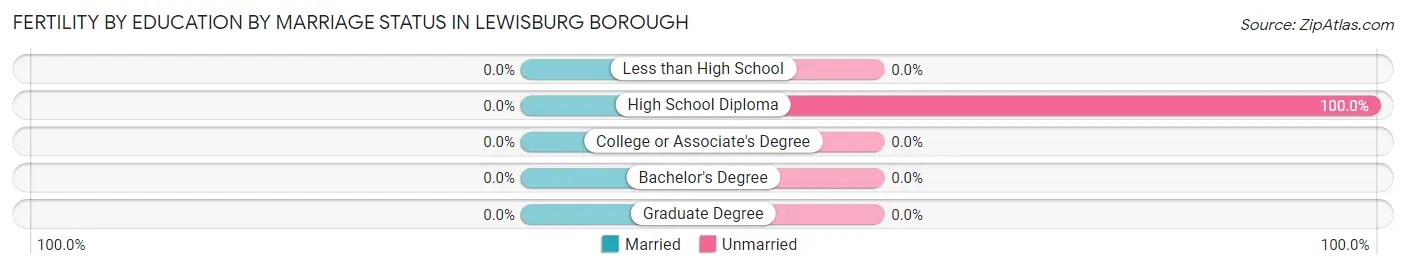
| Educational Attainment | Married | Unmarried |
| Less than High School | 0 (0.0%) | 0 (0.0%) |
| High School Diploma | 0 (0.0%) | 6 (100.0%) |
| College or Associate's Degree | 0 (0.0%) | 0 (0.0%) |
| Bachelor's Degree | 0 (0.0%) | 0 (0.0%) |
| Graduate Degree | 0 (0.0%) | 0 (0.0%) |
| Total | 0 (0.0%) | 6 (100.0%) |
Employment Characteristics in Lewisburg borough
Employment by Class of Employer in Lewisburg borough
Among the 2,219 employed individuals in Lewisburg borough, private company employees (977 | 44.0%), not-for-profit organizations (840 | 37.9%), and local government employees (137 | 6.2%) make up the most common classes of employment.
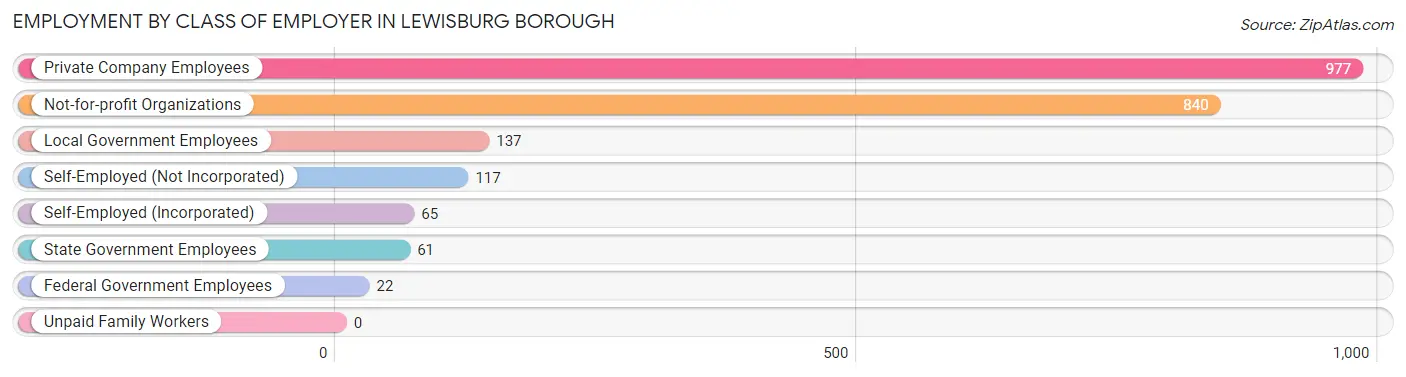
| Employer Class | # Employees | % Employees |
| Private Company Employees | 977 | 44.0% |
| Self-Employed (Incorporated) | 65 | 2.9% |
| Self-Employed (Not Incorporated) | 117 | 5.3% |
| Not-for-profit Organizations | 840 | 37.9% |
| Local Government Employees | 137 | 6.2% |
| State Government Employees | 61 | 2.8% |
| Federal Government Employees | 22 | 1.0% |
| Unpaid Family Workers | 0 | 0.0% |
| Total | 2,219 | 100.0% |
Employment Status by Age in Lewisburg borough
According to the labor force statistics for Lewisburg borough, out of the total population over 16 years of age (4,928), 46.5% or 2,292 individuals are in the labor force, with 1.6% or 37 of them unemployed. The age group with the highest labor force participation rate is 45 to 54 years, with 90.4% or 376 individuals in the labor force. Within the labor force, the 45 to 54 years age range has the highest percentage of unemployed individuals, with 7.7% or 29 of them being unemployed.
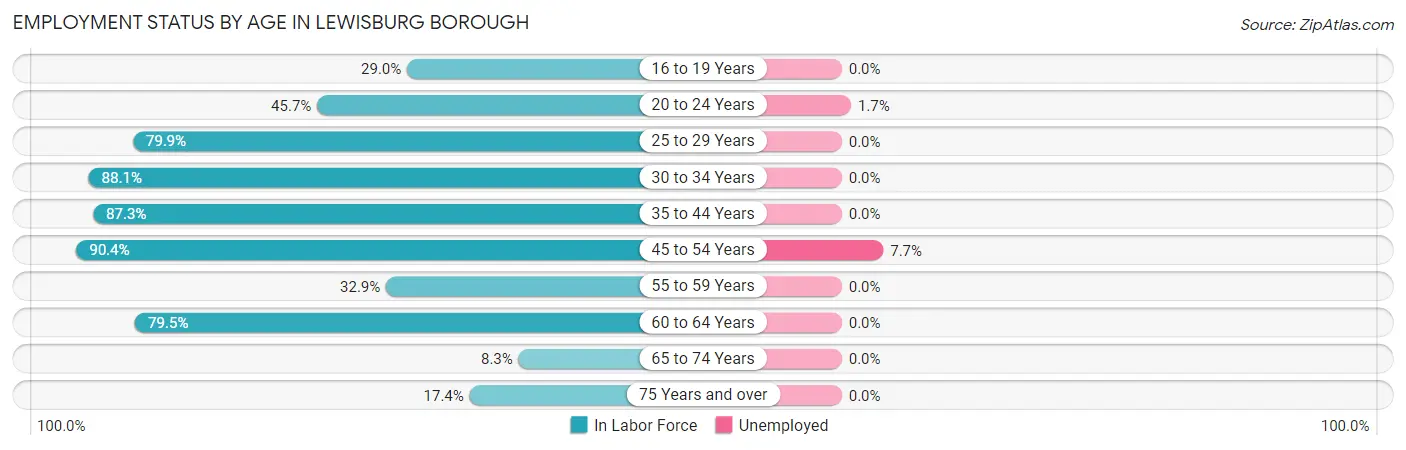
| Age Bracket | In Labor Force | Unemployed |
| 16 to 19 Years | 347 (29.0%) | 0 (0.0%) |
| 20 to 24 Years | 409 (45.7%) | 7 (1.7%) |
| 25 to 29 Years | 270 (79.9%) | 0 (0.0%) |
| 30 to 34 Years | 177 (88.1%) | 0 (0.0%) |
| 35 to 44 Years | 282 (87.3%) | 0 (0.0%) |
| 45 to 54 Years | 376 (90.4%) | 29 (7.7%) |
| 55 to 59 Years | 129 (32.9%) | 0 (0.0%) |
| 60 to 64 Years | 194 (79.5%) | 0 (0.0%) |
| 65 to 74 Years | 46 (8.3%) | 0 (0.0%) |
| 75 Years and over | 64 (17.4%) | 0 (0.0%) |
| Total | 2,292 (46.5%) | 37 (1.6%) |
Employment Status by Educational Attainment in Lewisburg borough
According to labor force statistics for Lewisburg borough, 74.6% of individuals (1,428) out of the total population between 25 and 64 years of age (1,914) are in the labor force, with 2.0% or 29 of them being unemployed. The group with the highest labor force participation rate are those with the educational attainment of bachelor's degree or higher, with 94.9% or 994 individuals in the labor force. Within the labor force, individuals with bachelor's degree or higher education have the highest percentage of unemployment, with 2.9% or 29 of them being unemployed.
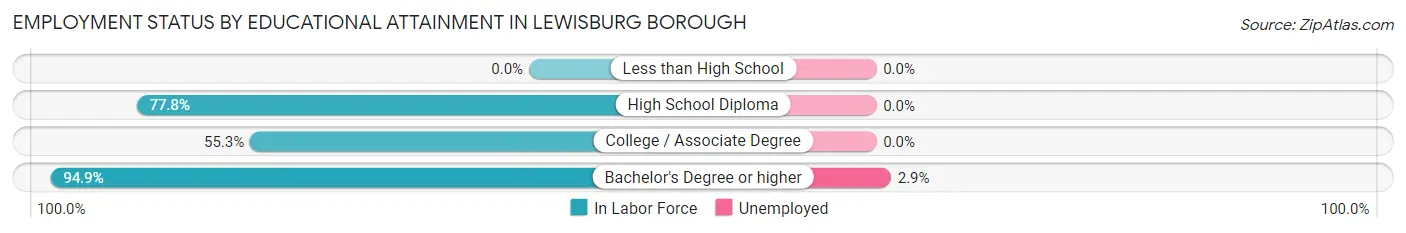
| Educational Attainment | In Labor Force | Unemployed |
| Less than High School | 0 (0.0%) | 0 (0.0%) |
| High School Diploma | 203 (77.8%) | 0 (0.0%) |
| College / Associate Degree | 231 (55.3%) | 0 (0.0%) |
| Bachelor's Degree or higher | 994 (94.9%) | 30 (2.9%) |
| Total | 1,428 (74.6%) | 38 (2.0%) |
Employment Occupations by Sex in Lewisburg borough
Management, Business, Science and Arts Occupations
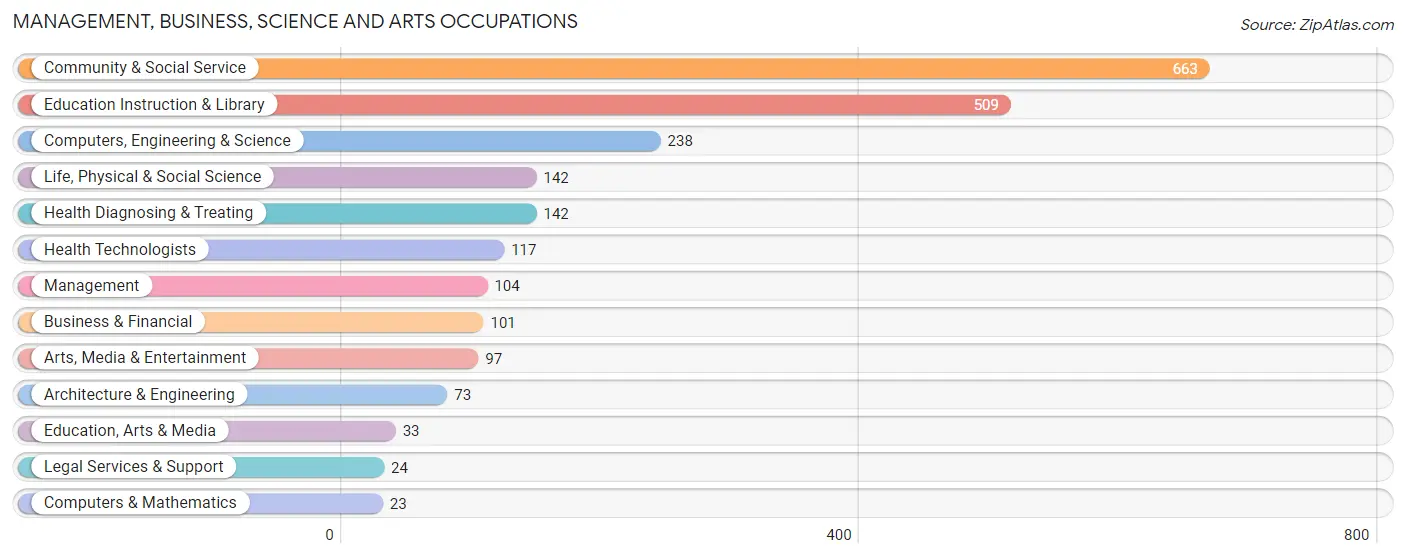
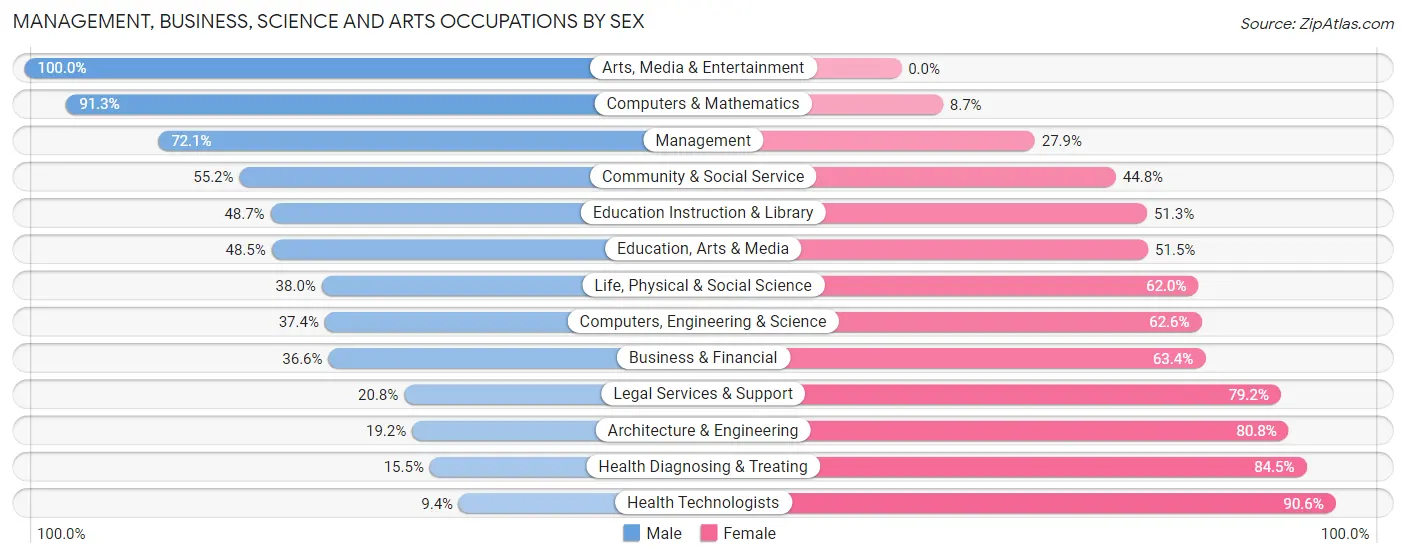
The most common Management, Business, Science and Arts occupations in Lewisburg borough are Community & Social Service (663 | 29.4%), Education Instruction & Library (509 | 22.6%), Computers, Engineering & Science (238 | 10.5%), Life, Physical & Social Science (142 | 6.3%), and Health Diagnosing & Treating (142 | 6.3%).
Management, Business, Science and Arts Occupations by Sex
Within the Management, Business, Science and Arts occupations in Lewisburg borough, the most male-oriented occupations are Arts, Media & Entertainment (100.0%), Computers & Mathematics (91.3%), and Management (72.1%), while the most female-oriented occupations are Health Technologists (90.6%), Health Diagnosing & Treating (84.5%), and Architecture & Engineering (80.8%).
| Occupation | Male | Female |
| Management | 75 (72.1%) | 29 (27.9%) |
| Business & Financial | 37 (36.6%) | 64 (63.4%) |
| Computers, Engineering & Science | 89 (37.4%) | 149 (62.6%) |
| Computers & Mathematics | 21 (91.3%) | 2 (8.7%) |
| Architecture & Engineering | 14 (19.2%) | 59 (80.8%) |
| Life, Physical & Social Science | 54 (38.0%) | 88 (62.0%) |
| Community & Social Service | 366 (55.2%) | 297 (44.8%) |
| Education, Arts & Media | 16 (48.5%) | 17 (51.5%) |
| Legal Services & Support | 5 (20.8%) | 19 (79.2%) |
| Education Instruction & Library | 248 (48.7%) | 261 (51.3%) |
| Arts, Media & Entertainment | 97 (100.0%) | 0 (0.0%) |
| Health Diagnosing & Treating | 22 (15.5%) | 120 (84.5%) |
| Health Technologists | 11 (9.4%) | 106 (90.6%) |
| Total (Category) | 589 (47.2%) | 659 (52.8%) |
| Total (Overall) | 1,090 (48.3%) | 1,167 (51.7%) |
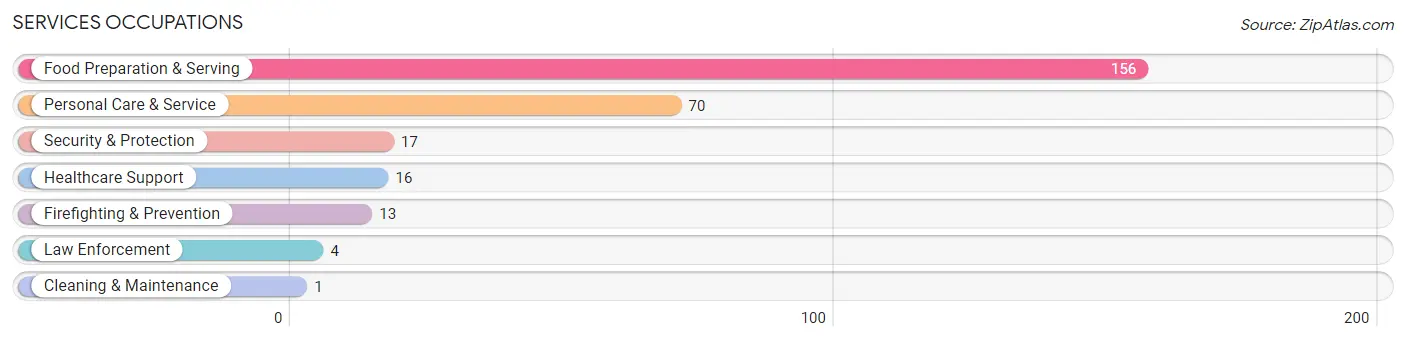
Services Occupations
The most common Services occupations in Lewisburg borough are Food Preparation & Serving (156 | 6.9%), Personal Care & Service (70 | 3.1%), Security & Protection (17 | 0.7%), Healthcare Support (16 | 0.7%), and Firefighting & Prevention (13 | 0.6%).
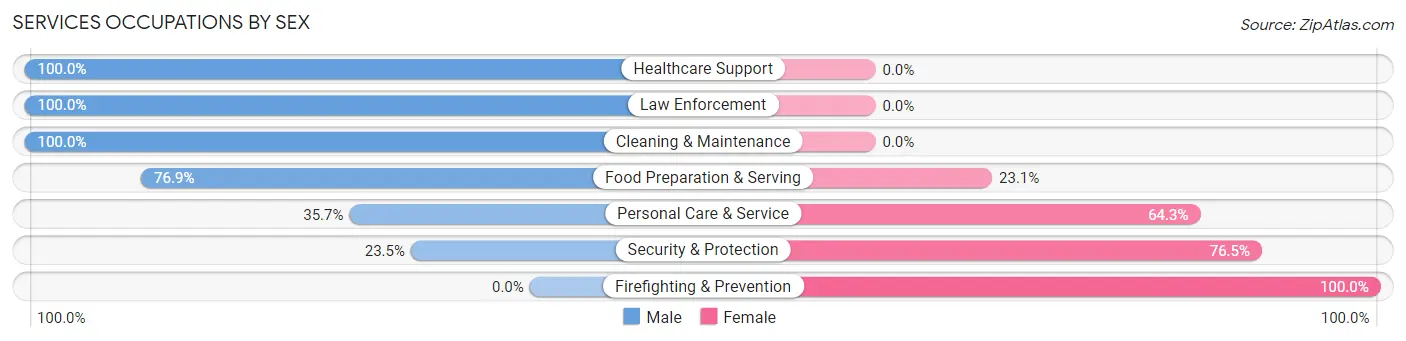
Services Occupations by Sex
Within the Services occupations in Lewisburg borough, the most male-oriented occupations are Healthcare Support (100.0%), Law Enforcement (100.0%), and Cleaning & Maintenance (100.0%), while the most female-oriented occupations are Firefighting & Prevention (100.0%), Security & Protection (76.5%), and Personal Care & Service (64.3%).
| Occupation | Male | Female |
| Healthcare Support | 16 (100.0%) | 0 (0.0%) |
| Security & Protection | 4 (23.5%) | 13 (76.5%) |
| Firefighting & Prevention | 0 (0.0%) | 13 (100.0%) |
| Law Enforcement | 4 (100.0%) | 0 (0.0%) |
| Food Preparation & Serving | 120 (76.9%) | 36 (23.1%) |
| Cleaning & Maintenance | 1 (100.0%) | 0 (0.0%) |
| Personal Care & Service | 25 (35.7%) | 45 (64.3%) |
| Total (Category) | 166 (63.8%) | 94 (36.1%) |
| Total (Overall) | 1,090 (48.3%) | 1,167 (51.7%) |
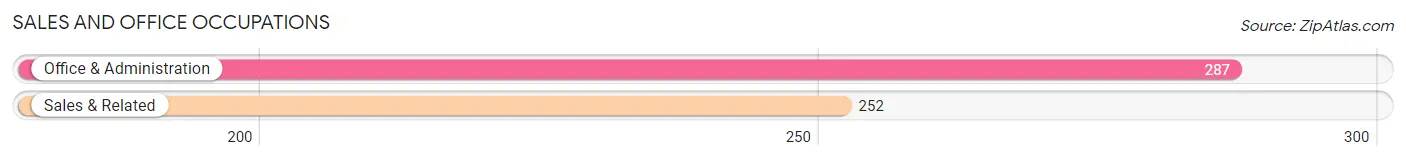
Sales and Office Occupations
The most common Sales and Office occupations in Lewisburg borough are Office & Administration (287 | 12.7%), and Sales & Related (252 | 11.2%).
Sales and Office Occupations by Sex
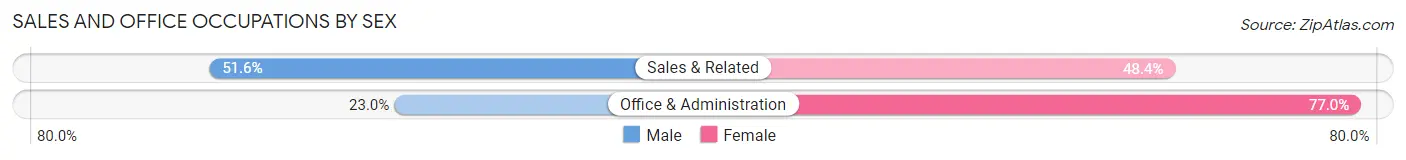
| Occupation | Male | Female |
| Sales & Related | 130 (51.6%) | 122 (48.4%) |
| Office & Administration | 66 (23.0%) | 221 (77.0%) |
| Total (Category) | 196 (36.4%) | 343 (63.6%) |
| Total (Overall) | 1,090 (48.3%) | 1,167 (51.7%) |
Natural Resources, Construction and Maintenance Occupations
The most common Natural Resources, Construction and Maintenance occupations in Lewisburg borough are Installation, Maintenance & Repair (39 | 1.7%), and Construction & Extraction (15 | 0.7%).
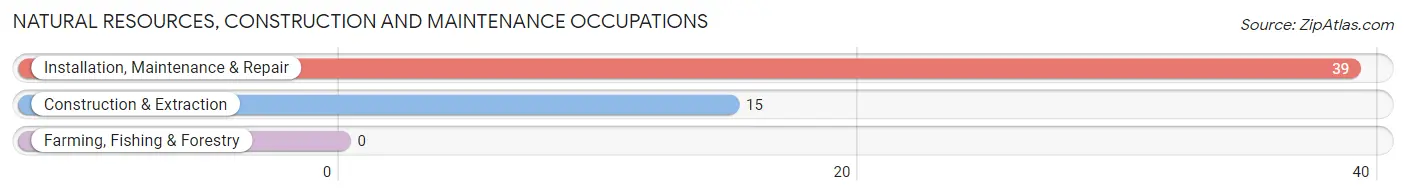
Natural Resources, Construction and Maintenance Occupations by Sex

| Occupation | Male | Female |
| Farming, Fishing & Forestry | 0 (0.0%) | 0 (0.0%) |
| Construction & Extraction | 15 (100.0%) | 0 (0.0%) |
| Installation, Maintenance & Repair | 39 (100.0%) | 0 (0.0%) |
| Total (Category) | 54 (100.0%) | 0 (0.0%) |
| Total (Overall) | 1,090 (48.3%) | 1,167 (51.7%) |
Production, Transportation and Moving Occupations
The most common Production, Transportation and Moving occupations in Lewisburg borough are Material Moving (62 | 2.8%), Production (60 | 2.7%), and Transportation (34 | 1.5%).
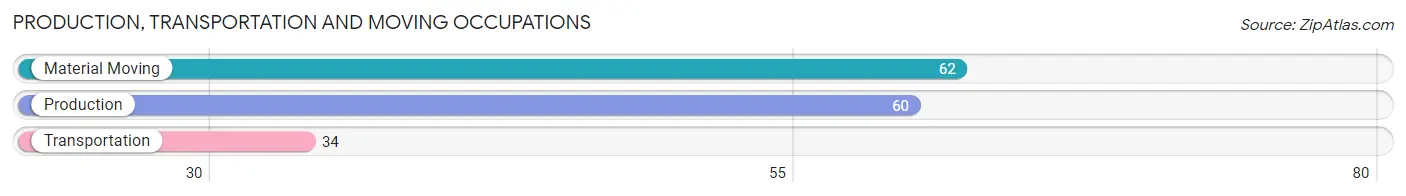
Production, Transportation and Moving Occupations by Sex
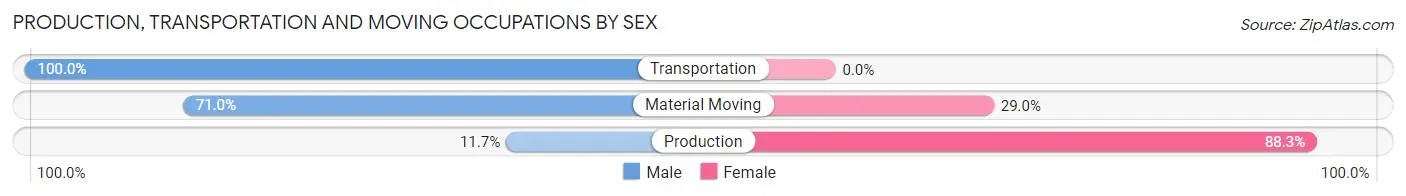
| Occupation | Male | Female |
| Production | 7 (11.7%) | 53 (88.3%) |
| Transportation | 34 (100.0%) | 0 (0.0%) |
| Material Moving | 44 (71.0%) | 18 (29.0%) |
| Total (Category) | 85 (54.5%) | 71 (45.5%) |
| Total (Overall) | 1,090 (48.3%) | 1,167 (51.7%) |
Employment Industries by Sex in Lewisburg borough
Employment Industries in Lewisburg borough
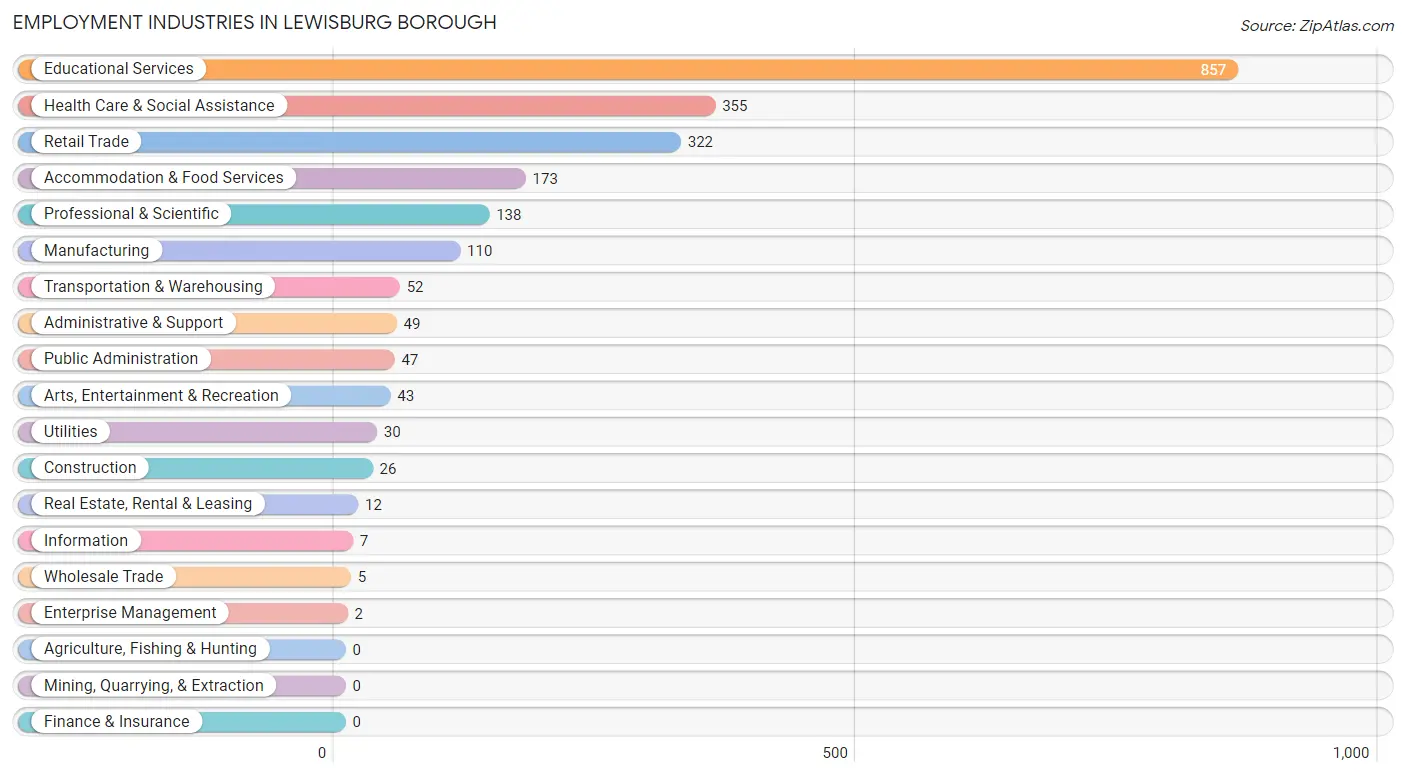
The major employment industries in Lewisburg borough include Educational Services (857 | 38.0%), Health Care & Social Assistance (355 | 15.7%), Retail Trade (322 | 14.3%), Accommodation & Food Services (173 | 7.7%), and Professional & Scientific (138 | 6.1%).
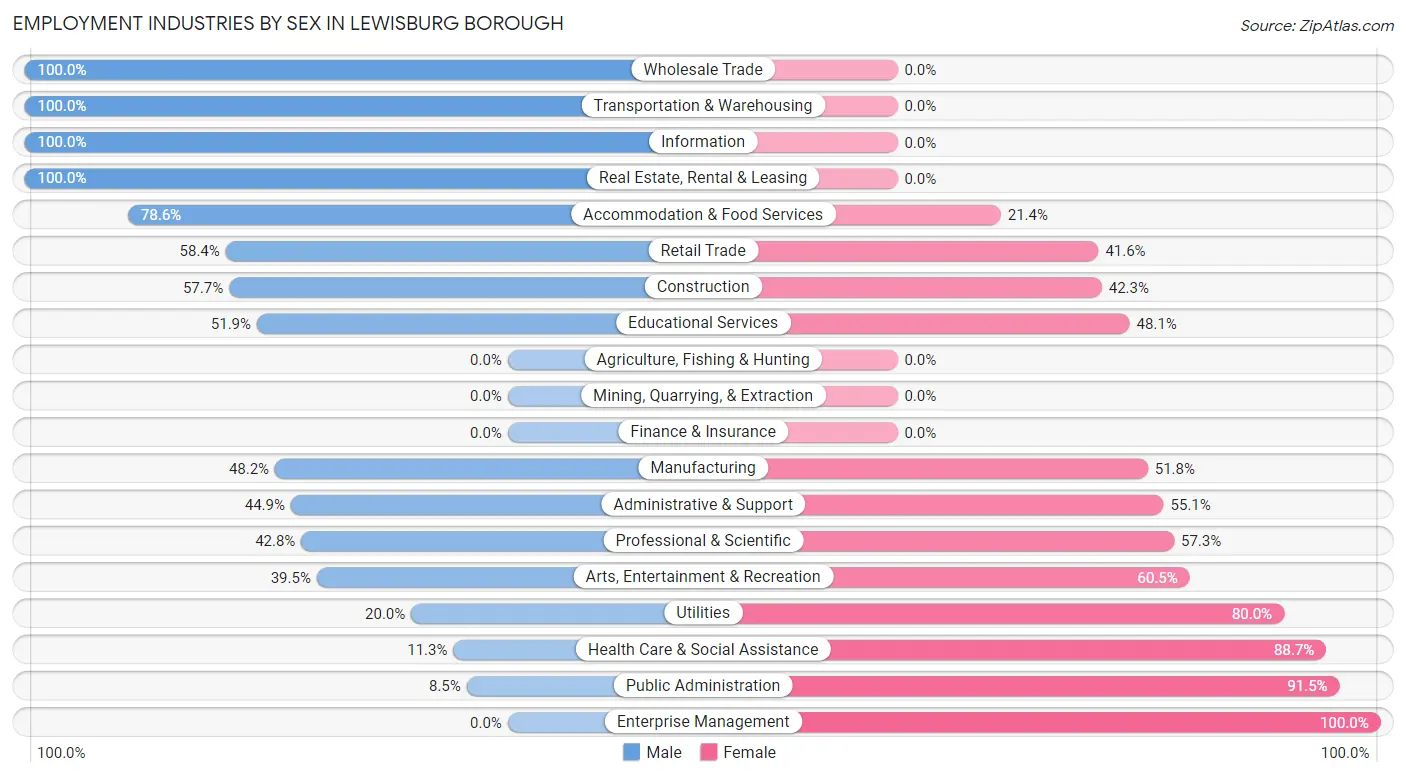
Employment Industries by Sex in Lewisburg borough
The Lewisburg borough industries that see more men than women are Wholesale Trade (100.0%), Transportation & Warehousing (100.0%), and Information (100.0%), whereas the industries that tend to have a higher number of women are Enterprise Management (100.0%), Public Administration (91.5%), and Health Care & Social Assistance (88.7%).
| Industry | Male | Female |
| Agriculture, Fishing & Hunting | 0 (0.0%) | 0 (0.0%) |
| Mining, Quarrying, & Extraction | 0 (0.0%) | 0 (0.0%) |
| Construction | 15 (57.7%) | 11 (42.3%) |
| Manufacturing | 53 (48.2%) | 57 (51.8%) |
| Wholesale Trade | 5 (100.0%) | 0 (0.0%) |
| Retail Trade | 188 (58.4%) | 134 (41.6%) |
| Transportation & Warehousing | 52 (100.0%) | 0 (0.0%) |
| Utilities | 6 (20.0%) | 24 (80.0%) |
| Information | 7 (100.0%) | 0 (0.0%) |
| Finance & Insurance | 0 (0.0%) | 0 (0.0%) |
| Real Estate, Rental & Leasing | 12 (100.0%) | 0 (0.0%) |
| Professional & Scientific | 59 (42.7%) | 79 (57.3%) |
| Enterprise Management | 0 (0.0%) | 2 (100.0%) |
| Administrative & Support | 22 (44.9%) | 27 (55.1%) |
| Educational Services | 445 (51.9%) | 412 (48.1%) |
| Health Care & Social Assistance | 40 (11.3%) | 315 (88.7%) |
| Arts, Entertainment & Recreation | 17 (39.5%) | 26 (60.5%) |
| Accommodation & Food Services | 136 (78.6%) | 37 (21.4%) |
| Public Administration | 4 (8.5%) | 43 (91.5%) |
| Total | 1,090 (48.3%) | 1,167 (51.7%) |
Education in Lewisburg borough
School Enrollment in Lewisburg borough
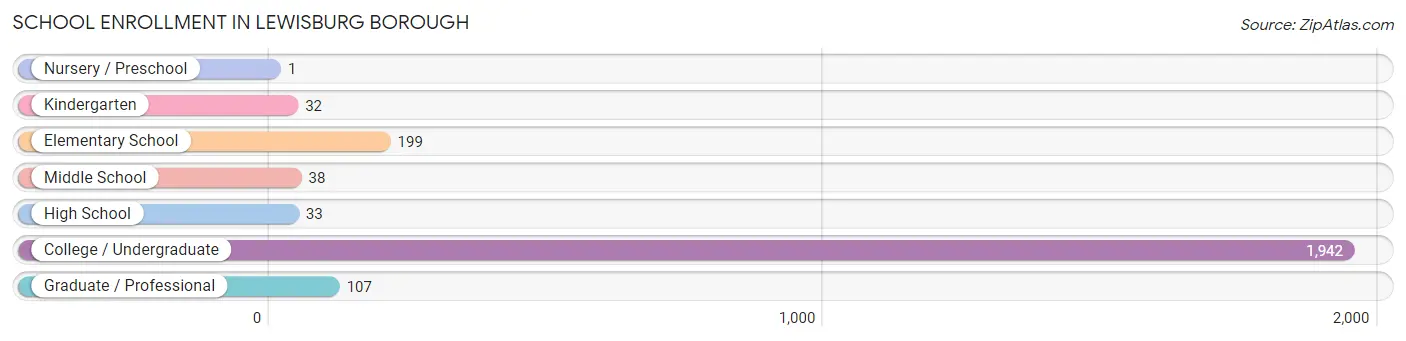
The most common levels of schooling among the 2,352 students in Lewisburg borough are college / undergraduate (1,942 | 82.6%), elementary school (199 | 8.5%), and graduate / professional (107 | 4.5%).
| School Level | # Students | % Students |
| Nursery / Preschool | 1 | 0.0% |
| Kindergarten | 32 | 1.4% |
| Elementary School | 199 | 8.5% |
| Middle School | 38 | 1.6% |
| High School | 33 | 1.4% |
| College / Undergraduate | 1,942 | 82.6% |
| Graduate / Professional | 107 | 4.5% |
| Total | 2,352 | 100.0% |
School Enrollment by Age by Funding Source in Lewisburg borough
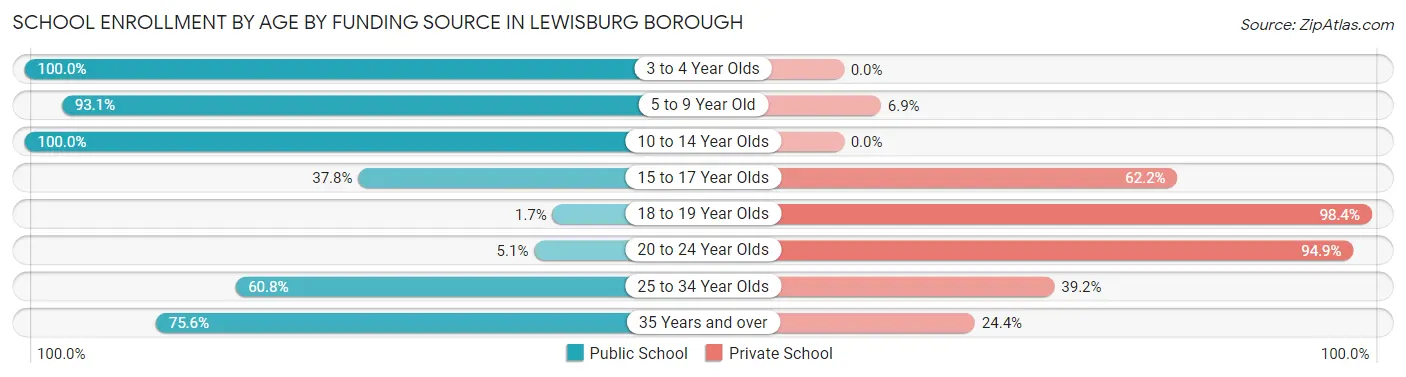
Out of a total of 2,352 students who are enrolled in schools in Lewisburg borough, 1,945 (82.7%) attend a private institution, while the remaining 407 (17.3%) are enrolled in public schools. The age group of 18 to 19 year olds has the highest likelihood of being enrolled in private schools, with 1,133 (98.4% in the age bracket) enrolled. Conversely, the age group of 3 to 4 year olds has the lowest likelihood of being enrolled in a private school, with 1 (100.0% in the age bracket) attending a public institution.
| Age Bracket | Public School | Private School |
| 3 to 4 Year Olds | 1 (100.0%) | 0 (0.0%) |
| 5 to 9 Year Old | 215 (93.1%) | 16 (6.9%) |
| 10 to 14 Year Olds | 38 (100.0%) | 0 (0.0%) |
| 15 to 17 Year Olds | 14 (37.8%) | 23 (62.2%) |
| 18 to 19 Year Olds | 19 (1.7%) | 1,133 (98.4%) |
| 20 to 24 Year Olds | 39 (5.1%) | 730 (94.9%) |
| 25 to 34 Year Olds | 48 (60.8%) | 31 (39.2%) |
| 35 Years and over | 34 (75.6%) | 11 (24.4%) |
| Total | 407 (17.3%) | 1,945 (82.7%) |
Educational Attainment by Field of Study in Lewisburg borough
Literature & languages (216 | 12.3%), science & technology (215 | 12.2%), education (185 | 10.5%), liberal arts & history (167 | 9.5%), and bio, nature & agricultural (151 | 8.6%) are the most common fields of study among 1,760 individuals in Lewisburg borough who have obtained a bachelor's degree or higher.
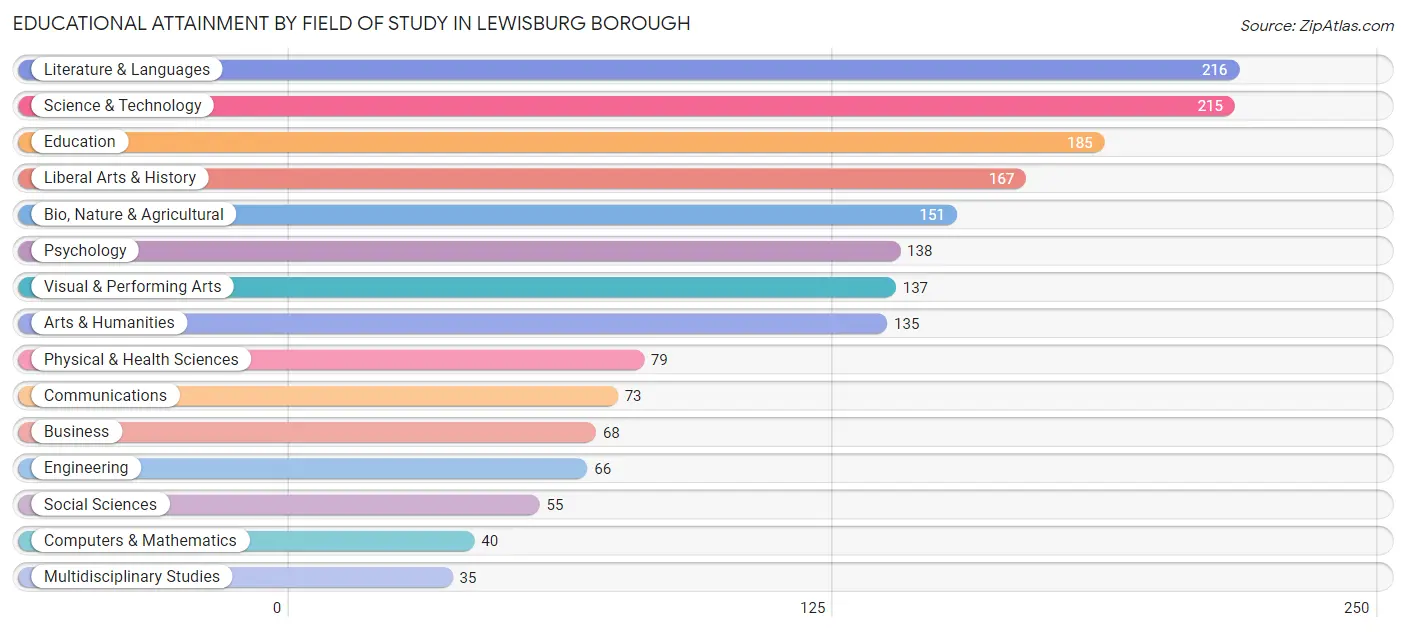
| Field of Study | # Graduates | % Graduates |
| Computers & Mathematics | 40 | 2.3% |
| Bio, Nature & Agricultural | 151 | 8.6% |
| Physical & Health Sciences | 79 | 4.5% |
| Psychology | 138 | 7.8% |
| Social Sciences | 55 | 3.1% |
| Engineering | 66 | 3.7% |
| Multidisciplinary Studies | 35 | 2.0% |
| Science & Technology | 215 | 12.2% |
| Business | 68 | 3.9% |
| Education | 185 | 10.5% |
| Literature & Languages | 216 | 12.3% |
| Liberal Arts & History | 167 | 9.5% |
| Visual & Performing Arts | 137 | 7.8% |
| Communications | 73 | 4.2% |
| Arts & Humanities | 135 | 7.7% |
| Total | 1,760 | 100.0% |
Transportation & Commute in Lewisburg borough
Vehicle Availability by Sex in Lewisburg borough
The most prevalent vehicle ownership categories in Lewisburg borough are males with 1 vehicle (369, accounting for 43.6%) and females with 1 vehicle (421, making up 43.4%).
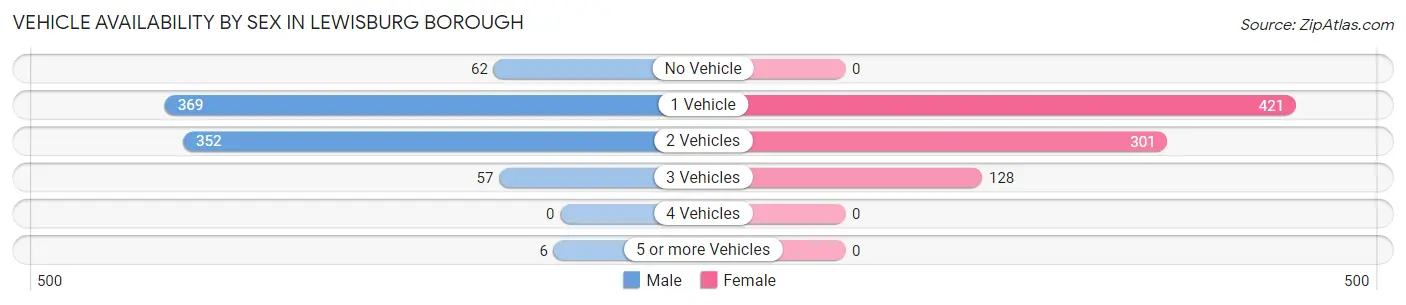
| Vehicles Available | Male | Female |
| No Vehicle | 62 (7.3%) | 0 (0.0%) |
| 1 Vehicle | 369 (43.6%) | 421 (49.5%) |
| 2 Vehicles | 352 (41.6%) | 301 (35.4%) |
| 3 Vehicles | 57 (6.7%) | 128 (15.1%) |
| 4 Vehicles | 0 (0.0%) | 0 (0.0%) |
| 5 or more Vehicles | 6 (0.7%) | 0 (0.0%) |
| Total | 846 (100.0%) | 850 (100.0%) |
Commute Time in Lewisburg borough
The most frequently occuring commute durations in Lewisburg borough are 5 to 9 minutes (814 commuters, 40.3%), 10 to 14 minutes (428 commuters, 21.2%), and 15 to 19 minutes (213 commuters, 10.5%).
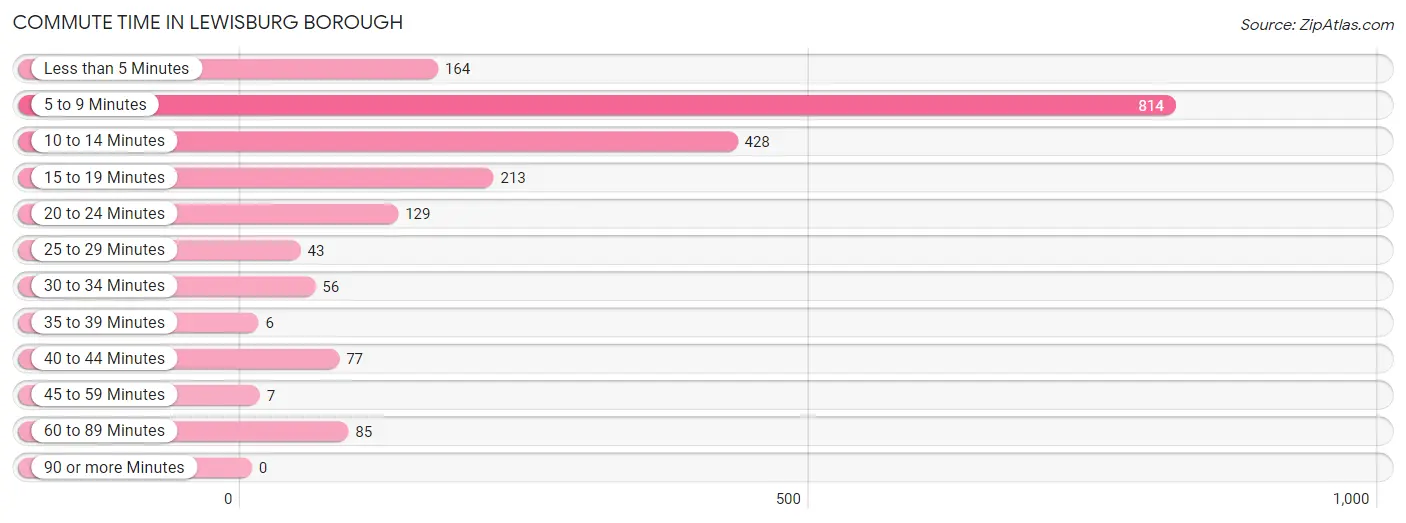
| Commute Time | # Commuters | % Commuters |
| Less than 5 Minutes | 164 | 8.1% |
| 5 to 9 Minutes | 814 | 40.3% |
| 10 to 14 Minutes | 428 | 21.2% |
| 15 to 19 Minutes | 213 | 10.5% |
| 20 to 24 Minutes | 129 | 6.4% |
| 25 to 29 Minutes | 43 | 2.1% |
| 30 to 34 Minutes | 56 | 2.8% |
| 35 to 39 Minutes | 6 | 0.3% |
| 40 to 44 Minutes | 77 | 3.8% |
| 45 to 59 Minutes | 7 | 0.4% |
| 60 to 89 Minutes | 85 | 4.2% |
| 90 or more Minutes | 0 | 0.0% |
Commute Time by Sex in Lewisburg borough
The most common commute times in Lewisburg borough are 5 to 9 minutes (463 commuters, 45.8%) for males and 5 to 9 minutes (351 commuters, 34.7%) for females.
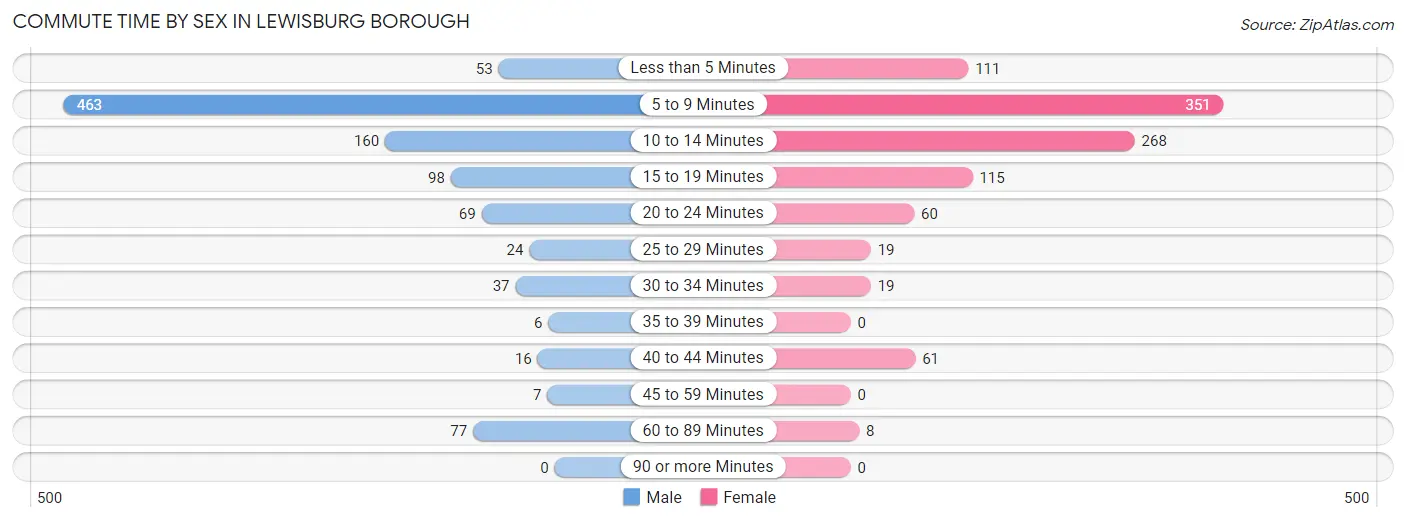
| Commute Time | Male | Female |
| Less than 5 Minutes | 53 (5.2%) | 111 (11.0%) |
| 5 to 9 Minutes | 463 (45.8%) | 351 (34.7%) |
| 10 to 14 Minutes | 160 (15.8%) | 268 (26.5%) |
| 15 to 19 Minutes | 98 (9.7%) | 115 (11.4%) |
| 20 to 24 Minutes | 69 (6.8%) | 60 (5.9%) |
| 25 to 29 Minutes | 24 (2.4%) | 19 (1.9%) |
| 30 to 34 Minutes | 37 (3.7%) | 19 (1.9%) |
| 35 to 39 Minutes | 6 (0.6%) | 0 (0.0%) |
| 40 to 44 Minutes | 16 (1.6%) | 61 (6.0%) |
| 45 to 59 Minutes | 7 (0.7%) | 0 (0.0%) |
| 60 to 89 Minutes | 77 (7.6%) | 8 (0.8%) |
| 90 or more Minutes | 0 (0.0%) | 0 (0.0%) |
Time of Departure to Work by Sex in Lewisburg borough
The most frequent times of departure to work in Lewisburg borough are 4:00 PM to 11:59 PM (199, 19.7%) for males and 4:00 PM to 11:59 PM (177, 17.5%) for females.
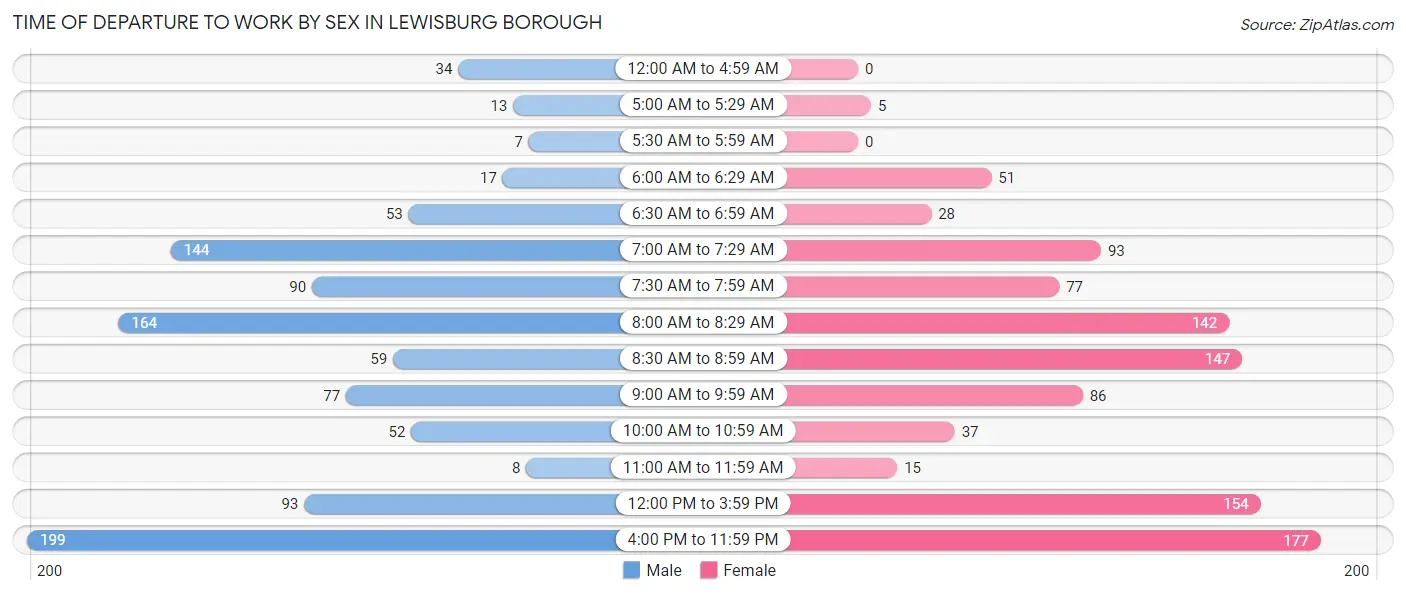
| Time of Departure | Male | Female |
| 12:00 AM to 4:59 AM | 34 (3.4%) | 0 (0.0%) |
| 5:00 AM to 5:29 AM | 13 (1.3%) | 5 (0.5%) |
| 5:30 AM to 5:59 AM | 7 (0.7%) | 0 (0.0%) |
| 6:00 AM to 6:29 AM | 17 (1.7%) | 51 (5.0%) |
| 6:30 AM to 6:59 AM | 53 (5.2%) | 28 (2.8%) |
| 7:00 AM to 7:29 AM | 144 (14.3%) | 93 (9.2%) |
| 7:30 AM to 7:59 AM | 90 (8.9%) | 77 (7.6%) |
| 8:00 AM to 8:29 AM | 164 (16.2%) | 142 (14.0%) |
| 8:30 AM to 8:59 AM | 59 (5.8%) | 147 (14.5%) |
| 9:00 AM to 9:59 AM | 77 (7.6%) | 86 (8.5%) |
| 10:00 AM to 10:59 AM | 52 (5.1%) | 37 (3.7%) |
| 11:00 AM to 11:59 AM | 8 (0.8%) | 15 (1.5%) |
| 12:00 PM to 3:59 PM | 93 (9.2%) | 154 (15.2%) |
| 4:00 PM to 11:59 PM | 199 (19.7%) | 177 (17.5%) |
| Total | 1,010 (100.0%) | 1,012 (100.0%) |
Housing Occupancy in Lewisburg borough
Occupancy by Ownership in Lewisburg borough
Of the total 1,973 dwellings in Lewisburg borough, owner-occupied units account for 790 (40.0%), while renter-occupied units make up 1,183 (60.0%).
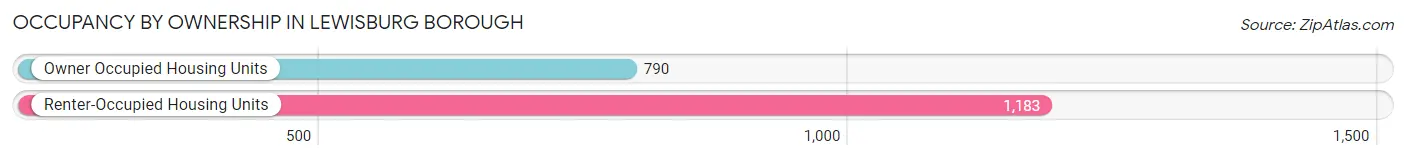
| Occupancy | # Housing Units | % Housing Units |
| Owner Occupied Housing Units | 790 | 40.0% |
| Renter-Occupied Housing Units | 1,183 | 60.0% |
| Total Occupied Housing Units | 1,973 | 100.0% |
Occupancy by Household Size in Lewisburg borough
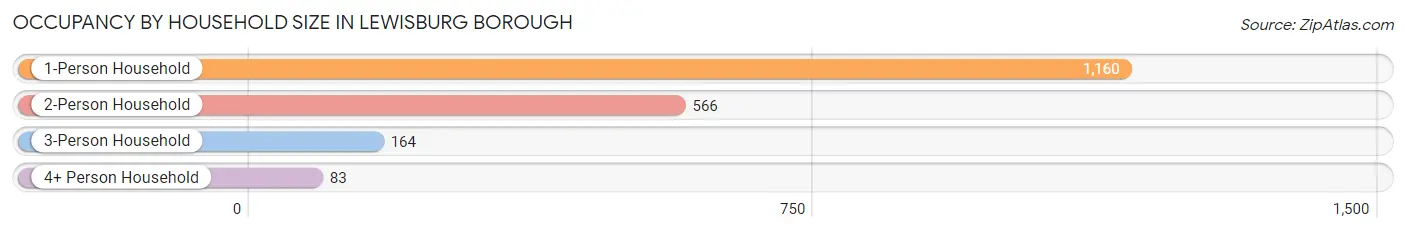
| Household Size | # Housing Units | % Housing Units |
| 1-Person Household | 1,160 | 58.8% |
| 2-Person Household | 566 | 28.7% |
| 3-Person Household | 164 | 8.3% |
| 4+ Person Household | 83 | 4.2% |
| Total Housing Units | 1,973 | 100.0% |
Occupancy by Ownership by Household Size in Lewisburg borough
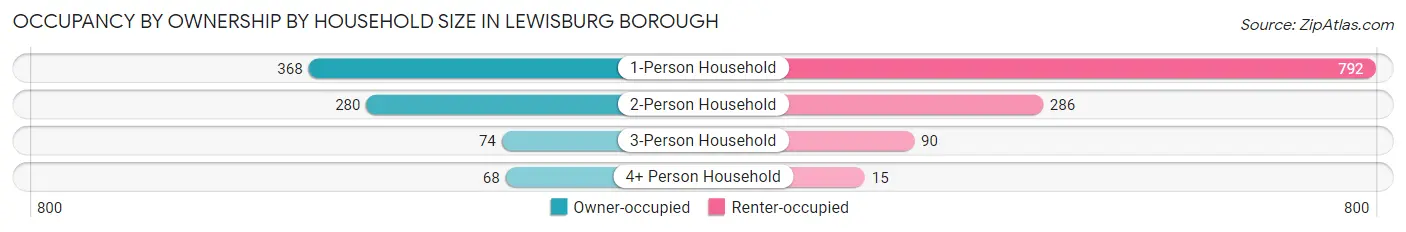
| Household Size | Owner-occupied | Renter-occupied |
| 1-Person Household | 368 (31.7%) | 792 (68.3%) |
| 2-Person Household | 280 (49.5%) | 286 (50.5%) |
| 3-Person Household | 74 (45.1%) | 90 (54.9%) |
| 4+ Person Household | 68 (81.9%) | 15 (18.1%) |
| Total Housing Units | 790 (40.0%) | 1,183 (60.0%) |
Occupancy by Educational Attainment in Lewisburg borough
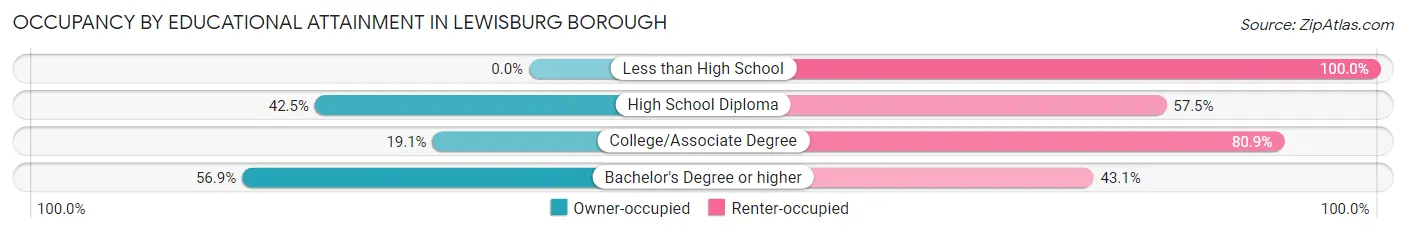
| Household Size | Owner-occupied | Renter-occupied |
| Less than High School | 0 (0.0%) | 202 (100.0%) |
| High School Diploma | 124 (42.5%) | 168 (57.5%) |
| College/Associate Degree | 89 (19.1%) | 376 (80.9%) |
| Bachelor's Degree or higher | 577 (56.9%) | 437 (43.1%) |
Occupancy by Age of Householder in Lewisburg borough
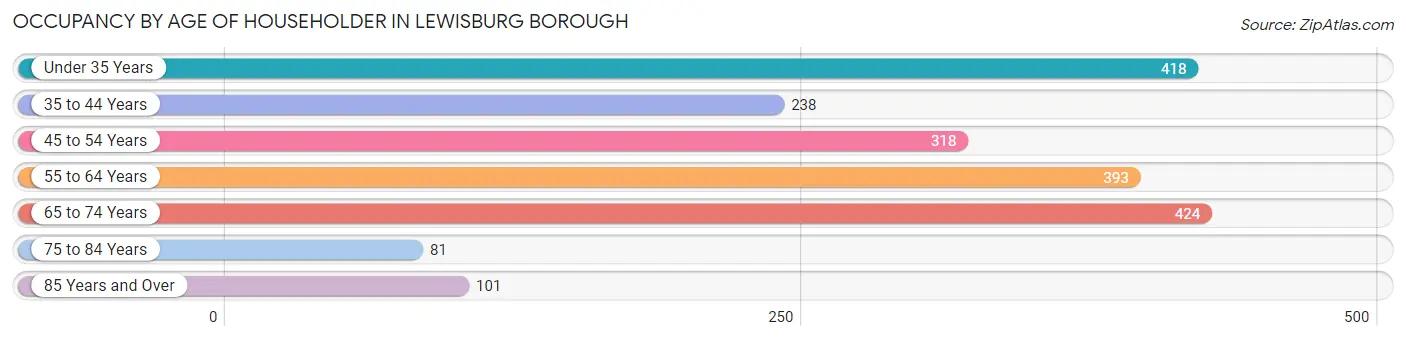
| Age Bracket | # Households | % Households |
| Under 35 Years | 418 | 21.2% |
| 35 to 44 Years | 238 | 12.1% |
| 45 to 54 Years | 318 | 16.1% |
| 55 to 64 Years | 393 | 19.9% |
| 65 to 74 Years | 424 | 21.5% |
| 75 to 84 Years | 81 | 4.1% |
| 85 Years and Over | 101 | 5.1% |
| Total | 1,973 | 100.0% |
Housing Finances in Lewisburg borough
Median Income by Occupancy in Lewisburg borough
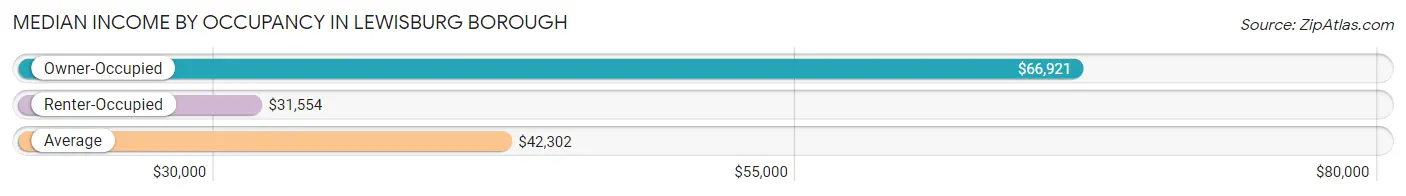
| Occupancy Type | # Households | Median Income |
| Owner-Occupied | 790 (40.0%) | $66,921 |
| Renter-Occupied | 1,183 (60.0%) | $31,554 |
| Average | 1,973 (100.0%) | $42,302 |
Occupancy by Householder Income Bracket in Lewisburg borough
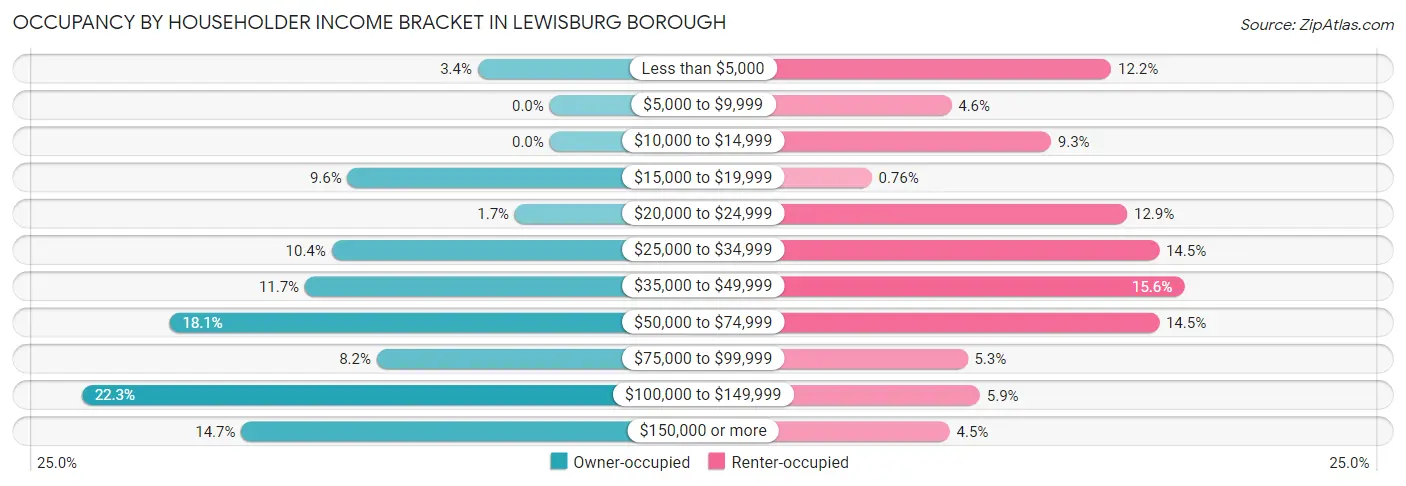
| Income Bracket | Owner-occupied | Renter-occupied |
| Less than $5,000 | 27 (3.4%) | 144 (12.2%) |
| $5,000 to $9,999 | 0 (0.0%) | 54 (4.6%) |
| $10,000 to $14,999 | 0 (0.0%) | 110 (9.3%) |
| $15,000 to $19,999 | 76 (9.6%) | 9 (0.8%) |
| $20,000 to $24,999 | 13 (1.7%) | 153 (12.9%) |
| $25,000 to $34,999 | 82 (10.4%) | 171 (14.4%) |
| $35,000 to $49,999 | 92 (11.7%) | 185 (15.6%) |
| $50,000 to $74,999 | 143 (18.1%) | 171 (14.4%) |
| $75,000 to $99,999 | 65 (8.2%) | 63 (5.3%) |
| $100,000 to $149,999 | 176 (22.3%) | 70 (5.9%) |
| $150,000 or more | 116 (14.7%) | 53 (4.5%) |
| Total | 790 (100.0%) | 1,183 (100.0%) |
Monthly Housing Cost Tiers in Lewisburg borough
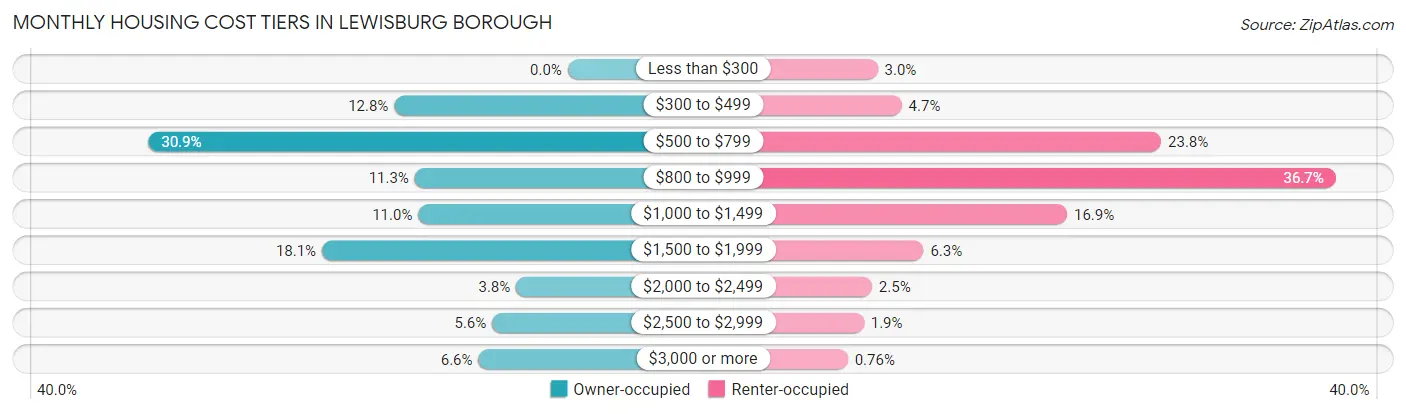
| Monthly Cost | Owner-occupied | Renter-occupied |
| Less than $300 | 0 (0.0%) | 35 (3.0%) |
| $300 to $499 | 101 (12.8%) | 56 (4.7%) |
| $500 to $799 | 244 (30.9%) | 282 (23.8%) |
| $800 to $999 | 89 (11.3%) | 434 (36.7%) |
| $1,000 to $1,499 | 87 (11.0%) | 200 (16.9%) |
| $1,500 to $1,999 | 143 (18.1%) | 75 (6.3%) |
| $2,000 to $2,499 | 30 (3.8%) | 30 (2.5%) |
| $2,500 to $2,999 | 44 (5.6%) | 23 (1.9%) |
| $3,000 or more | 52 (6.6%) | 9 (0.8%) |
| Total | 790 (100.0%) | 1,183 (100.0%) |
Physical Housing Characteristics in Lewisburg borough
Housing Structures in Lewisburg borough
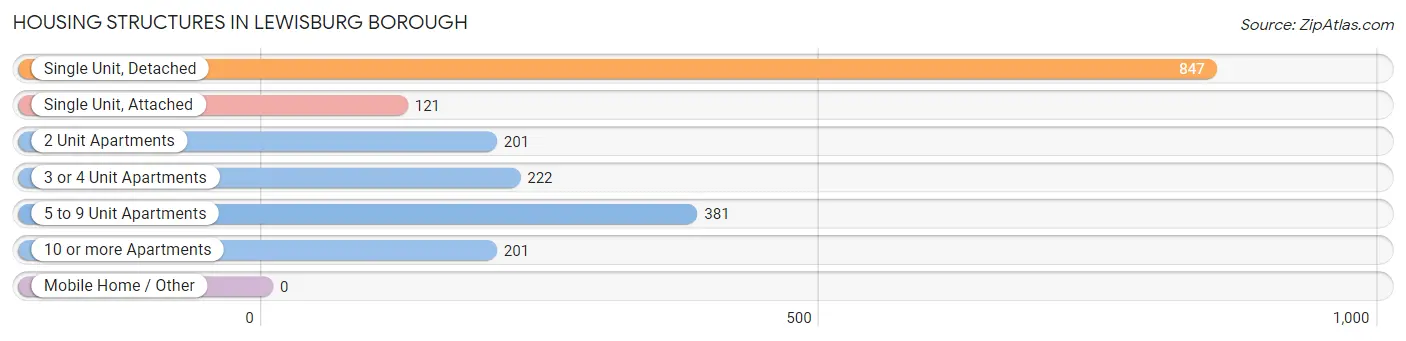
| Structure Type | # Housing Units | % Housing Units |
| Single Unit, Detached | 847 | 42.9% |
| Single Unit, Attached | 121 | 6.1% |
| 2 Unit Apartments | 201 | 10.2% |
| 3 or 4 Unit Apartments | 222 | 11.3% |
| 5 to 9 Unit Apartments | 381 | 19.3% |
| 10 or more Apartments | 201 | 10.2% |
| Mobile Home / Other | 0 | 0.0% |
| Total | 1,973 | 100.0% |
Housing Structures by Occupancy in Lewisburg borough
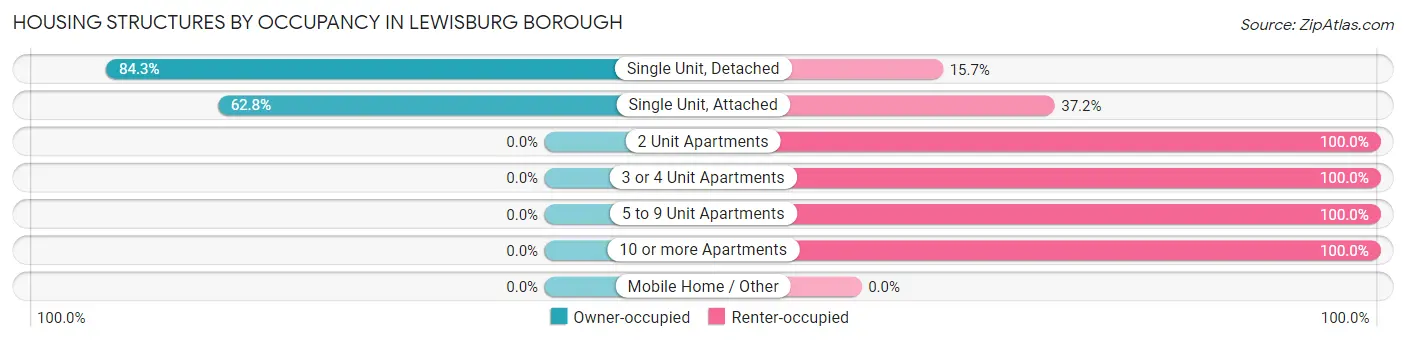
| Structure Type | Owner-occupied | Renter-occupied |
| Single Unit, Detached | 714 (84.3%) | 133 (15.7%) |
| Single Unit, Attached | 76 (62.8%) | 45 (37.2%) |
| 2 Unit Apartments | 0 (0.0%) | 201 (100.0%) |
| 3 or 4 Unit Apartments | 0 (0.0%) | 222 (100.0%) |
| 5 to 9 Unit Apartments | 0 (0.0%) | 381 (100.0%) |
| 10 or more Apartments | 0 (0.0%) | 201 (100.0%) |
| Mobile Home / Other | 0 (0.0%) | 0 (0.0%) |
| Total | 790 (40.0%) | 1,183 (60.0%) |
Housing Structures by Number of Rooms in Lewisburg borough
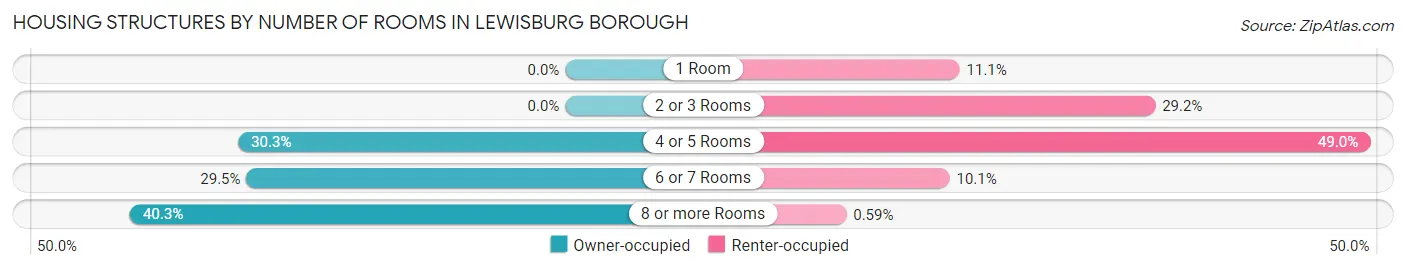
| Number of Rooms | Owner-occupied | Renter-occupied |
| 1 Room | 0 (0.0%) | 131 (11.1%) |
| 2 or 3 Rooms | 0 (0.0%) | 345 (29.2%) |
| 4 or 5 Rooms | 239 (30.2%) | 580 (49.0%) |
| 6 or 7 Rooms | 233 (29.5%) | 120 (10.1%) |
| 8 or more Rooms | 318 (40.3%) | 7 (0.6%) |
| Total | 790 (100.0%) | 1,183 (100.0%) |
Housing Structure by Heating Type in Lewisburg borough
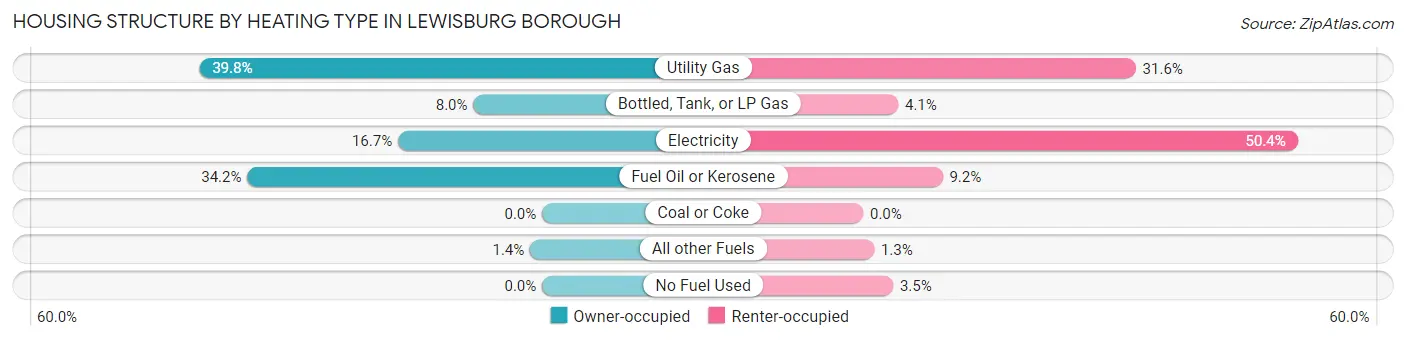
| Heating Type | Owner-occupied | Renter-occupied |
| Utility Gas | 314 (39.8%) | 374 (31.6%) |
| Bottled, Tank, or LP Gas | 63 (8.0%) | 48 (4.1%) |
| Electricity | 132 (16.7%) | 596 (50.4%) |
| Fuel Oil or Kerosene | 270 (34.2%) | 109 (9.2%) |
| Coal or Coke | 0 (0.0%) | 0 (0.0%) |
| All other Fuels | 11 (1.4%) | 15 (1.3%) |
| No Fuel Used | 0 (0.0%) | 41 (3.5%) |
| Total | 790 (100.0%) | 1,183 (100.0%) |
Household Vehicle Usage in Lewisburg borough
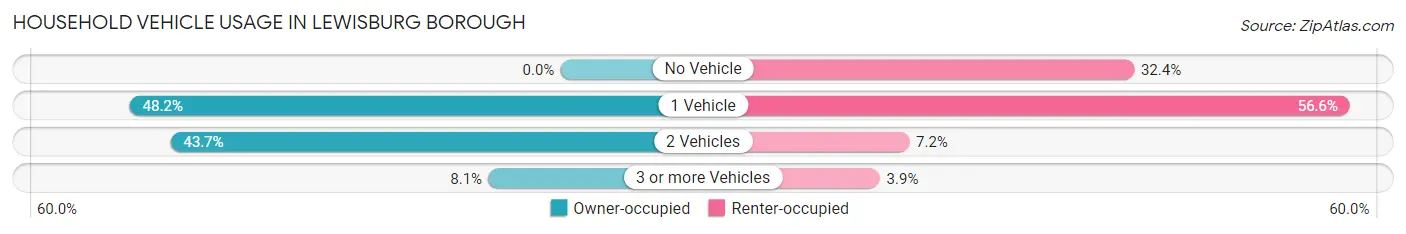
| Vehicles per Household | Owner-occupied | Renter-occupied |
| No Vehicle | 0 (0.0%) | 383 (32.4%) |
| 1 Vehicle | 381 (48.2%) | 669 (56.6%) |
| 2 Vehicles | 345 (43.7%) | 85 (7.2%) |
| 3 or more Vehicles | 64 (8.1%) | 46 (3.9%) |
| Total | 790 (100.0%) | 1,183 (100.0%) |
Real Estate & Mortgages in Lewisburg borough
Real Estate and Mortgage Overview in Lewisburg borough
| Characteristic | Without Mortgage | With Mortgage |
| Housing Units | 481 | 309 |
| Median Property Value | $199,200 | $266,300 |
| Median Household Income | $48,453 | $57 |
| Monthly Housing Costs | $653 | $52 |
| Real Estate Taxes | $3,038 | $0 |
Property Value by Mortgage Status in Lewisburg borough
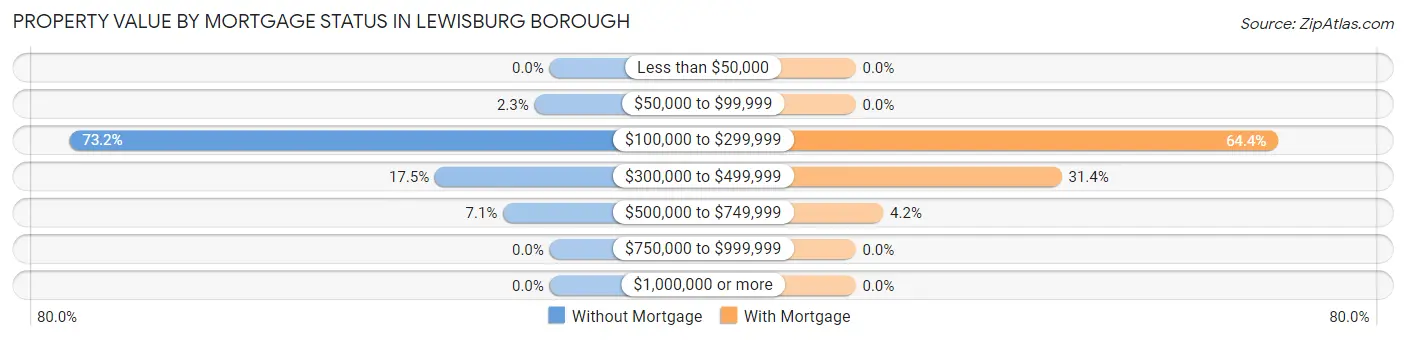
| Property Value | Without Mortgage | With Mortgage |
| Less than $50,000 | 0 (0.0%) | 0 (0.0%) |
| $50,000 to $99,999 | 11 (2.3%) | 0 (0.0%) |
| $100,000 to $299,999 | 352 (73.2%) | 199 (64.4%) |
| $300,000 to $499,999 | 84 (17.5%) | 97 (31.4%) |
| $500,000 to $749,999 | 34 (7.1%) | 13 (4.2%) |
| $750,000 to $999,999 | 0 (0.0%) | 0 (0.0%) |
| $1,000,000 or more | 0 (0.0%) | 0 (0.0%) |
| Total | 481 (100.0%) | 309 (100.0%) |
Household Income by Mortgage Status in Lewisburg borough
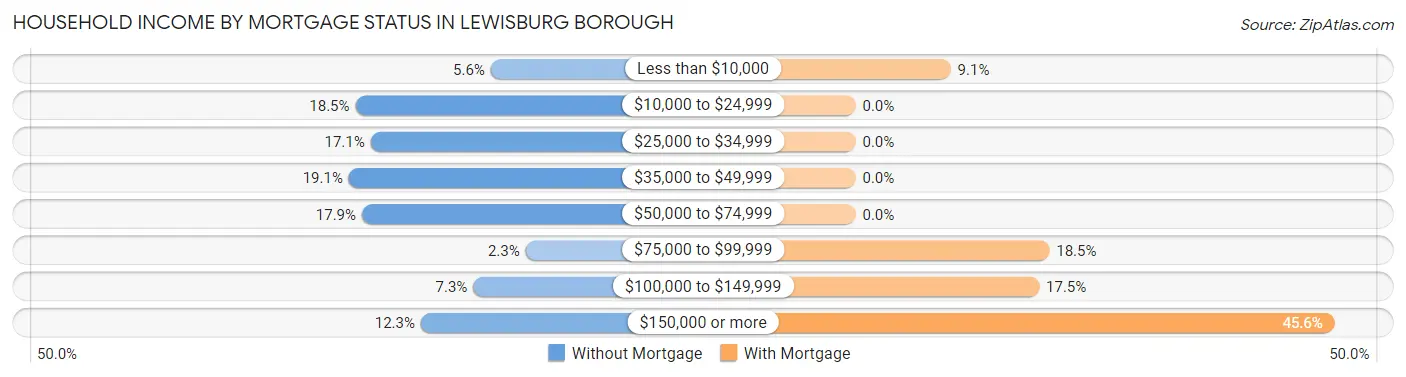
| Household Income | Without Mortgage | With Mortgage |
| Less than $10,000 | 27 (5.6%) | 28 (9.1%) |
| $10,000 to $24,999 | 89 (18.5%) | 0 (0.0%) |
| $25,000 to $34,999 | 82 (17.1%) | 0 (0.0%) |
| $35,000 to $49,999 | 92 (19.1%) | 0 (0.0%) |
| $50,000 to $74,999 | 86 (17.9%) | 0 (0.0%) |
| $75,000 to $99,999 | 11 (2.3%) | 57 (18.4%) |
| $100,000 to $149,999 | 35 (7.3%) | 54 (17.5%) |
| $150,000 or more | 59 (12.3%) | 141 (45.6%) |
| Total | 481 (100.0%) | 309 (100.0%) |
Property Value to Household Income Ratio in Lewisburg borough
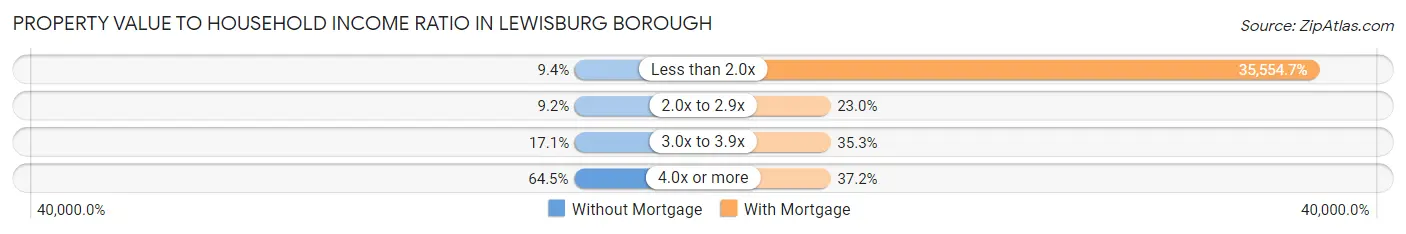
| Value-to-Income Ratio | Without Mortgage | With Mortgage |
| Less than 2.0x | 45 (9.4%) | 109,864 (35,554.7%) |
| 2.0x to 2.9x | 44 (9.1%) | 71 (23.0%) |
| 3.0x to 3.9x | 82 (17.1%) | 109 (35.3%) |
| 4.0x or more | 310 (64.4%) | 115 (37.2%) |
| Total | 481 (100.0%) | 309 (100.0%) |
Real Estate Taxes by Mortgage Status in Lewisburg borough
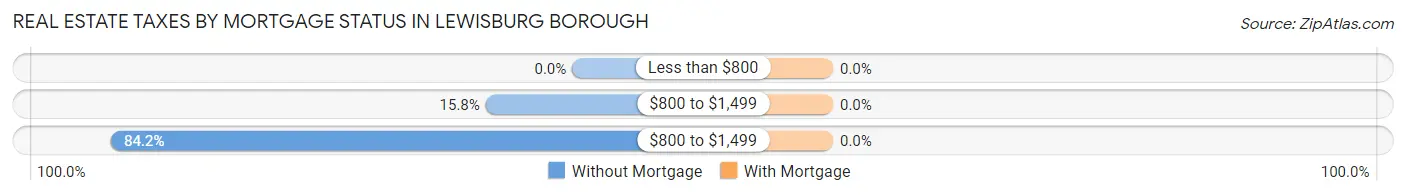
| Property Taxes | Without Mortgage | With Mortgage |
| Less than $800 | 0 (0.0%) | 0 (0.0%) |
| $800 to $1,499 | 76 (15.8%) | 0 (0.0%) |
| $800 to $1,499 | 405 (84.2%) | 0 (0.0%) |
| Total | 481 (100.0%) | 309 (100.0%) |
Health & Disability in Lewisburg borough
Health Insurance Coverage by Age in Lewisburg borough
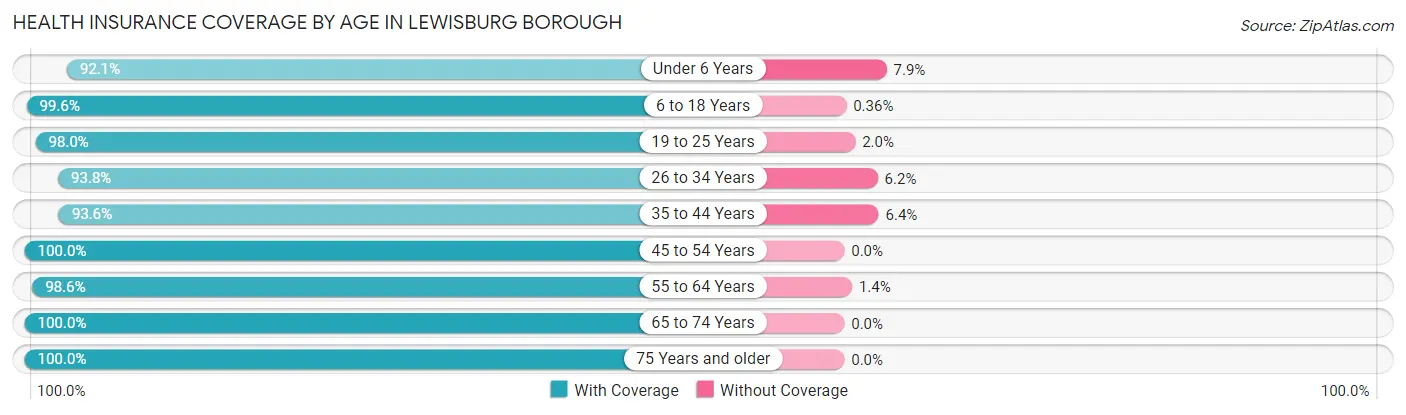
| Age Bracket | With Coverage | Without Coverage |
| Under 6 Years | 105 (92.1%) | 9 (7.9%) |
| 6 to 18 Years | 831 (99.6%) | 3 (0.4%) |
| 19 to 25 Years | 1,542 (98.0%) | 32 (2.0%) |
| 26 to 34 Years | 422 (93.8%) | 28 (6.2%) |
| 35 to 44 Years | 293 (93.6%) | 20 (6.4%) |
| 45 to 54 Years | 403 (100.0%) | 0 (0.0%) |
| 55 to 64 Years | 622 (98.6%) | 9 (1.4%) |
| 65 to 74 Years | 542 (100.0%) | 0 (0.0%) |
| 75 Years and older | 233 (100.0%) | 0 (0.0%) |
| Total | 4,993 (98.0%) | 101 (2.0%) |
Health Insurance Coverage by Citizenship Status in Lewisburg borough
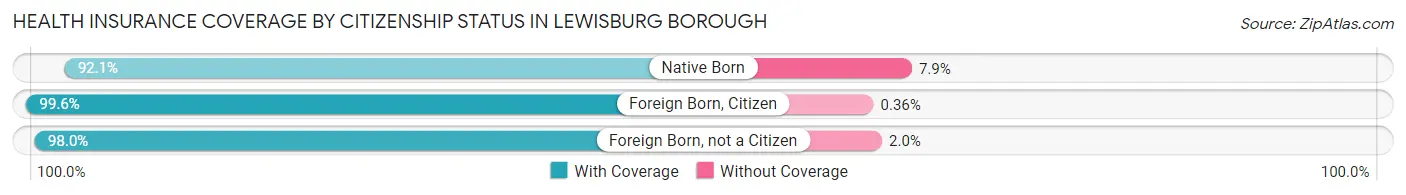
| Citizenship Status | With Coverage | Without Coverage |
| Native Born | 105 (92.1%) | 9 (7.9%) |
| Foreign Born, Citizen | 831 (99.6%) | 3 (0.4%) |
| Foreign Born, not a Citizen | 1,542 (98.0%) | 32 (2.0%) |
Health Insurance Coverage by Household Income in Lewisburg borough
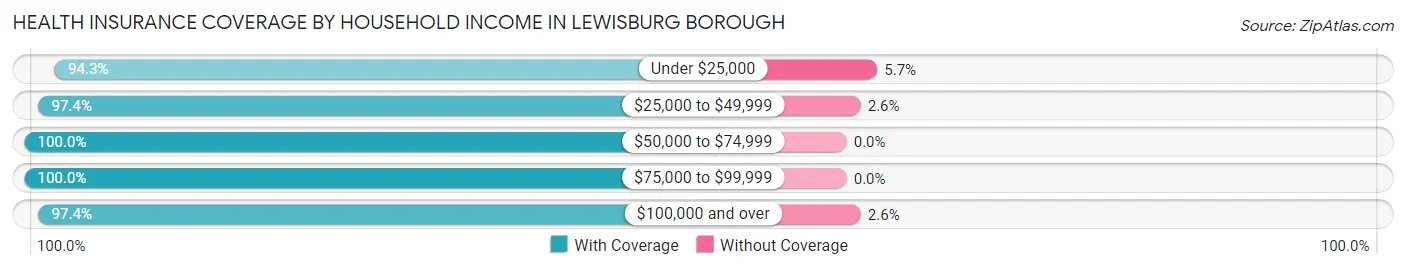
| Household Income | With Coverage | Without Coverage |
| Under $25,000 | 609 (94.3%) | 37 (5.7%) |
| $25,000 to $49,999 | 743 (97.4%) | 20 (2.6%) |
| $50,000 to $74,999 | 521 (100.0%) | 0 (0.0%) |
| $75,000 to $99,999 | 275 (100.0%) | 0 (0.0%) |
| $100,000 and over | 997 (97.4%) | 27 (2.6%) |
Public vs Private Health Insurance Coverage by Age in Lewisburg borough
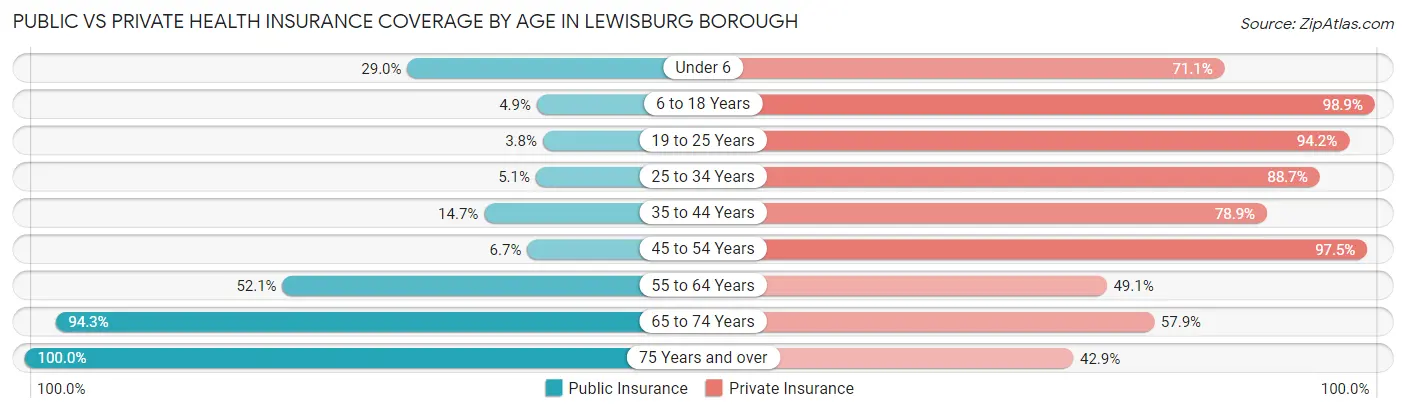
| Age Bracket | Public Insurance | Private Insurance |
| Under 6 | 33 (28.9%) | 81 (71.1%) |
| 6 to 18 Years | 41 (4.9%) | 825 (98.9%) |
| 19 to 25 Years | 60 (3.8%) | 1,482 (94.2%) |
| 25 to 34 Years | 23 (5.1%) | 399 (88.7%) |
| 35 to 44 Years | 46 (14.7%) | 247 (78.9%) |
| 45 to 54 Years | 27 (6.7%) | 393 (97.5%) |
| 55 to 64 Years | 329 (52.1%) | 310 (49.1%) |
| 65 to 74 Years | 511 (94.3%) | 314 (57.9%) |
| 75 Years and over | 233 (100.0%) | 100 (42.9%) |
| Total | 1,303 (25.6%) | 4,151 (81.5%) |
Disability Status by Sex by Age in Lewisburg borough
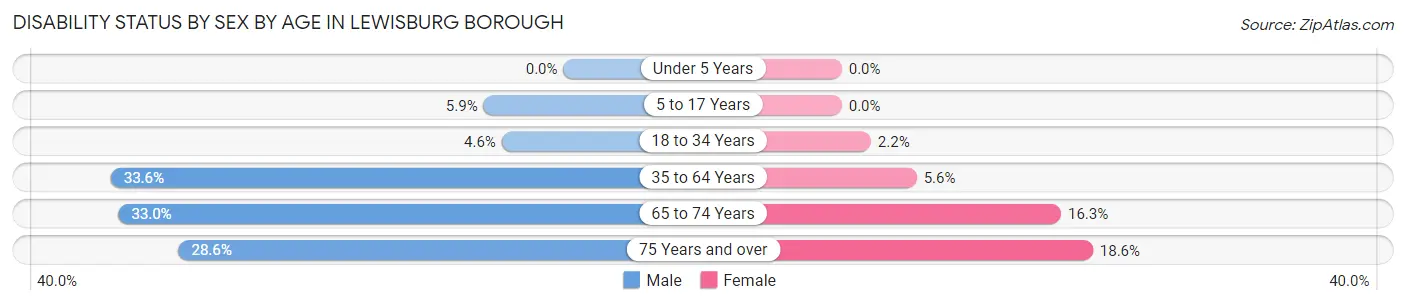
| Age Bracket | Male | Female |
| Under 5 Years | 0 (0.0%) | 0 (0.0%) |
| 5 to 17 Years | 7 (5.9%) | 0 (0.0%) |
| 18 to 34 Years | 63 (4.6%) | 26 (2.2%) |
| 35 to 64 Years | 211 (33.6%) | 40 (5.6%) |
| 65 to 74 Years | 108 (33.0%) | 35 (16.3%) |
| 75 Years and over | 16 (28.6%) | 33 (18.6%) |
Disability Class by Sex by Age in Lewisburg borough
Disability Class: Hearing Difficulty
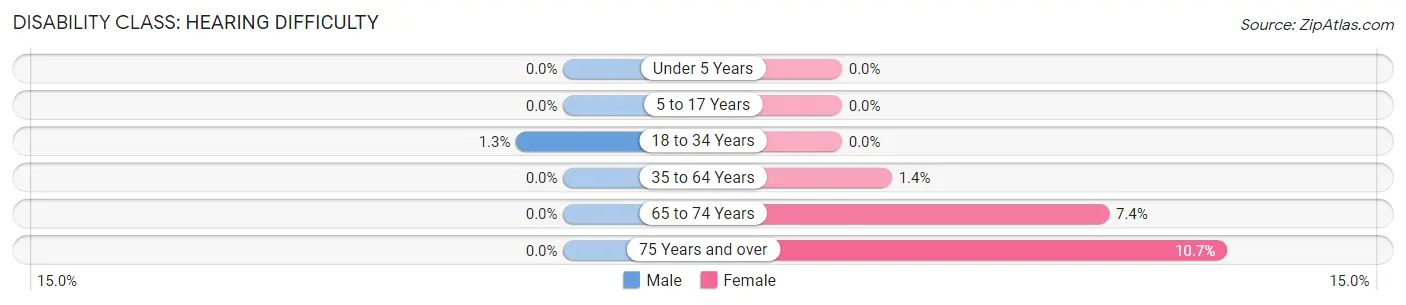
| Age Bracket | Male | Female |
| Under 5 Years | 0 (0.0%) | 0 (0.0%) |
| 5 to 17 Years | 0 (0.0%) | 0 (0.0%) |
| 18 to 34 Years | 18 (1.3%) | 0 (0.0%) |
| 35 to 64 Years | 0 (0.0%) | 10 (1.4%) |
| 65 to 74 Years | 0 (0.0%) | 16 (7.4%) |
| 75 Years and over | 0 (0.0%) | 19 (10.7%) |
Disability Class: Vision Difficulty
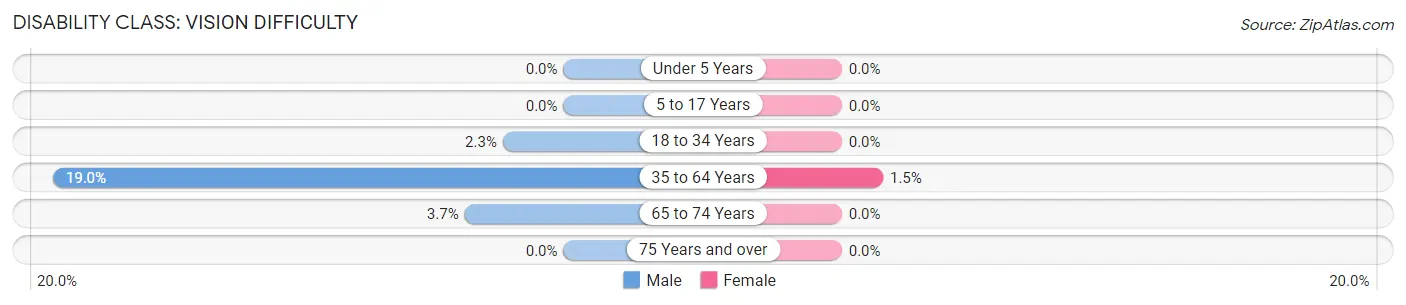
| Age Bracket | Male | Female |
| Under 5 Years | 0 (0.0%) | 0 (0.0%) |
| 5 to 17 Years | 0 (0.0%) | 0 (0.0%) |
| 18 to 34 Years | 31 (2.2%) | 0 (0.0%) |
| 35 to 64 Years | 119 (19.0%) | 11 (1.5%) |
| 65 to 74 Years | 12 (3.7%) | 0 (0.0%) |
| 75 Years and over | 0 (0.0%) | 0 (0.0%) |
Disability Class: Cognitive Difficulty
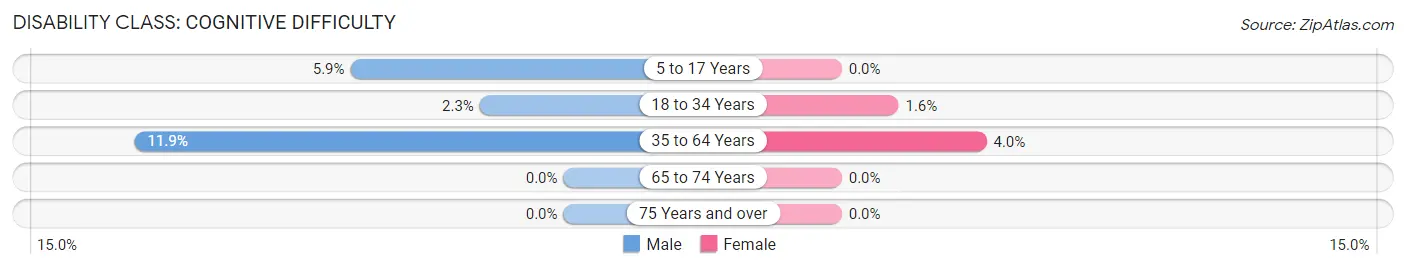
| Age Bracket | Male | Female |
| 5 to 17 Years | 7 (5.9%) | 0 (0.0%) |
| 18 to 34 Years | 32 (2.3%) | 19 (1.6%) |
| 35 to 64 Years | 75 (11.9%) | 29 (4.0%) |
| 65 to 74 Years | 0 (0.0%) | 0 (0.0%) |
| 75 Years and over | 0 (0.0%) | 0 (0.0%) |
Disability Class: Ambulatory Difficulty
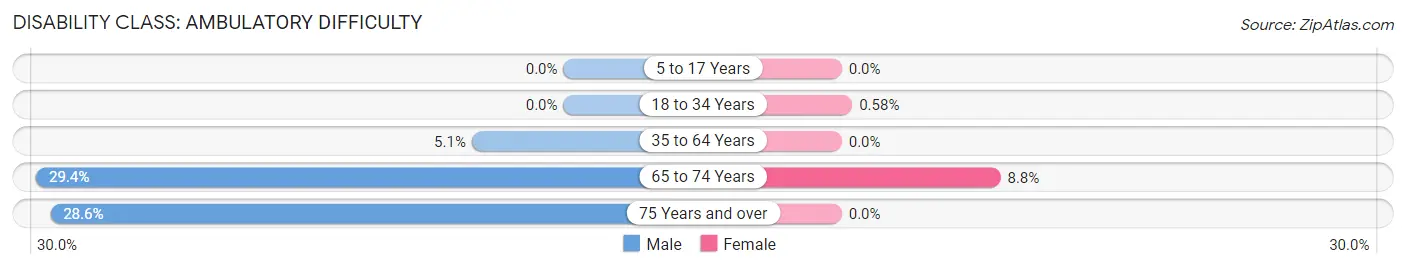
| Age Bracket | Male | Female |
| 5 to 17 Years | 0 (0.0%) | 0 (0.0%) |
| 18 to 34 Years | 0 (0.0%) | 7 (0.6%) |
| 35 to 64 Years | 32 (5.1%) | 0 (0.0%) |
| 65 to 74 Years | 96 (29.4%) | 19 (8.8%) |
| 75 Years and over | 16 (28.6%) | 0 (0.0%) |
Disability Class: Self-Care Difficulty
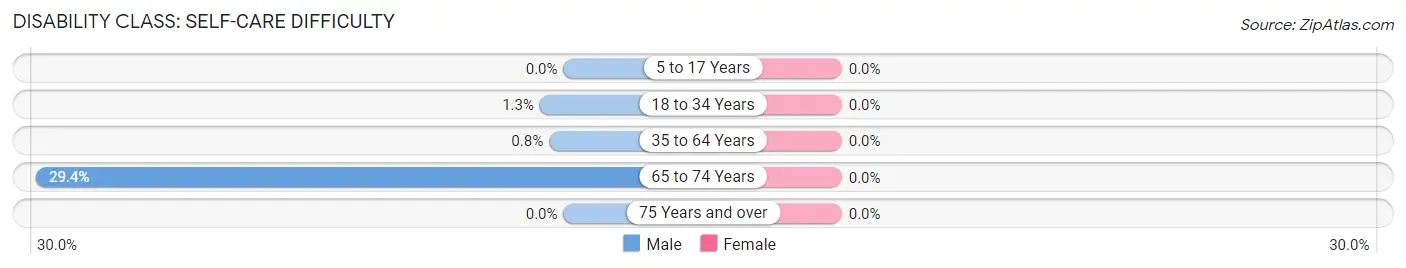
| Age Bracket | Male | Female |
| 5 to 17 Years | 0 (0.0%) | 0 (0.0%) |
| 18 to 34 Years | 18 (1.3%) | 0 (0.0%) |
| 35 to 64 Years | 5 (0.8%) | 0 (0.0%) |
| 65 to 74 Years | 96 (29.4%) | 0 (0.0%) |
| 75 Years and over | 0 (0.0%) | 0 (0.0%) |
Technology Access in Lewisburg borough
Computing Device Access in Lewisburg borough
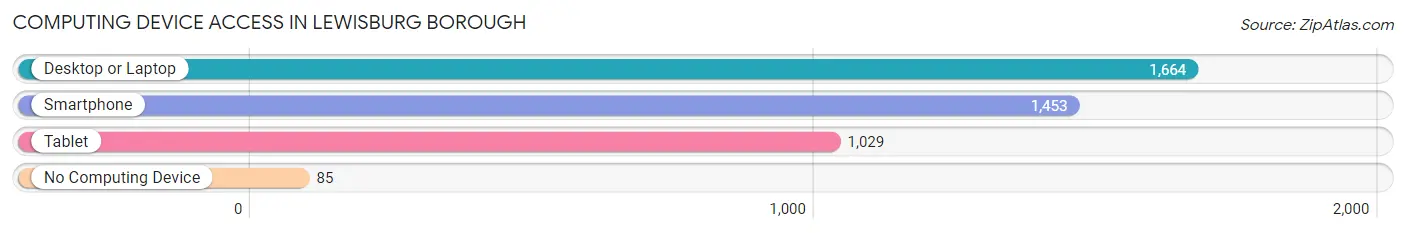
| Device Type | # Households | % Households |
| Desktop or Laptop | 1,664 | 84.3% |
| Smartphone | 1,453 | 73.6% |
| Tablet | 1,029 | 52.1% |
| No Computing Device | 85 | 4.3% |
| Total | 1,973 | 100.0% |
Internet Access in Lewisburg borough
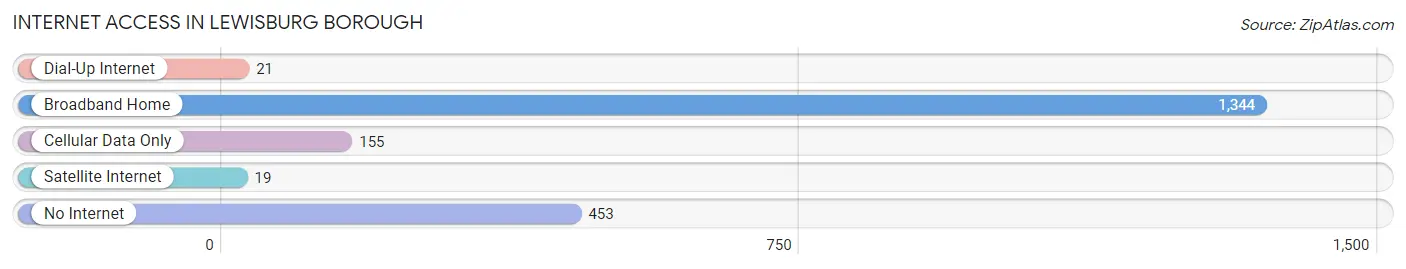
| Internet Type | # Households | % Households |
| Dial-Up Internet | 21 | 1.1% |
| Broadband Home | 1,344 | 68.1% |
| Cellular Data Only | 155 | 7.9% |
| Satellite Internet | 19 | 1.0% |
| No Internet | 453 | 23.0% |
| Total | 1,973 | 100.0% |
Lewisburg borough Summary
Lewisburg Borough is a small borough located in Union County, Pennsylvania. It is situated in the Susquehanna River Valley, approximately three miles south of the city of Williamsport. The borough is home to Bucknell University, a private liberal arts college, and is part of the larger Lewisburg Area School District. The borough has a population of 5,620 as of the 2010 census.
History
The area that is now Lewisburg Borough was first settled in 1784 by a group of German immigrants led by Johann Adam Hoops. The settlement was originally known as Hoops’ Settlement, and was later renamed Lewisburg in honor of Ludwig Derr, a prominent local landowner. The borough was officially incorporated in 1812.
In the early 19th century, Lewisburg was a thriving commercial center, with a variety of businesses and industries. The borough was home to a number of tanneries, gristmills, and sawmills, as well as a number of other businesses. The Susquehanna and Tidewater Canal, which opened in 1834, provided a direct connection to the markets of Philadelphia and Baltimore, further boosting the local economy.
In 1846, the Bucknell Institute was founded in Lewisburg. The school was later renamed Bucknell University, and is now one of the top liberal arts colleges in the country. The university has played an important role in the development of the borough, and continues to be a major employer in the area.
Geography
Lewisburg Borough is located in the Susquehanna River Valley, approximately three miles south of the city of Williamsport. The borough is situated on the east bank of the Susquehanna River, and is bordered by East Buffalo Township to the north, Kelly Township to the east, White Deer Township to the south, and Buffalo Township to the west.
The borough has a total area of 1.3 square miles, all of which is land. The terrain is generally flat, with some rolling hills in the northern part of the borough. The borough is located in the Appalachian Mountains, and is part of the Ridge and Valley physiographic province.
Economy
The economy of Lewisburg Borough is largely driven by education and healthcare. Bucknell University is the largest employer in the borough, with over 1,500 employees. The university also provides a significant economic boost to the local economy through its students, faculty, and staff.
The borough is also home to Evangelical Community Hospital, a major healthcare provider in the region. The hospital employs over 1,000 people, and provides a variety of medical services to the local community.
In addition to education and healthcare, Lewisburg Borough is home to a number of small businesses, including restaurants, retail stores, and professional services. The borough is also home to a number of manufacturing companies, including a paper mill and a plastics factory.
Demographics
As of the 2010 census, the population of Lewisburg Borough was 5,620. The racial makeup of the borough was 94.3% White, 2.2% African American, 0.3% Native American, 1.2% Asian, 0.1% Pacific Islander, 0.7% from other races, and 1.3% from two or more races. Hispanic or Latino of any race were 2.2% of the population.
The median household income in Lewisburg Borough was $45,938, and the median family income was $60,938. The per capita income was $25,938. About 8.3% of families and 11.2% of the population were below the poverty line, including 14.2% of those under age 18 and 5.2% of those age 65 or over.
Common Questions
What is Per Capita Income in Lewisburg borough?
Per Capita income in Lewisburg borough is $28,706.
What is the Median Family Income in Lewisburg borough?
Median Family Income in Lewisburg borough is $91,786.
What is the Median Household income in Lewisburg borough?
Median Household Income in Lewisburg borough is $42,302.
What is Income or Wage Gap in Lewisburg borough?
Income or Wage Gap in Lewisburg borough is 8.3%.
Women in Lewisburg borough earn 91.7 cents for every dollar earned by a man.
What is Inequality or Gini Index in Lewisburg borough?
Inequality or Gini Index in Lewisburg borough is 0.54.
What is the Total Population of Lewisburg borough?
Total Population of Lewisburg borough is 5,284.
What is the Total Male Population of Lewisburg borough?
Total Male Population of Lewisburg borough is 2,602.
What is the Total Female Population of Lewisburg borough?
Total Female Population of Lewisburg borough is 2,682.
What is the Ratio of Males per 100 Females in Lewisburg borough?
There are 97.02 Males per 100 Females in Lewisburg borough.
What is the Ratio of Females per 100 Males in Lewisburg borough?
There are 103.07 Females per 100 Males in Lewisburg borough.
What is the Median Population Age in Lewisburg borough?
Median Population Age in Lewisburg borough is 28.6 Years.
What is the Average Family Size in Lewisburg borough
Average Family Size in Lewisburg borough is 2.5 People.
What is the Average Household Size in Lewisburg borough
Average Household Size in Lewisburg borough is 1.6 People.
How Large is the Labor Force in Lewisburg borough?
There are 2,292 People in the Labor Forcein in Lewisburg borough.
What is the Percentage of People in the Labor Force in Lewisburg borough?
46.5% of People are in the Labor Force in Lewisburg borough.
What is the Unemployment Rate in Lewisburg borough?
Unemployment Rate in Lewisburg borough is 1.6%.