Goodville, PA Map & Demographics
Goodville Map
Goodville Overview
$20,399
PER CAPITA INCOME
$53,750
AVG FAMILY INCOME
$41,758
AVG HOUSEHOLD INCOME
0.27
INEQUALITY / GINI INDEX
281
TOTAL POPULATION
94
MALE POPULATION
187
FEMALE POPULATION
50.27
MALES / 100 FEMALES
198.94
FEMALES / 100 MALES
35.0
MEDIAN AGE
3.3
AVG FAMILY SIZE
2.4
AVG HOUSEHOLD SIZE
150
LABOR FORCE [ PEOPLE ]
87.2%
PERCENT IN LABOR FORCE
Goodville Area Codes
Income in Goodville
Income Overview in Goodville
Per Capita Income in Goodville is $20,399, while median incomes of families and households are $53,750 and $41,758 respectively.
| Characteristic | Number | Measure |
| Per Capita Income | 281 | $20,399 |
| Median Family Income | 72 | $53,750 |
| Mean Family Income | 72 | $56,839 |
| Median Household Income | 117 | $41,758 |
| Mean Household Income | 117 | $49,642 |
| Income Deficit | 72 | $0 |
| Wage / Income Gap (%) | 281 | 0.00% |
| Wage / Income Gap ($) | 281 | 100.00¢ per $1 |
| Gini / Inequality Index | 281 | 0.27 |
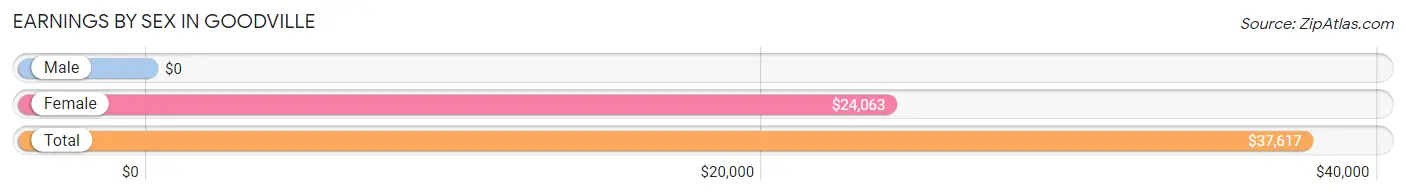
Earnings by Sex in Goodville
| Sex | Number | Average Earnings |
| Male | 55 (35.0%) | $0 |
| Female | 102 (65.0%) | $24,063 |
| Total | 157 (100.0%) | $37,617 |
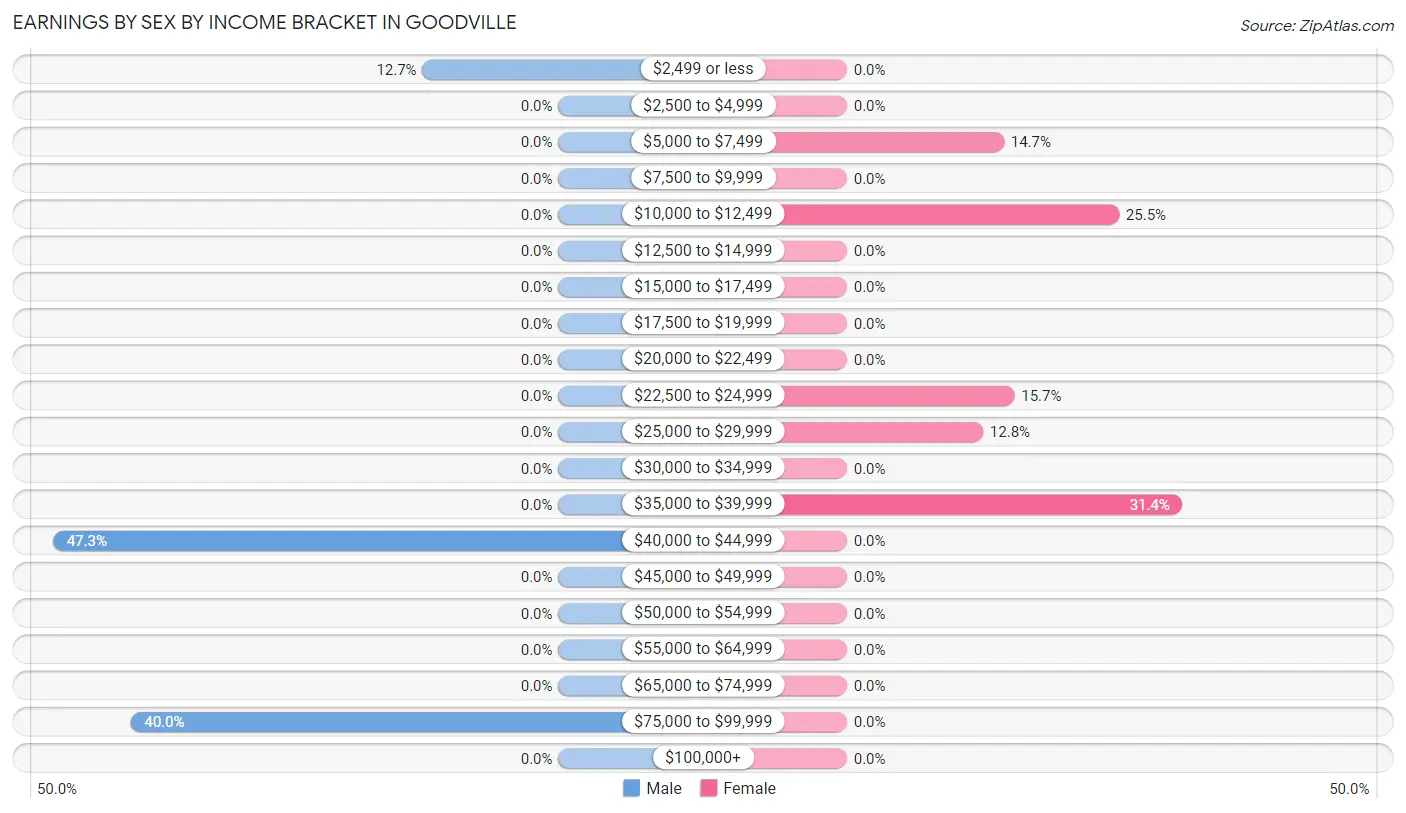
Earnings by Sex by Income Bracket in Goodville
The most common earnings brackets in Goodville are $40,000 to $44,999 for men (26 | 47.3%) and $35,000 to $39,999 for women (32 | 31.4%).
| Income | Male | Female |
| $2,499 or less | 7 (12.7%) | 0 (0.0%) |
| $2,500 to $4,999 | 0 (0.0%) | 0 (0.0%) |
| $5,000 to $7,499 | 0 (0.0%) | 15 (14.7%) |
| $7,500 to $9,999 | 0 (0.0%) | 0 (0.0%) |
| $10,000 to $12,499 | 0 (0.0%) | 26 (25.5%) |
| $12,500 to $14,999 | 0 (0.0%) | 0 (0.0%) |
| $15,000 to $17,499 | 0 (0.0%) | 0 (0.0%) |
| $17,500 to $19,999 | 0 (0.0%) | 0 (0.0%) |
| $20,000 to $22,499 | 0 (0.0%) | 0 (0.0%) |
| $22,500 to $24,999 | 0 (0.0%) | 16 (15.7%) |
| $25,000 to $29,999 | 0 (0.0%) | 13 (12.8%) |
| $30,000 to $34,999 | 0 (0.0%) | 0 (0.0%) |
| $35,000 to $39,999 | 0 (0.0%) | 32 (31.4%) |
| $40,000 to $44,999 | 26 (47.3%) | 0 (0.0%) |
| $45,000 to $49,999 | 0 (0.0%) | 0 (0.0%) |
| $50,000 to $54,999 | 0 (0.0%) | 0 (0.0%) |
| $55,000 to $64,999 | 0 (0.0%) | 0 (0.0%) |
| $65,000 to $74,999 | 0 (0.0%) | 0 (0.0%) |
| $75,000 to $99,999 | 22 (40.0%) | 0 (0.0%) |
| $100,000+ | 0 (0.0%) | 0 (0.0%) |
| Total | 55 (100.0%) | 102 (100.0%) |
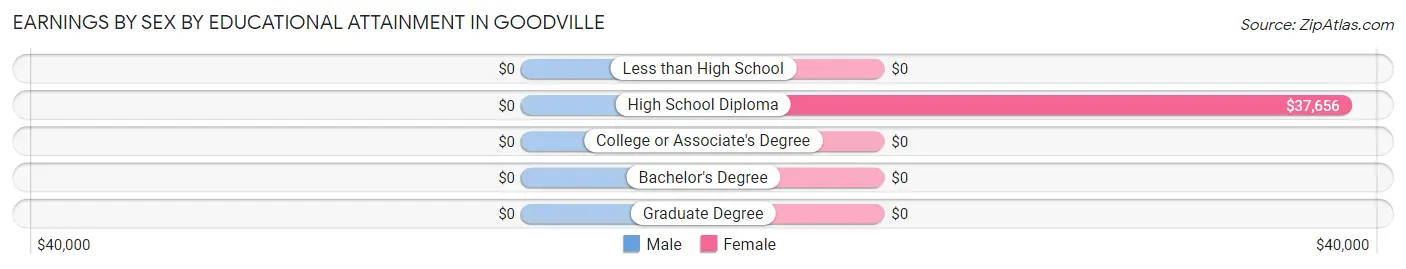
Earnings by Sex by Educational Attainment in Goodville
| Educational Attainment | Male Income | Female Income |
| Less than High School | - | - |
| High School Diploma | - | - |
| College or Associate's Degree | - | - |
| Bachelor's Degree | - | - |
| Graduate Degree | - | - |
| Total | - | - |
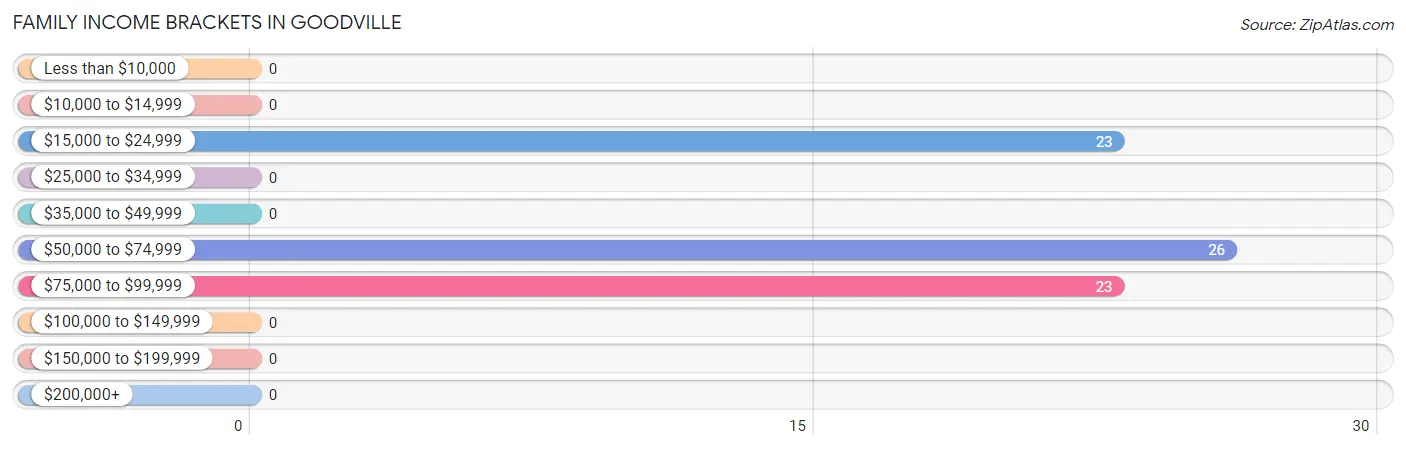
Family Income in Goodville
Family Income Brackets in Goodville
According to the Goodville family income data, there are 26 families falling into the $50,000 to $74,999 income range, which is the most common income bracket and makes up 36.1% of all families.
| Income Bracket | # Families | % Families |
| Less than $10,000 | 0 | 0.0% |
| $10,000 to $14,999 | 0 | 0.0% |
| $15,000 to $24,999 | 23 | 31.9% |
| $25,000 to $34,999 | 0 | 0.0% |
| $35,000 to $49,999 | 0 | 0.0% |
| $50,000 to $74,999 | 26 | 36.1% |
| $75,000 to $99,999 | 23 | 31.9% |
| $100,000 to $149,999 | 0 | 0.0% |
| $150,000 to $199,999 | 0 | 0.0% |
| $200,000+ | 0 | 0.0% |
Family Income by Famaliy Size in Goodville
| Income Bracket | # Families | Median Income |
| 2-Person Families | 7 (9.7%) | $0 |
| 3-Person Families | 42 (58.3%) | $0 |
| 4-Person Families | 15 (20.8%) | $0 |
| 5-Person Families | 8 (11.1%) | $0 |
| 6-Person Families | 0 (0.0%) | $0 |
| 7+ Person Families | 0 (0.0%) | $0 |
| Total | 72 (100.0%) | $53,750 |
Family Income by Number of Earners in Goodville
| Number of Earners | # Families | Median Income |
| No Earners | 0 (0.0%) | $0 |
| 1 Earner | 31 (43.1%) | $0 |
| 2 Earners | 41 (56.9%) | $0 |
| 3+ Earners | 0 (0.0%) | $0 |
| Total | 72 (100.0%) | $53,750 |
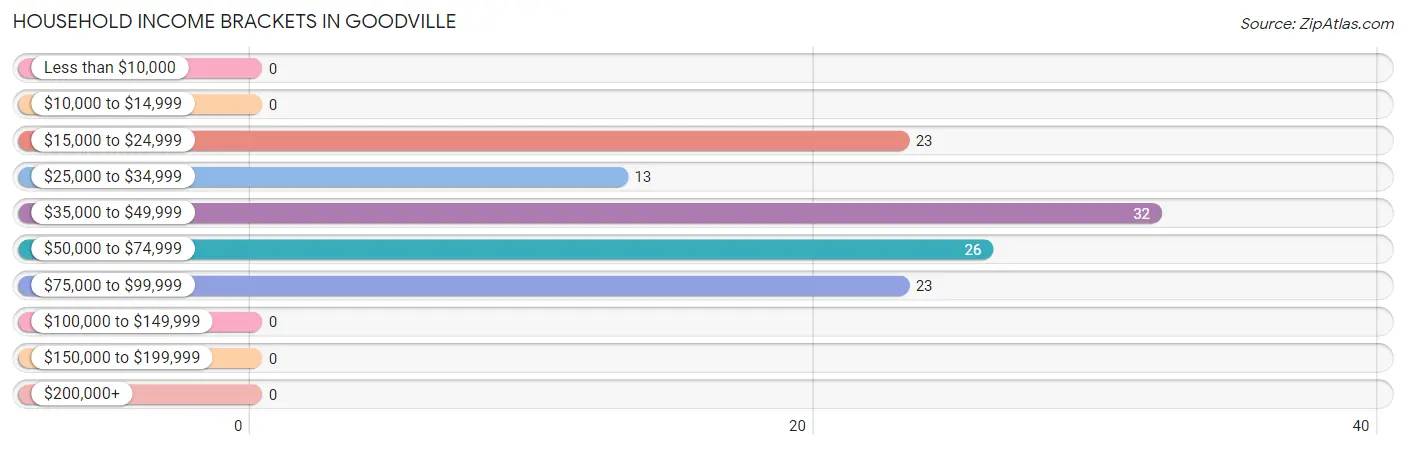
Household Income in Goodville
Household Income Brackets in Goodville
With 32 households falling in the category, the $35,000 to $49,999 income range is the most frequent in Goodville, accounting for 27.4% of all households.
| Income Bracket | # Households | % Households |
| Less than $10,000 | 0 | 0.0% |
| $10,000 to $14,999 | 0 | 0.0% |
| $15,000 to $24,999 | 23 | 19.7% |
| $25,000 to $34,999 | 13 | 11.1% |
| $35,000 to $49,999 | 32 | 27.4% |
| $50,000 to $74,999 | 26 | 22.2% |
| $75,000 to $99,999 | 23 | 19.7% |
| $100,000 to $149,999 | 0 | 0.0% |
| $150,000 to $199,999 | 0 | 0.0% |
| $200,000+ | 0 | 0.0% |
Household Income by Householder Age in Goodville
The median household income in Goodville is $41,758, with the highest median household income of $41,016 found in the 25 to 44 years age bracket for the primary householder. A total of 84 households (71.8%) fall into this category.
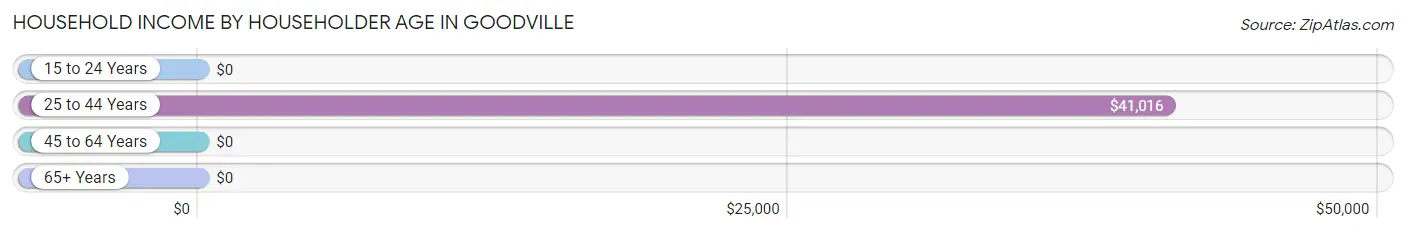
| Income Bracket | # Households | Median Income |
| 15 to 24 Years | 0 (0.0%) | $0 |
| 25 to 44 Years | 84 (71.8%) | $41,016 |
| 45 to 64 Years | 26 (22.2%) | $0 |
| 65+ Years | 7 (6.0%) | $0 |
| Total | 117 (100.0%) | $41,758 |
Poverty in Goodville
Income Below Poverty by Sex and Age in Goodville
With 17.0% poverty level for males and 17.1% for females among the residents of Goodville, 6 to 11 year old males and 12 to 14 year old females are the most vulnerable to poverty, with 16 males (100.0%) and 16 females (100.0%) in their respective age groups living below the poverty level.
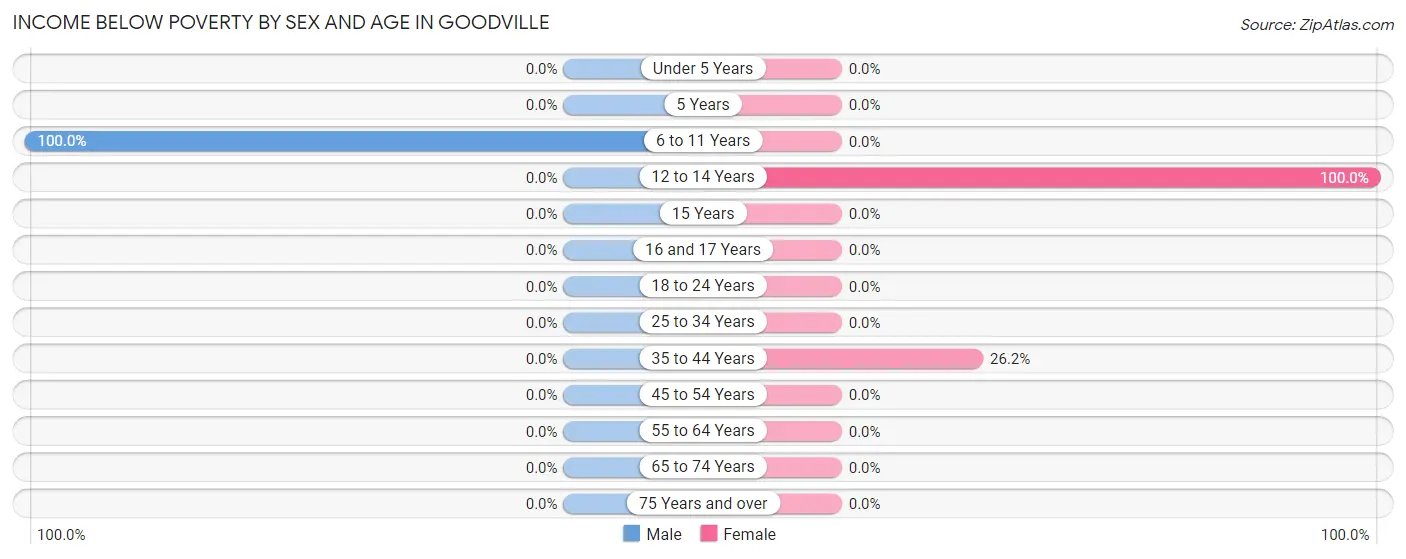
| Age Bracket | Male | Female |
| Under 5 Years | 0 (0.0%) | 0 (0.0%) |
| 5 Years | 0 (0.0%) | 0 (0.0%) |
| 6 to 11 Years | 16 (100.0%) | 0 (0.0%) |
| 12 to 14 Years | 0 (0.0%) | 16 (100.0%) |
| 15 Years | 0 (0.0%) | 0 (0.0%) |
| 16 and 17 Years | 0 (0.0%) | 0 (0.0%) |
| 18 to 24 Years | 0 (0.0%) | 0 (0.0%) |
| 25 to 34 Years | 0 (0.0%) | 0 (0.0%) |
| 35 to 44 Years | 0 (0.0%) | 16 (26.2%) |
| 45 to 54 Years | 0 (0.0%) | 0 (0.0%) |
| 55 to 64 Years | 0 (0.0%) | 0 (0.0%) |
| 65 to 74 Years | 0 (0.0%) | 0 (0.0%) |
| 75 Years and over | 0 (0.0%) | 0 (0.0%) |
| Total | 16 (17.0%) | 32 (17.1%) |
Income Above Poverty by Sex and Age in Goodville
According to the poverty statistics in Goodville, males aged under 5 years and females aged under 5 years are the age groups that are most secure financially, with 100.0% of males and 100.0% of females in these age groups living above the poverty line.
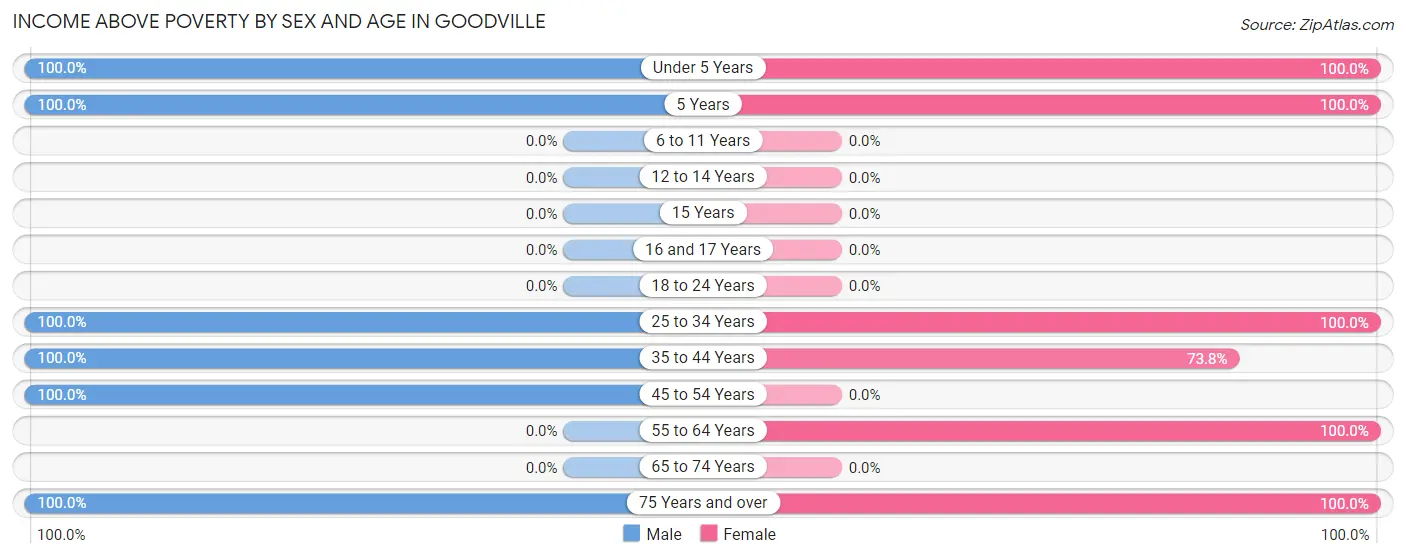
| Age Bracket | Male | Female |
| Under 5 Years | 8 (100.0%) | 22 (100.0%) |
| 5 Years | 15 (100.0%) | 32 (100.0%) |
| 6 to 11 Years | 0 (0.0%) | 0 (0.0%) |
| 12 to 14 Years | 0 (0.0%) | 0 (0.0%) |
| 15 Years | 0 (0.0%) | 0 (0.0%) |
| 16 and 17 Years | 0 (0.0%) | 0 (0.0%) |
| 18 to 24 Years | 0 (0.0%) | 0 (0.0%) |
| 25 to 34 Years | 8 (100.0%) | 22 (100.0%) |
| 35 to 44 Years | 14 (100.0%) | 45 (73.8%) |
| 45 to 54 Years | 26 (100.0%) | 0 (0.0%) |
| 55 to 64 Years | 0 (0.0%) | 26 (100.0%) |
| 65 to 74 Years | 0 (0.0%) | 0 (0.0%) |
| 75 Years and over | 7 (100.0%) | 8 (100.0%) |
| Total | 78 (83.0%) | 155 (82.9%) |
Income Below Poverty Among Married-Couple Families in Goodville
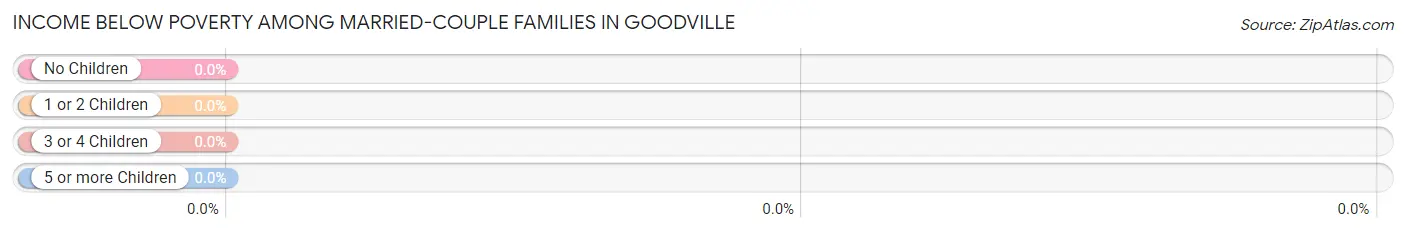
| Children | Above Poverty | Below Poverty |
| No Children | 7 (100.0%) | 0 (0.0%) |
| 1 or 2 Children | 41 (100.0%) | 0 (0.0%) |
| 3 or 4 Children | 8 (100.0%) | 0 (0.0%) |
| 5 or more Children | 0 (0.0%) | 0 (0.0%) |
| Total | 56 (100.0%) | 0 (0.0%) |
Income Below Poverty Among Single-Parent Households in Goodville
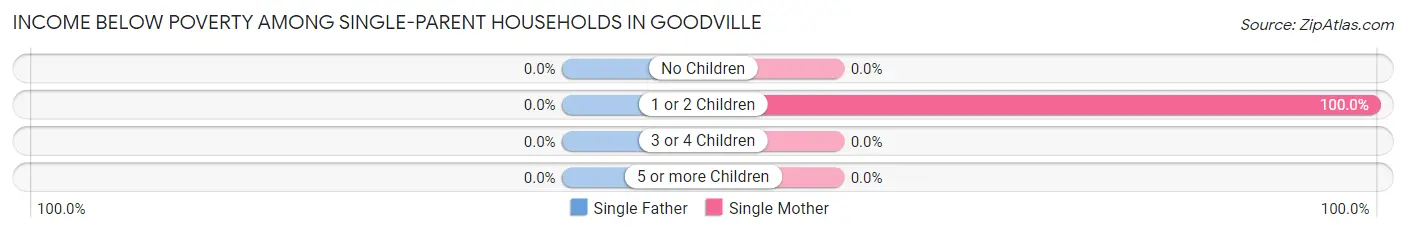
| Children | Single Father | Single Mother |
| No Children | 0 (0.0%) | 0 (0.0%) |
| 1 or 2 Children | 0 (0.0%) | 16 (100.0%) |
| 3 or 4 Children | 0 (0.0%) | 0 (0.0%) |
| 5 or more Children | 0 (0.0%) | 0 (0.0%) |
| Total | 0 (0.0%) | 16 (100.0%) |
Income Below Poverty Among Married-Couple vs Single-Parent Households in Goodville
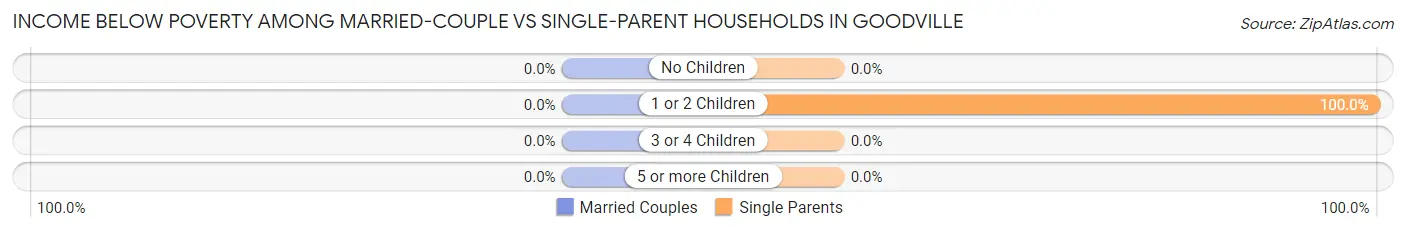
| Children | Married-Couple Families | Single-Parent Households |
| No Children | 0 (0.0%) | 0 (0.0%) |
| 1 or 2 Children | 0 (0.0%) | 16 (100.0%) |
| 3 or 4 Children | 0 (0.0%) | 0 (0.0%) |
| 5 or more Children | 0 (0.0%) | 0 (0.0%) |
| Total | 0 (0.0%) | 16 (100.0%) |
Race in Goodville
The most populous races in Goodville are White / Caucasian (231 | 82.2%), and Asian (50 | 17.8%).
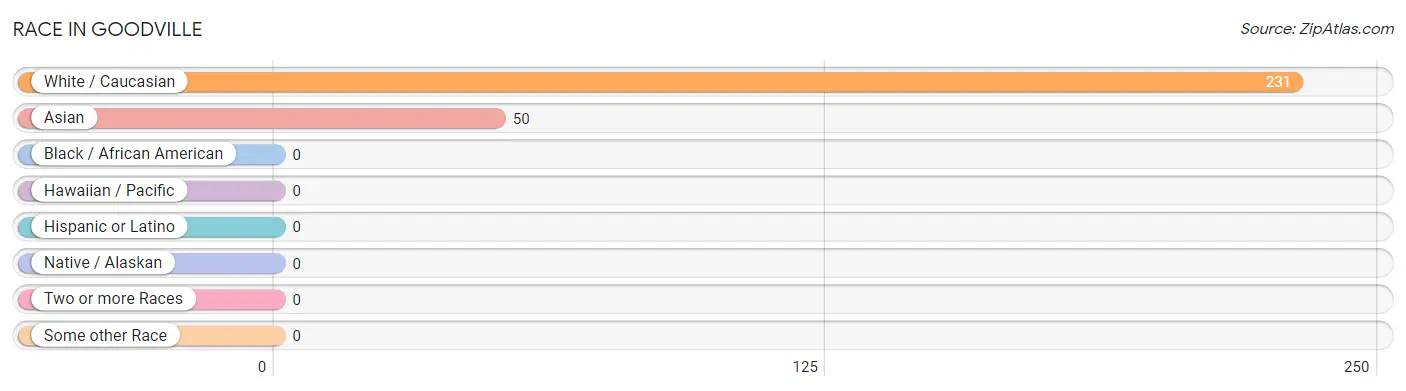
| Race | # Population | % Population |
| Asian | 50 | 17.8% |
| Black / African American | 0 | 0.0% |
| Hawaiian / Pacific | 0 | 0.0% |
| Hispanic or Latino | 0 | 0.0% |
| Native / Alaskan | 0 | 0.0% |
| White / Caucasian | 231 | 82.2% |
| Two or more Races | 0 | 0.0% |
| Some other Race | 0 | 0.0% |
| Total | 281 | 100.0% |
Ancestry in Goodville
The most populous ancestries reported in Goodville are German (58 | 20.6%), American (39 | 13.9%), Swiss (39 | 13.9%), Bhutanese (26 | 9.2%), and Indian (Asian) (24 | 8.5%), together accounting for 66.2% of all Goodville residents.
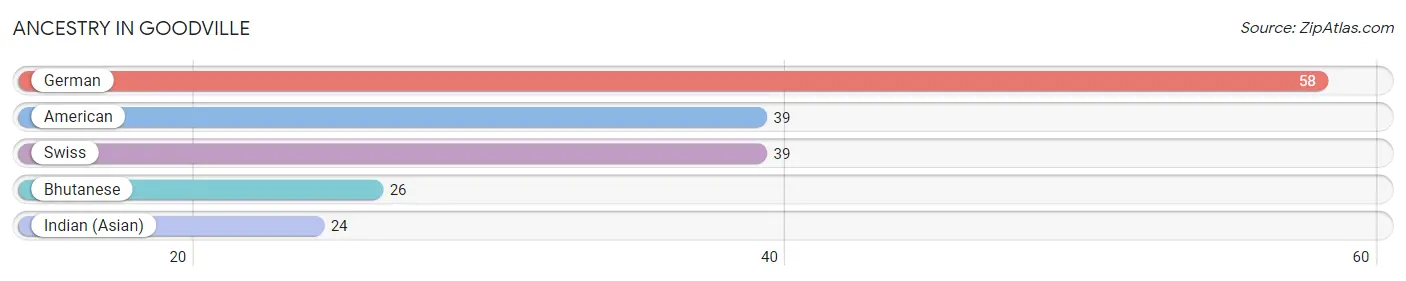
| Ancestry | # Population | % Population |
| American | 39 | 13.9% |
| Bhutanese | 26 | 9.2% |
| German | 58 | 20.6% |
| Indian (Asian) | 24 | 8.5% |
| Swiss | 39 | 13.9% | View All 5 Rows |
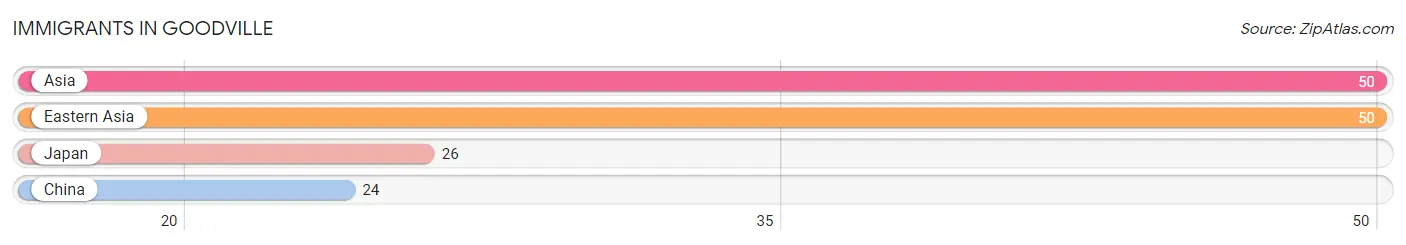
Immigrants in Goodville
The most numerous immigrant groups reported in Goodville came from Asia (50 | 17.8%), Eastern Asia (50 | 17.8%), Japan (26 | 9.2%), and China (24 | 8.5%), together accounting for 53.4% of all Goodville residents.
| Immigration Origin | # Population | % Population |
| Asia | 50 | 17.8% |
| China | 24 | 8.5% |
| Eastern Asia | 50 | 17.8% |
| Japan | 26 | 9.2% | View All 4 Rows |
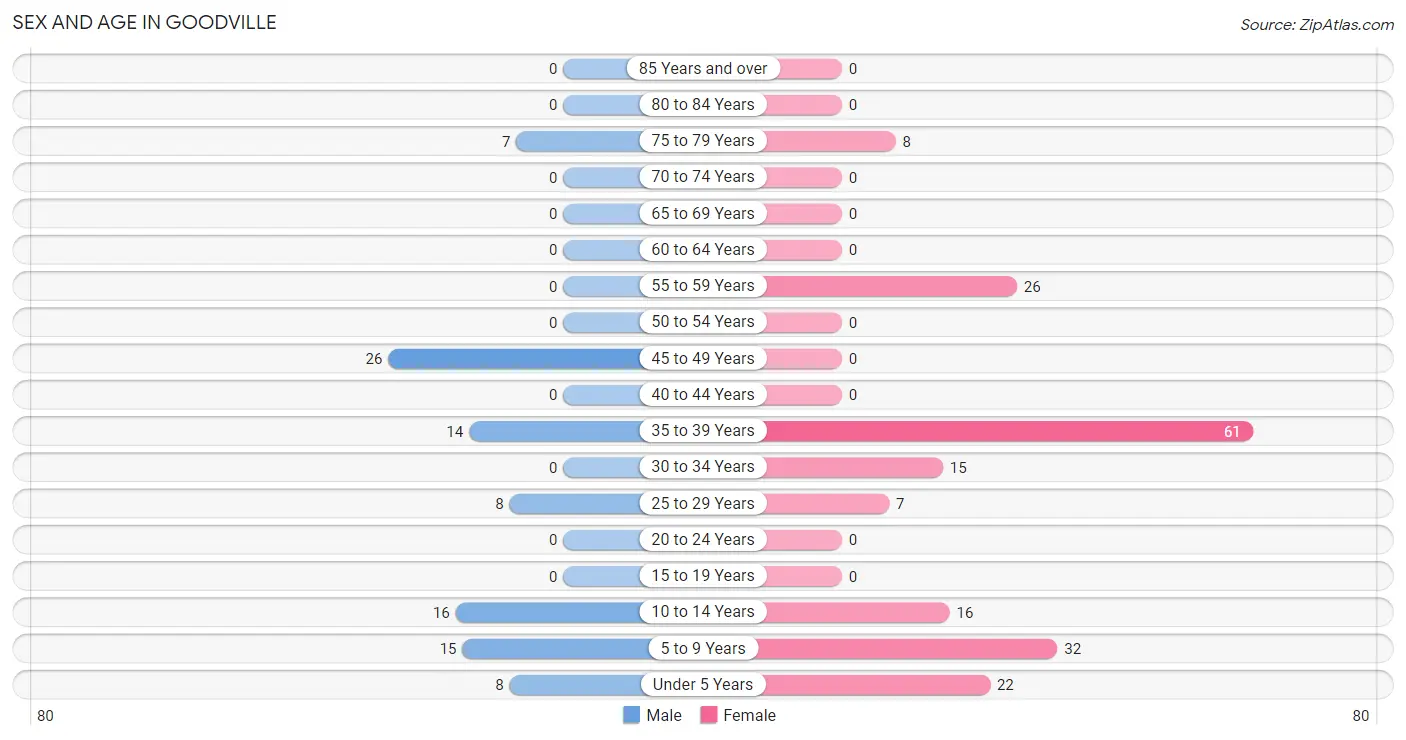
Sex and Age in Goodville
Sex and Age in Goodville
The most populous age groups in Goodville are 45 to 49 Years (26 | 27.7%) for men and 35 to 39 Years (61 | 32.6%) for women.
| Age Bracket | Male | Female |
| Under 5 Years | 8 (8.5%) | 22 (11.8%) |
| 5 to 9 Years | 15 (16.0%) | 32 (17.1%) |
| 10 to 14 Years | 16 (17.0%) | 16 (8.6%) |
| 15 to 19 Years | 0 (0.0%) | 0 (0.0%) |
| 20 to 24 Years | 0 (0.0%) | 0 (0.0%) |
| 25 to 29 Years | 8 (8.5%) | 7 (3.7%) |
| 30 to 34 Years | 0 (0.0%) | 15 (8.0%) |
| 35 to 39 Years | 14 (14.9%) | 61 (32.6%) |
| 40 to 44 Years | 0 (0.0%) | 0 (0.0%) |
| 45 to 49 Years | 26 (27.7%) | 0 (0.0%) |
| 50 to 54 Years | 0 (0.0%) | 0 (0.0%) |
| 55 to 59 Years | 0 (0.0%) | 26 (13.9%) |
| 60 to 64 Years | 0 (0.0%) | 0 (0.0%) |
| 65 to 69 Years | 0 (0.0%) | 0 (0.0%) |
| 70 to 74 Years | 0 (0.0%) | 0 (0.0%) |
| 75 to 79 Years | 7 (7.4%) | 8 (4.3%) |
| 80 to 84 Years | 0 (0.0%) | 0 (0.0%) |
| 85 Years and over | 0 (0.0%) | 0 (0.0%) |
| Total | 94 (100.0%) | 187 (100.0%) |
Families and Households in Goodville
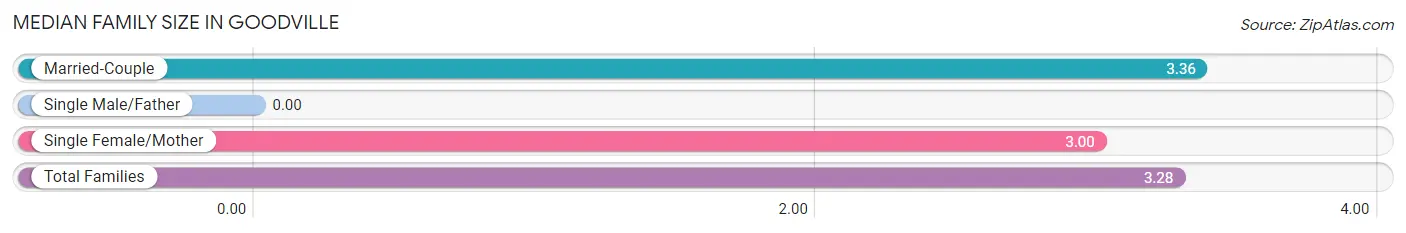
Median Family Size in Goodville
| Family Type | # Families | Family Size |
| Married-Couple | 56 (77.8%) | 3.36 |
| Single Male/Father | 0 (0.0%) | - |
| Single Female/Mother | 16 (22.2%) | 3.00 |
| Total Families | 72 (100.0%) | 3.28 |
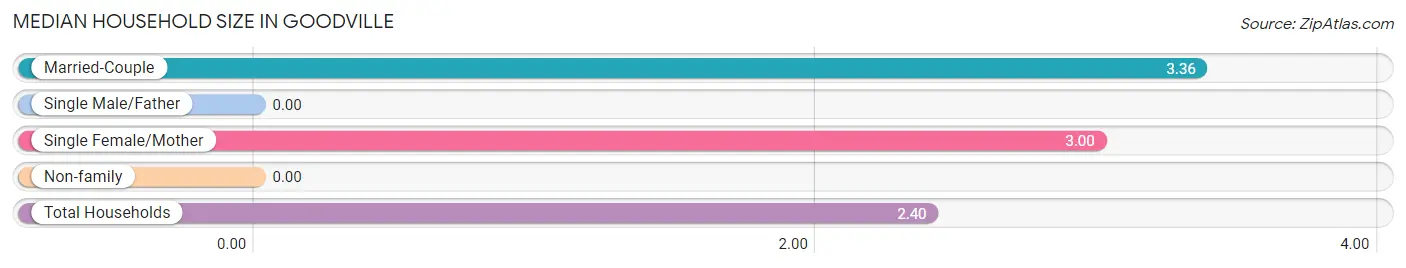
Median Household Size in Goodville
| Household Type | # Households | Household Size |
| Married-Couple | 56 (47.9%) | 3.36 |
| Single Male/Father | 0 (0.0%) | - |
| Single Female/Mother | 16 (13.7%) | 3.00 |
| Non-family | 45 (38.5%) | - |
| Total Households | 117 (100.0%) | 2.40 |
Household Size by Marriage Status in Goodville
Out of a total of 117 households in Goodville, 72 (61.5%) are family households, while 45 (38.5%) are nonfamily households. The most numerous type of family households are 3-person households, comprising 42, and the most common type of nonfamily households are 1-person households, comprising 45.
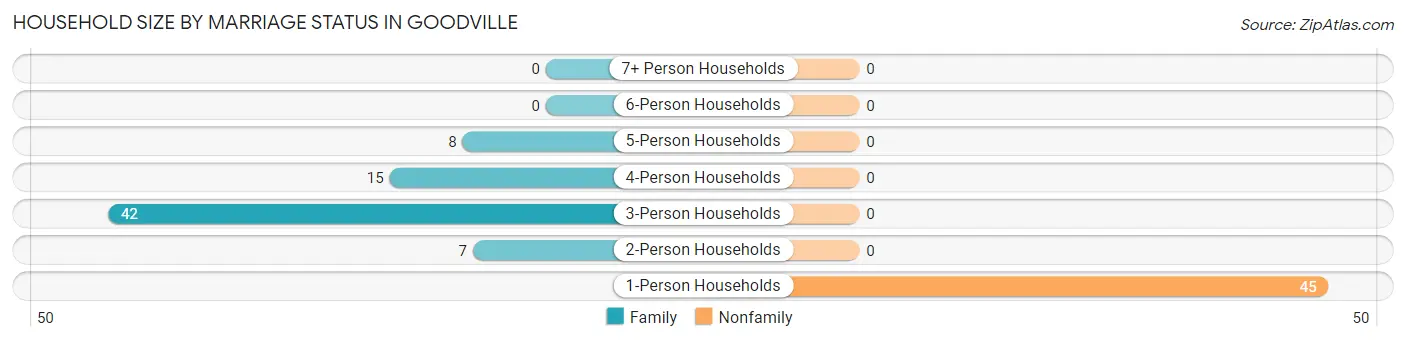
| Household Size | Family Households | Nonfamily Households |
| 1-Person Households | - | 45 (38.5%) |
| 2-Person Households | 7 (6.0%) | 0 (0.0%) |
| 3-Person Households | 42 (35.9%) | 0 (0.0%) |
| 4-Person Households | 15 (12.8%) | 0 (0.0%) |
| 5-Person Households | 8 (6.8%) | 0 (0.0%) |
| 6-Person Households | 0 (0.0%) | 0 (0.0%) |
| 7+ Person Households | 0 (0.0%) | 0 (0.0%) |
| Total | 72 (61.5%) | 45 (38.5%) |
Female Fertility in Goodville
Fertility by Age in Goodville
| Age Bracket | Women with Births | Births / 1,000 Women |
| 15 to 19 years | 0 (0.0%) | 0.0 |
| 20 to 34 years | 0 (0.0%) | 0.0 |
| 35 to 50 years | 0 (0.0%) | 0.0 |
| Total | 0 (0.0%) | 0.0 |
Fertility by Age by Marriage Status in Goodville
| Age Bracket | Married | Unmarried |
| 15 to 19 years | 0 (0.0%) | 0 (0.0%) |
| 20 to 34 years | 0 (0.0%) | 0 (0.0%) |
| 35 to 50 years | 0 (0.0%) | 0 (0.0%) |
| Total | 0 (0.0%) | 0 (0.0%) |
Fertility by Education in Goodville
| Educational Attainment | Women with Births | Births / 1,000 Women |
| Less than High School | 0 (0.0%) | 0.0 |
| High School Diploma | 0 (0.0%) | 0.0 |
| College or Associate's Degree | 0 (0.0%) | 0.0 |
| Bachelor's Degree | 0 (0.0%) | 0.0 |
| Graduate Degree | 0 (0.0%) | 0.0 |
| Total | 0 (0.0%) | 0.0 |
Fertility by Education by Marriage Status in Goodville
| Educational Attainment | Married | Unmarried |
| Less than High School | 0 (0.0%) | 0 (0.0%) |
| High School Diploma | 0 (0.0%) | 0 (0.0%) |
| College or Associate's Degree | 0 (0.0%) | 0 (0.0%) |
| Bachelor's Degree | 0 (0.0%) | 0 (0.0%) |
| Graduate Degree | 0 (0.0%) | 0 (0.0%) |
| Total | 0 (0.0%) | 0 (0.0%) |
Employment Characteristics in Goodville
Employment by Class of Employer in Goodville
Among the 150 employed individuals in Goodville, private company employees (64 | 42.7%), not-for-profit organizations (45 | 30.0%), and state government employees (26 | 17.3%) make up the most common classes of employment.
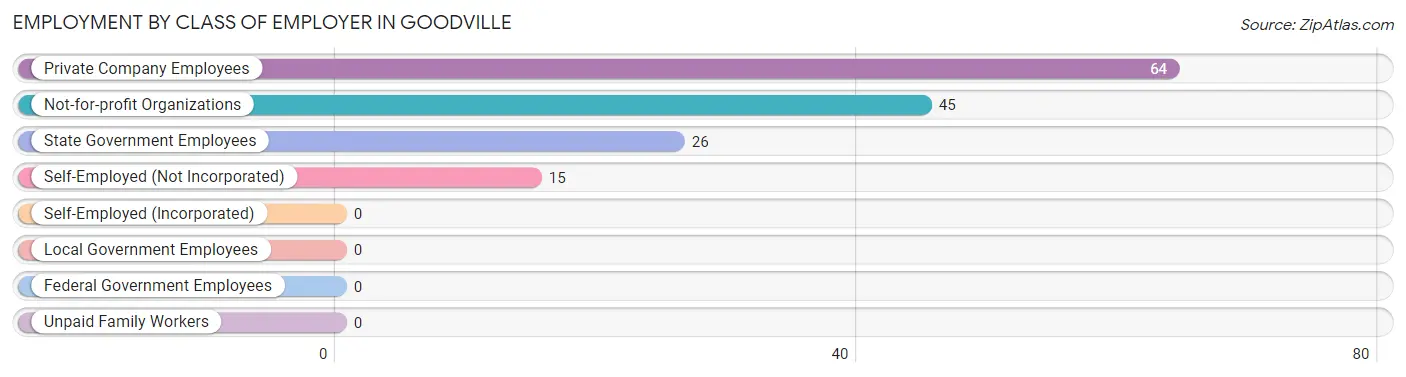
| Employer Class | # Employees | % Employees |
| Private Company Employees | 64 | 42.7% |
| Self-Employed (Incorporated) | 0 | 0.0% |
| Self-Employed (Not Incorporated) | 15 | 10.0% |
| Not-for-profit Organizations | 45 | 30.0% |
| Local Government Employees | 0 | 0.0% |
| State Government Employees | 26 | 17.3% |
| Federal Government Employees | 0 | 0.0% |
| Unpaid Family Workers | 0 | 0.0% |
| Total | 150 | 100.0% |
Employment Status by Age in Goodville
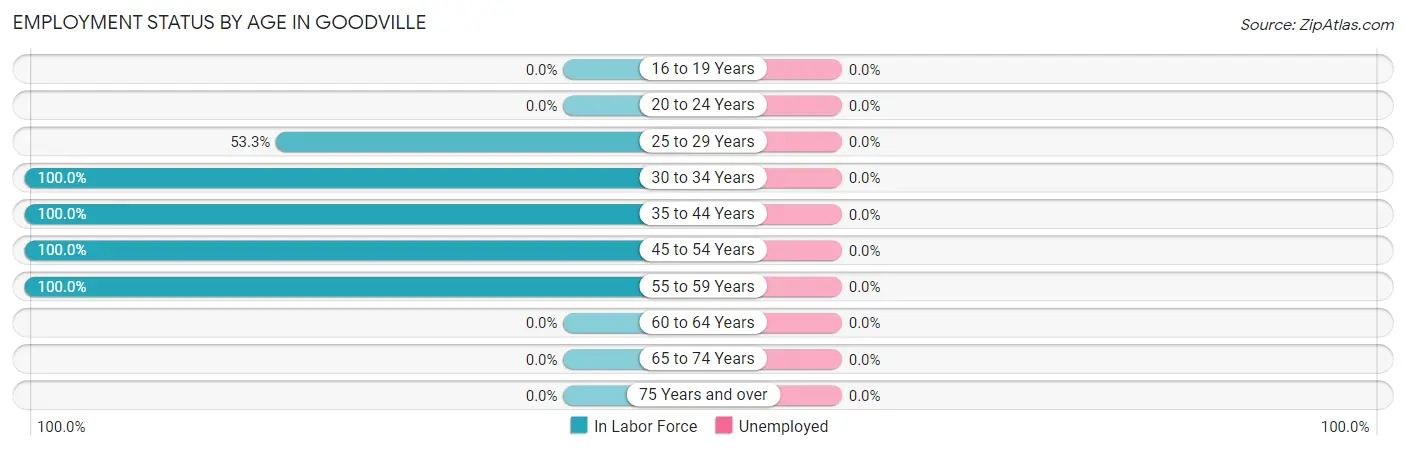
| Age Bracket | In Labor Force | Unemployed |
| 16 to 19 Years | 0 (0.0%) | 0 (0.0%) |
| 20 to 24 Years | 0 (0.0%) | 0 (0.0%) |
| 25 to 29 Years | 8 (53.3%) | 0 (0.0%) |
| 30 to 34 Years | 15 (100.0%) | 0 (0.0%) |
| 35 to 44 Years | 75 (100.0%) | 0 (0.0%) |
| 45 to 54 Years | 26 (100.0%) | 0 (0.0%) |
| 55 to 59 Years | 26 (100.0%) | 0 (0.0%) |
| 60 to 64 Years | 0 (0.0%) | 0 (0.0%) |
| 65 to 74 Years | 0 (0.0%) | 0 (0.0%) |
| 75 Years and over | 0 (0.0%) | 0 (0.0%) |
| Total | 150 (87.2%) | 0 (0.0%) |
Employment Status by Educational Attainment in Goodville
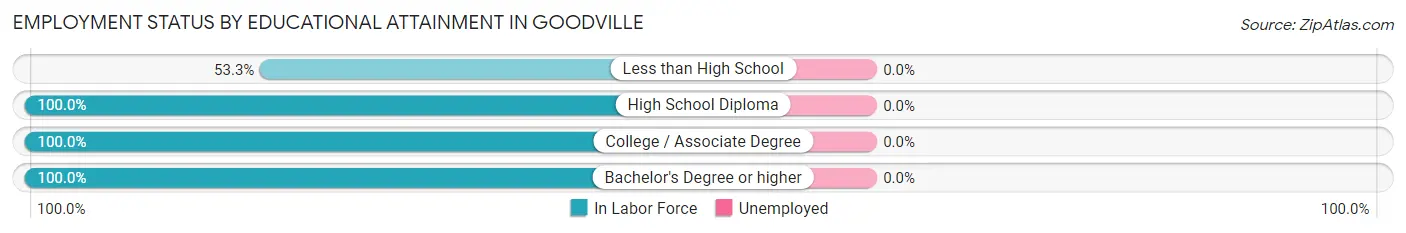
| Educational Attainment | In Labor Force | Unemployed |
| Less than High School | 8 (53.3%) | 0 (0.0%) |
| High School Diploma | 74 (100.0%) | 0 (0.0%) |
| College / Associate Degree | 16 (100.0%) | 0 (0.0%) |
| Bachelor's Degree or higher | 52 (100.0%) | 0 (0.0%) |
| Total | 150 (95.5%) | 0 (0.0%) |
Employment Occupations by Sex in Goodville
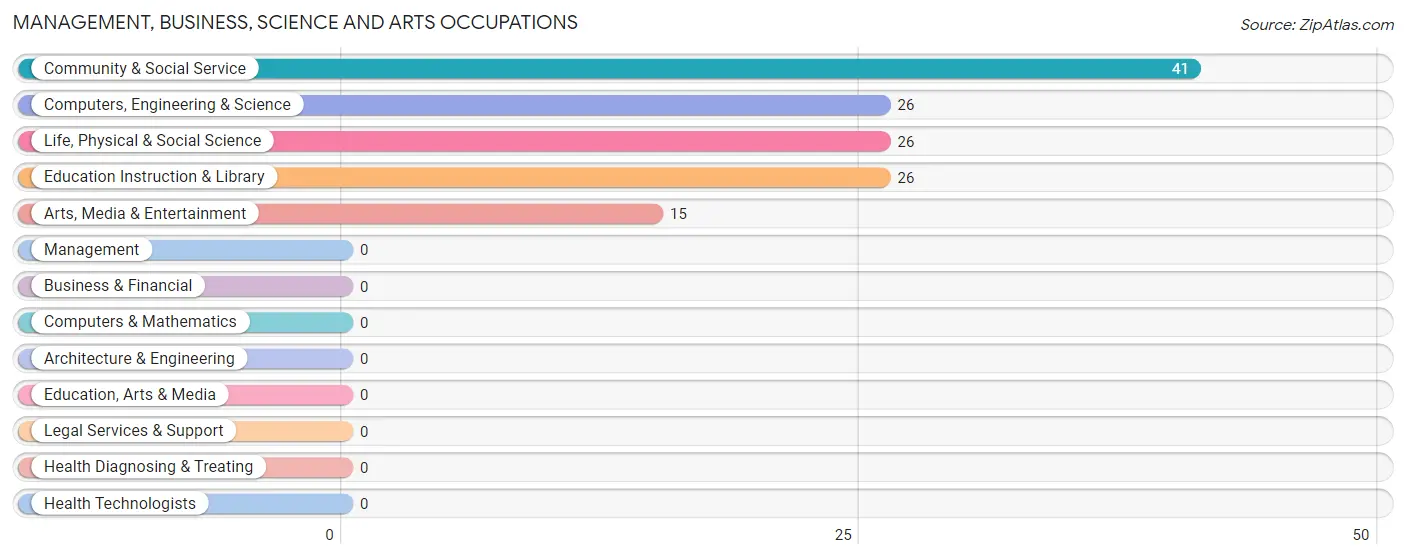
Management, Business, Science and Arts Occupations
The most common Management, Business, Science and Arts occupations in Goodville are Community & Social Service (41 | 27.3%), Computers, Engineering & Science (26 | 17.3%), Life, Physical & Social Science (26 | 17.3%), Education Instruction & Library (26 | 17.3%), and Arts, Media & Entertainment (15 | 10.0%).
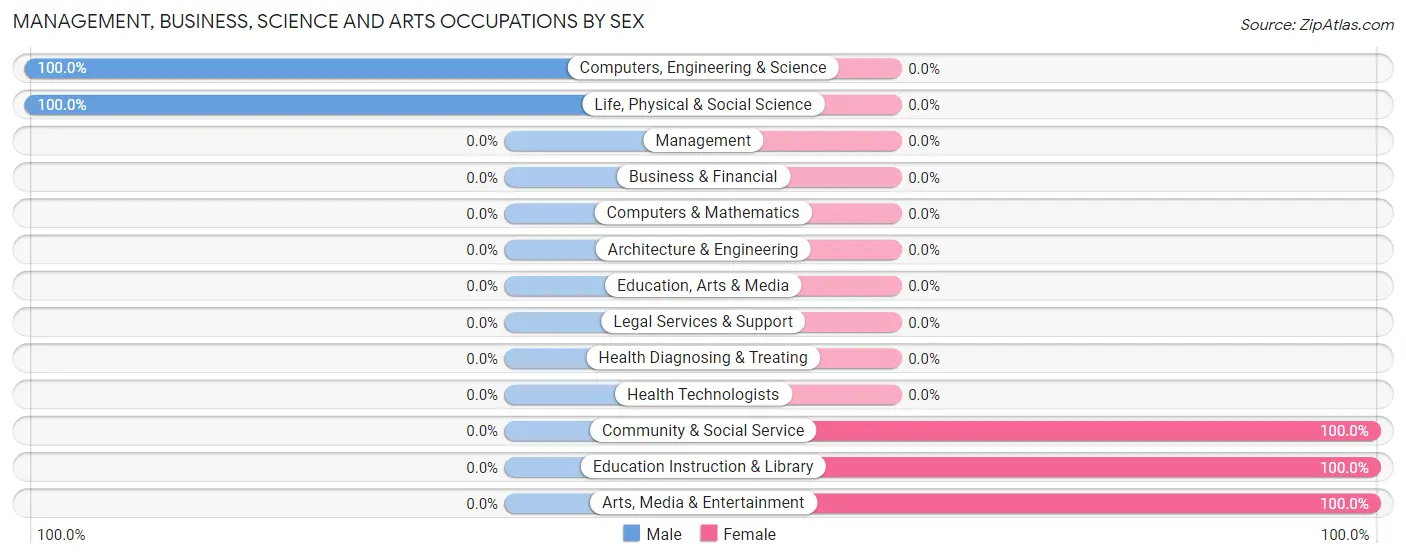
Management, Business, Science and Arts Occupations by Sex
Within the Management, Business, Science and Arts occupations in Goodville, the most male-oriented occupations are Computers, Engineering & Science (100.0%), and Life, Physical & Social Science (100.0%), while the most female-oriented occupations are Community & Social Service (100.0%), Education Instruction & Library (100.0%), and Arts, Media & Entertainment (100.0%).
| Occupation | Male | Female |
| Management | 0 (0.0%) | 0 (0.0%) |
| Business & Financial | 0 (0.0%) | 0 (0.0%) |
| Computers, Engineering & Science | 26 (100.0%) | 0 (0.0%) |
| Computers & Mathematics | 0 (0.0%) | 0 (0.0%) |
| Architecture & Engineering | 0 (0.0%) | 0 (0.0%) |
| Life, Physical & Social Science | 26 (100.0%) | 0 (0.0%) |
| Community & Social Service | 0 (0.0%) | 41 (100.0%) |
| Education, Arts & Media | 0 (0.0%) | 0 (0.0%) |
| Legal Services & Support | 0 (0.0%) | 0 (0.0%) |
| Education Instruction & Library | 0 (0.0%) | 26 (100.0%) |
| Arts, Media & Entertainment | 0 (0.0%) | 15 (100.0%) |
| Health Diagnosing & Treating | 0 (0.0%) | 0 (0.0%) |
| Health Technologists | 0 (0.0%) | 0 (0.0%) |
| Total (Category) | 26 (38.8%) | 41 (61.2%) |
| Total (Overall) | 48 (32.0%) | 102 (68.0%) |
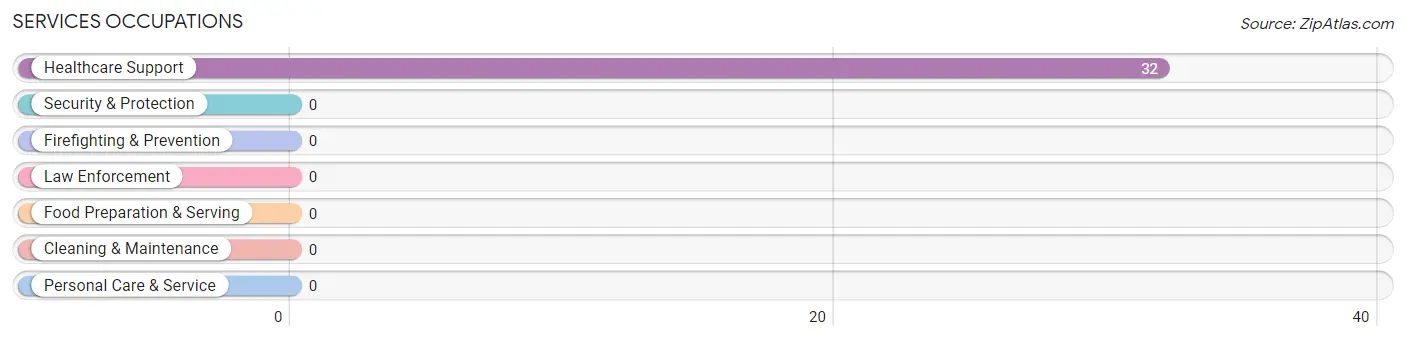
Services Occupations
The most common Services occupations in Goodville are , and Healthcare Support (32 | 21.3%).
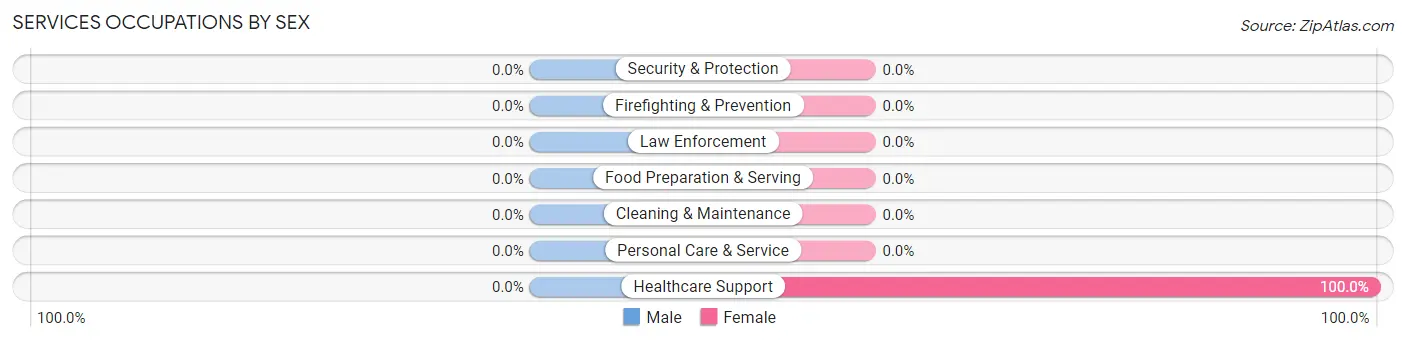
Services Occupations by Sex
| Occupation | Male | Female |
| Healthcare Support | 0 (0.0%) | 32 (100.0%) |
| Security & Protection | 0 (0.0%) | 0 (0.0%) |
| Firefighting & Prevention | 0 (0.0%) | 0 (0.0%) |
| Law Enforcement | 0 (0.0%) | 0 (0.0%) |
| Food Preparation & Serving | 0 (0.0%) | 0 (0.0%) |
| Cleaning & Maintenance | 0 (0.0%) | 0 (0.0%) |
| Personal Care & Service | 0 (0.0%) | 0 (0.0%) |
| Total (Category) | 0 (0.0%) | 32 (100.0%) |
| Total (Overall) | 48 (32.0%) | 102 (68.0%) |
Sales and Office Occupations
The most common Sales and Office occupations in Goodville are , and Office & Administration (16 | 10.7%).
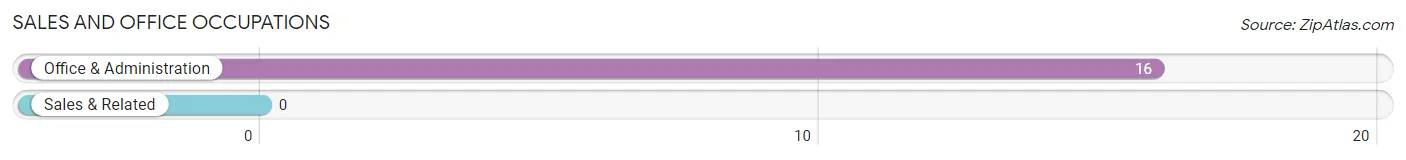
Sales and Office Occupations by Sex

| Occupation | Male | Female |
| Sales & Related | 0 (0.0%) | 0 (0.0%) |
| Office & Administration | 0 (0.0%) | 16 (100.0%) |
| Total (Category) | 0 (0.0%) | 16 (100.0%) |
| Total (Overall) | 48 (32.0%) | 102 (68.0%) |
Natural Resources, Construction and Maintenance Occupations
The most common Natural Resources, Construction and Maintenance occupations in Goodville are , and Construction & Extraction (14 | 9.3%).

Natural Resources, Construction and Maintenance Occupations by Sex
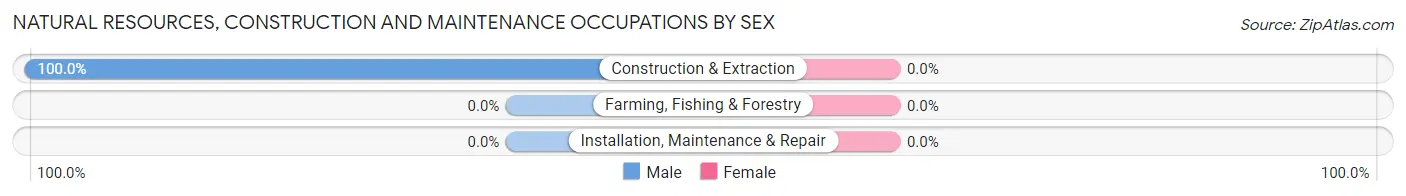
| Occupation | Male | Female |
| Farming, Fishing & Forestry | 0 (0.0%) | 0 (0.0%) |
| Construction & Extraction | 14 (100.0%) | 0 (0.0%) |
| Installation, Maintenance & Repair | 0 (0.0%) | 0 (0.0%) |
| Total (Category) | 14 (100.0%) | 0 (0.0%) |
| Total (Overall) | 48 (32.0%) | 102 (68.0%) |
Production, Transportation and Moving Occupations
The most common Production, Transportation and Moving occupations in Goodville are Production (13 | 8.7%), and Transportation (8 | 5.3%).
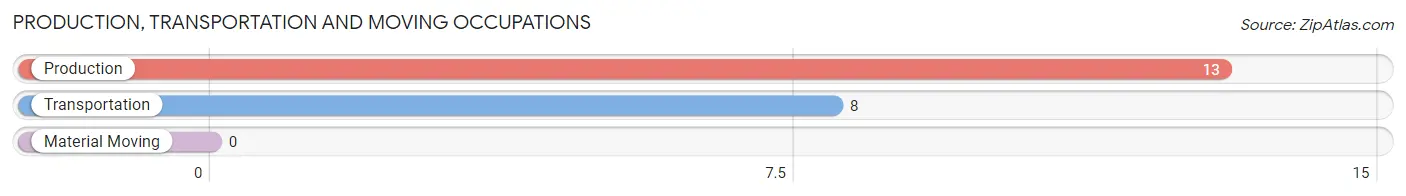
Production, Transportation and Moving Occupations by Sex
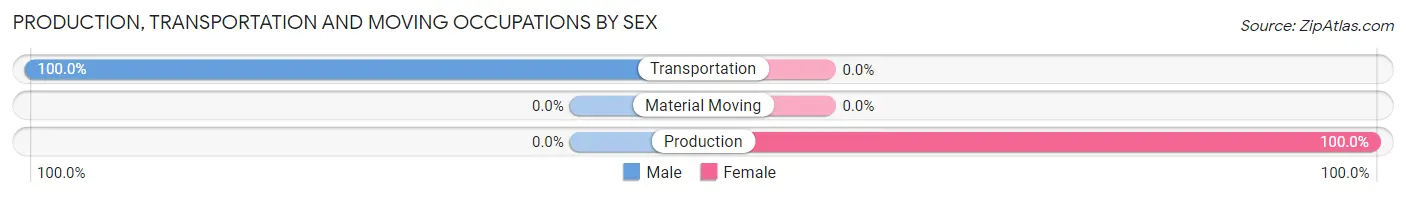
| Occupation | Male | Female |
| Production | 0 (0.0%) | 13 (100.0%) |
| Transportation | 8 (100.0%) | 0 (0.0%) |
| Material Moving | 0 (0.0%) | 0 (0.0%) |
| Total (Category) | 8 (38.1%) | 13 (61.9%) |
| Total (Overall) | 48 (32.0%) | 102 (68.0%) |
Employment Industries by Sex in Goodville
Employment Industries in Goodville
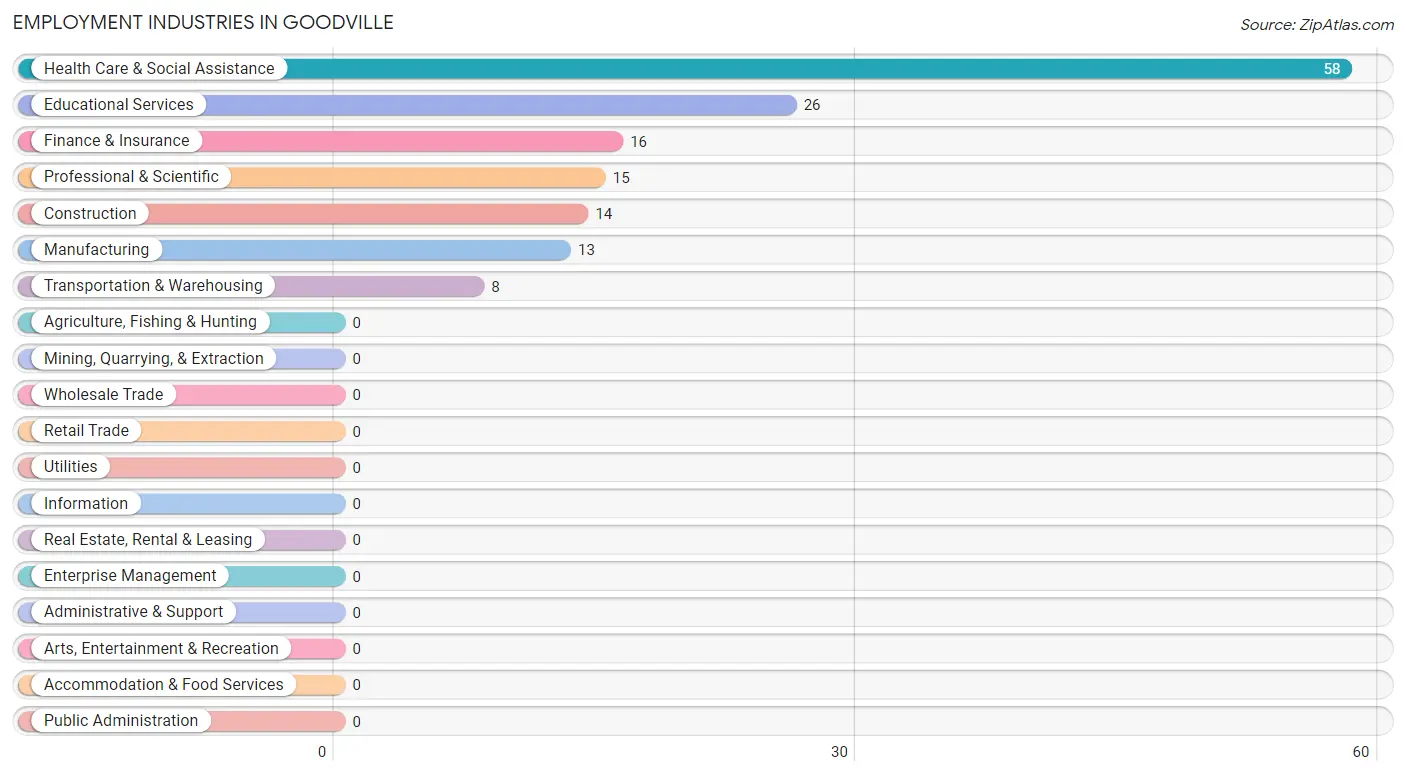
The major employment industries in Goodville include Health Care & Social Assistance (58 | 38.7%), Educational Services (26 | 17.3%), Finance & Insurance (16 | 10.7%), Professional & Scientific (15 | 10.0%), and Construction (14 | 9.3%).
Employment Industries by Sex in Goodville
The Goodville industries that see more men than women are Construction (100.0%), Transportation & Warehousing (100.0%), and Health Care & Social Assistance (44.8%), whereas the industries that tend to have a higher number of women are Manufacturing (100.0%), Finance & Insurance (100.0%), and Professional & Scientific (100.0%).
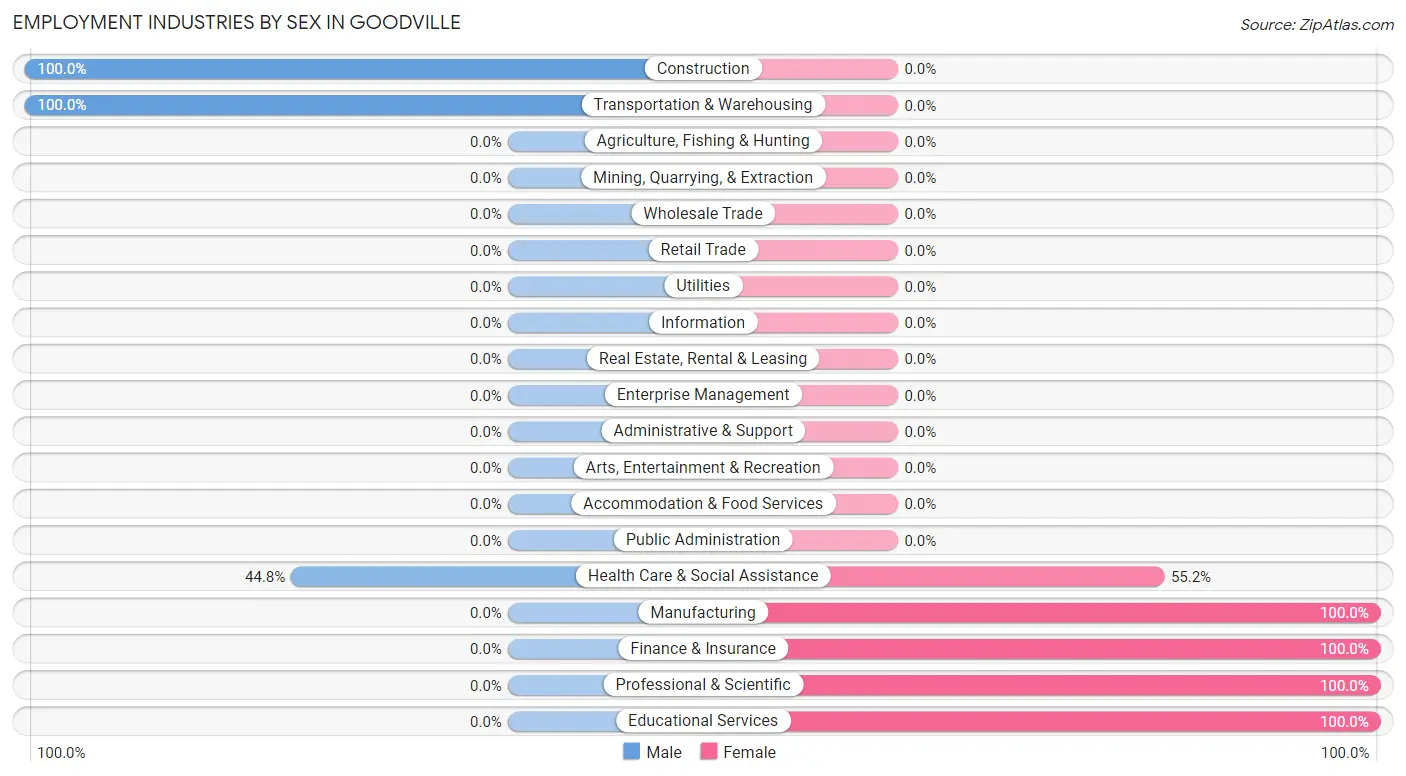
| Industry | Male | Female |
| Agriculture, Fishing & Hunting | 0 (0.0%) | 0 (0.0%) |
| Mining, Quarrying, & Extraction | 0 (0.0%) | 0 (0.0%) |
| Construction | 14 (100.0%) | 0 (0.0%) |
| Manufacturing | 0 (0.0%) | 13 (100.0%) |
| Wholesale Trade | 0 (0.0%) | 0 (0.0%) |
| Retail Trade | 0 (0.0%) | 0 (0.0%) |
| Transportation & Warehousing | 8 (100.0%) | 0 (0.0%) |
| Utilities | 0 (0.0%) | 0 (0.0%) |
| Information | 0 (0.0%) | 0 (0.0%) |
| Finance & Insurance | 0 (0.0%) | 16 (100.0%) |
| Real Estate, Rental & Leasing | 0 (0.0%) | 0 (0.0%) |
| Professional & Scientific | 0 (0.0%) | 15 (100.0%) |
| Enterprise Management | 0 (0.0%) | 0 (0.0%) |
| Administrative & Support | 0 (0.0%) | 0 (0.0%) |
| Educational Services | 0 (0.0%) | 26 (100.0%) |
| Health Care & Social Assistance | 26 (44.8%) | 32 (55.2%) |
| Arts, Entertainment & Recreation | 0 (0.0%) | 0 (0.0%) |
| Accommodation & Food Services | 0 (0.0%) | 0 (0.0%) |
| Public Administration | 0 (0.0%) | 0 (0.0%) |
| Total | 48 (32.0%) | 102 (68.0%) |
Education in Goodville
School Enrollment in Goodville
The most common levels of schooling among the 71 students in Goodville are kindergarten (39 | 54.9%), and middle school (32 | 45.1%).
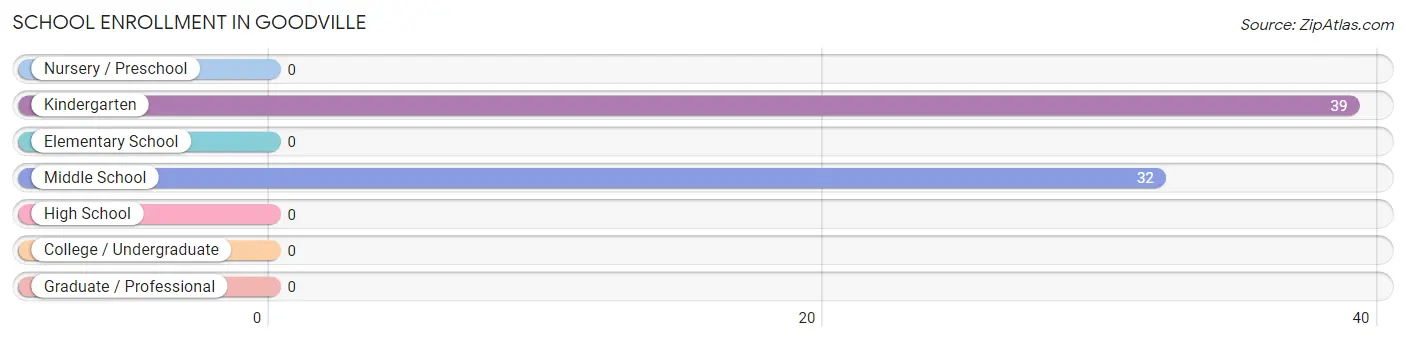
| School Level | # Students | % Students |
| Nursery / Preschool | 0 | 0.0% |
| Kindergarten | 39 | 54.9% |
| Elementary School | 0 | 0.0% |
| Middle School | 32 | 45.1% |
| High School | 0 | 0.0% |
| College / Undergraduate | 0 | 0.0% |
| Graduate / Professional | 0 | 0.0% |
| Total | 71 | 100.0% |
School Enrollment by Age by Funding Source in Goodville
Out of a total of 71 students who are enrolled in schools in Goodville, 39 (54.9%) attend a private institution, while the remaining 32 (45.1%) are enrolled in public schools. The age group of 5 to 9 year old has the highest likelihood of being enrolled in private schools, with 39 (100.0% in the age bracket) enrolled. Conversely, the age group of 10 to 14 year olds has the lowest likelihood of being enrolled in a private school, with 32 (100.0% in the age bracket) attending a public institution.
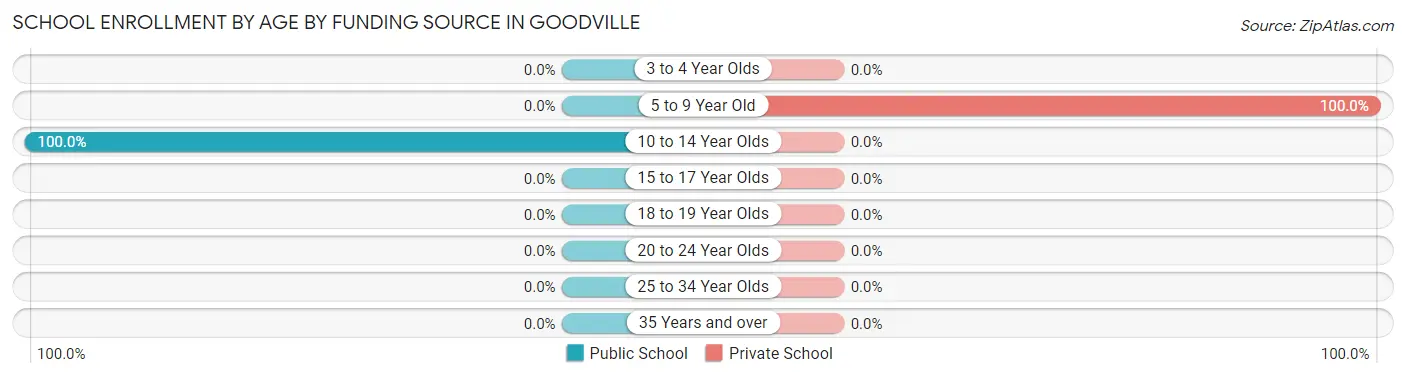
| Age Bracket | Public School | Private School |
| 3 to 4 Year Olds | 0 (0.0%) | 0 (0.0%) |
| 5 to 9 Year Old | 0 (0.0%) | 39 (100.0%) |
| 10 to 14 Year Olds | 32 (100.0%) | 0 (0.0%) |
| 15 to 17 Year Olds | 0 (0.0%) | 0 (0.0%) |
| 18 to 19 Year Olds | 0 (0.0%) | 0 (0.0%) |
| 20 to 24 Year Olds | 0 (0.0%) | 0 (0.0%) |
| 25 to 34 Year Olds | 0 (0.0%) | 0 (0.0%) |
| 35 Years and over | 0 (0.0%) | 0 (0.0%) |
| Total | 32 (45.1%) | 39 (54.9%) |
Educational Attainment by Field of Study in Goodville
Liberal arts & history (52 | 60.5%), literature & languages (26 | 30.2%), and science & technology (8 | 9.3%) are the most common fields of study among 86 individuals in Goodville who have obtained a bachelor's degree or higher.
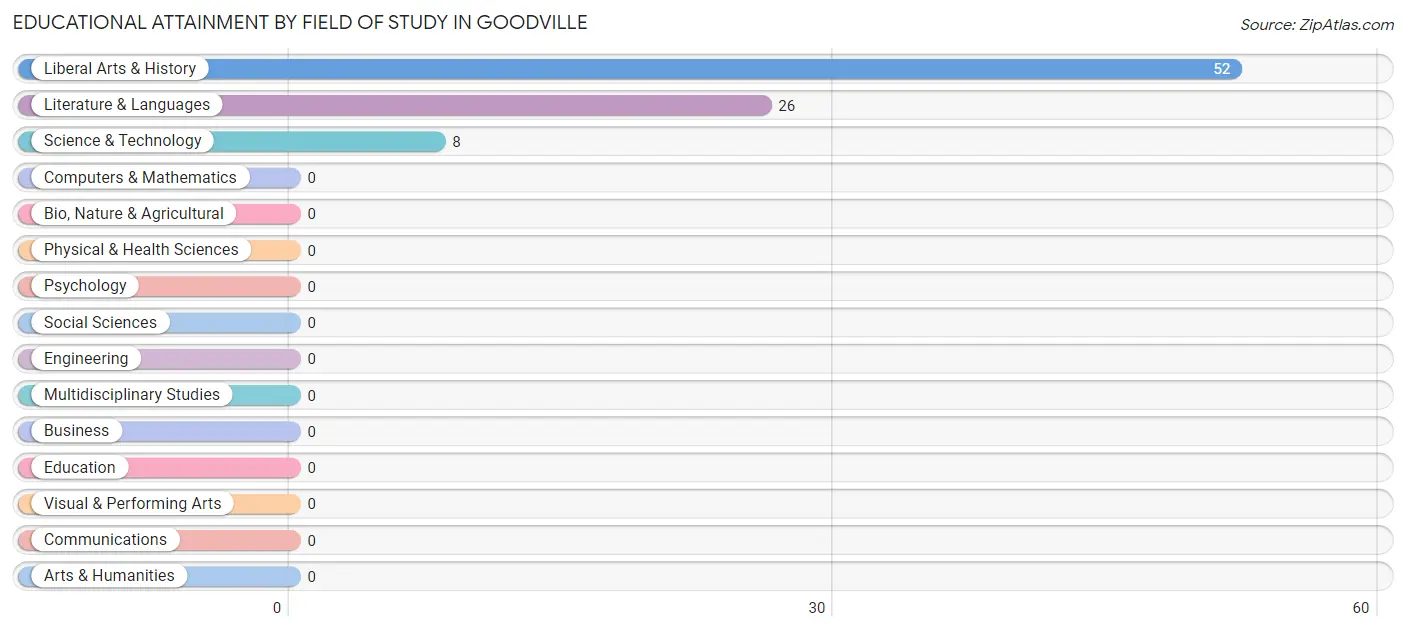
| Field of Study | # Graduates | % Graduates |
| Computers & Mathematics | 0 | 0.0% |
| Bio, Nature & Agricultural | 0 | 0.0% |
| Physical & Health Sciences | 0 | 0.0% |
| Psychology | 0 | 0.0% |
| Social Sciences | 0 | 0.0% |
| Engineering | 0 | 0.0% |
| Multidisciplinary Studies | 0 | 0.0% |
| Science & Technology | 8 | 9.3% |
| Business | 0 | 0.0% |
| Education | 0 | 0.0% |
| Literature & Languages | 26 | 30.2% |
| Liberal Arts & History | 52 | 60.5% |
| Visual & Performing Arts | 0 | 0.0% |
| Communications | 0 | 0.0% |
| Arts & Humanities | 0 | 0.0% |
| Total | 86 | 100.0% |
Transportation & Commute in Goodville
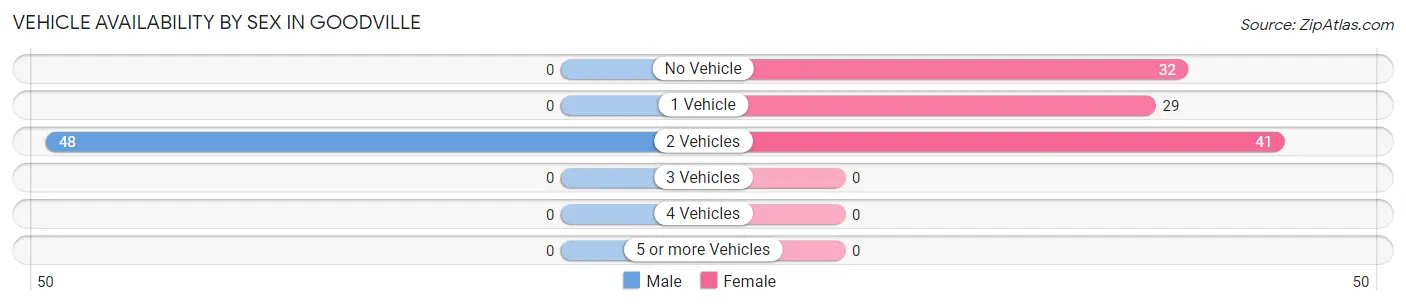
Vehicle Availability by Sex in Goodville
The most prevalent vehicle ownership categories in Goodville are males with 2 vehicles (48, accounting for 100.0%) and females with 2 vehicles (41, making up 47.1%).
| Vehicles Available | Male | Female |
| No Vehicle | 0 (0.0%) | 32 (31.4%) |
| 1 Vehicle | 0 (0.0%) | 29 (28.4%) |
| 2 Vehicles | 48 (100.0%) | 41 (40.2%) |
| 3 Vehicles | 0 (0.0%) | 0 (0.0%) |
| 4 Vehicles | 0 (0.0%) | 0 (0.0%) |
| 5 or more Vehicles | 0 (0.0%) | 0 (0.0%) |
| Total | 48 (100.0%) | 102 (100.0%) |
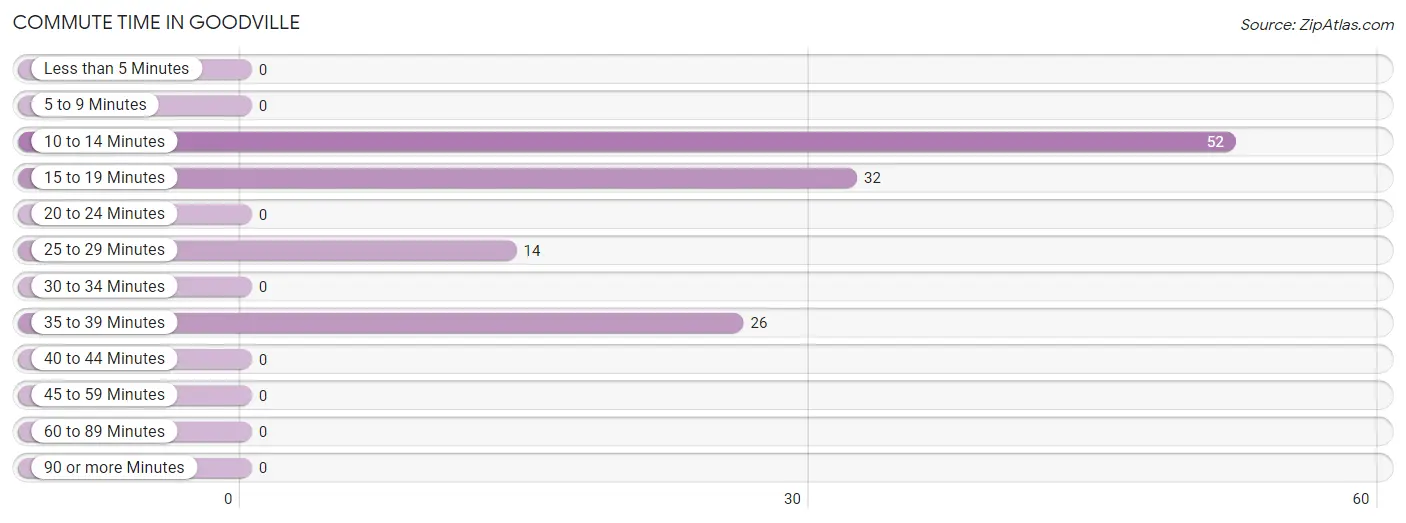
Commute Time in Goodville
The most frequently occuring commute durations in Goodville are 10 to 14 minutes (52 commuters, 41.9%), 15 to 19 minutes (32 commuters, 25.8%), and 35 to 39 minutes (26 commuters, 21.0%).
| Commute Time | # Commuters | % Commuters |
| Less than 5 Minutes | 0 | 0.0% |
| 5 to 9 Minutes | 0 | 0.0% |
| 10 to 14 Minutes | 52 | 41.9% |
| 15 to 19 Minutes | 32 | 25.8% |
| 20 to 24 Minutes | 0 | 0.0% |
| 25 to 29 Minutes | 14 | 11.3% |
| 30 to 34 Minutes | 0 | 0.0% |
| 35 to 39 Minutes | 26 | 21.0% |
| 40 to 44 Minutes | 0 | 0.0% |
| 45 to 59 Minutes | 0 | 0.0% |
| 60 to 89 Minutes | 0 | 0.0% |
| 90 or more Minutes | 0 | 0.0% |
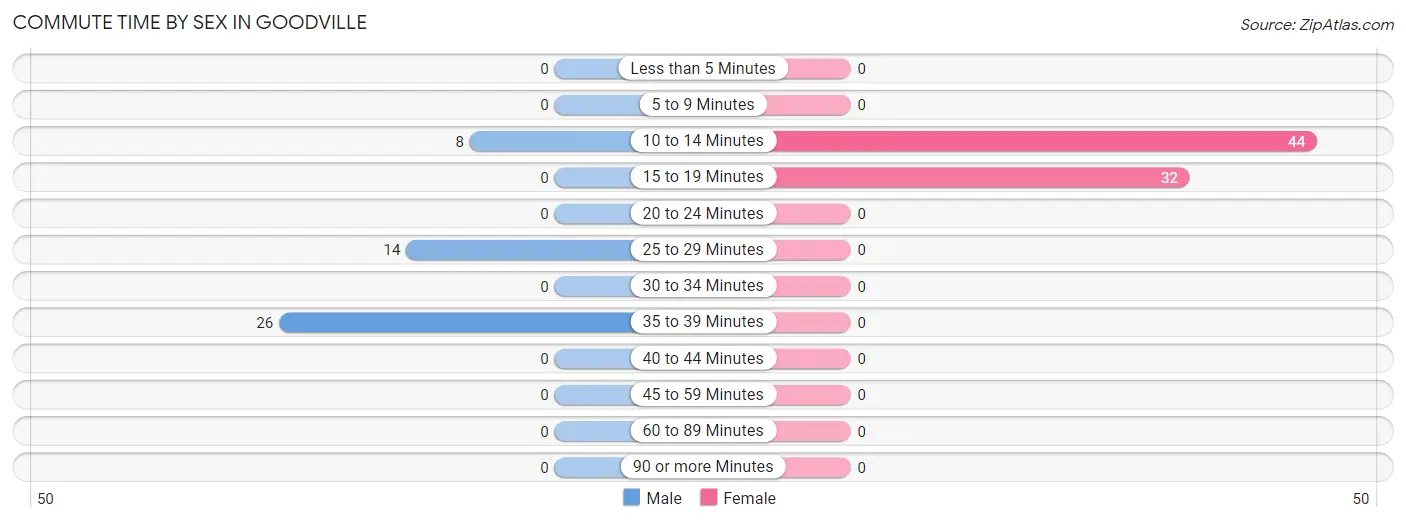
Commute Time by Sex in Goodville
The most common commute times in Goodville are 35 to 39 minutes (26 commuters, 54.2%) for males and 10 to 14 minutes (44 commuters, 57.9%) for females.
| Commute Time | Male | Female |
| Less than 5 Minutes | 0 (0.0%) | 0 (0.0%) |
| 5 to 9 Minutes | 0 (0.0%) | 0 (0.0%) |
| 10 to 14 Minutes | 8 (16.7%) | 44 (57.9%) |
| 15 to 19 Minutes | 0 (0.0%) | 32 (42.1%) |
| 20 to 24 Minutes | 0 (0.0%) | 0 (0.0%) |
| 25 to 29 Minutes | 14 (29.2%) | 0 (0.0%) |
| 30 to 34 Minutes | 0 (0.0%) | 0 (0.0%) |
| 35 to 39 Minutes | 26 (54.2%) | 0 (0.0%) |
| 40 to 44 Minutes | 0 (0.0%) | 0 (0.0%) |
| 45 to 59 Minutes | 0 (0.0%) | 0 (0.0%) |
| 60 to 89 Minutes | 0 (0.0%) | 0 (0.0%) |
| 90 or more Minutes | 0 (0.0%) | 0 (0.0%) |
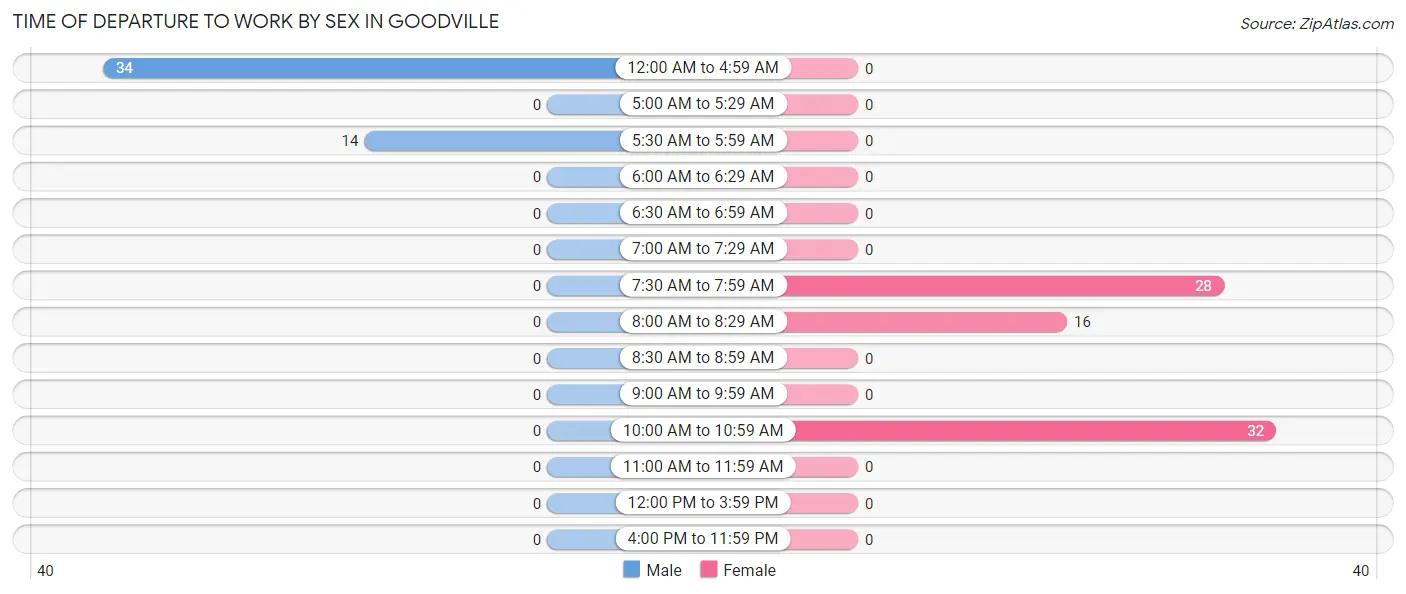
Time of Departure to Work by Sex in Goodville
The most frequent times of departure to work in Goodville are 12:00 AM to 4:59 AM (34, 70.8%) for males and 10:00 AM to 10:59 AM (32, 42.1%) for females.
| Time of Departure | Male | Female |
| 12:00 AM to 4:59 AM | 34 (70.8%) | 0 (0.0%) |
| 5:00 AM to 5:29 AM | 0 (0.0%) | 0 (0.0%) |
| 5:30 AM to 5:59 AM | 14 (29.2%) | 0 (0.0%) |
| 6:00 AM to 6:29 AM | 0 (0.0%) | 0 (0.0%) |
| 6:30 AM to 6:59 AM | 0 (0.0%) | 0 (0.0%) |
| 7:00 AM to 7:29 AM | 0 (0.0%) | 0 (0.0%) |
| 7:30 AM to 7:59 AM | 0 (0.0%) | 28 (36.8%) |
| 8:00 AM to 8:29 AM | 0 (0.0%) | 16 (21.0%) |
| 8:30 AM to 8:59 AM | 0 (0.0%) | 0 (0.0%) |
| 9:00 AM to 9:59 AM | 0 (0.0%) | 0 (0.0%) |
| 10:00 AM to 10:59 AM | 0 (0.0%) | 32 (42.1%) |
| 11:00 AM to 11:59 AM | 0 (0.0%) | 0 (0.0%) |
| 12:00 PM to 3:59 PM | 0 (0.0%) | 0 (0.0%) |
| 4:00 PM to 11:59 PM | 0 (0.0%) | 0 (0.0%) |
| Total | 48 (100.0%) | 76 (100.0%) |
Housing Occupancy in Goodville
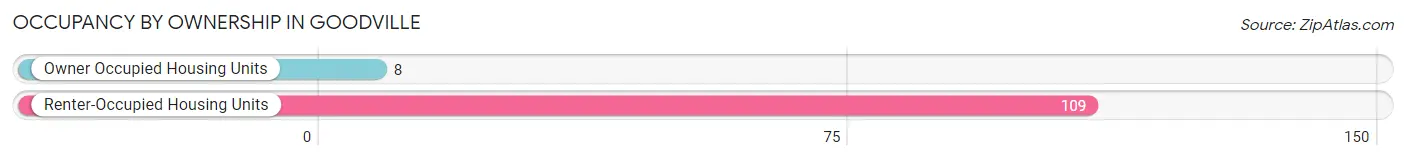
Occupancy by Ownership in Goodville
Of the total 117 dwellings in Goodville, owner-occupied units account for 8 (6.8%), while renter-occupied units make up 109 (93.2%).
| Occupancy | # Housing Units | % Housing Units |
| Owner Occupied Housing Units | 8 | 6.8% |
| Renter-Occupied Housing Units | 109 | 93.2% |
| Total Occupied Housing Units | 117 | 100.0% |
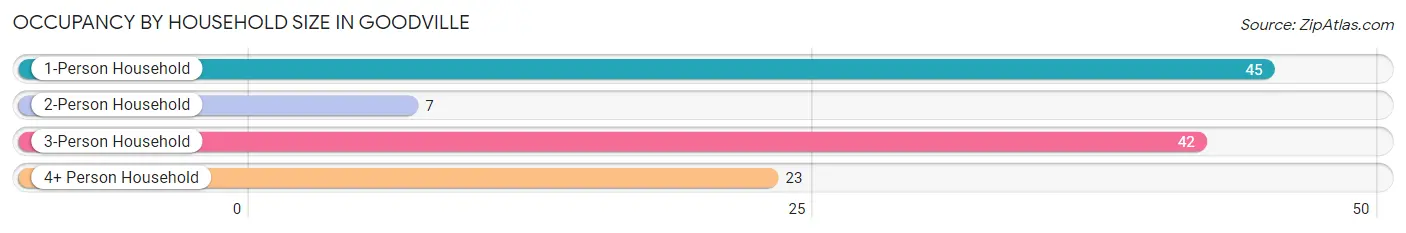
Occupancy by Household Size in Goodville
| Household Size | # Housing Units | % Housing Units |
| 1-Person Household | 45 | 38.5% |
| 2-Person Household | 7 | 6.0% |
| 3-Person Household | 42 | 35.9% |
| 4+ Person Household | 23 | 19.7% |
| Total Housing Units | 117 | 100.0% |
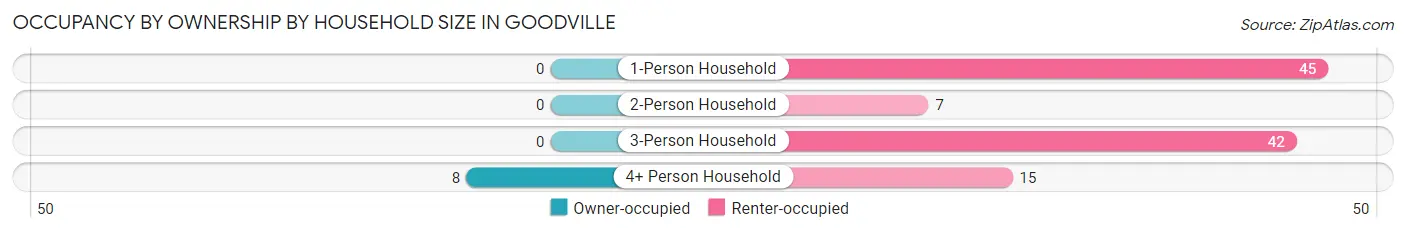
Occupancy by Ownership by Household Size in Goodville
| Household Size | Owner-occupied | Renter-occupied |
| 1-Person Household | 0 (0.0%) | 45 (100.0%) |
| 2-Person Household | 0 (0.0%) | 7 (100.0%) |
| 3-Person Household | 0 (0.0%) | 42 (100.0%) |
| 4+ Person Household | 8 (34.8%) | 15 (65.2%) |
| Total Housing Units | 8 (6.8%) | 109 (93.2%) |
Occupancy by Educational Attainment in Goodville
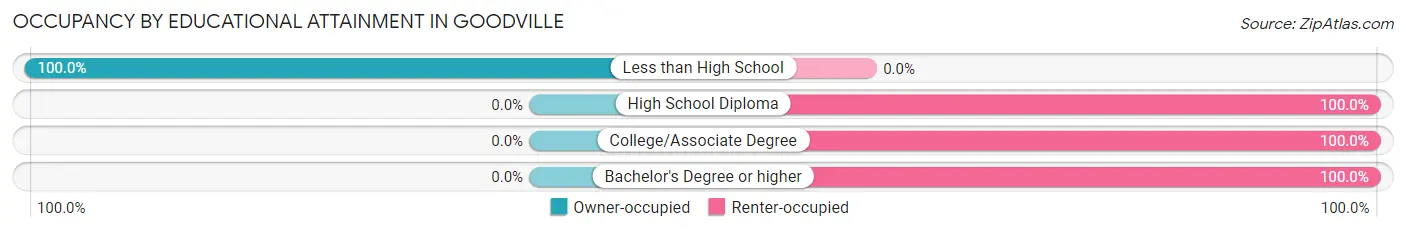
| Household Size | Owner-occupied | Renter-occupied |
| Less than High School | 8 (100.0%) | 0 (0.0%) |
| High School Diploma | 0 (0.0%) | 67 (100.0%) |
| College/Associate Degree | 0 (0.0%) | 16 (100.0%) |
| Bachelor's Degree or higher | 0 (0.0%) | 26 (100.0%) |
Occupancy by Age of Householder in Goodville
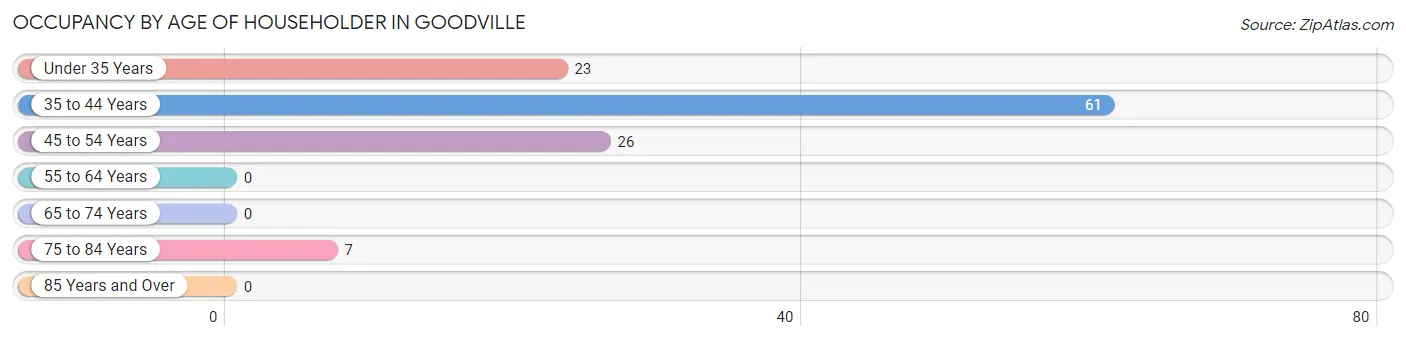
| Age Bracket | # Households | % Households |
| Under 35 Years | 23 | 19.7% |
| 35 to 44 Years | 61 | 52.1% |
| 45 to 54 Years | 26 | 22.2% |
| 55 to 64 Years | 0 | 0.0% |
| 65 to 74 Years | 0 | 0.0% |
| 75 to 84 Years | 7 | 6.0% |
| 85 Years and Over | 0 | 0.0% |
| Total | 117 | 100.0% |
Housing Finances in Goodville
Median Income by Occupancy in Goodville
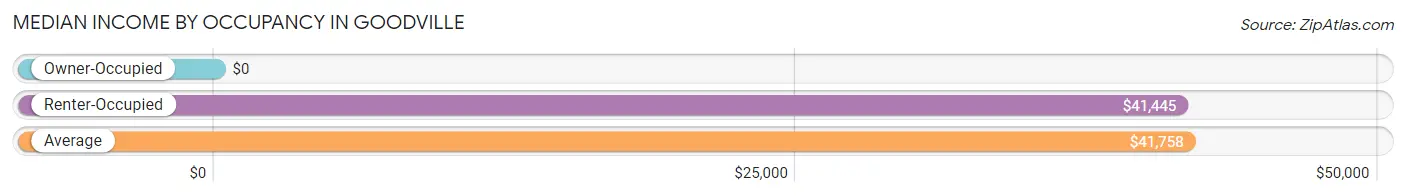
| Occupancy Type | # Households | Median Income |
| Owner-Occupied | 8 (6.8%) | $0 |
| Renter-Occupied | 109 (93.2%) | $41,445 |
| Average | 117 (100.0%) | $41,758 |
Occupancy by Householder Income Bracket in Goodville
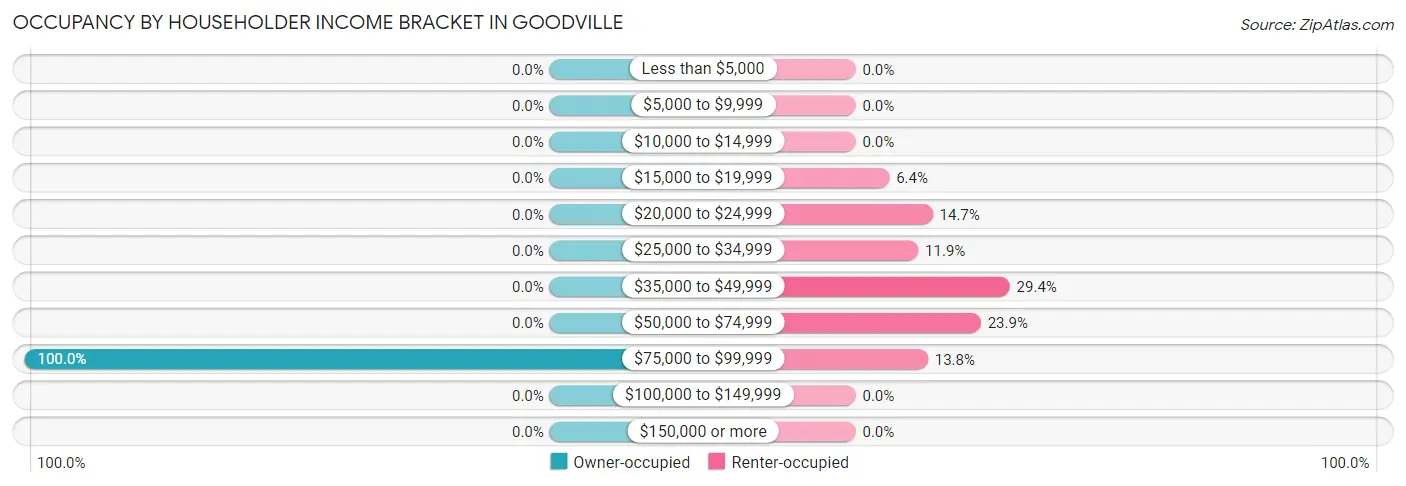
| Income Bracket | Owner-occupied | Renter-occupied |
| Less than $5,000 | 0 (0.0%) | 0 (0.0%) |
| $5,000 to $9,999 | 0 (0.0%) | 0 (0.0%) |
| $10,000 to $14,999 | 0 (0.0%) | 0 (0.0%) |
| $15,000 to $19,999 | 0 (0.0%) | 7 (6.4%) |
| $20,000 to $24,999 | 0 (0.0%) | 16 (14.7%) |
| $25,000 to $34,999 | 0 (0.0%) | 13 (11.9%) |
| $35,000 to $49,999 | 0 (0.0%) | 32 (29.4%) |
| $50,000 to $74,999 | 0 (0.0%) | 26 (23.8%) |
| $75,000 to $99,999 | 8 (100.0%) | 15 (13.8%) |
| $100,000 to $149,999 | 0 (0.0%) | 0 (0.0%) |
| $150,000 or more | 0 (0.0%) | 0 (0.0%) |
| Total | 8 (100.0%) | 109 (100.0%) |
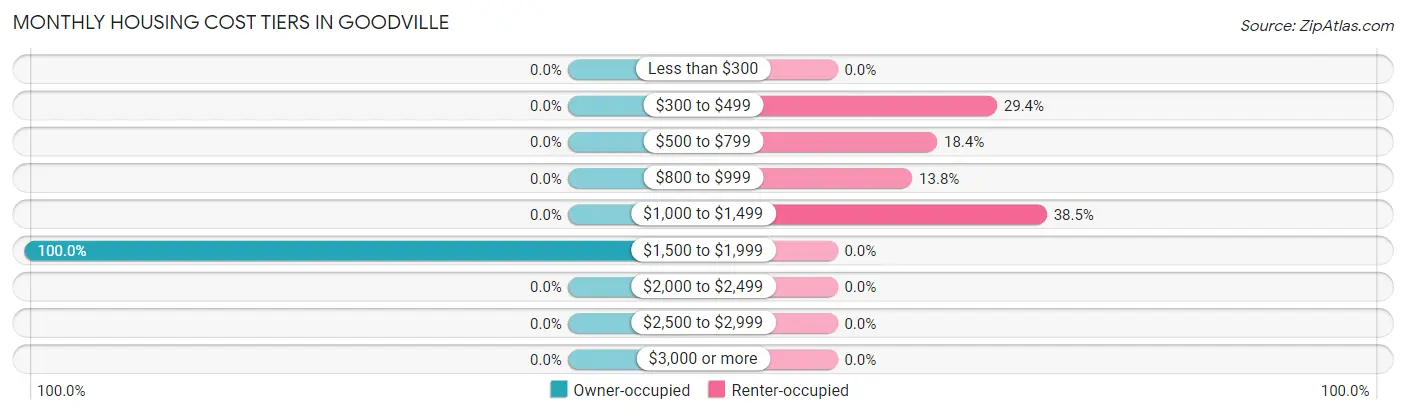
Monthly Housing Cost Tiers in Goodville
| Monthly Cost | Owner-occupied | Renter-occupied |
| Less than $300 | 0 (0.0%) | 0 (0.0%) |
| $300 to $499 | 0 (0.0%) | 32 (29.4%) |
| $500 to $799 | 0 (0.0%) | 20 (18.3%) |
| $800 to $999 | 0 (0.0%) | 15 (13.8%) |
| $1,000 to $1,499 | 0 (0.0%) | 42 (38.5%) |
| $1,500 to $1,999 | 8 (100.0%) | 0 (0.0%) |
| $2,000 to $2,499 | 0 (0.0%) | 0 (0.0%) |
| $2,500 to $2,999 | 0 (0.0%) | 0 (0.0%) |
| $3,000 or more | 0 (0.0%) | 0 (0.0%) |
| Total | 8 (100.0%) | 109 (100.0%) |
Physical Housing Characteristics in Goodville
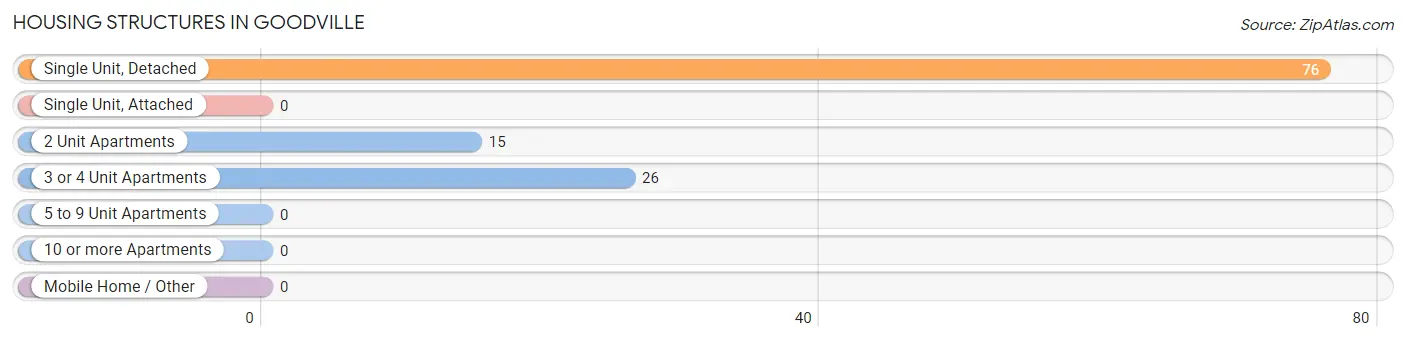
Housing Structures in Goodville
| Structure Type | # Housing Units | % Housing Units |
| Single Unit, Detached | 76 | 65.0% |
| Single Unit, Attached | 0 | 0.0% |
| 2 Unit Apartments | 15 | 12.8% |
| 3 or 4 Unit Apartments | 26 | 22.2% |
| 5 to 9 Unit Apartments | 0 | 0.0% |
| 10 or more Apartments | 0 | 0.0% |
| Mobile Home / Other | 0 | 0.0% |
| Total | 117 | 100.0% |
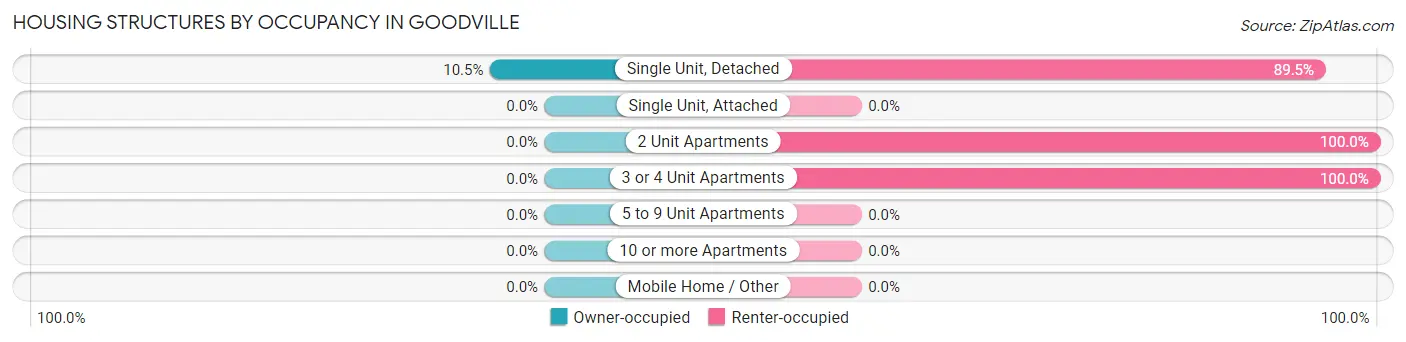
Housing Structures by Occupancy in Goodville
| Structure Type | Owner-occupied | Renter-occupied |
| Single Unit, Detached | 8 (10.5%) | 68 (89.5%) |
| Single Unit, Attached | 0 (0.0%) | 0 (0.0%) |
| 2 Unit Apartments | 0 (0.0%) | 15 (100.0%) |
| 3 or 4 Unit Apartments | 0 (0.0%) | 26 (100.0%) |
| 5 to 9 Unit Apartments | 0 (0.0%) | 0 (0.0%) |
| 10 or more Apartments | 0 (0.0%) | 0 (0.0%) |
| Mobile Home / Other | 0 (0.0%) | 0 (0.0%) |
| Total | 8 (6.8%) | 109 (93.2%) |
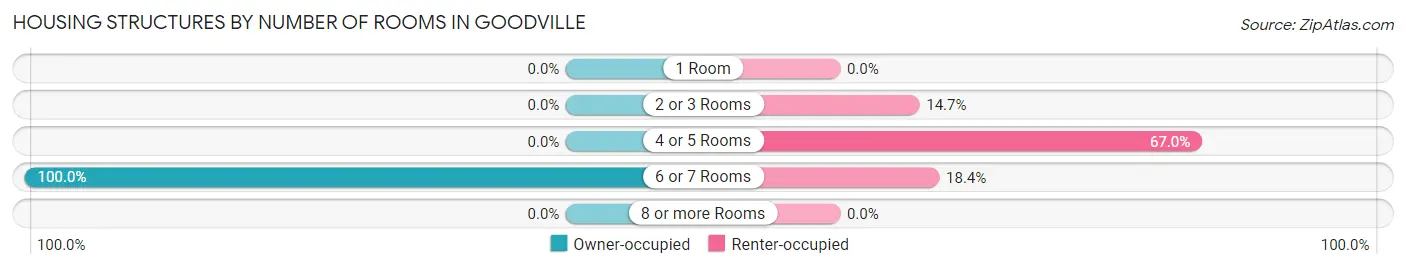
Housing Structures by Number of Rooms in Goodville
| Number of Rooms | Owner-occupied | Renter-occupied |
| 1 Room | 0 (0.0%) | 0 (0.0%) |
| 2 or 3 Rooms | 0 (0.0%) | 16 (14.7%) |
| 4 or 5 Rooms | 0 (0.0%) | 73 (67.0%) |
| 6 or 7 Rooms | 8 (100.0%) | 20 (18.3%) |
| 8 or more Rooms | 0 (0.0%) | 0 (0.0%) |
| Total | 8 (100.0%) | 109 (100.0%) |
Housing Structure by Heating Type in Goodville
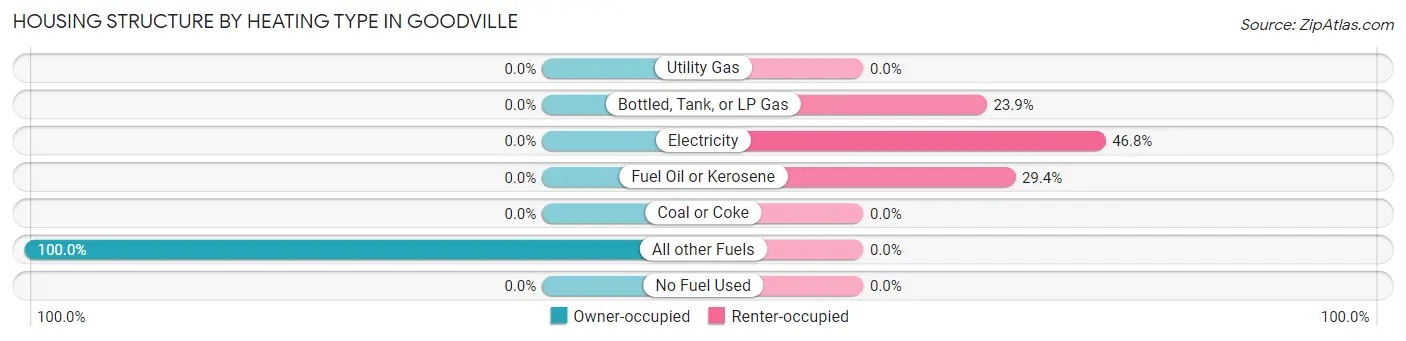
| Heating Type | Owner-occupied | Renter-occupied |
| Utility Gas | 0 (0.0%) | 0 (0.0%) |
| Bottled, Tank, or LP Gas | 0 (0.0%) | 26 (23.8%) |
| Electricity | 0 (0.0%) | 51 (46.8%) |
| Fuel Oil or Kerosene | 0 (0.0%) | 32 (29.4%) |
| Coal or Coke | 0 (0.0%) | 0 (0.0%) |
| All other Fuels | 8 (100.0%) | 0 (0.0%) |
| No Fuel Used | 0 (0.0%) | 0 (0.0%) |
| Total | 8 (100.0%) | 109 (100.0%) |
Household Vehicle Usage in Goodville
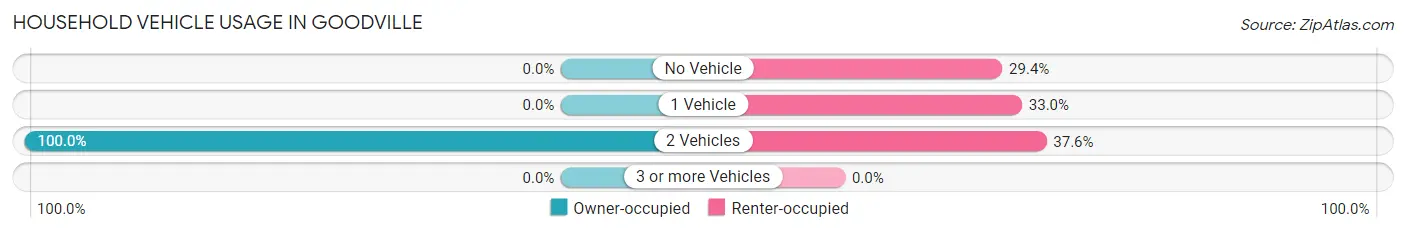
| Vehicles per Household | Owner-occupied | Renter-occupied |
| No Vehicle | 0 (0.0%) | 32 (29.4%) |
| 1 Vehicle | 0 (0.0%) | 36 (33.0%) |
| 2 Vehicles | 8 (100.0%) | 41 (37.6%) |
| 3 or more Vehicles | 0 (0.0%) | 0 (0.0%) |
| Total | 8 (100.0%) | 109 (100.0%) |
Real Estate & Mortgages in Goodville
Real Estate and Mortgage Overview in Goodville
| Characteristic | Without Mortgage | With Mortgage |
| Housing Units | 0 | 8 |
| Median Property Value | - | - |
| Median Household Income | - | - |
| Monthly Housing Costs | - | - |
| Real Estate Taxes | - | - |
Property Value by Mortgage Status in Goodville
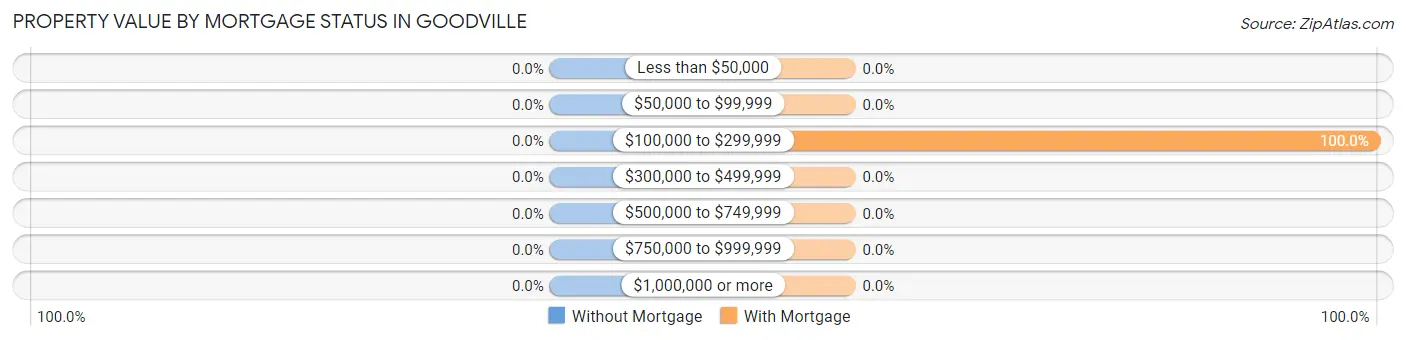
| Property Value | Without Mortgage | With Mortgage |
| Less than $50,000 | 0 (0.0%) | 0 (0.0%) |
| $50,000 to $99,999 | 0 (0.0%) | 0 (0.0%) |
| $100,000 to $299,999 | 0 (0.0%) | 8 (100.0%) |
| $300,000 to $499,999 | 0 (0.0%) | 0 (0.0%) |
| $500,000 to $749,999 | 0 (0.0%) | 0 (0.0%) |
| $750,000 to $999,999 | 0 (0.0%) | 0 (0.0%) |
| $1,000,000 or more | 0 (0.0%) | 0 (0.0%) |
| Total | 0 (0.0%) | 8 (100.0%) |
Household Income by Mortgage Status in Goodville

| Household Income | Without Mortgage | With Mortgage |
| Less than $10,000 | 0 (0.0%) | 0 (0.0%) |
| $10,000 to $24,999 | 0 (0.0%) | 0 (0.0%) |
| $25,000 to $34,999 | 0 (0.0%) | 0 (0.0%) |
| $35,000 to $49,999 | 0 (0.0%) | 0 (0.0%) |
| $50,000 to $74,999 | 0 (0.0%) | 0 (0.0%) |
| $75,000 to $99,999 | 0 (0.0%) | 0 (0.0%) |
| $100,000 to $149,999 | 0 (0.0%) | 8 (100.0%) |
| $150,000 or more | 0 (0.0%) | 0 (0.0%) |
| Total | 0 (0.0%) | 8 (100.0%) |
Property Value to Household Income Ratio in Goodville
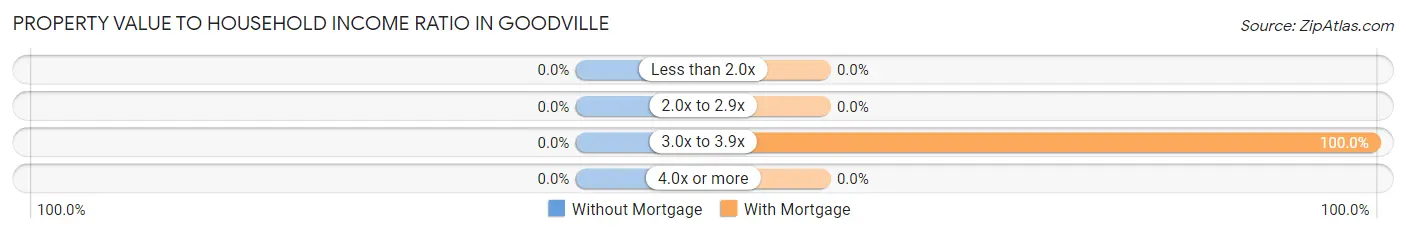
| Value-to-Income Ratio | Without Mortgage | With Mortgage |
| Less than 2.0x | 0 (0.0%) | 0 (0.0%) |
| 2.0x to 2.9x | 0 (0.0%) | 0 (0.0%) |
| 3.0x to 3.9x | 0 (0.0%) | 8 (100.0%) |
| 4.0x or more | 0 (0.0%) | 0 (0.0%) |
| Total | 0 (0.0%) | 8 (100.0%) |
Real Estate Taxes by Mortgage Status in Goodville
| Property Taxes | Without Mortgage | With Mortgage |
| Less than $800 | 0 (0.0%) | 0 (0.0%) |
| $800 to $1,499 | 0 (0.0%) | 0 (0.0%) |
| $800 to $1,499 | 0 (0.0%) | 0 (0.0%) |
| Total | 0 (0.0%) | 8 (100.0%) |
Health & Disability in Goodville
Health Insurance Coverage by Age in Goodville
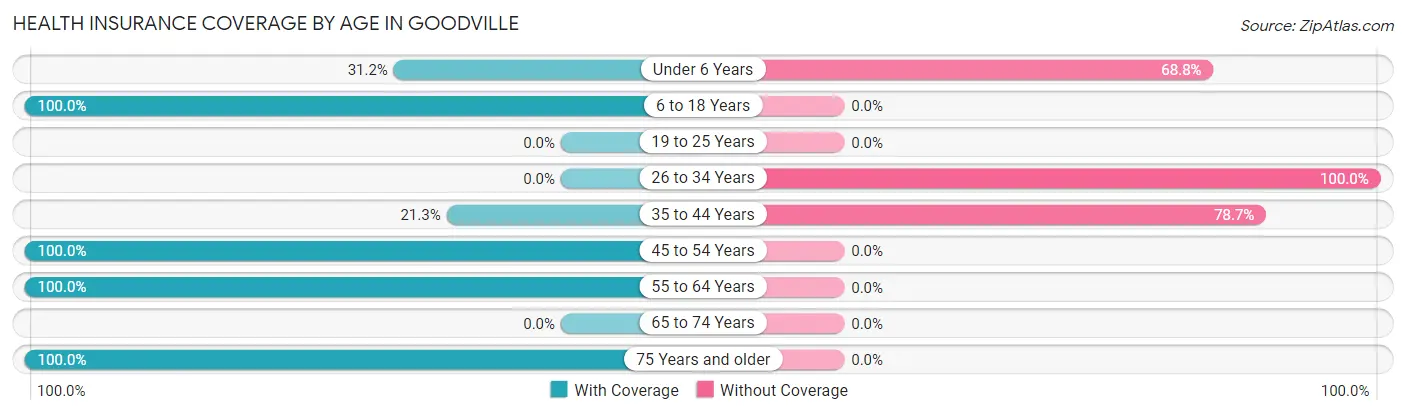
| Age Bracket | With Coverage | Without Coverage |
| Under 6 Years | 24 (31.2%) | 53 (68.8%) |
| 6 to 18 Years | 32 (100.0%) | 0 (0.0%) |
| 19 to 25 Years | 0 (0.0%) | 0 (0.0%) |
| 26 to 34 Years | 0 (0.0%) | 30 (100.0%) |
| 35 to 44 Years | 16 (21.3%) | 59 (78.7%) |
| 45 to 54 Years | 26 (100.0%) | 0 (0.0%) |
| 55 to 64 Years | 26 (100.0%) | 0 (0.0%) |
| 65 to 74 Years | 0 (0.0%) | 0 (0.0%) |
| 75 Years and older | 15 (100.0%) | 0 (0.0%) |
| Total | 139 (49.5%) | 142 (50.5%) |
Health Insurance Coverage by Citizenship Status in Goodville
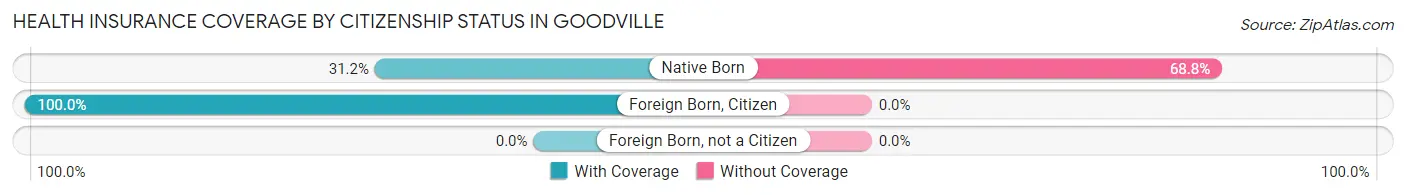
| Citizenship Status | With Coverage | Without Coverage |
| Native Born | 24 (31.2%) | 53 (68.8%) |
| Foreign Born, Citizen | 32 (100.0%) | 0 (0.0%) |
| Foreign Born, not a Citizen | 0 (0.0%) | 0 (0.0%) |
Health Insurance Coverage by Household Income in Goodville
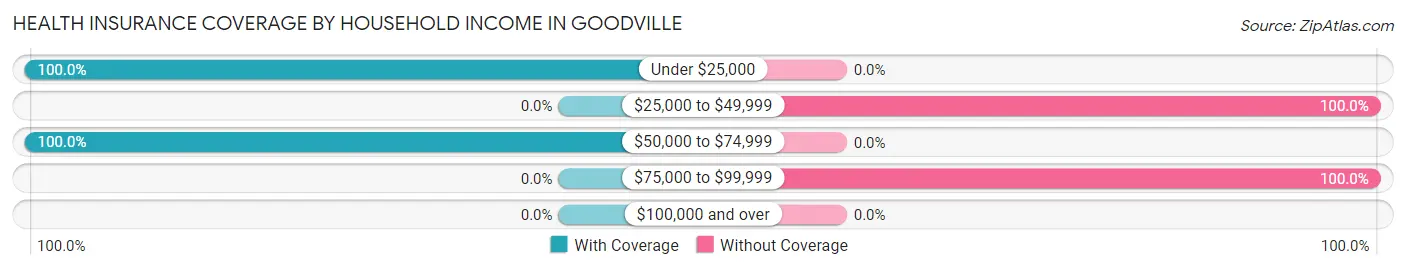
| Household Income | With Coverage | Without Coverage |
| Under $25,000 | 63 (100.0%) | 0 (0.0%) |
| $25,000 to $49,999 | 0 (0.0%) | 45 (100.0%) |
| $50,000 to $74,999 | 76 (100.0%) | 0 (0.0%) |
| $75,000 to $99,999 | 0 (0.0%) | 97 (100.0%) |
| $100,000 and over | 0 (0.0%) | 0 (0.0%) |
Public vs Private Health Insurance Coverage by Age in Goodville
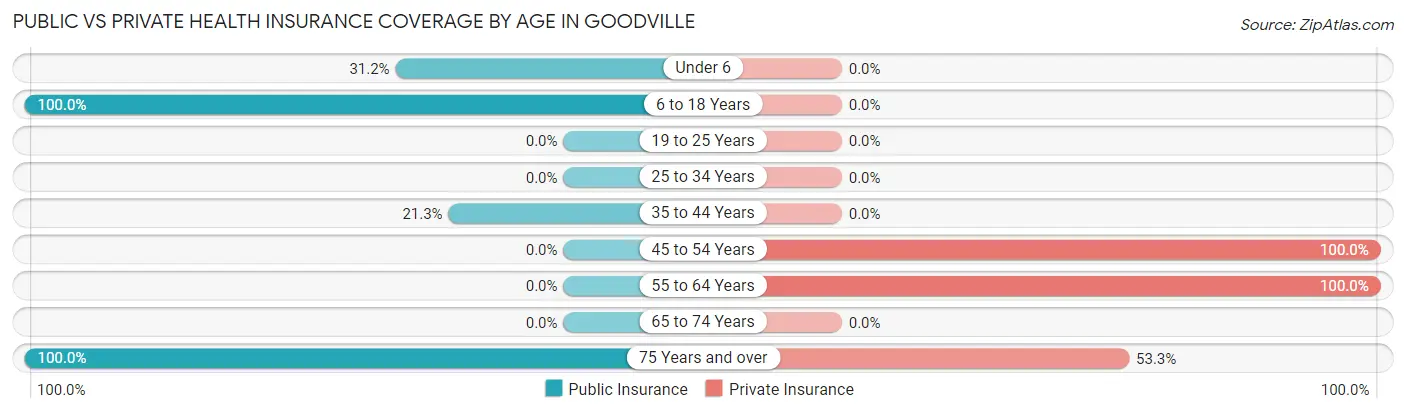
| Age Bracket | Public Insurance | Private Insurance |
| Under 6 | 24 (31.2%) | 0 (0.0%) |
| 6 to 18 Years | 32 (100.0%) | 0 (0.0%) |
| 19 to 25 Years | 0 (0.0%) | 0 (0.0%) |
| 25 to 34 Years | 0 (0.0%) | 0 (0.0%) |
| 35 to 44 Years | 16 (21.3%) | 0 (0.0%) |
| 45 to 54 Years | 0 (0.0%) | 26 (100.0%) |
| 55 to 64 Years | 0 (0.0%) | 26 (100.0%) |
| 65 to 74 Years | 0 (0.0%) | 0 (0.0%) |
| 75 Years and over | 15 (100.0%) | 8 (53.3%) |
| Total | 87 (31.0%) | 60 (21.3%) |
Disability Status by Sex by Age in Goodville
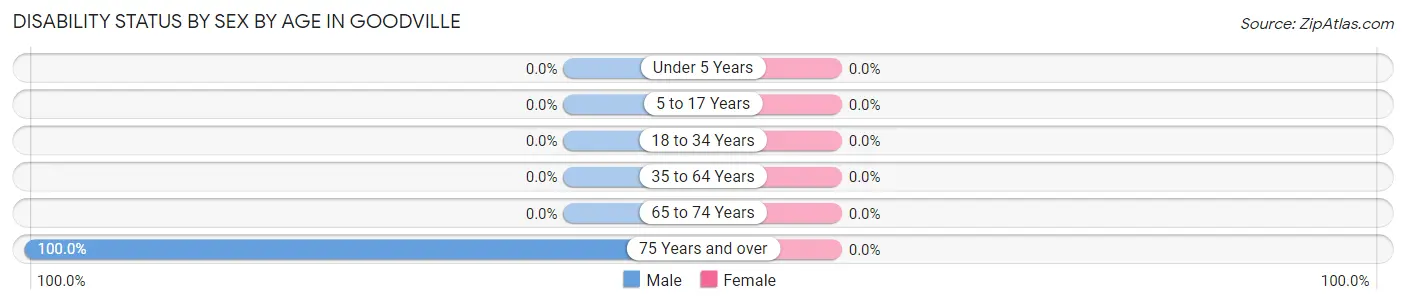
| Age Bracket | Male | Female |
| Under 5 Years | 0 (0.0%) | 0 (0.0%) |
| 5 to 17 Years | 0 (0.0%) | 0 (0.0%) |
| 18 to 34 Years | 0 (0.0%) | 0 (0.0%) |
| 35 to 64 Years | 0 (0.0%) | 0 (0.0%) |
| 65 to 74 Years | 0 (0.0%) | 0 (0.0%) |
| 75 Years and over | 7 (100.0%) | 0 (0.0%) |
Disability Class by Sex by Age in Goodville
Disability Class: Hearing Difficulty
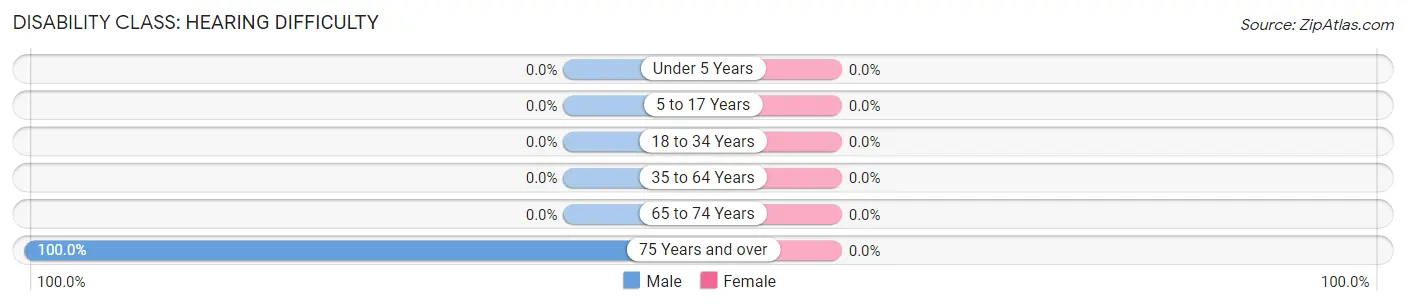
| Age Bracket | Male | Female |
| Under 5 Years | 0 (0.0%) | 0 (0.0%) |
| 5 to 17 Years | 0 (0.0%) | 0 (0.0%) |
| 18 to 34 Years | 0 (0.0%) | 0 (0.0%) |
| 35 to 64 Years | 0 (0.0%) | 0 (0.0%) |
| 65 to 74 Years | 0 (0.0%) | 0 (0.0%) |
| 75 Years and over | 7 (100.0%) | 0 (0.0%) |
Disability Class: Vision Difficulty
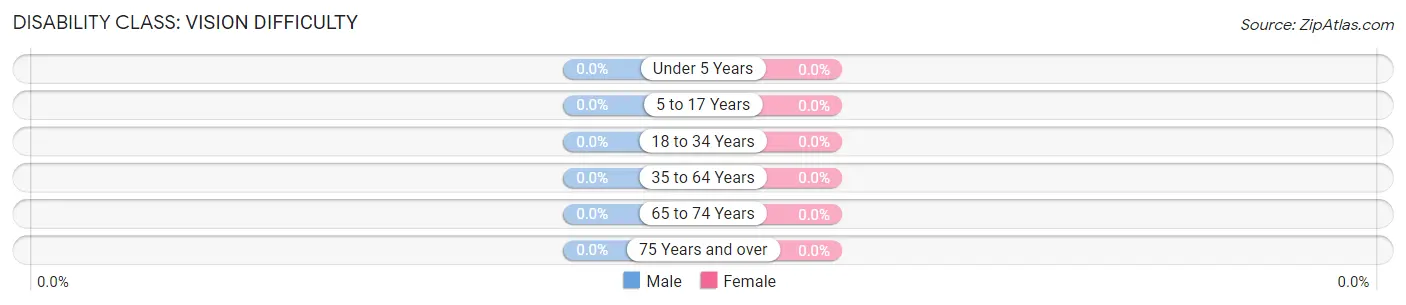
| Age Bracket | Male | Female |
| Under 5 Years | 0 (0.0%) | 0 (0.0%) |
| 5 to 17 Years | 0 (0.0%) | 0 (0.0%) |
| 18 to 34 Years | 0 (0.0%) | 0 (0.0%) |
| 35 to 64 Years | 0 (0.0%) | 0 (0.0%) |
| 65 to 74 Years | 0 (0.0%) | 0 (0.0%) |
| 75 Years and over | 0 (0.0%) | 0 (0.0%) |
Disability Class: Cognitive Difficulty
| Age Bracket | Male | Female |
| 5 to 17 Years | 0 (0.0%) | 0 (0.0%) |
| 18 to 34 Years | 0 (0.0%) | 0 (0.0%) |
| 35 to 64 Years | 0 (0.0%) | 0 (0.0%) |
| 65 to 74 Years | 0 (0.0%) | 0 (0.0%) |
| 75 Years and over | 0 (0.0%) | 0 (0.0%) |
Disability Class: Ambulatory Difficulty
| Age Bracket | Male | Female |
| 5 to 17 Years | 0 (0.0%) | 0 (0.0%) |
| 18 to 34 Years | 0 (0.0%) | 0 (0.0%) |
| 35 to 64 Years | 0 (0.0%) | 0 (0.0%) |
| 65 to 74 Years | 0 (0.0%) | 0 (0.0%) |
| 75 Years and over | 7 (100.0%) | 0 (0.0%) |
Disability Class: Self-Care Difficulty
| Age Bracket | Male | Female |
| 5 to 17 Years | 0 (0.0%) | 0 (0.0%) |
| 18 to 34 Years | 0 (0.0%) | 0 (0.0%) |
| 35 to 64 Years | 0 (0.0%) | 0 (0.0%) |
| 65 to 74 Years | 0 (0.0%) | 0 (0.0%) |
| 75 Years and over | 0 (0.0%) | 0 (0.0%) |
Technology Access in Goodville
Computing Device Access in Goodville
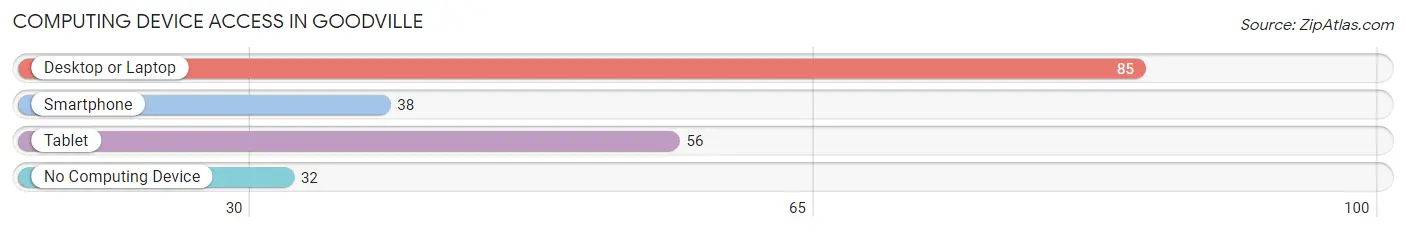
| Device Type | # Households | % Households |
| Desktop or Laptop | 85 | 72.7% |
| Smartphone | 38 | 32.5% |
| Tablet | 56 | 47.9% |
| No Computing Device | 32 | 27.4% |
| Total | 117 | 100.0% |
Internet Access in Goodville
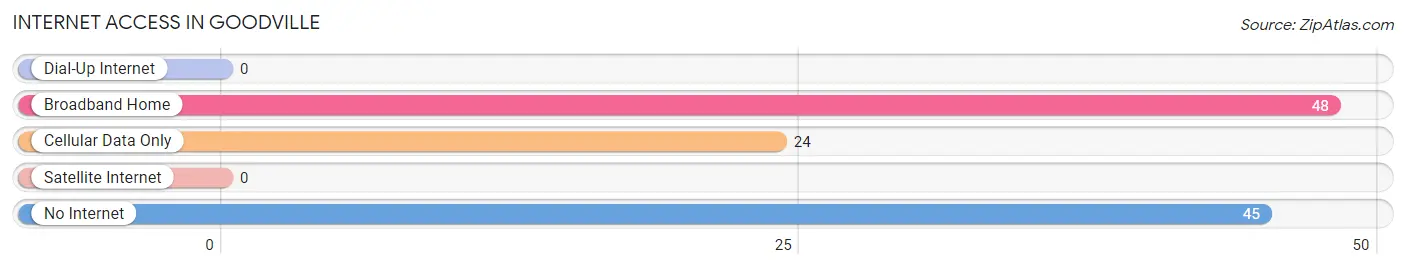
| Internet Type | # Households | % Households |
| Dial-Up Internet | 0 | 0.0% |
| Broadband Home | 48 | 41.0% |
| Cellular Data Only | 24 | 20.5% |
| Satellite Internet | 0 | 0.0% |
| No Internet | 45 | 38.5% |
| Total | 117 | 100.0% |
Goodville Summary
Goodville is a small borough located in Lancaster County, Pennsylvania. It is situated in the southeastern part of the county, about 10 miles east of the city of Lancaster. The population of Goodville was 1,093 at the 2010 census.
Geography
Goodville is located at 40°7'17" North, 76°14'45" West (40.1214, -76.2459). According to the United States Census Bureau, the borough has a total area of 0.3 square miles (0.8 km2), all of it land.
Goodville is located in the Conestoga Valley, a region of rolling hills and farmland. The borough is bordered by the townships of East Earl to the north, West Earl to the east, and East Lampeter to the south and west. The Conestoga River flows through the borough, and is a popular spot for fishing and canoeing.
History
Goodville was founded in 1790 by a group of Mennonite settlers from Germany. The settlers named the town after their leader, Jacob Good. The town was originally a farming community, and the Mennonites built a number of grist mills and sawmills along the Conestoga River.
In the late 19th century, Goodville began to grow as a center of commerce and industry. The town was home to a number of factories, including a cigar factory, a furniture factory, and a brickyard. The town also had a number of stores, including a general store, a hardware store, and a drug store.
In the early 20th century, Goodville was a popular tourist destination. The town was home to a number of resorts, including the Goodville Hotel, the Goodville Inn, and the Goodville House. The town also had a number of attractions, including a zoo, a swimming pool, and a roller coaster.
Economy
Goodville is a small, rural community with a limited economy. The town is home to a number of small businesses, including a grocery store, a hardware store, and a few restaurants. The town also has a number of small manufacturing businesses, including a furniture factory and a brickyard.
The town is also home to a number of farms, which produce a variety of crops, including corn, soybeans, and hay. The town is also home to a number of horse farms, which raise and train horses for show and racing.
Demographics
As of the 2010 census, Goodville had a population of 1,093. The racial makeup of the borough was 97.3% White, 0.7% African American, 0.2% Native American, 0.2% Asian, 0.2% from other races, and 1.4% from two or more races. Hispanic or Latino of any race were 1.2% of the population.
The median income for a household in Goodville was $45,000, and the median income for a family was $50,000. The per capita income for the borough was $20,000. About 8.3% of families and 10.2% of the population were below the poverty line, including 14.3% of those under age 18 and 5.3% of those age 65 or over.
Common Questions
What is Per Capita Income in Goodville?
Per Capita income in Goodville is $20,399.
What is the Median Family Income in Goodville?
Median Family Income in Goodville is $53,750.
What is the Median Household income in Goodville?
Median Household Income in Goodville is $41,758.
What is Inequality or Gini Index in Goodville?
Inequality or Gini Index in Goodville is 0.27.
What is the Total Population of Goodville?
Total Population of Goodville is 281.
What is the Total Male Population of Goodville?
Total Male Population of Goodville is 94.
What is the Total Female Population of Goodville?
Total Female Population of Goodville is 187.
What is the Ratio of Males per 100 Females in Goodville?
There are 50.27 Males per 100 Females in Goodville.
What is the Ratio of Females per 100 Males in Goodville?
There are 198.94 Females per 100 Males in Goodville.
What is the Median Population Age in Goodville?
Median Population Age in Goodville is 35.0 Years.
What is the Average Family Size in Goodville
Average Family Size in Goodville is 3.3 People.
What is the Average Household Size in Goodville
Average Household Size in Goodville is 2.4 People.
How Large is the Labor Force in Goodville?
There are 150 People in the Labor Forcein in Goodville.
What is the Percentage of People in the Labor Force in Goodville?
87.2% of People are in the Labor Force in Goodville.