Dorneyville, PA Map & Demographics
Dorneyville Map
Dorneyville Overview
$58,937
PER CAPITA INCOME
$124,338
AVG FAMILY INCOME
$121,250
AVG HOUSEHOLD INCOME
21.7%
WAGE / INCOME GAP [ % ]
78.3¢/ $1
WAGE / INCOME GAP [ $ ]
0.40
INEQUALITY / GINI INDEX
5,093
TOTAL POPULATION
2,847
MALE POPULATION
2,246
FEMALE POPULATION
126.76
MALES / 100 FEMALES
78.89
FEMALES / 100 MALES
47.0
MEDIAN AGE
2.9
AVG FAMILY SIZE
2.7
AVG HOUSEHOLD SIZE
2,580
LABOR FORCE [ PEOPLE ]
63.2%
PERCENT IN LABOR FORCE
6.4%
UNEMPLOYMENT RATE
Income in Dorneyville
Income Overview in Dorneyville
Per Capita Income in Dorneyville is $58,937, while median incomes of families and households are $124,338 and $121,250 respectively.
| Characteristic | Number | Measure |
| Per Capita Income | 5,093 | $58,937 |
| Median Family Income | 1,561 | $124,338 |
| Mean Family Income | 1,561 | $166,428 |
| Median Household Income | 1,895 | $121,250 |
| Mean Household Income | 1,895 | $151,976 |
| Income Deficit | 1,561 | $0 |
| Wage / Income Gap (%) | 5,093 | 21.66% |
| Wage / Income Gap ($) | 5,093 | 78.34¢ per $1 |
| Gini / Inequality Index | 5,093 | 0.40 |
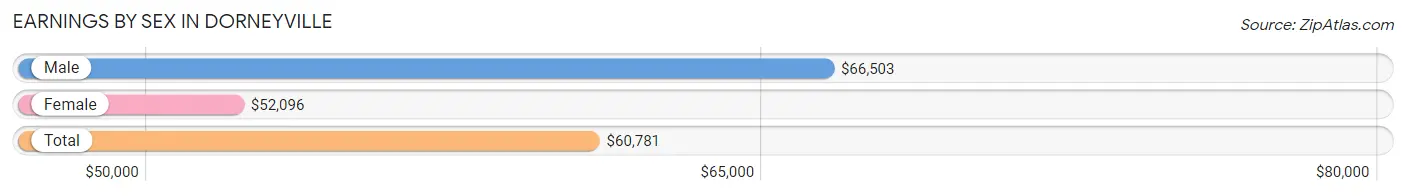
Earnings by Sex in Dorneyville
Average Earnings in Dorneyville are $60,781, $66,503 for men and $52,096 for women, a difference of 21.7%.
| Sex | Number | Average Earnings |
| Male | 1,733 (62.4%) | $66,503 |
| Female | 1,043 (37.6%) | $52,096 |
| Total | 2,776 (100.0%) | $60,781 |
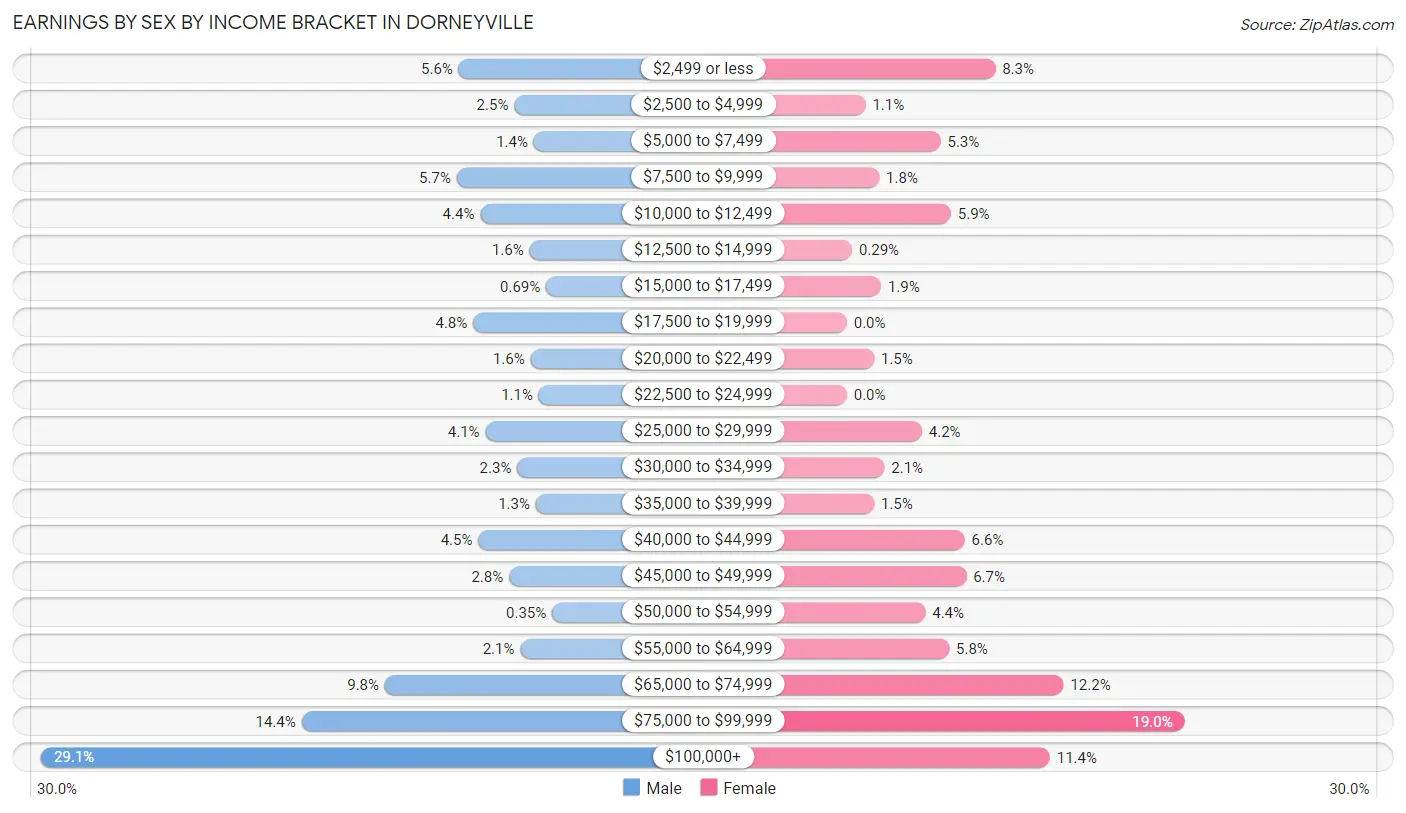
Earnings by Sex by Income Bracket in Dorneyville
The most common earnings brackets in Dorneyville are $100,000+ for men (504 | 29.1%) and $75,000 to $99,999 for women (198 | 19.0%).
| Income | Male | Female |
| $2,499 or less | 97 (5.6%) | 87 (8.3%) |
| $2,500 to $4,999 | 43 (2.5%) | 11 (1.1%) |
| $5,000 to $7,499 | 24 (1.4%) | 55 (5.3%) |
| $7,500 to $9,999 | 99 (5.7%) | 19 (1.8%) |
| $10,000 to $12,499 | 76 (4.4%) | 61 (5.9%) |
| $12,500 to $14,999 | 28 (1.6%) | 3 (0.3%) |
| $15,000 to $17,499 | 12 (0.7%) | 20 (1.9%) |
| $17,500 to $19,999 | 83 (4.8%) | 0 (0.0%) |
| $20,000 to $22,499 | 27 (1.6%) | 16 (1.5%) |
| $22,500 to $24,999 | 19 (1.1%) | 0 (0.0%) |
| $25,000 to $29,999 | 71 (4.1%) | 44 (4.2%) |
| $30,000 to $34,999 | 40 (2.3%) | 22 (2.1%) |
| $35,000 to $39,999 | 22 (1.3%) | 16 (1.5%) |
| $40,000 to $44,999 | 78 (4.5%) | 69 (6.6%) |
| $45,000 to $49,999 | 48 (2.8%) | 70 (6.7%) |
| $50,000 to $54,999 | 6 (0.4%) | 46 (4.4%) |
| $55,000 to $64,999 | 37 (2.1%) | 60 (5.8%) |
| $65,000 to $74,999 | 169 (9.8%) | 127 (12.2%) |
| $75,000 to $99,999 | 250 (14.4%) | 198 (19.0%) |
| $100,000+ | 504 (29.1%) | 119 (11.4%) |
| Total | 1,733 (100.0%) | 1,043 (100.0%) |
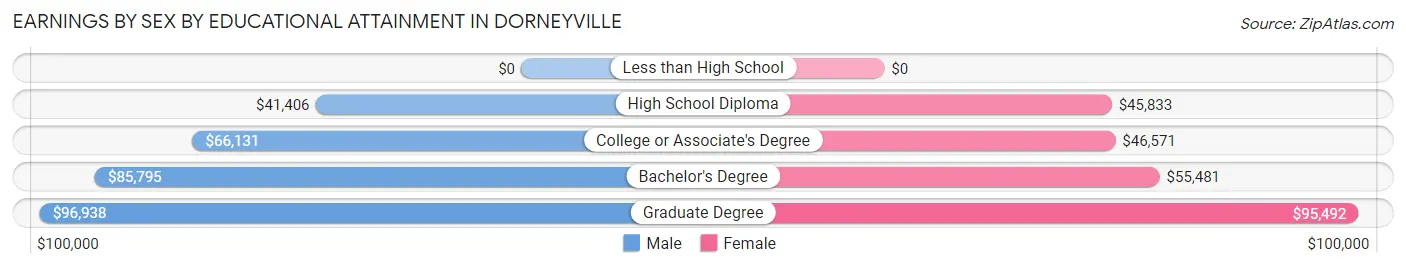
Earnings by Sex by Educational Attainment in Dorneyville
Average earnings in Dorneyville are $76,190 for men and $60,000 for women, a difference of 21.2%. Men with an educational attainment of graduate degree enjoy the highest average annual earnings of $96,938, while those with high school diploma education earn the least with $41,406. Women with an educational attainment of graduate degree earn the most with the average annual earnings of $95,492, while those with high school diploma education have the smallest earnings of $45,833.
| Educational Attainment | Male Income | Female Income |
| Less than High School | - | - |
| High School Diploma | $41,406 | $45,833 |
| College or Associate's Degree | $66,131 | $46,571 |
| Bachelor's Degree | $85,795 | $55,481 |
| Graduate Degree | $96,938 | $95,492 |
| Total | $76,190 | $60,000 |
Family Income in Dorneyville
Family Income Brackets in Dorneyville
According to the Dorneyville family income data, there are 379 families falling into the $100,000 to $149,999 income range, which is the most common income bracket and makes up 24.3% of all families.
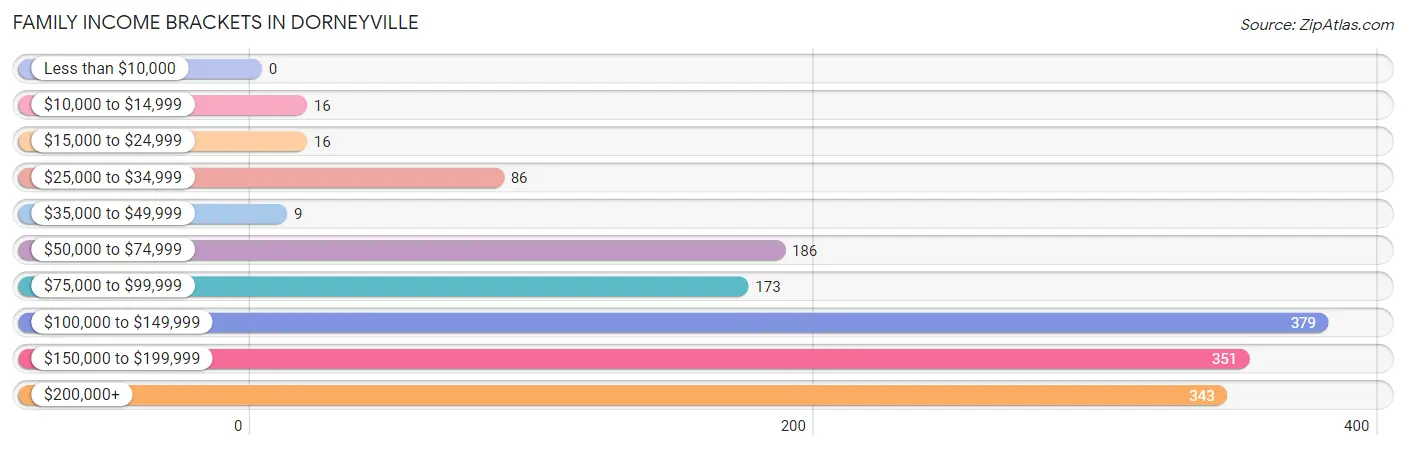
| Income Bracket | # Families | % Families |
| Less than $10,000 | 0 | 0.0% |
| $10,000 to $14,999 | 16 | 1.0% |
| $15,000 to $24,999 | 16 | 1.0% |
| $25,000 to $34,999 | 86 | 5.5% |
| $35,000 to $49,999 | 9 | 0.6% |
| $50,000 to $74,999 | 186 | 11.9% |
| $75,000 to $99,999 | 173 | 11.1% |
| $100,000 to $149,999 | 379 | 24.3% |
| $150,000 to $199,999 | 351 | 22.5% |
| $200,000+ | 343 | 22.0% |
Family Income by Famaliy Size in Dorneyville
5-person families (166 | 10.6%) account for the highest median family income in Dorneyville with $179,167 per family, while 2-person families (734 | 47.0%) have the highest median income of $54,166 per family member.
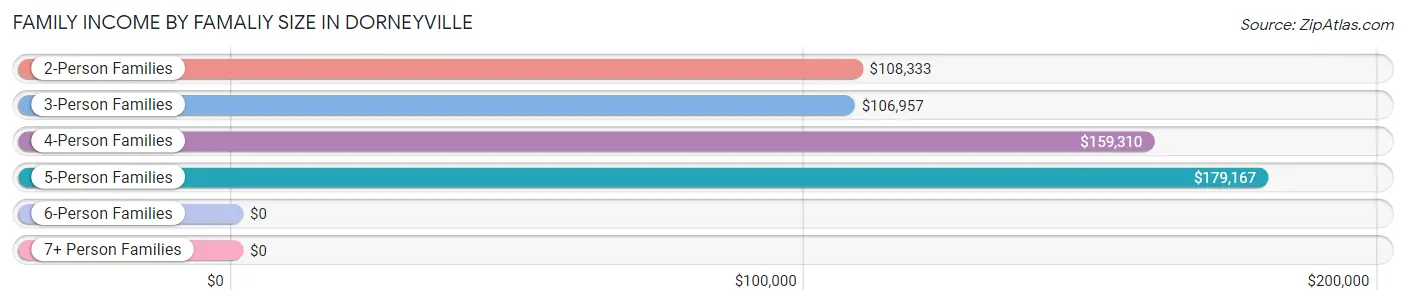
| Income Bracket | # Families | Median Income |
| 2-Person Families | 734 (47.0%) | $108,333 |
| 3-Person Families | 290 (18.6%) | $106,957 |
| 4-Person Families | 365 (23.4%) | $159,310 |
| 5-Person Families | 166 (10.6%) | $179,167 |
| 6-Person Families | 6 (0.4%) | $0 |
| 7+ Person Families | 0 (0.0%) | $0 |
| Total | 1,561 (100.0%) | $124,338 |
Family Income by Number of Earners in Dorneyville
The median family income in Dorneyville is $124,338, with families comprising 3+ earners (191) having the highest median family income of $160,938, while families with no earners (247) have the lowest median family income of $92,663, accounting for 12.2% and 15.8% of families, respectively.
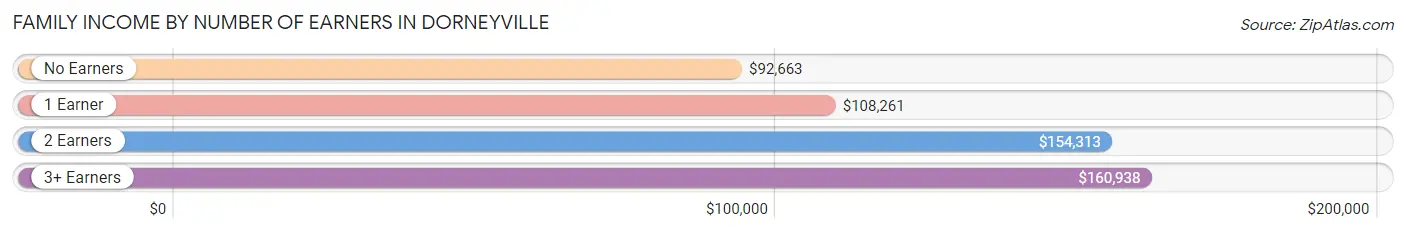
| Number of Earners | # Families | Median Income |
| No Earners | 247 (15.8%) | $92,663 |
| 1 Earner | 482 (30.9%) | $108,261 |
| 2 Earners | 641 (41.1%) | $154,313 |
| 3+ Earners | 191 (12.2%) | $160,938 |
| Total | 1,561 (100.0%) | $124,338 |
Household Income in Dorneyville
Household Income Brackets in Dorneyville
With 478 households falling in the category, the $100,000 to $149,999 income range is the most frequent in Dorneyville, accounting for 25.2% of all households. In contrast, only 15 households (0.8%) fall into the $15,000 to $24,999 income bracket, making it the least populous group.
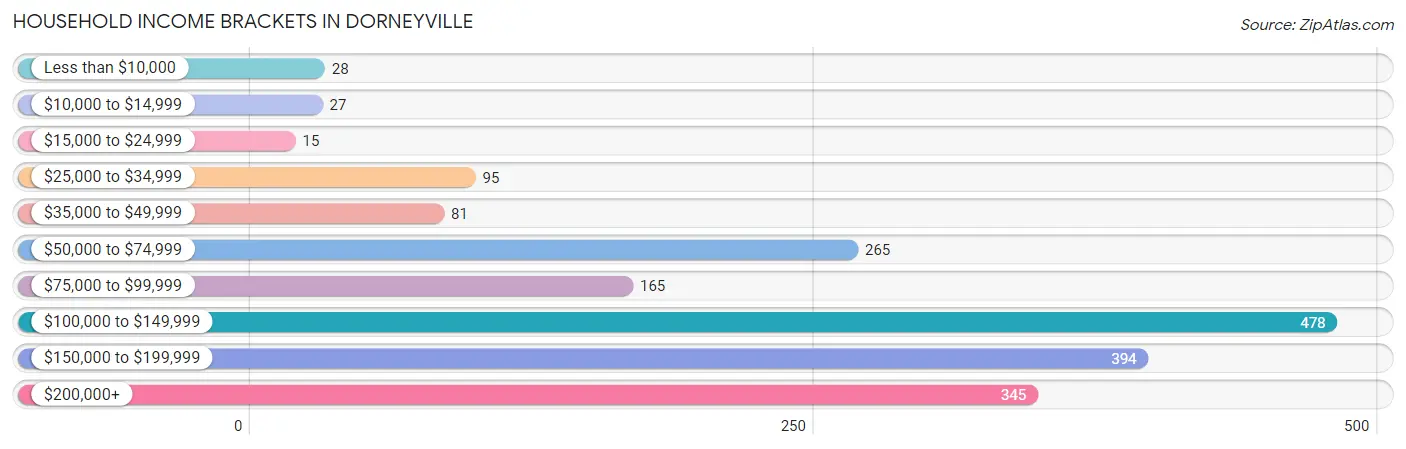
| Income Bracket | # Households | % Households |
| Less than $10,000 | 28 | 1.5% |
| $10,000 to $14,999 | 27 | 1.4% |
| $15,000 to $24,999 | 15 | 0.8% |
| $25,000 to $34,999 | 95 | 5.0% |
| $35,000 to $49,999 | 81 | 4.3% |
| $50,000 to $74,999 | 265 | 14.0% |
| $75,000 to $99,999 | 165 | 8.7% |
| $100,000 to $149,999 | 478 | 25.2% |
| $150,000 to $199,999 | 394 | 20.8% |
| $200,000+ | 345 | 18.2% |
Household Income by Householder Age in Dorneyville
The median household income in Dorneyville is $121,250, with the highest median household income of $158,274 found in the 45 to 64 years age bracket for the primary householder. A total of 844 households (44.5%) fall into this category.
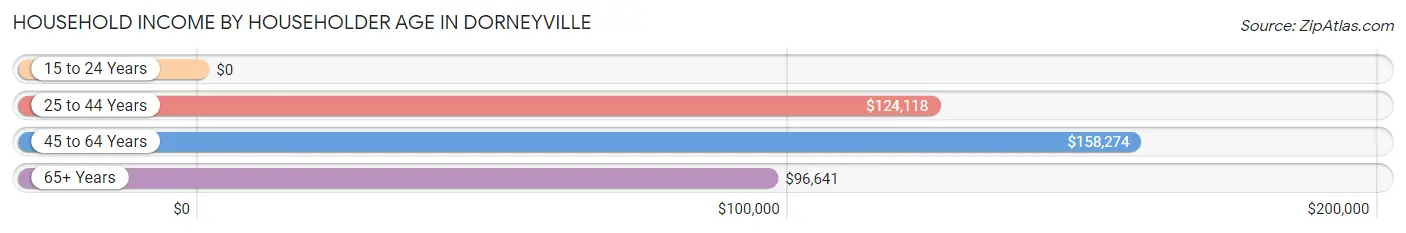
| Income Bracket | # Households | Median Income |
| 15 to 24 Years | 0 (0.0%) | $0 |
| 25 to 44 Years | 336 (17.7%) | $124,118 |
| 45 to 64 Years | 844 (44.5%) | $158,274 |
| 65+ Years | 715 (37.7%) | $96,641 |
| Total | 1,895 (100.0%) | $121,250 |
Poverty in Dorneyville
Income Below Poverty by Sex and Age in Dorneyville
With 5.3% poverty level for males and 3.2% for females among the residents of Dorneyville, 25 to 34 year old males and under 5 year old females are the most vulnerable to poverty, with 24 males (16.8%) and 19 females (22.6%) in their respective age groups living below the poverty level.
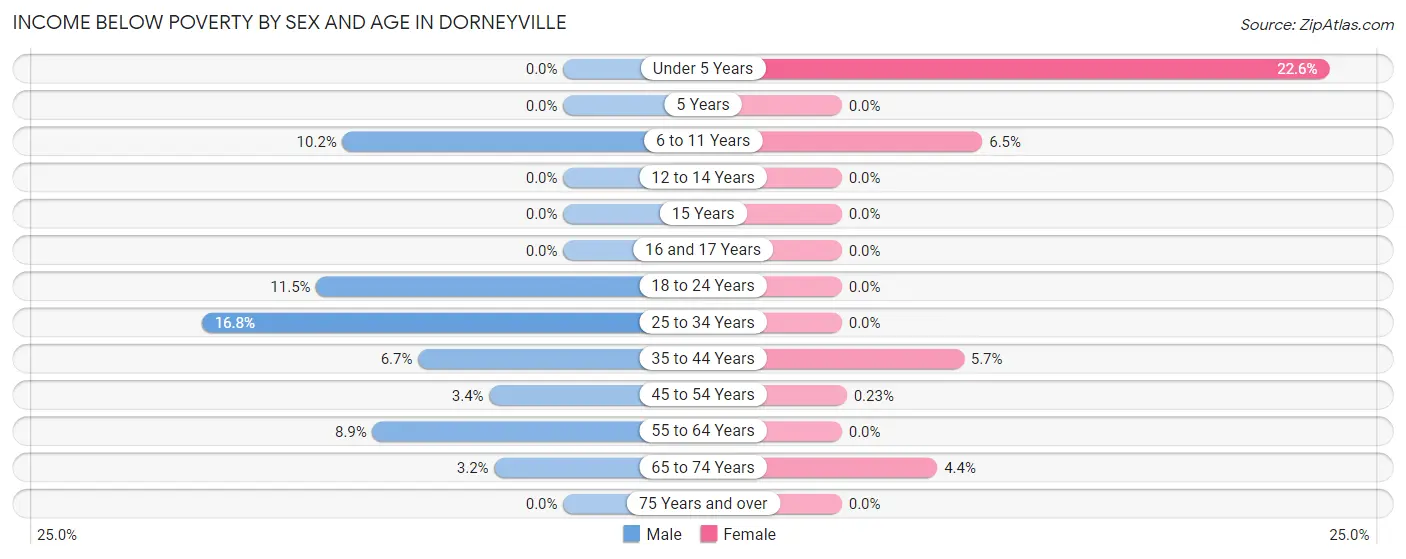
| Age Bracket | Male | Female |
| Under 5 Years | 0 (0.0%) | 19 (22.6%) |
| 5 Years | 0 (0.0%) | 0 (0.0%) |
| 6 to 11 Years | 17 (10.2%) | 18 (6.5%) |
| 12 to 14 Years | 0 (0.0%) | 0 (0.0%) |
| 15 Years | 0 (0.0%) | 0 (0.0%) |
| 16 and 17 Years | 0 (0.0%) | 0 (0.0%) |
| 18 to 24 Years | 33 (11.5%) | 0 (0.0%) |
| 25 to 34 Years | 24 (16.8%) | 0 (0.0%) |
| 35 to 44 Years | 22 (6.7%) | 18 (5.7%) |
| 45 to 54 Years | 20 (3.4%) | 1 (0.2%) |
| 55 to 64 Years | 20 (8.8%) | 0 (0.0%) |
| 65 to 74 Years | 14 (3.2%) | 16 (4.4%) |
| 75 Years and over | 0 (0.0%) | 0 (0.0%) |
| Total | 150 (5.3%) | 72 (3.2%) |
Income Above Poverty by Sex and Age in Dorneyville
According to the poverty statistics in Dorneyville, males aged under 5 years and females aged 12 to 14 years are the age groups that are most secure financially, with 100.0% of males and 100.0% of females in these age groups living above the poverty line.
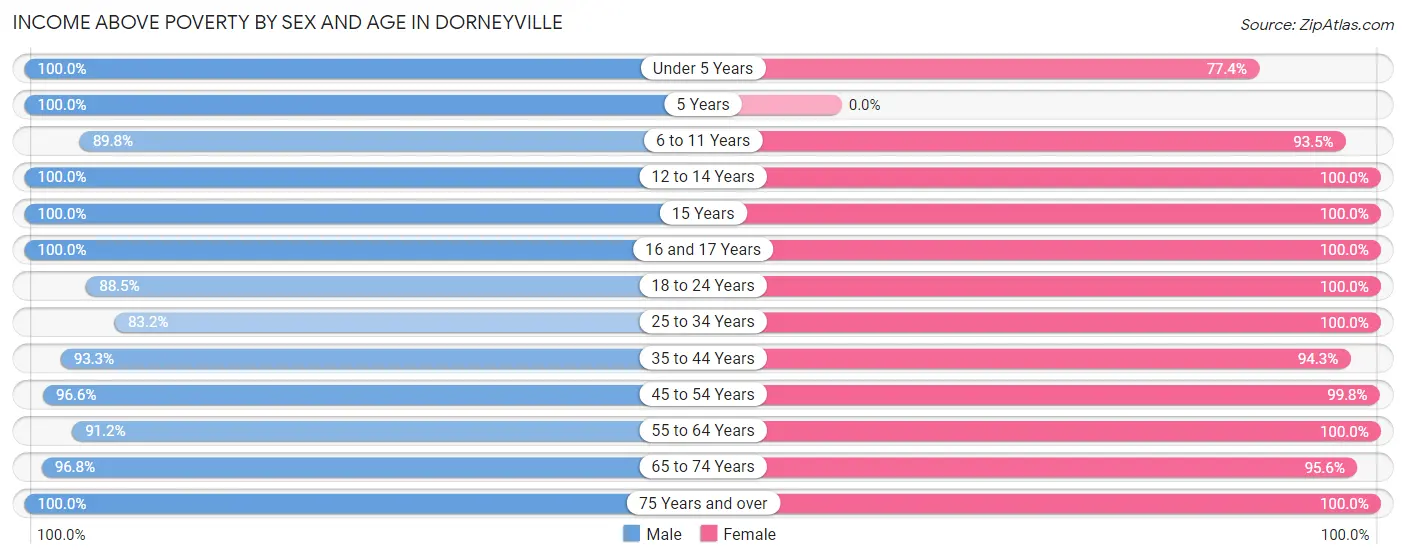
| Age Bracket | Male | Female |
| Under 5 Years | 74 (100.0%) | 65 (77.4%) |
| 5 Years | 14 (100.0%) | 0 (0.0%) |
| 6 to 11 Years | 149 (89.8%) | 258 (93.5%) |
| 12 to 14 Years | 258 (100.0%) | 35 (100.0%) |
| 15 Years | 89 (100.0%) | 15 (100.0%) |
| 16 and 17 Years | 100 (100.0%) | 37 (100.0%) |
| 18 to 24 Years | 255 (88.5%) | 108 (100.0%) |
| 25 to 34 Years | 119 (83.2%) | 84 (100.0%) |
| 35 to 44 Years | 305 (93.3%) | 300 (94.3%) |
| 45 to 54 Years | 563 (96.6%) | 437 (99.8%) |
| 55 to 64 Years | 206 (91.1%) | 239 (100.0%) |
| 65 to 74 Years | 424 (96.8%) | 345 (95.6%) |
| 75 Years and over | 141 (100.0%) | 251 (100.0%) |
| Total | 2,697 (94.7%) | 2,174 (96.8%) |
Income Below Poverty Among Married-Couple Families in Dorneyville
The poverty statistics for married-couple families in Dorneyville show that 1.5% or 19 of the total 1,313 families live below the poverty line. Families with 3 or 4 children have the highest poverty rate of 21.1%, comprising of 19 families. On the other hand, families with no children have the lowest poverty rate of 0.0%, which includes 0 families.
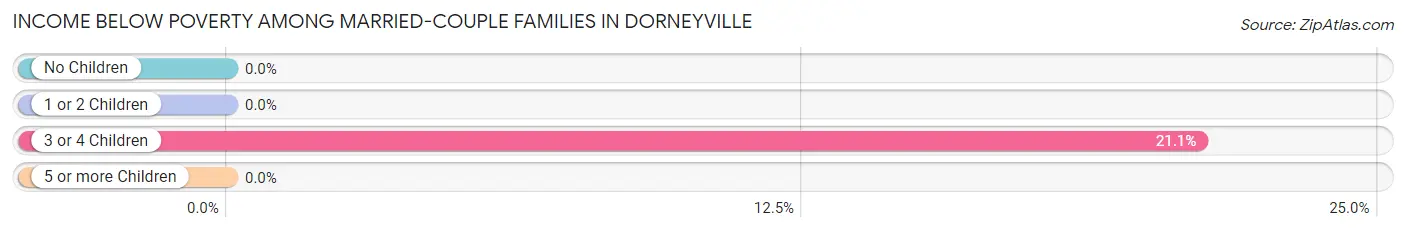
| Children | Above Poverty | Below Poverty |
| No Children | 777 (100.0%) | 0 (0.0%) |
| 1 or 2 Children | 446 (100.0%) | 0 (0.0%) |
| 3 or 4 Children | 71 (78.9%) | 19 (21.1%) |
| 5 or more Children | 0 (0.0%) | 0 (0.0%) |
| Total | 1,294 (98.6%) | 19 (1.5%) |
Income Below Poverty Among Single-Parent Households in Dorneyville
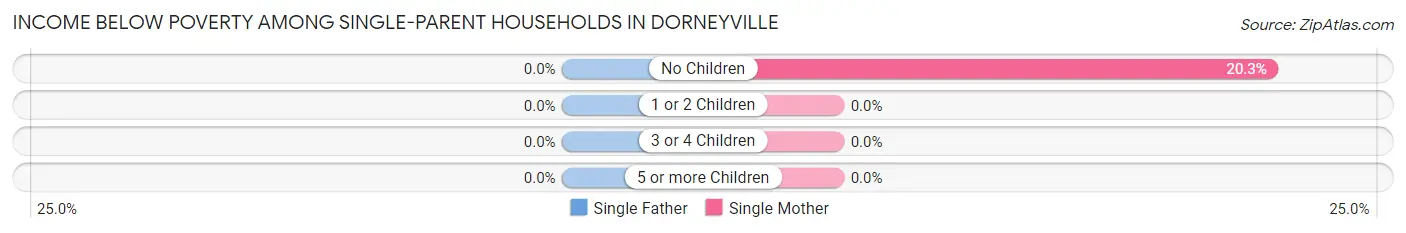
| Children | Single Father | Single Mother |
| No Children | 0 (0.0%) | 16 (20.3%) |
| 1 or 2 Children | 0 (0.0%) | 0 (0.0%) |
| 3 or 4 Children | 0 (0.0%) | 0 (0.0%) |
| 5 or more Children | 0 (0.0%) | 0 (0.0%) |
| Total | 0 (0.0%) | 16 (9.9%) |
Income Below Poverty Among Married-Couple vs Single-Parent Households in Dorneyville
The poverty data for Dorneyville shows that 19 of the married-couple family households (1.5%) and 16 of the single-parent households (6.5%) are living below the poverty level. Within the married-couple family households, those with 3 or 4 children have the highest poverty rate, with 19 households (21.1%) falling below the poverty line. Among the single-parent households, those with no children have the highest poverty rate, with 16 household (17.0%) living below poverty.
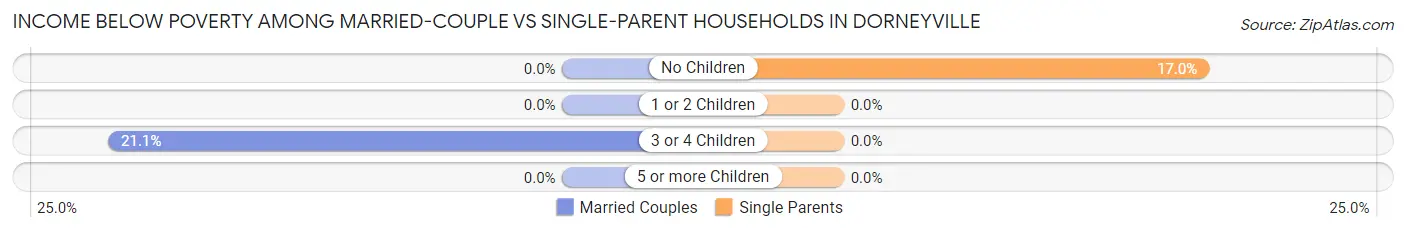
| Children | Married-Couple Families | Single-Parent Households |
| No Children | 0 (0.0%) | 16 (17.0%) |
| 1 or 2 Children | 0 (0.0%) | 0 (0.0%) |
| 3 or 4 Children | 19 (21.1%) | 0 (0.0%) |
| 5 or more Children | 0 (0.0%) | 0 (0.0%) |
| Total | 19 (1.5%) | 16 (6.5%) |
Race in Dorneyville
The most populous races in Dorneyville are White / Caucasian (4,231 | 83.1%), Two or more Races (698 | 13.7%), and Hispanic or Latino (656 | 12.9%).
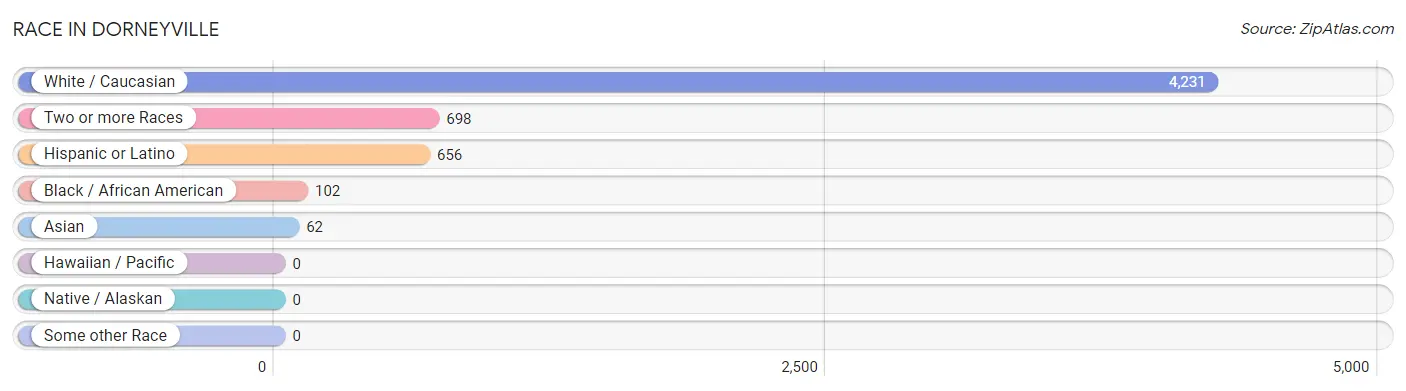
| Race | # Population | % Population |
| Asian | 62 | 1.2% |
| Black / African American | 102 | 2.0% |
| Hawaiian / Pacific | 0 | 0.0% |
| Hispanic or Latino | 656 | 12.9% |
| Native / Alaskan | 0 | 0.0% |
| White / Caucasian | 4,231 | 83.1% |
| Two or more Races | 698 | 13.7% |
| Some other Race | 0 | 0.0% |
| Total | 5,093 | 100.0% |
Ancestry in Dorneyville
The most populous ancestries reported in Dorneyville are German (1,471 | 28.9%), Irish (946 | 18.6%), Italian (513 | 10.1%), English (311 | 6.1%), and Dominican (298 | 5.9%), together accounting for 69.5% of all Dorneyville residents.
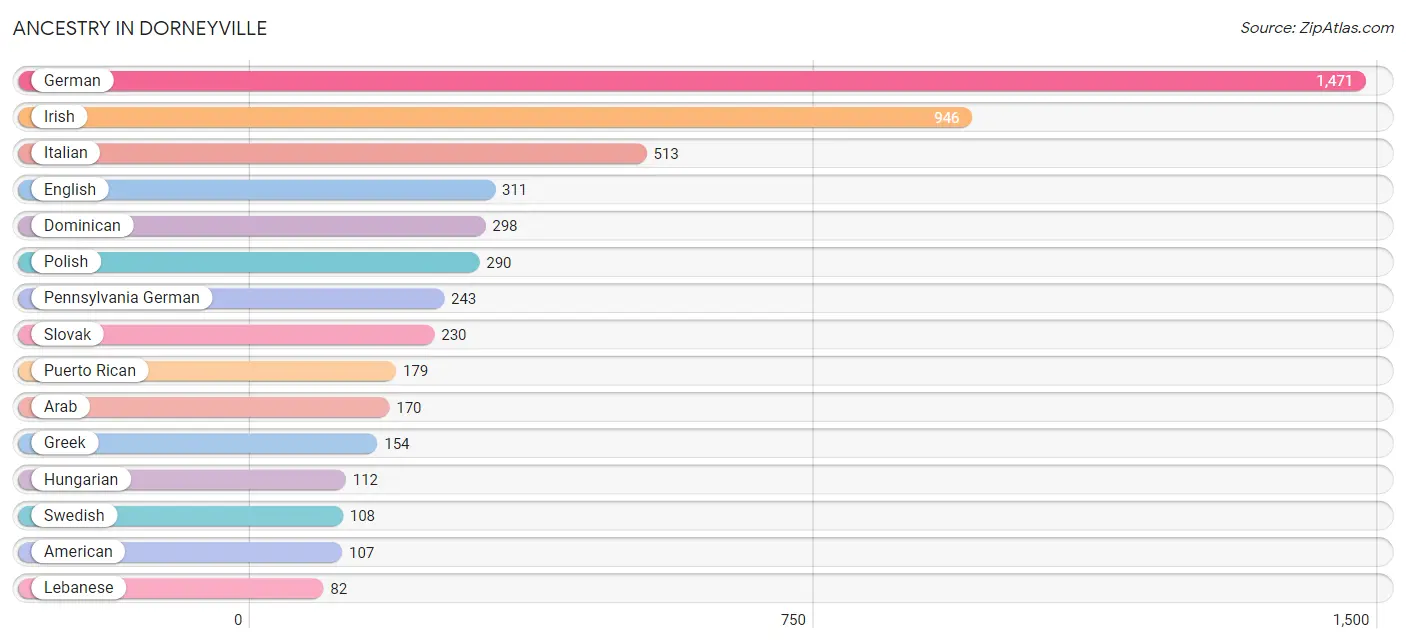
| Ancestry | # Population | % Population |
| Alsatian | 24 | 0.5% |
| American | 107 | 2.1% |
| Arab | 170 | 3.3% |
| Austrian | 19 | 0.4% |
| Bhutanese | 43 | 0.8% |
| Burmese | 12 | 0.2% |
| Colombian | 33 | 0.6% |
| Cuban | 76 | 1.5% |
| Czech | 1 | 0.0% |
| Czechoslovakian | 20 | 0.4% |
| Delaware | 24 | 0.5% |
| Dominican | 298 | 5.9% |
| Dutch | 12 | 0.2% |
| Eastern European | 50 | 1.0% |
| Egyptian | 28 | 0.5% |
| English | 311 | 6.1% |
| European | 24 | 0.5% |
| Finnish | 18 | 0.4% |
| French | 34 | 0.7% |
| French Canadian | 14 | 0.3% |
| German | 1,471 | 28.9% |
| Greek | 154 | 3.0% |
| Hungarian | 112 | 2.2% |
| Indonesian | 22 | 0.4% |
| Irish | 946 | 18.6% |
| Italian | 513 | 10.1% |
| Korean | 2 | 0.0% |
| Lebanese | 82 | 1.6% |
| Lithuanian | 14 | 0.3% |
| Mexican | 70 | 1.4% |
| Norwegian | 47 | 0.9% |
| Pakistani | 20 | 0.4% |
| Pennsylvania German | 243 | 4.8% |
| Polish | 290 | 5.7% |
| Portuguese | 23 | 0.4% |
| Puerto Rican | 179 | 3.5% |
| Russian | 54 | 1.1% |
| Scotch-Irish | 32 | 0.6% |
| Scottish | 75 | 1.5% |
| Slovak | 230 | 4.5% |
| South American | 33 | 0.6% |
| South American Indian | 18 | 0.4% |
| Sri Lankan | 9 | 0.2% |
| Swedish | 108 | 2.1% |
| Swiss | 4 | 0.1% |
| Syrian | 60 | 1.2% |
| Thai | 1 | 0.0% |
| Ukrainian | 36 | 0.7% |
| Welsh | 32 | 0.6% | View All 49 Rows |
Immigrants in Dorneyville
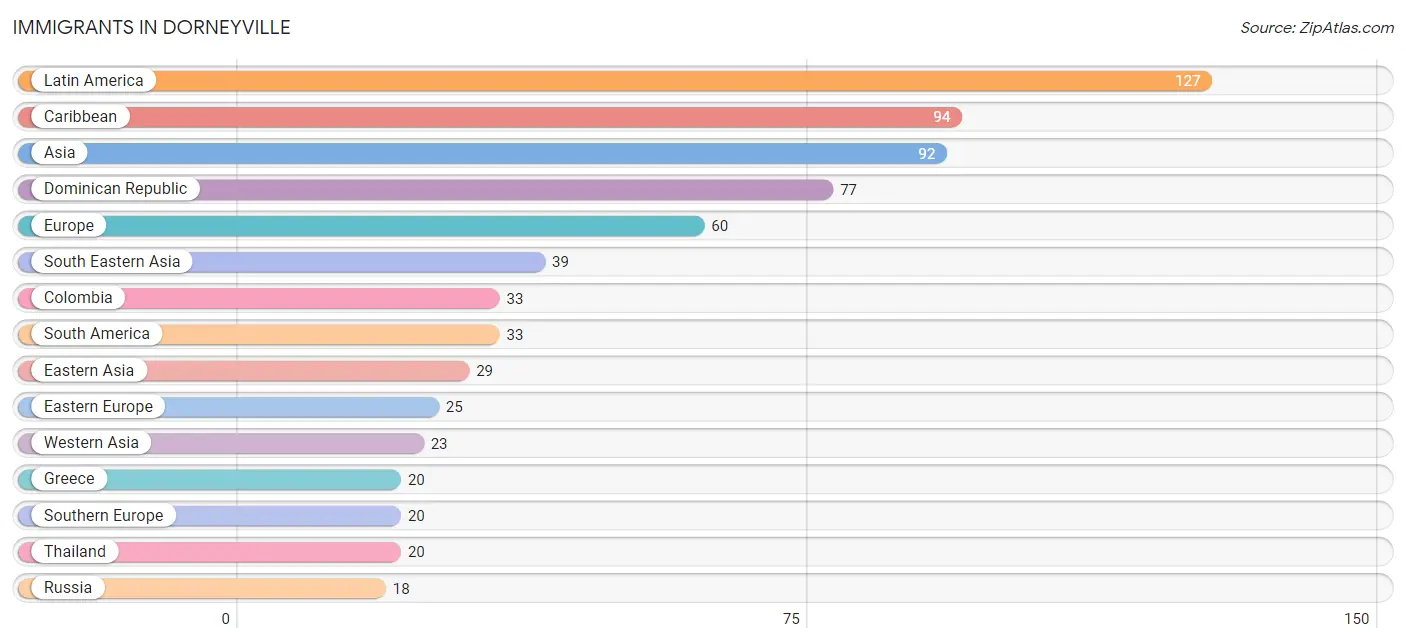
The most numerous immigrant groups reported in Dorneyville came from Latin America (127 | 2.5%), Caribbean (94 | 1.8%), Asia (92 | 1.8%), Dominican Republic (77 | 1.5%), and Europe (60 | 1.2%), together accounting for 8.8% of all Dorneyville residents.
| Immigration Origin | # Population | % Population |
| Africa | 15 | 0.3% |
| Asia | 92 | 1.8% |
| Caribbean | 94 | 1.8% |
| Colombia | 33 | 0.6% |
| Croatia | 7 | 0.1% |
| Cuba | 17 | 0.3% |
| Dominican Republic | 77 | 1.5% |
| Eastern Asia | 29 | 0.6% |
| Eastern Europe | 25 | 0.5% |
| Egypt | 15 | 0.3% |
| Europe | 60 | 1.2% |
| Greece | 20 | 0.4% |
| India | 1 | 0.0% |
| Ireland | 15 | 0.3% |
| Japan | 17 | 0.3% |
| Korea | 12 | 0.2% |
| Latin America | 127 | 2.5% |
| Lebanon | 6 | 0.1% |
| Northern Africa | 15 | 0.3% |
| Northern Europe | 15 | 0.3% |
| Philippines | 2 | 0.0% |
| Russia | 18 | 0.4% |
| South America | 33 | 0.6% |
| South Central Asia | 1 | 0.0% |
| South Eastern Asia | 39 | 0.8% |
| Southern Europe | 20 | 0.4% |
| Syria | 6 | 0.1% |
| Thailand | 20 | 0.4% |
| Vietnam | 9 | 0.2% |
| Western Asia | 23 | 0.4% | View All 30 Rows |
Sex and Age in Dorneyville
Sex and Age in Dorneyville
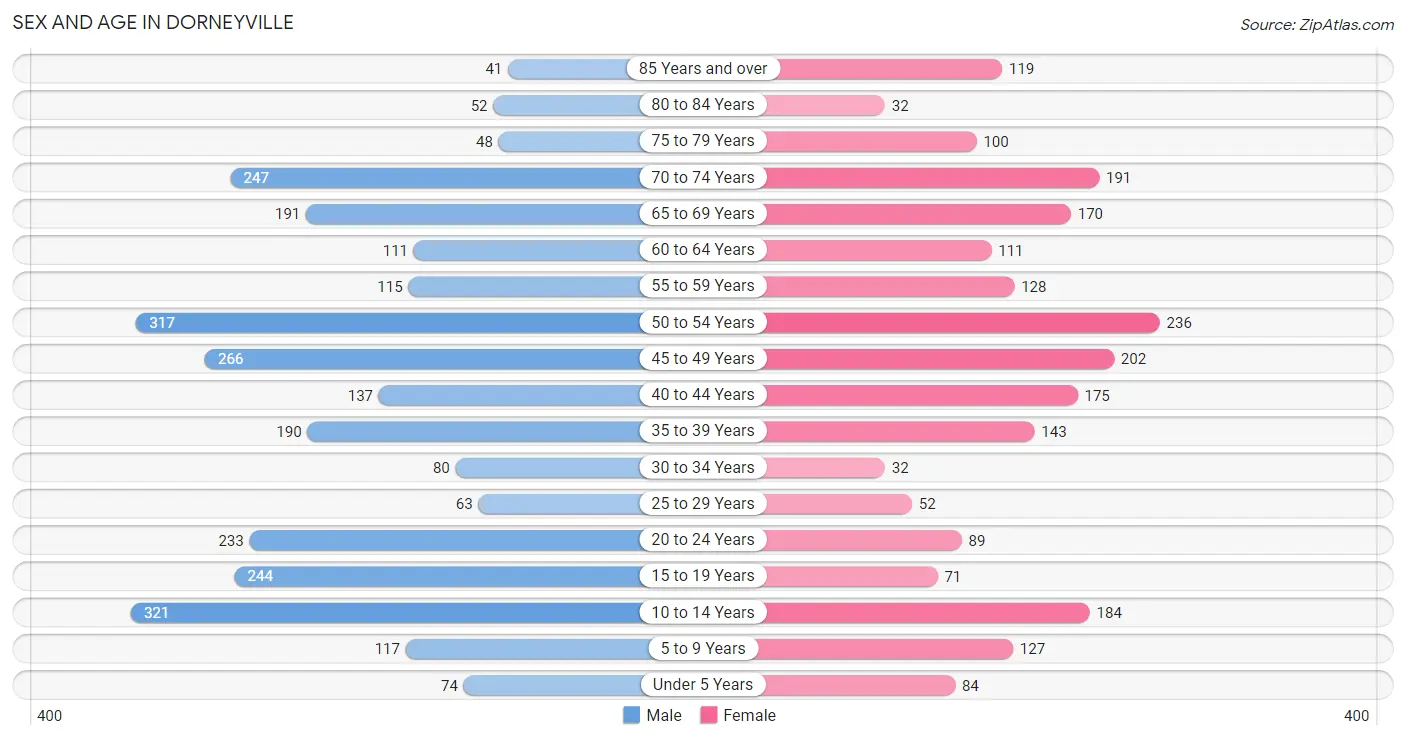
The most populous age groups in Dorneyville are 10 to 14 Years (321 | 11.3%) for men and 50 to 54 Years (236 | 10.5%) for women.
| Age Bracket | Male | Female |
| Under 5 Years | 74 (2.6%) | 84 (3.7%) |
| 5 to 9 Years | 117 (4.1%) | 127 (5.7%) |
| 10 to 14 Years | 321 (11.3%) | 184 (8.2%) |
| 15 to 19 Years | 244 (8.6%) | 71 (3.2%) |
| 20 to 24 Years | 233 (8.2%) | 89 (4.0%) |
| 25 to 29 Years | 63 (2.2%) | 52 (2.3%) |
| 30 to 34 Years | 80 (2.8%) | 32 (1.4%) |
| 35 to 39 Years | 190 (6.7%) | 143 (6.4%) |
| 40 to 44 Years | 137 (4.8%) | 175 (7.8%) |
| 45 to 49 Years | 266 (9.3%) | 202 (9.0%) |
| 50 to 54 Years | 317 (11.1%) | 236 (10.5%) |
| 55 to 59 Years | 115 (4.0%) | 128 (5.7%) |
| 60 to 64 Years | 111 (3.9%) | 111 (4.9%) |
| 65 to 69 Years | 191 (6.7%) | 170 (7.6%) |
| 70 to 74 Years | 247 (8.7%) | 191 (8.5%) |
| 75 to 79 Years | 48 (1.7%) | 100 (4.4%) |
| 80 to 84 Years | 52 (1.8%) | 32 (1.4%) |
| 85 Years and over | 41 (1.4%) | 119 (5.3%) |
| Total | 2,847 (100.0%) | 2,246 (100.0%) |
Families and Households in Dorneyville
Median Family Size in Dorneyville
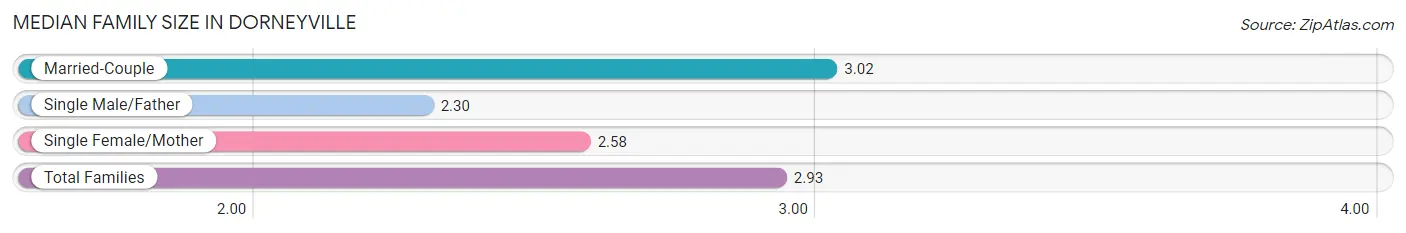
The median family size in Dorneyville is 2.93 persons per family, with married-couple families (1,313 | 84.1%) accounting for the largest median family size of 3.02 persons per family. On the other hand, single male/father families (87 | 5.6%) represent the smallest median family size with 2.30 persons per family.
| Family Type | # Families | Family Size |
| Married-Couple | 1,313 (84.1%) | 3.02 |
| Single Male/Father | 87 (5.6%) | 2.30 |
| Single Female/Mother | 161 (10.3%) | 2.58 |
| Total Families | 1,561 (100.0%) | 2.93 |
Median Household Size in Dorneyville
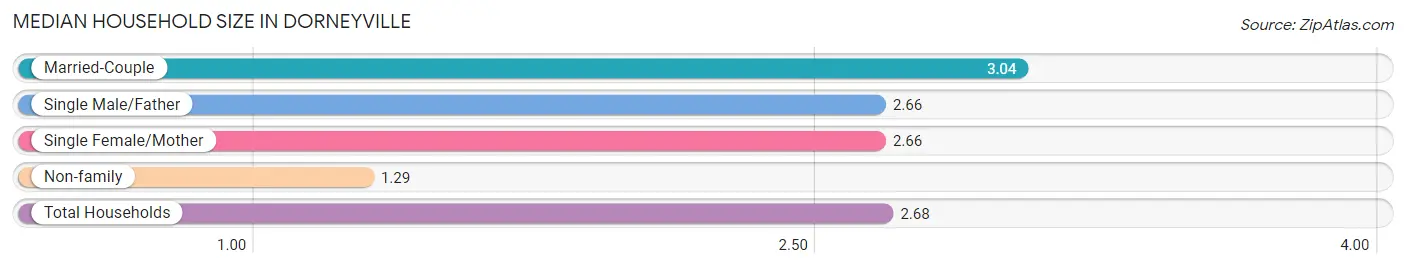
The median household size in Dorneyville is 2.68 persons per household, with married-couple households (1,313 | 69.3%) accounting for the largest median household size of 3.04 persons per household. non-family households (334 | 17.6%) represent the smallest median household size with 1.29 persons per household.
| Household Type | # Households | Household Size |
| Married-Couple | 1,313 (69.3%) | 3.04 |
| Single Male/Father | 87 (4.6%) | 2.66 |
| Single Female/Mother | 161 (8.5%) | 2.66 |
| Non-family | 334 (17.6%) | 1.29 |
| Total Households | 1,895 (100.0%) | 2.68 |
Household Size by Marriage Status in Dorneyville
Out of a total of 1,895 households in Dorneyville, 1,561 (82.4%) are family households, while 334 (17.6%) are nonfamily households. The most numerous type of family households are 2-person households, comprising 734, and the most common type of nonfamily households are 1-person households, comprising 251.
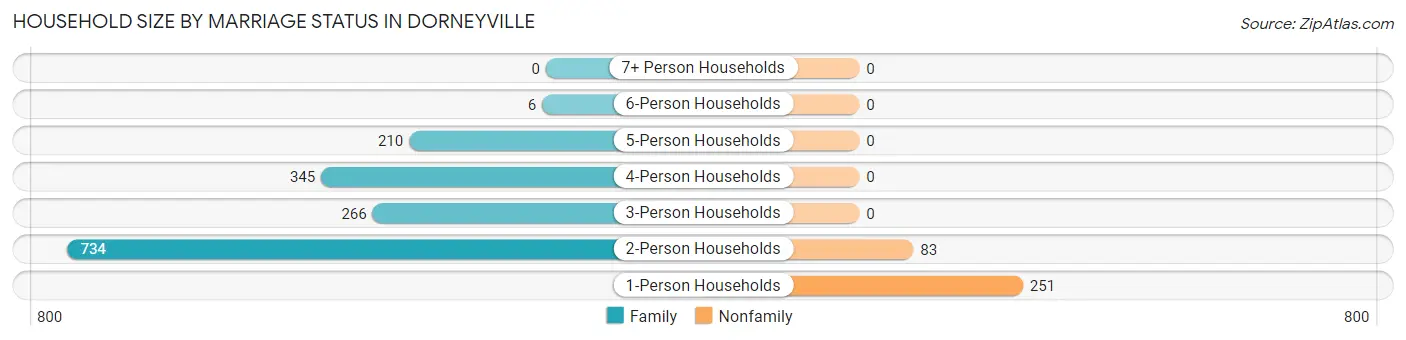
| Household Size | Family Households | Nonfamily Households |
| 1-Person Households | - | 251 (13.3%) |
| 2-Person Households | 734 (38.7%) | 83 (4.4%) |
| 3-Person Households | 266 (14.0%) | 0 (0.0%) |
| 4-Person Households | 345 (18.2%) | 0 (0.0%) |
| 5-Person Households | 210 (11.1%) | 0 (0.0%) |
| 6-Person Households | 6 (0.3%) | 0 (0.0%) |
| 7+ Person Households | 0 (0.0%) | 0 (0.0%) |
| Total | 1,561 (82.4%) | 334 (17.6%) |
Female Fertility in Dorneyville
Fertility by Age in Dorneyville
Average fertility rate in Dorneyville is 5.0 births per 1,000 women. Women in the age bracket of 20 to 34 years have the highest fertility rate with 23.0 births per 1,000 women. Women in the age bracket of 20 to 34 years acount for 100.0% of all women with births.
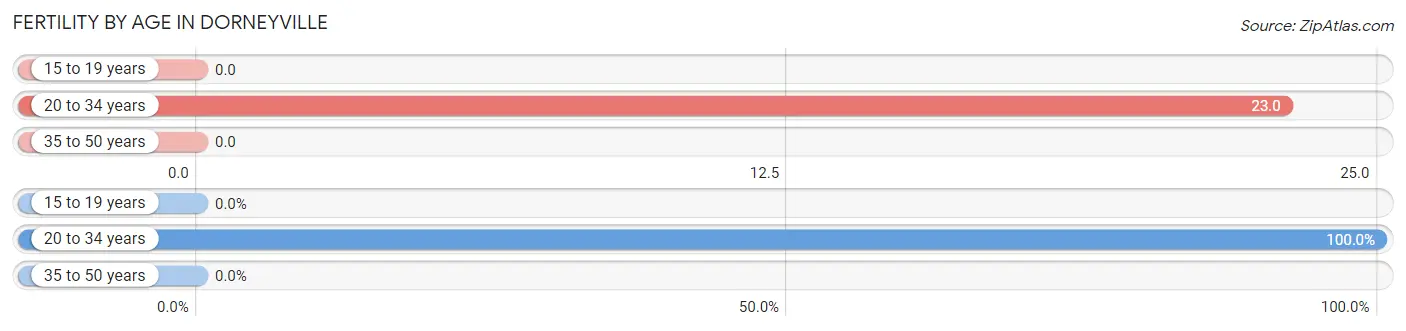
| Age Bracket | Women with Births | Births / 1,000 Women |
| 15 to 19 years | 0 (0.0%) | 0.0 |
| 20 to 34 years | 4 (100.0%) | 23.0 |
| 35 to 50 years | 0 (0.0%) | 0.0 |
| Total | 4 (100.0%) | 5.0 |
Fertility by Age by Marriage Status in Dorneyville
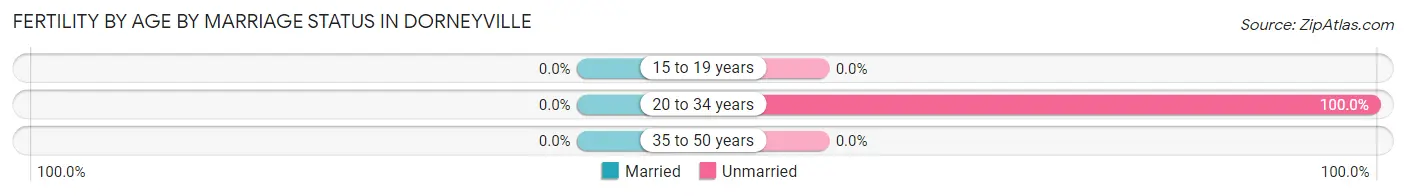
| Age Bracket | Married | Unmarried |
| 15 to 19 years | 0 (0.0%) | 0 (0.0%) |
| 20 to 34 years | 0 (0.0%) | 4 (100.0%) |
| 35 to 50 years | 0 (0.0%) | 0 (0.0%) |
| Total | 0 (0.0%) | 4 (100.0%) |
Fertility by Education in Dorneyville
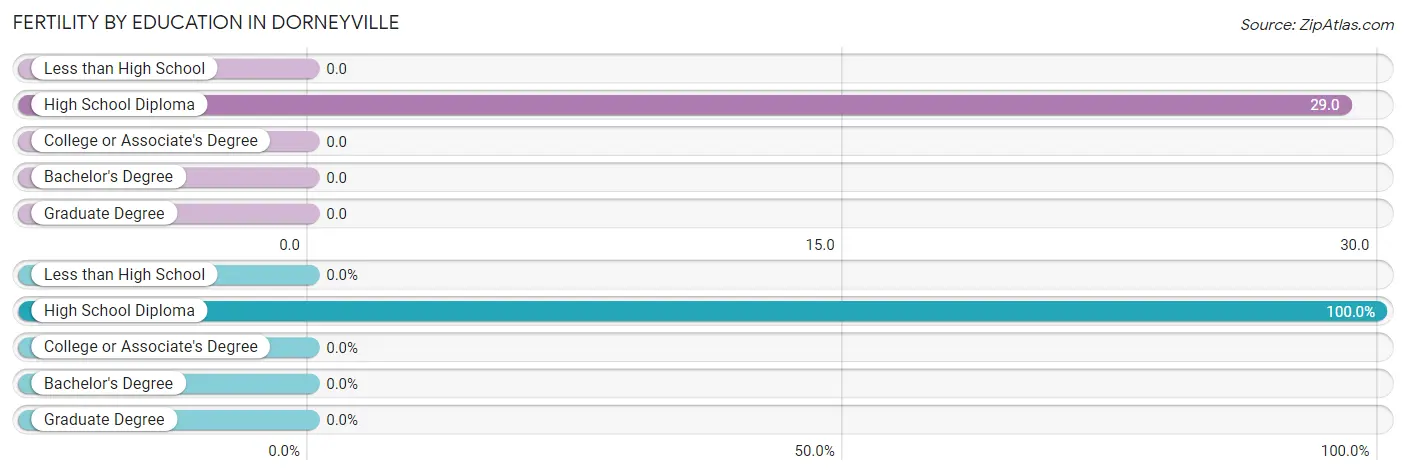
| Educational Attainment | Women with Births | Births / 1,000 Women |
| Less than High School | 0 (0.0%) | 0.0 |
| High School Diploma | 4 (100.0%) | 29.0 |
| College or Associate's Degree | 0 (0.0%) | 0.0 |
| Bachelor's Degree | 0 (0.0%) | 0.0 |
| Graduate Degree | 0 (0.0%) | 0.0 |
| Total | 4 (100.0%) | 5.0 |
Fertility by Education by Marriage Status in Dorneyville
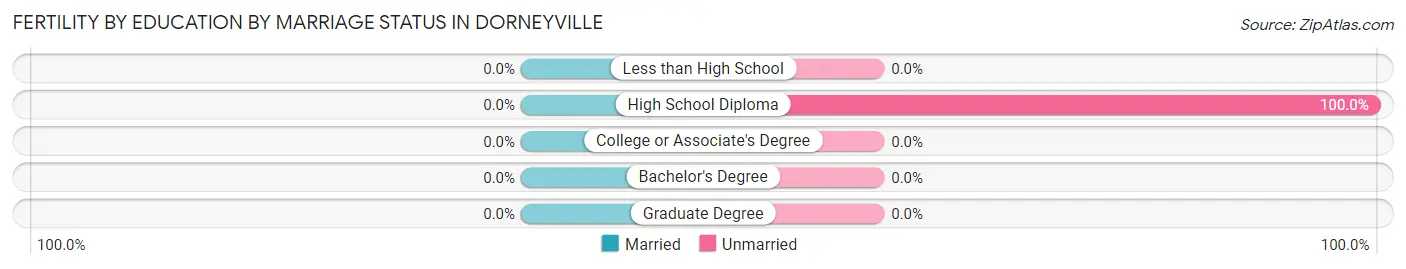
| Educational Attainment | Married | Unmarried |
| Less than High School | 0 (0.0%) | 0 (0.0%) |
| High School Diploma | 0 (0.0%) | 4 (100.0%) |
| College or Associate's Degree | 0 (0.0%) | 0 (0.0%) |
| Bachelor's Degree | 0 (0.0%) | 0 (0.0%) |
| Graduate Degree | 0 (0.0%) | 0 (0.0%) |
| Total | 0 (0.0%) | 4 (100.0%) |
Employment Characteristics in Dorneyville
Employment by Class of Employer in Dorneyville
Among the 2,391 employed individuals in Dorneyville, private company employees (1,478 | 61.8%), not-for-profit organizations (388 | 16.2%), and self-employed (not incorporated) (163 | 6.8%) make up the most common classes of employment.
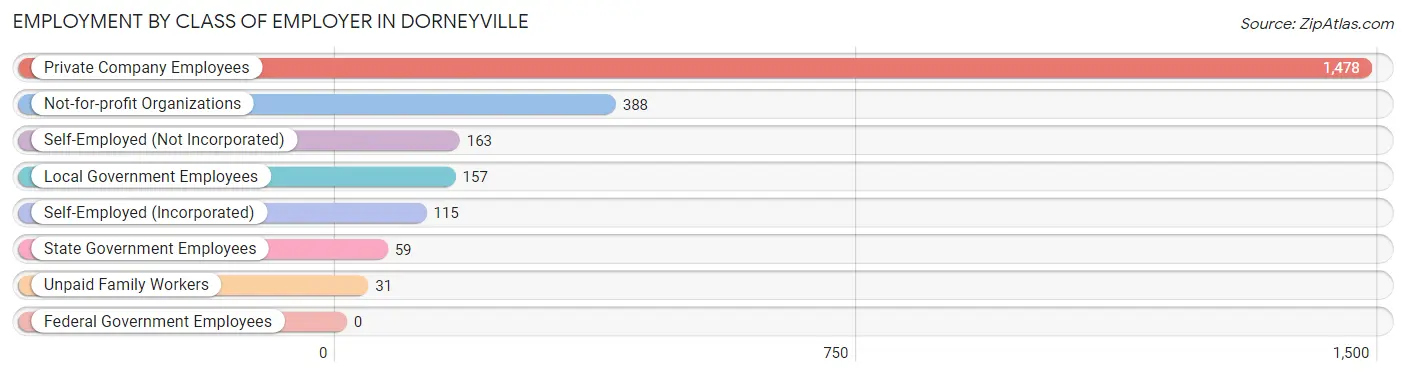
| Employer Class | # Employees | % Employees |
| Private Company Employees | 1,478 | 61.8% |
| Self-Employed (Incorporated) | 115 | 4.8% |
| Self-Employed (Not Incorporated) | 163 | 6.8% |
| Not-for-profit Organizations | 388 | 16.2% |
| Local Government Employees | 157 | 6.6% |
| State Government Employees | 59 | 2.5% |
| Federal Government Employees | 0 | 0.0% |
| Unpaid Family Workers | 31 | 1.3% |
| Total | 2,391 | 100.0% |
Employment Status by Age in Dorneyville
According to the labor force statistics for Dorneyville, out of the total population over 16 years of age (4,082), 63.2% or 2,580 individuals are in the labor force, with 6.4% or 165 of them unemployed. The age group with the highest labor force participation rate is 25 to 29 years, with 94.8% or 109 individuals in the labor force. Within the labor force, the 25 to 29 years age range has the highest percentage of unemployed individuals, with 20.2% or 22 of them being unemployed.
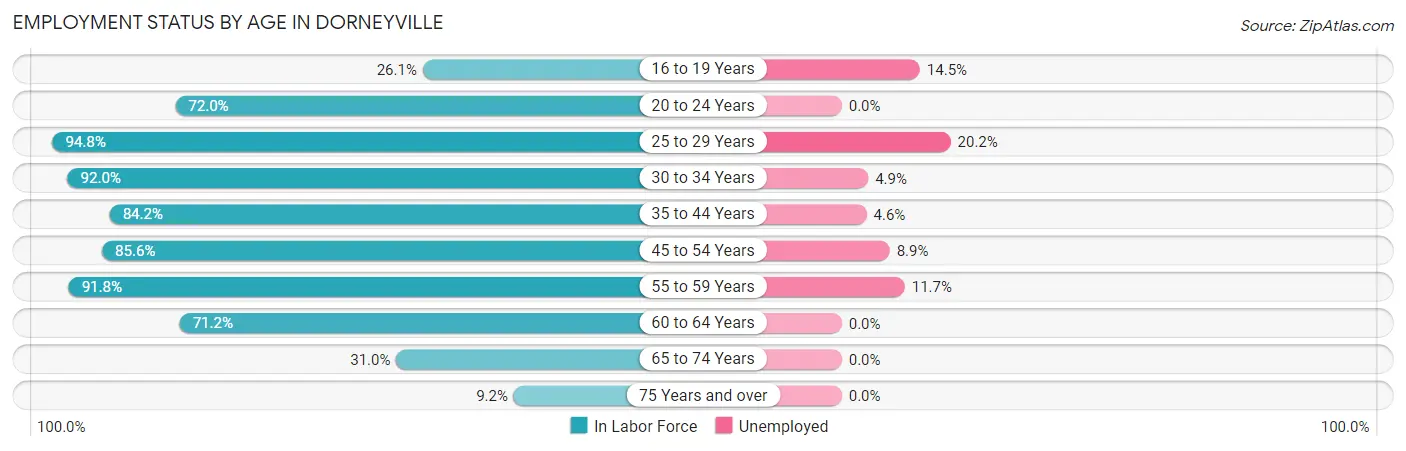
| Age Bracket | In Labor Force | Unemployed |
| 16 to 19 Years | 55 (26.1%) | 8 (14.5%) |
| 20 to 24 Years | 232 (72.0%) | 0 (0.0%) |
| 25 to 29 Years | 109 (94.8%) | 22 (20.2%) |
| 30 to 34 Years | 103 (92.0%) | 5 (4.9%) |
| 35 to 44 Years | 543 (84.2%) | 25 (4.6%) |
| 45 to 54 Years | 874 (85.6%) | 78 (8.9%) |
| 55 to 59 Years | 223 (91.8%) | 26 (11.7%) |
| 60 to 64 Years | 158 (71.2%) | 0 (0.0%) |
| 65 to 74 Years | 248 (31.0%) | 0 (0.0%) |
| 75 Years and over | 36 (9.2%) | 0 (0.0%) |
| Total | 2,580 (63.2%) | 165 (6.4%) |
Employment Status by Educational Attainment in Dorneyville
According to labor force statistics for Dorneyville, 85.2% of individuals (2,009) out of the total population between 25 and 64 years of age (2,358) are in the labor force, with 7.8% or 157 of them being unemployed. The group with the highest labor force participation rate are those with the educational attainment of college / associate degree, with 97.1% or 405 individuals in the labor force. Within the labor force, individuals with college / associate degree education have the highest percentage of unemployment, with 17.5% or 71 of them being unemployed.
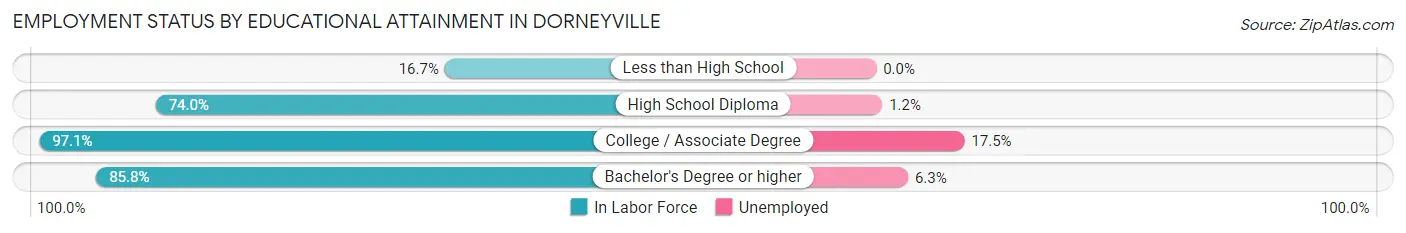
| Educational Attainment | In Labor Force | Unemployed |
| Less than High School | 2 (16.7%) | 0 (0.0%) |
| High School Diploma | 324 (74.0%) | 5 (1.2%) |
| College / Associate Degree | 405 (97.1%) | 73 (17.5%) |
| Bachelor's Degree or higher | 1,279 (85.8%) | 94 (6.3%) |
| Total | 2,009 (85.2%) | 184 (7.8%) |
Employment Occupations by Sex in Dorneyville
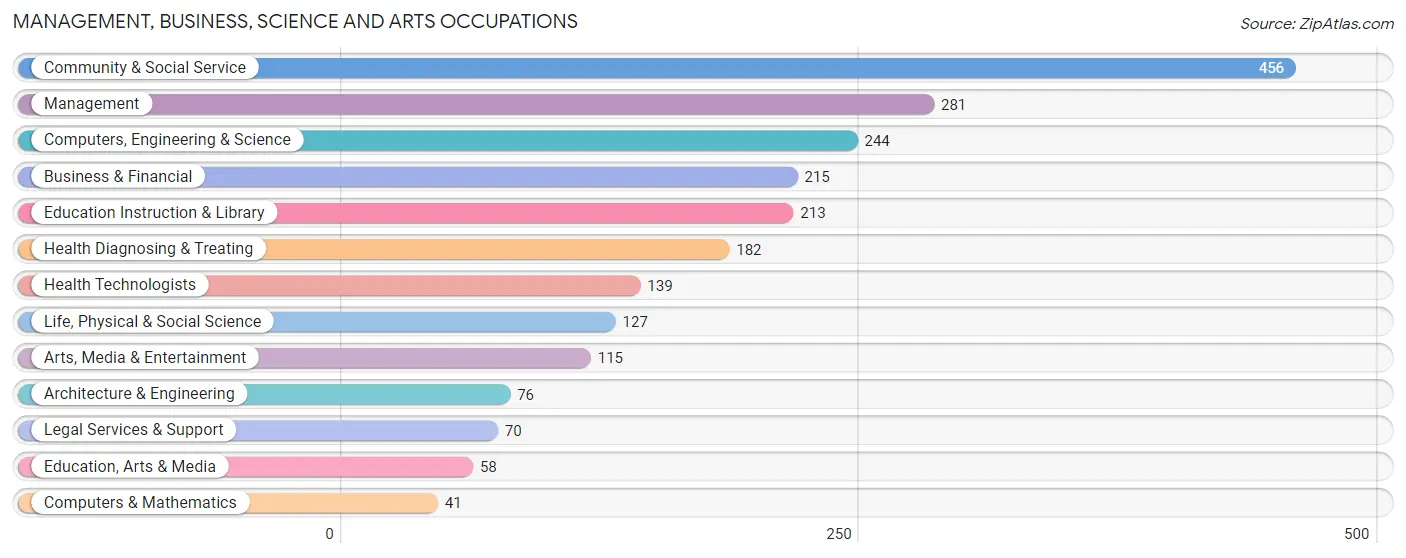
Management, Business, Science and Arts Occupations
The most common Management, Business, Science and Arts occupations in Dorneyville are Community & Social Service (456 | 18.9%), Management (281 | 11.6%), Computers, Engineering & Science (244 | 10.1%), Business & Financial (215 | 8.9%), and Education Instruction & Library (213 | 8.8%).
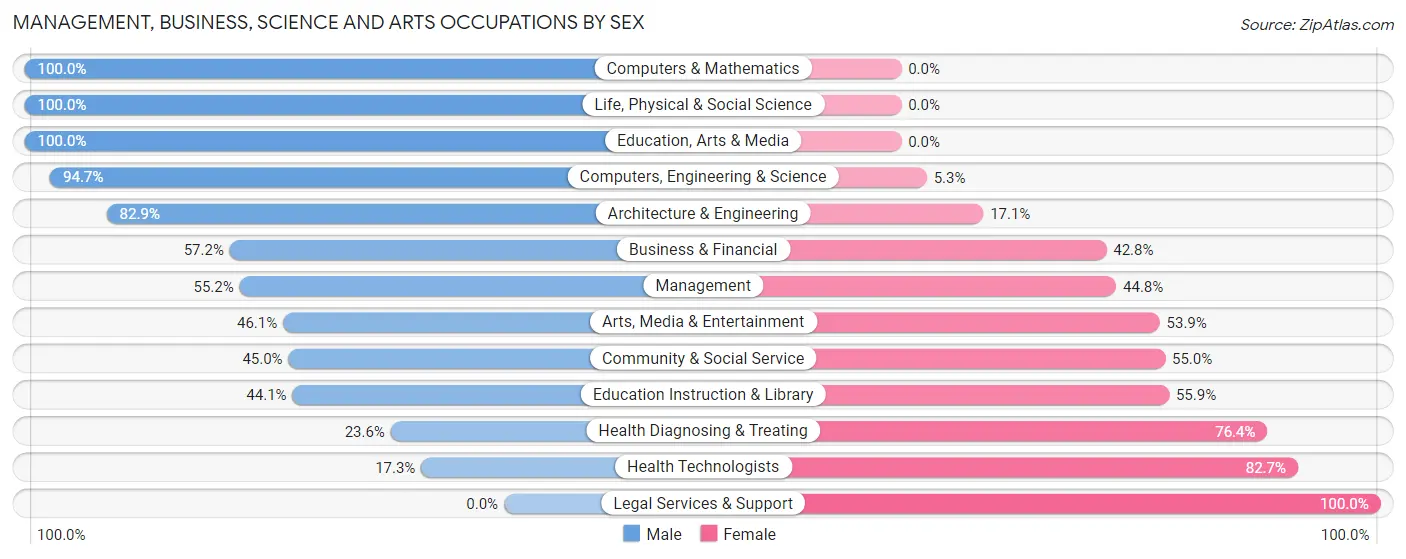
Management, Business, Science and Arts Occupations by Sex
Within the Management, Business, Science and Arts occupations in Dorneyville, the most male-oriented occupations are Computers & Mathematics (100.0%), Life, Physical & Social Science (100.0%), and Education, Arts & Media (100.0%), while the most female-oriented occupations are Legal Services & Support (100.0%), Health Technologists (82.7%), and Health Diagnosing & Treating (76.4%).
| Occupation | Male | Female |
| Management | 155 (55.2%) | 126 (44.8%) |
| Business & Financial | 123 (57.2%) | 92 (42.8%) |
| Computers, Engineering & Science | 231 (94.7%) | 13 (5.3%) |
| Computers & Mathematics | 41 (100.0%) | 0 (0.0%) |
| Architecture & Engineering | 63 (82.9%) | 13 (17.1%) |
| Life, Physical & Social Science | 127 (100.0%) | 0 (0.0%) |
| Community & Social Service | 205 (45.0%) | 251 (55.0%) |
| Education, Arts & Media | 58 (100.0%) | 0 (0.0%) |
| Legal Services & Support | 0 (0.0%) | 70 (100.0%) |
| Education Instruction & Library | 94 (44.1%) | 119 (55.9%) |
| Arts, Media & Entertainment | 53 (46.1%) | 62 (53.9%) |
| Health Diagnosing & Treating | 43 (23.6%) | 139 (76.4%) |
| Health Technologists | 24 (17.3%) | 115 (82.7%) |
| Total (Category) | 757 (54.9%) | 621 (45.1%) |
| Total (Overall) | 1,468 (60.7%) | 949 (39.3%) |
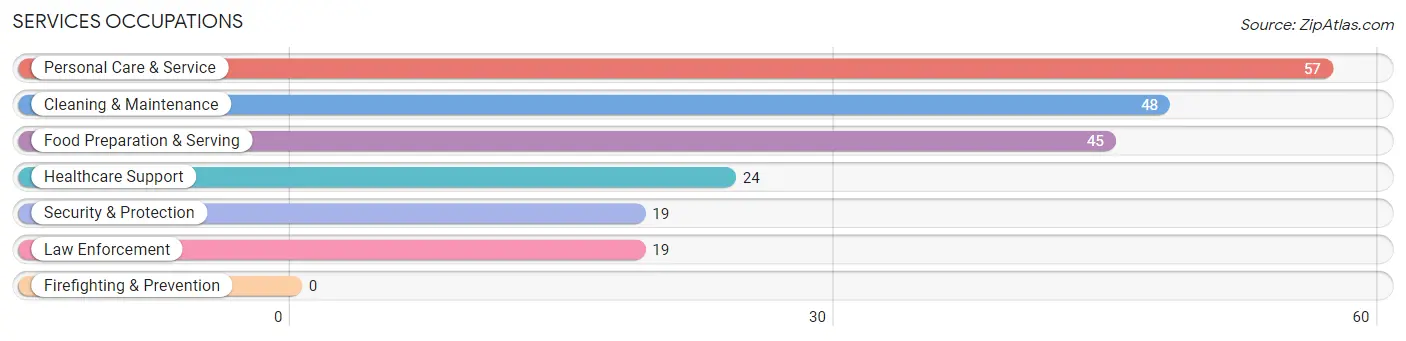
Services Occupations
The most common Services occupations in Dorneyville are Personal Care & Service (57 | 2.4%), Cleaning & Maintenance (48 | 2.0%), Food Preparation & Serving (45 | 1.9%), Healthcare Support (24 | 1.0%), and Security & Protection (19 | 0.8%).
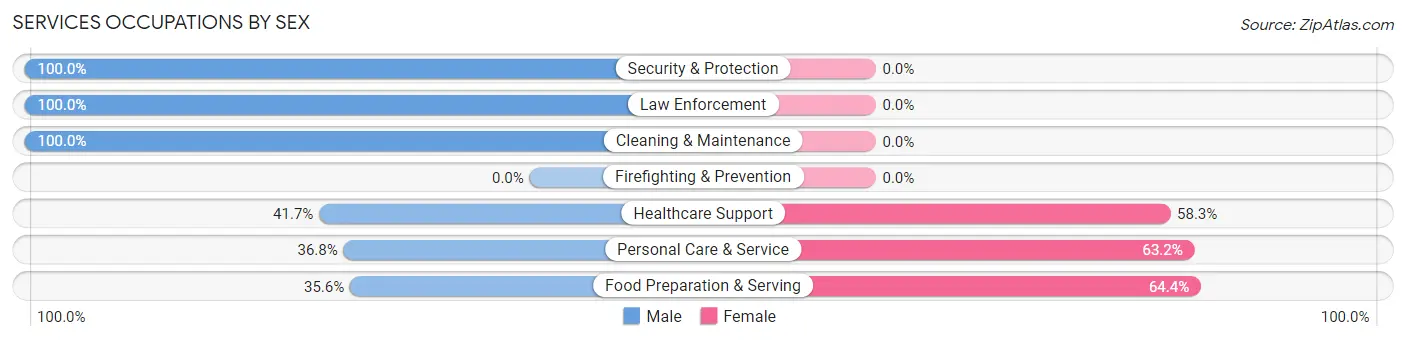
Services Occupations by Sex
Within the Services occupations in Dorneyville, the most male-oriented occupations are Security & Protection (100.0%), Law Enforcement (100.0%), and Cleaning & Maintenance (100.0%), while the most female-oriented occupations are Food Preparation & Serving (64.4%), Personal Care & Service (63.2%), and Healthcare Support (58.3%).
| Occupation | Male | Female |
| Healthcare Support | 10 (41.7%) | 14 (58.3%) |
| Security & Protection | 19 (100.0%) | 0 (0.0%) |
| Firefighting & Prevention | 0 (0.0%) | 0 (0.0%) |
| Law Enforcement | 19 (100.0%) | 0 (0.0%) |
| Food Preparation & Serving | 16 (35.6%) | 29 (64.4%) |
| Cleaning & Maintenance | 48 (100.0%) | 0 (0.0%) |
| Personal Care & Service | 21 (36.8%) | 36 (63.2%) |
| Total (Category) | 114 (59.1%) | 79 (40.9%) |
| Total (Overall) | 1,468 (60.7%) | 949 (39.3%) |
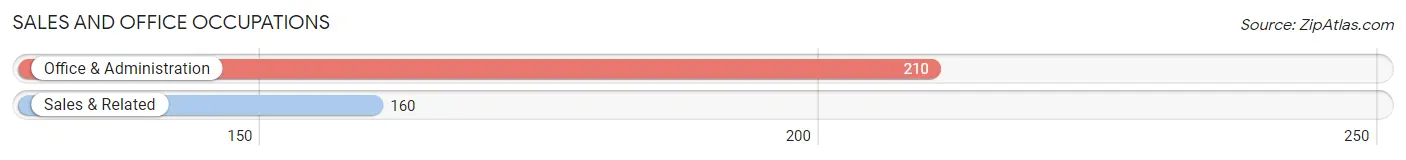
Sales and Office Occupations
The most common Sales and Office occupations in Dorneyville are Office & Administration (210 | 8.7%), and Sales & Related (160 | 6.6%).
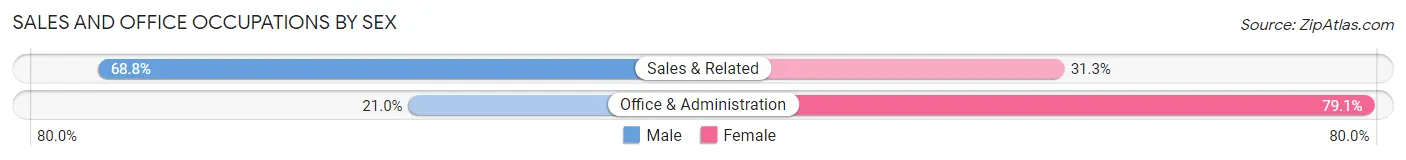
Sales and Office Occupations by Sex
| Occupation | Male | Female |
| Sales & Related | 110 (68.8%) | 50 (31.2%) |
| Office & Administration | 44 (20.9%) | 166 (79.0%) |
| Total (Category) | 154 (41.6%) | 216 (58.4%) |
| Total (Overall) | 1,468 (60.7%) | 949 (39.3%) |
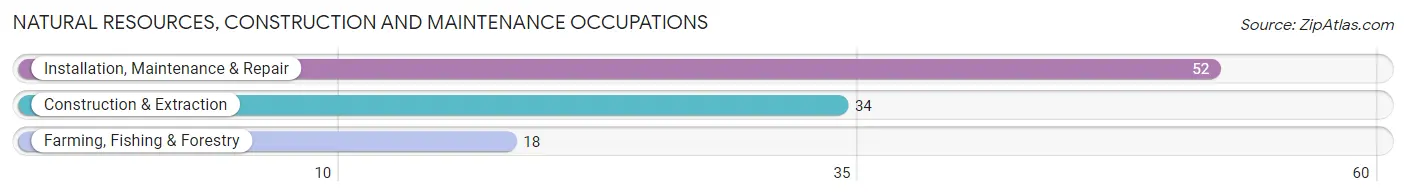
Natural Resources, Construction and Maintenance Occupations
The most common Natural Resources, Construction and Maintenance occupations in Dorneyville are Installation, Maintenance & Repair (52 | 2.1%), Construction & Extraction (34 | 1.4%), and Farming, Fishing & Forestry (18 | 0.7%).
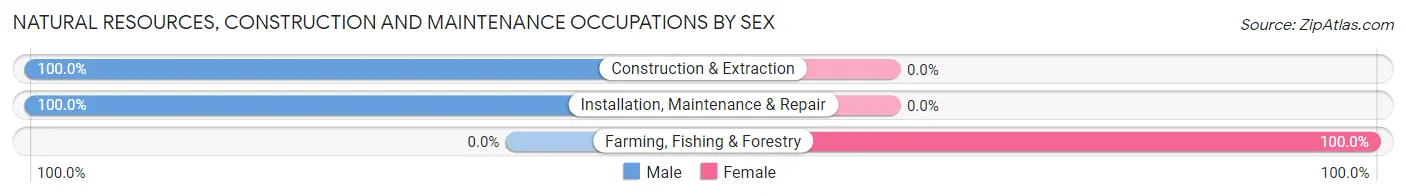
Natural Resources, Construction and Maintenance Occupations by Sex
| Occupation | Male | Female |
| Farming, Fishing & Forestry | 0 (0.0%) | 18 (100.0%) |
| Construction & Extraction | 34 (100.0%) | 0 (0.0%) |
| Installation, Maintenance & Repair | 52 (100.0%) | 0 (0.0%) |
| Total (Category) | 86 (82.7%) | 18 (17.3%) |
| Total (Overall) | 1,468 (60.7%) | 949 (39.3%) |
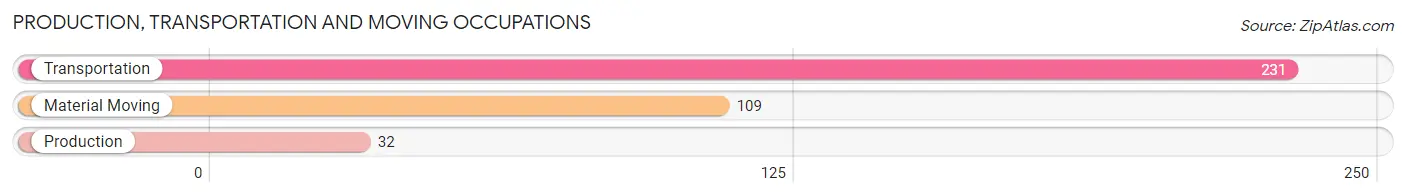
Production, Transportation and Moving Occupations
The most common Production, Transportation and Moving occupations in Dorneyville are Transportation (231 | 9.6%), Material Moving (109 | 4.5%), and Production (32 | 1.3%).
Production, Transportation and Moving Occupations by Sex
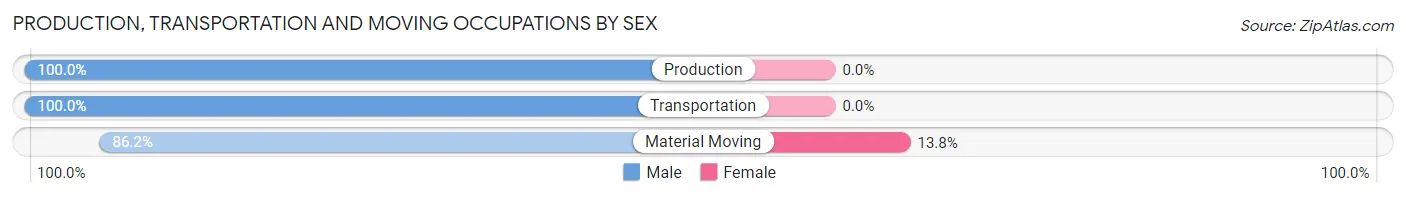
| Occupation | Male | Female |
| Production | 32 (100.0%) | 0 (0.0%) |
| Transportation | 231 (100.0%) | 0 (0.0%) |
| Material Moving | 94 (86.2%) | 15 (13.8%) |
| Total (Category) | 357 (96.0%) | 15 (4.0%) |
| Total (Overall) | 1,468 (60.7%) | 949 (39.3%) |
Employment Industries by Sex in Dorneyville
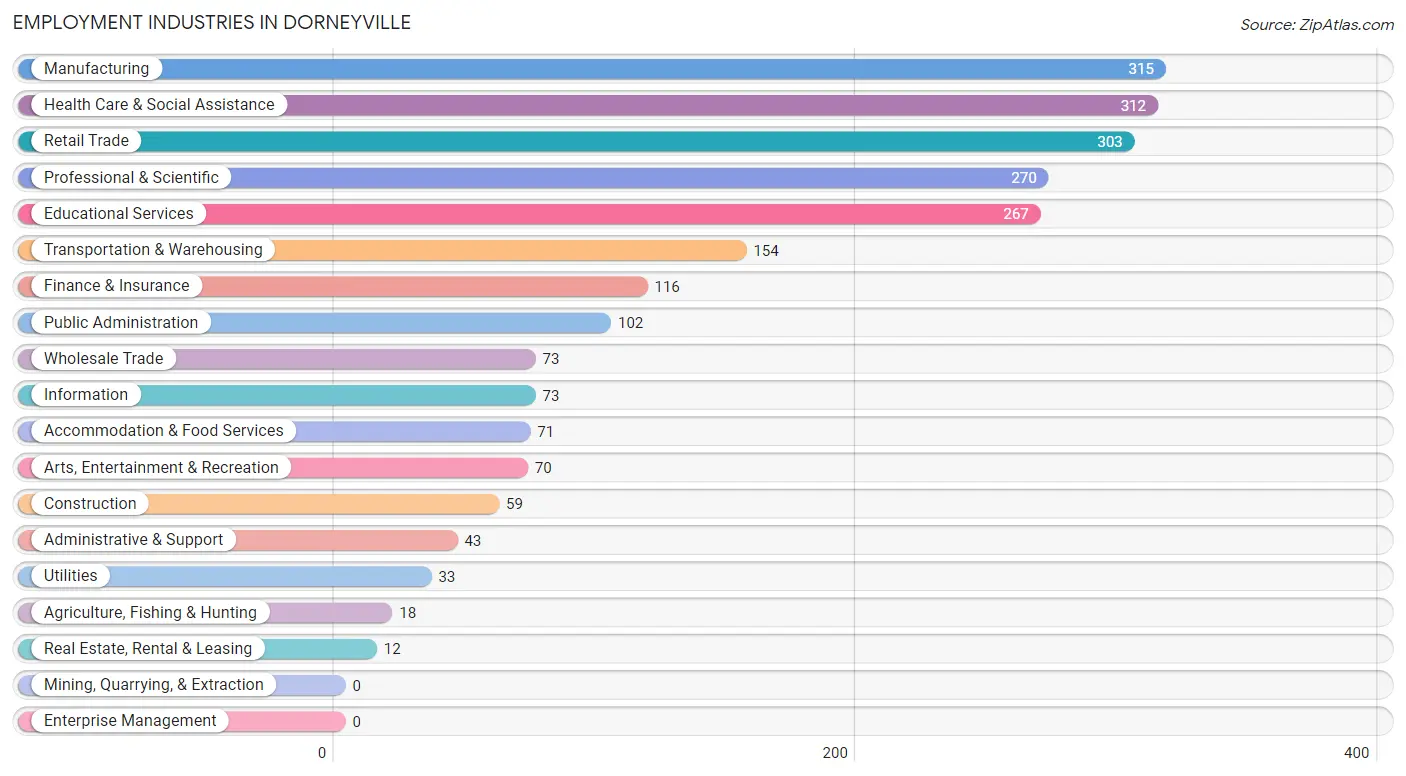
Employment Industries in Dorneyville
The major employment industries in Dorneyville include Manufacturing (315 | 13.0%), Health Care & Social Assistance (312 | 12.9%), Retail Trade (303 | 12.5%), Professional & Scientific (270 | 11.2%), and Educational Services (267 | 11.1%).
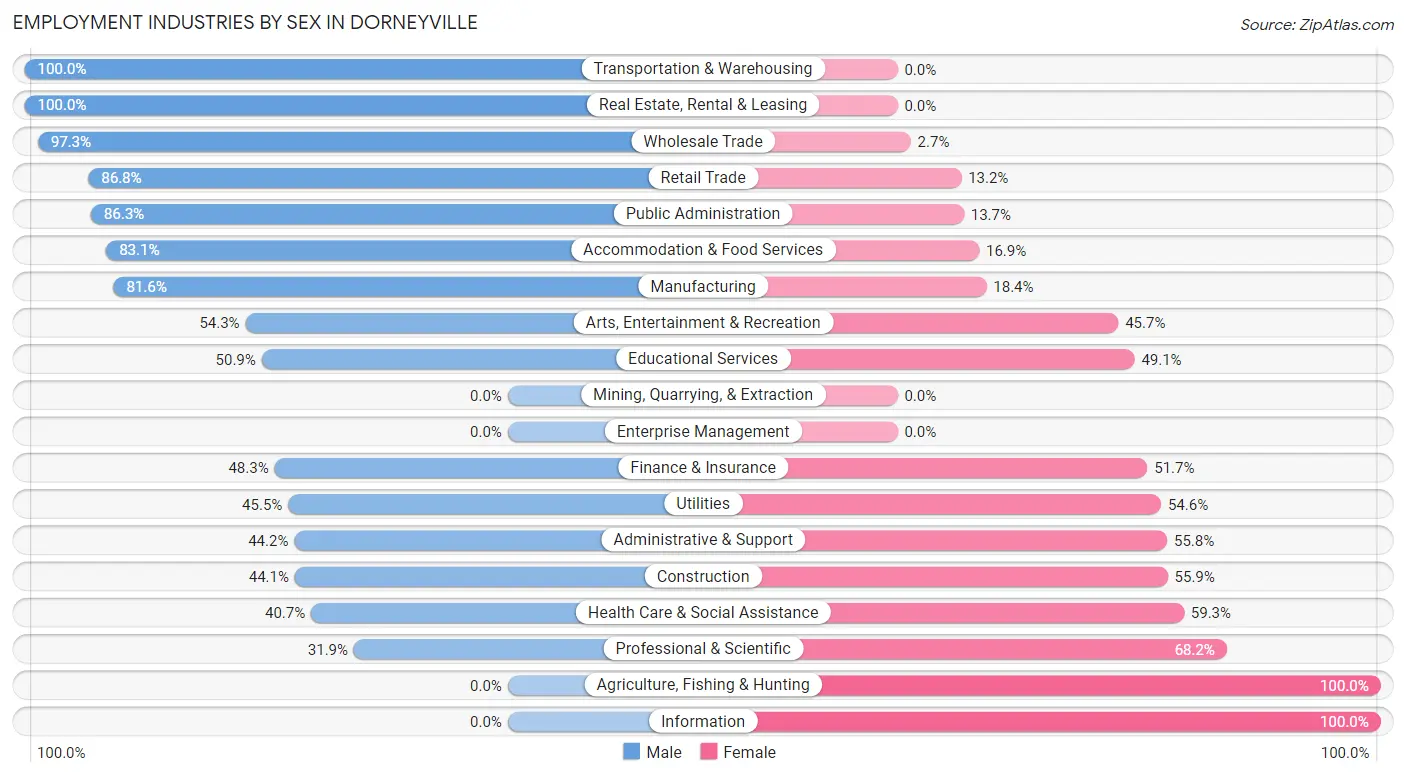
Employment Industries by Sex in Dorneyville
The Dorneyville industries that see more men than women are Transportation & Warehousing (100.0%), Real Estate, Rental & Leasing (100.0%), and Wholesale Trade (97.3%), whereas the industries that tend to have a higher number of women are Agriculture, Fishing & Hunting (100.0%), Information (100.0%), and Professional & Scientific (68.1%).
| Industry | Male | Female |
| Agriculture, Fishing & Hunting | 0 (0.0%) | 18 (100.0%) |
| Mining, Quarrying, & Extraction | 0 (0.0%) | 0 (0.0%) |
| Construction | 26 (44.1%) | 33 (55.9%) |
| Manufacturing | 257 (81.6%) | 58 (18.4%) |
| Wholesale Trade | 71 (97.3%) | 2 (2.7%) |
| Retail Trade | 263 (86.8%) | 40 (13.2%) |
| Transportation & Warehousing | 154 (100.0%) | 0 (0.0%) |
| Utilities | 15 (45.5%) | 18 (54.5%) |
| Information | 0 (0.0%) | 73 (100.0%) |
| Finance & Insurance | 56 (48.3%) | 60 (51.7%) |
| Real Estate, Rental & Leasing | 12 (100.0%) | 0 (0.0%) |
| Professional & Scientific | 86 (31.9%) | 184 (68.1%) |
| Enterprise Management | 0 (0.0%) | 0 (0.0%) |
| Administrative & Support | 19 (44.2%) | 24 (55.8%) |
| Educational Services | 136 (50.9%) | 131 (49.1%) |
| Health Care & Social Assistance | 127 (40.7%) | 185 (59.3%) |
| Arts, Entertainment & Recreation | 38 (54.3%) | 32 (45.7%) |
| Accommodation & Food Services | 59 (83.1%) | 12 (16.9%) |
| Public Administration | 88 (86.3%) | 14 (13.7%) |
| Total | 1,468 (60.7%) | 949 (39.3%) |
Education in Dorneyville
School Enrollment in Dorneyville
The most common levels of schooling among the 1,332 students in Dorneyville are middle school (435 | 32.7%), college / undergraduate (285 | 21.4%), and elementary school (251 | 18.8%).
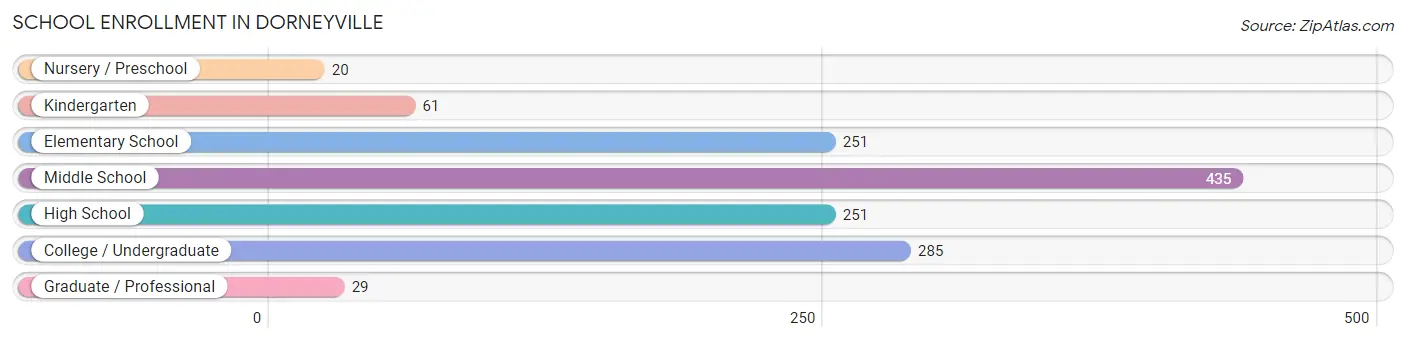
| School Level | # Students | % Students |
| Nursery / Preschool | 20 | 1.5% |
| Kindergarten | 61 | 4.6% |
| Elementary School | 251 | 18.8% |
| Middle School | 435 | 32.7% |
| High School | 251 | 18.8% |
| College / Undergraduate | 285 | 21.4% |
| Graduate / Professional | 29 | 2.2% |
| Total | 1,332 | 100.0% |
School Enrollment by Age by Funding Source in Dorneyville
Out of a total of 1,332 students who are enrolled in schools in Dorneyville, 232 (17.4%) attend a private institution, while the remaining 1,100 (82.6%) are enrolled in public schools. The age group of 3 to 4 year olds has the highest likelihood of being enrolled in private schools, with 20 (100.0% in the age bracket) enrolled. Conversely, the age group of 10 to 14 year olds has the lowest likelihood of being enrolled in a private school, with 461 (91.3% in the age bracket) attending a public institution.
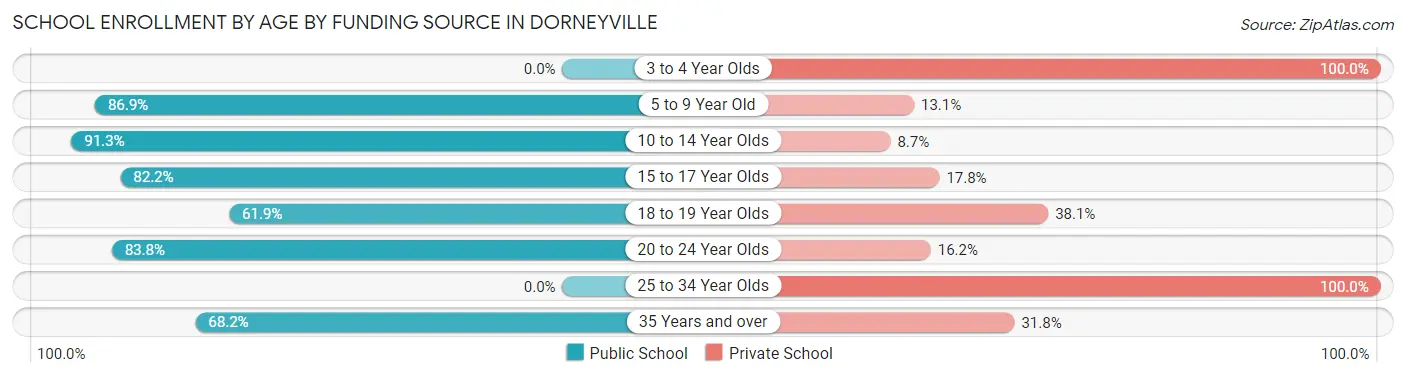
| Age Bracket | Public School | Private School |
| 3 to 4 Year Olds | 0 (0.0%) | 20 (100.0%) |
| 5 to 9 Year Old | 212 (86.9%) | 32 (13.1%) |
| 10 to 14 Year Olds | 461 (91.3%) | 44 (8.7%) |
| 15 to 17 Year Olds | 198 (82.2%) | 43 (17.8%) |
| 18 to 19 Year Olds | 39 (61.9%) | 24 (38.1%) |
| 20 to 24 Year Olds | 160 (83.8%) | 31 (16.2%) |
| 25 to 34 Year Olds | 0 (0.0%) | 24 (100.0%) |
| 35 Years and over | 30 (68.2%) | 14 (31.8%) |
| Total | 1,100 (82.6%) | 232 (17.4%) |
Educational Attainment by Field of Study in Dorneyville
Business (423 | 20.2%), education (311 | 14.8%), computers & mathematics (167 | 8.0%), science & technology (165 | 7.9%), and psychology (163 | 7.8%) are the most common fields of study among 2,099 individuals in Dorneyville who have obtained a bachelor's degree or higher.
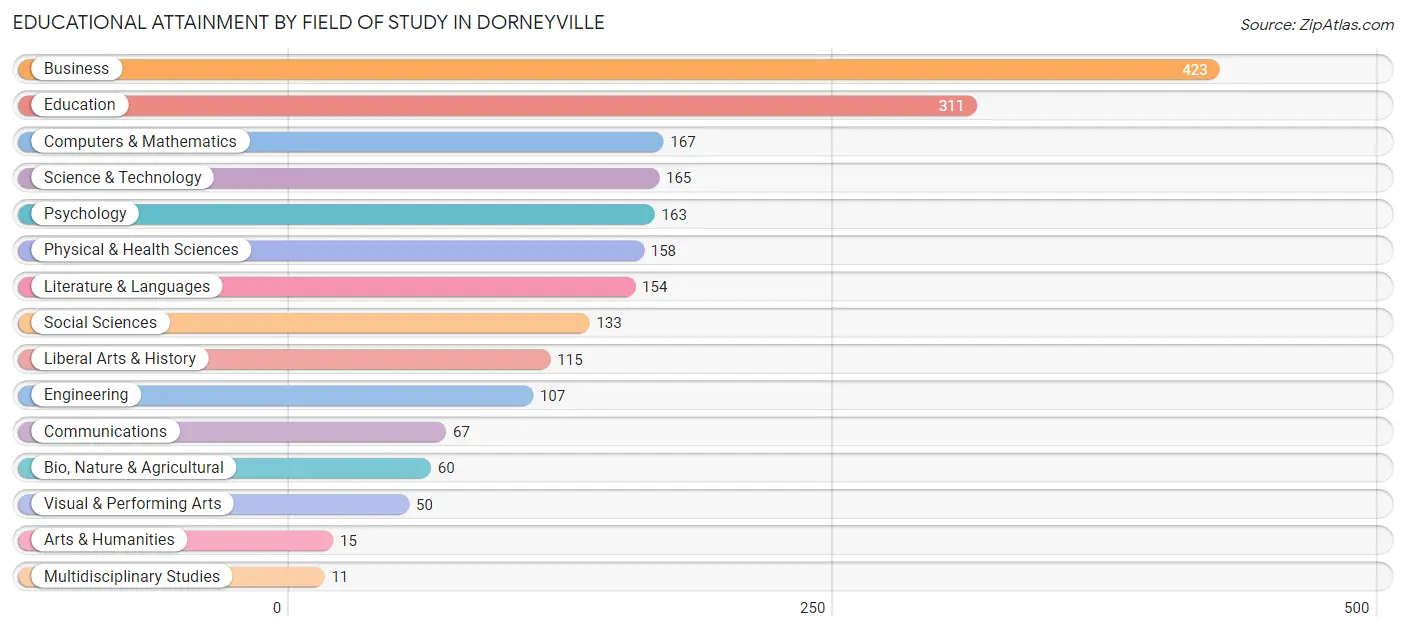
| Field of Study | # Graduates | % Graduates |
| Computers & Mathematics | 167 | 8.0% |
| Bio, Nature & Agricultural | 60 | 2.9% |
| Physical & Health Sciences | 158 | 7.5% |
| Psychology | 163 | 7.8% |
| Social Sciences | 133 | 6.3% |
| Engineering | 107 | 5.1% |
| Multidisciplinary Studies | 11 | 0.5% |
| Science & Technology | 165 | 7.9% |
| Business | 423 | 20.2% |
| Education | 311 | 14.8% |
| Literature & Languages | 154 | 7.3% |
| Liberal Arts & History | 115 | 5.5% |
| Visual & Performing Arts | 50 | 2.4% |
| Communications | 67 | 3.2% |
| Arts & Humanities | 15 | 0.7% |
| Total | 2,099 | 100.0% |
Transportation & Commute in Dorneyville
Vehicle Availability by Sex in Dorneyville
The most prevalent vehicle ownership categories in Dorneyville are males with 2 vehicles (866, accounting for 60.3%) and females with 2 vehicles (459, making up 91.2%).
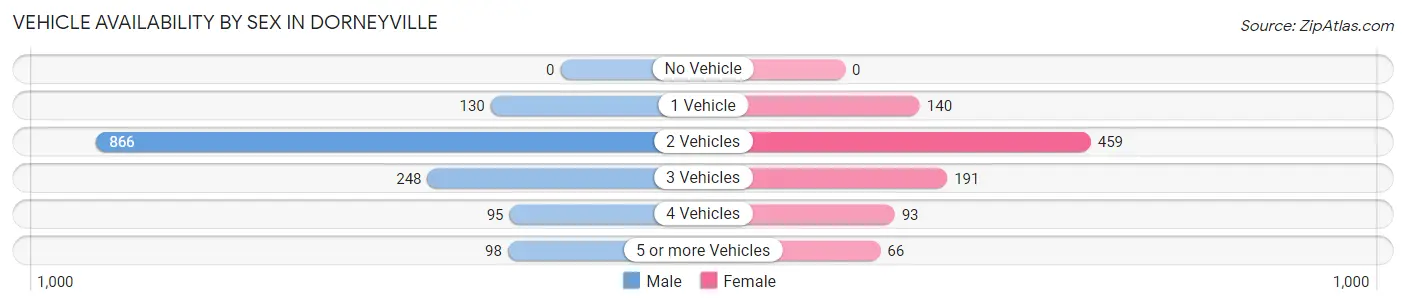
| Vehicles Available | Male | Female |
| No Vehicle | 0 (0.0%) | 0 (0.0%) |
| 1 Vehicle | 130 (9.0%) | 140 (14.7%) |
| 2 Vehicles | 866 (60.3%) | 459 (48.4%) |
| 3 Vehicles | 248 (17.3%) | 191 (20.1%) |
| 4 Vehicles | 95 (6.6%) | 93 (9.8%) |
| 5 or more Vehicles | 98 (6.8%) | 66 (7.0%) |
| Total | 1,437 (100.0%) | 949 (100.0%) |
Commute Time in Dorneyville
The most frequently occuring commute durations in Dorneyville are 15 to 19 minutes (501 commuters, 23.8%), 5 to 9 minutes (320 commuters, 15.2%), and 20 to 24 minutes (309 commuters, 14.7%).
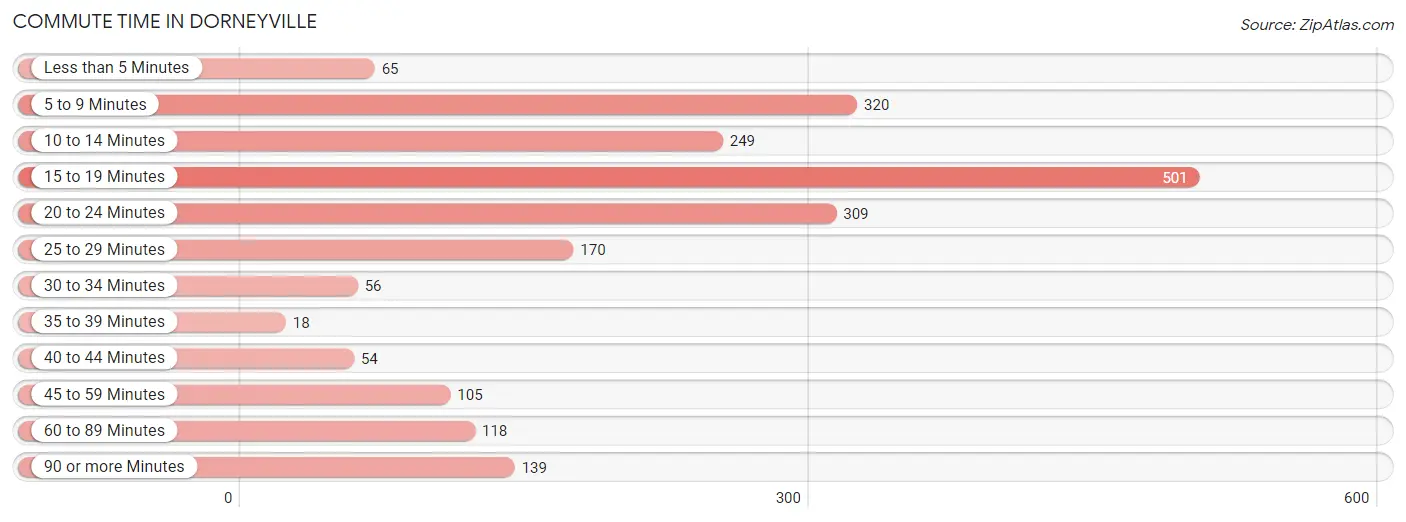
| Commute Time | # Commuters | % Commuters |
| Less than 5 Minutes | 65 | 3.1% |
| 5 to 9 Minutes | 320 | 15.2% |
| 10 to 14 Minutes | 249 | 11.8% |
| 15 to 19 Minutes | 501 | 23.8% |
| 20 to 24 Minutes | 309 | 14.7% |
| 25 to 29 Minutes | 170 | 8.1% |
| 30 to 34 Minutes | 56 | 2.7% |
| 35 to 39 Minutes | 18 | 0.9% |
| 40 to 44 Minutes | 54 | 2.6% |
| 45 to 59 Minutes | 105 | 5.0% |
| 60 to 89 Minutes | 118 | 5.6% |
| 90 or more Minutes | 139 | 6.6% |
Commute Time by Sex in Dorneyville
The most common commute times in Dorneyville are 15 to 19 minutes (344 commuters, 26.4%) for males and 5 to 9 minutes (204 commuters, 25.4%) for females.
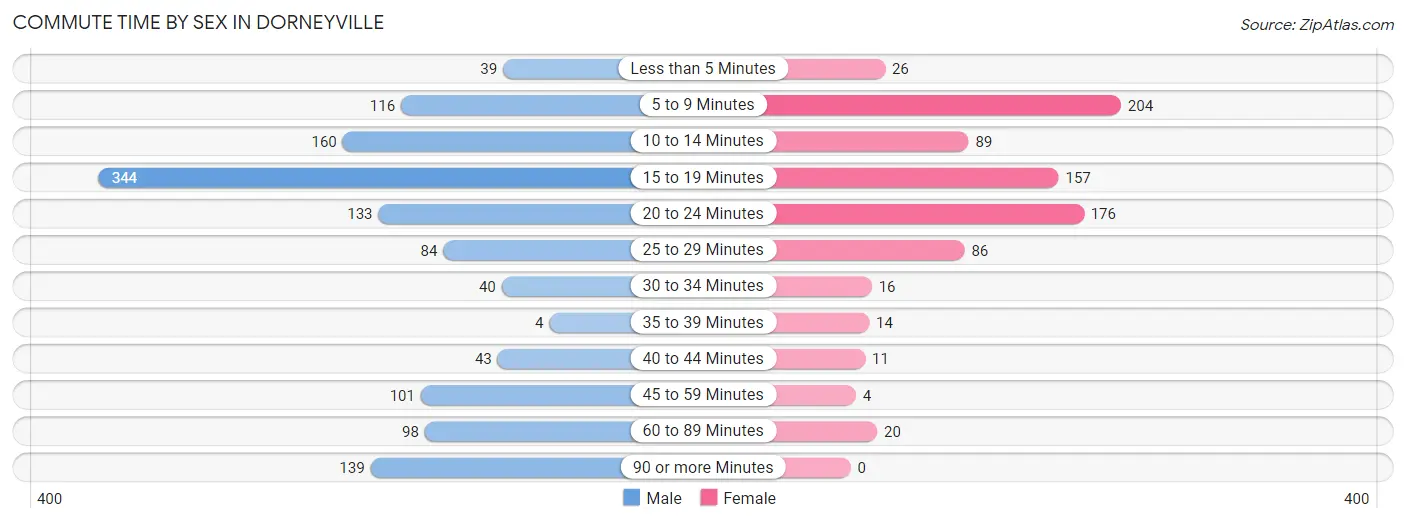
| Commute Time | Male | Female |
| Less than 5 Minutes | 39 (3.0%) | 26 (3.2%) |
| 5 to 9 Minutes | 116 (8.9%) | 204 (25.4%) |
| 10 to 14 Minutes | 160 (12.3%) | 89 (11.1%) |
| 15 to 19 Minutes | 344 (26.4%) | 157 (19.6%) |
| 20 to 24 Minutes | 133 (10.2%) | 176 (21.9%) |
| 25 to 29 Minutes | 84 (6.5%) | 86 (10.7%) |
| 30 to 34 Minutes | 40 (3.1%) | 16 (2.0%) |
| 35 to 39 Minutes | 4 (0.3%) | 14 (1.7%) |
| 40 to 44 Minutes | 43 (3.3%) | 11 (1.4%) |
| 45 to 59 Minutes | 101 (7.8%) | 4 (0.5%) |
| 60 to 89 Minutes | 98 (7.5%) | 20 (2.5%) |
| 90 or more Minutes | 139 (10.7%) | 0 (0.0%) |
Time of Departure to Work by Sex in Dorneyville
The most frequent times of departure to work in Dorneyville are 8:00 AM to 8:29 AM (157, 12.1%) for males and 8:00 AM to 8:29 AM (204, 25.4%) for females.
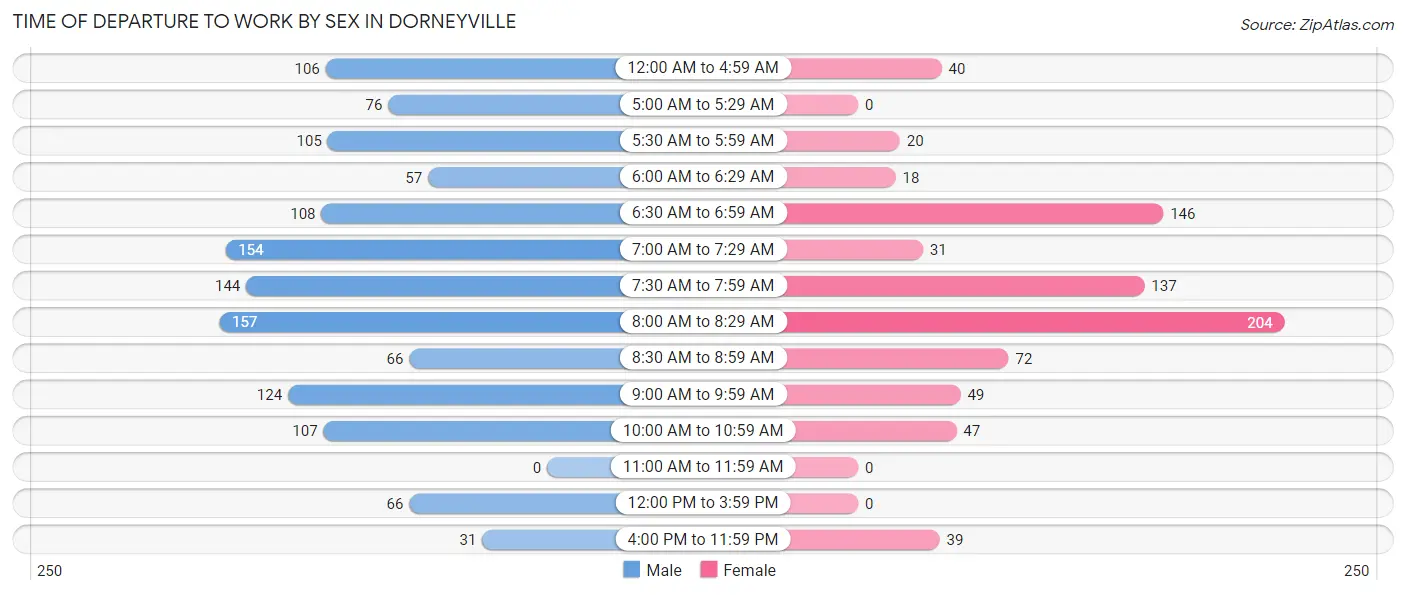
| Time of Departure | Male | Female |
| 12:00 AM to 4:59 AM | 106 (8.2%) | 40 (5.0%) |
| 5:00 AM to 5:29 AM | 76 (5.8%) | 0 (0.0%) |
| 5:30 AM to 5:59 AM | 105 (8.1%) | 20 (2.5%) |
| 6:00 AM to 6:29 AM | 57 (4.4%) | 18 (2.2%) |
| 6:30 AM to 6:59 AM | 108 (8.3%) | 146 (18.2%) |
| 7:00 AM to 7:29 AM | 154 (11.8%) | 31 (3.9%) |
| 7:30 AM to 7:59 AM | 144 (11.1%) | 137 (17.1%) |
| 8:00 AM to 8:29 AM | 157 (12.1%) | 204 (25.4%) |
| 8:30 AM to 8:59 AM | 66 (5.1%) | 72 (9.0%) |
| 9:00 AM to 9:59 AM | 124 (9.5%) | 49 (6.1%) |
| 10:00 AM to 10:59 AM | 107 (8.2%) | 47 (5.9%) |
| 11:00 AM to 11:59 AM | 0 (0.0%) | 0 (0.0%) |
| 12:00 PM to 3:59 PM | 66 (5.1%) | 0 (0.0%) |
| 4:00 PM to 11:59 PM | 31 (2.4%) | 39 (4.9%) |
| Total | 1,301 (100.0%) | 803 (100.0%) |
Housing Occupancy in Dorneyville
Occupancy by Ownership in Dorneyville
Of the total 1,895 dwellings in Dorneyville, owner-occupied units account for 1,733 (91.4%), while renter-occupied units make up 162 (8.6%).
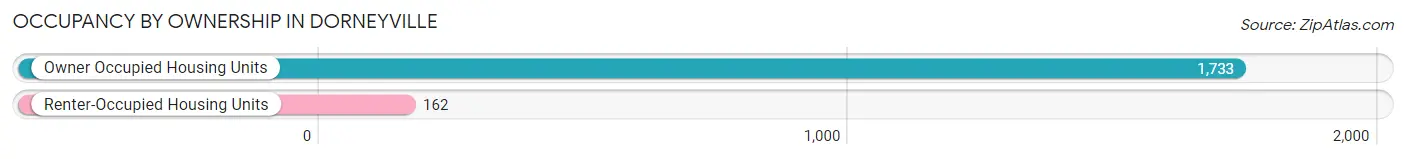
| Occupancy | # Housing Units | % Housing Units |
| Owner Occupied Housing Units | 1,733 | 91.4% |
| Renter-Occupied Housing Units | 162 | 8.6% |
| Total Occupied Housing Units | 1,895 | 100.0% |
Occupancy by Household Size in Dorneyville
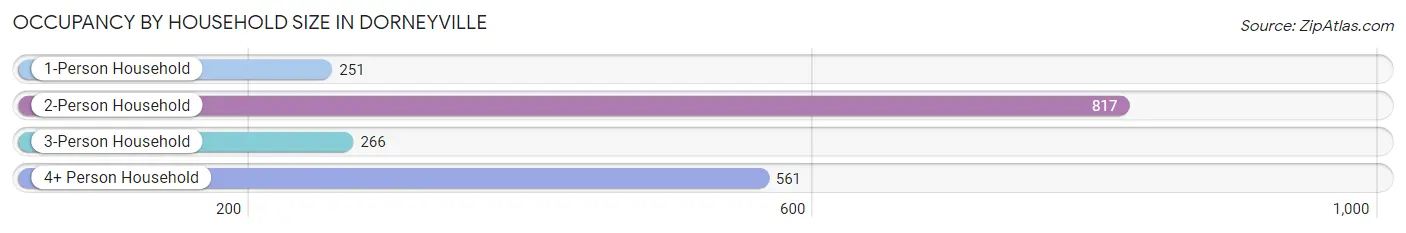
| Household Size | # Housing Units | % Housing Units |
| 1-Person Household | 251 | 13.3% |
| 2-Person Household | 817 | 43.1% |
| 3-Person Household | 266 | 14.0% |
| 4+ Person Household | 561 | 29.6% |
| Total Housing Units | 1,895 | 100.0% |
Occupancy by Ownership by Household Size in Dorneyville
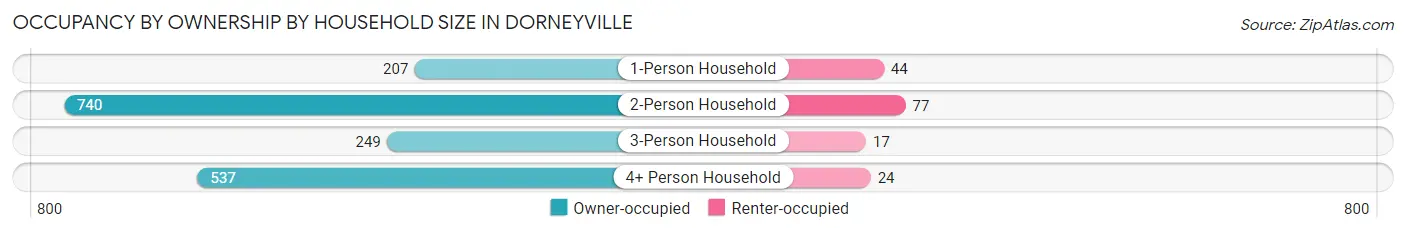
| Household Size | Owner-occupied | Renter-occupied |
| 1-Person Household | 207 (82.5%) | 44 (17.5%) |
| 2-Person Household | 740 (90.6%) | 77 (9.4%) |
| 3-Person Household | 249 (93.6%) | 17 (6.4%) |
| 4+ Person Household | 537 (95.7%) | 24 (4.3%) |
| Total Housing Units | 1,733 (91.4%) | 162 (8.6%) |
Occupancy by Educational Attainment in Dorneyville
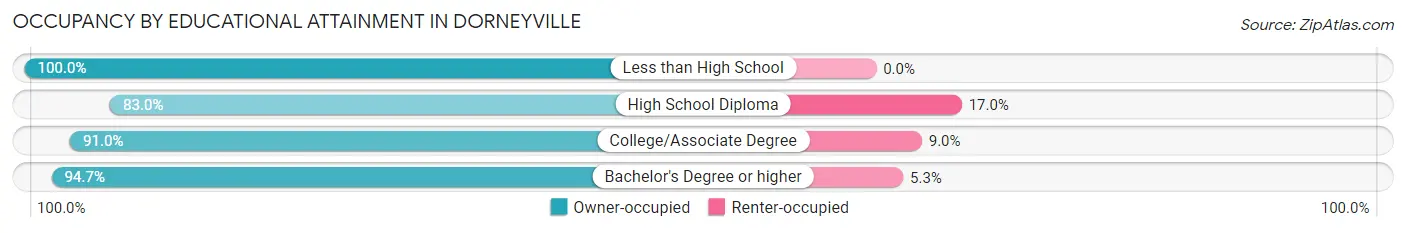
| Household Size | Owner-occupied | Renter-occupied |
| Less than High School | 2 (100.0%) | 0 (0.0%) |
| High School Diploma | 333 (83.0%) | 68 (17.0%) |
| College/Associate Degree | 352 (91.0%) | 35 (9.0%) |
| Bachelor's Degree or higher | 1,046 (94.7%) | 59 (5.3%) |
Occupancy by Age of Householder in Dorneyville
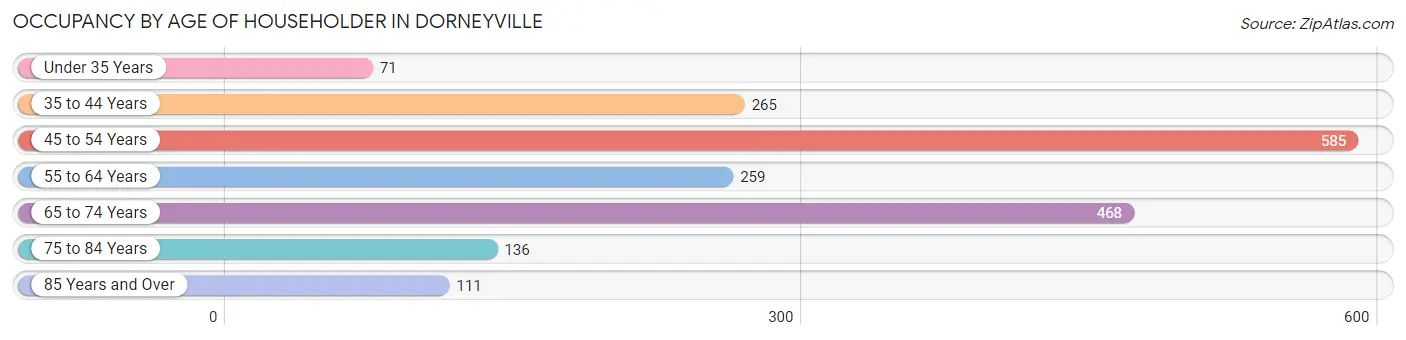
| Age Bracket | # Households | % Households |
| Under 35 Years | 71 | 3.7% |
| 35 to 44 Years | 265 | 14.0% |
| 45 to 54 Years | 585 | 30.9% |
| 55 to 64 Years | 259 | 13.7% |
| 65 to 74 Years | 468 | 24.7% |
| 75 to 84 Years | 136 | 7.2% |
| 85 Years and Over | 111 | 5.9% |
| Total | 1,895 | 100.0% |
Housing Finances in Dorneyville
Median Income by Occupancy in Dorneyville
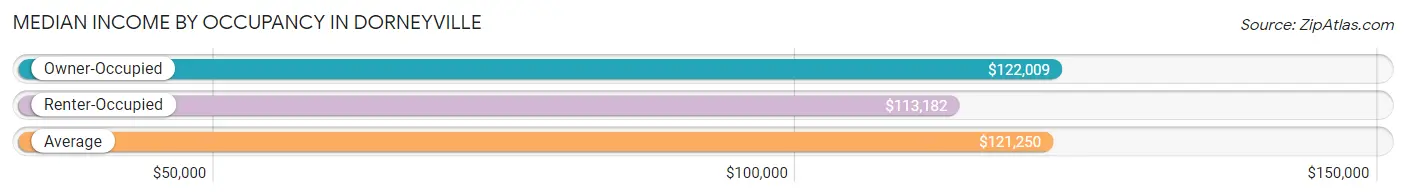
| Occupancy Type | # Households | Median Income |
| Owner-Occupied | 1,733 (91.4%) | $122,009 |
| Renter-Occupied | 162 (8.6%) | $113,182 |
| Average | 1,895 (100.0%) | $121,250 |
Occupancy by Householder Income Bracket in Dorneyville
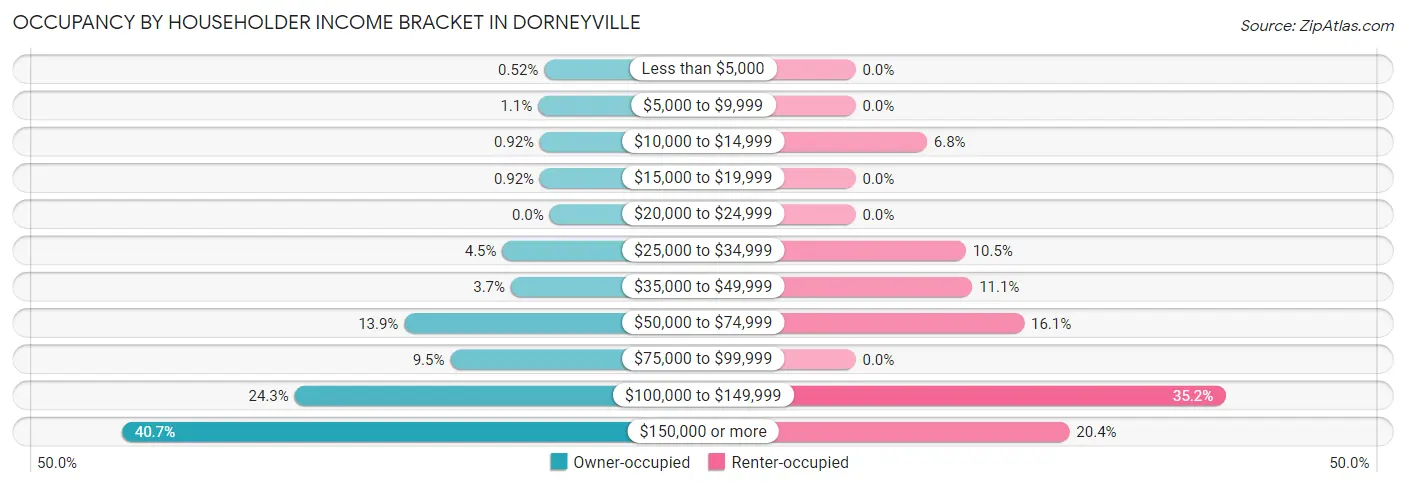
| Income Bracket | Owner-occupied | Renter-occupied |
| Less than $5,000 | 9 (0.5%) | 0 (0.0%) |
| $5,000 to $9,999 | 19 (1.1%) | 0 (0.0%) |
| $10,000 to $14,999 | 16 (0.9%) | 11 (6.8%) |
| $15,000 to $19,999 | 16 (0.9%) | 0 (0.0%) |
| $20,000 to $24,999 | 0 (0.0%) | 0 (0.0%) |
| $25,000 to $34,999 | 78 (4.5%) | 17 (10.5%) |
| $35,000 to $49,999 | 64 (3.7%) | 18 (11.1%) |
| $50,000 to $74,999 | 240 (13.9%) | 26 (16.1%) |
| $75,000 to $99,999 | 164 (9.5%) | 0 (0.0%) |
| $100,000 to $149,999 | 421 (24.3%) | 57 (35.2%) |
| $150,000 or more | 706 (40.7%) | 33 (20.4%) |
| Total | 1,733 (100.0%) | 162 (100.0%) |
Monthly Housing Cost Tiers in Dorneyville
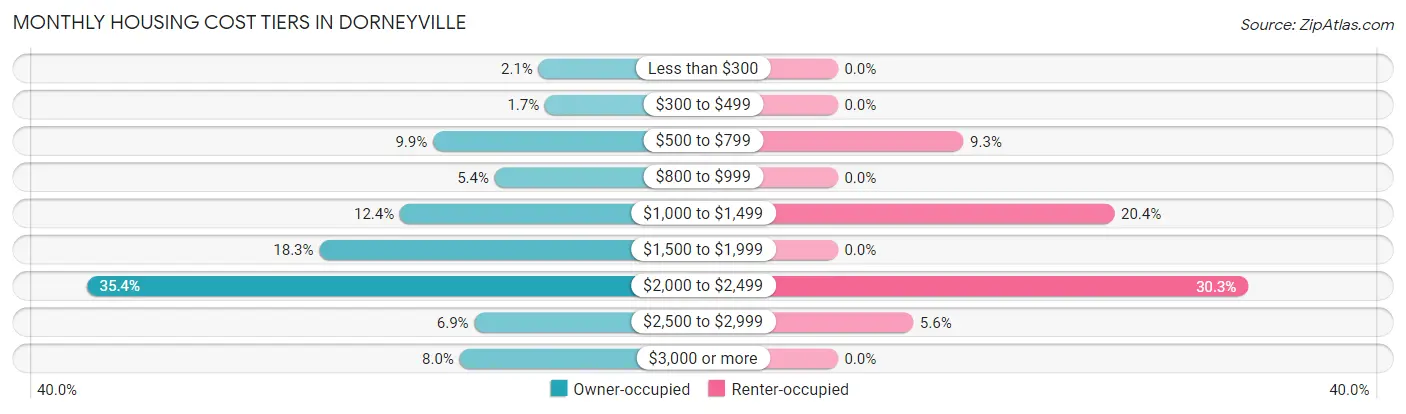
| Monthly Cost | Owner-occupied | Renter-occupied |
| Less than $300 | 37 (2.1%) | 0 (0.0%) |
| $300 to $499 | 29 (1.7%) | 0 (0.0%) |
| $500 to $799 | 172 (9.9%) | 15 (9.3%) |
| $800 to $999 | 93 (5.4%) | 0 (0.0%) |
| $1,000 to $1,499 | 214 (12.3%) | 33 (20.4%) |
| $1,500 to $1,999 | 317 (18.3%) | 0 (0.0%) |
| $2,000 to $2,499 | 614 (35.4%) | 49 (30.2%) |
| $2,500 to $2,999 | 119 (6.9%) | 9 (5.6%) |
| $3,000 or more | 138 (8.0%) | 0 (0.0%) |
| Total | 1,733 (100.0%) | 162 (100.0%) |
Physical Housing Characteristics in Dorneyville
Housing Structures in Dorneyville
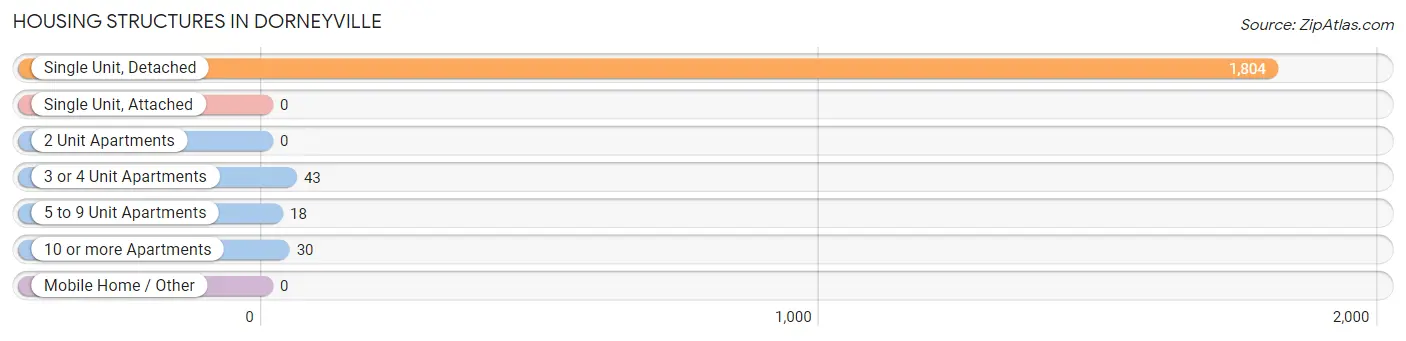
| Structure Type | # Housing Units | % Housing Units |
| Single Unit, Detached | 1,804 | 95.2% |
| Single Unit, Attached | 0 | 0.0% |
| 2 Unit Apartments | 0 | 0.0% |
| 3 or 4 Unit Apartments | 43 | 2.3% |
| 5 to 9 Unit Apartments | 18 | 0.9% |
| 10 or more Apartments | 30 | 1.6% |
| Mobile Home / Other | 0 | 0.0% |
| Total | 1,895 | 100.0% |
Housing Structures by Occupancy in Dorneyville
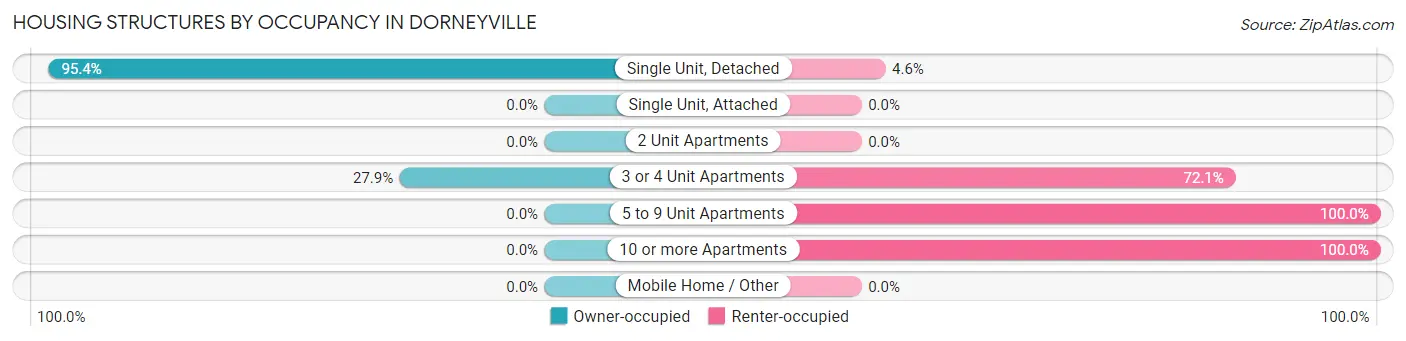
| Structure Type | Owner-occupied | Renter-occupied |
| Single Unit, Detached | 1,721 (95.4%) | 83 (4.6%) |
| Single Unit, Attached | 0 (0.0%) | 0 (0.0%) |
| 2 Unit Apartments | 0 (0.0%) | 0 (0.0%) |
| 3 or 4 Unit Apartments | 12 (27.9%) | 31 (72.1%) |
| 5 to 9 Unit Apartments | 0 (0.0%) | 18 (100.0%) |
| 10 or more Apartments | 0 (0.0%) | 30 (100.0%) |
| Mobile Home / Other | 0 (0.0%) | 0 (0.0%) |
| Total | 1,733 (91.4%) | 162 (8.6%) |
Housing Structures by Number of Rooms in Dorneyville
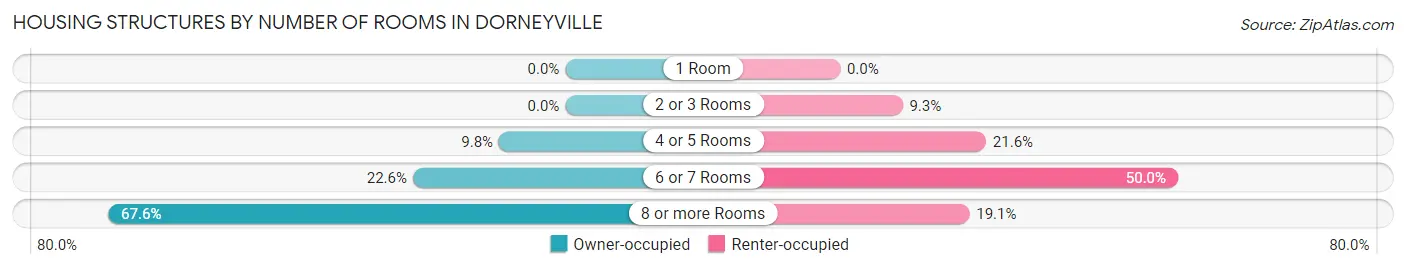
| Number of Rooms | Owner-occupied | Renter-occupied |
| 1 Room | 0 (0.0%) | 0 (0.0%) |
| 2 or 3 Rooms | 0 (0.0%) | 15 (9.3%) |
| 4 or 5 Rooms | 170 (9.8%) | 35 (21.6%) |
| 6 or 7 Rooms | 391 (22.6%) | 81 (50.0%) |
| 8 or more Rooms | 1,172 (67.6%) | 31 (19.1%) |
| Total | 1,733 (100.0%) | 162 (100.0%) |
Housing Structure by Heating Type in Dorneyville
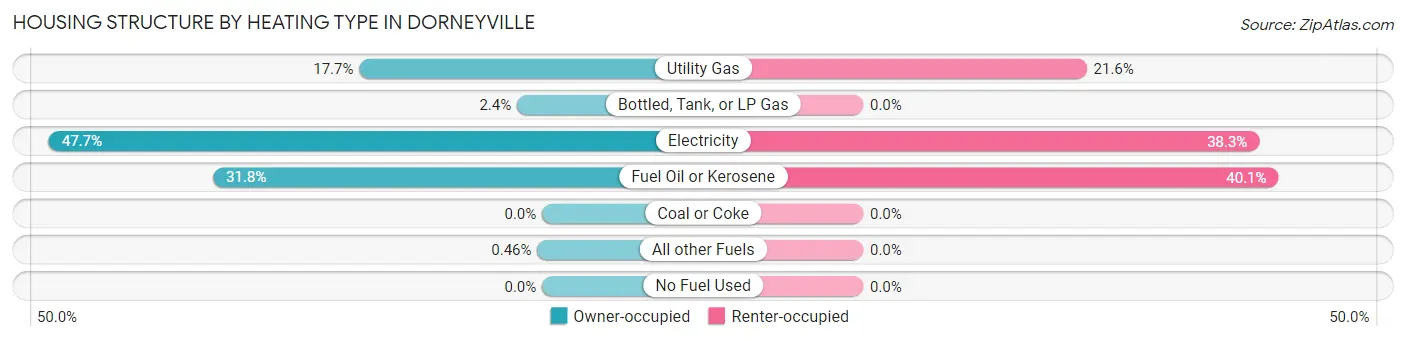
| Heating Type | Owner-occupied | Renter-occupied |
| Utility Gas | 306 (17.7%) | 35 (21.6%) |
| Bottled, Tank, or LP Gas | 42 (2.4%) | 0 (0.0%) |
| Electricity | 826 (47.7%) | 62 (38.3%) |
| Fuel Oil or Kerosene | 551 (31.8%) | 65 (40.1%) |
| Coal or Coke | 0 (0.0%) | 0 (0.0%) |
| All other Fuels | 8 (0.5%) | 0 (0.0%) |
| No Fuel Used | 0 (0.0%) | 0 (0.0%) |
| Total | 1,733 (100.0%) | 162 (100.0%) |
Household Vehicle Usage in Dorneyville
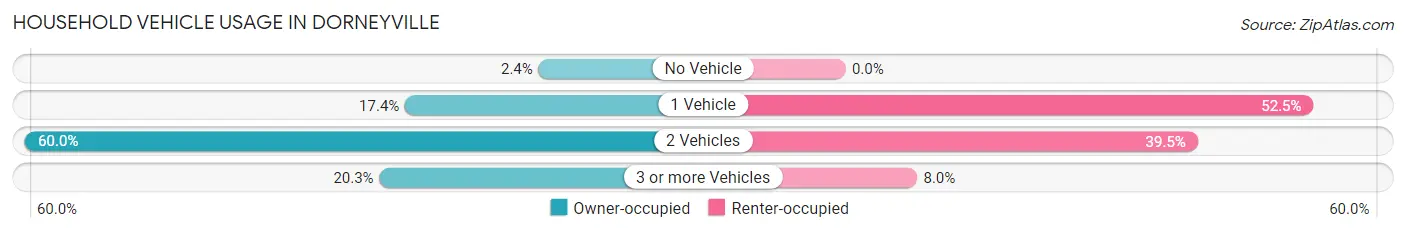
| Vehicles per Household | Owner-occupied | Renter-occupied |
| No Vehicle | 42 (2.4%) | 0 (0.0%) |
| 1 Vehicle | 301 (17.4%) | 85 (52.5%) |
| 2 Vehicles | 1,039 (60.0%) | 64 (39.5%) |
| 3 or more Vehicles | 351 (20.3%) | 13 (8.0%) |
| Total | 1,733 (100.0%) | 162 (100.0%) |
Real Estate & Mortgages in Dorneyville
Real Estate and Mortgage Overview in Dorneyville
| Characteristic | Without Mortgage | With Mortgage |
| Housing Units | 538 | 1,195 |
| Median Property Value | $329,100 | $349,900 |
| Median Household Income | $92,708 | $529 |
| Monthly Housing Costs | $889 | $121 |
| Real Estate Taxes | $6,218 | $6 |
Property Value by Mortgage Status in Dorneyville
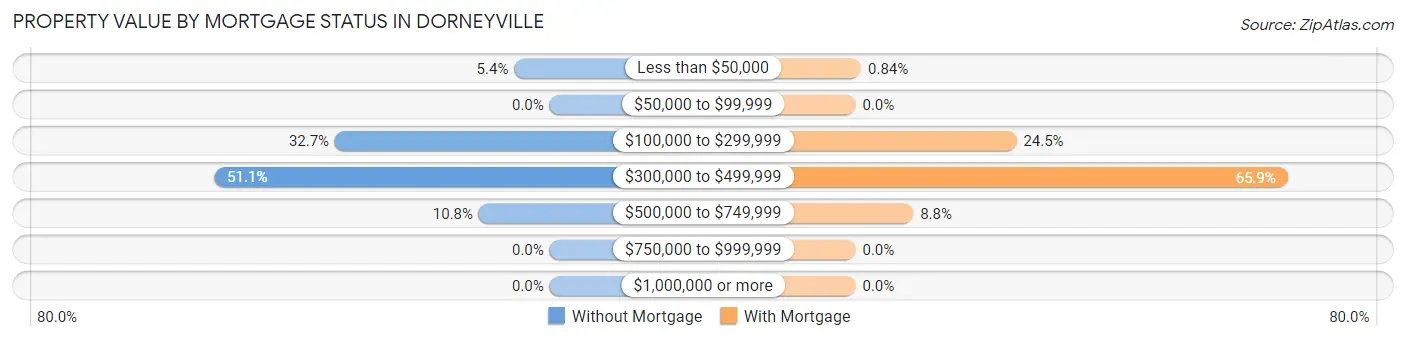
| Property Value | Without Mortgage | With Mortgage |
| Less than $50,000 | 29 (5.4%) | 10 (0.8%) |
| $50,000 to $99,999 | 0 (0.0%) | 0 (0.0%) |
| $100,000 to $299,999 | 176 (32.7%) | 293 (24.5%) |
| $300,000 to $499,999 | 275 (51.1%) | 787 (65.9%) |
| $500,000 to $749,999 | 58 (10.8%) | 105 (8.8%) |
| $750,000 to $999,999 | 0 (0.0%) | 0 (0.0%) |
| $1,000,000 or more | 0 (0.0%) | 0 (0.0%) |
| Total | 538 (100.0%) | 1,195 (100.0%) |
Household Income by Mortgage Status in Dorneyville
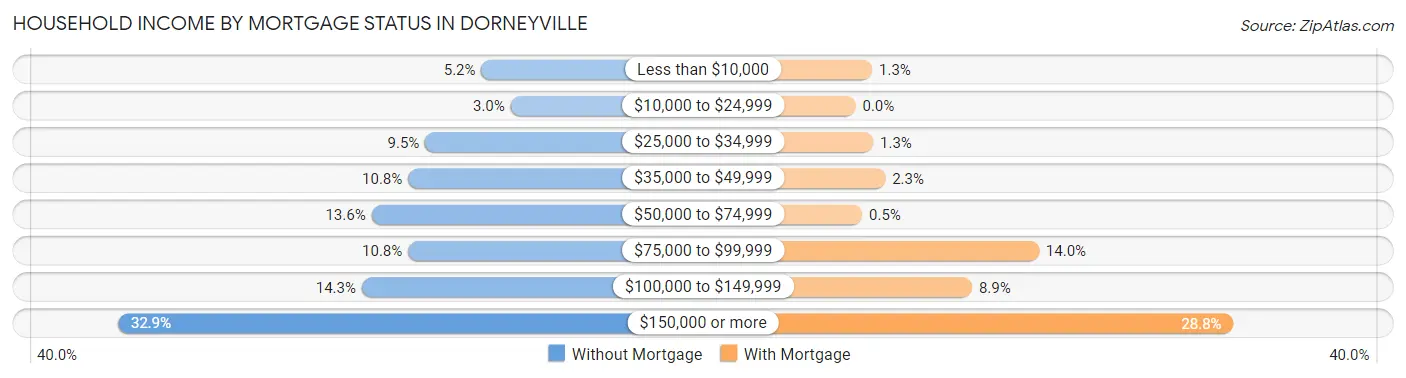
| Household Income | Without Mortgage | With Mortgage |
| Less than $10,000 | 28 (5.2%) | 15 (1.3%) |
| $10,000 to $24,999 | 16 (3.0%) | 0 (0.0%) |
| $25,000 to $34,999 | 51 (9.5%) | 16 (1.3%) |
| $35,000 to $49,999 | 58 (10.8%) | 27 (2.3%) |
| $50,000 to $74,999 | 73 (13.6%) | 6 (0.5%) |
| $75,000 to $99,999 | 58 (10.8%) | 167 (14.0%) |
| $100,000 to $149,999 | 77 (14.3%) | 106 (8.9%) |
| $150,000 or more | 177 (32.9%) | 344 (28.8%) |
| Total | 538 (100.0%) | 1,195 (100.0%) |
Property Value to Household Income Ratio in Dorneyville
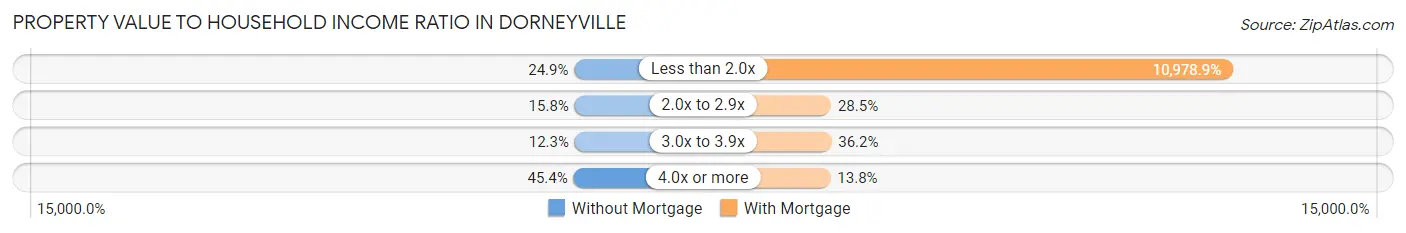
| Value-to-Income Ratio | Without Mortgage | With Mortgage |
| Less than 2.0x | 134 (24.9%) | 131,198 (10,978.9%) |
| 2.0x to 2.9x | 85 (15.8%) | 340 (28.4%) |
| 3.0x to 3.9x | 66 (12.3%) | 433 (36.2%) |
| 4.0x or more | 244 (45.4%) | 165 (13.8%) |
| Total | 538 (100.0%) | 1,195 (100.0%) |
Real Estate Taxes by Mortgage Status in Dorneyville
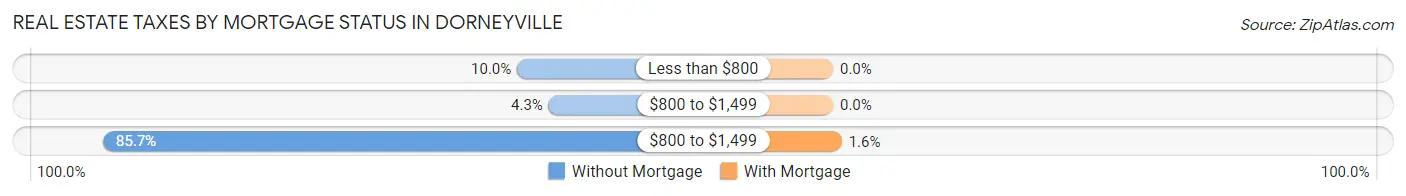
| Property Taxes | Without Mortgage | With Mortgage |
| Less than $800 | 54 (10.0%) | 0 (0.0%) |
| $800 to $1,499 | 23 (4.3%) | 0 (0.0%) |
| $800 to $1,499 | 461 (85.7%) | 19 (1.6%) |
| Total | 538 (100.0%) | 1,195 (100.0%) |
Health & Disability in Dorneyville
Health Insurance Coverage by Age in Dorneyville
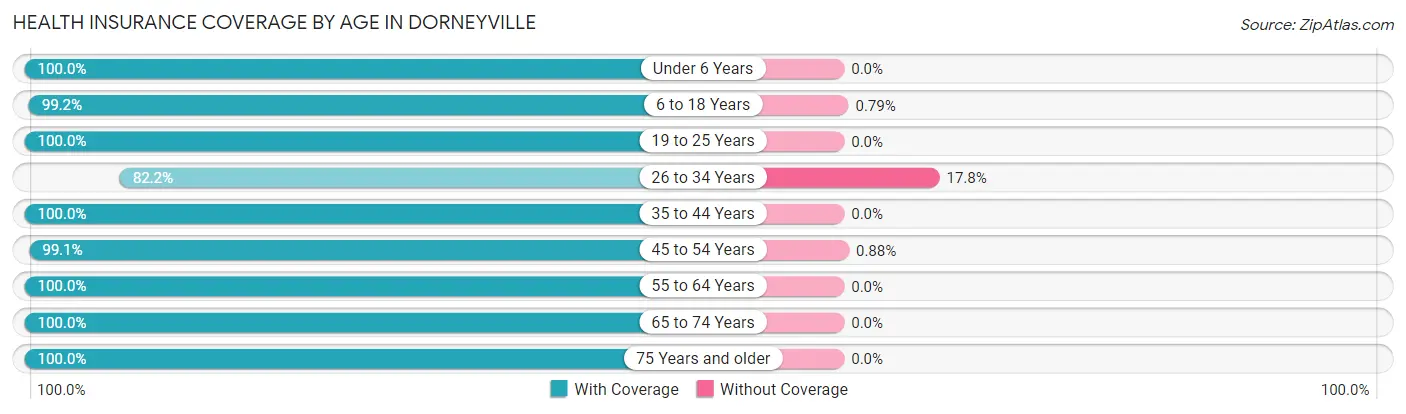
| Age Bracket | With Coverage | Without Coverage |
| Under 6 Years | 172 (100.0%) | 0 (0.0%) |
| 6 to 18 Years | 1,003 (99.2%) | 8 (0.8%) |
| 19 to 25 Years | 374 (100.0%) | 0 (0.0%) |
| 26 to 34 Years | 176 (82.2%) | 38 (17.8%) |
| 35 to 44 Years | 645 (100.0%) | 0 (0.0%) |
| 45 to 54 Years | 1,012 (99.1%) | 9 (0.9%) |
| 55 to 64 Years | 465 (100.0%) | 0 (0.0%) |
| 65 to 74 Years | 799 (100.0%) | 0 (0.0%) |
| 75 Years and older | 392 (100.0%) | 0 (0.0%) |
| Total | 5,038 (98.9%) | 55 (1.1%) |
Health Insurance Coverage by Citizenship Status in Dorneyville
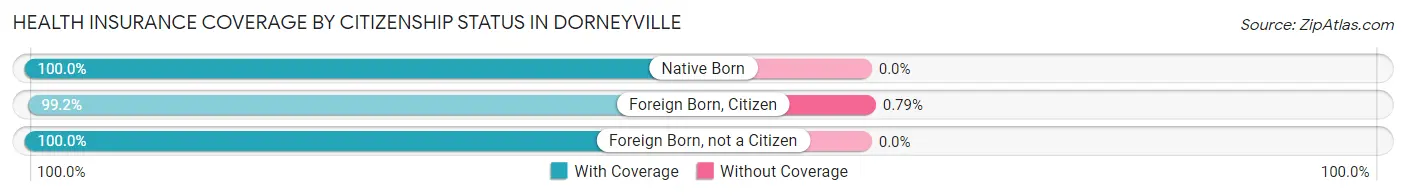
| Citizenship Status | With Coverage | Without Coverage |
| Native Born | 172 (100.0%) | 0 (0.0%) |
| Foreign Born, Citizen | 1,003 (99.2%) | 8 (0.8%) |
| Foreign Born, not a Citizen | 374 (100.0%) | 0 (0.0%) |
Health Insurance Coverage by Household Income in Dorneyville
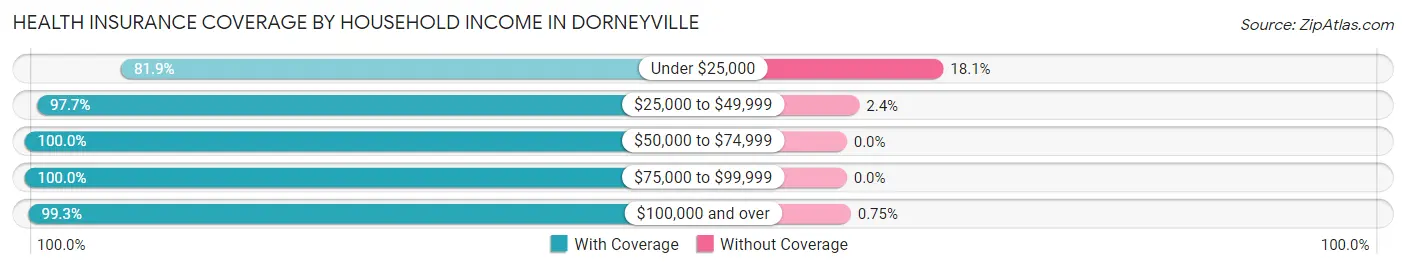
| Household Income | With Coverage | Without Coverage |
| Under $25,000 | 86 (81.9%) | 19 (18.1%) |
| $25,000 to $49,999 | 332 (97.7%) | 8 (2.4%) |
| $50,000 to $74,999 | 495 (100.0%) | 0 (0.0%) |
| $75,000 to $99,999 | 393 (100.0%) | 0 (0.0%) |
| $100,000 and over | 3,722 (99.3%) | 28 (0.7%) |
Public vs Private Health Insurance Coverage by Age in Dorneyville
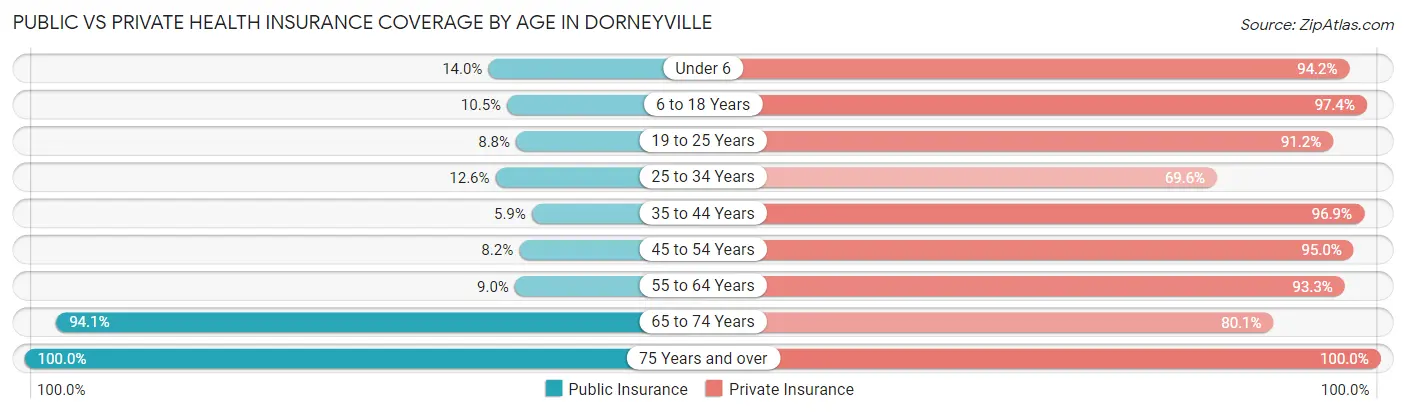
| Age Bracket | Public Insurance | Private Insurance |
| Under 6 | 24 (14.0%) | 162 (94.2%) |
| 6 to 18 Years | 106 (10.5%) | 985 (97.4%) |
| 19 to 25 Years | 33 (8.8%) | 341 (91.2%) |
| 25 to 34 Years | 27 (12.6%) | 149 (69.6%) |
| 35 to 44 Years | 38 (5.9%) | 625 (96.9%) |
| 45 to 54 Years | 84 (8.2%) | 970 (95.0%) |
| 55 to 64 Years | 42 (9.0%) | 434 (93.3%) |
| 65 to 74 Years | 752 (94.1%) | 640 (80.1%) |
| 75 Years and over | 392 (100.0%) | 392 (100.0%) |
| Total | 1,498 (29.4%) | 4,698 (92.2%) |
Disability Status by Sex by Age in Dorneyville
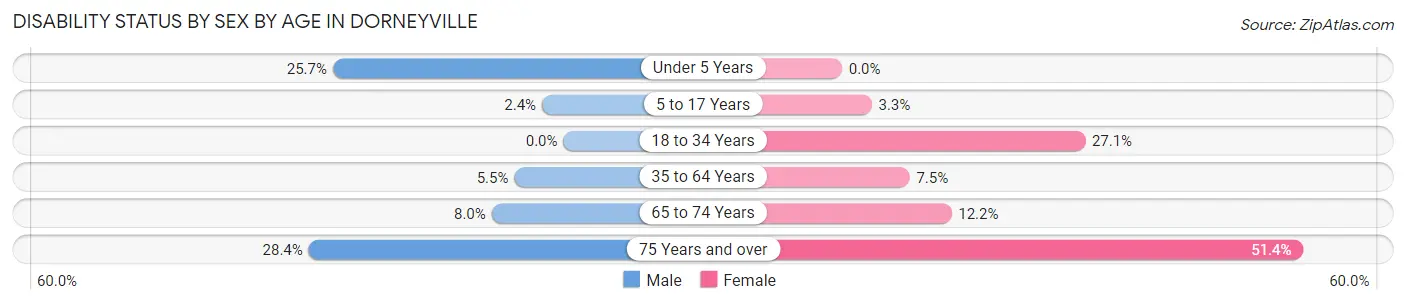
| Age Bracket | Male | Female |
| Under 5 Years | 19 (25.7%) | 0 (0.0%) |
| 5 to 17 Years | 15 (2.4%) | 12 (3.3%) |
| 18 to 34 Years | 0 (0.0%) | 52 (27.1%) |
| 35 to 64 Years | 62 (5.5%) | 75 (7.5%) |
| 65 to 74 Years | 35 (8.0%) | 44 (12.2%) |
| 75 Years and over | 40 (28.4%) | 129 (51.4%) |
Disability Class by Sex by Age in Dorneyville
Disability Class: Hearing Difficulty
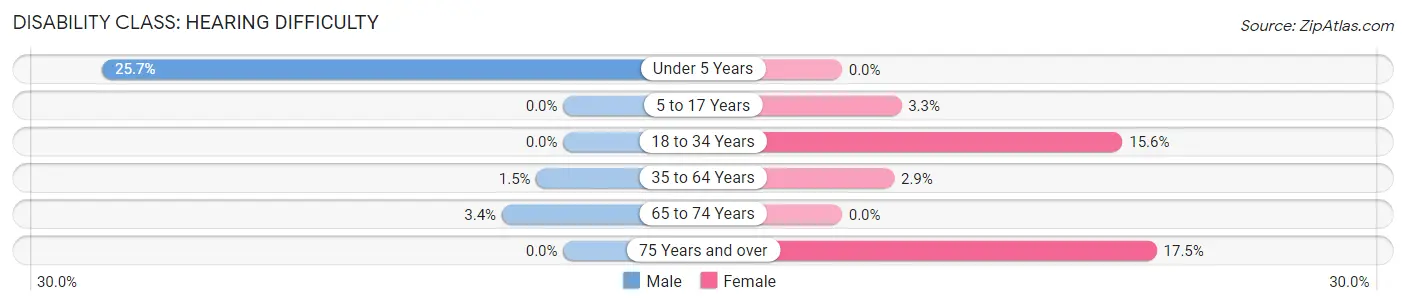
| Age Bracket | Male | Female |
| Under 5 Years | 19 (25.7%) | 0 (0.0%) |
| 5 to 17 Years | 0 (0.0%) | 12 (3.3%) |
| 18 to 34 Years | 0 (0.0%) | 30 (15.6%) |
| 35 to 64 Years | 17 (1.5%) | 29 (2.9%) |
| 65 to 74 Years | 15 (3.4%) | 0 (0.0%) |
| 75 Years and over | 0 (0.0%) | 44 (17.5%) |
Disability Class: Vision Difficulty
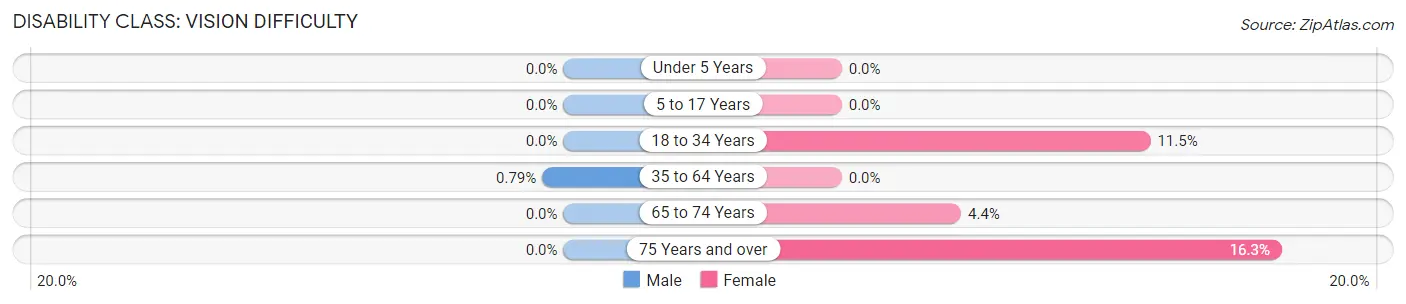
| Age Bracket | Male | Female |
| Under 5 Years | 0 (0.0%) | 0 (0.0%) |
| 5 to 17 Years | 0 (0.0%) | 0 (0.0%) |
| 18 to 34 Years | 0 (0.0%) | 22 (11.5%) |
| 35 to 64 Years | 9 (0.8%) | 0 (0.0%) |
| 65 to 74 Years | 0 (0.0%) | 16 (4.4%) |
| 75 Years and over | 0 (0.0%) | 41 (16.3%) |
Disability Class: Cognitive Difficulty
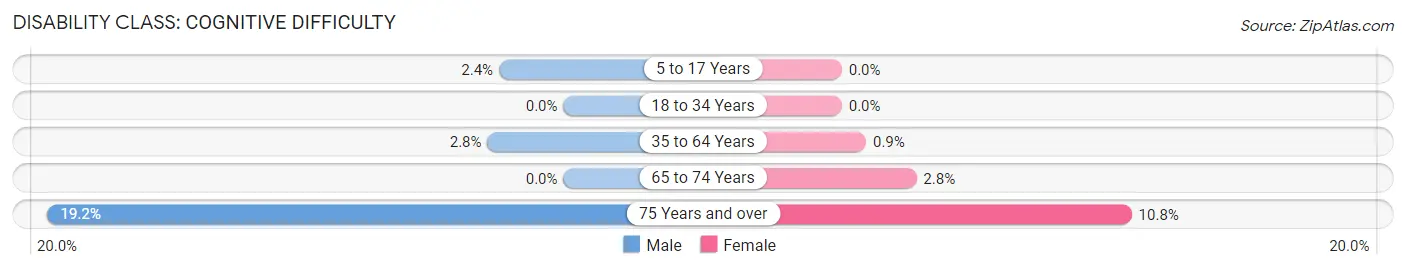
| Age Bracket | Male | Female |
| 5 to 17 Years | 15 (2.4%) | 0 (0.0%) |
| 18 to 34 Years | 0 (0.0%) | 0 (0.0%) |
| 35 to 64 Years | 32 (2.8%) | 9 (0.9%) |
| 65 to 74 Years | 0 (0.0%) | 10 (2.8%) |
| 75 Years and over | 27 (19.2%) | 27 (10.8%) |
Disability Class: Ambulatory Difficulty
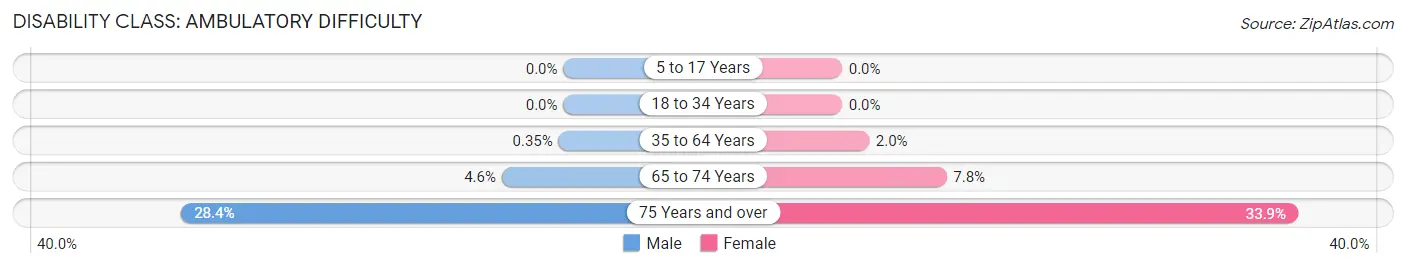
| Age Bracket | Male | Female |
| 5 to 17 Years | 0 (0.0%) | 0 (0.0%) |
| 18 to 34 Years | 0 (0.0%) | 0 (0.0%) |
| 35 to 64 Years | 4 (0.4%) | 20 (2.0%) |
| 65 to 74 Years | 20 (4.6%) | 28 (7.8%) |
| 75 Years and over | 40 (28.4%) | 85 (33.9%) |
Disability Class: Self-Care Difficulty
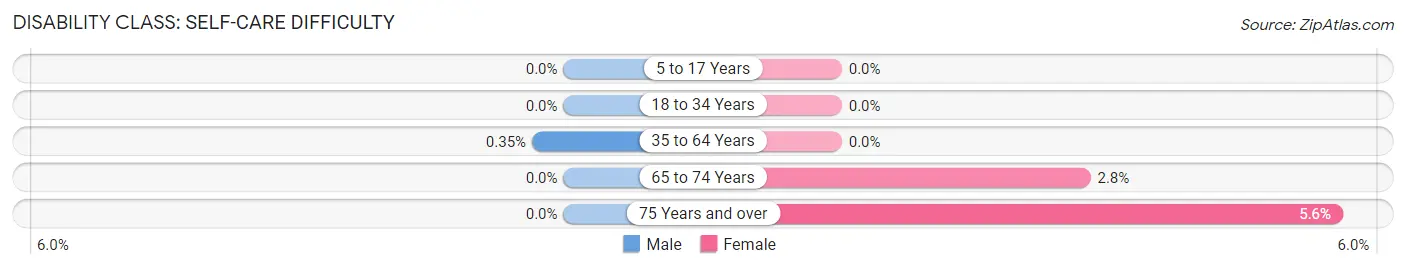
| Age Bracket | Male | Female |
| 5 to 17 Years | 0 (0.0%) | 0 (0.0%) |
| 18 to 34 Years | 0 (0.0%) | 0 (0.0%) |
| 35 to 64 Years | 4 (0.4%) | 0 (0.0%) |
| 65 to 74 Years | 0 (0.0%) | 10 (2.8%) |
| 75 Years and over | 0 (0.0%) | 14 (5.6%) |
Technology Access in Dorneyville
Computing Device Access in Dorneyville
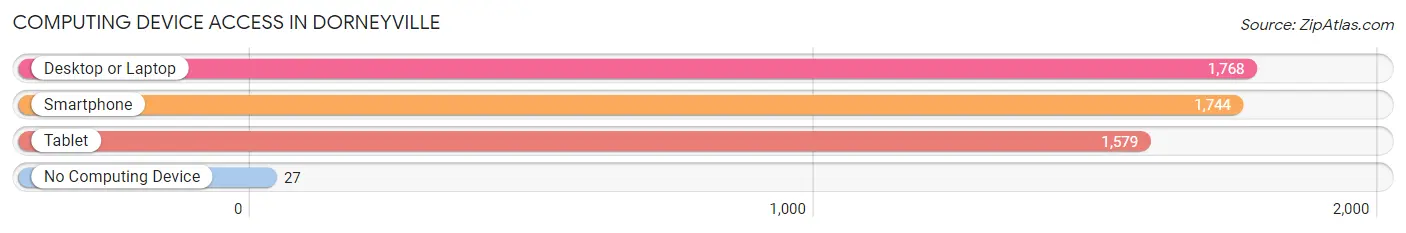
| Device Type | # Households | % Households |
| Desktop or Laptop | 1,768 | 93.3% |
| Smartphone | 1,744 | 92.0% |
| Tablet | 1,579 | 83.3% |
| No Computing Device | 27 | 1.4% |
| Total | 1,895 | 100.0% |
Internet Access in Dorneyville
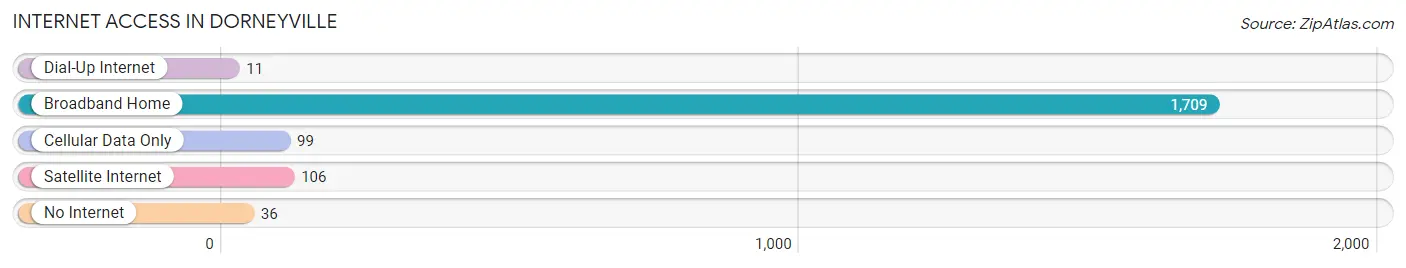
| Internet Type | # Households | % Households |
| Dial-Up Internet | 11 | 0.6% |
| Broadband Home | 1,709 | 90.2% |
| Cellular Data Only | 99 | 5.2% |
| Satellite Internet | 106 | 5.6% |
| No Internet | 36 | 1.9% |
| Total | 1,895 | 100.0% |
Dorneyville Summary
Dorneyville is a small unincorporated community located in South Whitehall Township, Lehigh County, Pennsylvania. It is situated in the Lehigh Valley region of the state, approximately 8 miles northwest of Allentown, the county seat. The community is bordered by the Lehigh River to the east, the Lehigh Valley Thruway to the west, and the Dorneyville Shopping Center to the south.
History
The area that is now Dorneyville was first settled in the late 1700s by German immigrants. The community was originally known as “Dorney’s Mill” after the first settler, John Dorney, who built a grist mill on the banks of the Lehigh River. The mill was used to grind grain for local farmers and was a major source of income for the community.
In the early 1900s, the area began to develop into a residential community. The Dorneyville Shopping Center was built in the 1950s and has since become the main commercial hub of the community.
Geography
Dorneyville is located in South Whitehall Township, Lehigh County, Pennsylvania. It is situated in the Lehigh Valley region of the state, approximately 8 miles northwest of Allentown, the county seat. The community is bordered by the Lehigh River to the east, the Lehigh Valley Thruway to the west, and the Dorneyville Shopping Center to the south.
The area is mostly flat, with some rolling hills in the surrounding area. The climate is humid continental, with hot summers and cold winters.
Economy
The economy of Dorneyville is largely based on the Dorneyville Shopping Center, which is the main commercial hub of the community. The shopping center is home to a variety of stores, restaurants, and services, including a grocery store, a pharmacy, a bank, and a post office.
The community is also home to several small businesses, including a gas station, a hardware store, and a car dealership. The area is also home to several industrial and manufacturing businesses, including a plastics factory and a metal fabrication plant.
Demographics
As of the 2010 census, the population of Dorneyville was 2,845. The racial makeup of the community was 94.3% White, 1.3% African American, 0.3% Native American, 1.2% Asian, 0.1% Pacific Islander, 1.2% from other races, and 1.6% from two or more races. Hispanic or Latino of any race were 3.2% of the population.
The median household income in Dorneyville was $50,945, and the median family income was $60,945. The per capita income was $25,945. About 4.3% of families and 5.3% of the population were below the poverty line, including 6.3% of those under age 18 and 4.3% of those age 65 or over.
Common Questions
What is Per Capita Income in Dorneyville?
Per Capita income in Dorneyville is $58,937.
What is the Median Family Income in Dorneyville?
Median Family Income in Dorneyville is $124,338.
What is the Median Household income in Dorneyville?
Median Household Income in Dorneyville is $121,250.
What is Income or Wage Gap in Dorneyville?
Income or Wage Gap in Dorneyville is 21.7%.
Women in Dorneyville earn 78.3 cents for every dollar earned by a man.
What is Inequality or Gini Index in Dorneyville?
Inequality or Gini Index in Dorneyville is 0.40.
What is the Total Population of Dorneyville?
Total Population of Dorneyville is 5,093.
What is the Total Male Population of Dorneyville?
Total Male Population of Dorneyville is 2,847.
What is the Total Female Population of Dorneyville?
Total Female Population of Dorneyville is 2,246.
What is the Ratio of Males per 100 Females in Dorneyville?
There are 126.76 Males per 100 Females in Dorneyville.
What is the Ratio of Females per 100 Males in Dorneyville?
There are 78.89 Females per 100 Males in Dorneyville.
What is the Median Population Age in Dorneyville?
Median Population Age in Dorneyville is 47.0 Years.
What is the Average Family Size in Dorneyville
Average Family Size in Dorneyville is 2.9 People.
What is the Average Household Size in Dorneyville
Average Household Size in Dorneyville is 2.7 People.
How Large is the Labor Force in Dorneyville?
There are 2,580 People in the Labor Forcein in Dorneyville.
What is the Percentage of People in the Labor Force in Dorneyville?
63.2% of People are in the Labor Force in Dorneyville.
What is the Unemployment Rate in Dorneyville?
Unemployment Rate in Dorneyville is 6.4%.