Oswayo borough, PA Map & Demographics
Oswayo borough Overview
$30,467
PER CAPITA INCOME
$64,375
AVG FAMILY INCOME
$64,375
AVG HOUSEHOLD INCOME
55.2%
WAGE / INCOME GAP [ % ]
44.8¢/ $1
WAGE / INCOME GAP [ $ ]
0.32
INEQUALITY / GINI INDEX
102
TOTAL POPULATION
52
MALE POPULATION
50
FEMALE POPULATION
104.00
MALES / 100 FEMALES
96.15
FEMALES / 100 MALES
47.5
MEDIAN AGE
2.7
AVG FAMILY SIZE
2.5
AVG HOUSEHOLD SIZE
53
LABOR FORCE [ PEOPLE ]
61.6%
PERCENT IN LABOR FORCE
5.7%
UNEMPLOYMENT RATE
Income in Oswayo borough
Income Overview in Oswayo borough
Per Capita Income in Oswayo borough is $30,467, while median incomes of families and households are $64,375 and $64,375 respectively.
| Characteristic | Number | Measure |
| Per Capita Income | 102 | $30,467 |
| Median Family Income | 33 | $64,375 |
| Mean Family Income | 33 | $76,294 |
| Median Household Income | 41 | $64,375 |
| Mean Household Income | 41 | $69,910 |
| Income Deficit | 33 | $0 |
| Wage / Income Gap (%) | 102 | 55.17% |
| Wage / Income Gap ($) | 102 | 44.83¢ per $1 |
| Gini / Inequality Index | 102 | 0.32 |
Earnings by Sex in Oswayo borough
Average Earnings in Oswayo borough are $41,563, $54,375 for men and $24,375 for women, a difference of 55.2%.
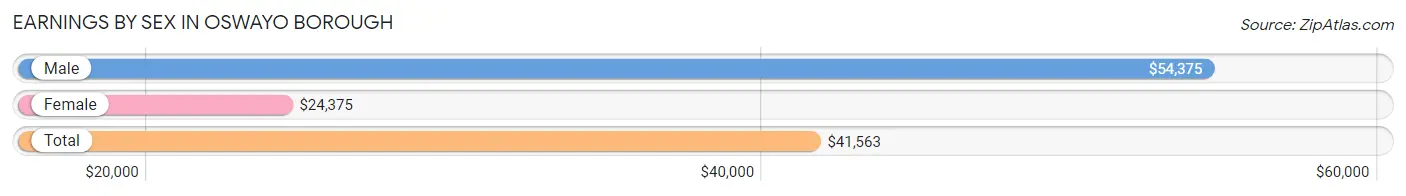
| Sex | Number | Average Earnings |
| Male | 33 (60.0%) | $54,375 |
| Female | 22 (40.0%) | $24,375 |
| Total | 55 (100.0%) | $41,563 |
Earnings by Sex by Income Bracket in Oswayo borough
The most common earnings brackets in Oswayo borough are $75,000 to $99,999 for men (10 | 30.3%) and $22,500 to $24,999 for women (4 | 18.2%).
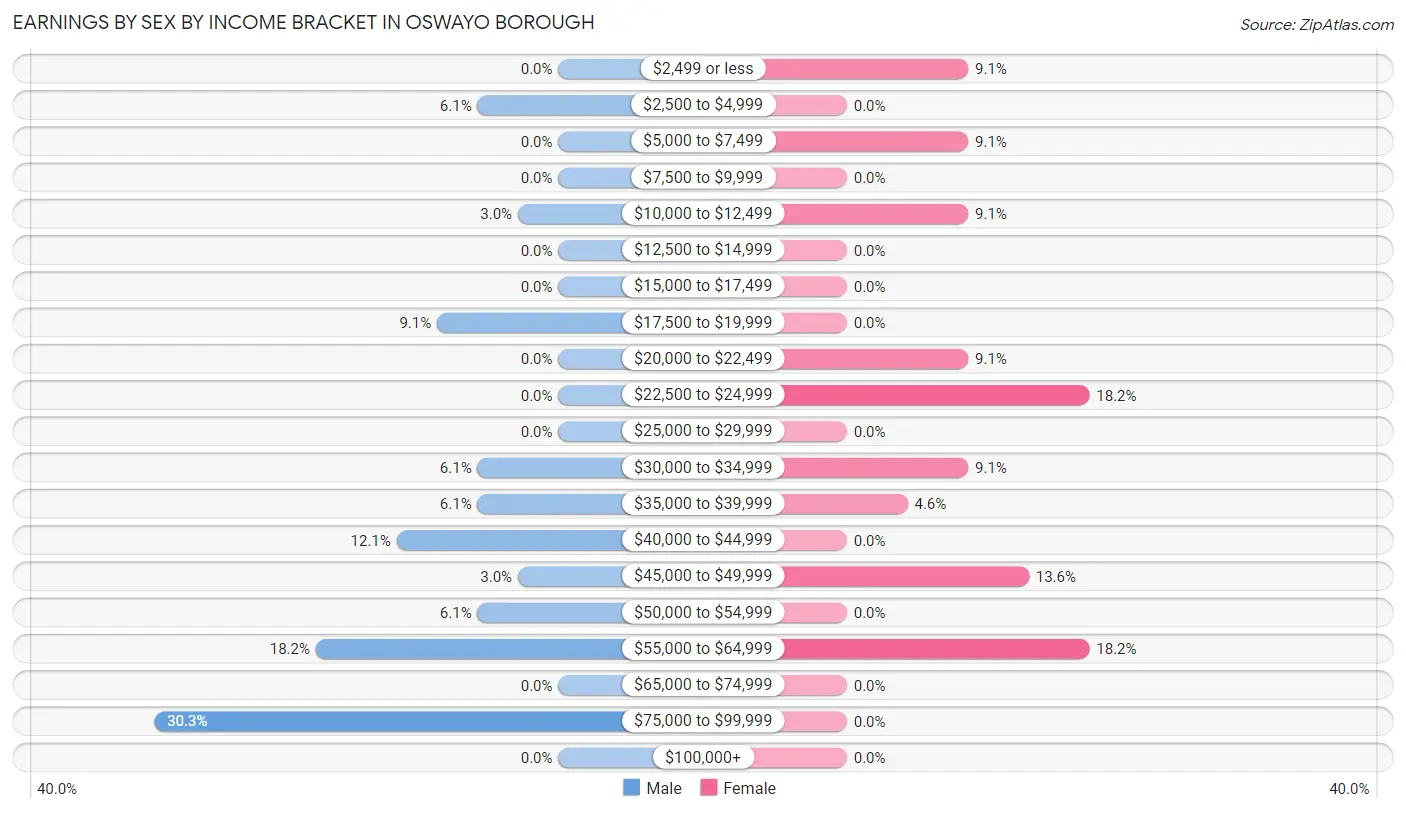
| Income | Male | Female |
| $2,499 or less | 0 (0.0%) | 2 (9.1%) |
| $2,500 to $4,999 | 2 (6.1%) | 0 (0.0%) |
| $5,000 to $7,499 | 0 (0.0%) | 2 (9.1%) |
| $7,500 to $9,999 | 0 (0.0%) | 0 (0.0%) |
| $10,000 to $12,499 | 1 (3.0%) | 2 (9.1%) |
| $12,500 to $14,999 | 0 (0.0%) | 0 (0.0%) |
| $15,000 to $17,499 | 0 (0.0%) | 0 (0.0%) |
| $17,500 to $19,999 | 3 (9.1%) | 0 (0.0%) |
| $20,000 to $22,499 | 0 (0.0%) | 2 (9.1%) |
| $22,500 to $24,999 | 0 (0.0%) | 4 (18.2%) |
| $25,000 to $29,999 | 0 (0.0%) | 0 (0.0%) |
| $30,000 to $34,999 | 2 (6.1%) | 2 (9.1%) |
| $35,000 to $39,999 | 2 (6.1%) | 1 (4.5%) |
| $40,000 to $44,999 | 4 (12.1%) | 0 (0.0%) |
| $45,000 to $49,999 | 1 (3.0%) | 3 (13.6%) |
| $50,000 to $54,999 | 2 (6.1%) | 0 (0.0%) |
| $55,000 to $64,999 | 6 (18.2%) | 4 (18.2%) |
| $65,000 to $74,999 | 0 (0.0%) | 0 (0.0%) |
| $75,000 to $99,999 | 10 (30.3%) | 0 (0.0%) |
| $100,000+ | 0 (0.0%) | 0 (0.0%) |
| Total | 33 (100.0%) | 22 (100.0%) |
Earnings by Sex by Educational Attainment in Oswayo borough
Average earnings in Oswayo borough are $55,625 for men and $28,750 for women, a difference of 48.3%. Men with an educational attainment of high school diploma enjoy the highest average annual earnings of $51,250, while those with high school diploma education earn the least with $51,250. Women with an educational attainment of college or associate's degree earn the most with the average annual earnings of $45,417, while those with high school diploma education have the smallest earnings of $22,500.
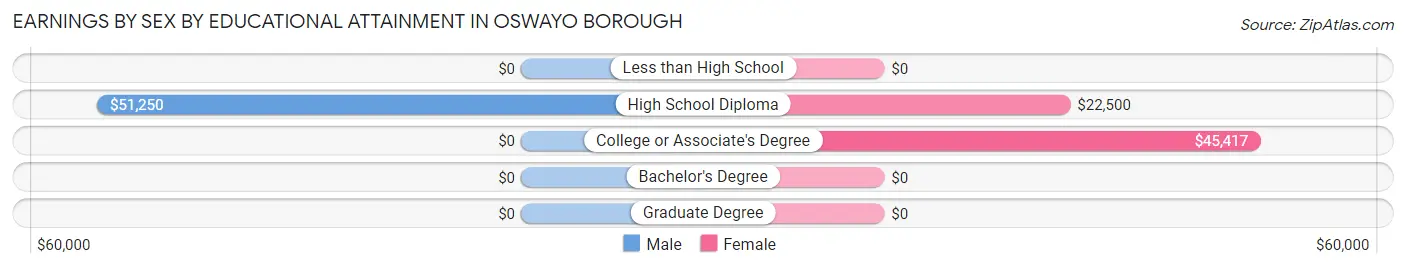
| Educational Attainment | Male Income | Female Income |
| Less than High School | - | - |
| High School Diploma | $51,250 | $22,500 |
| College or Associate's Degree | - | - |
| Bachelor's Degree | - | - |
| Graduate Degree | - | - |
| Total | $55,625 | $28,750 |
Family Income in Oswayo borough
Family Income Brackets in Oswayo borough
According to the Oswayo borough family income data, there are 10 families falling into the $50,000 to $74,999 income range, which is the most common income bracket and makes up 30.3% of all families.
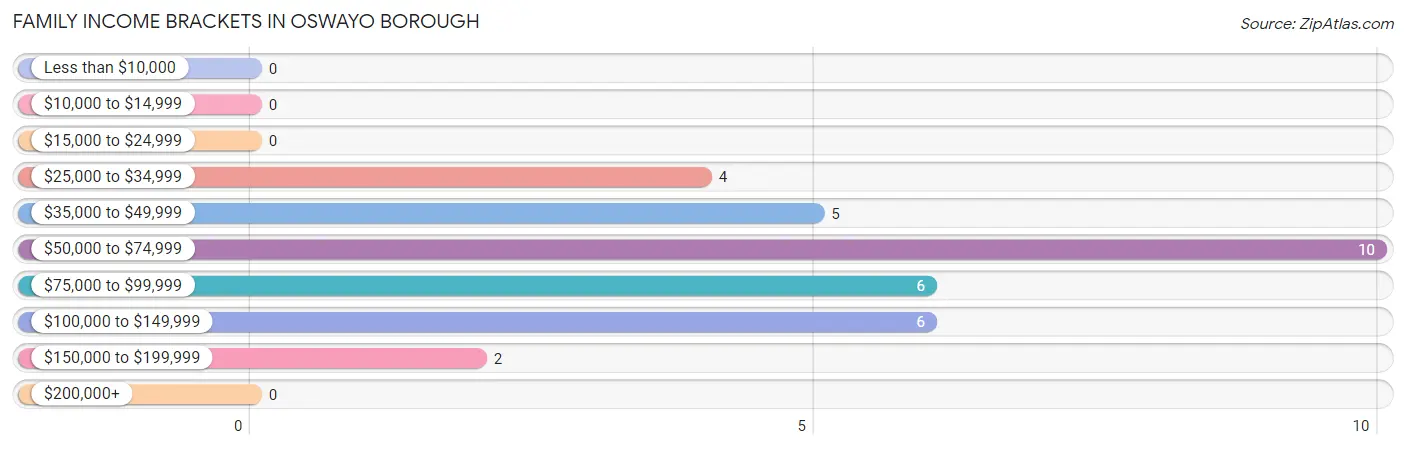
| Income Bracket | # Families | % Families |
| Less than $10,000 | 0 | 0.0% |
| $10,000 to $14,999 | 0 | 0.0% |
| $15,000 to $24,999 | 0 | 0.0% |
| $25,000 to $34,999 | 4 | 12.1% |
| $35,000 to $49,999 | 5 | 15.2% |
| $50,000 to $74,999 | 10 | 30.3% |
| $75,000 to $99,999 | 6 | 18.2% |
| $100,000 to $149,999 | 6 | 18.2% |
| $150,000 to $199,999 | 2 | 6.1% |
| $200,000+ | 0 | 0.0% |
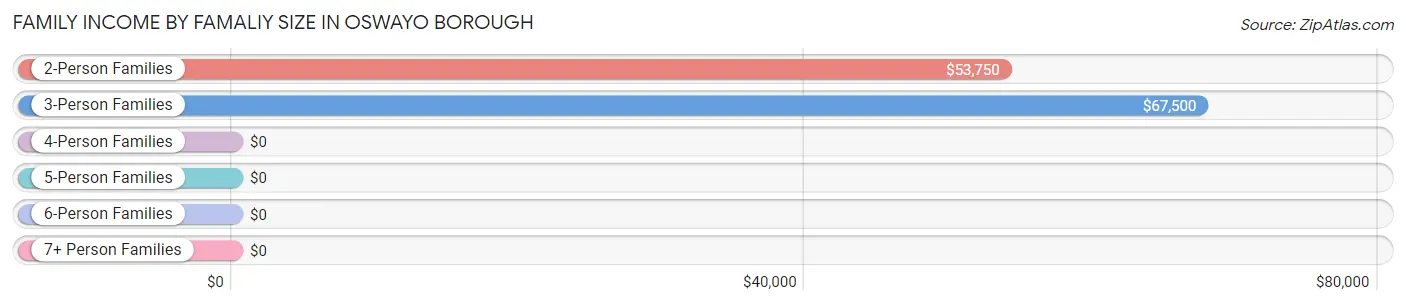
Family Income by Famaliy Size in Oswayo borough
3-person families (8 | 24.2%) account for the highest median family income in Oswayo borough with $67,500 per family, while 2-person families (20 | 60.6%) have the highest median income of $26,875 per family member.
| Income Bracket | # Families | Median Income |
| 2-Person Families | 20 (60.6%) | $53,750 |
| 3-Person Families | 8 (24.2%) | $67,500 |
| 4-Person Families | 3 (9.1%) | $0 |
| 5-Person Families | 2 (6.1%) | $0 |
| 6-Person Families | 0 (0.0%) | $0 |
| 7+ Person Families | 0 (0.0%) | $0 |
| Total | 33 (100.0%) | $64,375 |
Family Income by Number of Earners in Oswayo borough
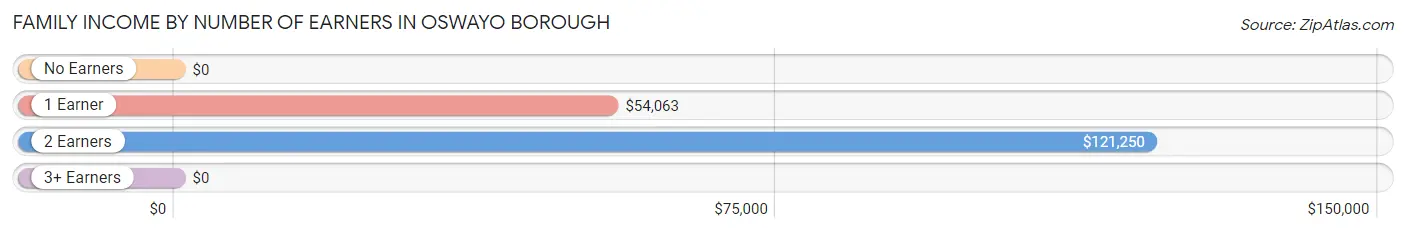
| Number of Earners | # Families | Median Income |
| No Earners | 2 (6.1%) | $0 |
| 1 Earner | 19 (57.6%) | $54,063 |
| 2 Earners | 10 (30.3%) | $121,250 |
| 3+ Earners | 2 (6.1%) | $0 |
| Total | 33 (100.0%) | $64,375 |
Household Income in Oswayo borough
Household Income Brackets in Oswayo borough
With 10 households falling in the category, the $50,000 to $74,999 income range is the most frequent in Oswayo borough, accounting for 24.4% of all households.
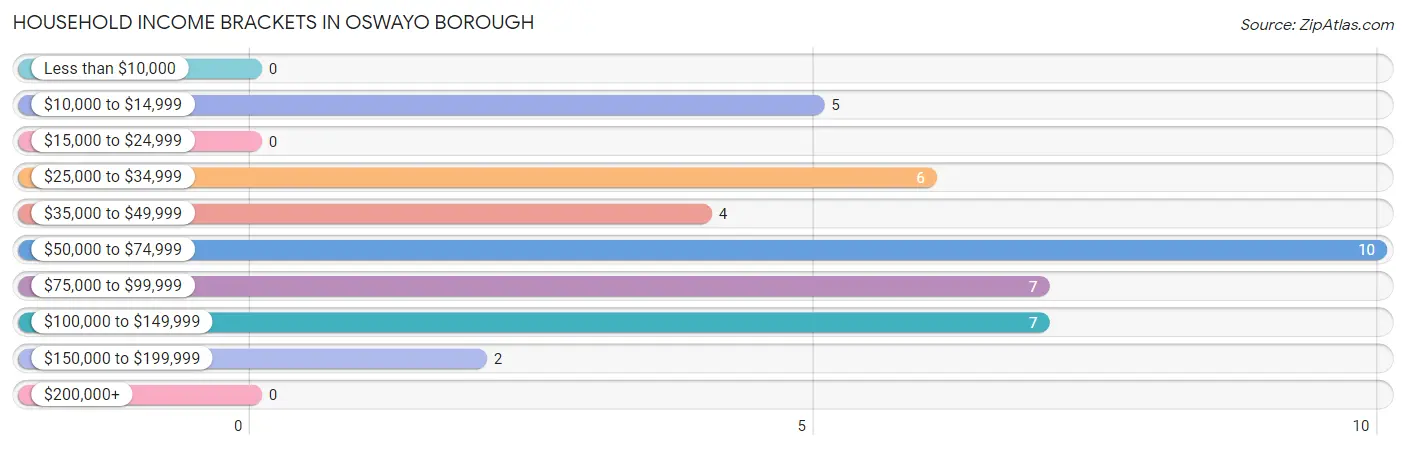
| Income Bracket | # Households | % Households |
| Less than $10,000 | 0 | 0.0% |
| $10,000 to $14,999 | 5 | 12.2% |
| $15,000 to $24,999 | 0 | 0.0% |
| $25,000 to $34,999 | 6 | 14.6% |
| $35,000 to $49,999 | 4 | 9.8% |
| $50,000 to $74,999 | 10 | 24.4% |
| $75,000 to $99,999 | 7 | 17.1% |
| $100,000 to $149,999 | 7 | 17.1% |
| $150,000 to $199,999 | 2 | 4.9% |
| $200,000+ | 0 | 0.0% |
Household Income by Householder Age in Oswayo borough
The median household income in Oswayo borough is $64,375, with the highest median household income of $80,000 found in the 45 to 64 years age bracket for the primary householder. A total of 20 households (48.8%) fall into this category.
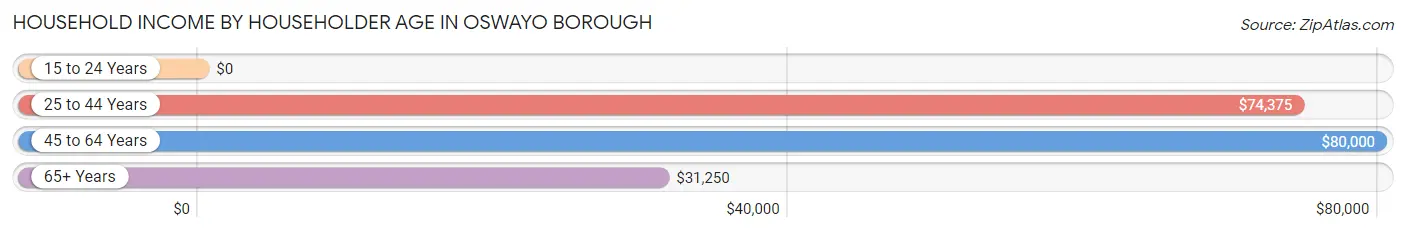
| Income Bracket | # Households | Median Income |
| 15 to 24 Years | 0 (0.0%) | $0 |
| 25 to 44 Years | 7 (17.1%) | $74,375 |
| 45 to 64 Years | 20 (48.8%) | $80,000 |
| 65+ Years | 14 (34.2%) | $31,250 |
| Total | 41 (100.0%) | $64,375 |
Poverty in Oswayo borough
Income Below Poverty by Sex and Age in Oswayo borough
With 1.9% poverty level for males and 12.0% for females among the residents of Oswayo borough, 25 to 34 year old males and 75 year old and over females are the most vulnerable to poverty, with 1 males (14.3%) and 5 females (55.6%) in their respective age groups living below the poverty level.
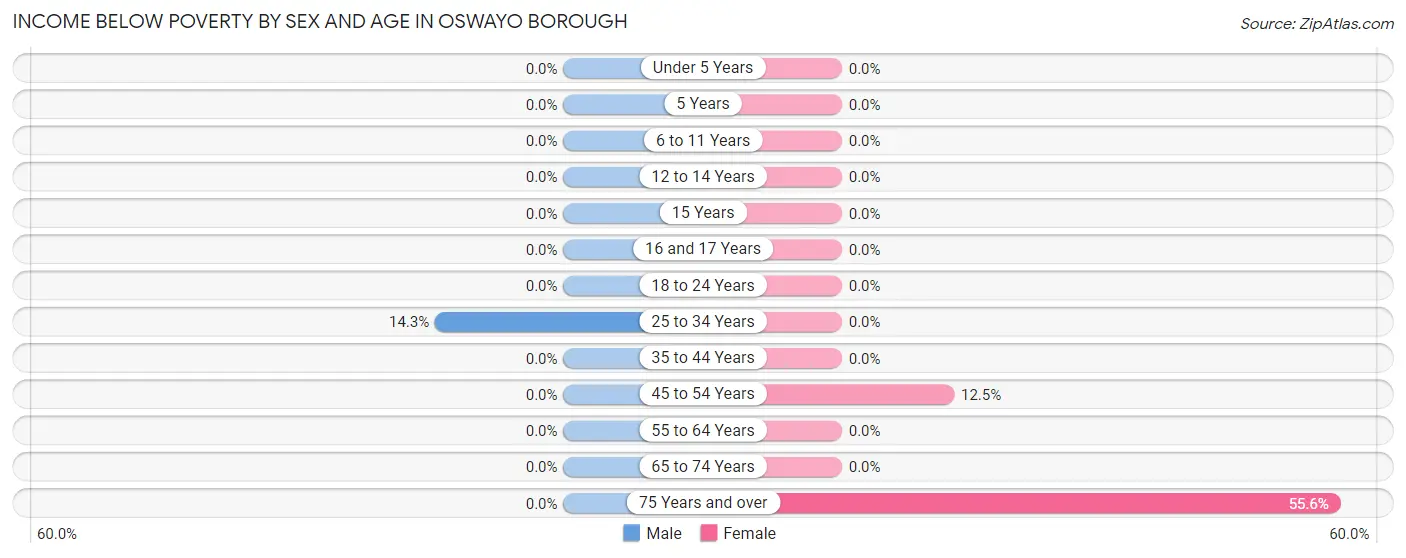
| Age Bracket | Male | Female |
| Under 5 Years | 0 (0.0%) | 0 (0.0%) |
| 5 Years | 0 (0.0%) | 0 (0.0%) |
| 6 to 11 Years | 0 (0.0%) | 0 (0.0%) |
| 12 to 14 Years | 0 (0.0%) | 0 (0.0%) |
| 15 Years | 0 (0.0%) | 0 (0.0%) |
| 16 and 17 Years | 0 (0.0%) | 0 (0.0%) |
| 18 to 24 Years | 0 (0.0%) | 0 (0.0%) |
| 25 to 34 Years | 1 (14.3%) | 0 (0.0%) |
| 35 to 44 Years | 0 (0.0%) | 0 (0.0%) |
| 45 to 54 Years | 0 (0.0%) | 1 (12.5%) |
| 55 to 64 Years | 0 (0.0%) | 0 (0.0%) |
| 65 to 74 Years | 0 (0.0%) | 0 (0.0%) |
| 75 Years and over | 0 (0.0%) | 5 (55.6%) |
| Total | 1 (1.9%) | 6 (12.0%) |
Income Above Poverty by Sex and Age in Oswayo borough
According to the poverty statistics in Oswayo borough, males aged under 5 years and females aged 6 to 11 years are the age groups that are most secure financially, with 100.0% of males and 100.0% of females in these age groups living above the poverty line.
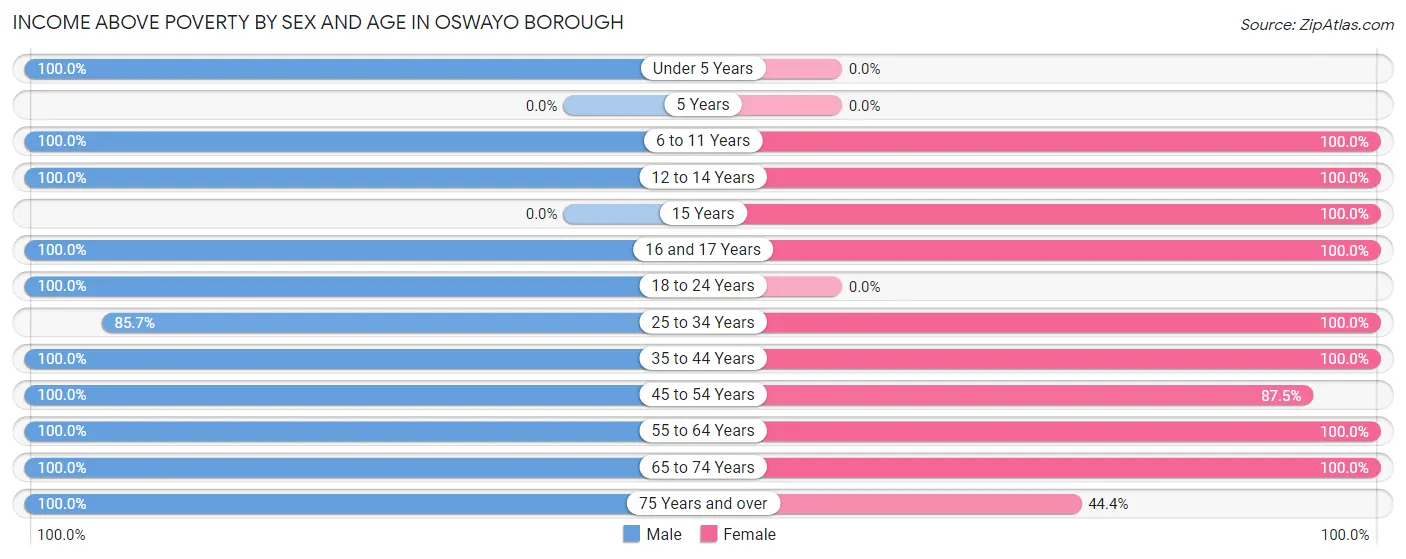
| Age Bracket | Male | Female |
| Under 5 Years | 4 (100.0%) | 0 (0.0%) |
| 5 Years | 0 (0.0%) | 0 (0.0%) |
| 6 to 11 Years | 3 (100.0%) | 3 (100.0%) |
| 12 to 14 Years | 2 (100.0%) | 2 (100.0%) |
| 15 Years | 0 (0.0%) | 2 (100.0%) |
| 16 and 17 Years | 2 (100.0%) | 2 (100.0%) |
| 18 to 24 Years | 3 (100.0%) | 0 (0.0%) |
| 25 to 34 Years | 6 (85.7%) | 6 (100.0%) |
| 35 to 44 Years | 3 (100.0%) | 4 (100.0%) |
| 45 to 54 Years | 10 (100.0%) | 7 (87.5%) |
| 55 to 64 Years | 8 (100.0%) | 9 (100.0%) |
| 65 to 74 Years | 6 (100.0%) | 5 (100.0%) |
| 75 Years and over | 4 (100.0%) | 4 (44.4%) |
| Total | 51 (98.1%) | 44 (88.0%) |
Income Below Poverty Among Married-Couple Families in Oswayo borough
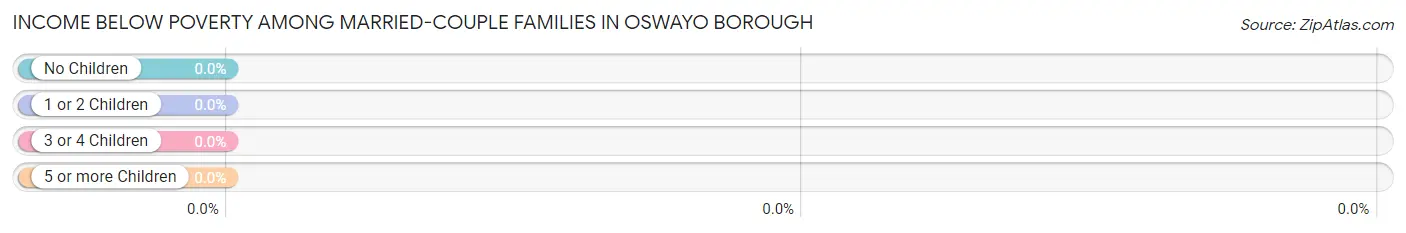
| Children | Above Poverty | Below Poverty |
| No Children | 16 (100.0%) | 0 (0.0%) |
| 1 or 2 Children | 8 (100.0%) | 0 (0.0%) |
| 3 or 4 Children | 0 (0.0%) | 0 (0.0%) |
| 5 or more Children | 0 (0.0%) | 0 (0.0%) |
| Total | 24 (100.0%) | 0 (0.0%) |
Income Below Poverty Among Single-Parent Households in Oswayo borough
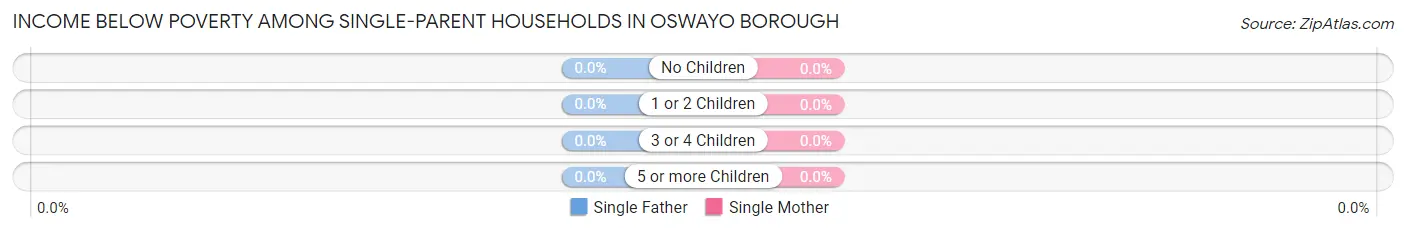
| Children | Single Father | Single Mother |
| No Children | 0 (0.0%) | 0 (0.0%) |
| 1 or 2 Children | 0 (0.0%) | 0 (0.0%) |
| 3 or 4 Children | 0 (0.0%) | 0 (0.0%) |
| 5 or more Children | 0 (0.0%) | 0 (0.0%) |
| Total | 0 (0.0%) | 0 (0.0%) |
Income Below Poverty Among Married-Couple vs Single-Parent Households in Oswayo borough
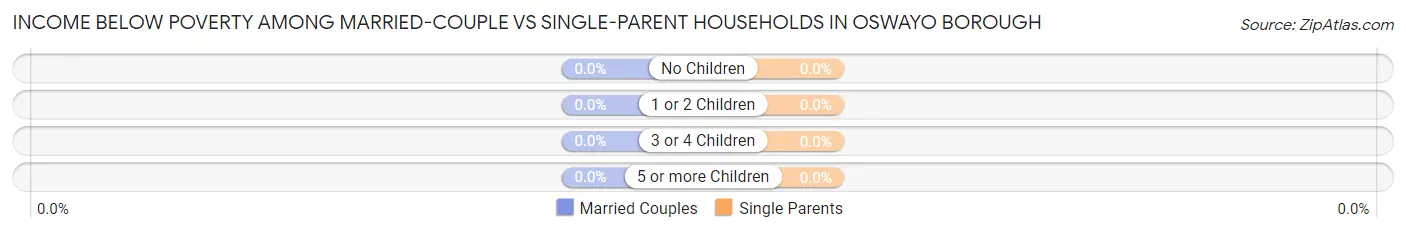
| Children | Married-Couple Families | Single-Parent Households |
| No Children | 0 (0.0%) | 0 (0.0%) |
| 1 or 2 Children | 0 (0.0%) | 0 (0.0%) |
| 3 or 4 Children | 0 (0.0%) | 0 (0.0%) |
| 5 or more Children | 0 (0.0%) | 0 (0.0%) |
| Total | 0 (0.0%) | 0 (0.0%) |
Race in Oswayo borough
The most populous races in Oswayo borough are White / Caucasian (94 | 92.2%), and Two or more Races (8 | 7.8%).
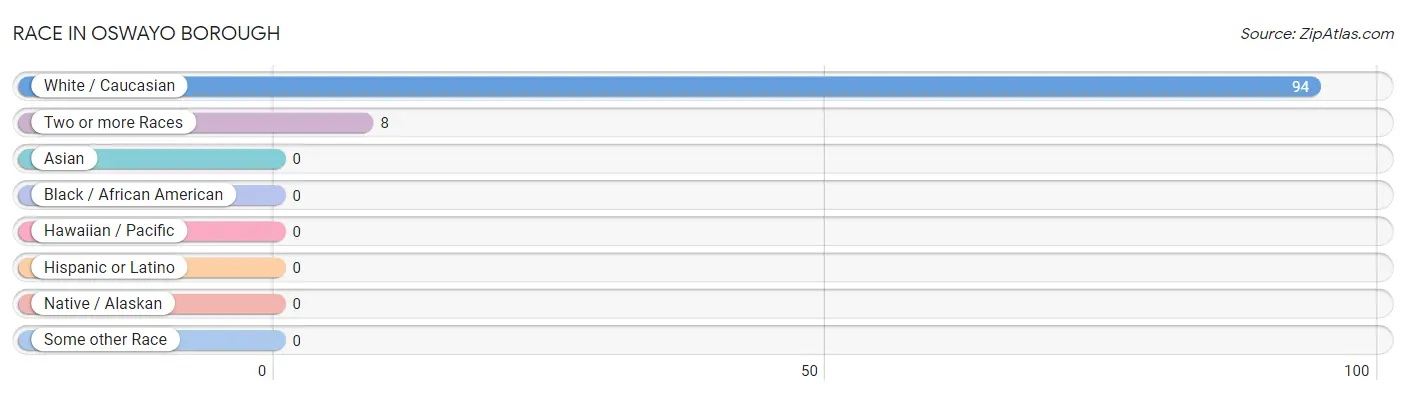
| Race | # Population | % Population |
| Asian | 0 | 0.0% |
| Black / African American | 0 | 0.0% |
| Hawaiian / Pacific | 0 | 0.0% |
| Hispanic or Latino | 0 | 0.0% |
| Native / Alaskan | 0 | 0.0% |
| White / Caucasian | 94 | 92.2% |
| Two or more Races | 8 | 7.8% |
| Some other Race | 0 | 0.0% |
| Total | 102 | 100.0% |
Ancestry in Oswayo borough
The most populous ancestries reported in Oswayo borough are German (21 | 20.6%), American (19 | 18.6%), English (15 | 14.7%), Irish (12 | 11.8%), and European (9 | 8.8%), together accounting for 74.5% of all Oswayo borough residents.
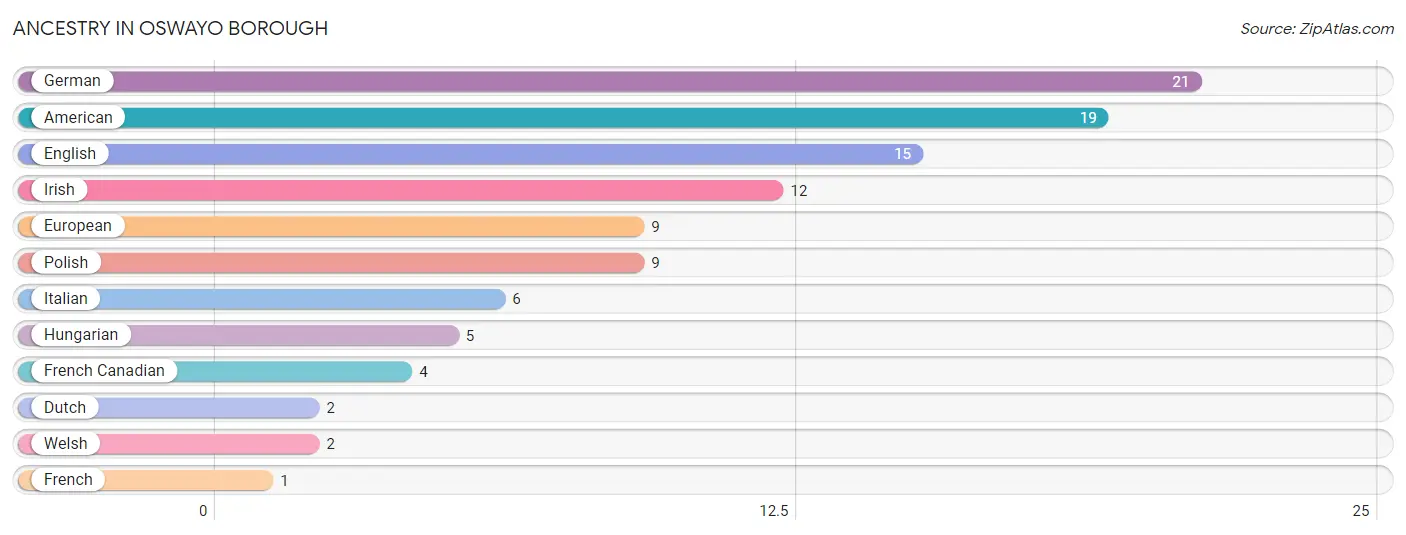
| Ancestry | # Population | % Population |
| American | 19 | 18.6% |
| Dutch | 2 | 2.0% |
| English | 15 | 14.7% |
| European | 9 | 8.8% |
| French | 1 | 1.0% |
| French Canadian | 4 | 3.9% |
| German | 21 | 20.6% |
| Hungarian | 5 | 4.9% |
| Irish | 12 | 11.8% |
| Italian | 6 | 5.9% |
| Polish | 9 | 8.8% |
| Welsh | 2 | 2.0% | View All 12 Rows |
Immigrants in Oswayo borough

| Immigration Origin | # Population | % Population | View All 0 Rows |
Sex and Age in Oswayo borough
Sex and Age in Oswayo borough
The most populous age groups in Oswayo borough are 25 to 29 Years (7 | 13.5%) for men and 80 to 84 Years (9 | 18.0%) for women.
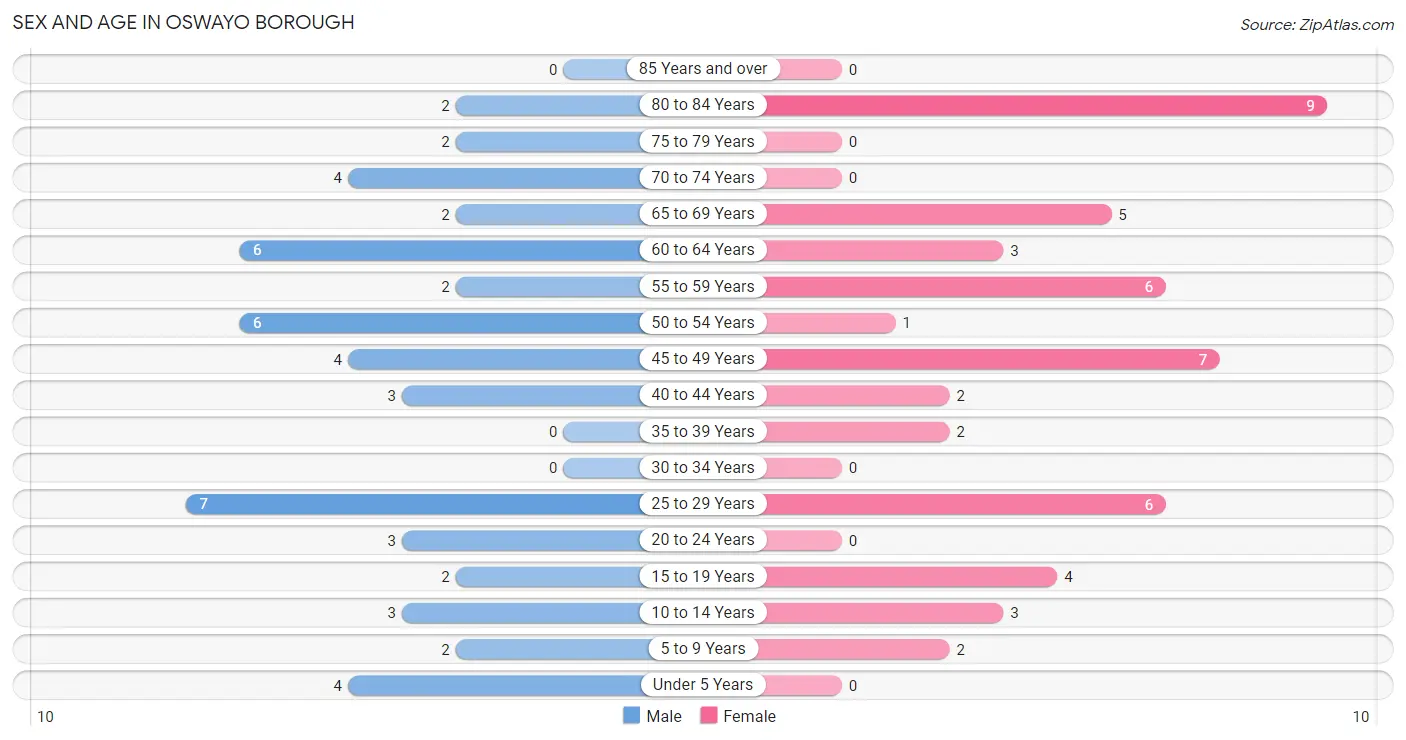
| Age Bracket | Male | Female |
| Under 5 Years | 4 (7.7%) | 0 (0.0%) |
| 5 to 9 Years | 2 (3.8%) | 2 (4.0%) |
| 10 to 14 Years | 3 (5.8%) | 3 (6.0%) |
| 15 to 19 Years | 2 (3.8%) | 4 (8.0%) |
| 20 to 24 Years | 3 (5.8%) | 0 (0.0%) |
| 25 to 29 Years | 7 (13.5%) | 6 (12.0%) |
| 30 to 34 Years | 0 (0.0%) | 0 (0.0%) |
| 35 to 39 Years | 0 (0.0%) | 2 (4.0%) |
| 40 to 44 Years | 3 (5.8%) | 2 (4.0%) |
| 45 to 49 Years | 4 (7.7%) | 7 (14.0%) |
| 50 to 54 Years | 6 (11.5%) | 1 (2.0%) |
| 55 to 59 Years | 2 (3.8%) | 6 (12.0%) |
| 60 to 64 Years | 6 (11.5%) | 3 (6.0%) |
| 65 to 69 Years | 2 (3.8%) | 5 (10.0%) |
| 70 to 74 Years | 4 (7.7%) | 0 (0.0%) |
| 75 to 79 Years | 2 (3.8%) | 0 (0.0%) |
| 80 to 84 Years | 2 (3.8%) | 9 (18.0%) |
| 85 Years and over | 0 (0.0%) | 0 (0.0%) |
| Total | 52 (100.0%) | 50 (100.0%) |
Families and Households in Oswayo borough
Median Family Size in Oswayo borough
The median family size in Oswayo borough is 2.70 persons per family, with single female/mother families (4 | 12.1%) accounting for the largest median family size of 3 persons per family. On the other hand, married-couple families (24 | 72.7%) represent the smallest median family size with 2.63 persons per family.
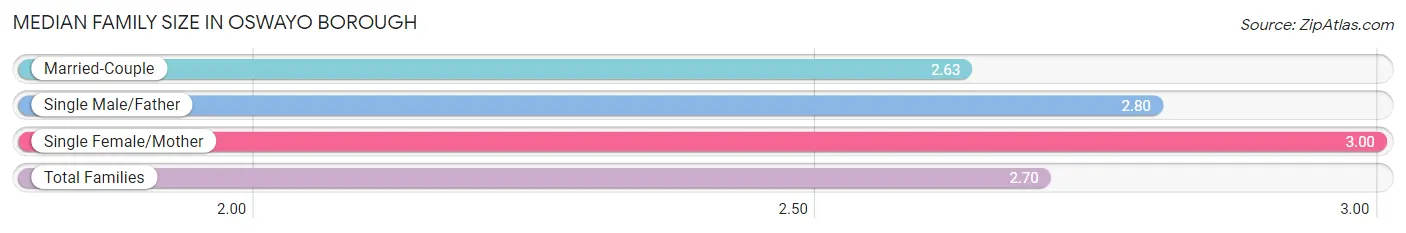
| Family Type | # Families | Family Size |
| Married-Couple | 24 (72.7%) | 2.63 |
| Single Male/Father | 5 (15.1%) | 2.80 |
| Single Female/Mother | 4 (12.1%) | 3.00 |
| Total Families | 33 (100.0%) | 2.70 |
Median Household Size in Oswayo borough
The median household size in Oswayo borough is 2.49 persons per household, with single female/mother households (4 | 9.8%) accounting for the largest median household size of 3.25 persons per household. non-family households (8 | 19.5%) represent the smallest median household size with 1.25 persons per household.
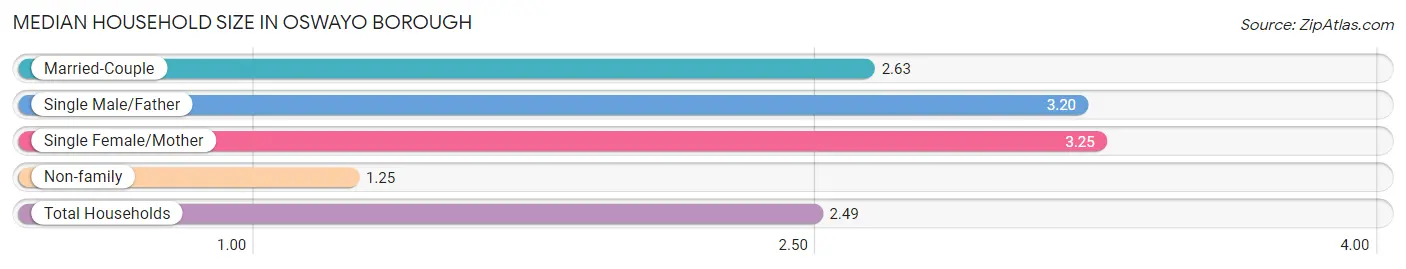
| Household Type | # Households | Household Size |
| Married-Couple | 24 (58.5%) | 2.63 |
| Single Male/Father | 5 (12.2%) | 3.20 |
| Single Female/Mother | 4 (9.8%) | 3.25 |
| Non-family | 8 (19.5%) | 1.25 |
| Total Households | 41 (100.0%) | 2.49 |
Household Size by Marriage Status in Oswayo borough
Out of a total of 41 households in Oswayo borough, 33 (80.5%) are family households, while 8 (19.5%) are nonfamily households. The most numerous type of family households are 2-person households, comprising 18, and the most common type of nonfamily households are 1-person households, comprising 7.
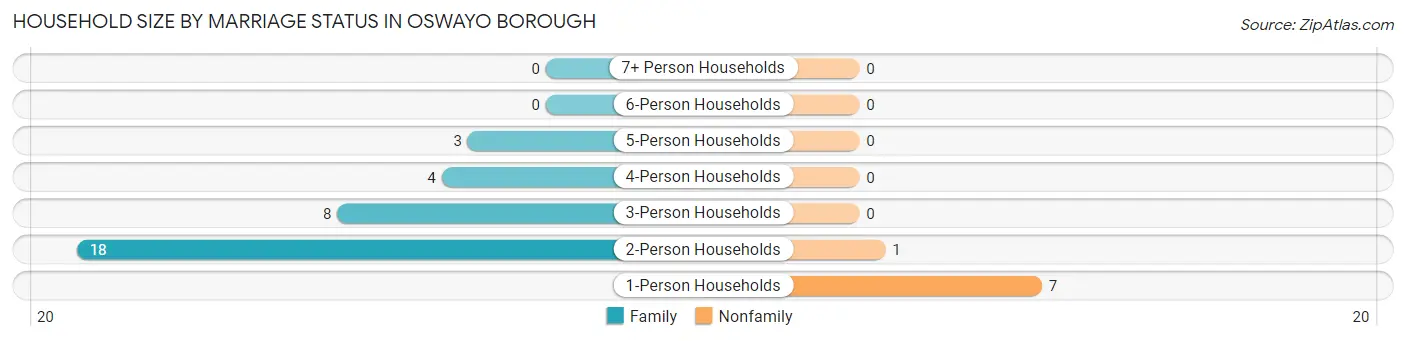
| Household Size | Family Households | Nonfamily Households |
| 1-Person Households | - | 7 (17.1%) |
| 2-Person Households | 18 (43.9%) | 1 (2.4%) |
| 3-Person Households | 8 (19.5%) | 0 (0.0%) |
| 4-Person Households | 4 (9.8%) | 0 (0.0%) |
| 5-Person Households | 3 (7.3%) | 0 (0.0%) |
| 6-Person Households | 0 (0.0%) | 0 (0.0%) |
| 7+ Person Households | 0 (0.0%) | 0 (0.0%) |
| Total | 33 (80.5%) | 8 (19.5%) |
Female Fertility in Oswayo borough
Fertility by Age in Oswayo borough
| Age Bracket | Women with Births | Births / 1,000 Women |
| 15 to 19 years | 0 (0.0%) | 0.0 |
| 20 to 34 years | 0 (0.0%) | 0.0 |
| 35 to 50 years | 0 (0.0%) | 0.0 |
| Total | 0 (0.0%) | 0.0 |
Fertility by Age by Marriage Status in Oswayo borough
| Age Bracket | Married | Unmarried |
| 15 to 19 years | 0 (0.0%) | 0 (0.0%) |
| 20 to 34 years | 0 (0.0%) | 0 (0.0%) |
| 35 to 50 years | 0 (0.0%) | 0 (0.0%) |
| Total | 0 (0.0%) | 0 (0.0%) |
Fertility by Education in Oswayo borough
| Educational Attainment | Women with Births | Births / 1,000 Women |
| Less than High School | 0 (0.0%) | 0.0 |
| High School Diploma | 0 (0.0%) | 0.0 |
| College or Associate's Degree | 0 (0.0%) | 0.0 |
| Bachelor's Degree | 0 (0.0%) | 0.0 |
| Graduate Degree | 0 (0.0%) | 0.0 |
| Total | 0 (0.0%) | 0.0 |
Fertility by Education by Marriage Status in Oswayo borough
| Educational Attainment | Married | Unmarried |
| Less than High School | 0 (0.0%) | 0 (0.0%) |
| High School Diploma | 0 (0.0%) | 0 (0.0%) |
| College or Associate's Degree | 0 (0.0%) | 0 (0.0%) |
| Bachelor's Degree | 0 (0.0%) | 0 (0.0%) |
| Graduate Degree | 0 (0.0%) | 0 (0.0%) |
| Total | 0 (0.0%) | 0 (0.0%) |
Employment Characteristics in Oswayo borough
Employment by Class of Employer in Oswayo borough
Among the 50 employed individuals in Oswayo borough, private company employees (38 | 76.0%), state government employees (6 | 12.0%), and not-for-profit organizations (4 | 8.0%) make up the most common classes of employment.
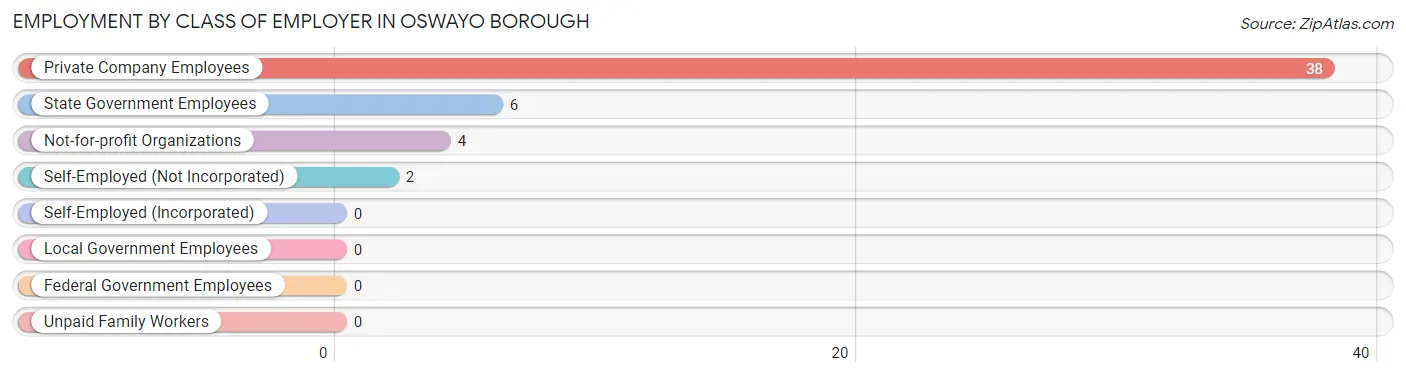
| Employer Class | # Employees | % Employees |
| Private Company Employees | 38 | 76.0% |
| Self-Employed (Incorporated) | 0 | 0.0% |
| Self-Employed (Not Incorporated) | 2 | 4.0% |
| Not-for-profit Organizations | 4 | 8.0% |
| Local Government Employees | 0 | 0.0% |
| State Government Employees | 6 | 12.0% |
| Federal Government Employees | 0 | 0.0% |
| Unpaid Family Workers | 0 | 0.0% |
| Total | 50 | 100.0% |
Employment Status by Age in Oswayo borough
According to the labor force statistics for Oswayo borough, out of the total population over 16 years of age (86), 61.6% or 53 individuals are in the labor force, with 5.7% or 3 of them unemployed. The age group with the highest labor force participation rate is 20 to 24 years, with 100.0% or 3 individuals in the labor force. Within the labor force, the 25 to 29 years age range has the highest percentage of unemployed individuals, with 30.0% or 3 of them being unemployed.
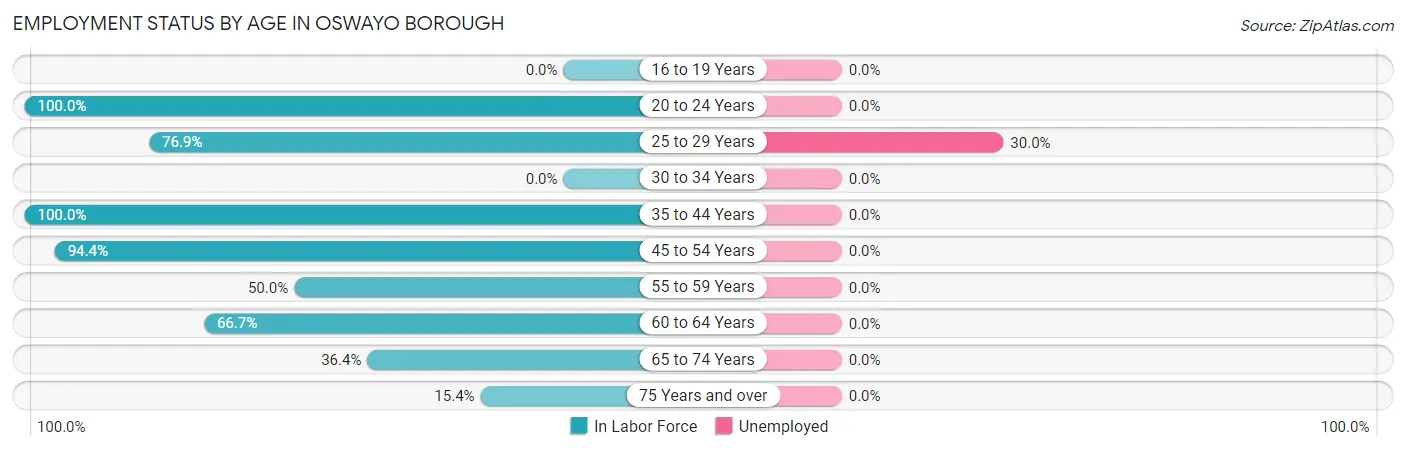
| Age Bracket | In Labor Force | Unemployed |
| 16 to 19 Years | 0 (0.0%) | 0 (0.0%) |
| 20 to 24 Years | 3 (100.0%) | 0 (0.0%) |
| 25 to 29 Years | 10 (76.9%) | 3 (30.0%) |
| 30 to 34 Years | 0 (0.0%) | 0 (0.0%) |
| 35 to 44 Years | 7 (100.0%) | 0 (0.0%) |
| 45 to 54 Years | 17 (94.4%) | 0 (0.0%) |
| 55 to 59 Years | 4 (50.0%) | 0 (0.0%) |
| 60 to 64 Years | 6 (66.7%) | 0 (0.0%) |
| 65 to 74 Years | 4 (36.4%) | 0 (0.0%) |
| 75 Years and over | 2 (15.4%) | 0 (0.0%) |
| Total | 53 (61.6%) | 3 (5.7%) |
Employment Status by Educational Attainment in Oswayo borough
According to labor force statistics for Oswayo borough, 80.0% of individuals (44) out of the total population between 25 and 64 years of age (55) are in the labor force, with 6.8% or 3 of them being unemployed. The group with the highest labor force participation rate are those with the educational attainment of less than high school, with 100.0% or 2 individuals in the labor force. Within the labor force, individuals with high school diploma education have the highest percentage of unemployment, with 10.7% or 3 of them being unemployed.
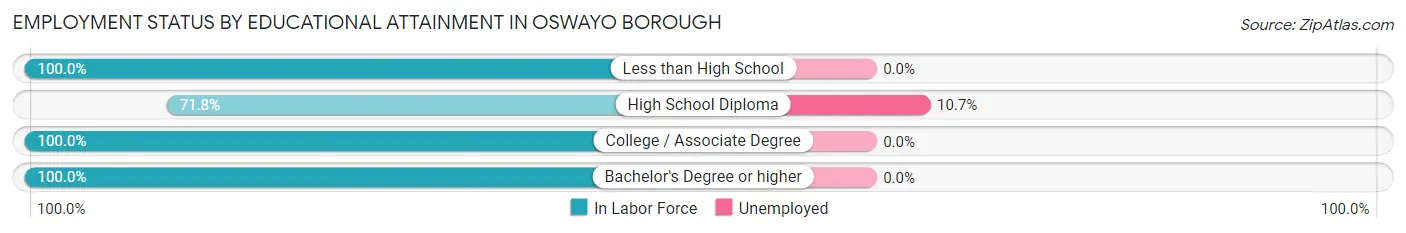
| Educational Attainment | In Labor Force | Unemployed |
| Less than High School | 2 (100.0%) | 0 (0.0%) |
| High School Diploma | 28 (71.8%) | 4 (10.7%) |
| College / Associate Degree | 9 (100.0%) | 0 (0.0%) |
| Bachelor's Degree or higher | 5 (100.0%) | 0 (0.0%) |
| Total | 44 (80.0%) | 4 (6.8%) |
Employment Occupations by Sex in Oswayo borough
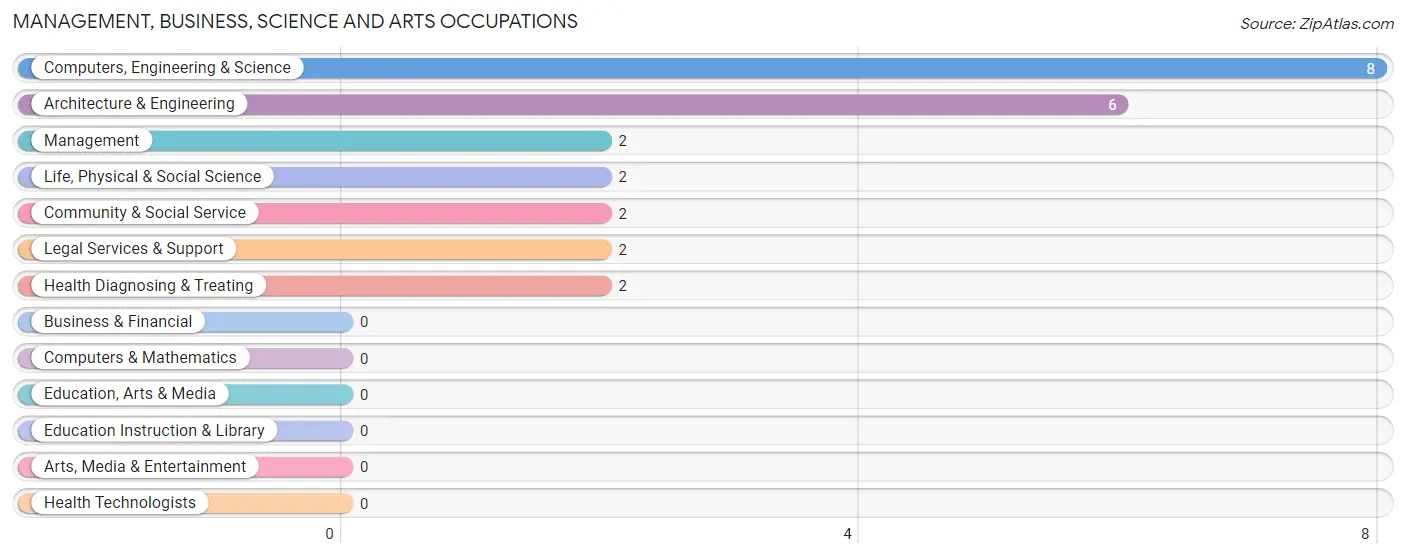
Management, Business, Science and Arts Occupations
The most common Management, Business, Science and Arts occupations in Oswayo borough are Computers, Engineering & Science (8 | 16.0%), Architecture & Engineering (6 | 12.0%), Management (2 | 4.0%), Life, Physical & Social Science (2 | 4.0%), and Community & Social Service (2 | 4.0%).
Management, Business, Science and Arts Occupations by Sex
Within the Management, Business, Science and Arts occupations in Oswayo borough, the most male-oriented occupations are Architecture & Engineering (66.7%), Computers, Engineering & Science (62.5%), and Life, Physical & Social Science (50.0%), while the most female-oriented occupations are Management (100.0%), Community & Social Service (100.0%), and Legal Services & Support (100.0%).
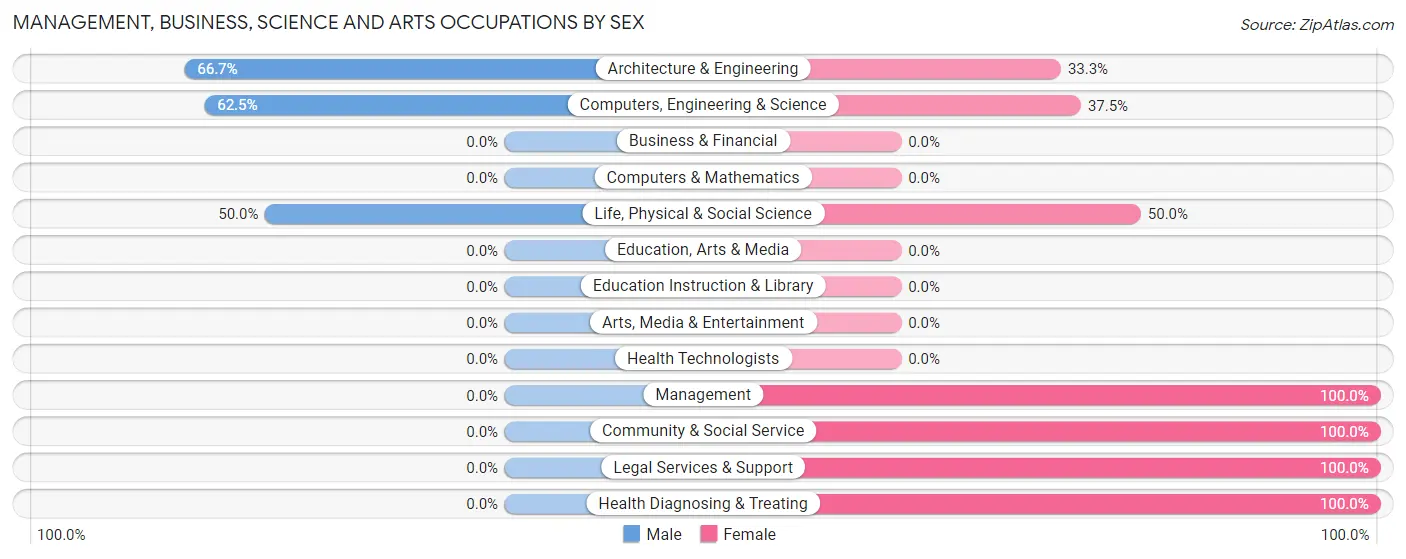
| Occupation | Male | Female |
| Management | 0 (0.0%) | 2 (100.0%) |
| Business & Financial | 0 (0.0%) | 0 (0.0%) |
| Computers, Engineering & Science | 5 (62.5%) | 3 (37.5%) |
| Computers & Mathematics | 0 (0.0%) | 0 (0.0%) |
| Architecture & Engineering | 4 (66.7%) | 2 (33.3%) |
| Life, Physical & Social Science | 1 (50.0%) | 1 (50.0%) |
| Community & Social Service | 0 (0.0%) | 2 (100.0%) |
| Education, Arts & Media | 0 (0.0%) | 0 (0.0%) |
| Legal Services & Support | 0 (0.0%) | 2 (100.0%) |
| Education Instruction & Library | 0 (0.0%) | 0 (0.0%) |
| Arts, Media & Entertainment | 0 (0.0%) | 0 (0.0%) |
| Health Diagnosing & Treating | 0 (0.0%) | 2 (100.0%) |
| Health Technologists | 0 (0.0%) | 0 (0.0%) |
| Total (Category) | 5 (35.7%) | 9 (64.3%) |
| Total (Overall) | 30 (60.0%) | 20 (40.0%) |
Services Occupations
The most common Services occupations in Oswayo borough are Cleaning & Maintenance (6 | 12.0%), and Healthcare Support (2 | 4.0%).
Services Occupations by Sex
| Occupation | Male | Female |
| Healthcare Support | 0 (0.0%) | 2 (100.0%) |
| Security & Protection | 0 (0.0%) | 0 (0.0%) |
| Firefighting & Prevention | 0 (0.0%) | 0 (0.0%) |
| Law Enforcement | 0 (0.0%) | 0 (0.0%) |
| Food Preparation & Serving | 0 (0.0%) | 0 (0.0%) |
| Cleaning & Maintenance | 2 (33.3%) | 4 (66.7%) |
| Personal Care & Service | 0 (0.0%) | 0 (0.0%) |
| Total (Category) | 2 (25.0%) | 6 (75.0%) |
| Total (Overall) | 30 (60.0%) | 20 (40.0%) |
Sales and Office Occupations
The most common Sales and Office occupations in Oswayo borough are Sales & Related (5 | 10.0%), and Office & Administration (4 | 8.0%).
Sales and Office Occupations by Sex

| Occupation | Male | Female |
| Sales & Related | 0 (0.0%) | 5 (100.0%) |
| Office & Administration | 4 (100.0%) | 0 (0.0%) |
| Total (Category) | 4 (44.4%) | 5 (55.6%) |
| Total (Overall) | 30 (60.0%) | 20 (40.0%) |
Natural Resources, Construction and Maintenance Occupations
The most common Natural Resources, Construction and Maintenance occupations in Oswayo borough are Construction & Extraction (6 | 12.0%), and Farming, Fishing & Forestry (2 | 4.0%).

Natural Resources, Construction and Maintenance Occupations by Sex

| Occupation | Male | Female |
| Farming, Fishing & Forestry | 2 (100.0%) | 0 (0.0%) |
| Construction & Extraction | 6 (100.0%) | 0 (0.0%) |
| Installation, Maintenance & Repair | 0 (0.0%) | 0 (0.0%) |
| Total (Category) | 8 (100.0%) | 0 (0.0%) |
| Total (Overall) | 30 (60.0%) | 20 (40.0%) |
Production, Transportation and Moving Occupations
The most common Production, Transportation and Moving occupations in Oswayo borough are Transportation (6 | 12.0%), and Production (5 | 10.0%).
Production, Transportation and Moving Occupations by Sex
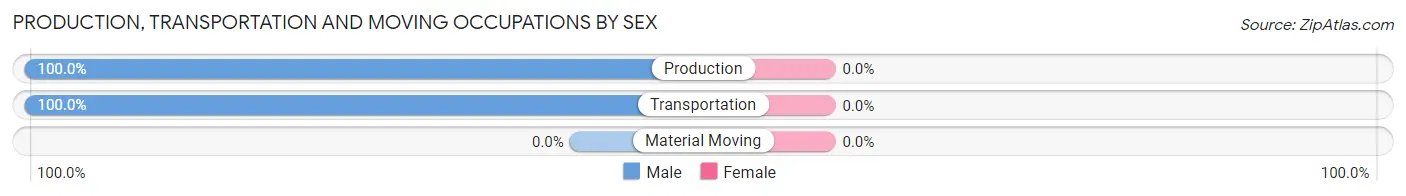
| Occupation | Male | Female |
| Production | 5 (100.0%) | 0 (0.0%) |
| Transportation | 6 (100.0%) | 0 (0.0%) |
| Material Moving | 0 (0.0%) | 0 (0.0%) |
| Total (Category) | 11 (100.0%) | 0 (0.0%) |
| Total (Overall) | 30 (60.0%) | 20 (40.0%) |
Employment Industries by Sex in Oswayo borough
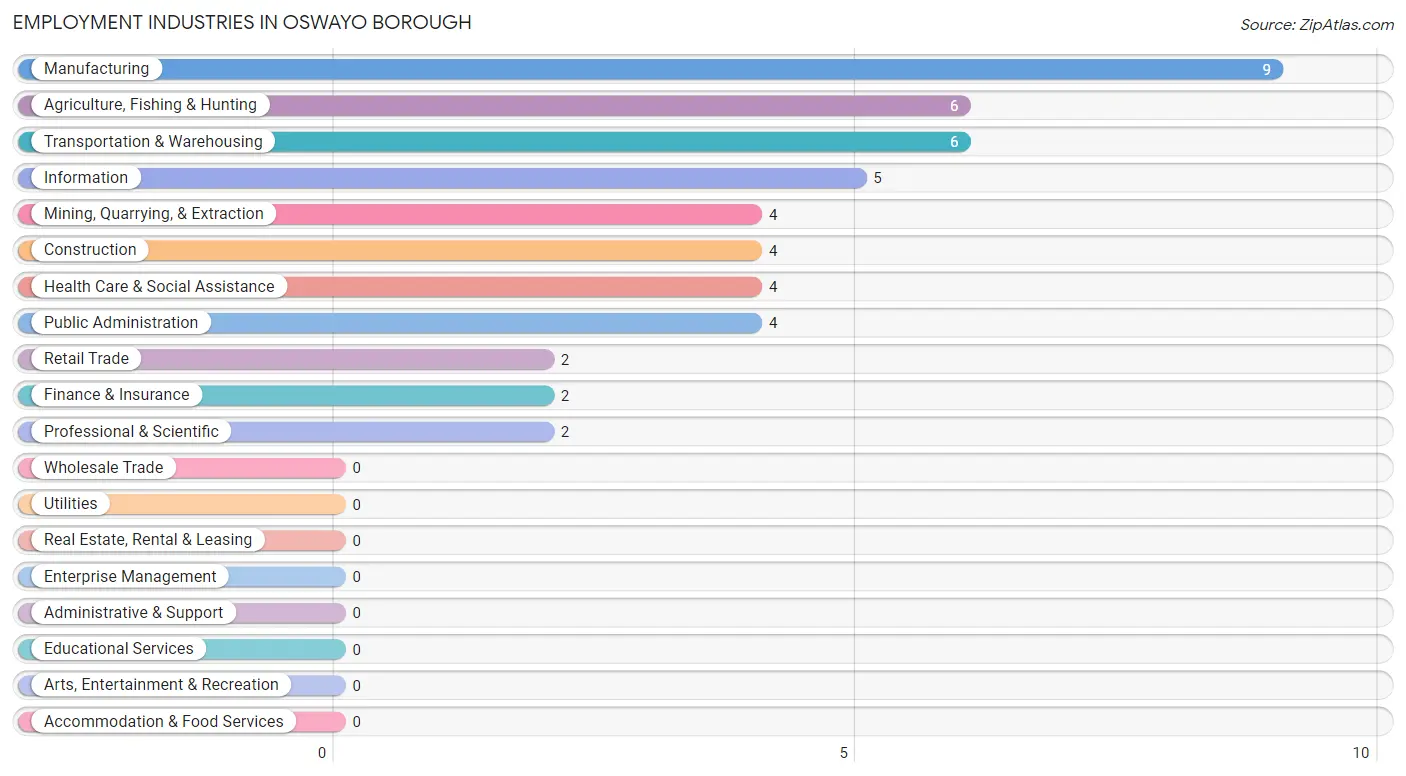
Employment Industries in Oswayo borough
The major employment industries in Oswayo borough include Manufacturing (9 | 18.0%), Agriculture, Fishing & Hunting (6 | 12.0%), Transportation & Warehousing (6 | 12.0%), Information (5 | 10.0%), and Mining, Quarrying, & Extraction (4 | 8.0%).
Employment Industries by Sex in Oswayo borough
The Oswayo borough industries that see more men than women are Mining, Quarrying, & Extraction (100.0%), Construction (100.0%), and Transportation & Warehousing (100.0%), whereas the industries that tend to have a higher number of women are Retail Trade (100.0%), Finance & Insurance (100.0%), and Professional & Scientific (100.0%).
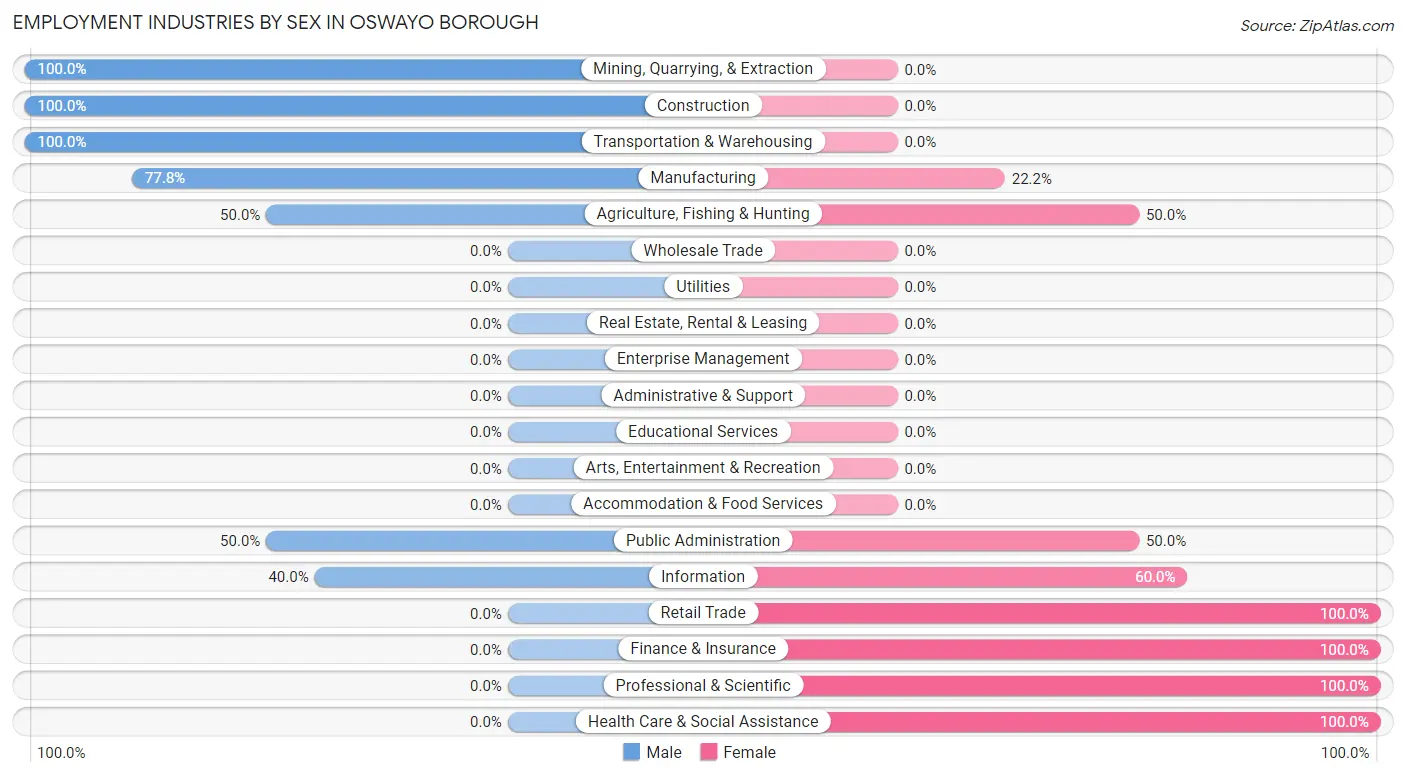
| Industry | Male | Female |
| Agriculture, Fishing & Hunting | 3 (50.0%) | 3 (50.0%) |
| Mining, Quarrying, & Extraction | 4 (100.0%) | 0 (0.0%) |
| Construction | 4 (100.0%) | 0 (0.0%) |
| Manufacturing | 7 (77.8%) | 2 (22.2%) |
| Wholesale Trade | 0 (0.0%) | 0 (0.0%) |
| Retail Trade | 0 (0.0%) | 2 (100.0%) |
| Transportation & Warehousing | 6 (100.0%) | 0 (0.0%) |
| Utilities | 0 (0.0%) | 0 (0.0%) |
| Information | 2 (40.0%) | 3 (60.0%) |
| Finance & Insurance | 0 (0.0%) | 2 (100.0%) |
| Real Estate, Rental & Leasing | 0 (0.0%) | 0 (0.0%) |
| Professional & Scientific | 0 (0.0%) | 2 (100.0%) |
| Enterprise Management | 0 (0.0%) | 0 (0.0%) |
| Administrative & Support | 0 (0.0%) | 0 (0.0%) |
| Educational Services | 0 (0.0%) | 0 (0.0%) |
| Health Care & Social Assistance | 0 (0.0%) | 4 (100.0%) |
| Arts, Entertainment & Recreation | 0 (0.0%) | 0 (0.0%) |
| Accommodation & Food Services | 0 (0.0%) | 0 (0.0%) |
| Public Administration | 2 (50.0%) | 2 (50.0%) |
| Total | 30 (60.0%) | 20 (40.0%) |
Education in Oswayo borough
School Enrollment in Oswayo borough
The most common levels of schooling among the 19 students in Oswayo borough are middle school (6 | 31.6%), high school (6 | 31.6%), and kindergarten (2 | 10.5%).
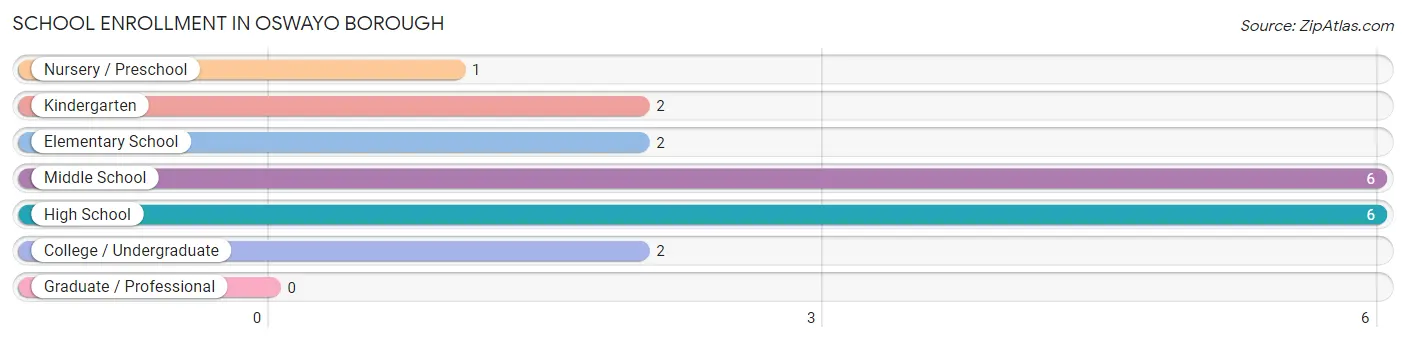
| School Level | # Students | % Students |
| Nursery / Preschool | 1 | 5.3% |
| Kindergarten | 2 | 10.5% |
| Elementary School | 2 | 10.5% |
| Middle School | 6 | 31.6% |
| High School | 6 | 31.6% |
| College / Undergraduate | 2 | 10.5% |
| Graduate / Professional | 0 | 0.0% |
| Total | 19 | 100.0% |
School Enrollment by Age by Funding Source in Oswayo borough
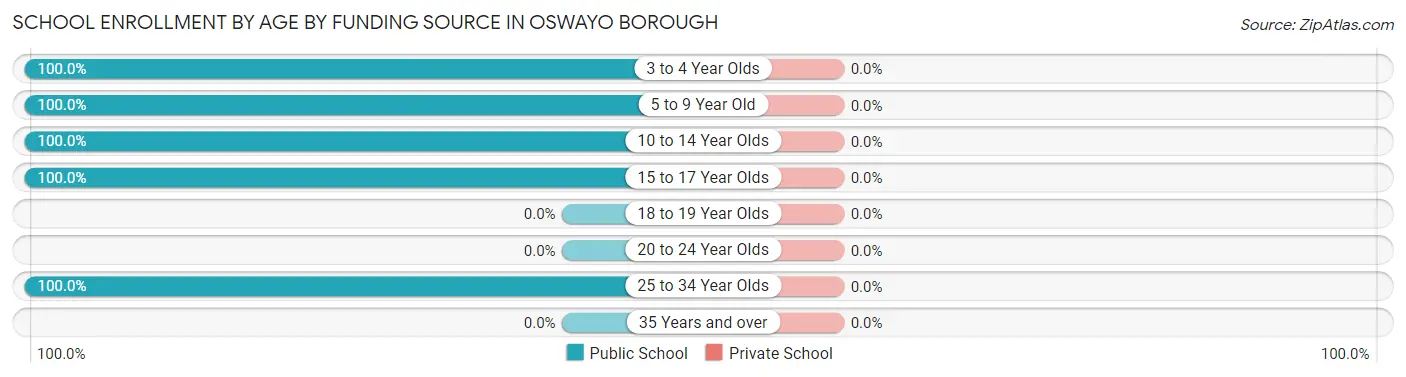
| Age Bracket | Public School | Private School |
| 3 to 4 Year Olds | 1 (100.0%) | 0 (0.0%) |
| 5 to 9 Year Old | 4 (100.0%) | 0 (0.0%) |
| 10 to 14 Year Olds | 6 (100.0%) | 0 (0.0%) |
| 15 to 17 Year Olds | 6 (100.0%) | 0 (0.0%) |
| 18 to 19 Year Olds | 0 (0.0%) | 0 (0.0%) |
| 20 to 24 Year Olds | 0 (0.0%) | 0 (0.0%) |
| 25 to 34 Year Olds | 2 (100.0%) | 0 (0.0%) |
| 35 Years and over | 0 (0.0%) | 0 (0.0%) |
| Total | 19 (100.0%) | 0 (0.0%) |
Educational Attainment by Field of Study in Oswayo borough
Business (4 | 80.0%), and bio, nature & agricultural (1 | 20.0%) are the most common fields of study among 5 individuals in Oswayo borough who have obtained a bachelor's degree or higher.
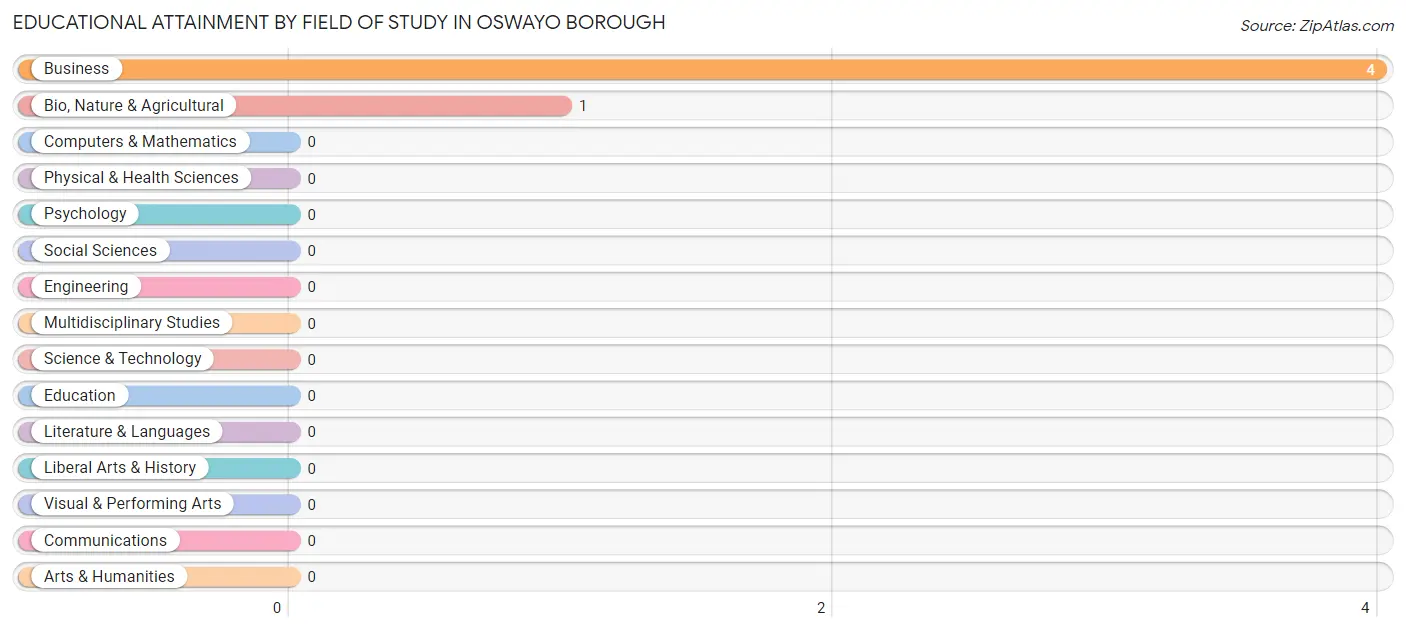
| Field of Study | # Graduates | % Graduates |
| Computers & Mathematics | 0 | 0.0% |
| Bio, Nature & Agricultural | 1 | 20.0% |
| Physical & Health Sciences | 0 | 0.0% |
| Psychology | 0 | 0.0% |
| Social Sciences | 0 | 0.0% |
| Engineering | 0 | 0.0% |
| Multidisciplinary Studies | 0 | 0.0% |
| Science & Technology | 0 | 0.0% |
| Business | 4 | 80.0% |
| Education | 0 | 0.0% |
| Literature & Languages | 0 | 0.0% |
| Liberal Arts & History | 0 | 0.0% |
| Visual & Performing Arts | 0 | 0.0% |
| Communications | 0 | 0.0% |
| Arts & Humanities | 0 | 0.0% |
| Total | 5 | 100.0% |
Transportation & Commute in Oswayo borough
Vehicle Availability by Sex in Oswayo borough
The most prevalent vehicle ownership categories in Oswayo borough are males with 2 vehicles (14, accounting for 46.7%) and females with 2 vehicles (8, making up 70.0%).
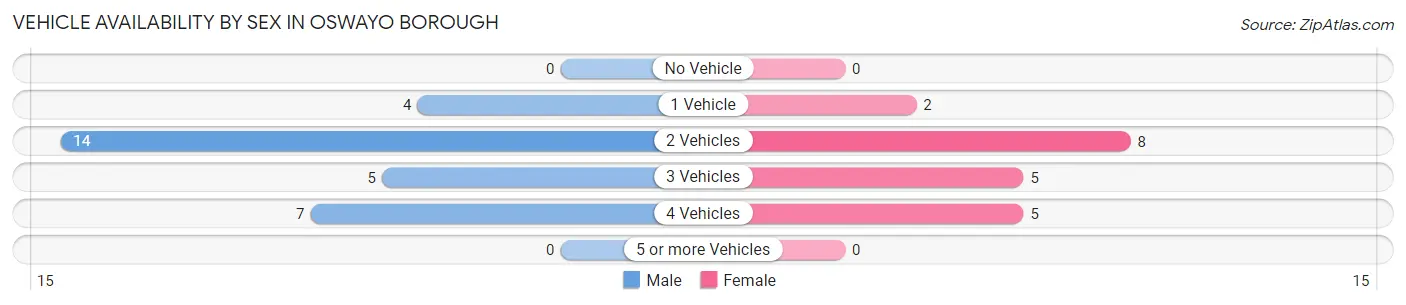
| Vehicles Available | Male | Female |
| No Vehicle | 0 (0.0%) | 0 (0.0%) |
| 1 Vehicle | 4 (13.3%) | 2 (10.0%) |
| 2 Vehicles | 14 (46.7%) | 8 (40.0%) |
| 3 Vehicles | 5 (16.7%) | 5 (25.0%) |
| 4 Vehicles | 7 (23.3%) | 5 (25.0%) |
| 5 or more Vehicles | 0 (0.0%) | 0 (0.0%) |
| Total | 30 (100.0%) | 20 (100.0%) |
Commute Time in Oswayo borough
The most frequently occuring commute durations in Oswayo borough are 30 to 34 minutes (13 commuters, 27.1%), 45 to 59 minutes (8 commuters, 16.7%), and 15 to 19 minutes (6 commuters, 12.5%).
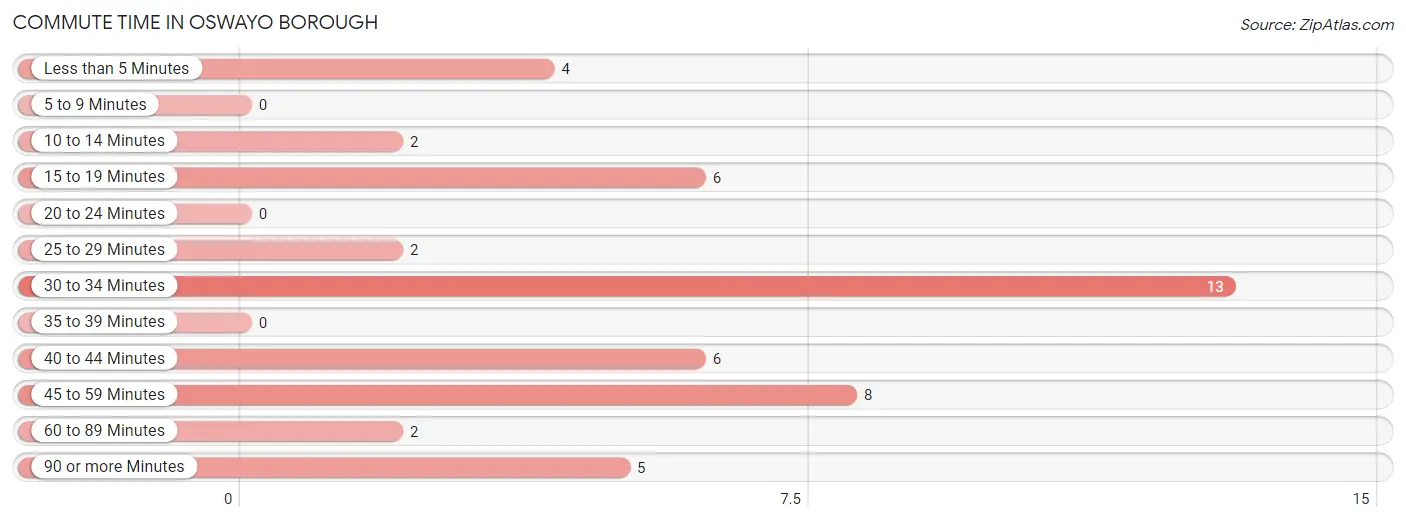
| Commute Time | # Commuters | % Commuters |
| Less than 5 Minutes | 4 | 8.3% |
| 5 to 9 Minutes | 0 | 0.0% |
| 10 to 14 Minutes | 2 | 4.2% |
| 15 to 19 Minutes | 6 | 12.5% |
| 20 to 24 Minutes | 0 | 0.0% |
| 25 to 29 Minutes | 2 | 4.2% |
| 30 to 34 Minutes | 13 | 27.1% |
| 35 to 39 Minutes | 0 | 0.0% |
| 40 to 44 Minutes | 6 | 12.5% |
| 45 to 59 Minutes | 8 | 16.7% |
| 60 to 89 Minutes | 2 | 4.2% |
| 90 or more Minutes | 5 | 10.4% |
Commute Time by Sex in Oswayo borough
The most common commute times in Oswayo borough are 30 to 34 minutes (8 commuters, 28.6%) for males and 45 to 59 minutes (6 commuters, 30.0%) for females.
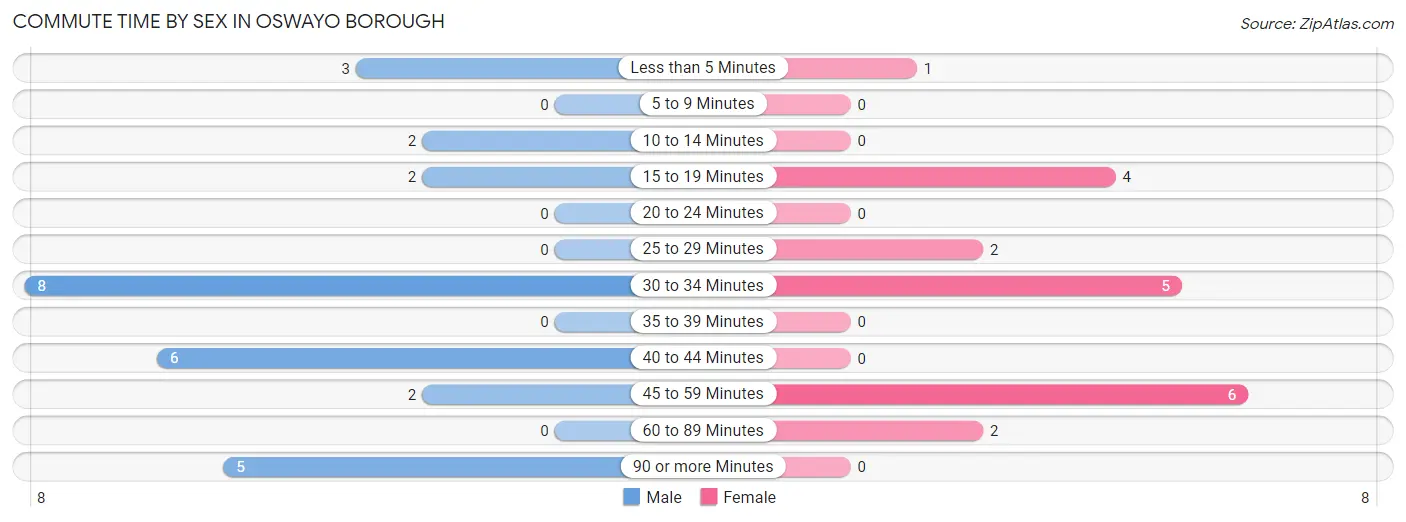
| Commute Time | Male | Female |
| Less than 5 Minutes | 3 (10.7%) | 1 (5.0%) |
| 5 to 9 Minutes | 0 (0.0%) | 0 (0.0%) |
| 10 to 14 Minutes | 2 (7.1%) | 0 (0.0%) |
| 15 to 19 Minutes | 2 (7.1%) | 4 (20.0%) |
| 20 to 24 Minutes | 0 (0.0%) | 0 (0.0%) |
| 25 to 29 Minutes | 0 (0.0%) | 2 (10.0%) |
| 30 to 34 Minutes | 8 (28.6%) | 5 (25.0%) |
| 35 to 39 Minutes | 0 (0.0%) | 0 (0.0%) |
| 40 to 44 Minutes | 6 (21.4%) | 0 (0.0%) |
| 45 to 59 Minutes | 2 (7.1%) | 6 (30.0%) |
| 60 to 89 Minutes | 0 (0.0%) | 2 (10.0%) |
| 90 or more Minutes | 5 (17.9%) | 0 (0.0%) |
Time of Departure to Work by Sex in Oswayo borough
The most frequent times of departure to work in Oswayo borough are 12:00 PM to 3:59 PM (10, 35.7%) for males and 7:00 AM to 7:29 AM (7, 35.0%) for females.
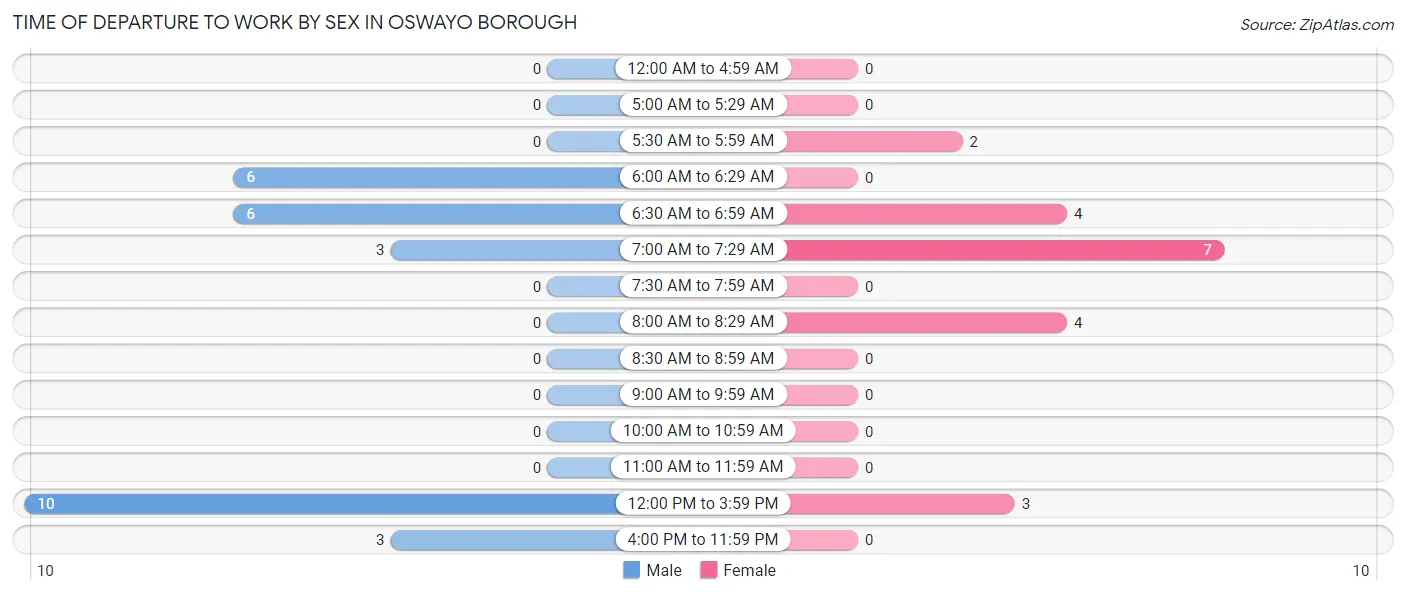
| Time of Departure | Male | Female |
| 12:00 AM to 4:59 AM | 0 (0.0%) | 0 (0.0%) |
| 5:00 AM to 5:29 AM | 0 (0.0%) | 0 (0.0%) |
| 5:30 AM to 5:59 AM | 0 (0.0%) | 2 (10.0%) |
| 6:00 AM to 6:29 AM | 6 (21.4%) | 0 (0.0%) |
| 6:30 AM to 6:59 AM | 6 (21.4%) | 4 (20.0%) |
| 7:00 AM to 7:29 AM | 3 (10.7%) | 7 (35.0%) |
| 7:30 AM to 7:59 AM | 0 (0.0%) | 0 (0.0%) |
| 8:00 AM to 8:29 AM | 0 (0.0%) | 4 (20.0%) |
| 8:30 AM to 8:59 AM | 0 (0.0%) | 0 (0.0%) |
| 9:00 AM to 9:59 AM | 0 (0.0%) | 0 (0.0%) |
| 10:00 AM to 10:59 AM | 0 (0.0%) | 0 (0.0%) |
| 11:00 AM to 11:59 AM | 0 (0.0%) | 0 (0.0%) |
| 12:00 PM to 3:59 PM | 10 (35.7%) | 3 (15.0%) |
| 4:00 PM to 11:59 PM | 3 (10.7%) | 0 (0.0%) |
| Total | 28 (100.0%) | 20 (100.0%) |
Housing Occupancy in Oswayo borough
Occupancy by Ownership in Oswayo borough
Of the total 41 dwellings in Oswayo borough, owner-occupied units account for 36 (87.8%), while renter-occupied units make up 5 (12.2%).
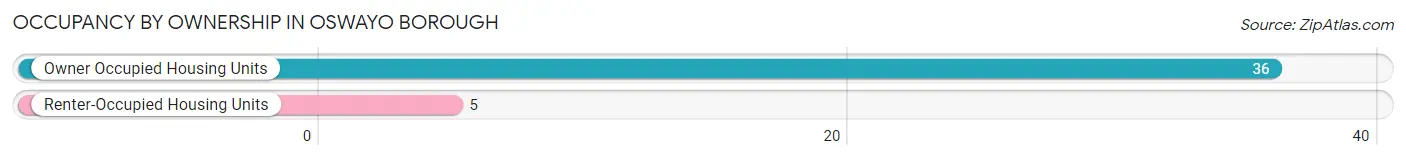
| Occupancy | # Housing Units | % Housing Units |
| Owner Occupied Housing Units | 36 | 87.8% |
| Renter-Occupied Housing Units | 5 | 12.2% |
| Total Occupied Housing Units | 41 | 100.0% |
Occupancy by Household Size in Oswayo borough
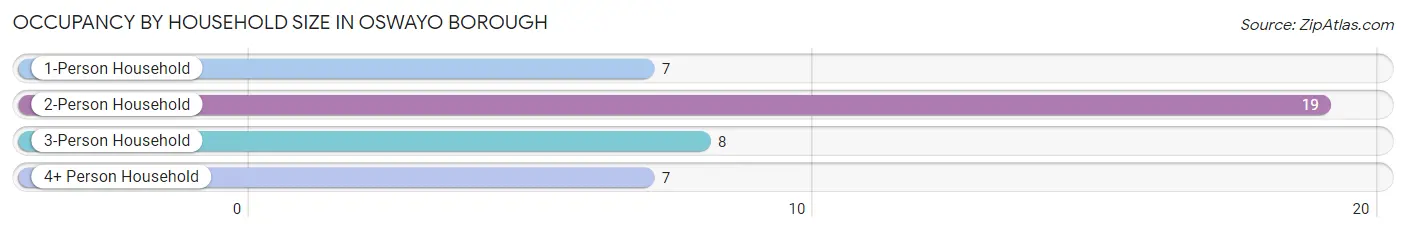
| Household Size | # Housing Units | % Housing Units |
| 1-Person Household | 7 | 17.1% |
| 2-Person Household | 19 | 46.3% |
| 3-Person Household | 8 | 19.5% |
| 4+ Person Household | 7 | 17.1% |
| Total Housing Units | 41 | 100.0% |
Occupancy by Ownership by Household Size in Oswayo borough
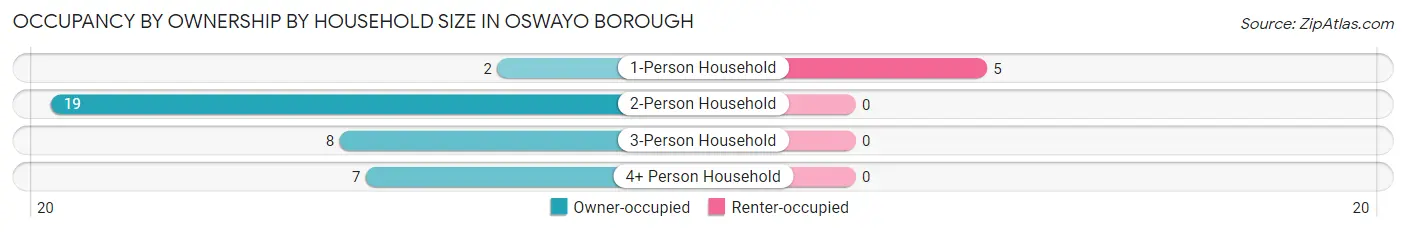
| Household Size | Owner-occupied | Renter-occupied |
| 1-Person Household | 2 (28.6%) | 5 (71.4%) |
| 2-Person Household | 19 (100.0%) | 0 (0.0%) |
| 3-Person Household | 8 (100.0%) | 0 (0.0%) |
| 4+ Person Household | 7 (100.0%) | 0 (0.0%) |
| Total Housing Units | 36 (87.8%) | 5 (12.2%) |
Occupancy by Educational Attainment in Oswayo borough
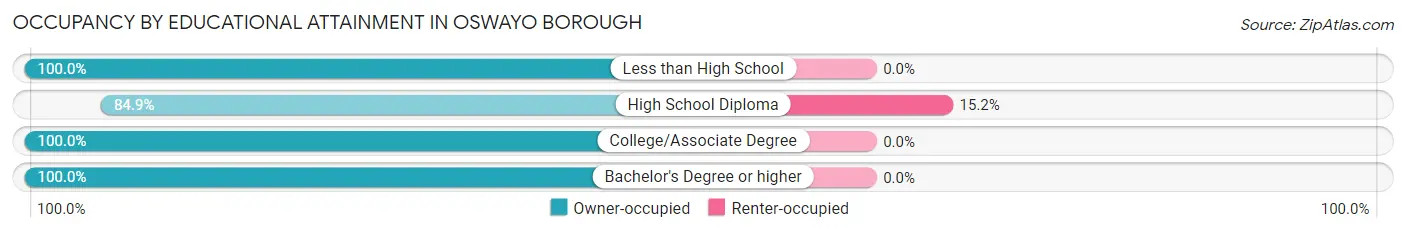
| Household Size | Owner-occupied | Renter-occupied |
| Less than High School | 2 (100.0%) | 0 (0.0%) |
| High School Diploma | 28 (84.9%) | 5 (15.1%) |
| College/Associate Degree | 2 (100.0%) | 0 (0.0%) |
| Bachelor's Degree or higher | 4 (100.0%) | 0 (0.0%) |
Occupancy by Age of Householder in Oswayo borough
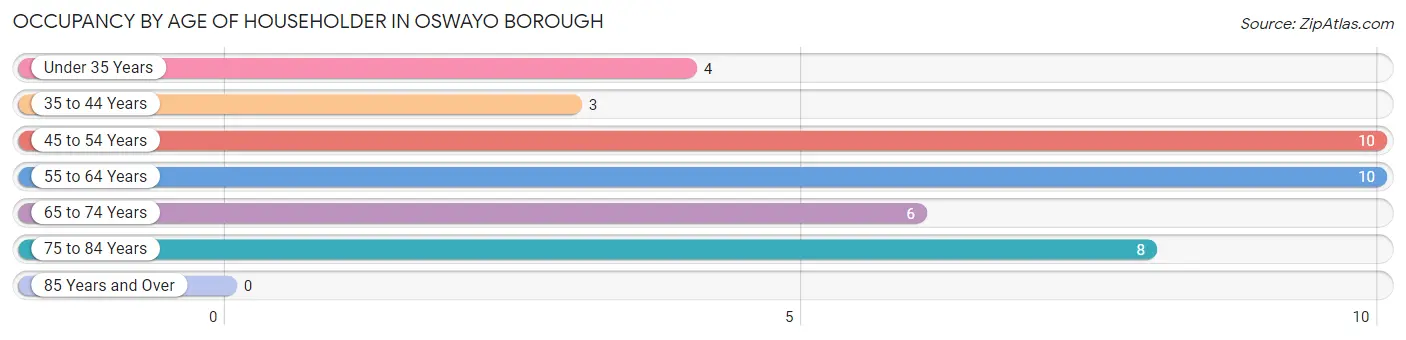
| Age Bracket | # Households | % Households |
| Under 35 Years | 4 | 9.8% |
| 35 to 44 Years | 3 | 7.3% |
| 45 to 54 Years | 10 | 24.4% |
| 55 to 64 Years | 10 | 24.4% |
| 65 to 74 Years | 6 | 14.6% |
| 75 to 84 Years | 8 | 19.5% |
| 85 Years and Over | 0 | 0.0% |
| Total | 41 | 100.0% |
Housing Finances in Oswayo borough
Median Income by Occupancy in Oswayo borough
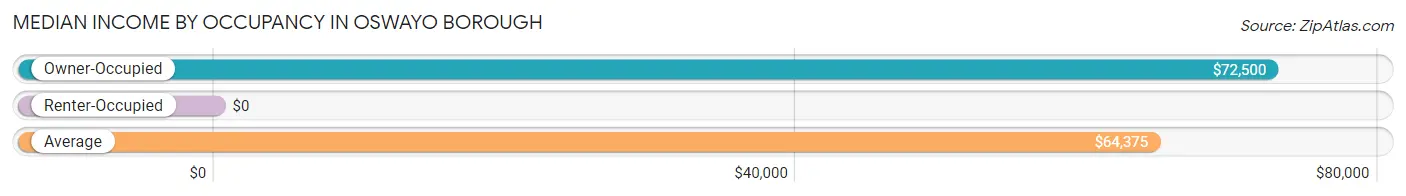
| Occupancy Type | # Households | Median Income |
| Owner-Occupied | 36 (87.8%) | $72,500 |
| Renter-Occupied | 5 (12.2%) | $0 |
| Average | 41 (100.0%) | $64,375 |
Occupancy by Householder Income Bracket in Oswayo borough
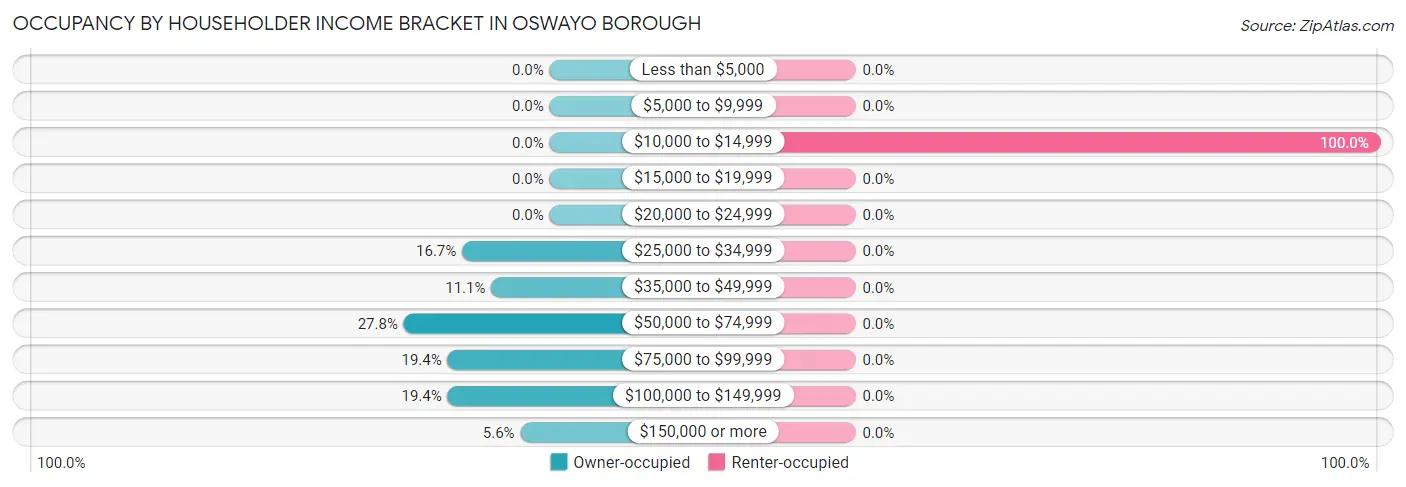
| Income Bracket | Owner-occupied | Renter-occupied |
| Less than $5,000 | 0 (0.0%) | 0 (0.0%) |
| $5,000 to $9,999 | 0 (0.0%) | 0 (0.0%) |
| $10,000 to $14,999 | 0 (0.0%) | 5 (100.0%) |
| $15,000 to $19,999 | 0 (0.0%) | 0 (0.0%) |
| $20,000 to $24,999 | 0 (0.0%) | 0 (0.0%) |
| $25,000 to $34,999 | 6 (16.7%) | 0 (0.0%) |
| $35,000 to $49,999 | 4 (11.1%) | 0 (0.0%) |
| $50,000 to $74,999 | 10 (27.8%) | 0 (0.0%) |
| $75,000 to $99,999 | 7 (19.4%) | 0 (0.0%) |
| $100,000 to $149,999 | 7 (19.4%) | 0 (0.0%) |
| $150,000 or more | 2 (5.6%) | 0 (0.0%) |
| Total | 36 (100.0%) | 5 (100.0%) |
Monthly Housing Cost Tiers in Oswayo borough
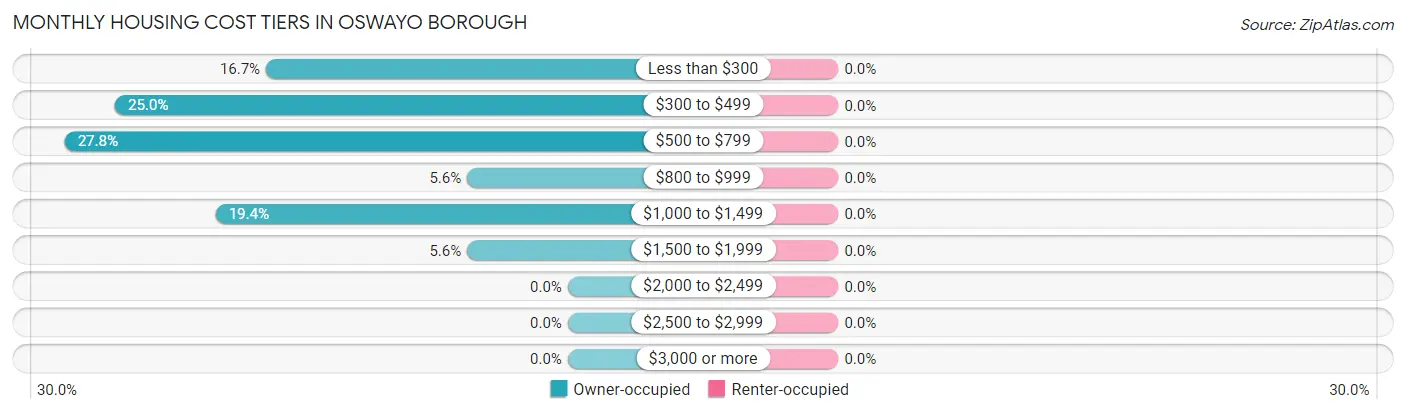
| Monthly Cost | Owner-occupied | Renter-occupied |
| Less than $300 | 6 (16.7%) | 0 (0.0%) |
| $300 to $499 | 9 (25.0%) | 0 (0.0%) |
| $500 to $799 | 10 (27.8%) | 0 (0.0%) |
| $800 to $999 | 2 (5.6%) | 0 (0.0%) |
| $1,000 to $1,499 | 7 (19.4%) | 0 (0.0%) |
| $1,500 to $1,999 | 2 (5.6%) | 0 (0.0%) |
| $2,000 to $2,499 | 0 (0.0%) | 0 (0.0%) |
| $2,500 to $2,999 | 0 (0.0%) | 0 (0.0%) |
| $3,000 or more | 0 (0.0%) | 0 (0.0%) |
| Total | 36 (100.0%) | 5 (100.0%) |
Physical Housing Characteristics in Oswayo borough
Housing Structures in Oswayo borough
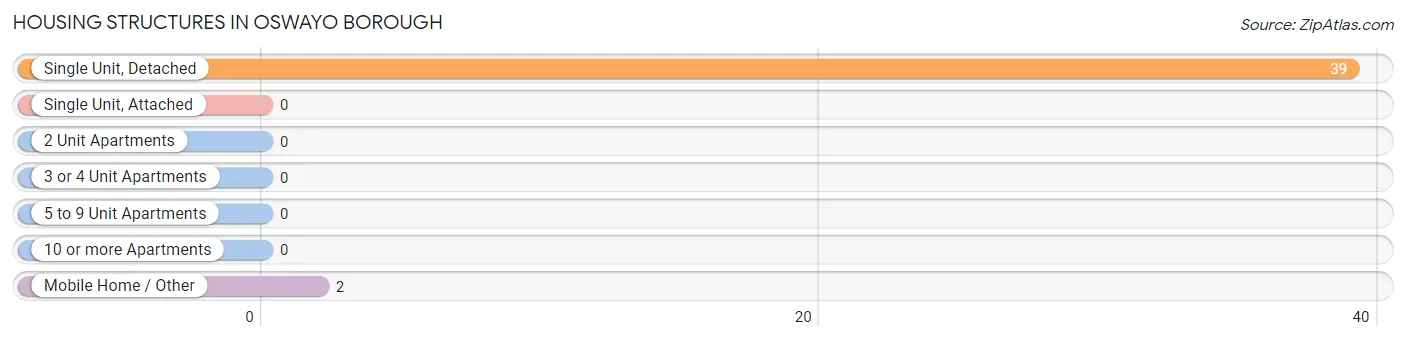
| Structure Type | # Housing Units | % Housing Units |
| Single Unit, Detached | 39 | 95.1% |
| Single Unit, Attached | 0 | 0.0% |
| 2 Unit Apartments | 0 | 0.0% |
| 3 or 4 Unit Apartments | 0 | 0.0% |
| 5 to 9 Unit Apartments | 0 | 0.0% |
| 10 or more Apartments | 0 | 0.0% |
| Mobile Home / Other | 2 | 4.9% |
| Total | 41 | 100.0% |
Housing Structures by Occupancy in Oswayo borough
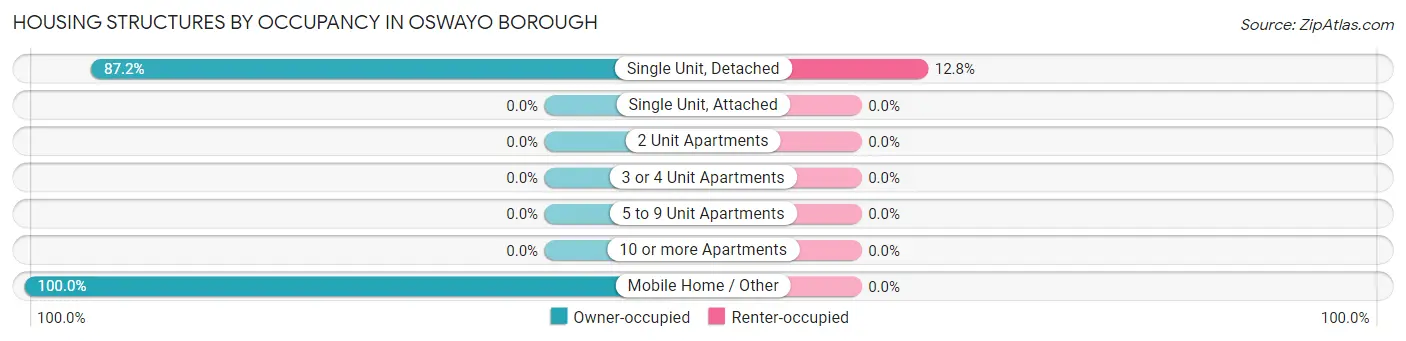
| Structure Type | Owner-occupied | Renter-occupied |
| Single Unit, Detached | 34 (87.2%) | 5 (12.8%) |
| Single Unit, Attached | 0 (0.0%) | 0 (0.0%) |
| 2 Unit Apartments | 0 (0.0%) | 0 (0.0%) |
| 3 or 4 Unit Apartments | 0 (0.0%) | 0 (0.0%) |
| 5 to 9 Unit Apartments | 0 (0.0%) | 0 (0.0%) |
| 10 or more Apartments | 0 (0.0%) | 0 (0.0%) |
| Mobile Home / Other | 2 (100.0%) | 0 (0.0%) |
| Total | 36 (87.8%) | 5 (12.2%) |
Housing Structures by Number of Rooms in Oswayo borough
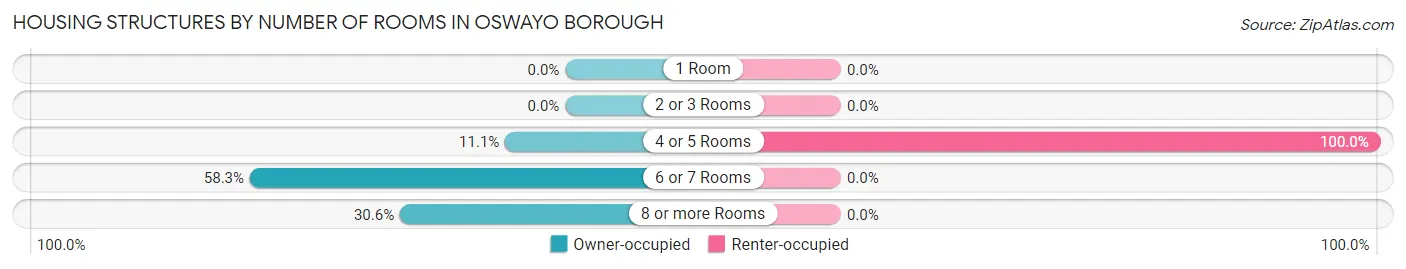
| Number of Rooms | Owner-occupied | Renter-occupied |
| 1 Room | 0 (0.0%) | 0 (0.0%) |
| 2 or 3 Rooms | 0 (0.0%) | 0 (0.0%) |
| 4 or 5 Rooms | 4 (11.1%) | 5 (100.0%) |
| 6 or 7 Rooms | 21 (58.3%) | 0 (0.0%) |
| 8 or more Rooms | 11 (30.6%) | 0 (0.0%) |
| Total | 36 (100.0%) | 5 (100.0%) |
Housing Structure by Heating Type in Oswayo borough
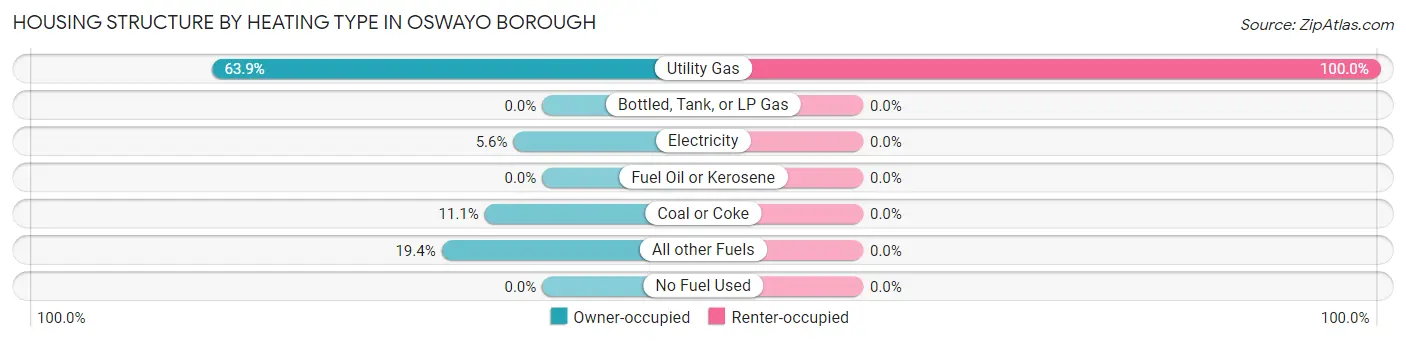
| Heating Type | Owner-occupied | Renter-occupied |
| Utility Gas | 23 (63.9%) | 5 (100.0%) |
| Bottled, Tank, or LP Gas | 0 (0.0%) | 0 (0.0%) |
| Electricity | 2 (5.6%) | 0 (0.0%) |
| Fuel Oil or Kerosene | 0 (0.0%) | 0 (0.0%) |
| Coal or Coke | 4 (11.1%) | 0 (0.0%) |
| All other Fuels | 7 (19.4%) | 0 (0.0%) |
| No Fuel Used | 0 (0.0%) | 0 (0.0%) |
| Total | 36 (100.0%) | 5 (100.0%) |
Household Vehicle Usage in Oswayo borough
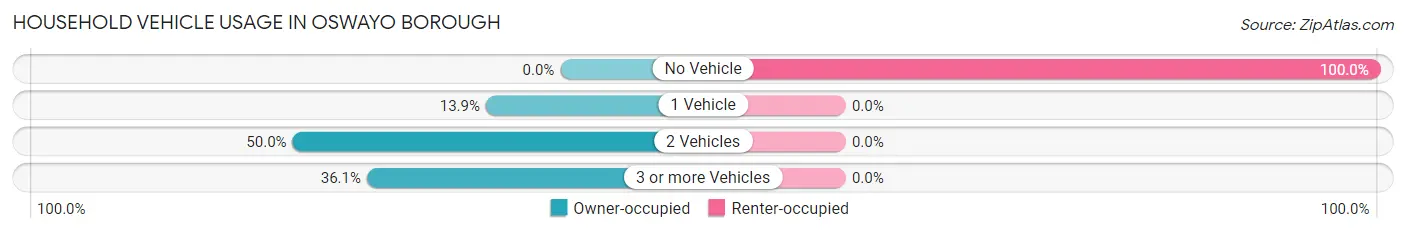
| Vehicles per Household | Owner-occupied | Renter-occupied |
| No Vehicle | 0 (0.0%) | 5 (100.0%) |
| 1 Vehicle | 5 (13.9%) | 0 (0.0%) |
| 2 Vehicles | 18 (50.0%) | 0 (0.0%) |
| 3 or more Vehicles | 13 (36.1%) | 0 (0.0%) |
| Total | 36 (100.0%) | 5 (100.0%) |
Real Estate & Mortgages in Oswayo borough
Real Estate and Mortgage Overview in Oswayo borough
| Characteristic | Without Mortgage | With Mortgage |
| Housing Units | 22 | 14 |
| Median Property Value | $85,000 | $97,500 |
| Median Household Income | $83,750 | $0 |
| Monthly Housing Costs | $425 | $0 |
| Real Estate Taxes | $1,625 | $0 |
Property Value by Mortgage Status in Oswayo borough
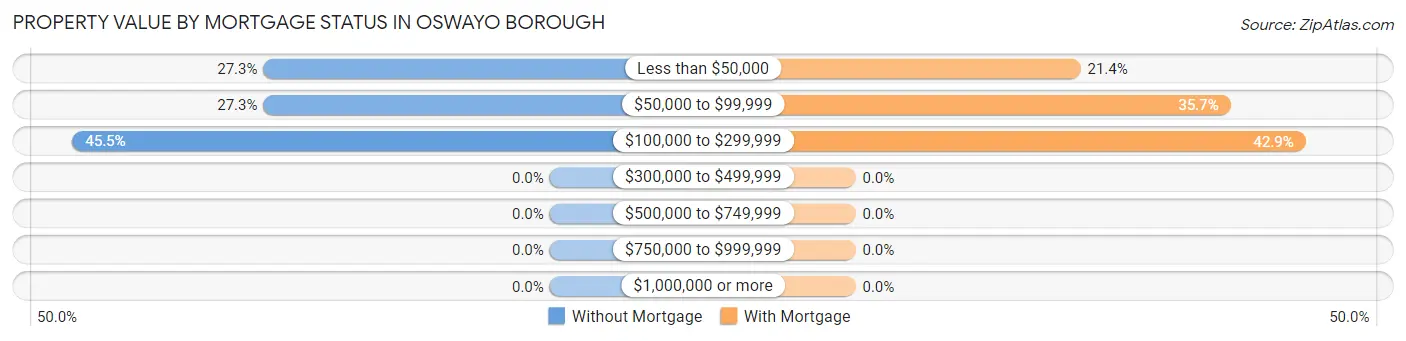
| Property Value | Without Mortgage | With Mortgage |
| Less than $50,000 | 6 (27.3%) | 3 (21.4%) |
| $50,000 to $99,999 | 6 (27.3%) | 5 (35.7%) |
| $100,000 to $299,999 | 10 (45.5%) | 6 (42.9%) |
| $300,000 to $499,999 | 0 (0.0%) | 0 (0.0%) |
| $500,000 to $749,999 | 0 (0.0%) | 0 (0.0%) |
| $750,000 to $999,999 | 0 (0.0%) | 0 (0.0%) |
| $1,000,000 or more | 0 (0.0%) | 0 (0.0%) |
| Total | 22 (100.0%) | 14 (100.0%) |
Household Income by Mortgage Status in Oswayo borough
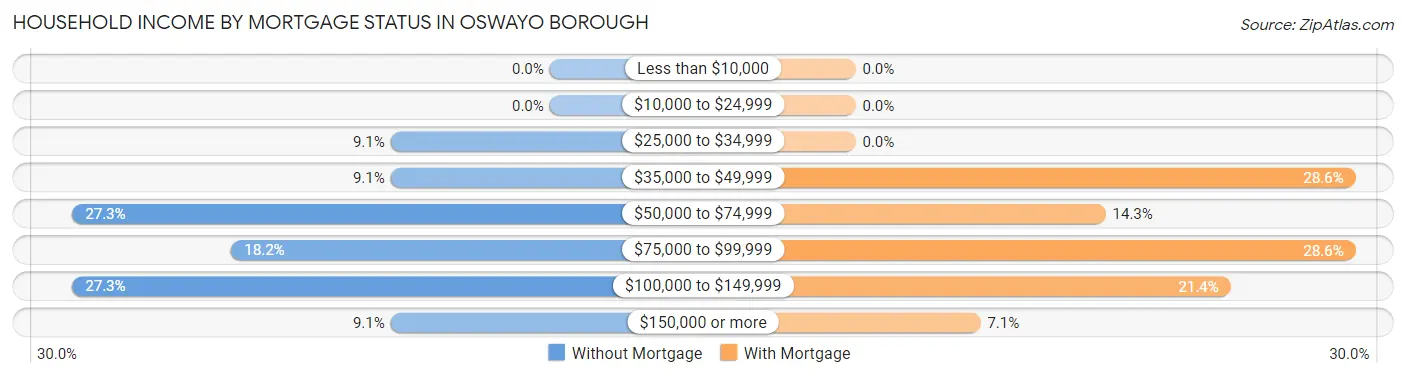
| Household Income | Without Mortgage | With Mortgage |
| Less than $10,000 | 0 (0.0%) | 0 (0.0%) |
| $10,000 to $24,999 | 0 (0.0%) | 0 (0.0%) |
| $25,000 to $34,999 | 2 (9.1%) | 0 (0.0%) |
| $35,000 to $49,999 | 2 (9.1%) | 4 (28.6%) |
| $50,000 to $74,999 | 6 (27.3%) | 2 (14.3%) |
| $75,000 to $99,999 | 4 (18.2%) | 4 (28.6%) |
| $100,000 to $149,999 | 6 (27.3%) | 3 (21.4%) |
| $150,000 or more | 2 (9.1%) | 1 (7.1%) |
| Total | 22 (100.0%) | 14 (100.0%) |
Property Value to Household Income Ratio in Oswayo borough
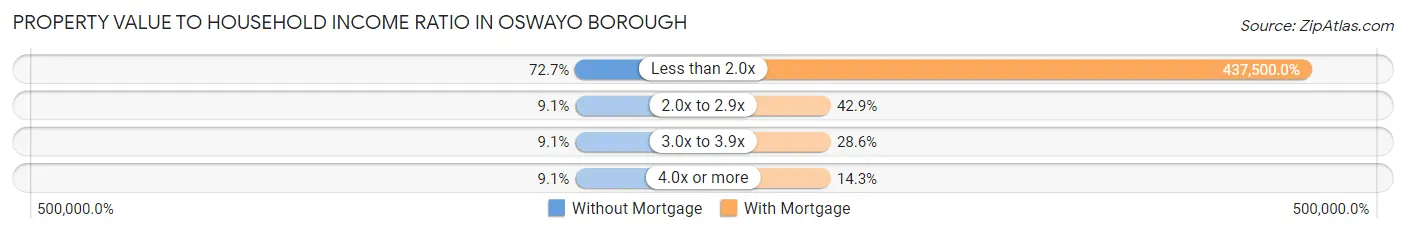
| Value-to-Income Ratio | Without Mortgage | With Mortgage |
| Less than 2.0x | 16 (72.7%) | 61,250 (437,500.0%) |
| 2.0x to 2.9x | 2 (9.1%) | 6 (42.9%) |
| 3.0x to 3.9x | 2 (9.1%) | 4 (28.6%) |
| 4.0x or more | 2 (9.1%) | 2 (14.3%) |
| Total | 22 (100.0%) | 14 (100.0%) |
Real Estate Taxes by Mortgage Status in Oswayo borough
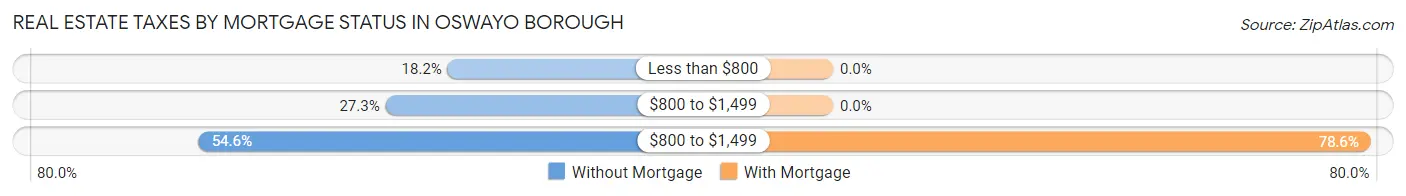
| Property Taxes | Without Mortgage | With Mortgage |
| Less than $800 | 4 (18.2%) | 0 (0.0%) |
| $800 to $1,499 | 6 (27.3%) | 0 (0.0%) |
| $800 to $1,499 | 12 (54.5%) | 11 (78.6%) |
| Total | 22 (100.0%) | 14 (100.0%) |
Health & Disability in Oswayo borough
Health Insurance Coverage by Age in Oswayo borough
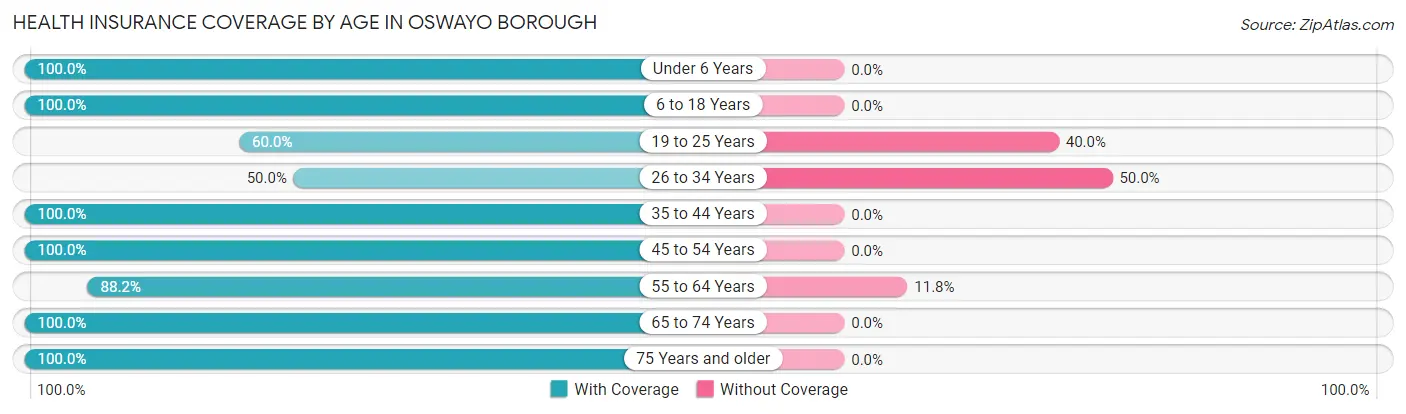
| Age Bracket | With Coverage | Without Coverage |
| Under 6 Years | 4 (100.0%) | 0 (0.0%) |
| 6 to 18 Years | 16 (100.0%) | 0 (0.0%) |
| 19 to 25 Years | 6 (60.0%) | 4 (40.0%) |
| 26 to 34 Years | 3 (50.0%) | 3 (50.0%) |
| 35 to 44 Years | 7 (100.0%) | 0 (0.0%) |
| 45 to 54 Years | 18 (100.0%) | 0 (0.0%) |
| 55 to 64 Years | 15 (88.2%) | 2 (11.8%) |
| 65 to 74 Years | 11 (100.0%) | 0 (0.0%) |
| 75 Years and older | 13 (100.0%) | 0 (0.0%) |
| Total | 93 (91.2%) | 9 (8.8%) |
Health Insurance Coverage by Citizenship Status in Oswayo borough
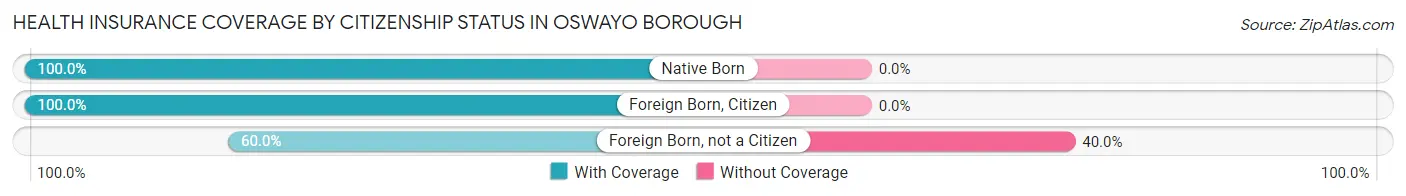
| Citizenship Status | With Coverage | Without Coverage |
| Native Born | 4 (100.0%) | 0 (0.0%) |
| Foreign Born, Citizen | 16 (100.0%) | 0 (0.0%) |
| Foreign Born, not a Citizen | 6 (60.0%) | 4 (40.0%) |
Health Insurance Coverage by Household Income in Oswayo borough
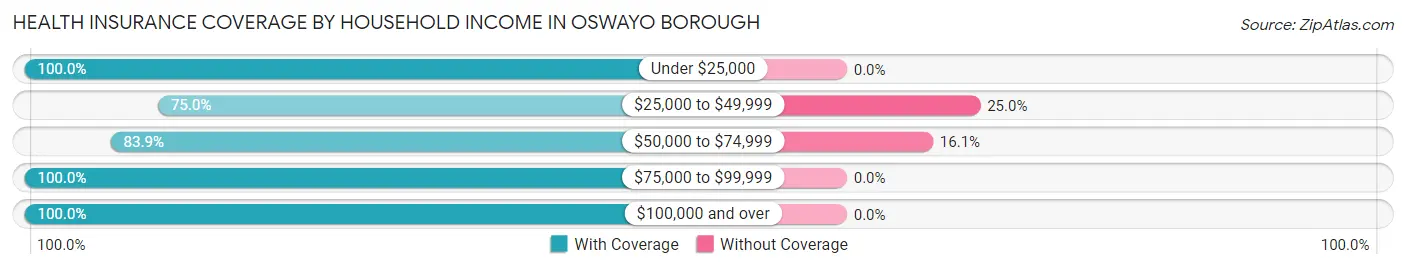
| Household Income | With Coverage | Without Coverage |
| Under $25,000 | 5 (100.0%) | 0 (0.0%) |
| $25,000 to $49,999 | 12 (75.0%) | 4 (25.0%) |
| $50,000 to $74,999 | 26 (83.9%) | 5 (16.1%) |
| $75,000 to $99,999 | 21 (100.0%) | 0 (0.0%) |
| $100,000 and over | 29 (100.0%) | 0 (0.0%) |
Public vs Private Health Insurance Coverage by Age in Oswayo borough
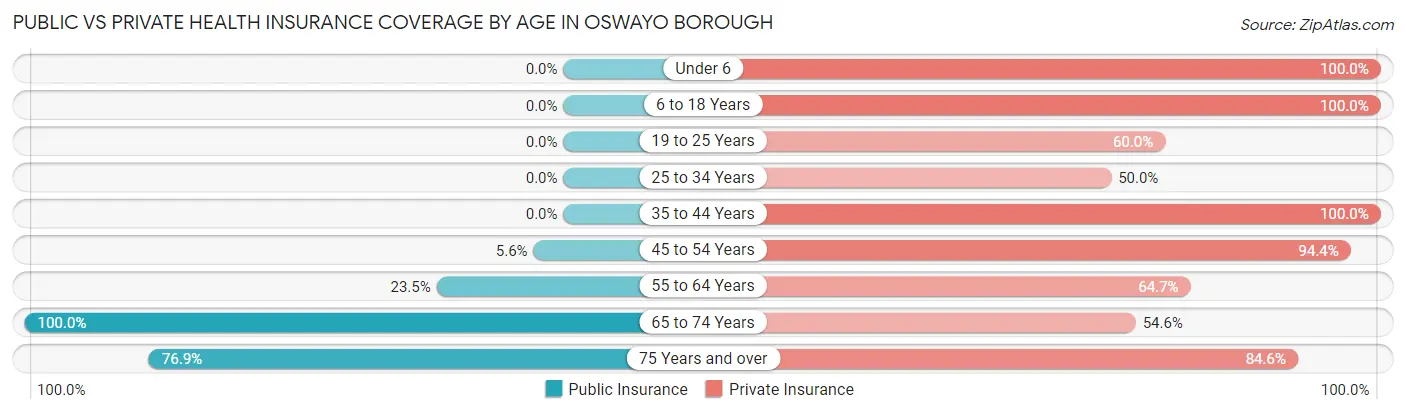
| Age Bracket | Public Insurance | Private Insurance |
| Under 6 | 0 (0.0%) | 4 (100.0%) |
| 6 to 18 Years | 0 (0.0%) | 16 (100.0%) |
| 19 to 25 Years | 0 (0.0%) | 6 (60.0%) |
| 25 to 34 Years | 0 (0.0%) | 3 (50.0%) |
| 35 to 44 Years | 0 (0.0%) | 7 (100.0%) |
| 45 to 54 Years | 1 (5.6%) | 17 (94.4%) |
| 55 to 64 Years | 4 (23.5%) | 11 (64.7%) |
| 65 to 74 Years | 11 (100.0%) | 6 (54.5%) |
| 75 Years and over | 10 (76.9%) | 11 (84.6%) |
| Total | 26 (25.5%) | 81 (79.4%) |
Disability Status by Sex by Age in Oswayo borough
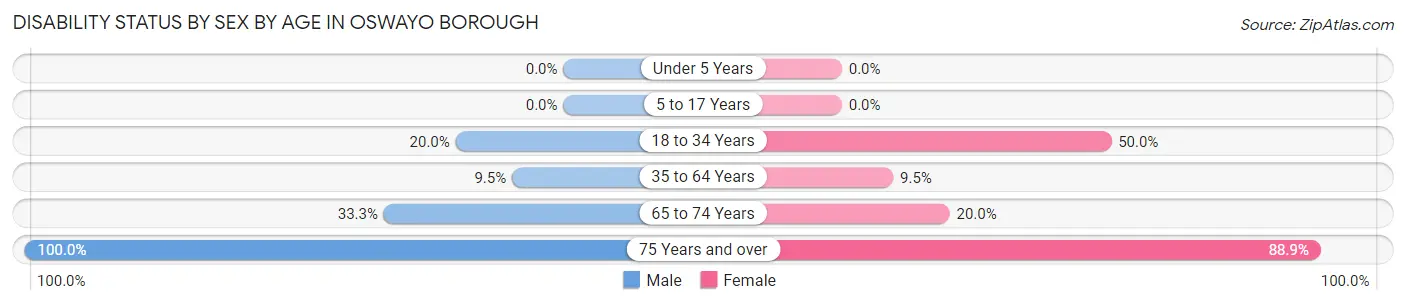
| Age Bracket | Male | Female |
| Under 5 Years | 0 (0.0%) | 0 (0.0%) |
| 5 to 17 Years | 0 (0.0%) | 0 (0.0%) |
| 18 to 34 Years | 2 (20.0%) | 3 (50.0%) |
| 35 to 64 Years | 2 (9.5%) | 2 (9.5%) |
| 65 to 74 Years | 2 (33.3%) | 1 (20.0%) |
| 75 Years and over | 4 (100.0%) | 8 (88.9%) |
Disability Class by Sex by Age in Oswayo borough
Disability Class: Hearing Difficulty
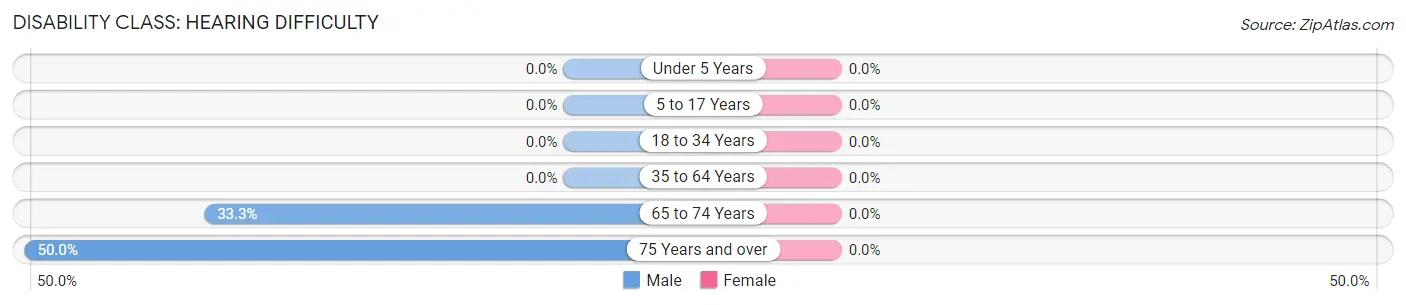
| Age Bracket | Male | Female |
| Under 5 Years | 0 (0.0%) | 0 (0.0%) |
| 5 to 17 Years | 0 (0.0%) | 0 (0.0%) |
| 18 to 34 Years | 0 (0.0%) | 0 (0.0%) |
| 35 to 64 Years | 0 (0.0%) | 0 (0.0%) |
| 65 to 74 Years | 2 (33.3%) | 0 (0.0%) |
| 75 Years and over | 2 (50.0%) | 0 (0.0%) |
Disability Class: Vision Difficulty
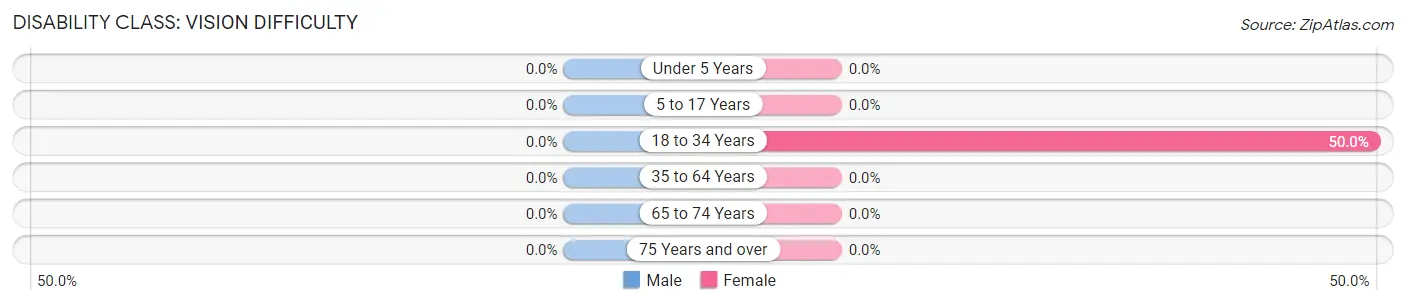
| Age Bracket | Male | Female |
| Under 5 Years | 0 (0.0%) | 0 (0.0%) |
| 5 to 17 Years | 0 (0.0%) | 0 (0.0%) |
| 18 to 34 Years | 0 (0.0%) | 3 (50.0%) |
| 35 to 64 Years | 0 (0.0%) | 0 (0.0%) |
| 65 to 74 Years | 0 (0.0%) | 0 (0.0%) |
| 75 Years and over | 0 (0.0%) | 0 (0.0%) |
Disability Class: Cognitive Difficulty
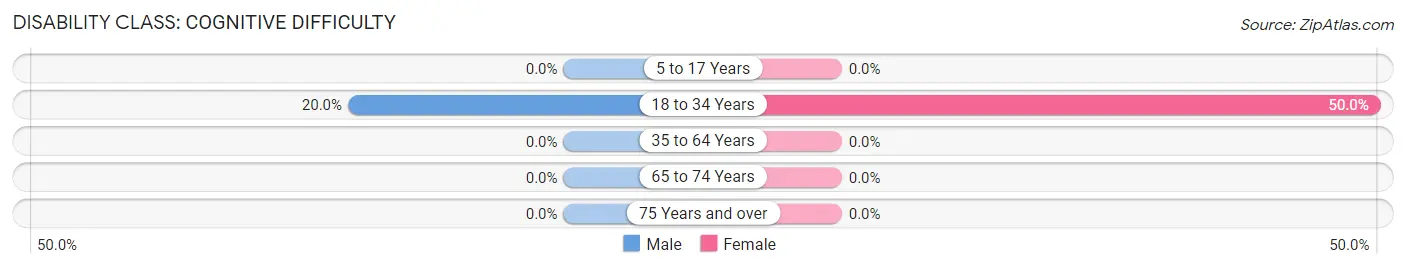
| Age Bracket | Male | Female |
| 5 to 17 Years | 0 (0.0%) | 0 (0.0%) |
| 18 to 34 Years | 2 (20.0%) | 3 (50.0%) |
| 35 to 64 Years | 0 (0.0%) | 0 (0.0%) |
| 65 to 74 Years | 0 (0.0%) | 0 (0.0%) |
| 75 Years and over | 0 (0.0%) | 0 (0.0%) |
Disability Class: Ambulatory Difficulty
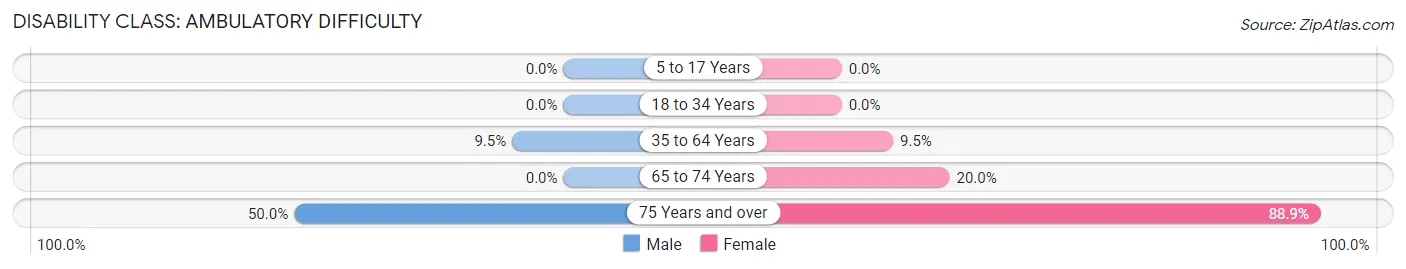
| Age Bracket | Male | Female |
| 5 to 17 Years | 0 (0.0%) | 0 (0.0%) |
| 18 to 34 Years | 0 (0.0%) | 0 (0.0%) |
| 35 to 64 Years | 2 (9.5%) | 2 (9.5%) |
| 65 to 74 Years | 0 (0.0%) | 1 (20.0%) |
| 75 Years and over | 2 (50.0%) | 8 (88.9%) |
Disability Class: Self-Care Difficulty
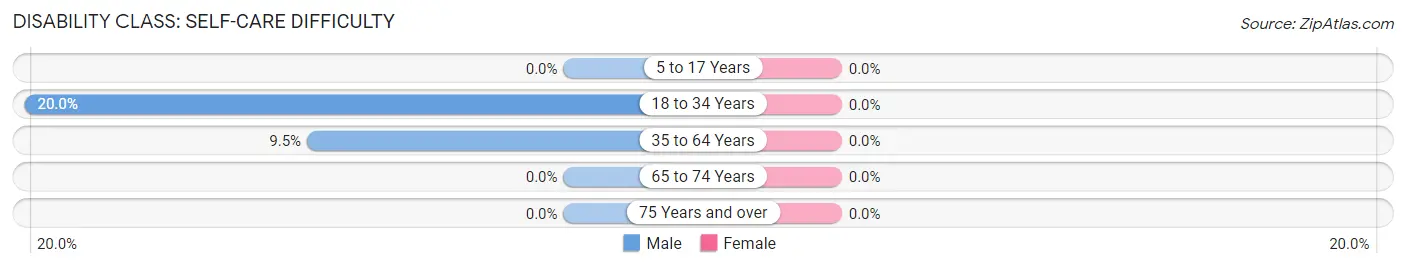
| Age Bracket | Male | Female |
| 5 to 17 Years | 0 (0.0%) | 0 (0.0%) |
| 18 to 34 Years | 2 (20.0%) | 0 (0.0%) |
| 35 to 64 Years | 2 (9.5%) | 0 (0.0%) |
| 65 to 74 Years | 0 (0.0%) | 0 (0.0%) |
| 75 Years and over | 0 (0.0%) | 0 (0.0%) |
Technology Access in Oswayo borough
Computing Device Access in Oswayo borough
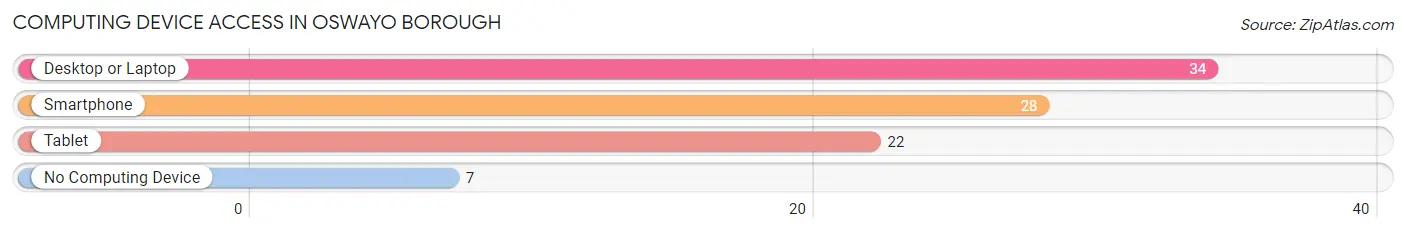
| Device Type | # Households | % Households |
| Desktop or Laptop | 34 | 82.9% |
| Smartphone | 28 | 68.3% |
| Tablet | 22 | 53.7% |
| No Computing Device | 7 | 17.1% |
| Total | 41 | 100.0% |
Internet Access in Oswayo borough
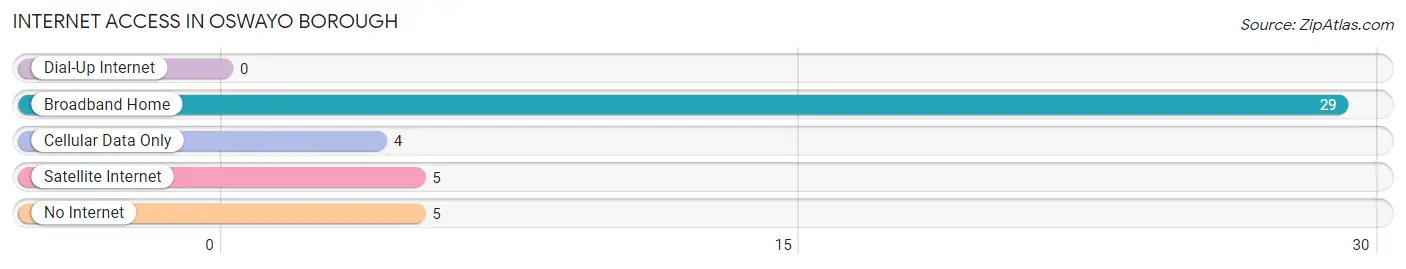
| Internet Type | # Households | % Households |
| Dial-Up Internet | 0 | 0.0% |
| Broadband Home | 29 | 70.7% |
| Cellular Data Only | 4 | 9.8% |
| Satellite Internet | 5 | 12.2% |
| No Internet | 5 | 12.2% |
| Total | 41 | 100.0% |
Oswayo borough Summary
Oswayo Borough is a small borough located in Potter County, Pennsylvania. It is situated in the northwest corner of the state, just south of the New York border. The borough is home to a population of just over 1,000 people, and is part of the larger Potter County area.
History
Oswayo Borough was first settled in the late 1700s by a group of settlers from Connecticut. The settlers were attracted to the area due to its abundance of natural resources, including timber and water. The settlers quickly established a small village, which was named Oswayo after the nearby Oswayo Creek.
The village grew slowly over the years, and by the mid-1800s it had become a thriving community. The village was incorporated as a borough in 1876, and the first mayor was elected in 1877.
In the early 1900s, the borough experienced a period of growth and prosperity. The population increased, and new businesses and industries were established. The borough also became a popular tourist destination, as it was located near several popular lakes and rivers.
Geography
Oswayo Borough is located in the northwest corner of Potter County, Pennsylvania. It is situated in the Allegheny Plateau region of the state, and is surrounded by rolling hills and forests. The borough is located near several popular lakes and rivers, including the Oswayo Creek, the Allegheny River, and the Susquehanna River.
The borough covers an area of 1.3 square miles, and has a population density of 790 people per square mile. The borough is located at an elevation of 1,400 feet above sea level.
Economy
Oswayo Borough has a small but diverse economy. The borough is home to several small businesses, including restaurants, retail stores, and service providers. The borough also has a few manufacturing companies, which produce a variety of products, including furniture, clothing, and electronics.
The borough is also home to several tourist attractions, including the Oswayo Creek State Park and the Allegheny River. These attractions draw visitors from all over the region, and help to boost the local economy.
Demographics
As of the 2010 census, Oswayo Borough had a population of 1,072 people. The population is predominantly white, with a small minority population. The median household income is $37,500, and the median age is 44 years.
The borough is home to a variety of religious denominations, including Protestant, Catholic, and Jewish. The borough also has a small but growing Hispanic population.
Conclusion
Oswayo Borough is a small borough located in Potter County, Pennsylvania. It is situated in the Allegheny Plateau region of the state, and is surrounded by rolling hills and forests. The borough has a small but diverse economy, and is home to several tourist attractions. The population is predominantly white, with a small minority population. The median household income is $37,500, and the median age is 44 years.
Common Questions
What is Per Capita Income in Oswayo borough?
Per Capita income in Oswayo borough is $30,467.
What is the Median Family Income in Oswayo borough?
Median Family Income in Oswayo borough is $64,375.
What is the Median Household income in Oswayo borough?
Median Household Income in Oswayo borough is $64,375.
What is Income or Wage Gap in Oswayo borough?
Income or Wage Gap in Oswayo borough is 55.2%.
Women in Oswayo borough earn 44.8 cents for every dollar earned by a man.
What is Inequality or Gini Index in Oswayo borough?
Inequality or Gini Index in Oswayo borough is 0.32.
What is the Total Population of Oswayo borough?
Total Population of Oswayo borough is 102.
What is the Total Male Population of Oswayo borough?
Total Male Population of Oswayo borough is 52.
What is the Total Female Population of Oswayo borough?
Total Female Population of Oswayo borough is 50.
What is the Ratio of Males per 100 Females in Oswayo borough?
There are 104.00 Males per 100 Females in Oswayo borough.
What is the Ratio of Females per 100 Males in Oswayo borough?
There are 96.15 Females per 100 Males in Oswayo borough.
What is the Median Population Age in Oswayo borough?
Median Population Age in Oswayo borough is 47.5 Years.
What is the Average Family Size in Oswayo borough
Average Family Size in Oswayo borough is 2.7 People.
What is the Average Household Size in Oswayo borough
Average Household Size in Oswayo borough is 2.5 People.
How Large is the Labor Force in Oswayo borough?
There are 53 People in the Labor Forcein in Oswayo borough.
What is the Percentage of People in the Labor Force in Oswayo borough?
61.6% of People are in the Labor Force in Oswayo borough.
What is the Unemployment Rate in Oswayo borough?
Unemployment Rate in Oswayo borough is 5.7%.