Kulpsville, PA Map & Demographics
Kulpsville Map
Kulpsville Overview
$48,759
PER CAPITA INCOME
$104,352
AVG FAMILY INCOME
$84,971
AVG HOUSEHOLD INCOME
5.1%
WAGE / INCOME GAP [ % ]
94.9¢/ $1
WAGE / INCOME GAP [ $ ]
$2,477
FAMILY INCOME DEFICIT
0.40
INEQUALITY / GINI INDEX
8,876
TOTAL POPULATION
4,074
MALE POPULATION
4,802
FEMALE POPULATION
84.84
MALES / 100 FEMALES
117.87
FEMALES / 100 MALES
40.2
MEDIAN AGE
3.0
AVG FAMILY SIZE
2.4
AVG HOUSEHOLD SIZE
4,598
LABOR FORCE [ PEOPLE ]
64.7%
PERCENT IN LABOR FORCE
2.8%
UNEMPLOYMENT RATE
Income in Kulpsville
Income Overview in Kulpsville
Per Capita Income in Kulpsville is $48,759, while median incomes of families and households are $104,352 and $84,971 respectively.
| Characteristic | Number | Measure |
| Per Capita Income | 8,876 | $48,759 |
| Median Family Income | 2,442 | $104,352 |
| Mean Family Income | 2,442 | $135,654 |
| Median Household Income | 3,746 | $84,971 |
| Mean Household Income | 3,746 | $114,554 |
| Income Deficit | 2,442 | $2,477 |
| Wage / Income Gap (%) | 8,876 | 5.06% |
| Wage / Income Gap ($) | 8,876 | 94.94¢ per $1 |
| Gini / Inequality Index | 8,876 | 0.40 |
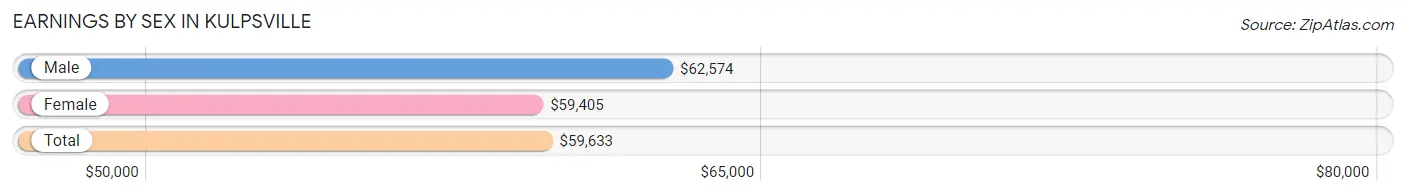
Earnings by Sex in Kulpsville
Average Earnings in Kulpsville are $59,633, $62,574 for men and $59,405 for women, a difference of 5.1%.
| Sex | Number | Average Earnings |
| Male | 2,160 (46.0%) | $62,574 |
| Female | 2,532 (54.0%) | $59,405 |
| Total | 4,692 (100.0%) | $59,633 |
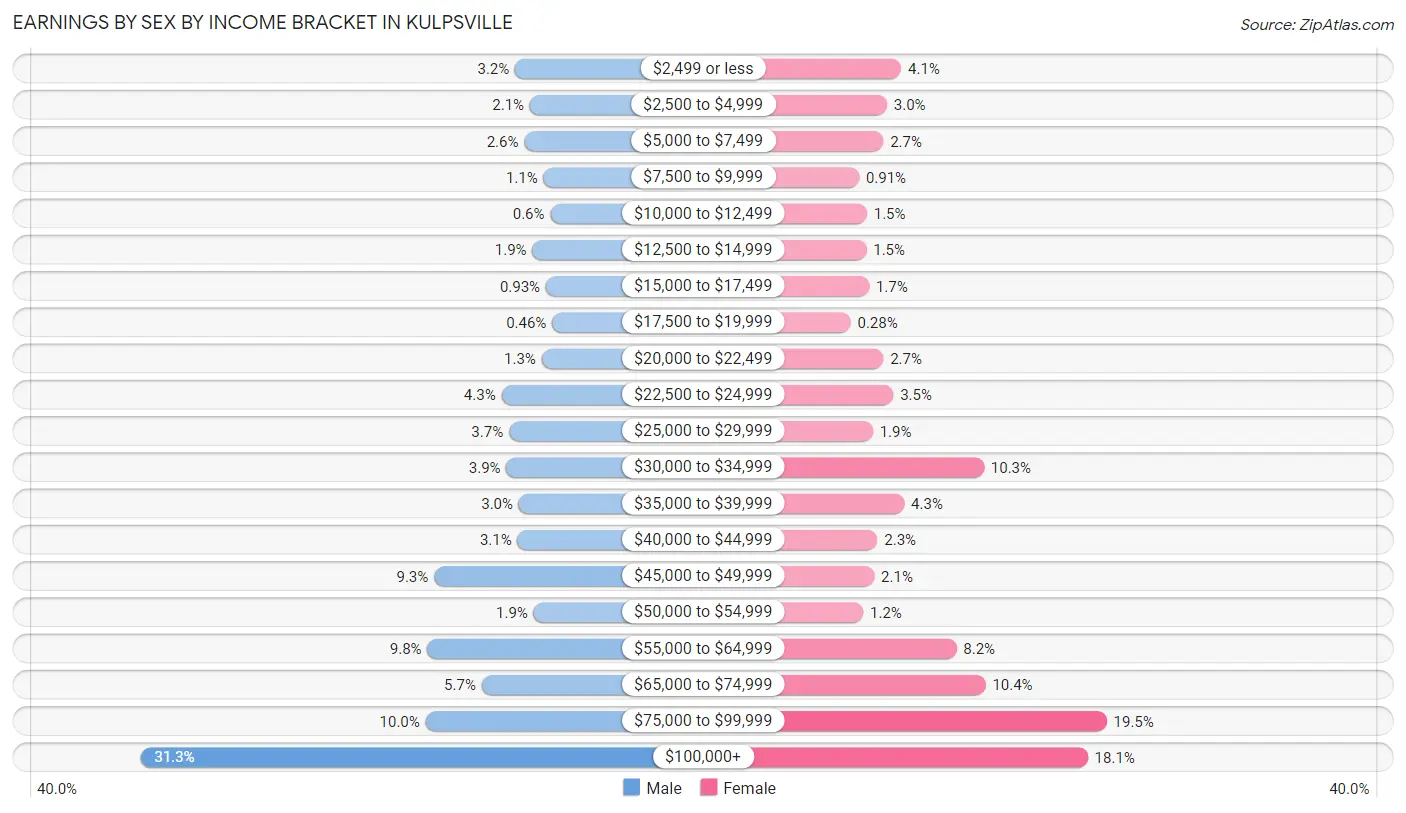
Earnings by Sex by Income Bracket in Kulpsville
The most common earnings brackets in Kulpsville are $100,000+ for men (675 | 31.2%) and $75,000 to $99,999 for women (493 | 19.5%).
| Income | Male | Female |
| $2,499 or less | 70 (3.2%) | 103 (4.1%) |
| $2,500 to $4,999 | 46 (2.1%) | 76 (3.0%) |
| $5,000 to $7,499 | 55 (2.5%) | 69 (2.7%) |
| $7,500 to $9,999 | 24 (1.1%) | 23 (0.9%) |
| $10,000 to $12,499 | 13 (0.6%) | 38 (1.5%) |
| $12,500 to $14,999 | 42 (1.9%) | 37 (1.5%) |
| $15,000 to $17,499 | 20 (0.9%) | 42 (1.7%) |
| $17,500 to $19,999 | 10 (0.5%) | 7 (0.3%) |
| $20,000 to $22,499 | 27 (1.3%) | 69 (2.7%) |
| $22,500 to $24,999 | 92 (4.3%) | 88 (3.5%) |
| $25,000 to $29,999 | 80 (3.7%) | 49 (1.9%) |
| $30,000 to $34,999 | 84 (3.9%) | 260 (10.3%) |
| $35,000 to $39,999 | 64 (3.0%) | 109 (4.3%) |
| $40,000 to $44,999 | 66 (3.1%) | 58 (2.3%) |
| $45,000 to $49,999 | 201 (9.3%) | 52 (2.1%) |
| $50,000 to $54,999 | 40 (1.8%) | 31 (1.2%) |
| $55,000 to $64,999 | 212 (9.8%) | 208 (8.2%) |
| $65,000 to $74,999 | 124 (5.7%) | 263 (10.4%) |
| $75,000 to $99,999 | 215 (10.0%) | 493 (19.5%) |
| $100,000+ | 675 (31.2%) | 457 (18.0%) |
| Total | 2,160 (100.0%) | 2,532 (100.0%) |
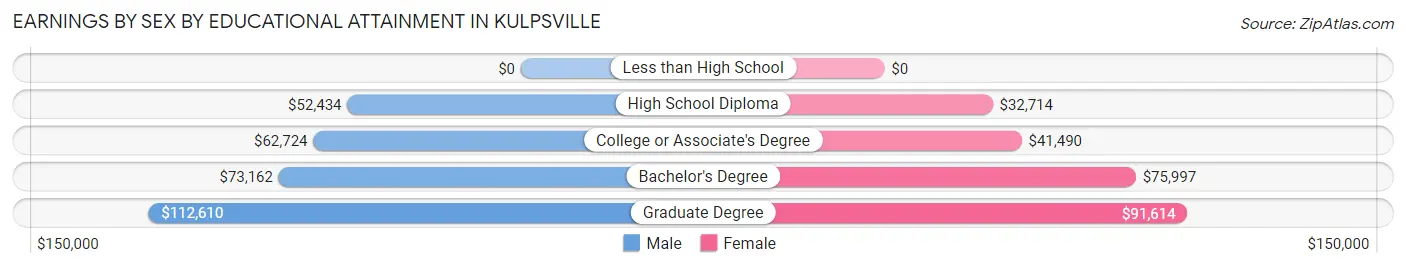
Earnings by Sex by Educational Attainment in Kulpsville
Average earnings in Kulpsville are $70,139 for men and $69,375 for women, a difference of 1.1%. Men with an educational attainment of graduate degree enjoy the highest average annual earnings of $112,610, while those with high school diploma education earn the least with $52,434. Women with an educational attainment of graduate degree earn the most with the average annual earnings of $91,614, while those with high school diploma education have the smallest earnings of $32,714.
| Educational Attainment | Male Income | Female Income |
| Less than High School | - | - |
| High School Diploma | $52,434 | $32,714 |
| College or Associate's Degree | $62,724 | $41,490 |
| Bachelor's Degree | $73,162 | $75,997 |
| Graduate Degree | $112,610 | $91,614 |
| Total | $70,139 | $69,375 |
Family Income in Kulpsville
Family Income Brackets in Kulpsville
According to the Kulpsville family income data, there are 632 families falling into the $100,000 to $149,999 income range, which is the most common income bracket and makes up 25.9% of all families.
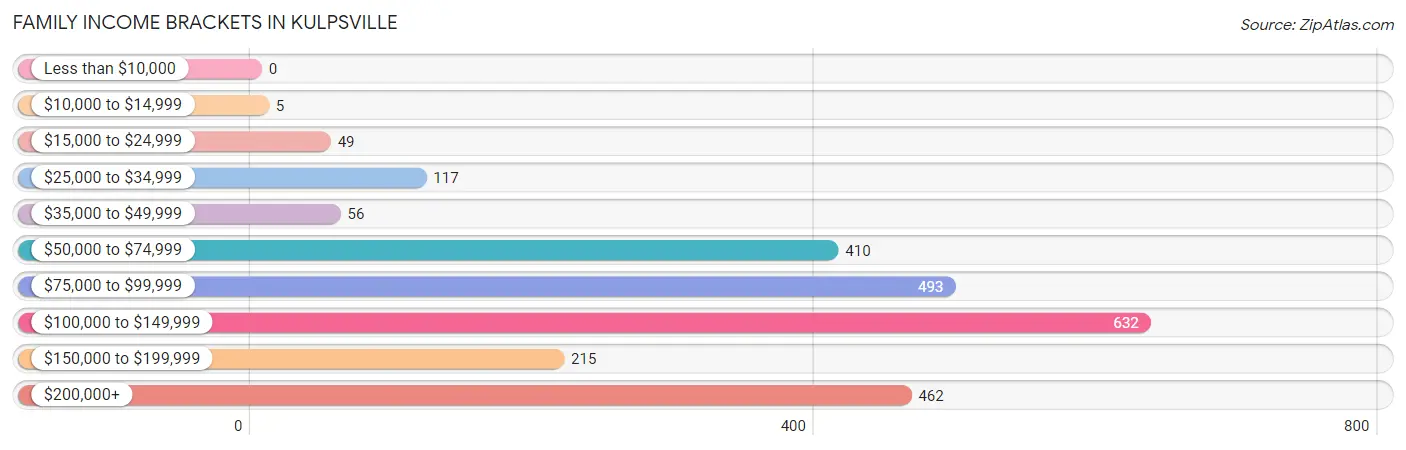
| Income Bracket | # Families | % Families |
| Less than $10,000 | 0 | 0.0% |
| $10,000 to $14,999 | 5 | 0.2% |
| $15,000 to $24,999 | 49 | 2.0% |
| $25,000 to $34,999 | 117 | 4.8% |
| $35,000 to $49,999 | 56 | 2.3% |
| $50,000 to $74,999 | 410 | 16.8% |
| $75,000 to $99,999 | 493 | 20.2% |
| $100,000 to $149,999 | 632 | 25.9% |
| $150,000 to $199,999 | 215 | 8.8% |
| $200,000+ | 462 | 18.9% |
Family Income by Famaliy Size in Kulpsville
5-person families (122 | 5.0%) account for the highest median family income in Kulpsville with $178,125 per family, while 2-person families (1,094 | 44.8%) have the highest median income of $48,487 per family member.
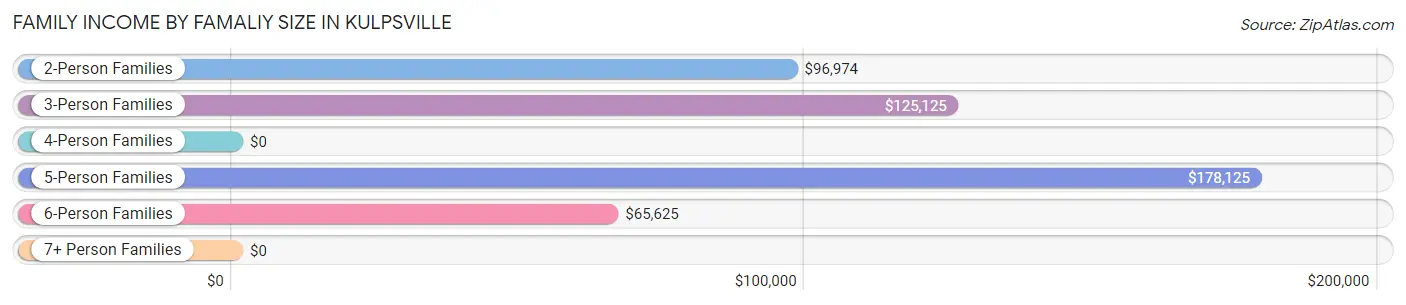
| Income Bracket | # Families | Median Income |
| 2-Person Families | 1,094 (44.8%) | $96,974 |
| 3-Person Families | 520 (21.3%) | $125,125 |
| 4-Person Families | 668 (27.4%) | $0 |
| 5-Person Families | 122 (5.0%) | $178,125 |
| 6-Person Families | 38 (1.6%) | $65,625 |
| 7+ Person Families | 0 (0.0%) | $0 |
| Total | 2,442 (100.0%) | $104,352 |
Family Income by Number of Earners in Kulpsville
The median family income in Kulpsville is $104,352, with families comprising 3+ earners (252) having the highest median family income of $200,417, while families with no earners (303) have the lowest median family income of $71,331, accounting for 10.3% and 12.4% of families, respectively.
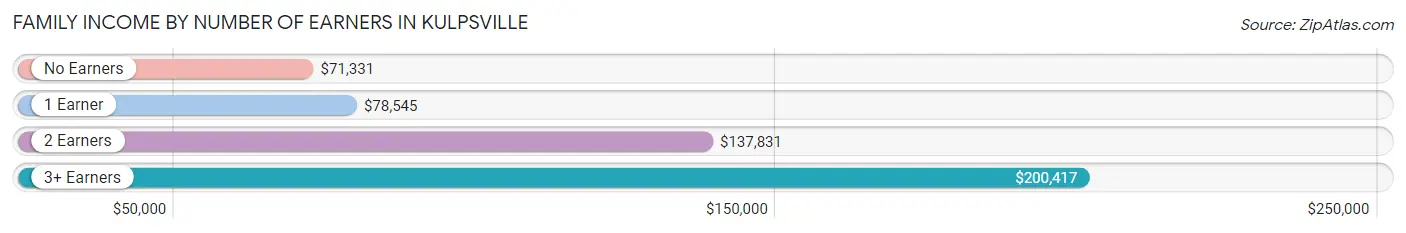
| Number of Earners | # Families | Median Income |
| No Earners | 303 (12.4%) | $71,331 |
| 1 Earner | 690 (28.3%) | $78,545 |
| 2 Earners | 1,197 (49.0%) | $137,831 |
| 3+ Earners | 252 (10.3%) | $200,417 |
| Total | 2,442 (100.0%) | $104,352 |
Household Income in Kulpsville
Household Income Brackets in Kulpsville
With 805 households falling in the category, the $50,000 to $74,999 income range is the most frequent in Kulpsville, accounting for 21.5% of all households. In contrast, only 79 households (2.1%) fall into the less than $10,000 income bracket, making it the least populous group.
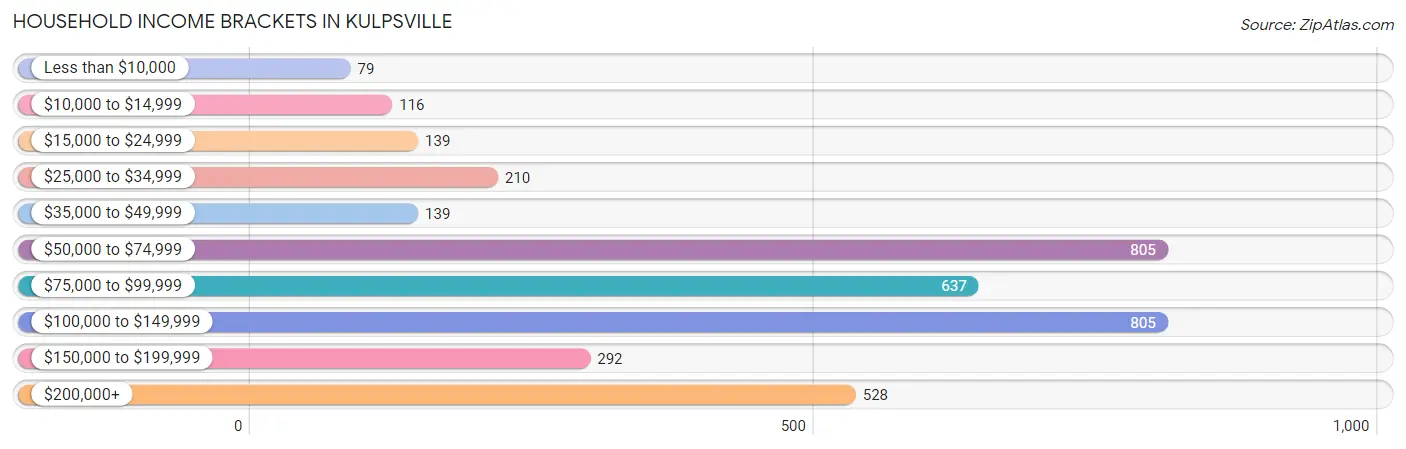
| Income Bracket | # Households | % Households |
| Less than $10,000 | 79 | 2.1% |
| $10,000 to $14,999 | 116 | 3.1% |
| $15,000 to $24,999 | 139 | 3.7% |
| $25,000 to $34,999 | 210 | 5.6% |
| $35,000 to $49,999 | 139 | 3.7% |
| $50,000 to $74,999 | 805 | 21.5% |
| $75,000 to $99,999 | 637 | 17.0% |
| $100,000 to $149,999 | 805 | 21.5% |
| $150,000 to $199,999 | 292 | 7.8% |
| $200,000+ | 528 | 14.1% |
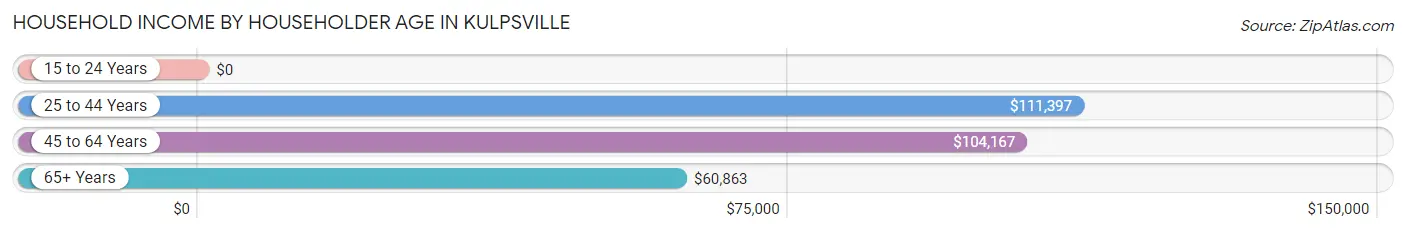
Household Income by Householder Age in Kulpsville
The median household income in Kulpsville is $84,971, with the highest median household income of $111,397 found in the 25 to 44 years age bracket for the primary householder. A total of 1,262 households (33.7%) fall into this category.
| Income Bracket | # Households | Median Income |
| 15 to 24 Years | 0 (0.0%) | $0 |
| 25 to 44 Years | 1,262 (33.7%) | $111,397 |
| 45 to 64 Years | 1,028 (27.4%) | $104,167 |
| 65+ Years | 1,456 (38.9%) | $60,863 |
| Total | 3,746 (100.0%) | $84,971 |
Poverty in Kulpsville
Income Below Poverty by Sex and Age in Kulpsville
With 2.4% poverty level for males and 6.7% for females among the residents of Kulpsville, 75 year old and over males and 75 year old and over females are the most vulnerable to poverty, with 51 males (13.4%) and 169 females (26.0%) in their respective age groups living below the poverty level.
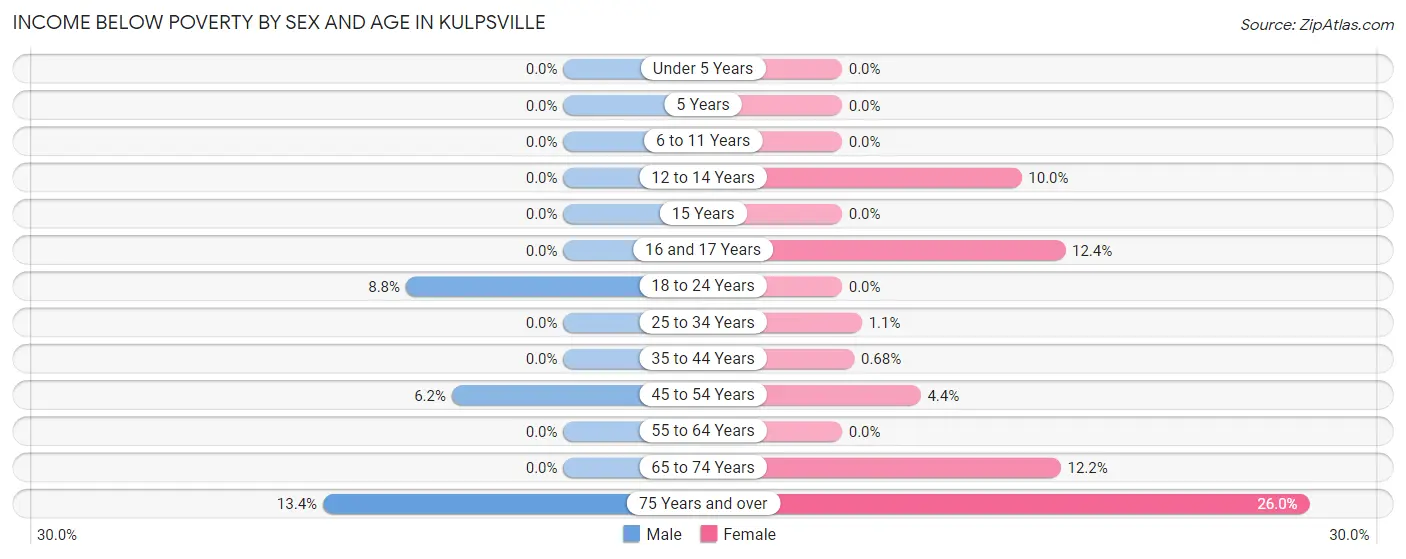
| Age Bracket | Male | Female |
| Under 5 Years | 0 (0.0%) | 0 (0.0%) |
| 5 Years | 0 (0.0%) | 0 (0.0%) |
| 6 to 11 Years | 0 (0.0%) | 0 (0.0%) |
| 12 to 14 Years | 0 (0.0%) | 17 (10.0%) |
| 15 Years | 0 (0.0%) | 0 (0.0%) |
| 16 and 17 Years | 0 (0.0%) | 23 (12.4%) |
| 18 to 24 Years | 25 (8.8%) | 0 (0.0%) |
| 25 to 34 Years | 0 (0.0%) | 8 (1.1%) |
| 35 to 44 Years | 0 (0.0%) | 4 (0.7%) |
| 45 to 54 Years | 22 (6.2%) | 23 (4.4%) |
| 55 to 64 Years | 0 (0.0%) | 0 (0.0%) |
| 65 to 74 Years | 0 (0.0%) | 75 (12.2%) |
| 75 Years and over | 51 (13.4%) | 169 (26.0%) |
| Total | 98 (2.4%) | 319 (6.7%) |
Income Above Poverty by Sex and Age in Kulpsville
According to the poverty statistics in Kulpsville, males aged under 5 years and females aged under 5 years are the age groups that are most secure financially, with 100.0% of males and 100.0% of females in these age groups living above the poverty line.
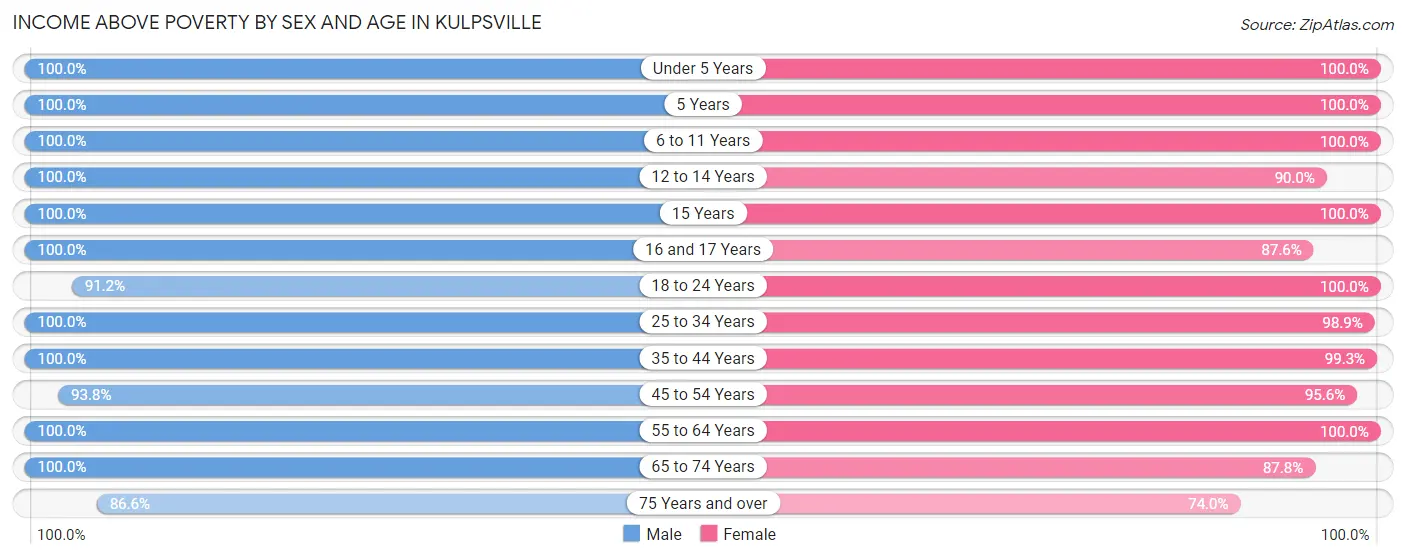
| Age Bracket | Male | Female |
| Under 5 Years | 374 (100.0%) | 241 (100.0%) |
| 5 Years | 82 (100.0%) | 41 (100.0%) |
| 6 to 11 Years | 328 (100.0%) | 179 (100.0%) |
| 12 to 14 Years | 218 (100.0%) | 153 (90.0%) |
| 15 Years | 77 (100.0%) | 29 (100.0%) |
| 16 and 17 Years | 71 (100.0%) | 162 (87.6%) |
| 18 to 24 Years | 260 (91.2%) | 290 (100.0%) |
| 25 to 34 Years | 548 (100.0%) | 712 (98.9%) |
| 35 to 44 Years | 520 (100.0%) | 586 (99.3%) |
| 45 to 54 Years | 332 (93.8%) | 502 (95.6%) |
| 55 to 64 Years | 456 (100.0%) | 508 (100.0%) |
| 65 to 74 Years | 332 (100.0%) | 541 (87.8%) |
| 75 Years and over | 330 (86.6%) | 480 (74.0%) |
| Total | 3,928 (97.6%) | 4,424 (93.3%) |
Income Below Poverty Among Married-Couple Families in Kulpsville
The poverty statistics for married-couple families in Kulpsville show that 4.1% or 73 of the total 1,802 families live below the poverty line. Families with 1 or 2 children have the highest poverty rate of 4.8%, comprising of 37 families. On the other hand, families with 3 or 4 children have the lowest poverty rate of 0.0%, which includes 0 families.
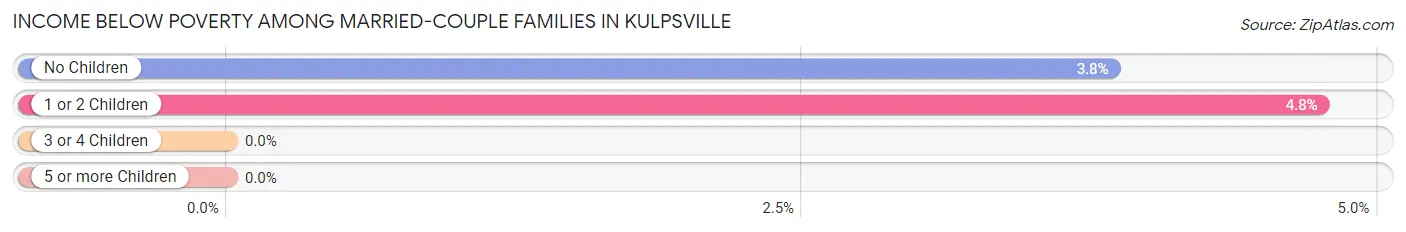
| Children | Above Poverty | Below Poverty |
| No Children | 902 (96.2%) | 36 (3.8%) |
| 1 or 2 Children | 742 (95.3%) | 37 (4.8%) |
| 3 or 4 Children | 85 (100.0%) | 0 (0.0%) |
| 5 or more Children | 0 (0.0%) | 0 (0.0%) |
| Total | 1,729 (96.0%) | 73 (4.1%) |
Income Below Poverty Among Single-Parent Households in Kulpsville
| Children | Single Father | Single Mother |
| No Children | 0 (0.0%) | 0 (0.0%) |
| 1 or 2 Children | 0 (0.0%) | 0 (0.0%) |
| 3 or 4 Children | 0 (0.0%) | 0 (0.0%) |
| 5 or more Children | 0 (0.0%) | 0 (0.0%) |
| Total | 0 (0.0%) | 0 (0.0%) |
Income Below Poverty Among Married-Couple vs Single-Parent Households in Kulpsville
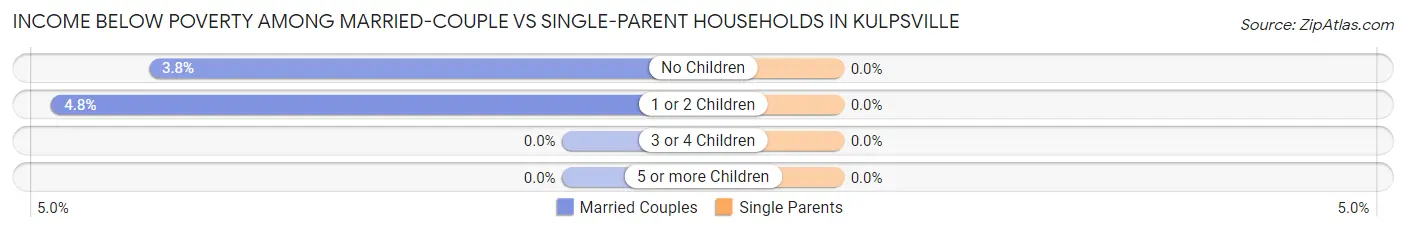
| Children | Married-Couple Families | Single-Parent Households |
| No Children | 36 (3.8%) | 0 (0.0%) |
| 1 or 2 Children | 37 (4.8%) | 0 (0.0%) |
| 3 or 4 Children | 0 (0.0%) | 0 (0.0%) |
| 5 or more Children | 0 (0.0%) | 0 (0.0%) |
| Total | 73 (4.1%) | 0 (0.0%) |
Race in Kulpsville
The most populous races in Kulpsville are White / Caucasian (6,693 | 75.4%), Asian (958 | 10.8%), and Black / African American (898 | 10.1%).
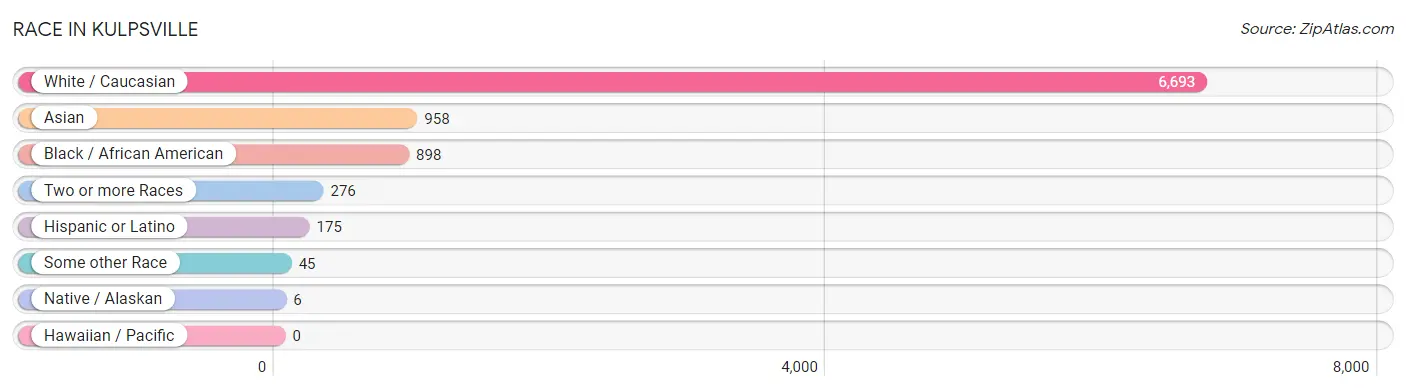
| Race | # Population | % Population |
| Asian | 958 | 10.8% |
| Black / African American | 898 | 10.1% |
| Hawaiian / Pacific | 0 | 0.0% |
| Hispanic or Latino | 175 | 2.0% |
| Native / Alaskan | 6 | 0.1% |
| White / Caucasian | 6,693 | 75.4% |
| Two or more Races | 276 | 3.1% |
| Some other Race | 45 | 0.5% |
| Total | 8,876 | 100.0% |
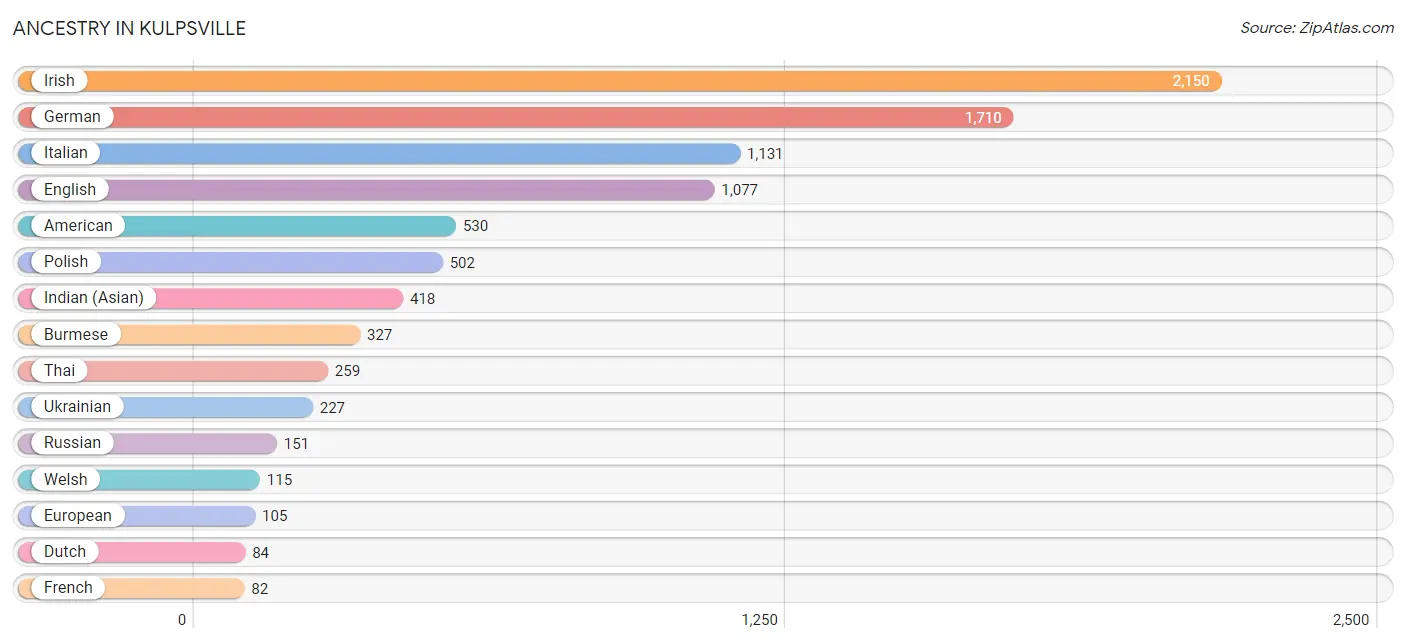
Ancestry in Kulpsville
The most populous ancestries reported in Kulpsville are Irish (2,150 | 24.2%), German (1,710 | 19.3%), Italian (1,131 | 12.7%), English (1,077 | 12.1%), and American (530 | 6.0%), together accounting for 74.3% of all Kulpsville residents.
| Ancestry | # Population | % Population |
| African | 29 | 0.3% |
| American | 530 | 6.0% |
| Arab | 34 | 0.4% |
| Armenian | 15 | 0.2% |
| Australian | 6 | 0.1% |
| Austrian | 77 | 0.9% |
| Bhutanese | 34 | 0.4% |
| British | 25 | 0.3% |
| Burmese | 327 | 3.7% |
| Central American | 6 | 0.1% |
| Central American Indian | 6 | 0.1% |
| Cherokee | 39 | 0.4% |
| Colombian | 38 | 0.4% |
| Cuban | 19 | 0.2% |
| Dutch | 84 | 0.9% |
| Eastern European | 30 | 0.3% |
| Ecuadorian | 7 | 0.1% |
| English | 1,077 | 12.1% |
| European | 105 | 1.2% |
| French | 82 | 0.9% |
| French Canadian | 6 | 0.1% |
| German | 1,710 | 19.3% |
| Guatemalan | 6 | 0.1% |
| Hungarian | 40 | 0.4% |
| Indian (Asian) | 418 | 4.7% |
| Irish | 2,150 | 24.2% |
| Italian | 1,131 | 12.7% |
| Jamaican | 12 | 0.1% |
| Korean | 32 | 0.4% |
| Latvian | 18 | 0.2% |
| Lithuanian | 15 | 0.2% |
| Mexican | 58 | 0.6% |
| Northern European | 12 | 0.1% |
| Norwegian | 23 | 0.3% |
| Pennsylvania German | 70 | 0.8% |
| Polish | 502 | 5.7% |
| Puerto Rican | 47 | 0.5% |
| Russian | 151 | 1.7% |
| Scotch-Irish | 34 | 0.4% |
| Scottish | 66 | 0.7% |
| Slovak | 17 | 0.2% |
| South American | 45 | 0.5% |
| Subsaharan African | 29 | 0.3% |
| Swedish | 47 | 0.5% |
| Swiss | 7 | 0.1% |
| Thai | 259 | 2.9% |
| Ukrainian | 227 | 2.6% |
| Welsh | 115 | 1.3% |
| West Indian | 54 | 0.6% | View All 49 Rows |
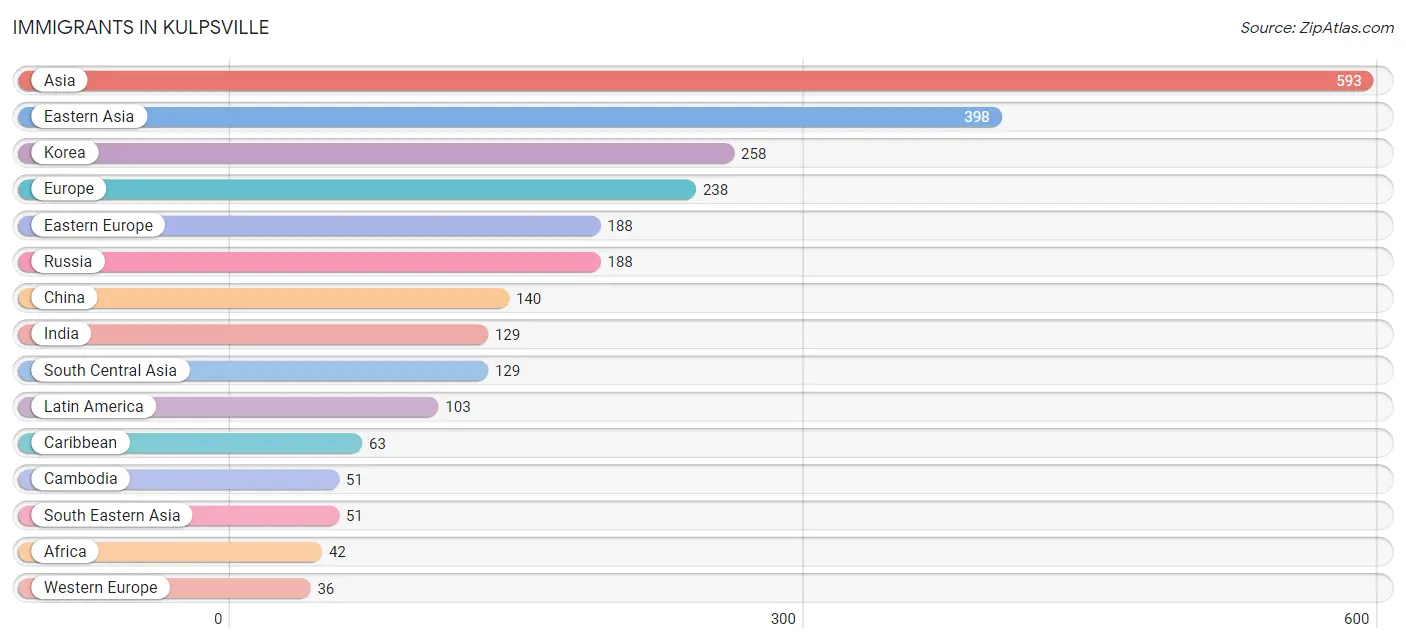
Immigrants in Kulpsville
The most numerous immigrant groups reported in Kulpsville came from Asia (593 | 6.7%), Eastern Asia (398 | 4.5%), Korea (258 | 2.9%), Europe (238 | 2.7%), and Eastern Europe (188 | 2.1%), together accounting for 18.9% of all Kulpsville residents.
| Immigration Origin | # Population | % Population |
| Africa | 42 | 0.5% |
| Armenia | 15 | 0.2% |
| Asia | 593 | 6.7% |
| Cambodia | 51 | 0.6% |
| Canada | 16 | 0.2% |
| Caribbean | 63 | 0.7% |
| Central America | 6 | 0.1% |
| China | 140 | 1.6% |
| Colombia | 24 | 0.3% |
| Cuba | 19 | 0.2% |
| Eastern Africa | 8 | 0.1% |
| Eastern Asia | 398 | 4.5% |
| Eastern Europe | 188 | 2.1% |
| England | 14 | 0.2% |
| Europe | 238 | 2.7% |
| Germany | 12 | 0.1% |
| Guatemala | 6 | 0.1% |
| Guyana | 10 | 0.1% |
| India | 129 | 1.5% |
| Jamaica | 22 | 0.3% |
| Korea | 258 | 2.9% |
| Latin America | 103 | 1.2% |
| Netherlands | 24 | 0.3% |
| Northern Africa | 34 | 0.4% |
| Northern Europe | 14 | 0.2% |
| Russia | 188 | 2.1% |
| South America | 34 | 0.4% |
| South Central Asia | 129 | 1.5% |
| South Eastern Asia | 51 | 0.6% |
| Taiwan | 20 | 0.2% |
| Trinidad and Tobago | 22 | 0.3% |
| Western Asia | 15 | 0.2% |
| Western Europe | 36 | 0.4% | View All 33 Rows |
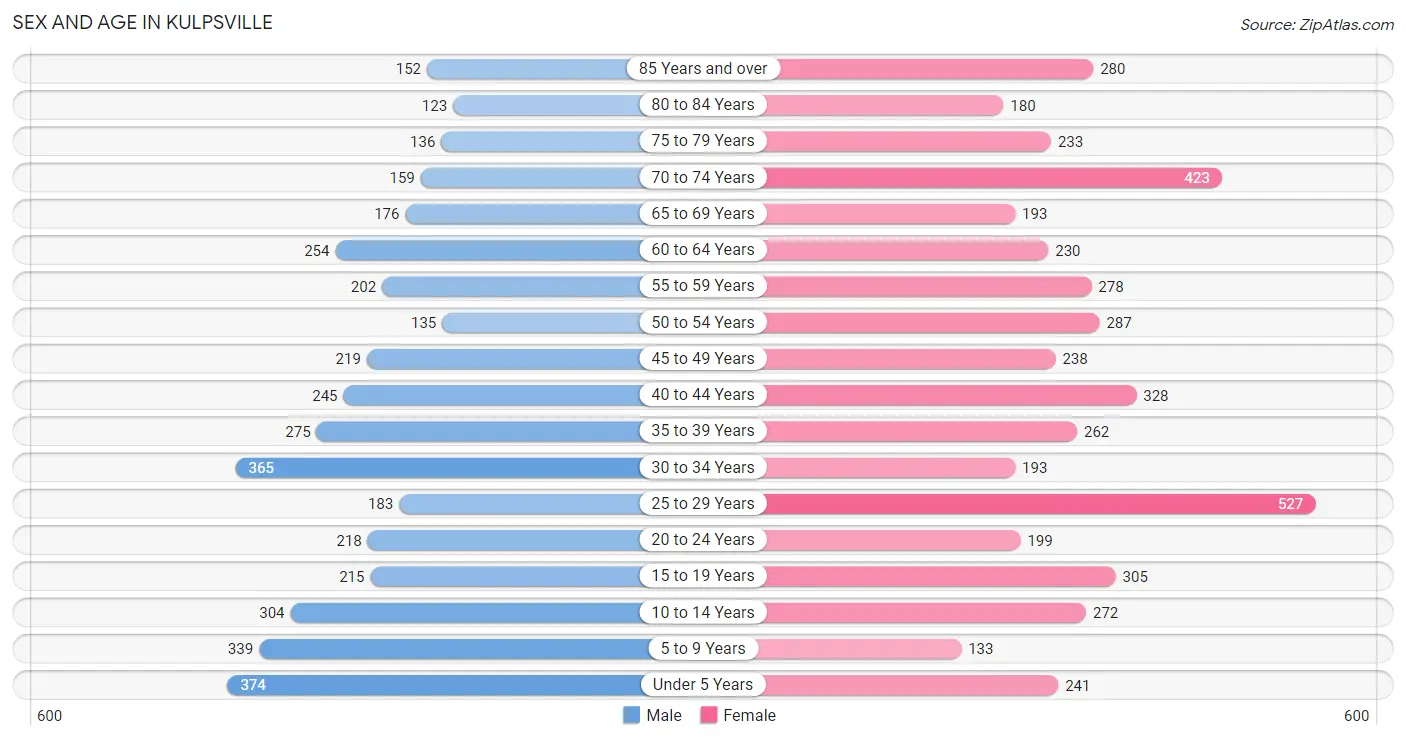
Sex and Age in Kulpsville
Sex and Age in Kulpsville
The most populous age groups in Kulpsville are Under 5 Years (374 | 9.2%) for men and 25 to 29 Years (527 | 11.0%) for women.
| Age Bracket | Male | Female |
| Under 5 Years | 374 (9.2%) | 241 (5.0%) |
| 5 to 9 Years | 339 (8.3%) | 133 (2.8%) |
| 10 to 14 Years | 304 (7.5%) | 272 (5.7%) |
| 15 to 19 Years | 215 (5.3%) | 305 (6.4%) |
| 20 to 24 Years | 218 (5.3%) | 199 (4.1%) |
| 25 to 29 Years | 183 (4.5%) | 527 (11.0%) |
| 30 to 34 Years | 365 (9.0%) | 193 (4.0%) |
| 35 to 39 Years | 275 (6.8%) | 262 (5.5%) |
| 40 to 44 Years | 245 (6.0%) | 328 (6.8%) |
| 45 to 49 Years | 219 (5.4%) | 238 (5.0%) |
| 50 to 54 Years | 135 (3.3%) | 287 (6.0%) |
| 55 to 59 Years | 202 (5.0%) | 278 (5.8%) |
| 60 to 64 Years | 254 (6.2%) | 230 (4.8%) |
| 65 to 69 Years | 176 (4.3%) | 193 (4.0%) |
| 70 to 74 Years | 159 (3.9%) | 423 (8.8%) |
| 75 to 79 Years | 136 (3.3%) | 233 (4.9%) |
| 80 to 84 Years | 123 (3.0%) | 180 (3.7%) |
| 85 Years and over | 152 (3.7%) | 280 (5.8%) |
| Total | 4,074 (100.0%) | 4,802 (100.0%) |
Families and Households in Kulpsville
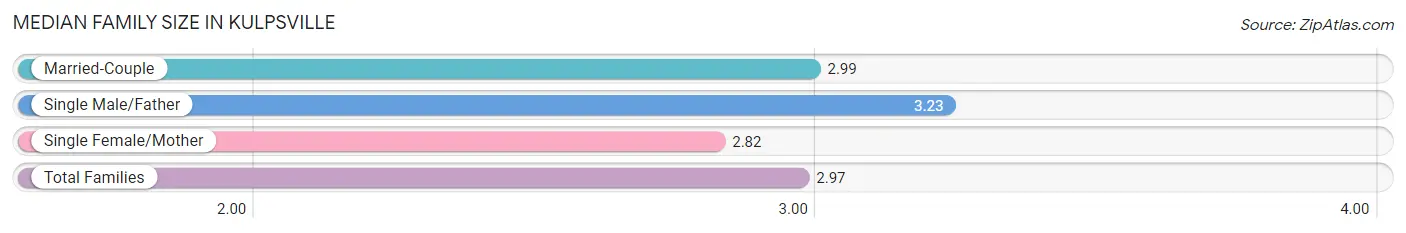
Median Family Size in Kulpsville
The median family size in Kulpsville is 2.97 persons per family, with single male/father families (150 | 6.1%) accounting for the largest median family size of 3.23 persons per family. On the other hand, single female/mother families (490 | 20.1%) represent the smallest median family size with 2.82 persons per family.
| Family Type | # Families | Family Size |
| Married-Couple | 1,802 (73.8%) | 2.99 |
| Single Male/Father | 150 (6.1%) | 3.23 |
| Single Female/Mother | 490 (20.1%) | 2.82 |
| Total Families | 2,442 (100.0%) | 2.97 |
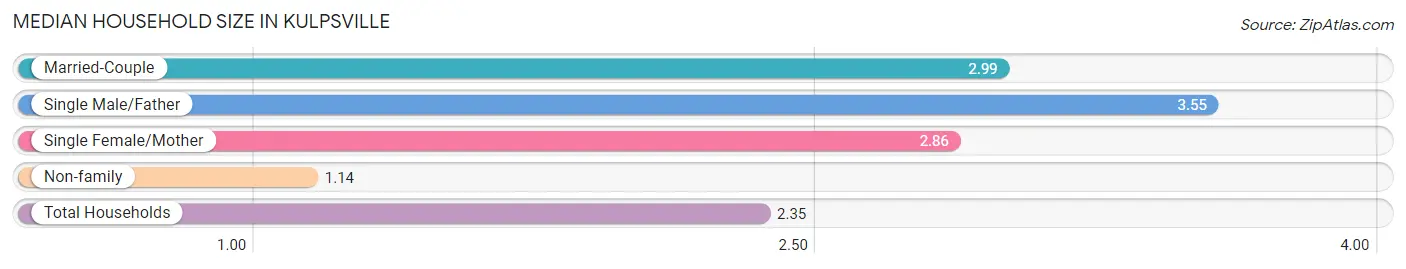
Median Household Size in Kulpsville
The median household size in Kulpsville is 2.35 persons per household, with single male/father households (150 | 4.0%) accounting for the largest median household size of 3.55 persons per household. non-family households (1,304 | 34.8%) represent the smallest median household size with 1.14 persons per household.
| Household Type | # Households | Household Size |
| Married-Couple | 1,802 (48.1%) | 2.99 |
| Single Male/Father | 150 (4.0%) | 3.55 |
| Single Female/Mother | 490 (13.1%) | 2.86 |
| Non-family | 1,304 (34.8%) | 1.14 |
| Total Households | 3,746 (100.0%) | 2.35 |
Household Size by Marriage Status in Kulpsville
Out of a total of 3,746 households in Kulpsville, 2,442 (65.2%) are family households, while 1,304 (34.8%) are nonfamily households. The most numerous type of family households are 2-person households, comprising 1,050, and the most common type of nonfamily households are 1-person households, comprising 1,149.
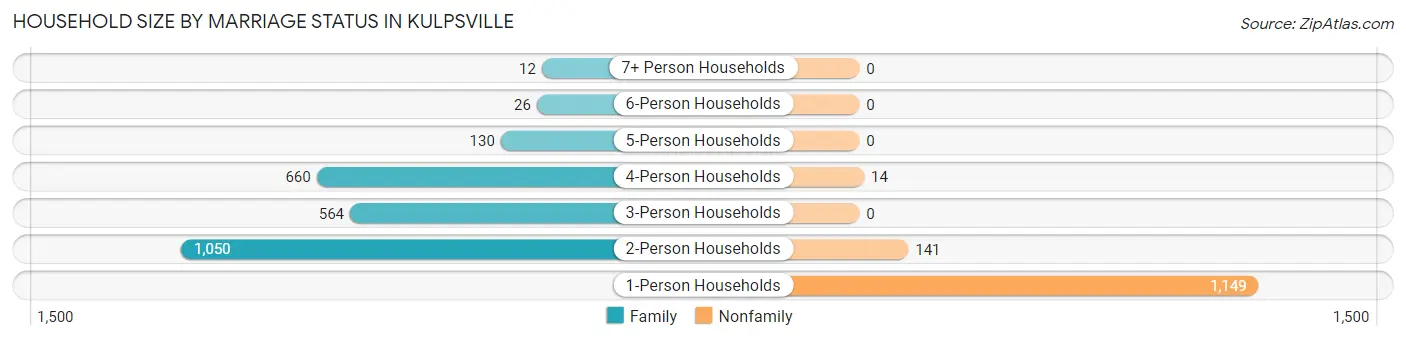
| Household Size | Family Households | Nonfamily Households |
| 1-Person Households | - | 1,149 (30.7%) |
| 2-Person Households | 1,050 (28.0%) | 141 (3.8%) |
| 3-Person Households | 564 (15.1%) | 0 (0.0%) |
| 4-Person Households | 660 (17.6%) | 14 (0.4%) |
| 5-Person Households | 130 (3.5%) | 0 (0.0%) |
| 6-Person Households | 26 (0.7%) | 0 (0.0%) |
| 7+ Person Households | 12 (0.3%) | 0 (0.0%) |
| Total | 2,442 (65.2%) | 1,304 (34.8%) |
Female Fertility in Kulpsville
Fertility by Age in Kulpsville
Average fertility rate in Kulpsville is 36.0 births per 1,000 women. Women in the age bracket of 20 to 34 years have the highest fertility rate with 82.0 births per 1,000 women. Women in the age bracket of 20 to 34 years acount for 100.0% of all women with births.
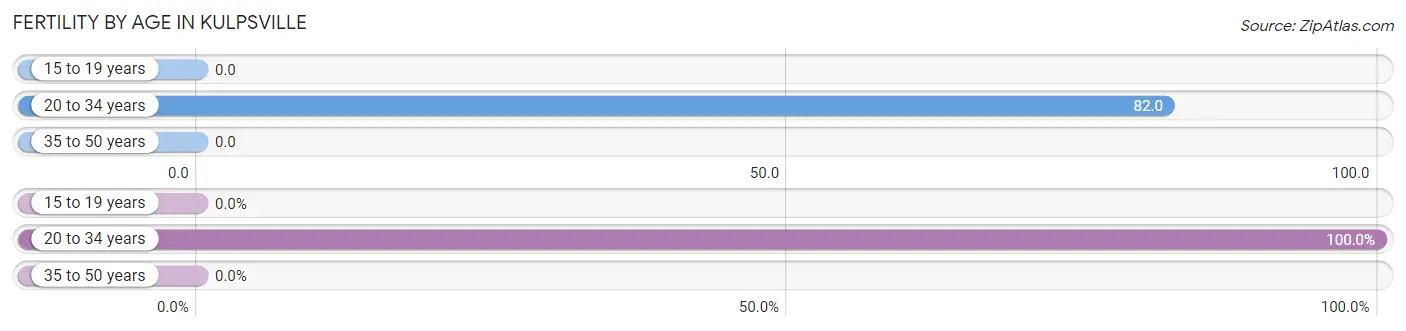
| Age Bracket | Women with Births | Births / 1,000 Women |
| 15 to 19 years | 0 (0.0%) | 0.0 |
| 20 to 34 years | 75 (100.0%) | 82.0 |
| 35 to 50 years | 0 (0.0%) | 0.0 |
| Total | 75 (100.0%) | 36.0 |
Fertility by Age by Marriage Status in Kulpsville
89.3% of women with births (75) in Kulpsville are married. The highest percentage of unmarried women with births falls into 20 to 34 years age bracket with 10.7% of them unmarried at the time of birth, while the lowest percentage of unmarried women with births belong to 20 to 34 years age bracket with 10.7% of them unmarried.
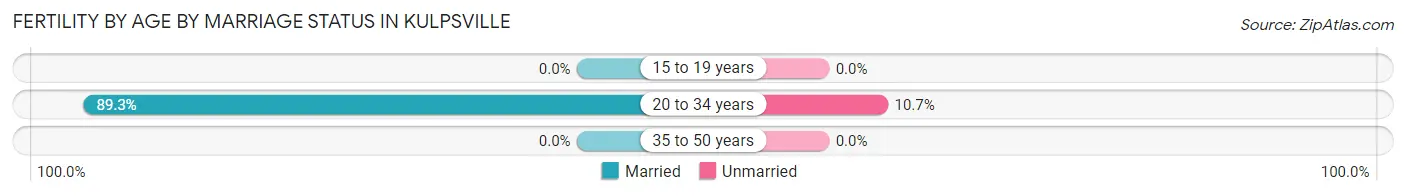
| Age Bracket | Married | Unmarried |
| 15 to 19 years | 0 (0.0%) | 0 (0.0%) |
| 20 to 34 years | 67 (89.3%) | 8 (10.7%) |
| 35 to 50 years | 0 (0.0%) | 0 (0.0%) |
| Total | 67 (89.3%) | 8 (10.7%) |
Fertility by Education in Kulpsville
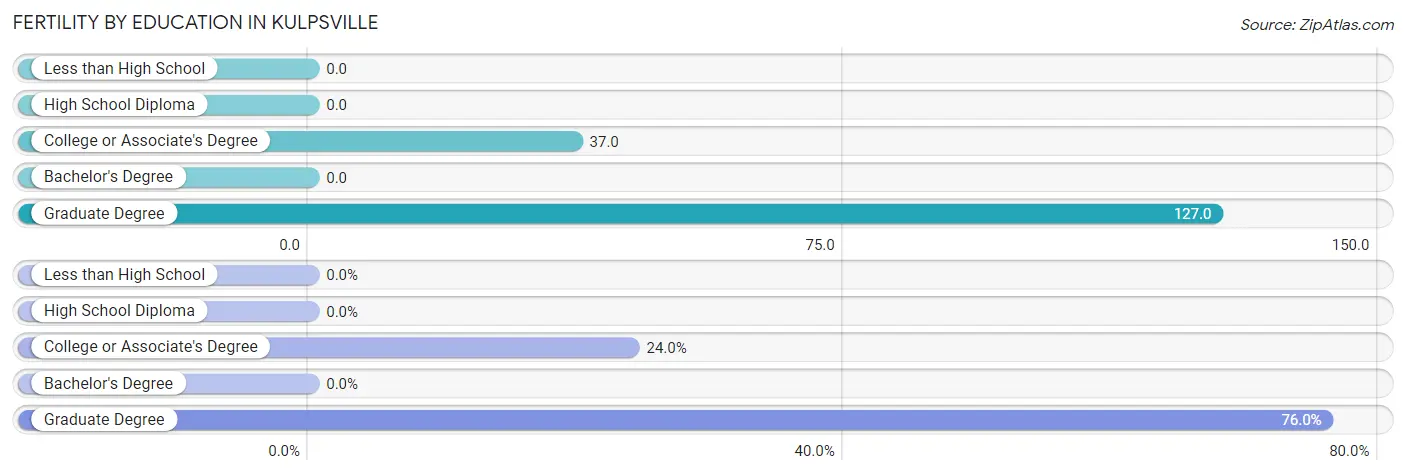
| Educational Attainment | Women with Births | Births / 1,000 Women |
| Less than High School | 0 (0.0%) | 0.0 |
| High School Diploma | 0 (0.0%) | 0.0 |
| College or Associate's Degree | 18 (24.0%) | 37.0 |
| Bachelor's Degree | 0 (0.0%) | 0.0 |
| Graduate Degree | 57 (76.0%) | 127.0 |
| Total | 75 (100.0%) | 36.0 |
Fertility by Education by Marriage Status in Kulpsville
10.7% of women with births in Kulpsville are unmarried. Women with the educational attainment of graduate degree are most likely to be married with 100.0% of them married at childbirth, while women with the educational attainment of college or associate's degree are least likely to be married with 44.4% of them unmarried at childbirth.
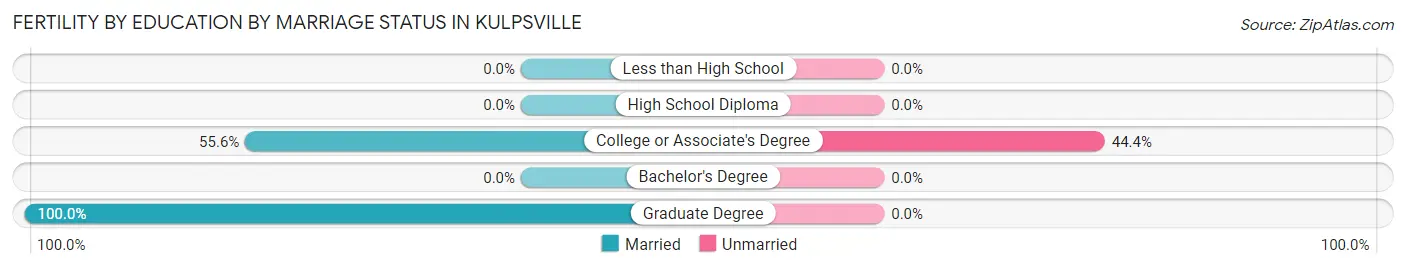
| Educational Attainment | Married | Unmarried |
| Less than High School | 0 (0.0%) | 0 (0.0%) |
| High School Diploma | 0 (0.0%) | 0 (0.0%) |
| College or Associate's Degree | 10 (55.6%) | 8 (44.4%) |
| Bachelor's Degree | 0 (0.0%) | 0 (0.0%) |
| Graduate Degree | 57 (100.0%) | 0 (0.0%) |
| Total | 67 (89.3%) | 8 (10.7%) |
Employment Characteristics in Kulpsville
Employment by Class of Employer in Kulpsville
Among the 4,405 employed individuals in Kulpsville, private company employees (3,328 | 75.5%), not-for-profit organizations (486 | 11.0%), and local government employees (226 | 5.1%) make up the most common classes of employment.
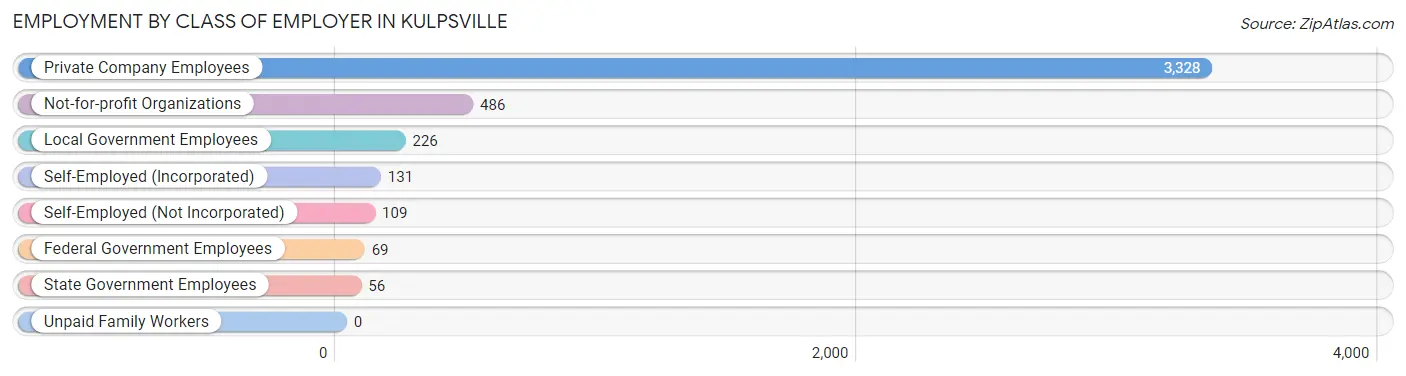
| Employer Class | # Employees | % Employees |
| Private Company Employees | 3,328 | 75.5% |
| Self-Employed (Incorporated) | 131 | 3.0% |
| Self-Employed (Not Incorporated) | 109 | 2.5% |
| Not-for-profit Organizations | 486 | 11.0% |
| Local Government Employees | 226 | 5.1% |
| State Government Employees | 56 | 1.3% |
| Federal Government Employees | 69 | 1.6% |
| Unpaid Family Workers | 0 | 0.0% |
| Total | 4,405 | 100.0% |
Employment Status by Age in Kulpsville
According to the labor force statistics for Kulpsville, out of the total population over 16 years of age (7,107), 64.7% or 4,598 individuals are in the labor force, with 2.8% or 129 of them unemployed. The age group with the highest labor force participation rate is 55 to 59 years, with 97.7% or 469 individuals in the labor force. Within the labor force, the 75 years and over age range has the highest percentage of unemployed individuals, with 7.6% or 6 of them being unemployed.
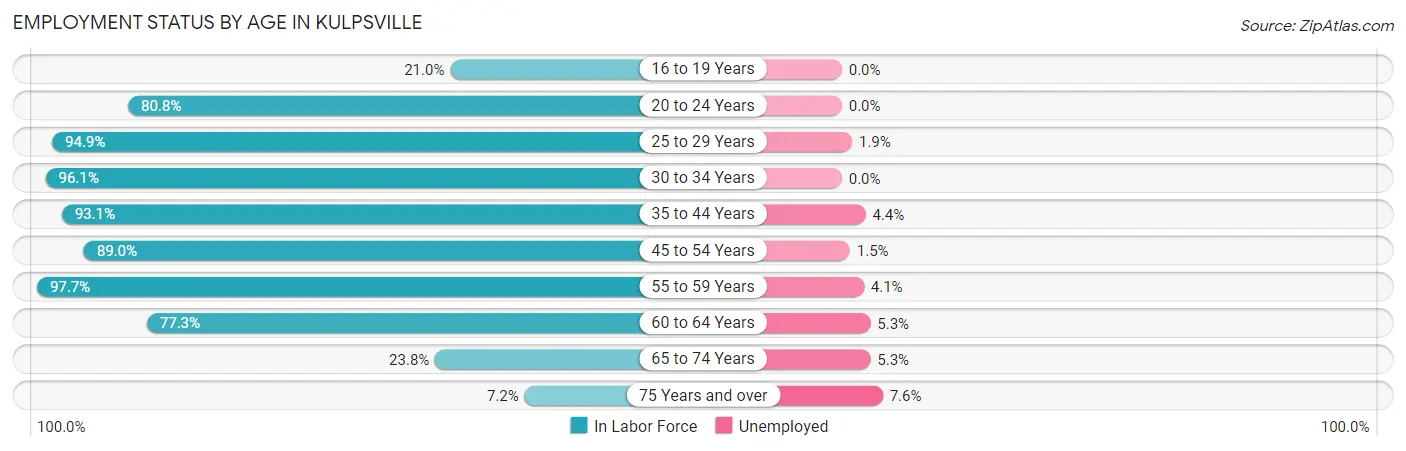
| Age Bracket | In Labor Force | Unemployed |
| 16 to 19 Years | 87 (21.0%) | 0 (0.0%) |
| 20 to 24 Years | 337 (80.8%) | 0 (0.0%) |
| 25 to 29 Years | 674 (94.9%) | 13 (1.9%) |
| 30 to 34 Years | 536 (96.1%) | 0 (0.0%) |
| 35 to 44 Years | 1,033 (93.1%) | 45 (4.4%) |
| 45 to 54 Years | 782 (89.0%) | 12 (1.5%) |
| 55 to 59 Years | 469 (97.7%) | 19 (4.1%) |
| 60 to 64 Years | 374 (77.3%) | 20 (5.3%) |
| 65 to 74 Years | 226 (23.8%) | 12 (5.3%) |
| 75 Years and over | 79 (7.2%) | 6 (7.6%) |
| Total | 4,598 (64.7%) | 129 (2.8%) |
Employment Status by Educational Attainment in Kulpsville
According to labor force statistics for Kulpsville, 91.6% of individuals (3,866) out of the total population between 25 and 64 years of age (4,221) are in the labor force, with 2.8% or 108 of them being unemployed. The group with the highest labor force participation rate are those with the educational attainment of college / associate degree, with 97.0% or 946 individuals in the labor force. Within the labor force, individuals with less than high school education have the highest percentage of unemployment, with 29.5% or 13 of them being unemployed.
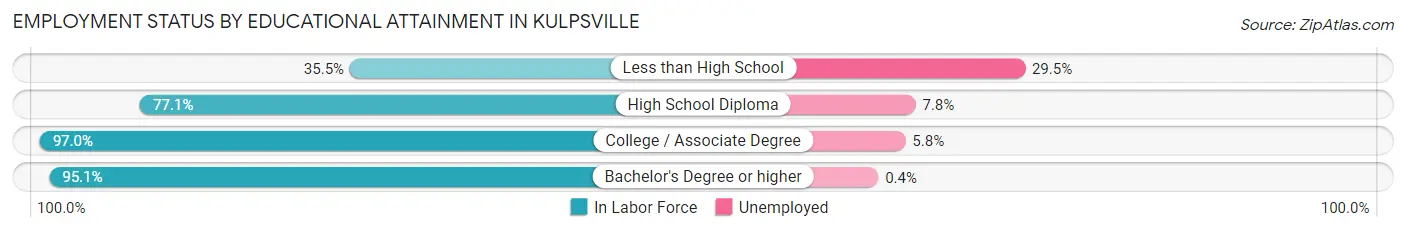
| Educational Attainment | In Labor Force | Unemployed |
| Less than High School | 44 (35.5%) | 37 (29.5%) |
| High School Diploma | 395 (77.1%) | 40 (7.8%) |
| College / Associate Degree | 946 (97.0%) | 57 (5.8%) |
| Bachelor's Degree or higher | 2,482 (95.1%) | 10 (0.4%) |
| Total | 3,866 (91.6%) | 118 (2.8%) |
Employment Occupations by Sex in Kulpsville
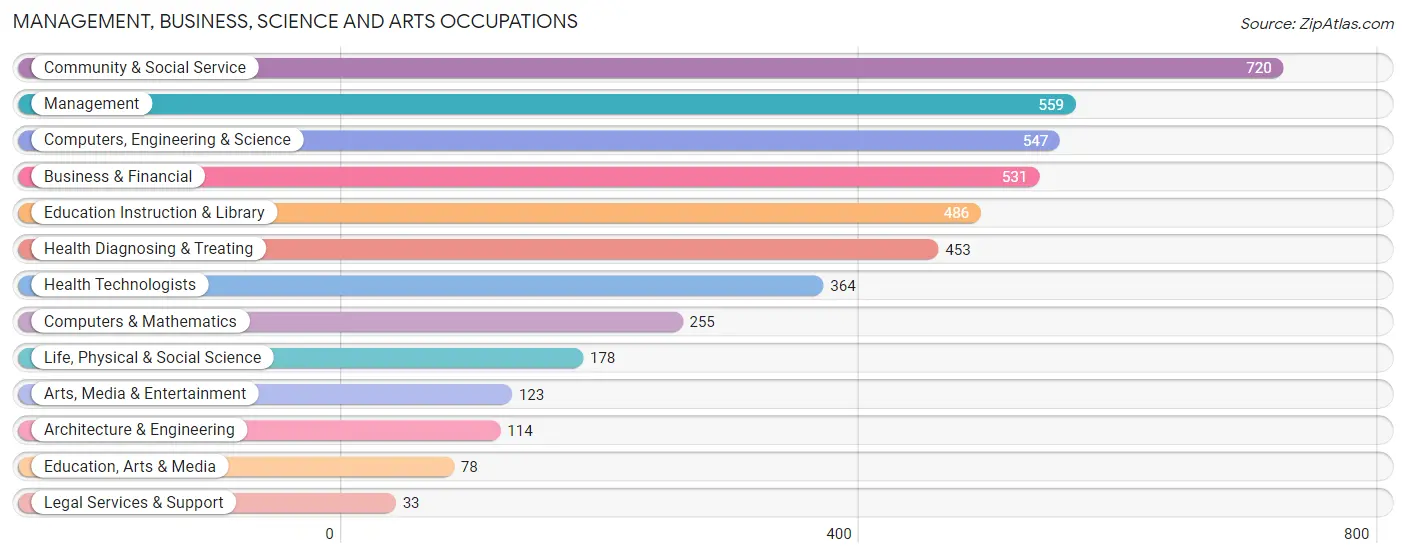
Management, Business, Science and Arts Occupations
The most common Management, Business, Science and Arts occupations in Kulpsville are Community & Social Service (720 | 16.1%), Management (559 | 12.5%), Computers, Engineering & Science (547 | 12.2%), Business & Financial (531 | 11.9%), and Education Instruction & Library (486 | 10.9%).
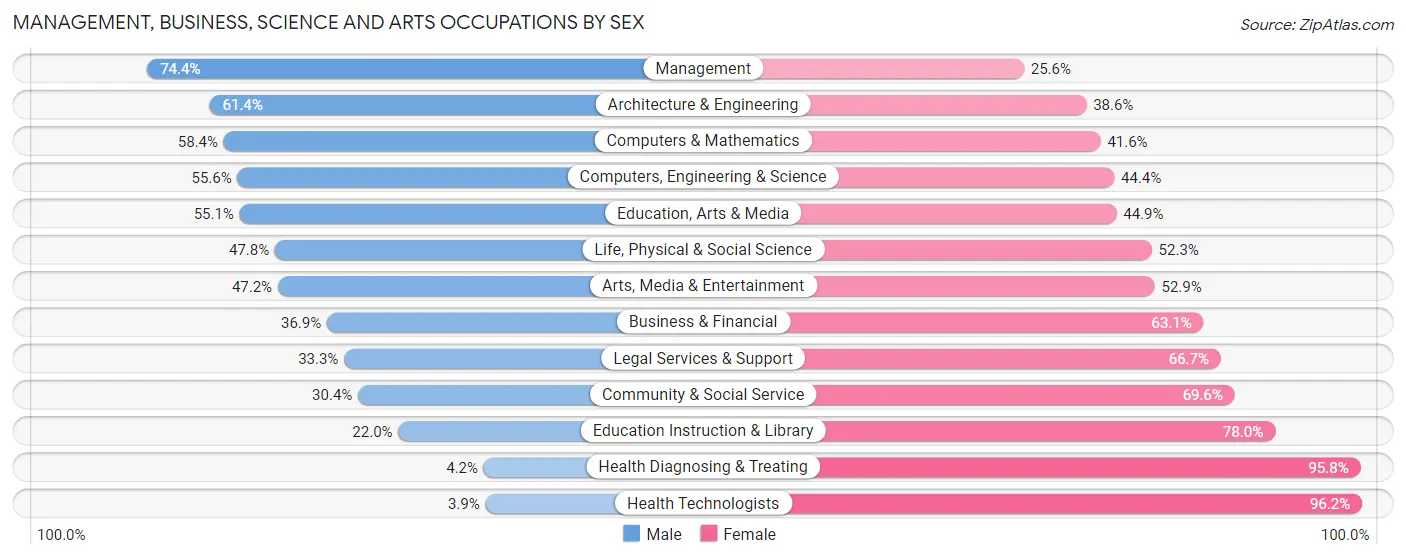
Management, Business, Science and Arts Occupations by Sex
Within the Management, Business, Science and Arts occupations in Kulpsville, the most male-oriented occupations are Management (74.4%), Architecture & Engineering (61.4%), and Computers & Mathematics (58.4%), while the most female-oriented occupations are Health Technologists (96.2%), Health Diagnosing & Treating (95.8%), and Education Instruction & Library (78.0%).
| Occupation | Male | Female |
| Management | 416 (74.4%) | 143 (25.6%) |
| Business & Financial | 196 (36.9%) | 335 (63.1%) |
| Computers, Engineering & Science | 304 (55.6%) | 243 (44.4%) |
| Computers & Mathematics | 149 (58.4%) | 106 (41.6%) |
| Architecture & Engineering | 70 (61.4%) | 44 (38.6%) |
| Life, Physical & Social Science | 85 (47.7%) | 93 (52.2%) |
| Community & Social Service | 219 (30.4%) | 501 (69.6%) |
| Education, Arts & Media | 43 (55.1%) | 35 (44.9%) |
| Legal Services & Support | 11 (33.3%) | 22 (66.7%) |
| Education Instruction & Library | 107 (22.0%) | 379 (78.0%) |
| Arts, Media & Entertainment | 58 (47.1%) | 65 (52.8%) |
| Health Diagnosing & Treating | 19 (4.2%) | 434 (95.8%) |
| Health Technologists | 14 (3.8%) | 350 (96.2%) |
| Total (Category) | 1,154 (41.1%) | 1,656 (58.9%) |
| Total (Overall) | 2,035 (45.5%) | 2,435 (54.5%) |
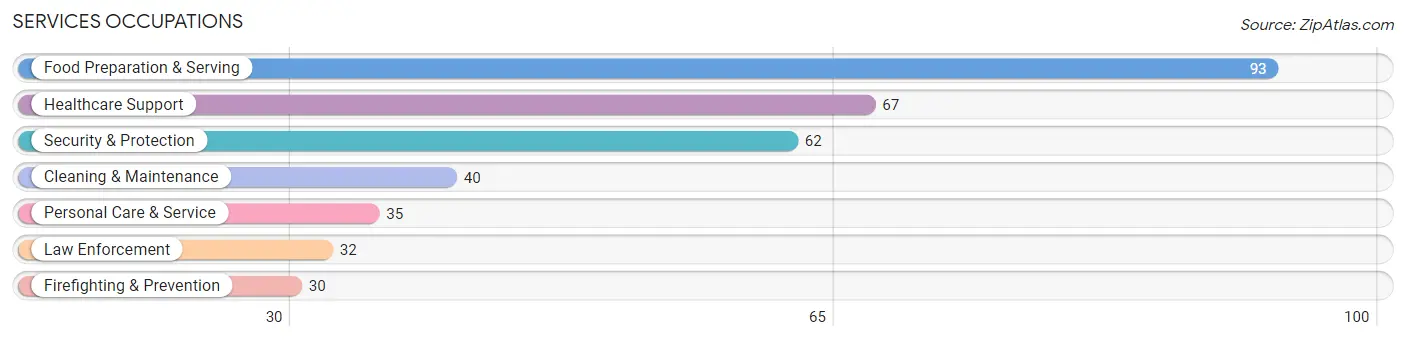
Services Occupations
The most common Services occupations in Kulpsville are Food Preparation & Serving (93 | 2.1%), Healthcare Support (67 | 1.5%), Security & Protection (62 | 1.4%), Cleaning & Maintenance (40 | 0.9%), and Personal Care & Service (35 | 0.8%).
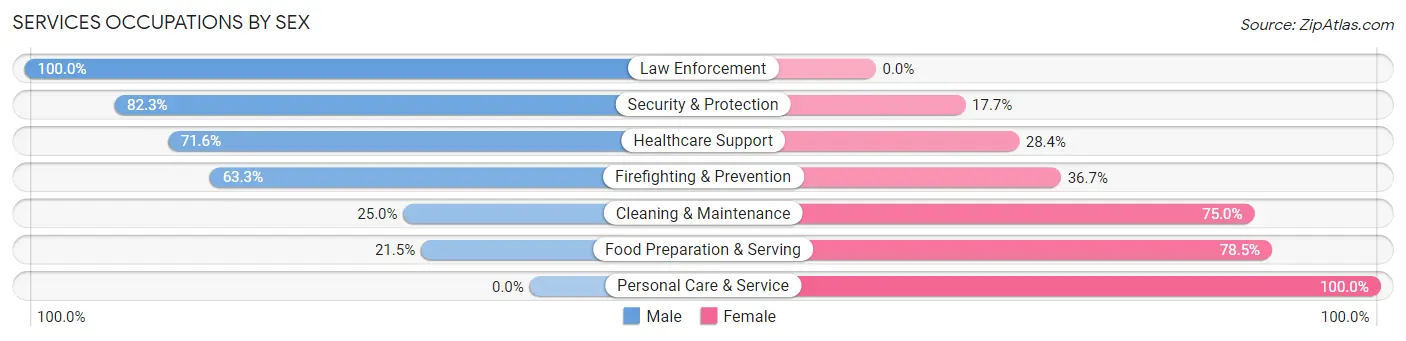
Services Occupations by Sex
Within the Services occupations in Kulpsville, the most male-oriented occupations are Law Enforcement (100.0%), Security & Protection (82.3%), and Healthcare Support (71.6%), while the most female-oriented occupations are Personal Care & Service (100.0%), Food Preparation & Serving (78.5%), and Cleaning & Maintenance (75.0%).
| Occupation | Male | Female |
| Healthcare Support | 48 (71.6%) | 19 (28.4%) |
| Security & Protection | 51 (82.3%) | 11 (17.7%) |
| Firefighting & Prevention | 19 (63.3%) | 11 (36.7%) |
| Law Enforcement | 32 (100.0%) | 0 (0.0%) |
| Food Preparation & Serving | 20 (21.5%) | 73 (78.5%) |
| Cleaning & Maintenance | 10 (25.0%) | 30 (75.0%) |
| Personal Care & Service | 0 (0.0%) | 35 (100.0%) |
| Total (Category) | 129 (43.4%) | 168 (56.6%) |
| Total (Overall) | 2,035 (45.5%) | 2,435 (54.5%) |
Sales and Office Occupations
The most common Sales and Office occupations in Kulpsville are Sales & Related (477 | 10.7%), and Office & Administration (464 | 10.4%).

Sales and Office Occupations by Sex
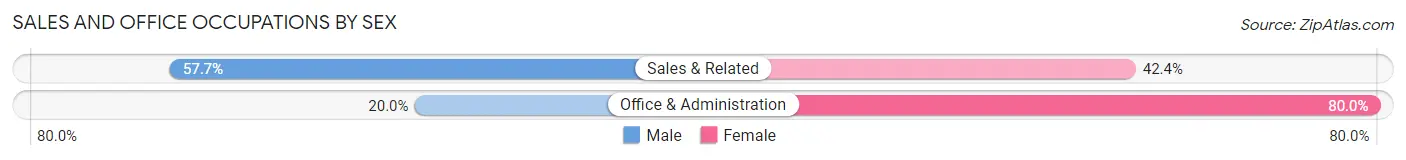
| Occupation | Male | Female |
| Sales & Related | 275 (57.7%) | 202 (42.3%) |
| Office & Administration | 93 (20.0%) | 371 (80.0%) |
| Total (Category) | 368 (39.1%) | 573 (60.9%) |
| Total (Overall) | 2,035 (45.5%) | 2,435 (54.5%) |
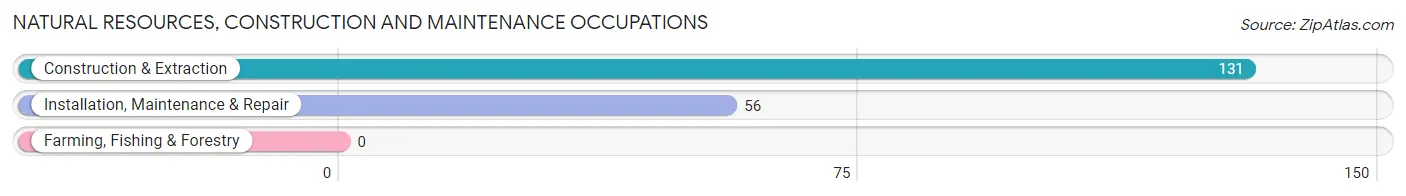
Natural Resources, Construction and Maintenance Occupations
The most common Natural Resources, Construction and Maintenance occupations in Kulpsville are Construction & Extraction (131 | 2.9%), and Installation, Maintenance & Repair (56 | 1.3%).
Natural Resources, Construction and Maintenance Occupations by Sex
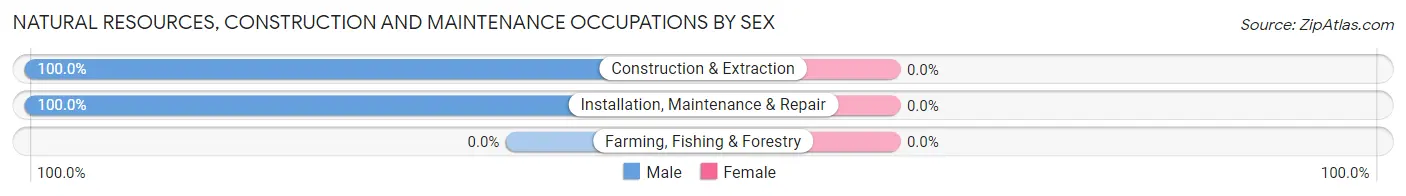
| Occupation | Male | Female |
| Farming, Fishing & Forestry | 0 (0.0%) | 0 (0.0%) |
| Construction & Extraction | 131 (100.0%) | 0 (0.0%) |
| Installation, Maintenance & Repair | 56 (100.0%) | 0 (0.0%) |
| Total (Category) | 187 (100.0%) | 0 (0.0%) |
| Total (Overall) | 2,035 (45.5%) | 2,435 (54.5%) |
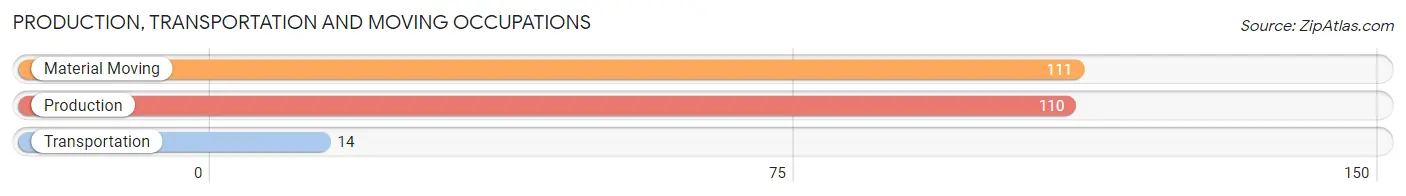
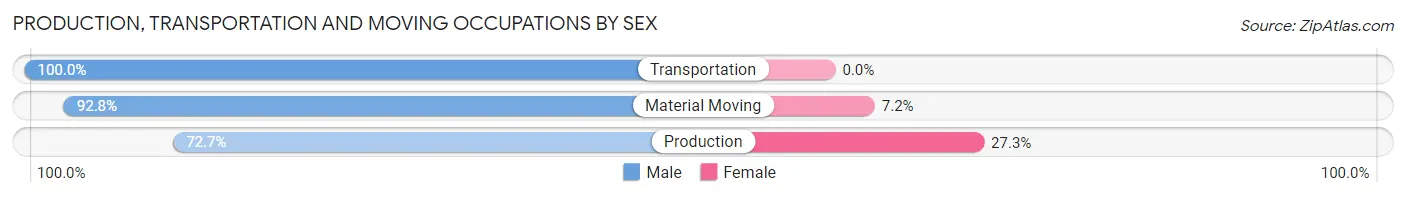
Production, Transportation and Moving Occupations
The most common Production, Transportation and Moving occupations in Kulpsville are Material Moving (111 | 2.5%), Production (110 | 2.5%), and Transportation (14 | 0.3%).
Production, Transportation and Moving Occupations by Sex
| Occupation | Male | Female |
| Production | 80 (72.7%) | 30 (27.3%) |
| Transportation | 14 (100.0%) | 0 (0.0%) |
| Material Moving | 103 (92.8%) | 8 (7.2%) |
| Total (Category) | 197 (83.8%) | 38 (16.2%) |
| Total (Overall) | 2,035 (45.5%) | 2,435 (54.5%) |
Employment Industries by Sex in Kulpsville
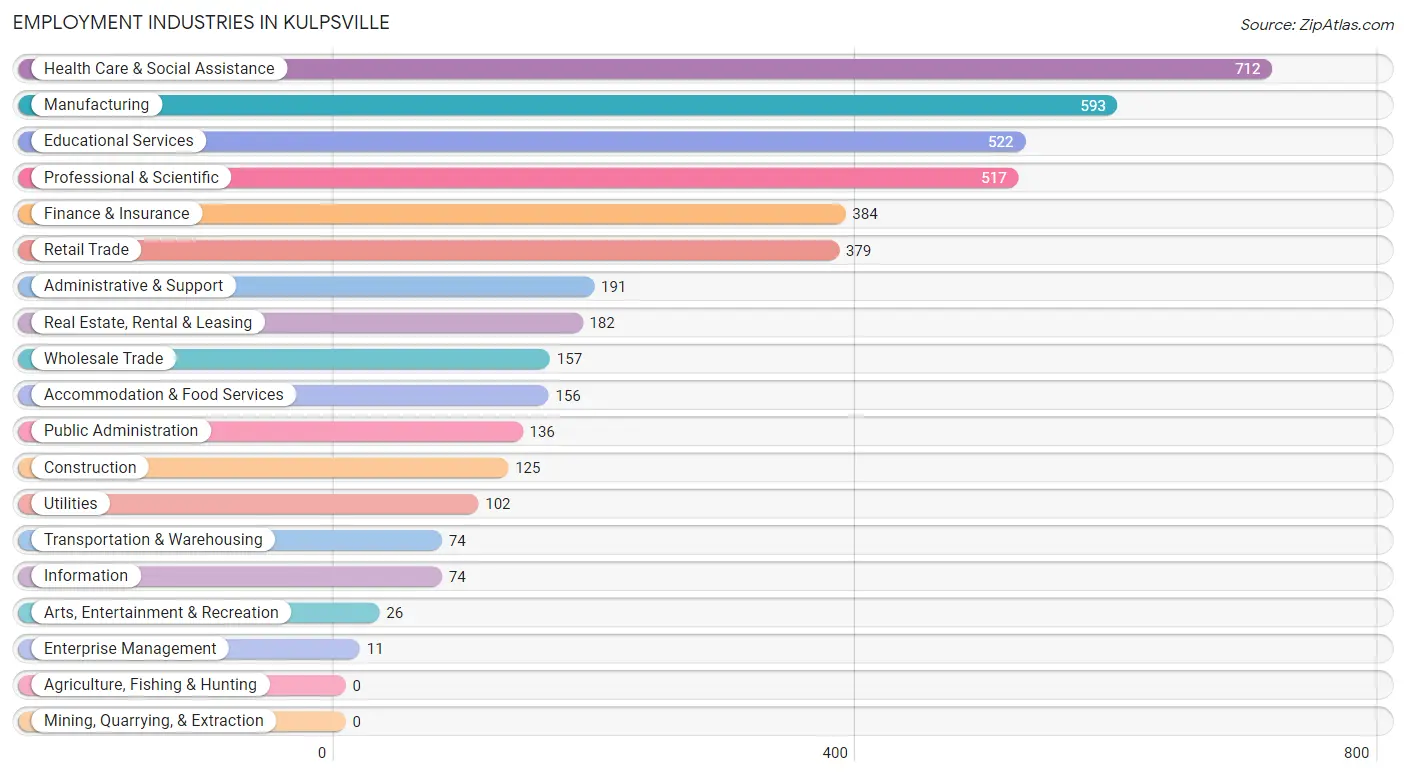
Employment Industries in Kulpsville
The major employment industries in Kulpsville include Health Care & Social Assistance (712 | 15.9%), Manufacturing (593 | 13.3%), Educational Services (522 | 11.7%), Professional & Scientific (517 | 11.6%), and Finance & Insurance (384 | 8.6%).
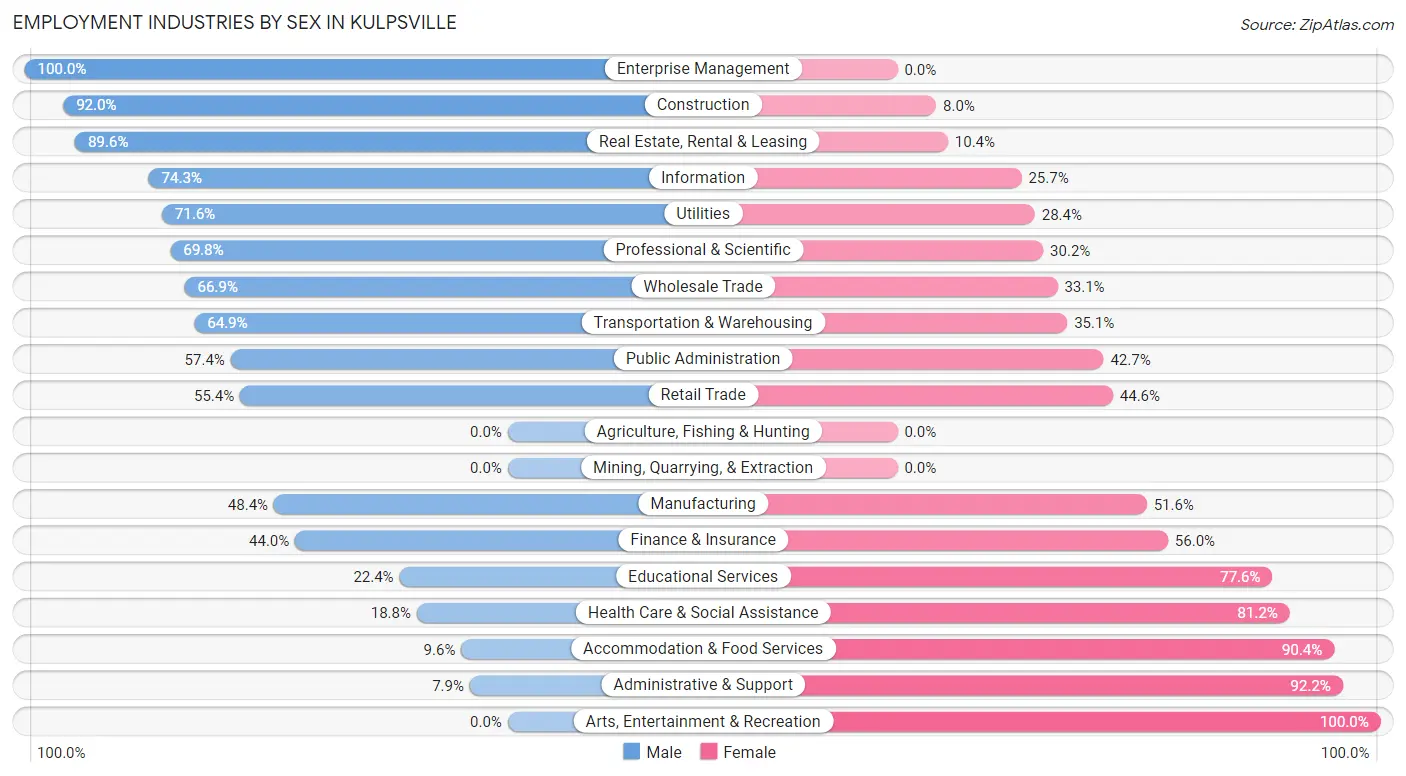
Employment Industries by Sex in Kulpsville
The Kulpsville industries that see more men than women are Enterprise Management (100.0%), Construction (92.0%), and Real Estate, Rental & Leasing (89.6%), whereas the industries that tend to have a higher number of women are Arts, Entertainment & Recreation (100.0%), Administrative & Support (92.1%), and Accommodation & Food Services (90.4%).
| Industry | Male | Female |
| Agriculture, Fishing & Hunting | 0 (0.0%) | 0 (0.0%) |
| Mining, Quarrying, & Extraction | 0 (0.0%) | 0 (0.0%) |
| Construction | 115 (92.0%) | 10 (8.0%) |
| Manufacturing | 287 (48.4%) | 306 (51.6%) |
| Wholesale Trade | 105 (66.9%) | 52 (33.1%) |
| Retail Trade | 210 (55.4%) | 169 (44.6%) |
| Transportation & Warehousing | 48 (64.9%) | 26 (35.1%) |
| Utilities | 73 (71.6%) | 29 (28.4%) |
| Information | 55 (74.3%) | 19 (25.7%) |
| Finance & Insurance | 169 (44.0%) | 215 (56.0%) |
| Real Estate, Rental & Leasing | 163 (89.6%) | 19 (10.4%) |
| Professional & Scientific | 361 (69.8%) | 156 (30.2%) |
| Enterprise Management | 11 (100.0%) | 0 (0.0%) |
| Administrative & Support | 15 (7.9%) | 176 (92.1%) |
| Educational Services | 117 (22.4%) | 405 (77.6%) |
| Health Care & Social Assistance | 134 (18.8%) | 578 (81.2%) |
| Arts, Entertainment & Recreation | 0 (0.0%) | 26 (100.0%) |
| Accommodation & Food Services | 15 (9.6%) | 141 (90.4%) |
| Public Administration | 78 (57.4%) | 58 (42.6%) |
| Total | 2,035 (45.5%) | 2,435 (54.5%) |
Education in Kulpsville
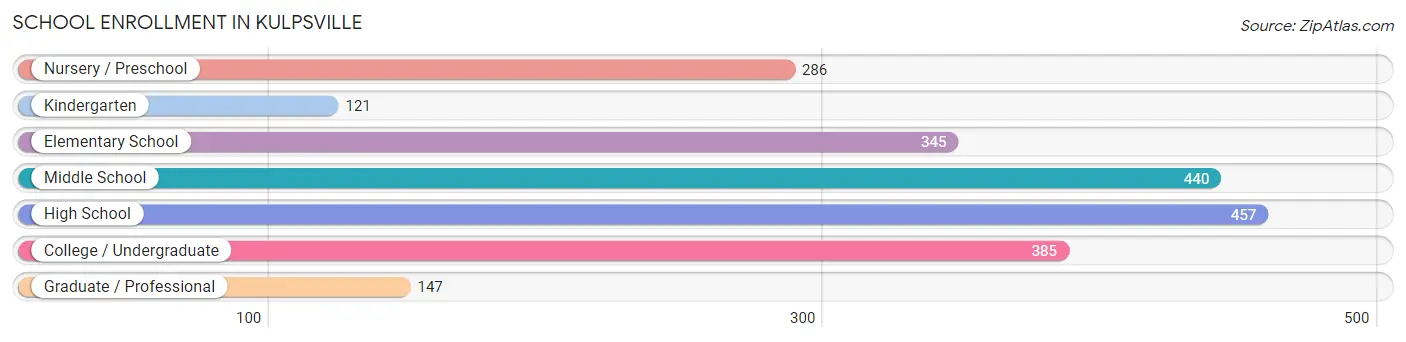
School Enrollment in Kulpsville
The most common levels of schooling among the 2,181 students in Kulpsville are high school (457 | 20.9%), middle school (440 | 20.2%), and college / undergraduate (385 | 17.6%).
| School Level | # Students | % Students |
| Nursery / Preschool | 286 | 13.1% |
| Kindergarten | 121 | 5.6% |
| Elementary School | 345 | 15.8% |
| Middle School | 440 | 20.2% |
| High School | 457 | 20.9% |
| College / Undergraduate | 385 | 17.6% |
| Graduate / Professional | 147 | 6.7% |
| Total | 2,181 | 100.0% |
School Enrollment by Age by Funding Source in Kulpsville
Out of a total of 2,181 students who are enrolled in schools in Kulpsville, 473 (21.7%) attend a private institution, while the remaining 1,708 (78.3%) are enrolled in public schools. The age group of 3 to 4 year olds has the highest likelihood of being enrolled in private schools, with 156 (71.9% in the age bracket) enrolled. Conversely, the age group of 20 to 24 year olds has the lowest likelihood of being enrolled in a private school, with 227 (94.6% in the age bracket) attending a public institution.
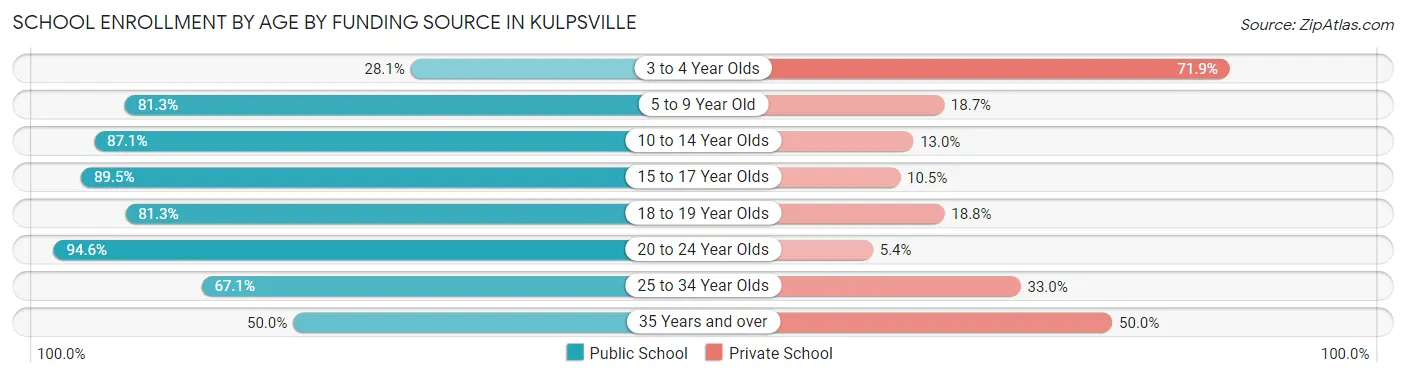
| Age Bracket | Public School | Private School |
| 3 to 4 Year Olds | 61 (28.1%) | 156 (71.9%) |
| 5 to 9 Year Old | 379 (81.3%) | 87 (18.7%) |
| 10 to 14 Year Olds | 464 (87.1%) | 69 (13.0%) |
| 15 to 17 Year Olds | 315 (89.5%) | 37 (10.5%) |
| 18 to 19 Year Olds | 117 (81.2%) | 27 (18.8%) |
| 20 to 24 Year Olds | 227 (94.6%) | 13 (5.4%) |
| 25 to 34 Year Olds | 116 (67.0%) | 57 (33.0%) |
| 35 Years and over | 28 (50.0%) | 28 (50.0%) |
| Total | 1,708 (78.3%) | 473 (21.7%) |
Educational Attainment by Field of Study in Kulpsville
Business (813 | 23.8%), science & technology (476 | 14.0%), education (391 | 11.5%), engineering (360 | 10.5%), and bio, nature & agricultural (308 | 9.0%) are the most common fields of study among 3,411 individuals in Kulpsville who have obtained a bachelor's degree or higher.
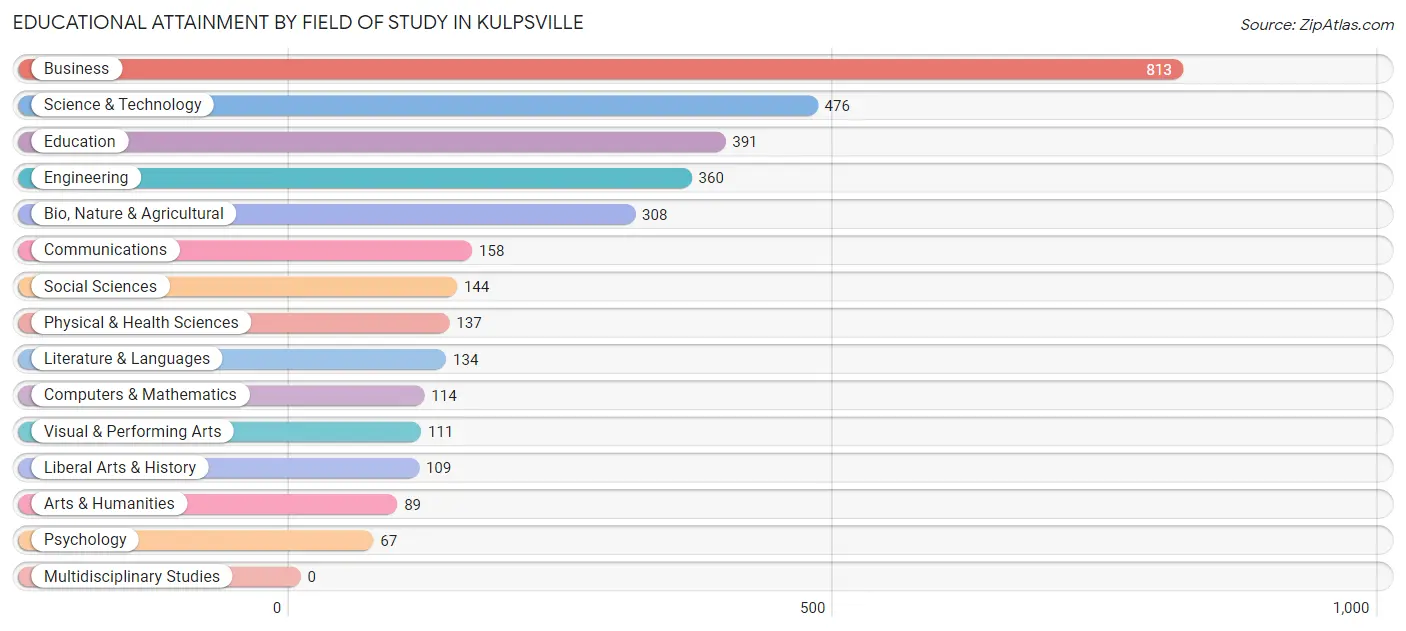
| Field of Study | # Graduates | % Graduates |
| Computers & Mathematics | 114 | 3.3% |
| Bio, Nature & Agricultural | 308 | 9.0% |
| Physical & Health Sciences | 137 | 4.0% |
| Psychology | 67 | 2.0% |
| Social Sciences | 144 | 4.2% |
| Engineering | 360 | 10.5% |
| Multidisciplinary Studies | 0 | 0.0% |
| Science & Technology | 476 | 14.0% |
| Business | 813 | 23.8% |
| Education | 391 | 11.5% |
| Literature & Languages | 134 | 3.9% |
| Liberal Arts & History | 109 | 3.2% |
| Visual & Performing Arts | 111 | 3.3% |
| Communications | 158 | 4.6% |
| Arts & Humanities | 89 | 2.6% |
| Total | 3,411 | 100.0% |
Transportation & Commute in Kulpsville
Vehicle Availability by Sex in Kulpsville
The most prevalent vehicle ownership categories in Kulpsville are males with 2 vehicles (1,285, accounting for 63.4%) and females with 2 vehicles (1,334, making up 54.1%).
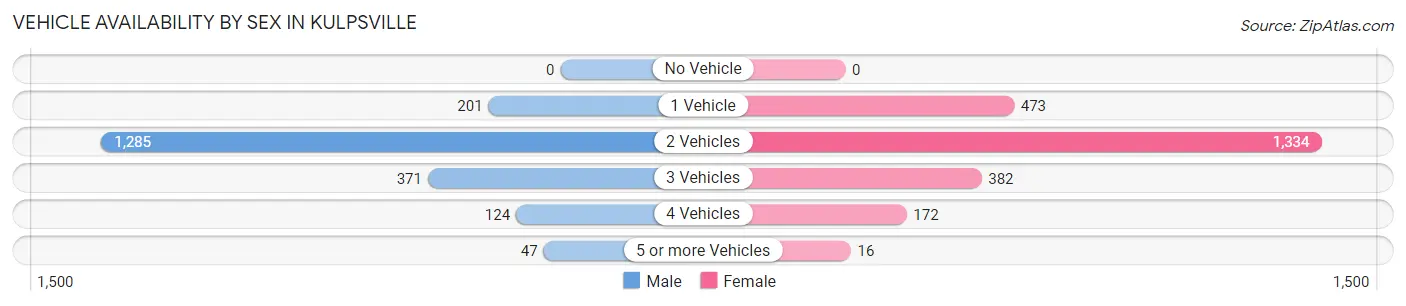
| Vehicles Available | Male | Female |
| No Vehicle | 0 (0.0%) | 0 (0.0%) |
| 1 Vehicle | 201 (9.9%) | 473 (19.9%) |
| 2 Vehicles | 1,285 (63.4%) | 1,334 (56.1%) |
| 3 Vehicles | 371 (18.3%) | 382 (16.1%) |
| 4 Vehicles | 124 (6.1%) | 172 (7.2%) |
| 5 or more Vehicles | 47 (2.3%) | 16 (0.7%) |
| Total | 2,028 (100.0%) | 2,377 (100.0%) |
Commute Time in Kulpsville
The most frequently occuring commute durations in Kulpsville are 20 to 24 minutes (683 commuters, 18.6%), 45 to 59 minutes (464 commuters, 12.6%), and 25 to 29 minutes (460 commuters, 12.5%).
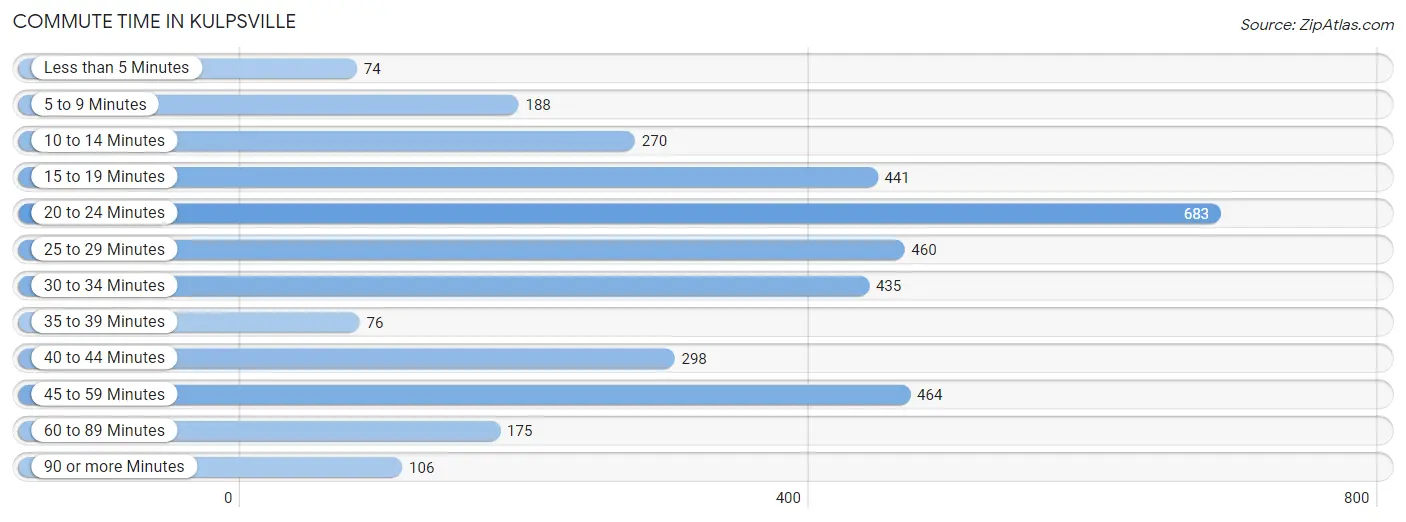
| Commute Time | # Commuters | % Commuters |
| Less than 5 Minutes | 74 | 2.0% |
| 5 to 9 Minutes | 188 | 5.1% |
| 10 to 14 Minutes | 270 | 7.4% |
| 15 to 19 Minutes | 441 | 12.0% |
| 20 to 24 Minutes | 683 | 18.6% |
| 25 to 29 Minutes | 460 | 12.5% |
| 30 to 34 Minutes | 435 | 11.8% |
| 35 to 39 Minutes | 76 | 2.1% |
| 40 to 44 Minutes | 298 | 8.1% |
| 45 to 59 Minutes | 464 | 12.6% |
| 60 to 89 Minutes | 175 | 4.8% |
| 90 or more Minutes | 106 | 2.9% |
Commute Time by Sex in Kulpsville
The most common commute times in Kulpsville are 20 to 24 minutes (337 commuters, 19.7%) for males and 20 to 24 minutes (346 commuters, 17.7%) for females.
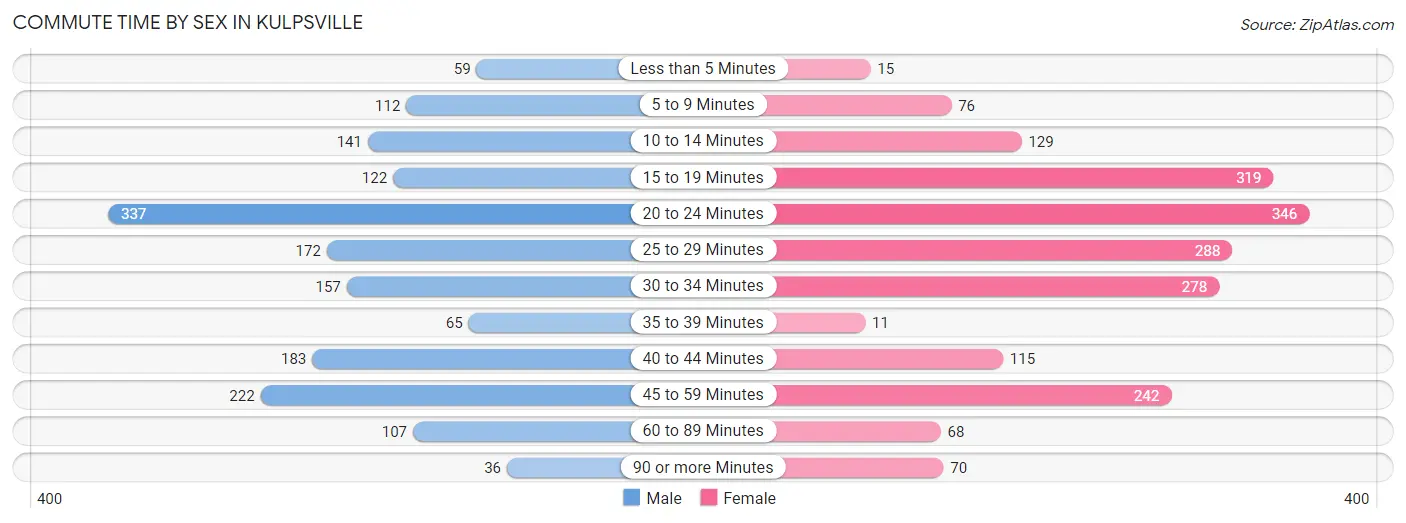
| Commute Time | Male | Female |
| Less than 5 Minutes | 59 (3.4%) | 15 (0.8%) |
| 5 to 9 Minutes | 112 (6.5%) | 76 (3.9%) |
| 10 to 14 Minutes | 141 (8.2%) | 129 (6.6%) |
| 15 to 19 Minutes | 122 (7.1%) | 319 (16.3%) |
| 20 to 24 Minutes | 337 (19.7%) | 346 (17.7%) |
| 25 to 29 Minutes | 172 (10.0%) | 288 (14.7%) |
| 30 to 34 Minutes | 157 (9.2%) | 278 (14.2%) |
| 35 to 39 Minutes | 65 (3.8%) | 11 (0.6%) |
| 40 to 44 Minutes | 183 (10.7%) | 115 (5.9%) |
| 45 to 59 Minutes | 222 (13.0%) | 242 (12.4%) |
| 60 to 89 Minutes | 107 (6.2%) | 68 (3.5%) |
| 90 or more Minutes | 36 (2.1%) | 70 (3.6%) |
Time of Departure to Work by Sex in Kulpsville
The most frequent times of departure to work in Kulpsville are 7:30 AM to 7:59 AM (357, 20.8%) for males and 7:30 AM to 7:59 AM (469, 24.0%) for females.
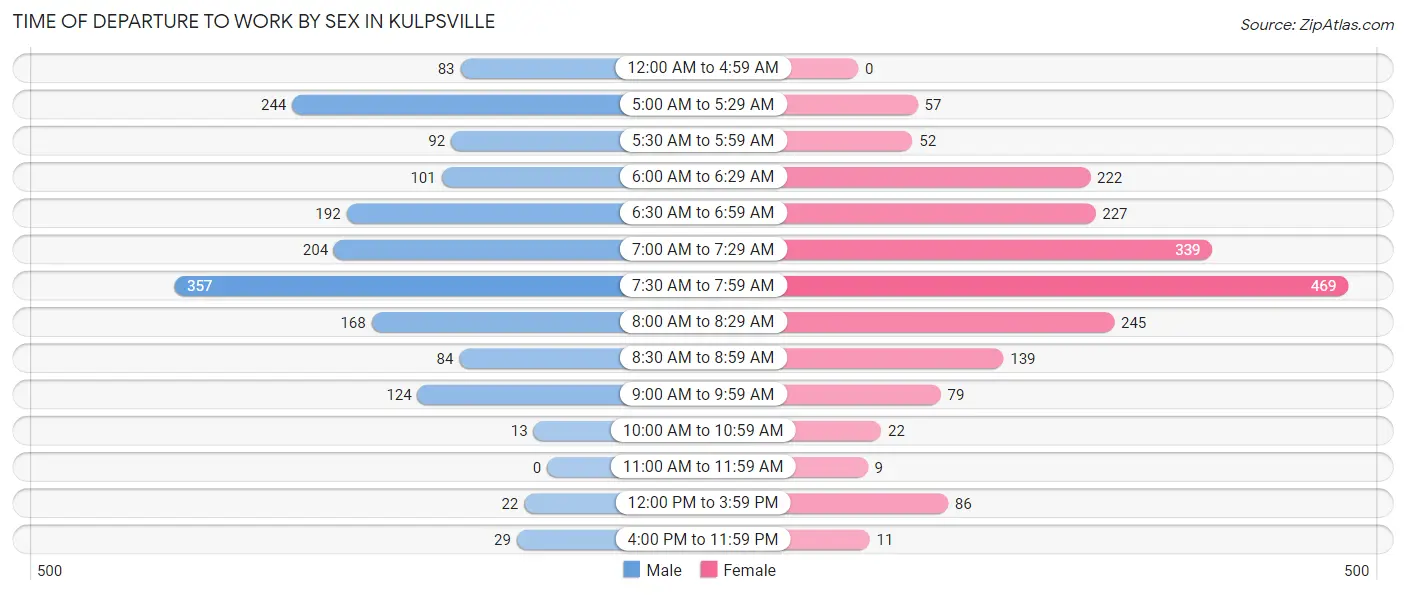
| Time of Departure | Male | Female |
| 12:00 AM to 4:59 AM | 83 (4.9%) | 0 (0.0%) |
| 5:00 AM to 5:29 AM | 244 (14.2%) | 57 (2.9%) |
| 5:30 AM to 5:59 AM | 92 (5.4%) | 52 (2.7%) |
| 6:00 AM to 6:29 AM | 101 (5.9%) | 222 (11.3%) |
| 6:30 AM to 6:59 AM | 192 (11.2%) | 227 (11.6%) |
| 7:00 AM to 7:29 AM | 204 (11.9%) | 339 (17.3%) |
| 7:30 AM to 7:59 AM | 357 (20.8%) | 469 (24.0%) |
| 8:00 AM to 8:29 AM | 168 (9.8%) | 245 (12.5%) |
| 8:30 AM to 8:59 AM | 84 (4.9%) | 139 (7.1%) |
| 9:00 AM to 9:59 AM | 124 (7.2%) | 79 (4.0%) |
| 10:00 AM to 10:59 AM | 13 (0.8%) | 22 (1.1%) |
| 11:00 AM to 11:59 AM | 0 (0.0%) | 9 (0.5%) |
| 12:00 PM to 3:59 PM | 22 (1.3%) | 86 (4.4%) |
| 4:00 PM to 11:59 PM | 29 (1.7%) | 11 (0.6%) |
| Total | 1,713 (100.0%) | 1,957 (100.0%) |
Housing Occupancy in Kulpsville
Occupancy by Ownership in Kulpsville
Of the total 3,746 dwellings in Kulpsville, owner-occupied units account for 2,380 (63.5%), while renter-occupied units make up 1,366 (36.5%).
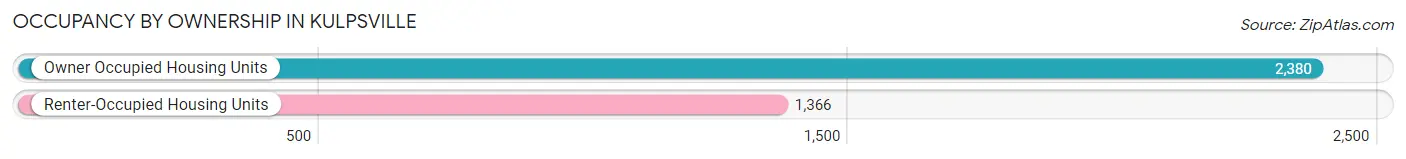
| Occupancy | # Housing Units | % Housing Units |
| Owner Occupied Housing Units | 2,380 | 63.5% |
| Renter-Occupied Housing Units | 1,366 | 36.5% |
| Total Occupied Housing Units | 3,746 | 100.0% |
Occupancy by Household Size in Kulpsville
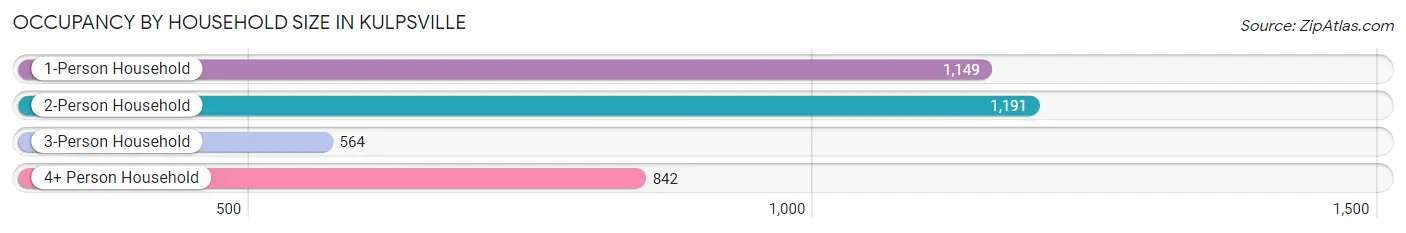
| Household Size | # Housing Units | % Housing Units |
| 1-Person Household | 1,149 | 30.7% |
| 2-Person Household | 1,191 | 31.8% |
| 3-Person Household | 564 | 15.1% |
| 4+ Person Household | 842 | 22.5% |
| Total Housing Units | 3,746 | 100.0% |
Occupancy by Ownership by Household Size in Kulpsville
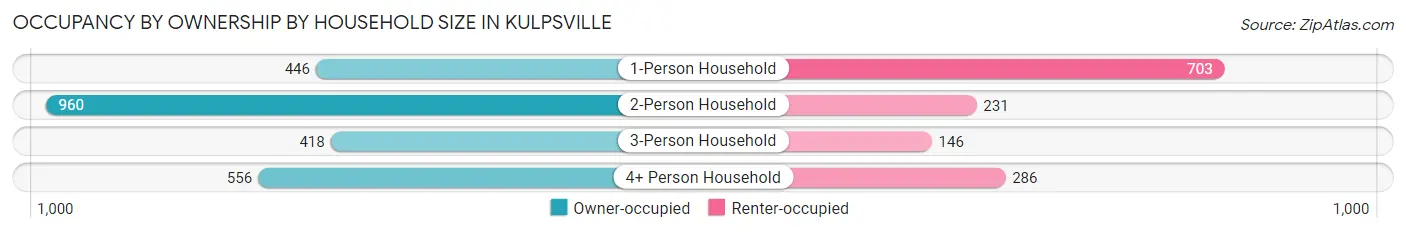
| Household Size | Owner-occupied | Renter-occupied |
| 1-Person Household | 446 (38.8%) | 703 (61.2%) |
| 2-Person Household | 960 (80.6%) | 231 (19.4%) |
| 3-Person Household | 418 (74.1%) | 146 (25.9%) |
| 4+ Person Household | 556 (66.0%) | 286 (34.0%) |
| Total Housing Units | 2,380 (63.5%) | 1,366 (36.5%) |
Occupancy by Educational Attainment in Kulpsville
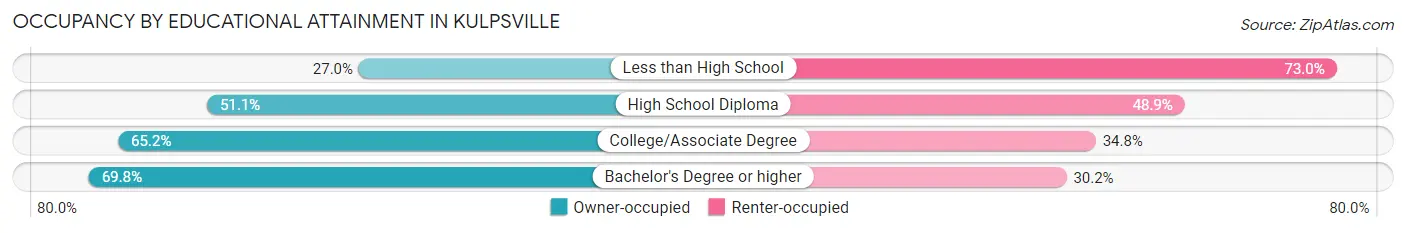
| Household Size | Owner-occupied | Renter-occupied |
| Less than High School | 17 (27.0%) | 46 (73.0%) |
| High School Diploma | 454 (51.1%) | 435 (48.9%) |
| College/Associate Degree | 586 (65.2%) | 313 (34.8%) |
| Bachelor's Degree or higher | 1,323 (69.8%) | 572 (30.2%) |
Occupancy by Age of Householder in Kulpsville
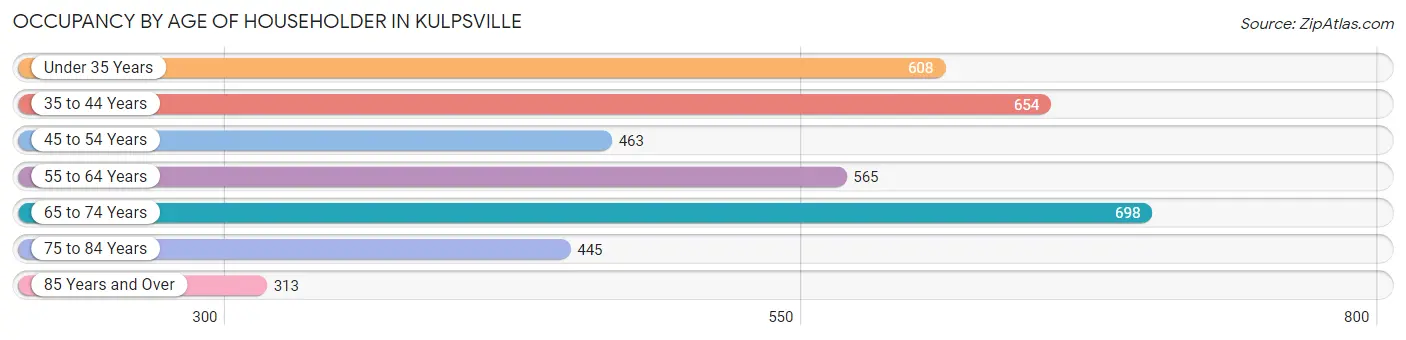
| Age Bracket | # Households | % Households |
| Under 35 Years | 608 | 16.2% |
| 35 to 44 Years | 654 | 17.5% |
| 45 to 54 Years | 463 | 12.4% |
| 55 to 64 Years | 565 | 15.1% |
| 65 to 74 Years | 698 | 18.6% |
| 75 to 84 Years | 445 | 11.9% |
| 85 Years and Over | 313 | 8.4% |
| Total | 3,746 | 100.0% |
Housing Finances in Kulpsville
Median Income by Occupancy in Kulpsville
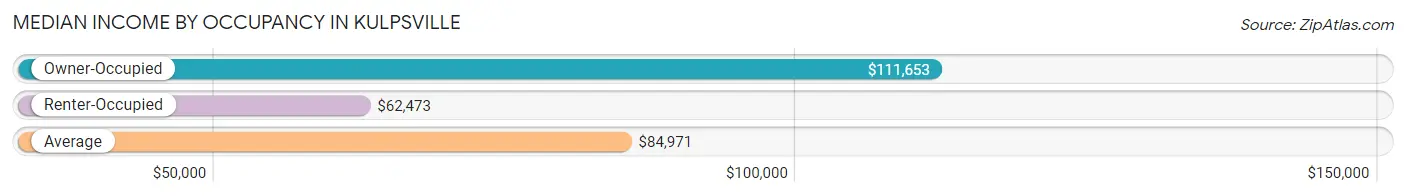
| Occupancy Type | # Households | Median Income |
| Owner-Occupied | 2,380 (63.5%) | $111,653 |
| Renter-Occupied | 1,366 (36.5%) | $62,473 |
| Average | 3,746 (100.0%) | $84,971 |
Occupancy by Householder Income Bracket in Kulpsville
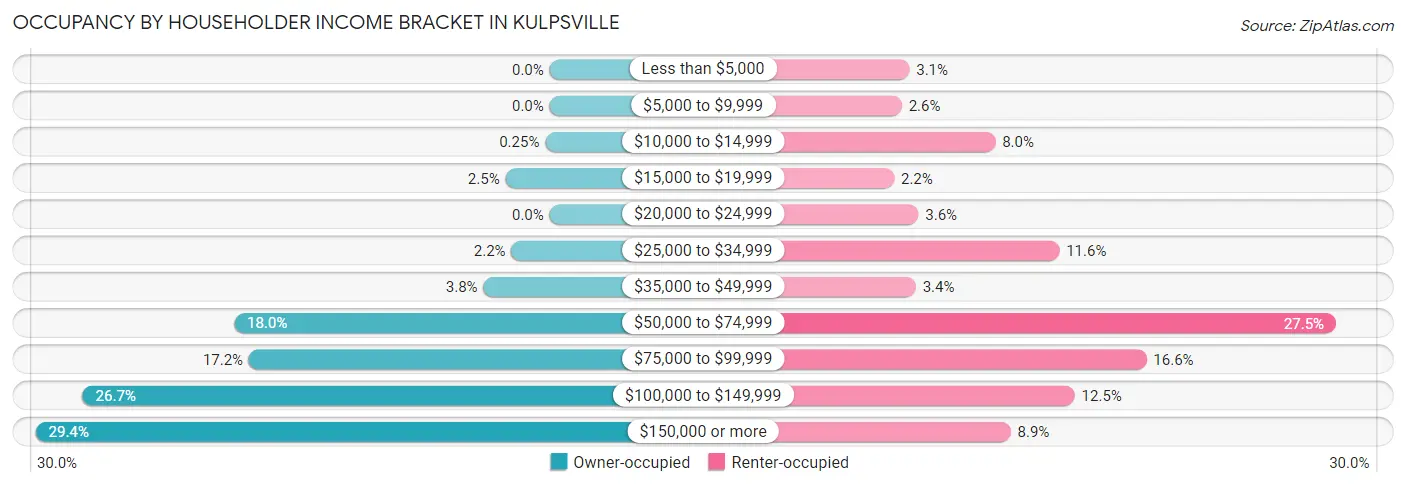
| Income Bracket | Owner-occupied | Renter-occupied |
| Less than $5,000 | 0 (0.0%) | 42 (3.1%) |
| $5,000 to $9,999 | 0 (0.0%) | 36 (2.6%) |
| $10,000 to $14,999 | 6 (0.3%) | 109 (8.0%) |
| $15,000 to $19,999 | 60 (2.5%) | 30 (2.2%) |
| $20,000 to $24,999 | 0 (0.0%) | 49 (3.6%) |
| $25,000 to $34,999 | 52 (2.2%) | 159 (11.6%) |
| $35,000 to $49,999 | 90 (3.8%) | 47 (3.4%) |
| $50,000 to $74,999 | 429 (18.0%) | 375 (27.5%) |
| $75,000 to $99,999 | 409 (17.2%) | 227 (16.6%) |
| $100,000 to $149,999 | 635 (26.7%) | 171 (12.5%) |
| $150,000 or more | 699 (29.4%) | 121 (8.9%) |
| Total | 2,380 (100.0%) | 1,366 (100.0%) |
Monthly Housing Cost Tiers in Kulpsville
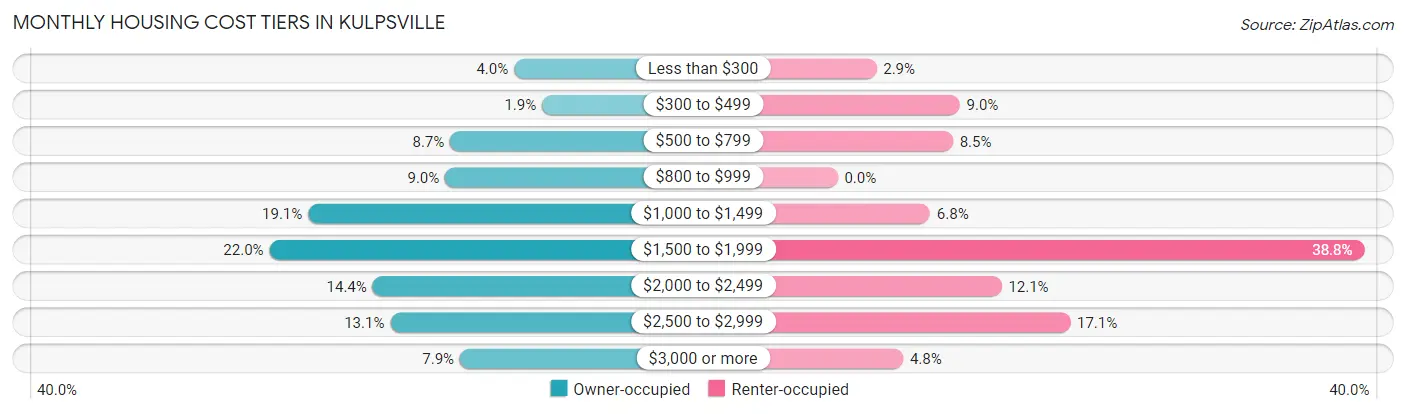
| Monthly Cost | Owner-occupied | Renter-occupied |
| Less than $300 | 94 (4.0%) | 39 (2.9%) |
| $300 to $499 | 45 (1.9%) | 123 (9.0%) |
| $500 to $799 | 206 (8.7%) | 116 (8.5%) |
| $800 to $999 | 215 (9.0%) | 0 (0.0%) |
| $1,000 to $1,499 | 455 (19.1%) | 93 (6.8%) |
| $1,500 to $1,999 | 523 (22.0%) | 530 (38.8%) |
| $2,000 to $2,499 | 342 (14.4%) | 165 (12.1%) |
| $2,500 to $2,999 | 311 (13.1%) | 234 (17.1%) |
| $3,000 or more | 189 (7.9%) | 66 (4.8%) |
| Total | 2,380 (100.0%) | 1,366 (100.0%) |
Physical Housing Characteristics in Kulpsville
Housing Structures in Kulpsville
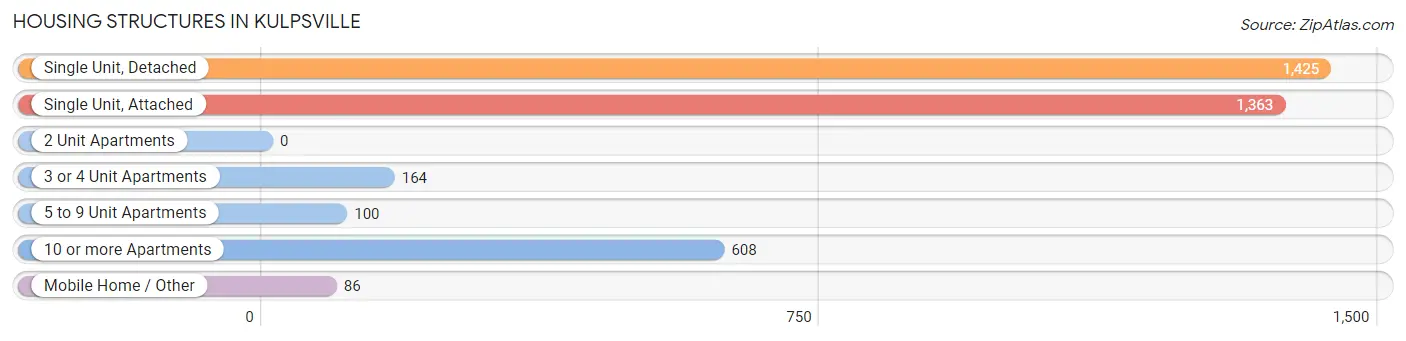
| Structure Type | # Housing Units | % Housing Units |
| Single Unit, Detached | 1,425 | 38.0% |
| Single Unit, Attached | 1,363 | 36.4% |
| 2 Unit Apartments | 0 | 0.0% |
| 3 or 4 Unit Apartments | 164 | 4.4% |
| 5 to 9 Unit Apartments | 100 | 2.7% |
| 10 or more Apartments | 608 | 16.2% |
| Mobile Home / Other | 86 | 2.3% |
| Total | 3,746 | 100.0% |
Housing Structures by Occupancy in Kulpsville
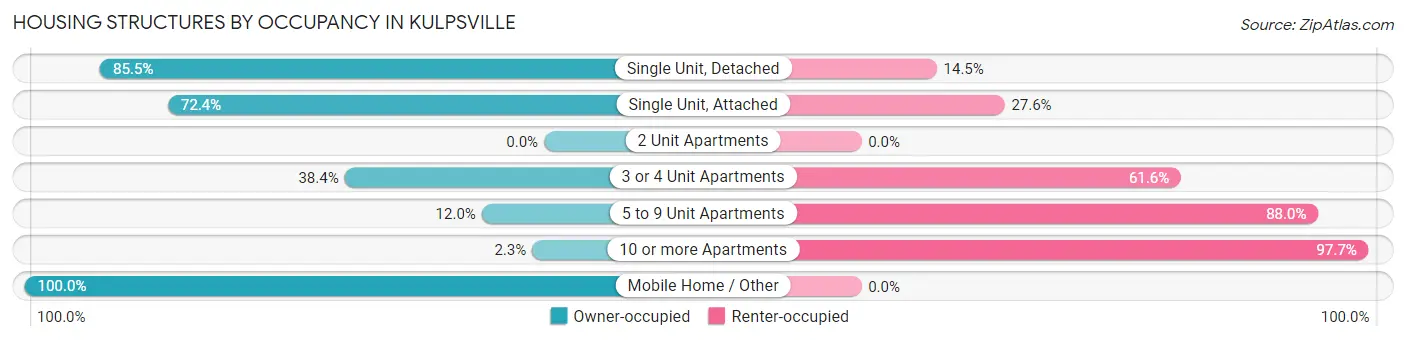
| Structure Type | Owner-occupied | Renter-occupied |
| Single Unit, Detached | 1,218 (85.5%) | 207 (14.5%) |
| Single Unit, Attached | 987 (72.4%) | 376 (27.6%) |
| 2 Unit Apartments | 0 (0.0%) | 0 (0.0%) |
| 3 or 4 Unit Apartments | 63 (38.4%) | 101 (61.6%) |
| 5 to 9 Unit Apartments | 12 (12.0%) | 88 (88.0%) |
| 10 or more Apartments | 14 (2.3%) | 594 (97.7%) |
| Mobile Home / Other | 86 (100.0%) | 0 (0.0%) |
| Total | 2,380 (63.5%) | 1,366 (36.5%) |
Housing Structures by Number of Rooms in Kulpsville
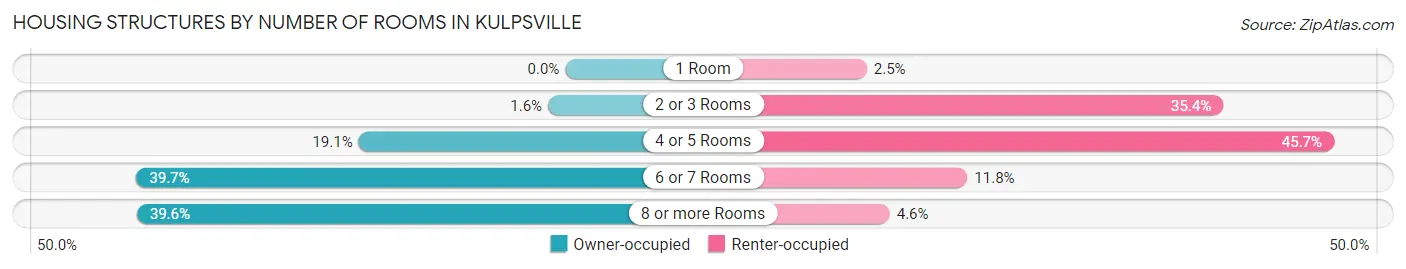
| Number of Rooms | Owner-occupied | Renter-occupied |
| 1 Room | 0 (0.0%) | 34 (2.5%) |
| 2 or 3 Rooms | 38 (1.6%) | 484 (35.4%) |
| 4 or 5 Rooms | 455 (19.1%) | 624 (45.7%) |
| 6 or 7 Rooms | 944 (39.7%) | 161 (11.8%) |
| 8 or more Rooms | 943 (39.6%) | 63 (4.6%) |
| Total | 2,380 (100.0%) | 1,366 (100.0%) |
Housing Structure by Heating Type in Kulpsville
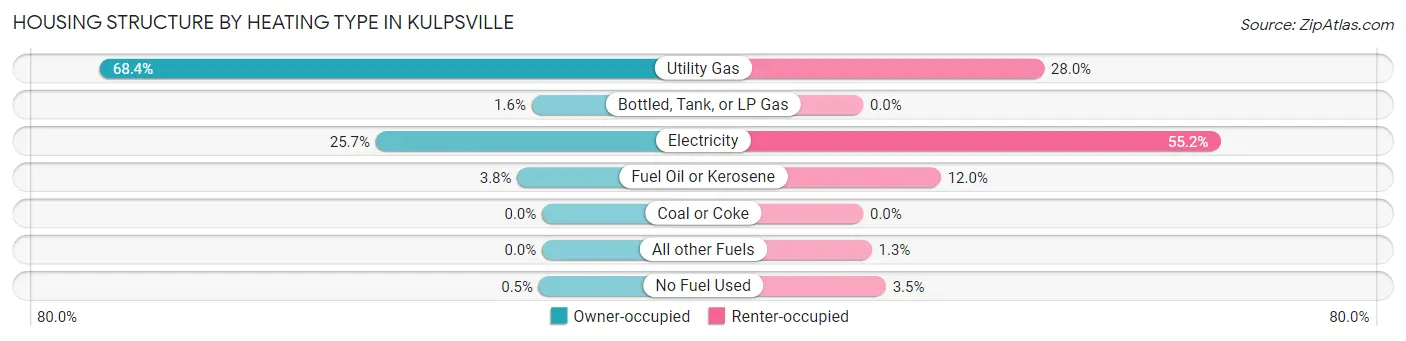
| Heating Type | Owner-occupied | Renter-occupied |
| Utility Gas | 1,627 (68.4%) | 382 (28.0%) |
| Bottled, Tank, or LP Gas | 38 (1.6%) | 0 (0.0%) |
| Electricity | 612 (25.7%) | 754 (55.2%) |
| Fuel Oil or Kerosene | 91 (3.8%) | 164 (12.0%) |
| Coal or Coke | 0 (0.0%) | 0 (0.0%) |
| All other Fuels | 0 (0.0%) | 18 (1.3%) |
| No Fuel Used | 12 (0.5%) | 48 (3.5%) |
| Total | 2,380 (100.0%) | 1,366 (100.0%) |
Household Vehicle Usage in Kulpsville
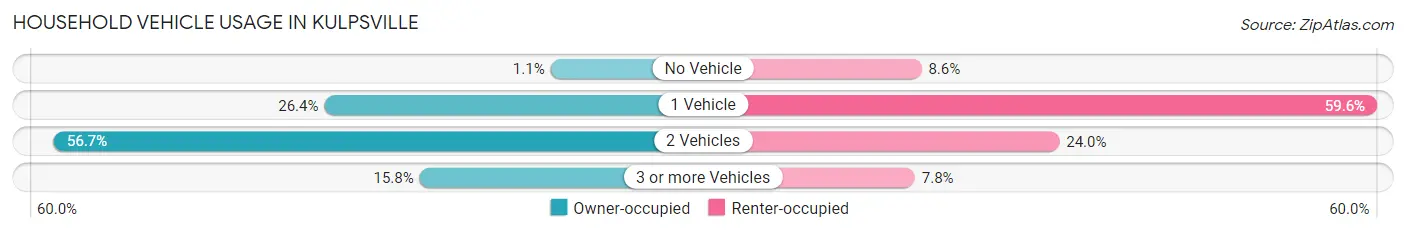
| Vehicles per Household | Owner-occupied | Renter-occupied |
| No Vehicle | 26 (1.1%) | 117 (8.6%) |
| 1 Vehicle | 629 (26.4%) | 814 (59.6%) |
| 2 Vehicles | 1,350 (56.7%) | 328 (24.0%) |
| 3 or more Vehicles | 375 (15.8%) | 107 (7.8%) |
| Total | 2,380 (100.0%) | 1,366 (100.0%) |
Real Estate & Mortgages in Kulpsville
Real Estate and Mortgage Overview in Kulpsville
| Characteristic | Without Mortgage | With Mortgage |
| Housing Units | 586 | 1,794 |
| Median Property Value | $281,700 | $313,100 |
| Median Household Income | $73,021 | $579 |
| Monthly Housing Costs | $765 | $189 |
| Real Estate Taxes | $4,303 | $34 |
Property Value by Mortgage Status in Kulpsville
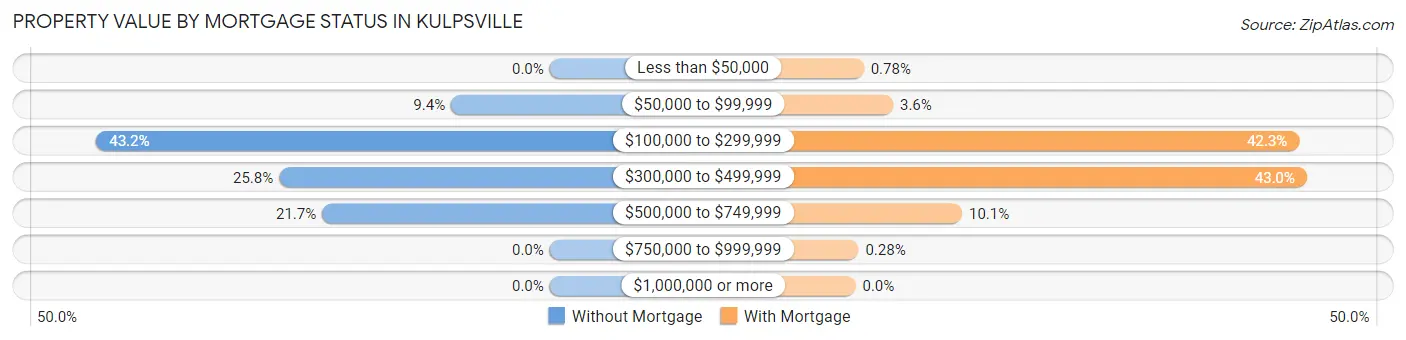
| Property Value | Without Mortgage | With Mortgage |
| Less than $50,000 | 0 (0.0%) | 14 (0.8%) |
| $50,000 to $99,999 | 55 (9.4%) | 64 (3.6%) |
| $100,000 to $299,999 | 253 (43.2%) | 758 (42.2%) |
| $300,000 to $499,999 | 151 (25.8%) | 771 (43.0%) |
| $500,000 to $749,999 | 127 (21.7%) | 182 (10.1%) |
| $750,000 to $999,999 | 0 (0.0%) | 5 (0.3%) |
| $1,000,000 or more | 0 (0.0%) | 0 (0.0%) |
| Total | 586 (100.0%) | 1,794 (100.0%) |
Household Income by Mortgage Status in Kulpsville
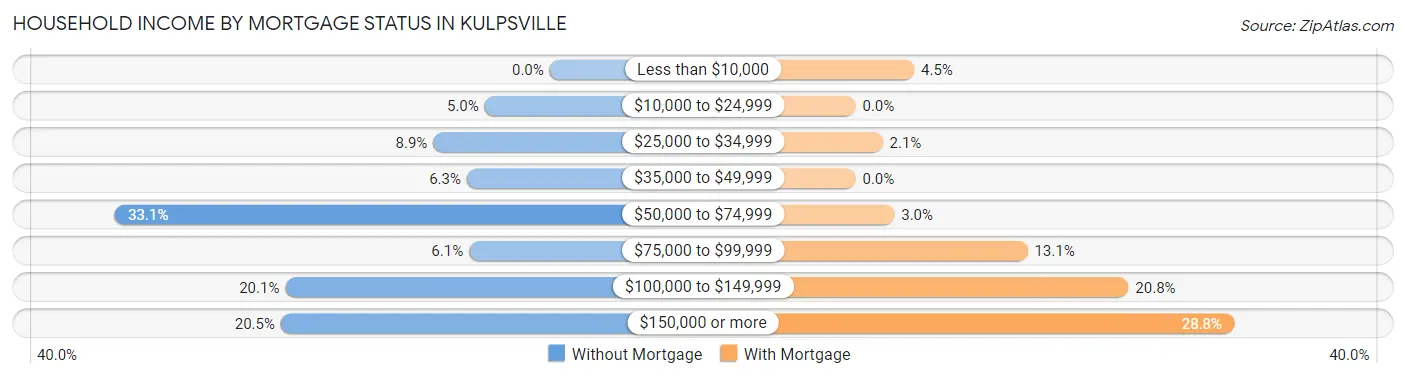
| Household Income | Without Mortgage | With Mortgage |
| Less than $10,000 | 0 (0.0%) | 80 (4.5%) |
| $10,000 to $24,999 | 29 (5.0%) | 0 (0.0%) |
| $25,000 to $34,999 | 52 (8.9%) | 37 (2.1%) |
| $35,000 to $49,999 | 37 (6.3%) | 0 (0.0%) |
| $50,000 to $74,999 | 194 (33.1%) | 53 (2.9%) |
| $75,000 to $99,999 | 36 (6.1%) | 235 (13.1%) |
| $100,000 to $149,999 | 118 (20.1%) | 373 (20.8%) |
| $150,000 or more | 120 (20.5%) | 517 (28.8%) |
| Total | 586 (100.0%) | 1,794 (100.0%) |
Property Value to Household Income Ratio in Kulpsville
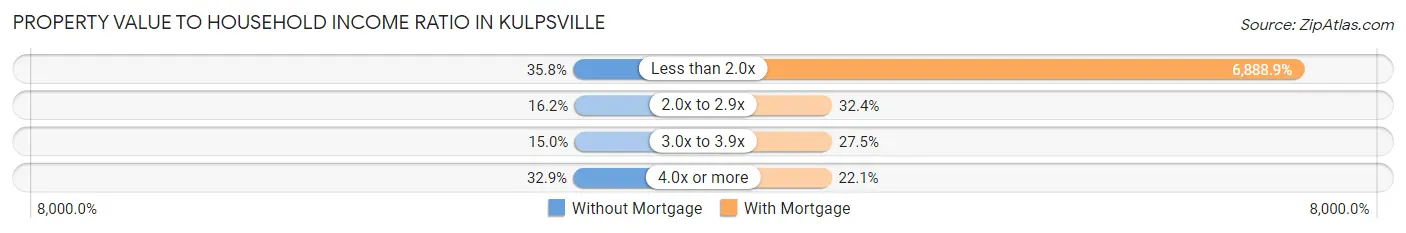
| Value-to-Income Ratio | Without Mortgage | With Mortgage |
| Less than 2.0x | 210 (35.8%) | 123,587 (6,888.9%) |
| 2.0x to 2.9x | 95 (16.2%) | 581 (32.4%) |
| 3.0x to 3.9x | 88 (15.0%) | 493 (27.5%) |
| 4.0x or more | 193 (32.9%) | 396 (22.1%) |
| Total | 586 (100.0%) | 1,794 (100.0%) |
Real Estate Taxes by Mortgage Status in Kulpsville
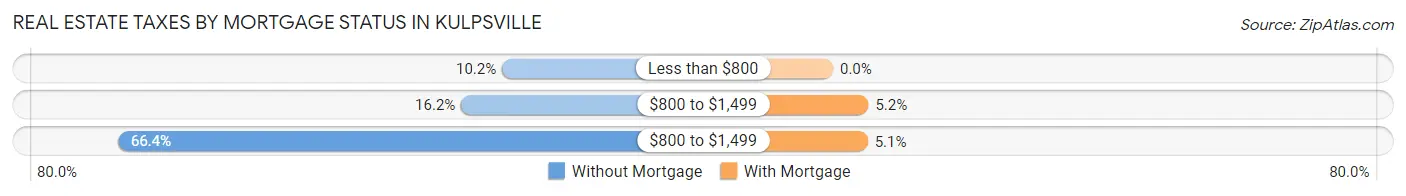
| Property Taxes | Without Mortgage | With Mortgage |
| Less than $800 | 60 (10.2%) | 0 (0.0%) |
| $800 to $1,499 | 95 (16.2%) | 93 (5.2%) |
| $800 to $1,499 | 389 (66.4%) | 91 (5.1%) |
| Total | 586 (100.0%) | 1,794 (100.0%) |
Health & Disability in Kulpsville
Health Insurance Coverage by Age in Kulpsville
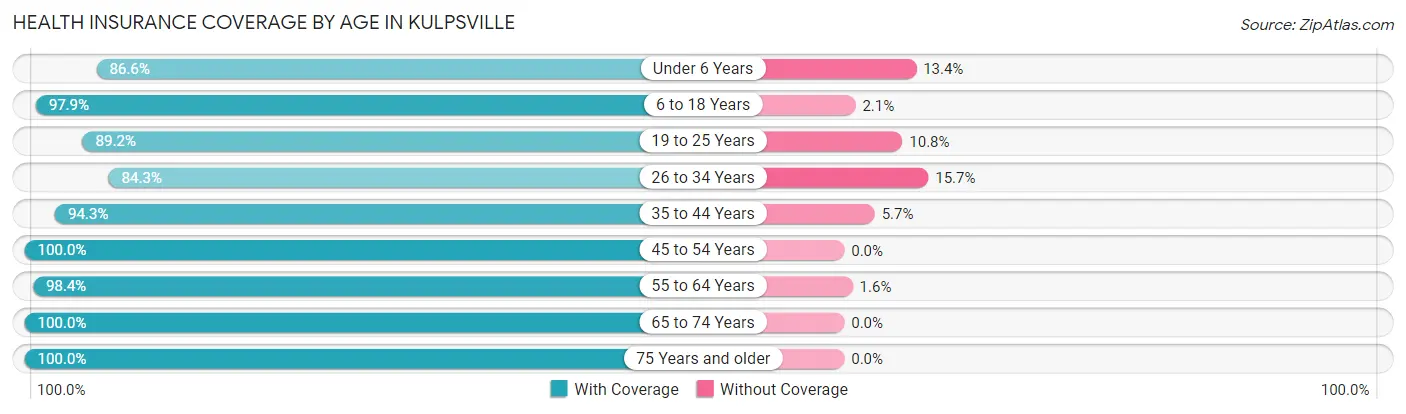
| Age Bracket | With Coverage | Without Coverage |
| Under 6 Years | 639 (86.6%) | 99 (13.4%) |
| 6 to 18 Years | 1,361 (97.9%) | 29 (2.1%) |
| 19 to 25 Years | 527 (89.2%) | 64 (10.8%) |
| 26 to 34 Years | 969 (84.3%) | 180 (15.7%) |
| 35 to 44 Years | 1,047 (94.3%) | 63 (5.7%) |
| 45 to 54 Years | 879 (100.0%) | 0 (0.0%) |
| 55 to 64 Years | 949 (98.4%) | 15 (1.6%) |
| 65 to 74 Years | 948 (100.0%) | 0 (0.0%) |
| 75 Years and older | 1,030 (100.0%) | 0 (0.0%) |
| Total | 8,349 (94.9%) | 450 (5.1%) |
Health Insurance Coverage by Citizenship Status in Kulpsville
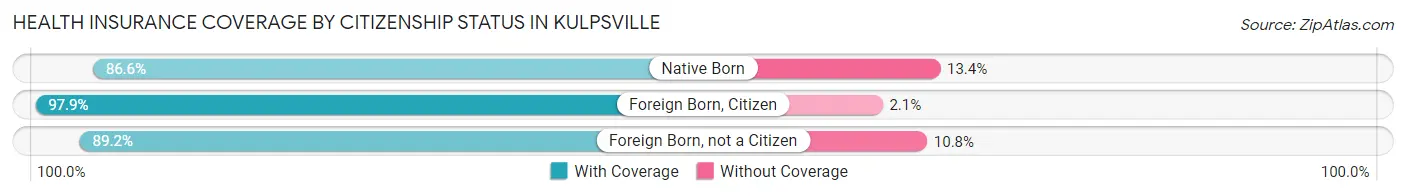
| Citizenship Status | With Coverage | Without Coverage |
| Native Born | 639 (86.6%) | 99 (13.4%) |
| Foreign Born, Citizen | 1,361 (97.9%) | 29 (2.1%) |
| Foreign Born, not a Citizen | 527 (89.2%) | 64 (10.8%) |
Health Insurance Coverage by Household Income in Kulpsville
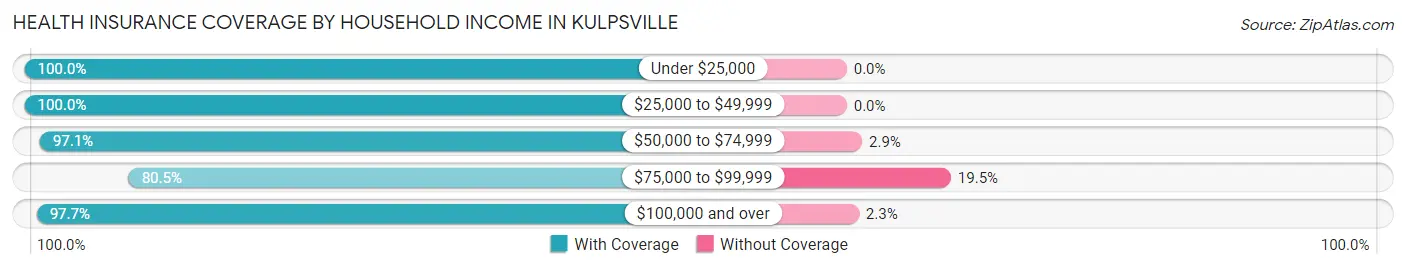
| Household Income | With Coverage | Without Coverage |
| Under $25,000 | 406 (100.0%) | 0 (0.0%) |
| $25,000 to $49,999 | 681 (100.0%) | 0 (0.0%) |
| $50,000 to $74,999 | 1,489 (97.1%) | 44 (2.9%) |
| $75,000 to $99,999 | 1,242 (80.5%) | 301 (19.5%) |
| $100,000 and over | 4,530 (97.7%) | 105 (2.3%) |
Public vs Private Health Insurance Coverage by Age in Kulpsville
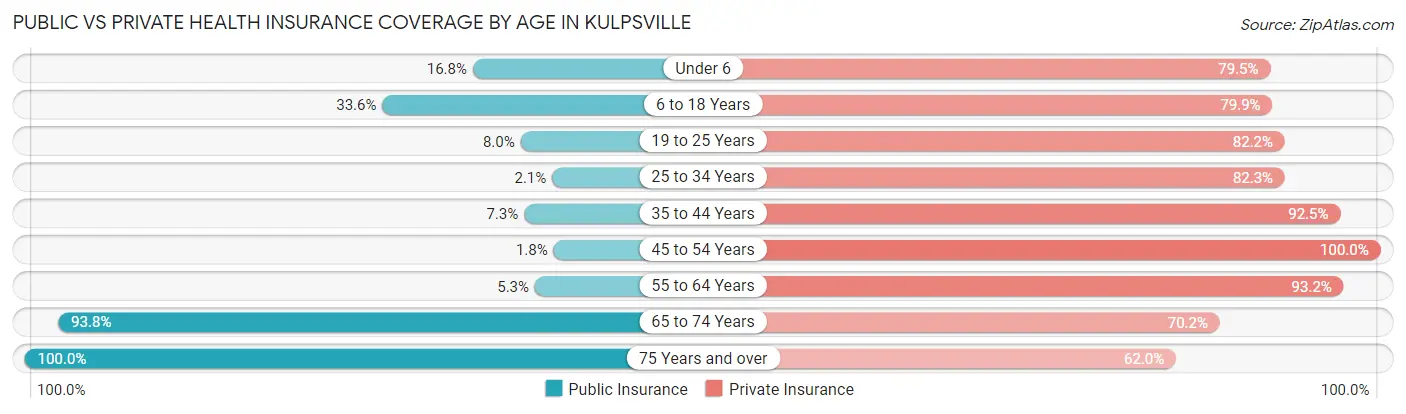
| Age Bracket | Public Insurance | Private Insurance |
| Under 6 | 124 (16.8%) | 587 (79.5%) |
| 6 to 18 Years | 467 (33.6%) | 1,111 (79.9%) |
| 19 to 25 Years | 47 (8.0%) | 486 (82.2%) |
| 25 to 34 Years | 24 (2.1%) | 945 (82.3%) |
| 35 to 44 Years | 81 (7.3%) | 1,027 (92.5%) |
| 45 to 54 Years | 16 (1.8%) | 879 (100.0%) |
| 55 to 64 Years | 51 (5.3%) | 898 (93.1%) |
| 65 to 74 Years | 889 (93.8%) | 665 (70.2%) |
| 75 Years and over | 1,030 (100.0%) | 639 (62.0%) |
| Total | 2,729 (31.0%) | 7,237 (82.3%) |
Disability Status by Sex by Age in Kulpsville
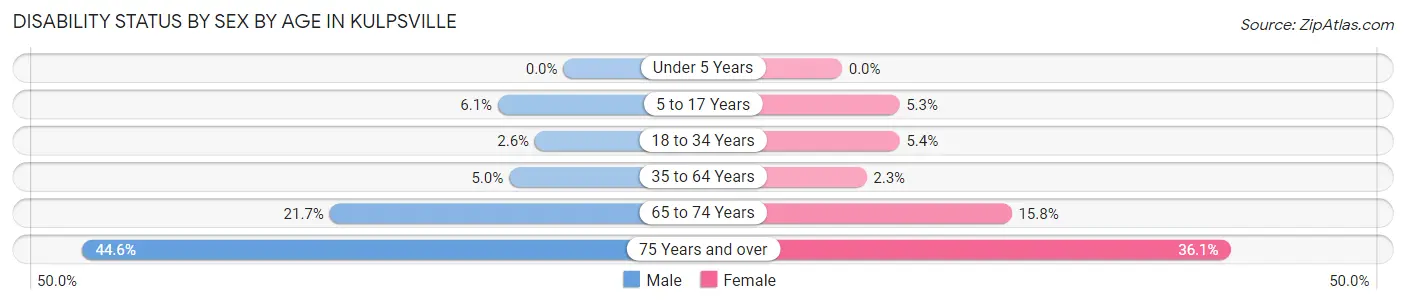
| Age Bracket | Male | Female |
| Under 5 Years | 0 (0.0%) | 0 (0.0%) |
| 5 to 17 Years | 48 (6.1%) | 33 (5.3%) |
| 18 to 34 Years | 22 (2.6%) | 54 (5.3%) |
| 35 to 64 Years | 67 (5.0%) | 37 (2.3%) |
| 65 to 74 Years | 72 (21.7%) | 97 (15.8%) |
| 75 Years and over | 170 (44.6%) | 234 (36.1%) |
Disability Class by Sex by Age in Kulpsville
Disability Class: Hearing Difficulty
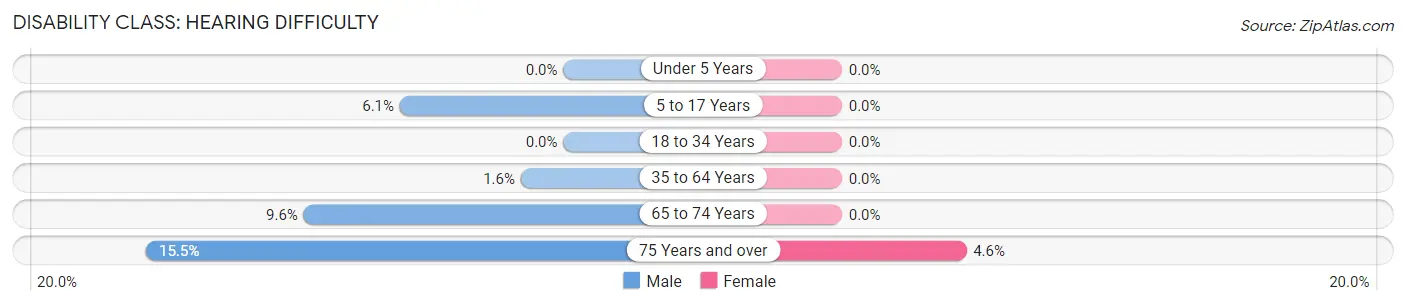
| Age Bracket | Male | Female |
| Under 5 Years | 0 (0.0%) | 0 (0.0%) |
| 5 to 17 Years | 48 (6.1%) | 0 (0.0%) |
| 18 to 34 Years | 0 (0.0%) | 0 (0.0%) |
| 35 to 64 Years | 21 (1.6%) | 0 (0.0%) |
| 65 to 74 Years | 32 (9.6%) | 0 (0.0%) |
| 75 Years and over | 59 (15.5%) | 30 (4.6%) |
Disability Class: Vision Difficulty
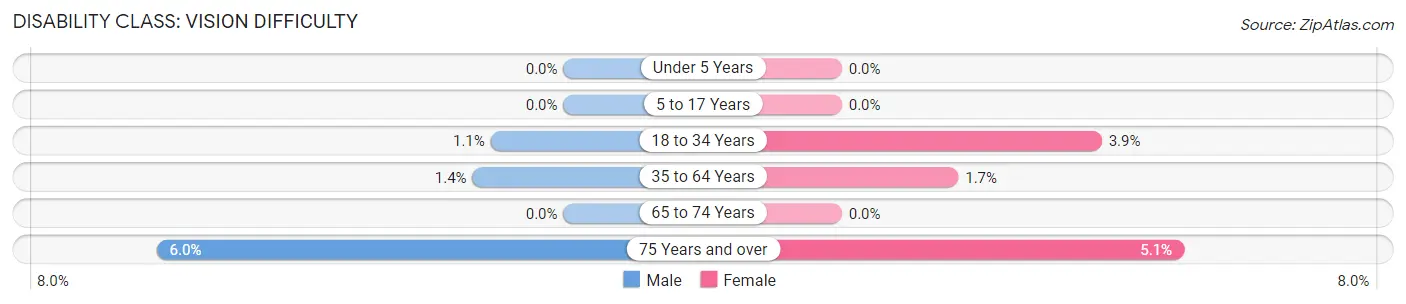
| Age Bracket | Male | Female |
| Under 5 Years | 0 (0.0%) | 0 (0.0%) |
| 5 to 17 Years | 0 (0.0%) | 0 (0.0%) |
| 18 to 34 Years | 9 (1.1%) | 39 (3.9%) |
| 35 to 64 Years | 18 (1.3%) | 28 (1.7%) |
| 65 to 74 Years | 0 (0.0%) | 0 (0.0%) |
| 75 Years and over | 23 (6.0%) | 33 (5.1%) |
Disability Class: Cognitive Difficulty
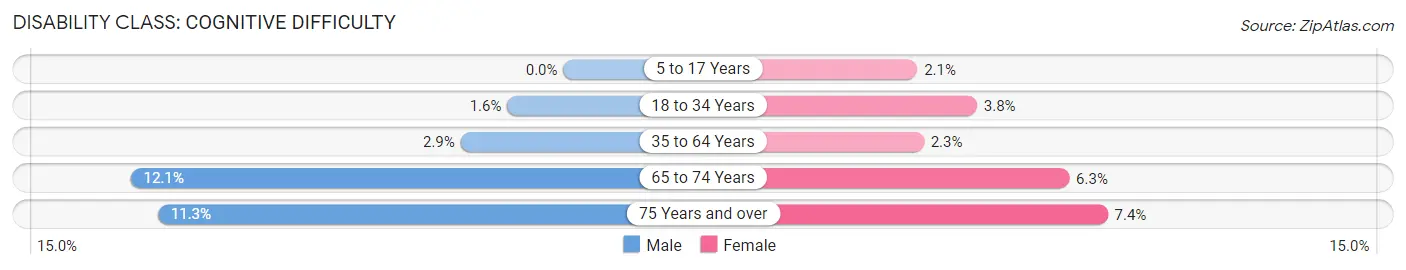
| Age Bracket | Male | Female |
| 5 to 17 Years | 0 (0.0%) | 13 (2.1%) |
| 18 to 34 Years | 13 (1.6%) | 38 (3.8%) |
| 35 to 64 Years | 38 (2.9%) | 37 (2.3%) |
| 65 to 74 Years | 40 (12.0%) | 39 (6.3%) |
| 75 Years and over | 43 (11.3%) | 48 (7.4%) |
Disability Class: Ambulatory Difficulty
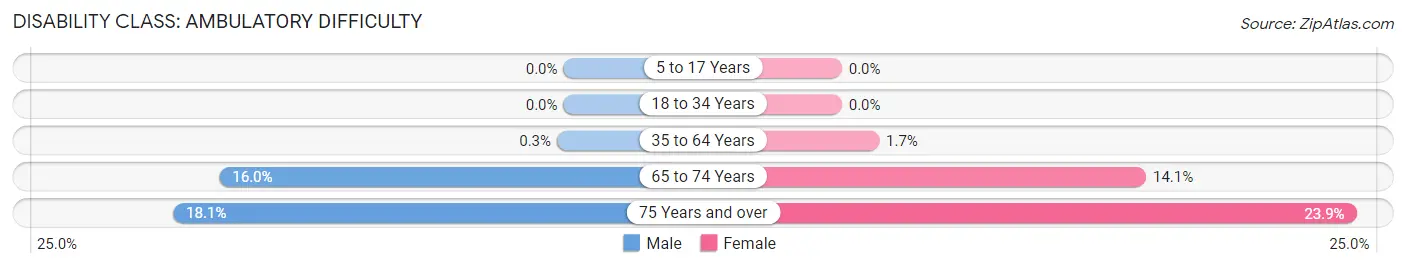
| Age Bracket | Male | Female |
| 5 to 17 Years | 0 (0.0%) | 0 (0.0%) |
| 18 to 34 Years | 0 (0.0%) | 0 (0.0%) |
| 35 to 64 Years | 4 (0.3%) | 28 (1.7%) |
| 65 to 74 Years | 53 (16.0%) | 87 (14.1%) |
| 75 Years and over | 69 (18.1%) | 155 (23.9%) |
Disability Class: Self-Care Difficulty
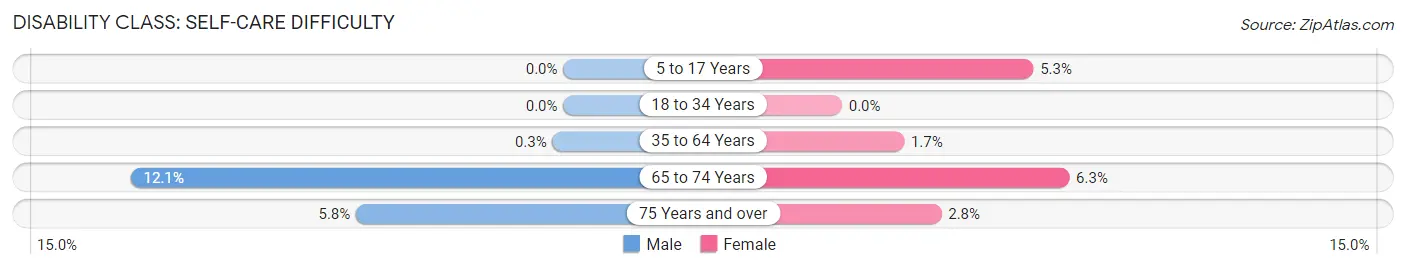
| Age Bracket | Male | Female |
| 5 to 17 Years | 0 (0.0%) | 33 (5.3%) |
| 18 to 34 Years | 0 (0.0%) | 0 (0.0%) |
| 35 to 64 Years | 4 (0.3%) | 28 (1.7%) |
| 65 to 74 Years | 40 (12.0%) | 39 (6.3%) |
| 75 Years and over | 22 (5.8%) | 18 (2.8%) |
Technology Access in Kulpsville
Computing Device Access in Kulpsville
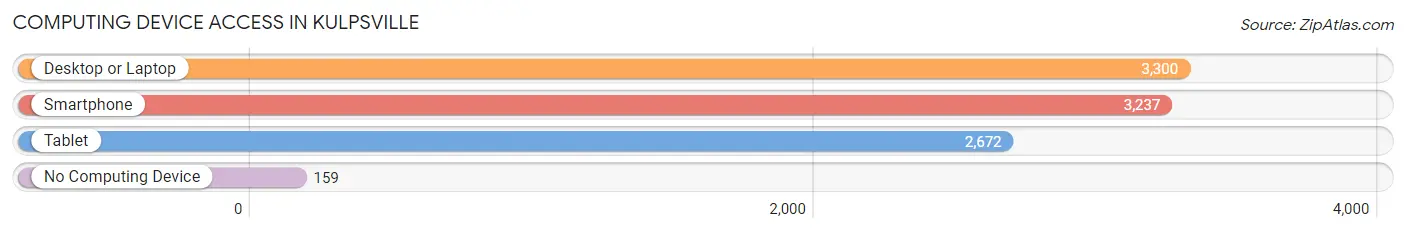
| Device Type | # Households | % Households |
| Desktop or Laptop | 3,300 | 88.1% |
| Smartphone | 3,237 | 86.4% |
| Tablet | 2,672 | 71.3% |
| No Computing Device | 159 | 4.2% |
| Total | 3,746 | 100.0% |
Internet Access in Kulpsville
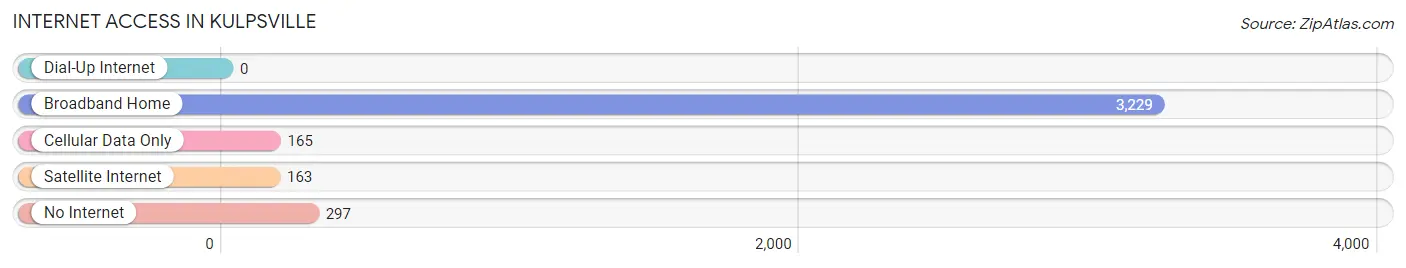
| Internet Type | # Households | % Households |
| Dial-Up Internet | 0 | 0.0% |
| Broadband Home | 3,229 | 86.2% |
| Cellular Data Only | 165 | 4.4% |
| Satellite Internet | 163 | 4.3% |
| No Internet | 297 | 7.9% |
| Total | 3,746 | 100.0% |
Kulpsville Summary
Kulpsville is a small unincorporated community located in Montgomery County, Pennsylvania. It is situated in the Upper Salford Township, approximately 25 miles northwest of Philadelphia. The population of Kulpsville was estimated to be 2,845 in the 2010 census.
History
Kulpsville was founded in 1737 by John Kulp, a German immigrant. The area was originally known as Kulpstown, but the name was changed to Kulpsville in 1876. The town was originally a farming community, but it has since become a bedroom community for Philadelphia and its surrounding suburbs.
Geography
Kulpsville is located at 40°14'N 75°20'W. It is situated in the Upper Salford Township, approximately 25 miles northwest of Philadelphia. The town is bordered by the townships of Lower Salford, Towamencin, and Upper Hanover. The total area of Kulpsville is 1.3 square miles, with a population density of 2,093 people per square mile.
Economy
Kulpsville is primarily a residential community, with most of its residents commuting to nearby cities for work. The town does have a few small businesses, including a few restaurants, a gas station, and a few convenience stores. The town is also home to a few industrial parks, which provide employment opportunities for local residents.
Demographics
As of the 2010 census, the population of Kulpsville was 2,845. The racial makeup of the town was 94.3% White, 1.7% African American, 0.3% Native American, 1.2% Asian, 0.1% Pacific Islander, 1.2% from other races, and 1.4% from two or more races. Hispanic or Latino of any race were 3.2% of the population.
The median income for a household in Kulpsville was $68,958, and the median income for a family was $76,958. The per capita income for the town was $30,958. About 4.2% of families and 5.3% of the population were below the poverty line, including 6.3% of those under age 18 and 4.2% of those age 65 or over.
Kulpsville is a small, quiet community with a strong sense of community. The town is home to a variety of people from different backgrounds and cultures, and it is a great place to live and raise a family.
Common Questions
What is Per Capita Income in Kulpsville?
Per Capita income in Kulpsville is $48,759.
What is the Median Family Income in Kulpsville?
Median Family Income in Kulpsville is $104,352.
What is the Median Household income in Kulpsville?
Median Household Income in Kulpsville is $84,971.
What is Income or Wage Gap in Kulpsville?
Income or Wage Gap in Kulpsville is 5.1%.
Women in Kulpsville earn 94.9 cents for every dollar earned by a man.
What is Family Income Deficit in Kulpsville?
Family Income Deficit in Kulpsville is $2,477.
Families that are below poverty line in Kulpsville earn $2,477 less on average than the poverty threshold level.
What is Inequality or Gini Index in Kulpsville?
Inequality or Gini Index in Kulpsville is 0.40.
What is the Total Population of Kulpsville?
Total Population of Kulpsville is 8,876.
What is the Total Male Population of Kulpsville?
Total Male Population of Kulpsville is 4,074.
What is the Total Female Population of Kulpsville?
Total Female Population of Kulpsville is 4,802.
What is the Ratio of Males per 100 Females in Kulpsville?
There are 84.84 Males per 100 Females in Kulpsville.
What is the Ratio of Females per 100 Males in Kulpsville?
There are 117.87 Females per 100 Males in Kulpsville.
What is the Median Population Age in Kulpsville?
Median Population Age in Kulpsville is 40.2 Years.
What is the Average Family Size in Kulpsville
Average Family Size in Kulpsville is 3.0 People.
What is the Average Household Size in Kulpsville
Average Household Size in Kulpsville is 2.4 People.
How Large is the Labor Force in Kulpsville?
There are 4,598 People in the Labor Forcein in Kulpsville.
What is the Percentage of People in the Labor Force in Kulpsville?
64.7% of People are in the Labor Force in Kulpsville.
What is the Unemployment Rate in Kulpsville?
Unemployment Rate in Kulpsville is 2.8%.