Whitfield, PA Map & Demographics
Whitfield Map
Whitfield Overview
$54,428
PER CAPITA INCOME
$136,004
AVG FAMILY INCOME
$123,750
AVG HOUSEHOLD INCOME
16.1%
WAGE / INCOME GAP [ % ]
83.9¢/ $1
WAGE / INCOME GAP [ $ ]
0.37
INEQUALITY / GINI INDEX
5,269
TOTAL POPULATION
2,437
MALE POPULATION
2,832
FEMALE POPULATION
86.05
MALES / 100 FEMALES
116.21
FEMALES / 100 MALES
46.6
MEDIAN AGE
3.2
AVG FAMILY SIZE
2.7
AVG HOUSEHOLD SIZE
2,978
LABOR FORCE [ PEOPLE ]
70.2%
PERCENT IN LABOR FORCE
2.0%
UNEMPLOYMENT RATE
Income in Whitfield
Income Overview in Whitfield
Per Capita Income in Whitfield is $54,428, while median incomes of families and households are $136,004 and $123,750 respectively.
| Characteristic | Number | Measure |
| Per Capita Income | 5,269 | $54,428 |
| Median Family Income | 1,437 | $136,004 |
| Mean Family Income | 1,437 | $163,571 |
| Median Household Income | 1,935 | $123,750 |
| Mean Household Income | 1,935 | $144,029 |
| Income Deficit | 1,437 | $0 |
| Wage / Income Gap (%) | 5,269 | 16.15% |
| Wage / Income Gap ($) | 5,269 | 83.85¢ per $1 |
| Gini / Inequality Index | 5,269 | 0.37 |
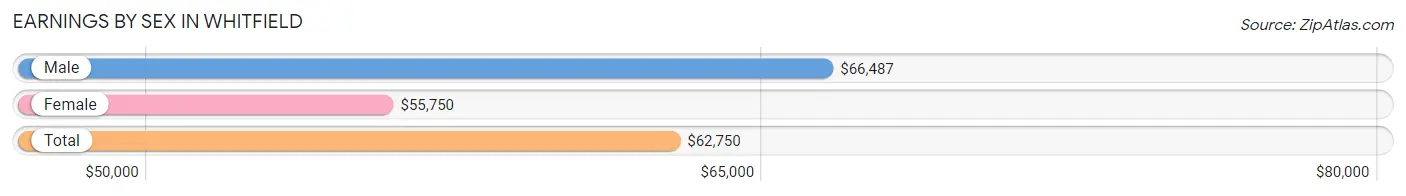
Earnings by Sex in Whitfield
Average Earnings in Whitfield are $62,750, $66,487 for men and $55,750 for women, a difference of 16.2%.
| Sex | Number | Average Earnings |
| Male | 1,503 (48.4%) | $66,487 |
| Female | 1,601 (51.6%) | $55,750 |
| Total | 3,104 (100.0%) | $62,750 |
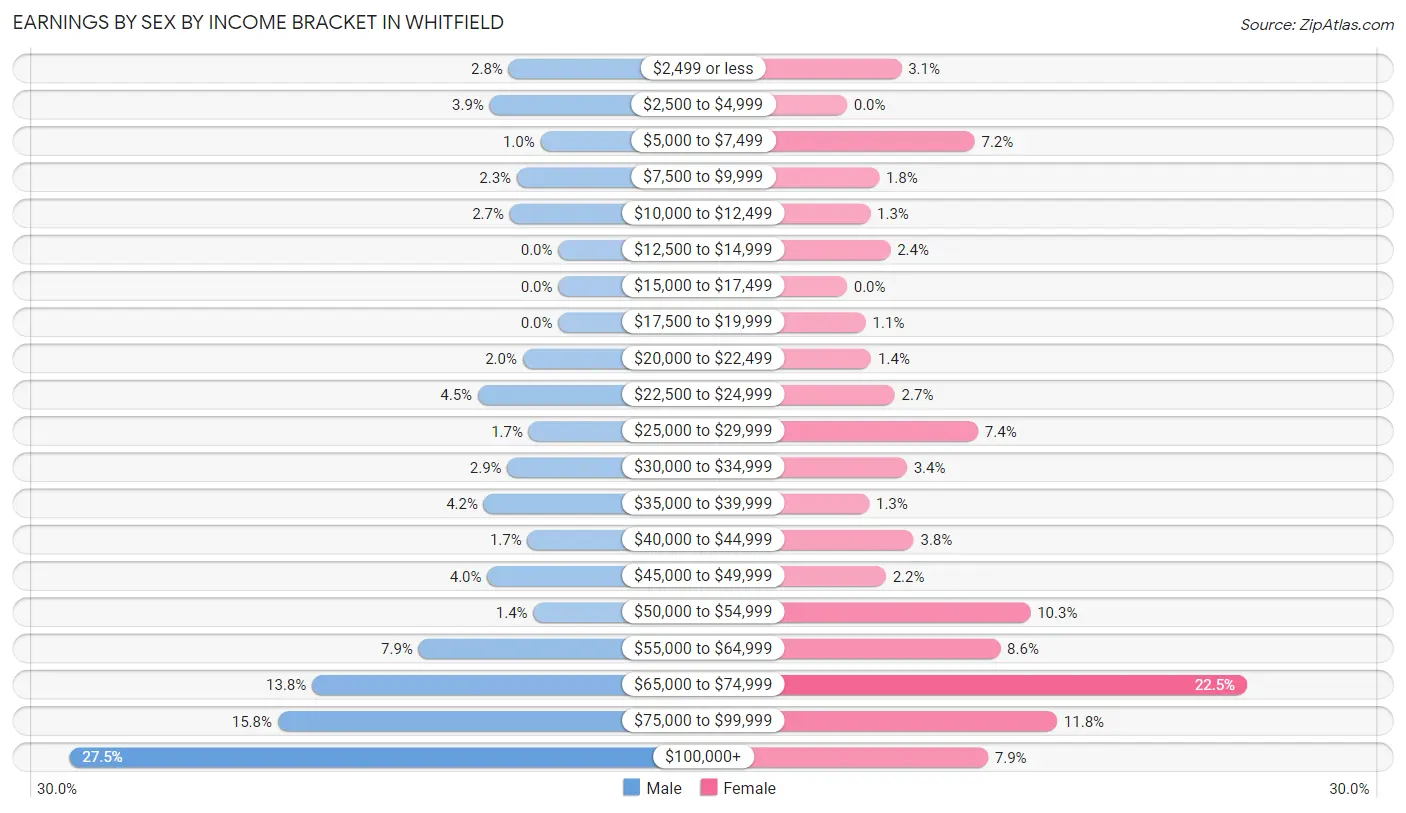
Earnings by Sex by Income Bracket in Whitfield
The most common earnings brackets in Whitfield are $100,000+ for men (413 | 27.5%) and $65,000 to $74,999 for women (360 | 22.5%).
| Income | Male | Female |
| $2,499 or less | 42 (2.8%) | 49 (3.1%) |
| $2,500 to $4,999 | 58 (3.9%) | 0 (0.0%) |
| $5,000 to $7,499 | 15 (1.0%) | 115 (7.2%) |
| $7,500 to $9,999 | 35 (2.3%) | 29 (1.8%) |
| $10,000 to $12,499 | 41 (2.7%) | 21 (1.3%) |
| $12,500 to $14,999 | 0 (0.0%) | 39 (2.4%) |
| $15,000 to $17,499 | 0 (0.0%) | 0 (0.0%) |
| $17,500 to $19,999 | 0 (0.0%) | 17 (1.1%) |
| $20,000 to $22,499 | 30 (2.0%) | 22 (1.4%) |
| $22,500 to $24,999 | 68 (4.5%) | 43 (2.7%) |
| $25,000 to $29,999 | 25 (1.7%) | 118 (7.4%) |
| $30,000 to $34,999 | 43 (2.9%) | 54 (3.4%) |
| $35,000 to $39,999 | 63 (4.2%) | 20 (1.3%) |
| $40,000 to $44,999 | 26 (1.7%) | 60 (3.7%) |
| $45,000 to $49,999 | 60 (4.0%) | 35 (2.2%) |
| $50,000 to $54,999 | 21 (1.4%) | 165 (10.3%) |
| $55,000 to $64,999 | 118 (7.9%) | 138 (8.6%) |
| $65,000 to $74,999 | 208 (13.8%) | 360 (22.5%) |
| $75,000 to $99,999 | 237 (15.8%) | 189 (11.8%) |
| $100,000+ | 413 (27.5%) | 127 (7.9%) |
| Total | 1,503 (100.0%) | 1,601 (100.0%) |
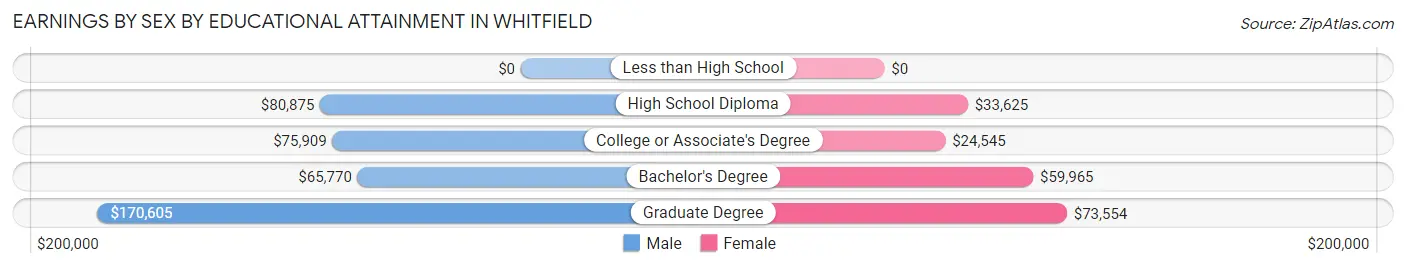
Earnings by Sex by Educational Attainment in Whitfield
Average earnings in Whitfield are $70,250 for men and $57,639 for women, a difference of 17.9%. Men with an educational attainment of graduate degree enjoy the highest average annual earnings of $170,605, while those with bachelor's degree education earn the least with $65,770. Women with an educational attainment of graduate degree earn the most with the average annual earnings of $73,554, while those with college or associate's degree education have the smallest earnings of $24,545.
| Educational Attainment | Male Income | Female Income |
| Less than High School | - | - |
| High School Diploma | $80,875 | $33,625 |
| College or Associate's Degree | $75,909 | $24,545 |
| Bachelor's Degree | $65,770 | $59,965 |
| Graduate Degree | $170,605 | $73,554 |
| Total | $70,250 | $57,639 |
Family Income in Whitfield
Family Income Brackets in Whitfield
According to the Whitfield family income data, there are 422 families falling into the $100,000 to $149,999 income range, which is the most common income bracket and makes up 29.4% of all families.
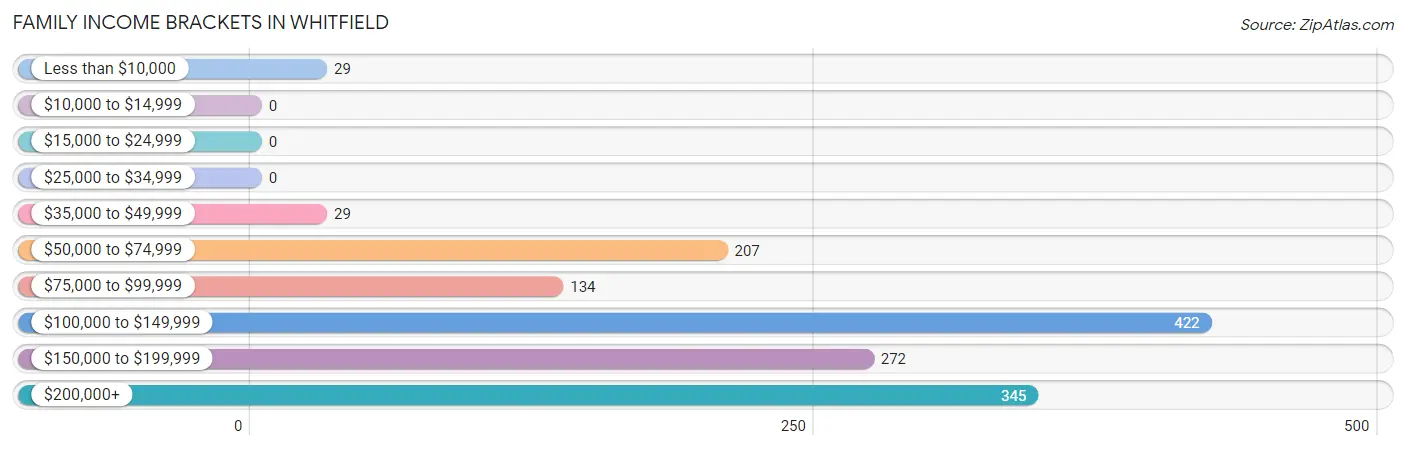
| Income Bracket | # Families | % Families |
| Less than $10,000 | 29 | 2.0% |
| $10,000 to $14,999 | 0 | 0.0% |
| $15,000 to $24,999 | 0 | 0.0% |
| $25,000 to $34,999 | 0 | 0.0% |
| $35,000 to $49,999 | 29 | 2.0% |
| $50,000 to $74,999 | 207 | 14.4% |
| $75,000 to $99,999 | 134 | 9.3% |
| $100,000 to $149,999 | 422 | 29.4% |
| $150,000 to $199,999 | 272 | 18.9% |
| $200,000+ | 345 | 24.0% |
Family Income by Famaliy Size in Whitfield
5-person families (175 | 12.2%) account for the highest median family income in Whitfield with $157,560 per family, while 2-person families (595 | 41.4%) have the highest median income of $62,562 per family member.
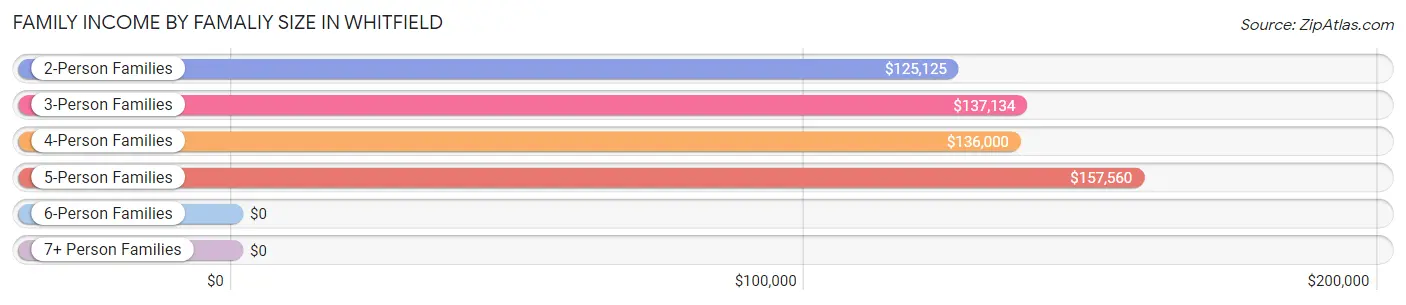
| Income Bracket | # Families | Median Income |
| 2-Person Families | 595 (41.4%) | $125,125 |
| 3-Person Families | 382 (26.6%) | $137,134 |
| 4-Person Families | 282 (19.6%) | $136,000 |
| 5-Person Families | 175 (12.2%) | $157,560 |
| 6-Person Families | 3 (0.2%) | $0 |
| 7+ Person Families | 0 (0.0%) | $0 |
| Total | 1,437 (100.0%) | $136,004 |
Family Income by Number of Earners in Whitfield
The median family income in Whitfield is $136,004, with families comprising 3+ earners (208) having the highest median family income of $180,089, while families with no earners (187) have the lowest median family income of $86,125, accounting for 14.5% and 13.0% of families, respectively.
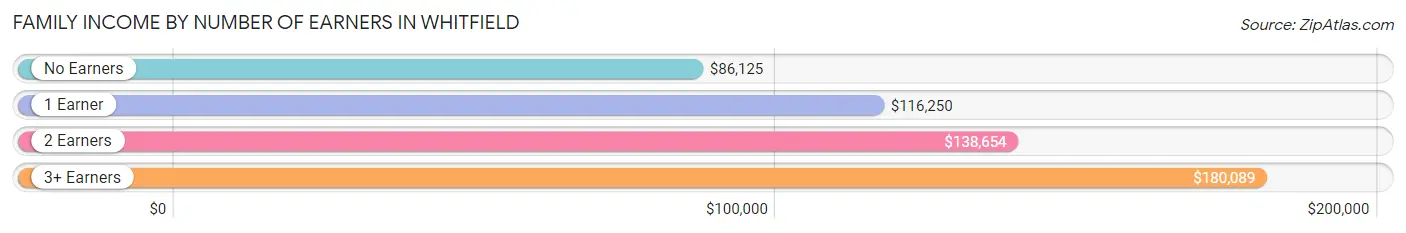
| Number of Earners | # Families | Median Income |
| No Earners | 187 (13.0%) | $86,125 |
| 1 Earner | 328 (22.8%) | $116,250 |
| 2 Earners | 714 (49.7%) | $138,654 |
| 3+ Earners | 208 (14.5%) | $180,089 |
| Total | 1,437 (100.0%) | $136,004 |
Household Income in Whitfield
Household Income Brackets in Whitfield
With 600 households falling in the category, the $100,000 to $149,999 income range is the most frequent in Whitfield, accounting for 31.0% of all households.
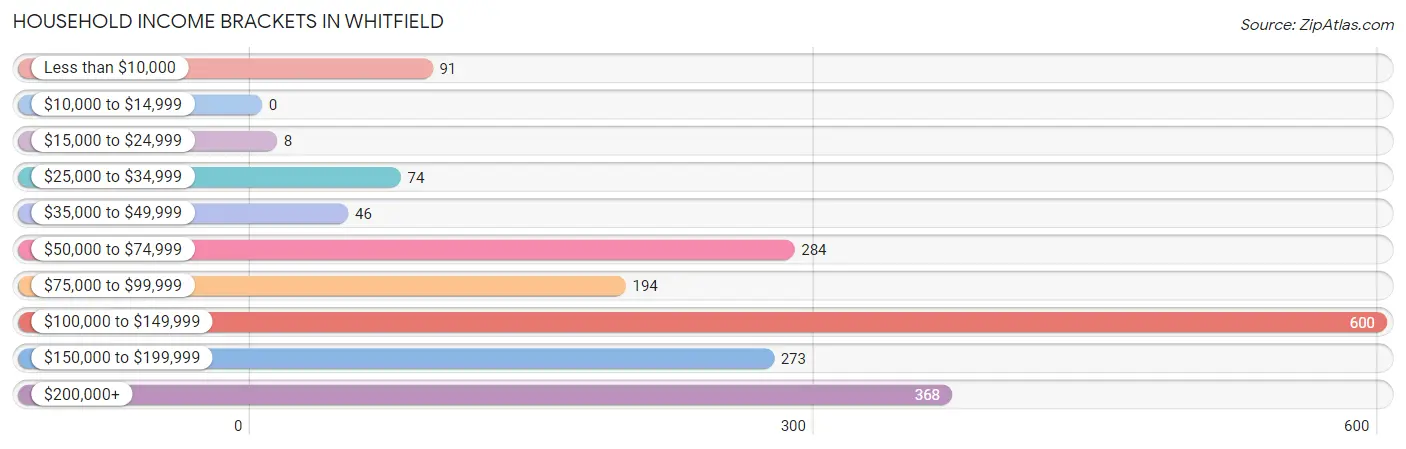
| Income Bracket | # Households | % Households |
| Less than $10,000 | 91 | 4.7% |
| $10,000 to $14,999 | 0 | 0.0% |
| $15,000 to $24,999 | 8 | 0.4% |
| $25,000 to $34,999 | 74 | 3.8% |
| $35,000 to $49,999 | 46 | 2.4% |
| $50,000 to $74,999 | 284 | 14.7% |
| $75,000 to $99,999 | 194 | 10.0% |
| $100,000 to $149,999 | 600 | 31.0% |
| $150,000 to $199,999 | 273 | 14.1% |
| $200,000+ | 368 | 19.0% |
Household Income by Householder Age in Whitfield
The median household income in Whitfield is $123,750, with the highest median household income of $137,708 found in the 45 to 64 years age bracket for the primary householder. A total of 1,012 households (52.3%) fall into this category. Meanwhile, the 15 to 24 years age bracket for the primary householder has the lowest median household income of $0, with 9 households (0.5%) in this group.
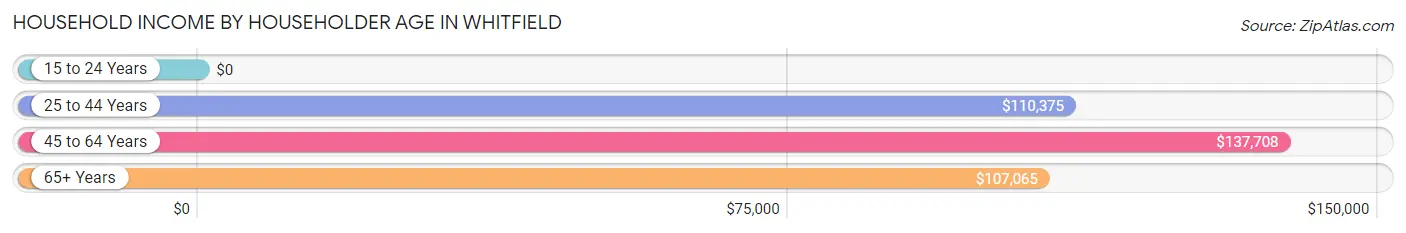
| Income Bracket | # Households | Median Income |
| 15 to 24 Years | 9 (0.5%) | $0 |
| 25 to 44 Years | 340 (17.6%) | $110,375 |
| 45 to 64 Years | 1,012 (52.3%) | $137,708 |
| 65+ Years | 574 (29.7%) | $107,065 |
| Total | 1,935 (100.0%) | $123,750 |
Poverty in Whitfield
Income Below Poverty by Sex and Age in Whitfield
With 2.0% poverty level for males and 4.9% for females among the residents of Whitfield, 12 to 14 year old males and 55 to 64 year old females are the most vulnerable to poverty, with 12 males (21.4%) and 41 females (13.9%) in their respective age groups living below the poverty level.
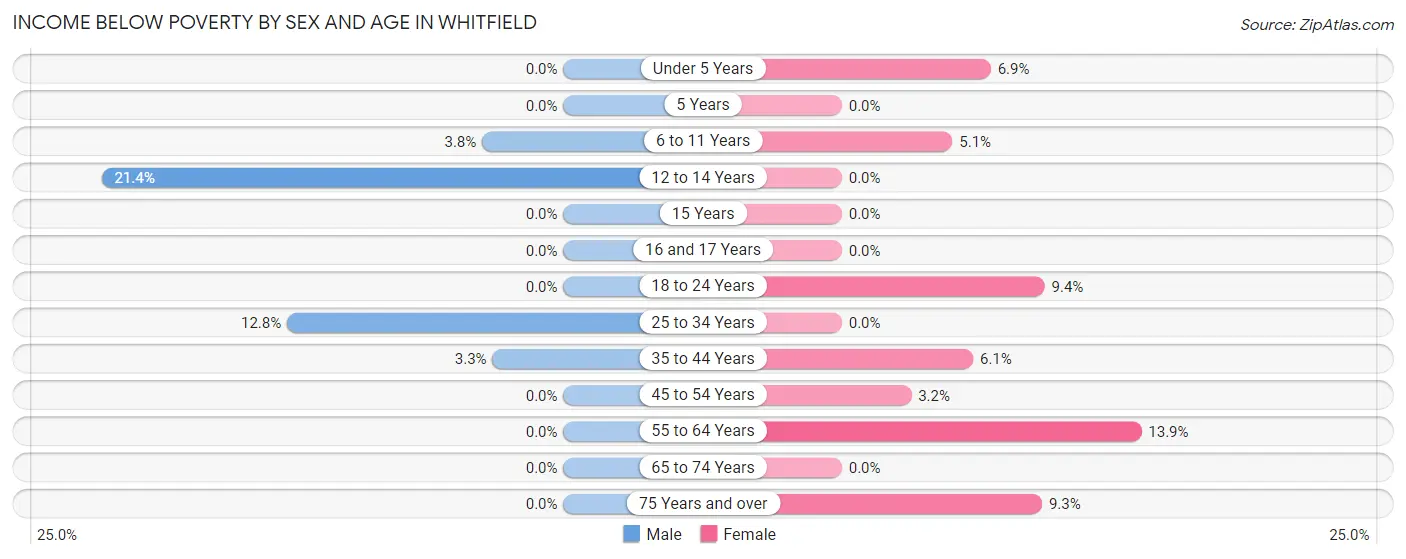
| Age Bracket | Male | Female |
| Under 5 Years | 0 (0.0%) | 13 (6.9%) |
| 5 Years | 0 (0.0%) | 0 (0.0%) |
| 6 to 11 Years | 11 (3.8%) | 8 (5.1%) |
| 12 to 14 Years | 12 (21.4%) | 0 (0.0%) |
| 15 Years | 0 (0.0%) | 0 (0.0%) |
| 16 and 17 Years | 0 (0.0%) | 0 (0.0%) |
| 18 to 24 Years | 0 (0.0%) | 8 (9.4%) |
| 25 to 34 Years | 15 (12.8%) | 0 (0.0%) |
| 35 to 44 Years | 10 (3.3%) | 21 (6.1%) |
| 45 to 54 Years | 0 (0.0%) | 21 (3.2%) |
| 55 to 64 Years | 0 (0.0%) | 41 (13.9%) |
| 65 to 74 Years | 0 (0.0%) | 0 (0.0%) |
| 75 Years and over | 0 (0.0%) | 26 (9.3%) |
| Total | 48 (2.0%) | 138 (4.9%) |
Income Above Poverty by Sex and Age in Whitfield
According to the poverty statistics in Whitfield, males aged under 5 years and females aged 5 years are the age groups that are most secure financially, with 100.0% of males and 100.0% of females in these age groups living above the poverty line.
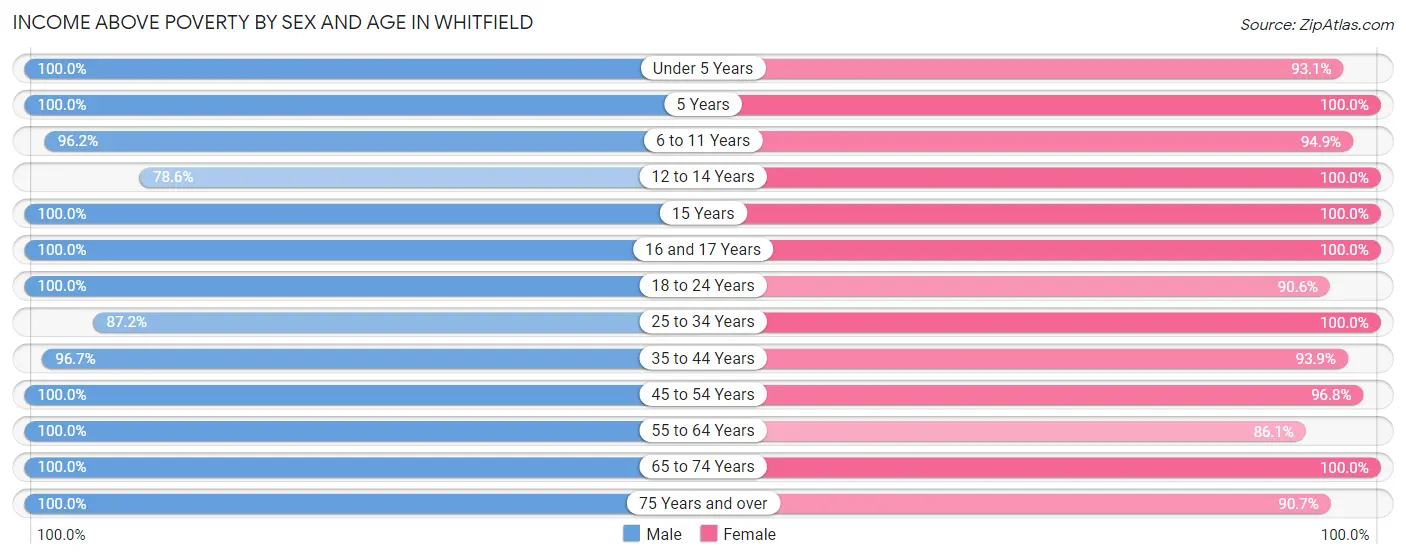
| Age Bracket | Male | Female |
| Under 5 Years | 76 (100.0%) | 175 (93.1%) |
| 5 Years | 36 (100.0%) | 42 (100.0%) |
| 6 to 11 Years | 281 (96.2%) | 148 (94.9%) |
| 12 to 14 Years | 44 (78.6%) | 108 (100.0%) |
| 15 Years | 29 (100.0%) | 44 (100.0%) |
| 16 and 17 Years | 77 (100.0%) | 8 (100.0%) |
| 18 to 24 Years | 205 (100.0%) | 77 (90.6%) |
| 25 to 34 Years | 102 (87.2%) | 296 (100.0%) |
| 35 to 44 Years | 294 (96.7%) | 324 (93.9%) |
| 45 to 54 Years | 490 (100.0%) | 631 (96.8%) |
| 55 to 64 Years | 301 (100.0%) | 254 (86.1%) |
| 65 to 74 Years | 291 (100.0%) | 333 (100.0%) |
| 75 Years and over | 163 (100.0%) | 254 (90.7%) |
| Total | 2,389 (98.0%) | 2,694 (95.1%) |
Income Below Poverty Among Married-Couple Families in Whitfield
The poverty statistics for married-couple families in Whitfield show that 0.9% or 10 of the total 1,147 families live below the poverty line. Families with 1 or 2 children have the highest poverty rate of 2.7%, comprising of 10 families. On the other hand, families with no children have the lowest poverty rate of 0.0%, which includes 0 families.
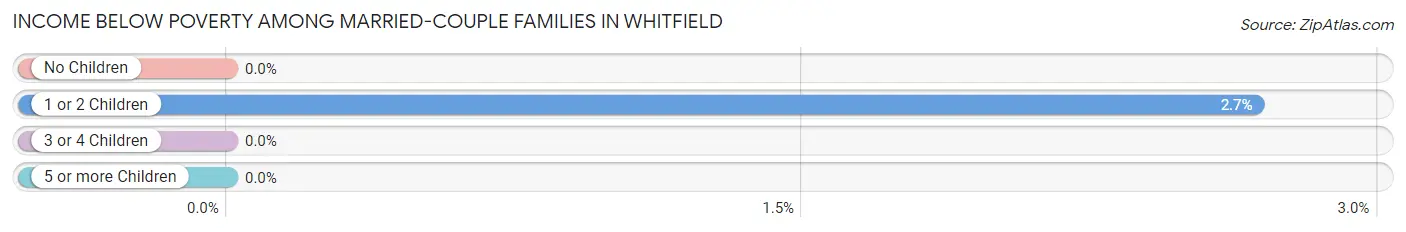
| Children | Above Poverty | Below Poverty |
| No Children | 655 (100.0%) | 0 (0.0%) |
| 1 or 2 Children | 363 (97.3%) | 10 (2.7%) |
| 3 or 4 Children | 119 (100.0%) | 0 (0.0%) |
| 5 or more Children | 0 (0.0%) | 0 (0.0%) |
| Total | 1,137 (99.1%) | 10 (0.9%) |
Income Below Poverty Among Single-Parent Households in Whitfield
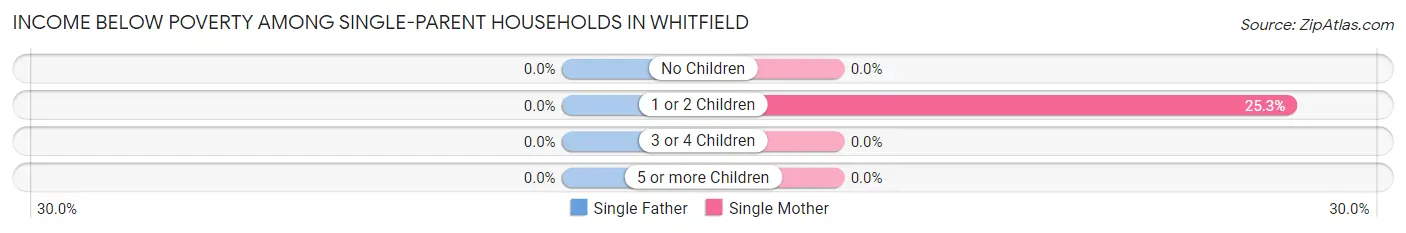
| Children | Single Father | Single Mother |
| No Children | 0 (0.0%) | 0 (0.0%) |
| 1 or 2 Children | 0 (0.0%) | 19 (25.3%) |
| 3 or 4 Children | 0 (0.0%) | 0 (0.0%) |
| 5 or more Children | 0 (0.0%) | 0 (0.0%) |
| Total | 0 (0.0%) | 19 (9.7%) |
Income Below Poverty Among Married-Couple vs Single-Parent Households in Whitfield
The poverty data for Whitfield shows that 10 of the married-couple family households (0.9%) and 19 of the single-parent households (6.6%) are living below the poverty level. Within the married-couple family households, those with 1 or 2 children have the highest poverty rate, with 10 households (2.7%) falling below the poverty line. Among the single-parent households, those with 1 or 2 children have the highest poverty rate, with 19 household (25.3%) living below poverty.
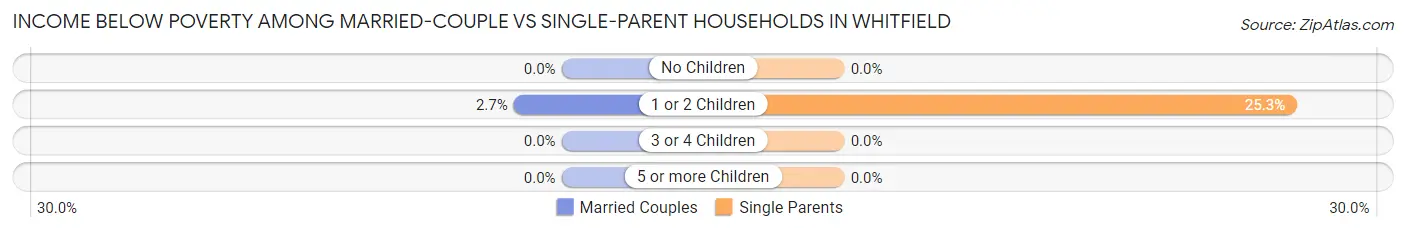
| Children | Married-Couple Families | Single-Parent Households |
| No Children | 0 (0.0%) | 0 (0.0%) |
| 1 or 2 Children | 10 (2.7%) | 19 (25.3%) |
| 3 or 4 Children | 0 (0.0%) | 0 (0.0%) |
| 5 or more Children | 0 (0.0%) | 0 (0.0%) |
| Total | 10 (0.9%) | 19 (6.6%) |
Race in Whitfield
The most populous races in Whitfield are White / Caucasian (4,078 | 77.4%), Two or more Races (702 | 13.3%), and Hispanic or Latino (670 | 12.7%).
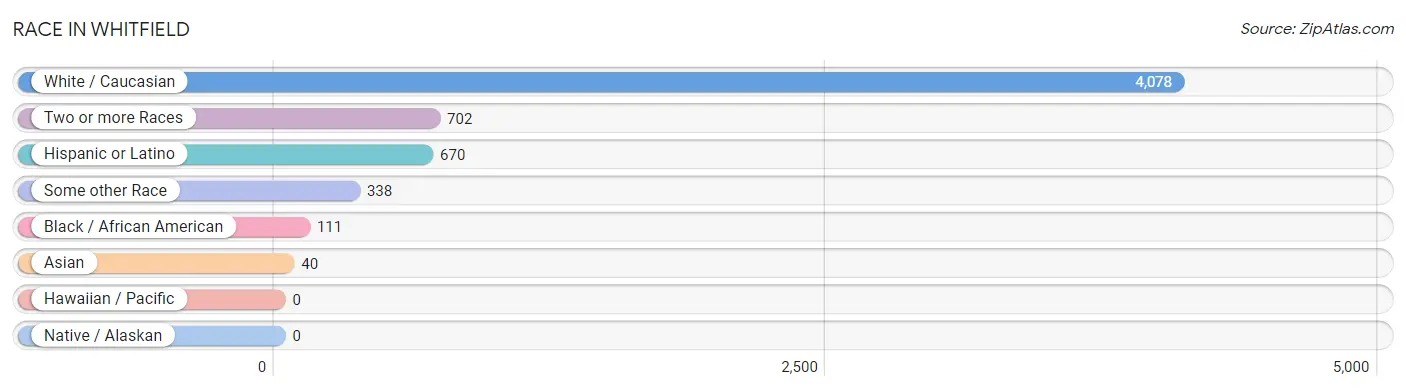
| Race | # Population | % Population |
| Asian | 40 | 0.8% |
| Black / African American | 111 | 2.1% |
| Hawaiian / Pacific | 0 | 0.0% |
| Hispanic or Latino | 670 | 12.7% |
| Native / Alaskan | 0 | 0.0% |
| White / Caucasian | 4,078 | 77.4% |
| Two or more Races | 702 | 13.3% |
| Some other Race | 338 | 6.4% |
| Total | 5,269 | 100.0% |
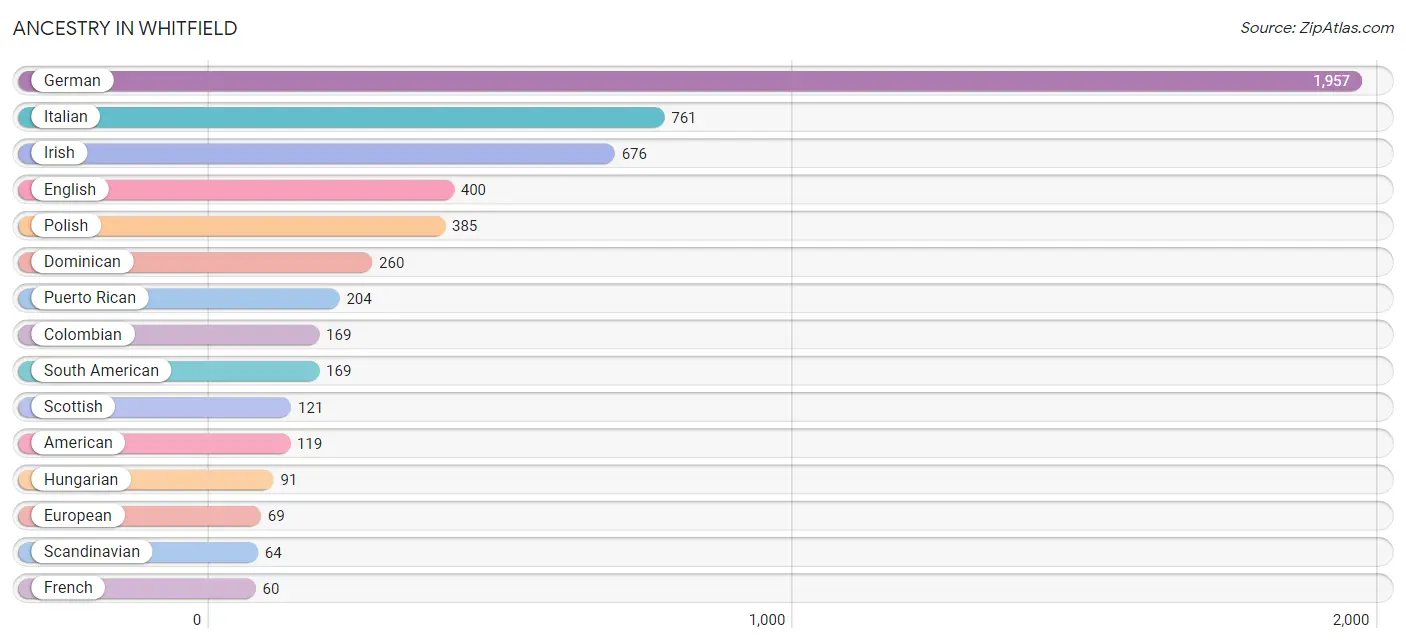
Ancestry in Whitfield
The most populous ancestries reported in Whitfield are German (1,957 | 37.1%), Italian (761 | 14.4%), Irish (676 | 12.8%), English (400 | 7.6%), and Polish (385 | 7.3%), together accounting for 79.3% of all Whitfield residents.
| Ancestry | # Population | % Population |
| African | 49 | 0.9% |
| American | 119 | 2.3% |
| Austrian | 10 | 0.2% |
| British | 40 | 0.8% |
| Burmese | 44 | 0.8% |
| Central American | 15 | 0.3% |
| Colombian | 169 | 3.2% |
| Cree | 35 | 0.7% |
| Cuban | 22 | 0.4% |
| Czech | 11 | 0.2% |
| Czechoslovakian | 17 | 0.3% |
| Danish | 29 | 0.5% |
| Dominican | 260 | 4.9% |
| Dutch | 37 | 0.7% |
| English | 400 | 7.6% |
| European | 69 | 1.3% |
| French | 60 | 1.1% |
| French Canadian | 21 | 0.4% |
| German | 1,957 | 37.1% |
| Greek | 23 | 0.4% |
| Hungarian | 91 | 1.7% |
| Indian (Asian) | 21 | 0.4% |
| Irish | 676 | 12.8% |
| Italian | 761 | 14.4% |
| Korean | 20 | 0.4% |
| Lithuanian | 42 | 0.8% |
| Pennsylvania German | 20 | 0.4% |
| Polish | 385 | 7.3% |
| Portuguese | 20 | 0.4% |
| Puerto Rican | 204 | 3.9% |
| Russian | 6 | 0.1% |
| Salvadoran | 15 | 0.3% |
| Scandinavian | 64 | 1.2% |
| Scotch-Irish | 39 | 0.7% |
| Scottish | 121 | 2.3% |
| Slovak | 25 | 0.5% |
| South American | 169 | 3.2% |
| Subsaharan African | 49 | 0.9% |
| Swedish | 28 | 0.5% |
| Swiss | 7 | 0.1% |
| Ukrainian | 54 | 1.0% |
| Welsh | 45 | 0.9% | View All 42 Rows |
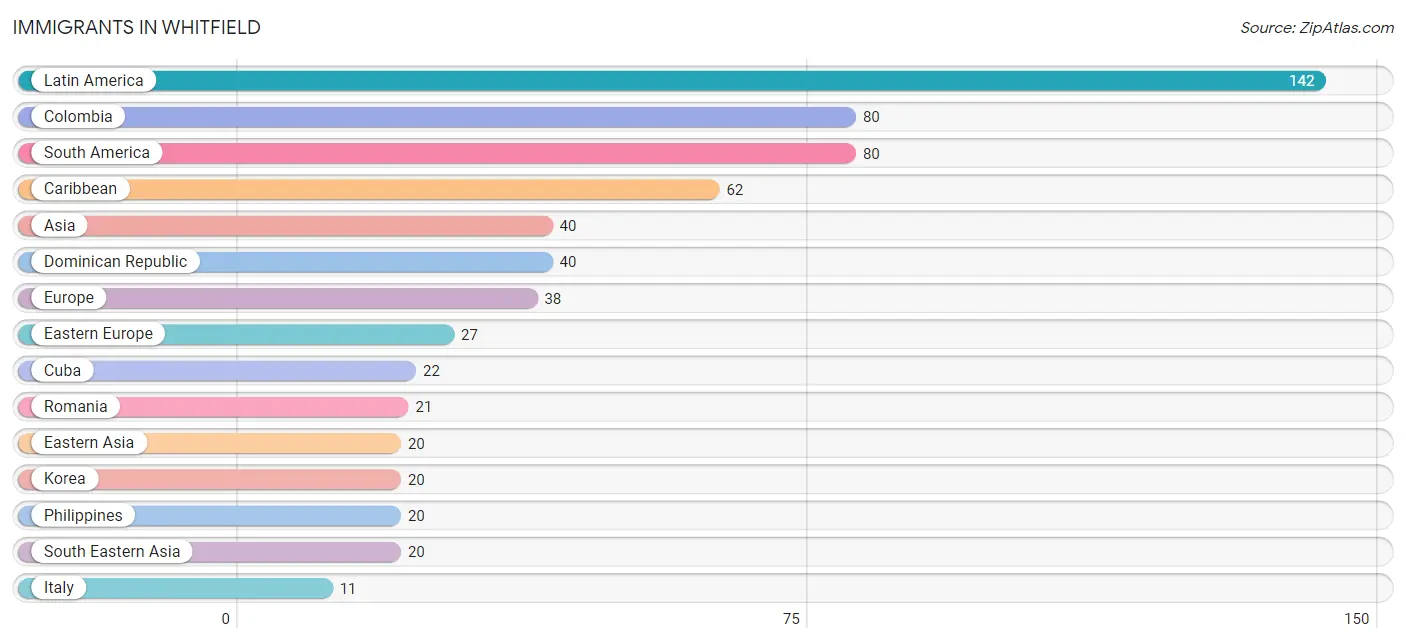
Immigrants in Whitfield
The most numerous immigrant groups reported in Whitfield came from Latin America (142 | 2.7%), Colombia (80 | 1.5%), South America (80 | 1.5%), Caribbean (62 | 1.2%), and Asia (40 | 0.8%), together accounting for 7.7% of all Whitfield residents.
| Immigration Origin | # Population | % Population |
| Asia | 40 | 0.8% |
| Caribbean | 62 | 1.2% |
| Colombia | 80 | 1.5% |
| Cuba | 22 | 0.4% |
| Dominican Republic | 40 | 0.8% |
| Eastern Asia | 20 | 0.4% |
| Eastern Europe | 27 | 0.5% |
| Europe | 38 | 0.7% |
| Italy | 11 | 0.2% |
| Korea | 20 | 0.4% |
| Latin America | 142 | 2.7% |
| Philippines | 20 | 0.4% |
| Poland | 6 | 0.1% |
| Romania | 21 | 0.4% |
| South America | 80 | 1.5% |
| South Eastern Asia | 20 | 0.4% |
| Southern Europe | 11 | 0.2% | View All 17 Rows |
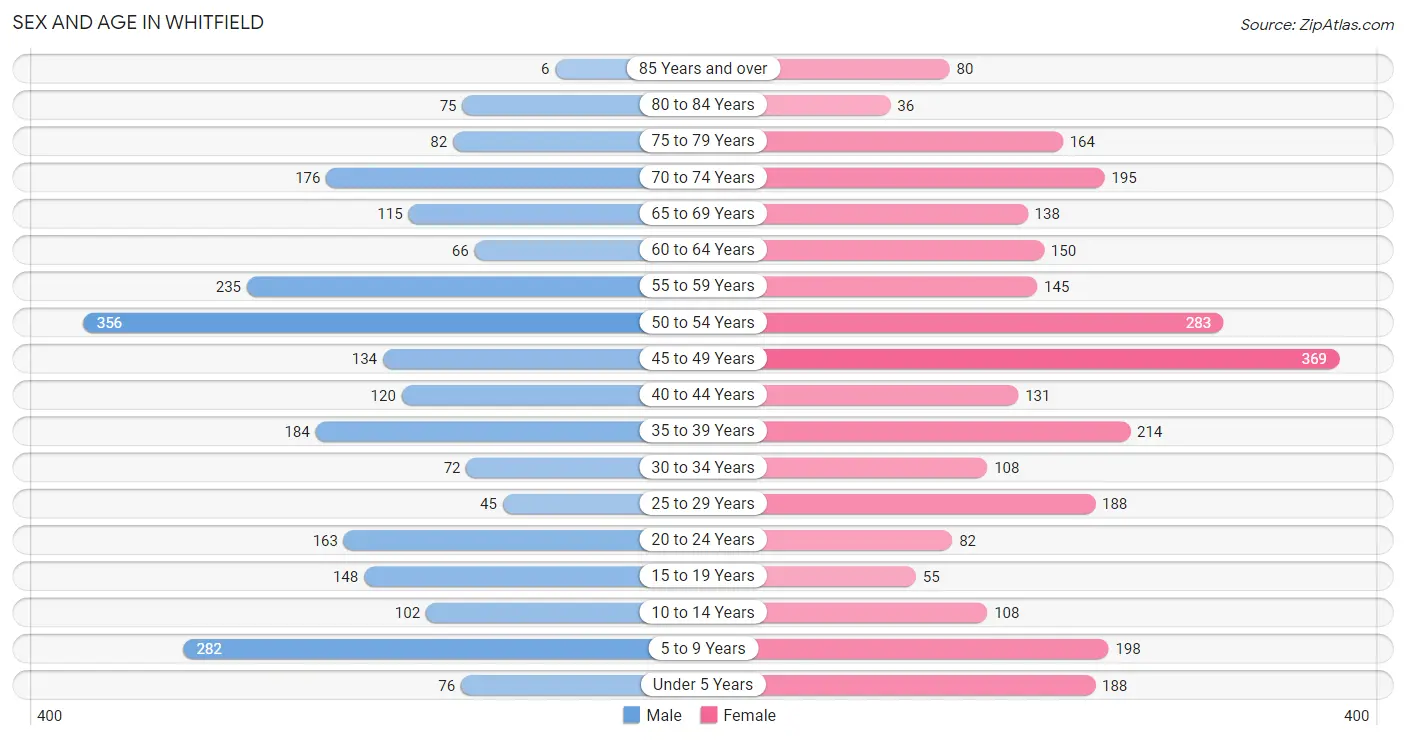
Sex and Age in Whitfield
Sex and Age in Whitfield
The most populous age groups in Whitfield are 50 to 54 Years (356 | 14.6%) for men and 45 to 49 Years (369 | 13.0%) for women.
| Age Bracket | Male | Female |
| Under 5 Years | 76 (3.1%) | 188 (6.6%) |
| 5 to 9 Years | 282 (11.6%) | 198 (7.0%) |
| 10 to 14 Years | 102 (4.2%) | 108 (3.8%) |
| 15 to 19 Years | 148 (6.1%) | 55 (1.9%) |
| 20 to 24 Years | 163 (6.7%) | 82 (2.9%) |
| 25 to 29 Years | 45 (1.8%) | 188 (6.6%) |
| 30 to 34 Years | 72 (2.9%) | 108 (3.8%) |
| 35 to 39 Years | 184 (7.5%) | 214 (7.6%) |
| 40 to 44 Years | 120 (4.9%) | 131 (4.6%) |
| 45 to 49 Years | 134 (5.5%) | 369 (13.0%) |
| 50 to 54 Years | 356 (14.6%) | 283 (10.0%) |
| 55 to 59 Years | 235 (9.6%) | 145 (5.1%) |
| 60 to 64 Years | 66 (2.7%) | 150 (5.3%) |
| 65 to 69 Years | 115 (4.7%) | 138 (4.9%) |
| 70 to 74 Years | 176 (7.2%) | 195 (6.9%) |
| 75 to 79 Years | 82 (3.4%) | 164 (5.8%) |
| 80 to 84 Years | 75 (3.1%) | 36 (1.3%) |
| 85 Years and over | 6 (0.3%) | 80 (2.8%) |
| Total | 2,437 (100.0%) | 2,832 (100.0%) |
Families and Households in Whitfield
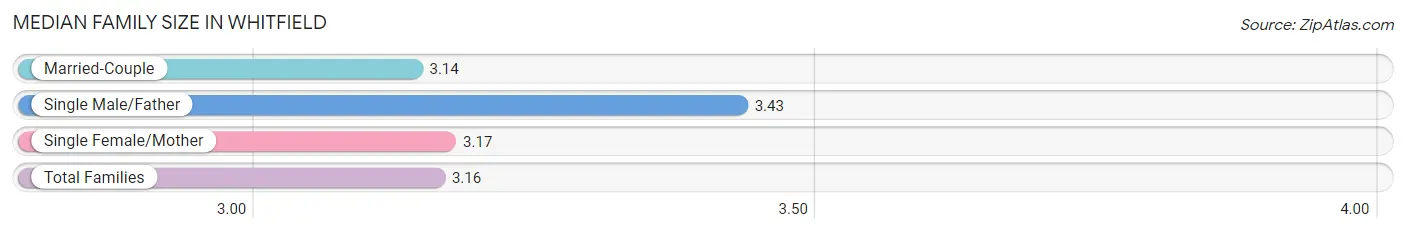
Median Family Size in Whitfield
The median family size in Whitfield is 3.16 persons per family, with single male/father families (95 | 6.6%) accounting for the largest median family size of 3.43 persons per family. On the other hand, married-couple families (1,147 | 79.8%) represent the smallest median family size with 3.14 persons per family.
| Family Type | # Families | Family Size |
| Married-Couple | 1,147 (79.8%) | 3.14 |
| Single Male/Father | 95 (6.6%) | 3.43 |
| Single Female/Mother | 195 (13.6%) | 3.17 |
| Total Families | 1,437 (100.0%) | 3.16 |
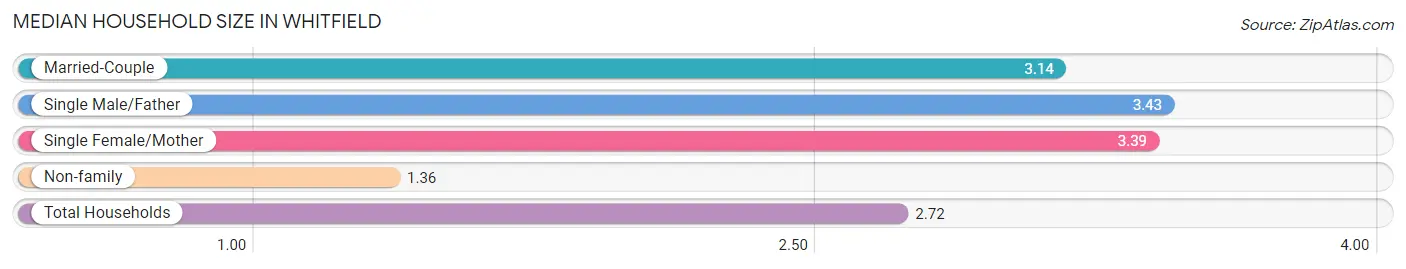
Median Household Size in Whitfield
The median household size in Whitfield is 2.72 persons per household, with single male/father households (95 | 4.9%) accounting for the largest median household size of 3.43 persons per household. non-family households (498 | 25.7%) represent the smallest median household size with 1.36 persons per household.
| Household Type | # Households | Household Size |
| Married-Couple | 1,147 (59.3%) | 3.14 |
| Single Male/Father | 95 (4.9%) | 3.43 |
| Single Female/Mother | 195 (10.1%) | 3.39 |
| Non-family | 498 (25.7%) | 1.36 |
| Total Households | 1,935 (100.0%) | 2.72 |
Household Size by Marriage Status in Whitfield
Out of a total of 1,935 households in Whitfield, 1,437 (74.3%) are family households, while 498 (25.7%) are nonfamily households. The most numerous type of family households are 2-person households, comprising 591, and the most common type of nonfamily households are 1-person households, comprising 344.
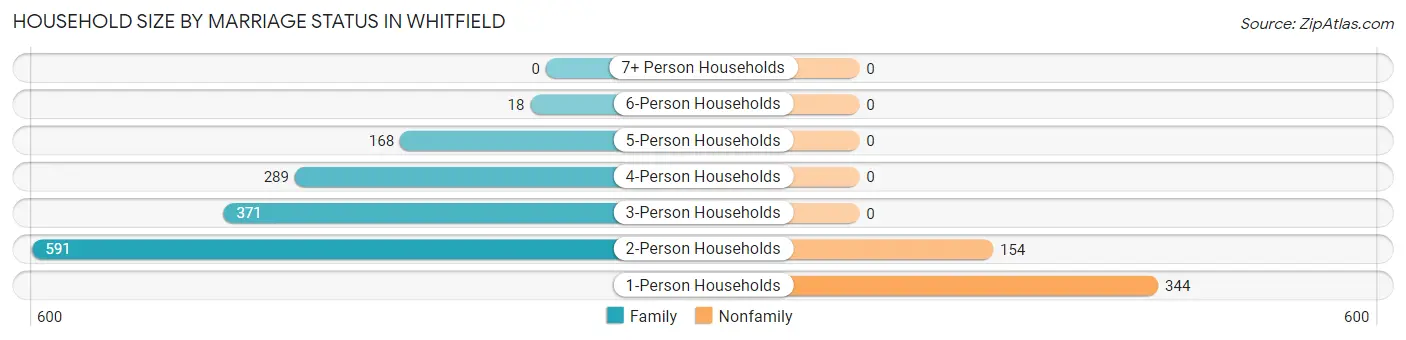
| Household Size | Family Households | Nonfamily Households |
| 1-Person Households | - | 344 (17.8%) |
| 2-Person Households | 591 (30.5%) | 154 (8.0%) |
| 3-Person Households | 371 (19.2%) | 0 (0.0%) |
| 4-Person Households | 289 (14.9%) | 0 (0.0%) |
| 5-Person Households | 168 (8.7%) | 0 (0.0%) |
| 6-Person Households | 18 (0.9%) | 0 (0.0%) |
| 7+ Person Households | 0 (0.0%) | 0 (0.0%) |
| Total | 1,437 (74.3%) | 498 (25.7%) |
Female Fertility in Whitfield
Fertility by Age in Whitfield
Average fertility rate in Whitfield is 33.0 births per 1,000 women. Women in the age bracket of 20 to 34 years have the highest fertility rate with 53.0 births per 1,000 women. Women in the age bracket of 35 to 50 years acount for 51.2% of all women with births.
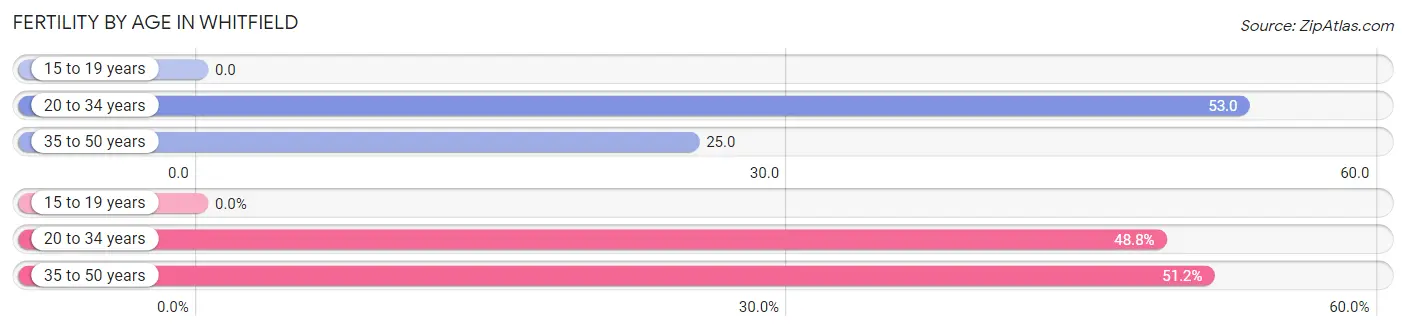
| Age Bracket | Women with Births | Births / 1,000 Women |
| 15 to 19 years | 0 (0.0%) | 0.0 |
| 20 to 34 years | 20 (48.8%) | 53.0 |
| 35 to 50 years | 21 (51.2%) | 25.0 |
| Total | 41 (100.0%) | 33.0 |
Fertility by Age by Marriage Status in Whitfield
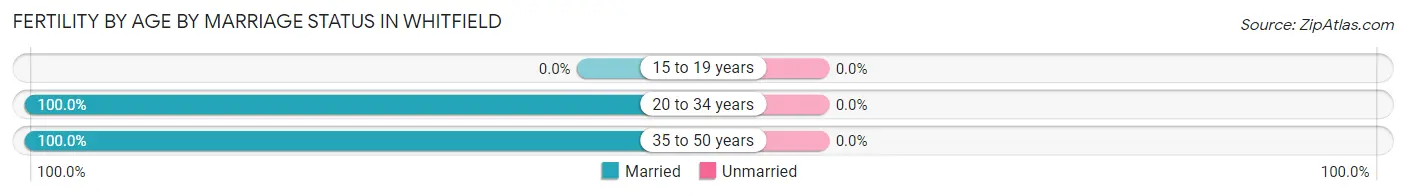
| Age Bracket | Married | Unmarried |
| 15 to 19 years | 0 (0.0%) | 0 (0.0%) |
| 20 to 34 years | 20 (100.0%) | 0 (0.0%) |
| 35 to 50 years | 21 (100.0%) | 0 (0.0%) |
| Total | 41 (100.0%) | 0 (0.0%) |
Fertility by Education in Whitfield
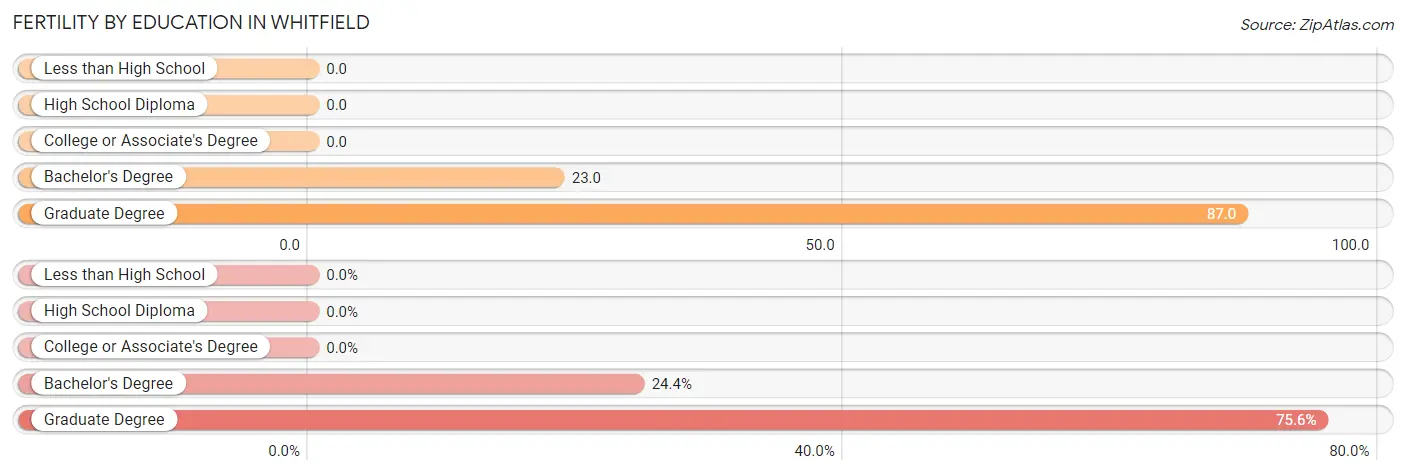
| Educational Attainment | Women with Births | Births / 1,000 Women |
| Less than High School | 0 (0.0%) | 0.0 |
| High School Diploma | 0 (0.0%) | 0.0 |
| College or Associate's Degree | 0 (0.0%) | 0.0 |
| Bachelor's Degree | 10 (24.4%) | 23.0 |
| Graduate Degree | 31 (75.6%) | 87.0 |
| Total | 41 (100.0%) | 33.0 |
Fertility by Education by Marriage Status in Whitfield
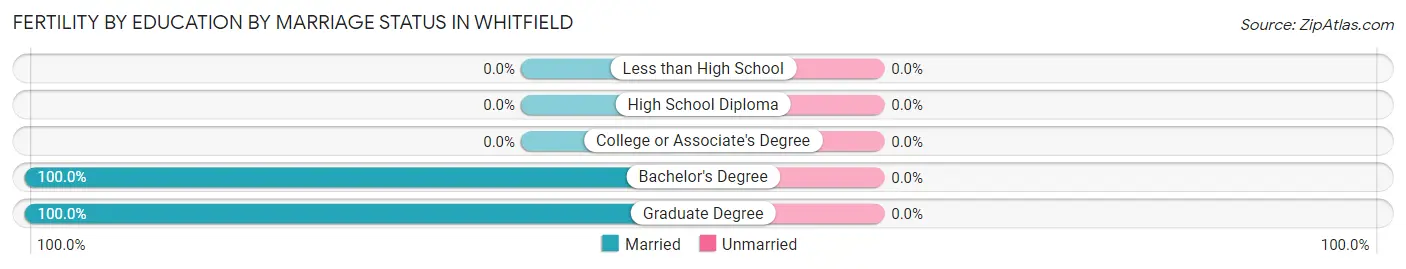
| Educational Attainment | Married | Unmarried |
| Less than High School | 0 (0.0%) | 0 (0.0%) |
| High School Diploma | 0 (0.0%) | 0 (0.0%) |
| College or Associate's Degree | 0 (0.0%) | 0 (0.0%) |
| Bachelor's Degree | 10 (100.0%) | 0 (0.0%) |
| Graduate Degree | 31 (100.0%) | 0 (0.0%) |
| Total | 41 (100.0%) | 0 (0.0%) |
Employment Characteristics in Whitfield
Employment by Class of Employer in Whitfield
Among the 2,891 employed individuals in Whitfield, private company employees (1,749 | 60.5%), not-for-profit organizations (457 | 15.8%), and federal government employees (209 | 7.2%) make up the most common classes of employment.
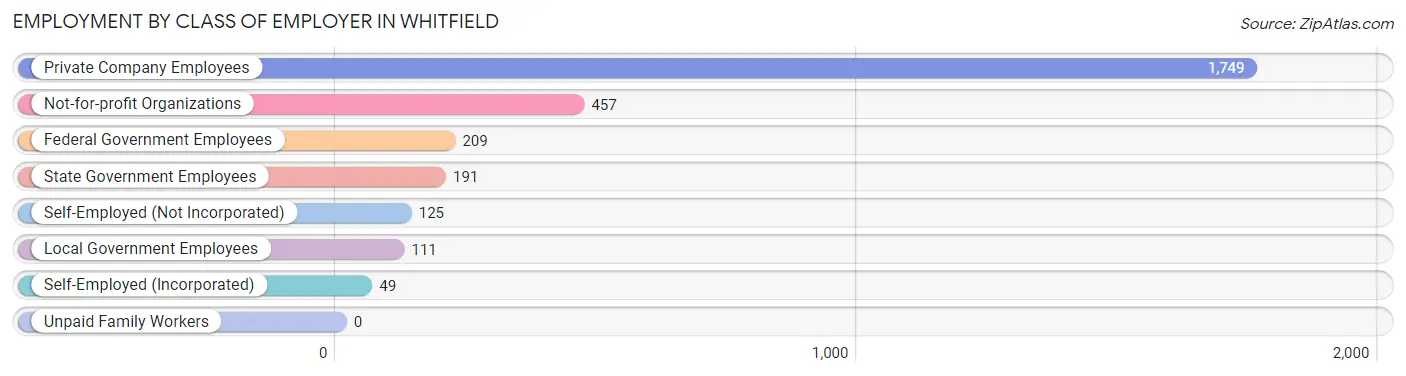
| Employer Class | # Employees | % Employees |
| Private Company Employees | 1,749 | 60.5% |
| Self-Employed (Incorporated) | 49 | 1.7% |
| Self-Employed (Not Incorporated) | 125 | 4.3% |
| Not-for-profit Organizations | 457 | 15.8% |
| Local Government Employees | 111 | 3.8% |
| State Government Employees | 191 | 6.6% |
| Federal Government Employees | 209 | 7.2% |
| Unpaid Family Workers | 0 | 0.0% |
| Total | 2,891 | 100.0% |
Employment Status by Age in Whitfield
According to the labor force statistics for Whitfield, out of the total population over 16 years of age (4,242), 70.2% or 2,978 individuals are in the labor force, with 2.0% or 60 of them unemployed. The age group with the highest labor force participation rate is 25 to 29 years, with 100.0% or 233 individuals in the labor force. Within the labor force, the 60 to 64 years age range has the highest percentage of unemployed individuals, with 16.3% or 22 of them being unemployed.
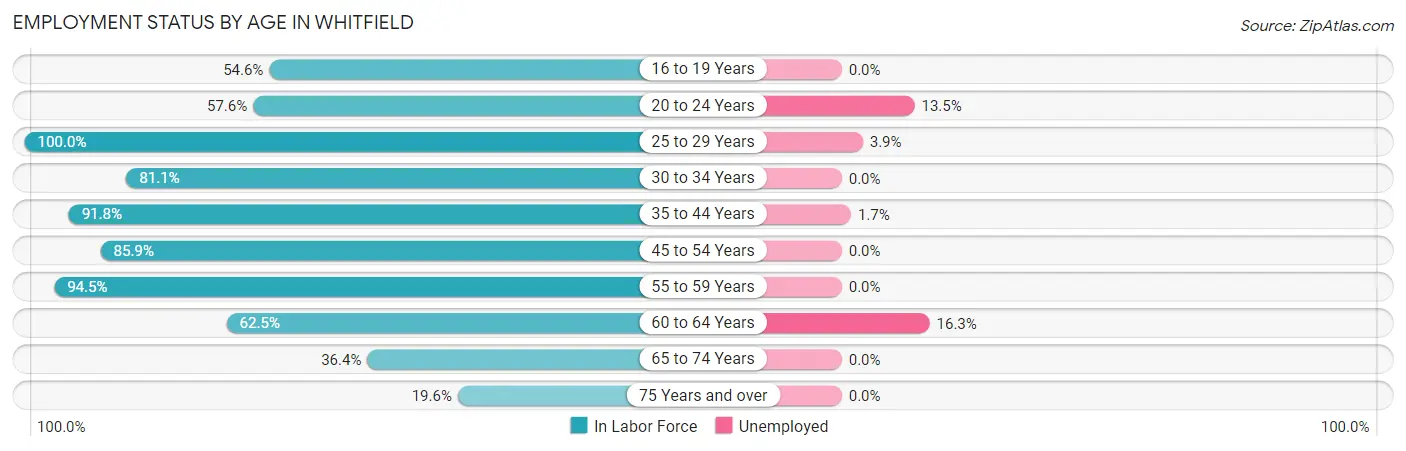
| Age Bracket | In Labor Force | Unemployed |
| 16 to 19 Years | 71 (54.6%) | 0 (0.0%) |
| 20 to 24 Years | 141 (57.6%) | 19 (13.5%) |
| 25 to 29 Years | 233 (100.0%) | 9 (3.9%) |
| 30 to 34 Years | 146 (81.1%) | 0 (0.0%) |
| 35 to 44 Years | 596 (91.8%) | 10 (1.7%) |
| 45 to 54 Years | 981 (85.9%) | 0 (0.0%) |
| 55 to 59 Years | 359 (94.5%) | 0 (0.0%) |
| 60 to 64 Years | 135 (62.5%) | 22 (16.3%) |
| 65 to 74 Years | 227 (36.4%) | 0 (0.0%) |
| 75 Years and over | 87 (19.6%) | 0 (0.0%) |
| Total | 2,978 (70.2%) | 60 (2.0%) |
Employment Status by Educational Attainment in Whitfield
According to labor force statistics for Whitfield, 87.5% of individuals (2,450) out of the total population between 25 and 64 years of age (2,800) are in the labor force, with 1.7% or 42 of them being unemployed. The group with the highest labor force participation rate are those with the educational attainment of bachelor's degree or higher, with 92.6% or 1,526 individuals in the labor force. Within the labor force, individuals with high school diploma education have the highest percentage of unemployment, with 5.4% or 22 of them being unemployed.
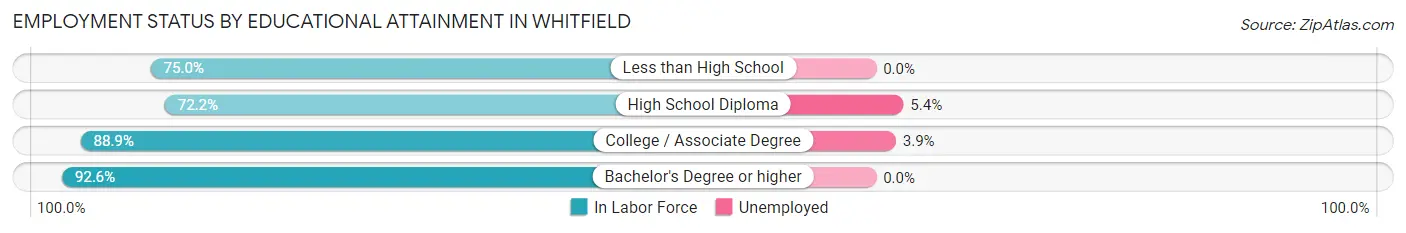
| Educational Attainment | In Labor Force | Unemployed |
| Less than High School | 27 (75.0%) | 0 (0.0%) |
| High School Diploma | 410 (72.2%) | 31 (5.4%) |
| College / Associate Degree | 487 (88.9%) | 21 (3.9%) |
| Bachelor's Degree or higher | 1,526 (92.6%) | 0 (0.0%) |
| Total | 2,450 (87.5%) | 48 (1.7%) |
Employment Occupations by Sex in Whitfield
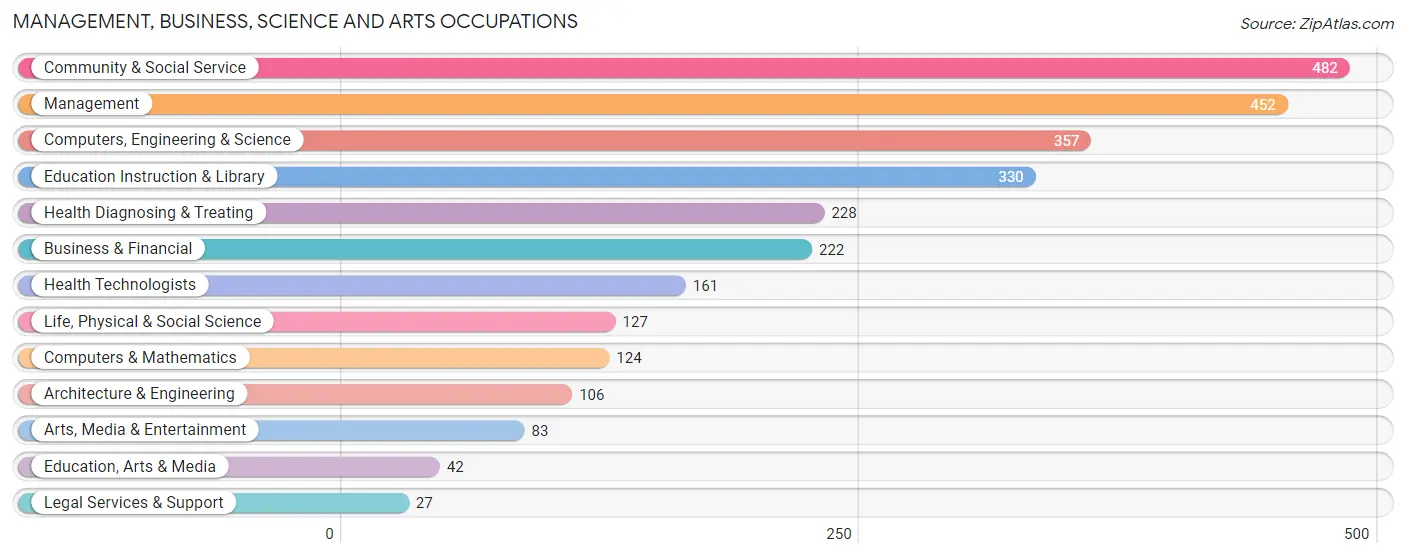
Management, Business, Science and Arts Occupations
The most common Management, Business, Science and Arts occupations in Whitfield are Community & Social Service (482 | 16.5%), Management (452 | 15.5%), Computers, Engineering & Science (357 | 12.2%), Education Instruction & Library (330 | 11.3%), and Health Diagnosing & Treating (228 | 7.8%).
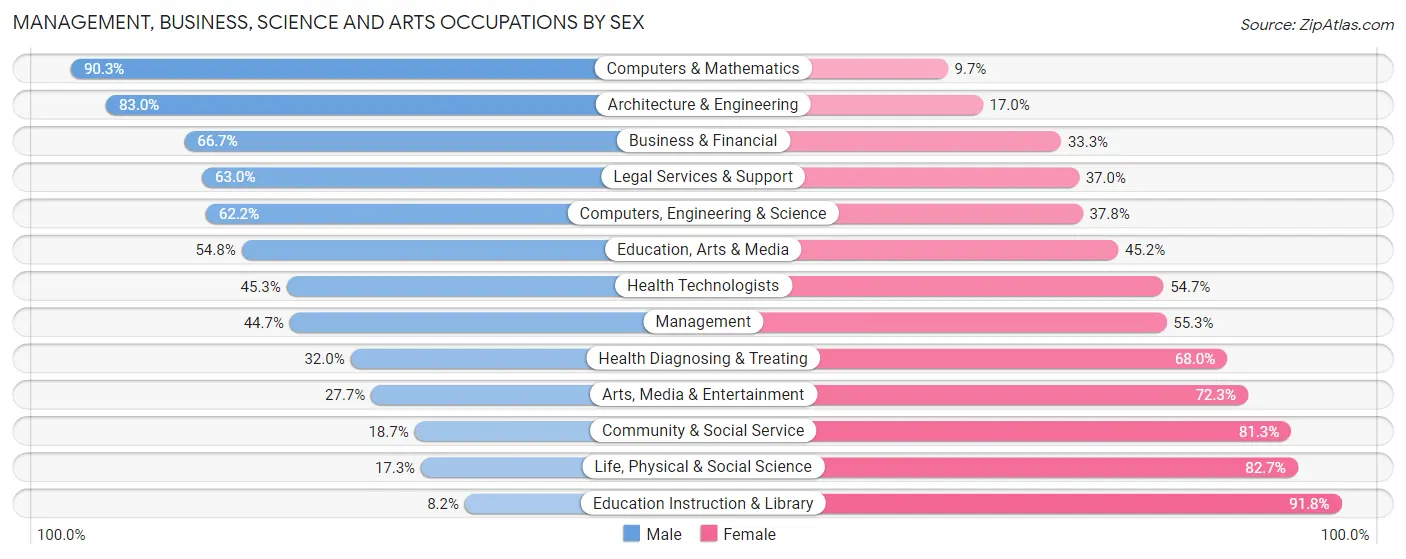
Management, Business, Science and Arts Occupations by Sex
Within the Management, Business, Science and Arts occupations in Whitfield, the most male-oriented occupations are Computers & Mathematics (90.3%), Architecture & Engineering (83.0%), and Business & Financial (66.7%), while the most female-oriented occupations are Education Instruction & Library (91.8%), Life, Physical & Social Science (82.7%), and Community & Social Service (81.3%).
| Occupation | Male | Female |
| Management | 202 (44.7%) | 250 (55.3%) |
| Business & Financial | 148 (66.7%) | 74 (33.3%) |
| Computers, Engineering & Science | 222 (62.2%) | 135 (37.8%) |
| Computers & Mathematics | 112 (90.3%) | 12 (9.7%) |
| Architecture & Engineering | 88 (83.0%) | 18 (17.0%) |
| Life, Physical & Social Science | 22 (17.3%) | 105 (82.7%) |
| Community & Social Service | 90 (18.7%) | 392 (81.3%) |
| Education, Arts & Media | 23 (54.8%) | 19 (45.2%) |
| Legal Services & Support | 17 (63.0%) | 10 (37.0%) |
| Education Instruction & Library | 27 (8.2%) | 303 (91.8%) |
| Arts, Media & Entertainment | 23 (27.7%) | 60 (72.3%) |
| Health Diagnosing & Treating | 73 (32.0%) | 155 (68.0%) |
| Health Technologists | 73 (45.3%) | 88 (54.7%) |
| Total (Category) | 735 (42.2%) | 1,006 (57.8%) |
| Total (Overall) | 1,448 (49.7%) | 1,468 (50.3%) |
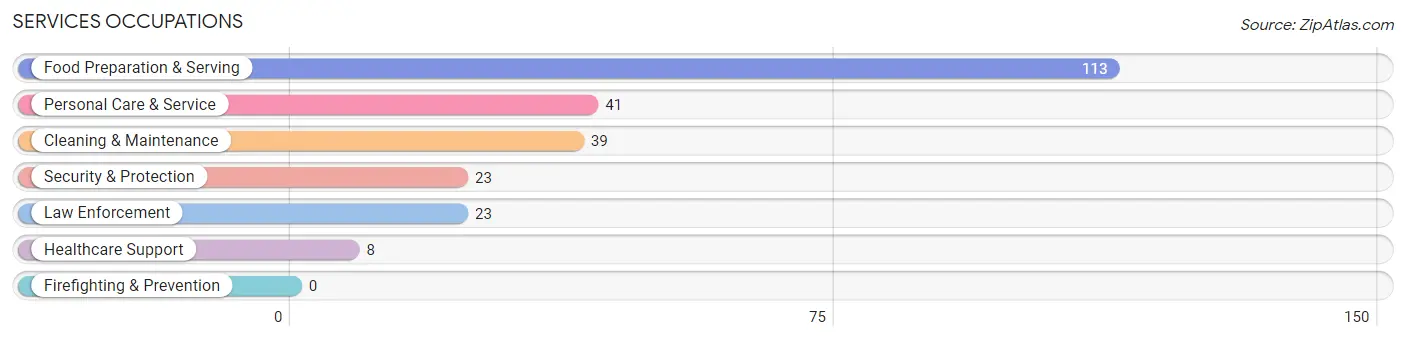
Services Occupations
The most common Services occupations in Whitfield are Food Preparation & Serving (113 | 3.9%), Personal Care & Service (41 | 1.4%), Cleaning & Maintenance (39 | 1.3%), Security & Protection (23 | 0.8%), and Law Enforcement (23 | 0.8%).
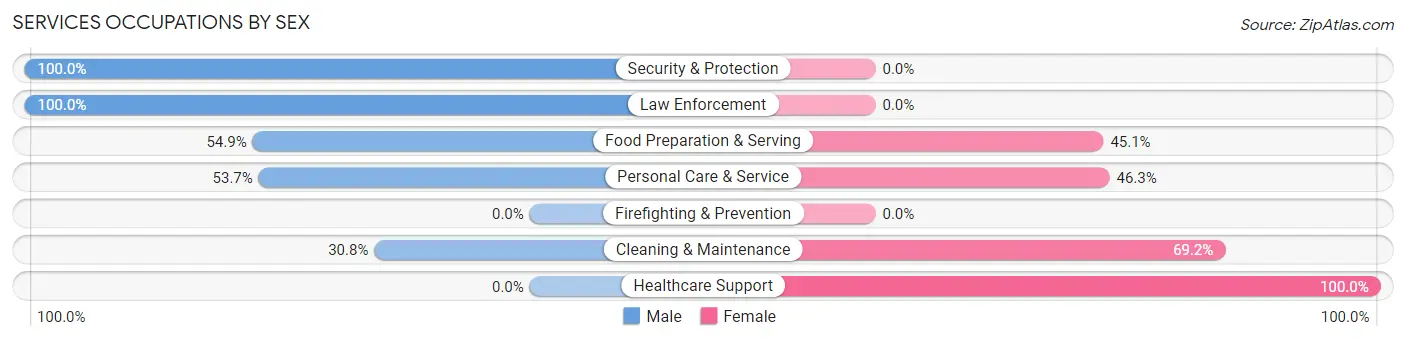
Services Occupations by Sex
Within the Services occupations in Whitfield, the most male-oriented occupations are Security & Protection (100.0%), Law Enforcement (100.0%), and Food Preparation & Serving (54.9%), while the most female-oriented occupations are Healthcare Support (100.0%), Cleaning & Maintenance (69.2%), and Personal Care & Service (46.3%).
| Occupation | Male | Female |
| Healthcare Support | 0 (0.0%) | 8 (100.0%) |
| Security & Protection | 23 (100.0%) | 0 (0.0%) |
| Firefighting & Prevention | 0 (0.0%) | 0 (0.0%) |
| Law Enforcement | 23 (100.0%) | 0 (0.0%) |
| Food Preparation & Serving | 62 (54.9%) | 51 (45.1%) |
| Cleaning & Maintenance | 12 (30.8%) | 27 (69.2%) |
| Personal Care & Service | 22 (53.7%) | 19 (46.3%) |
| Total (Category) | 119 (53.1%) | 105 (46.9%) |
| Total (Overall) | 1,448 (49.7%) | 1,468 (50.3%) |
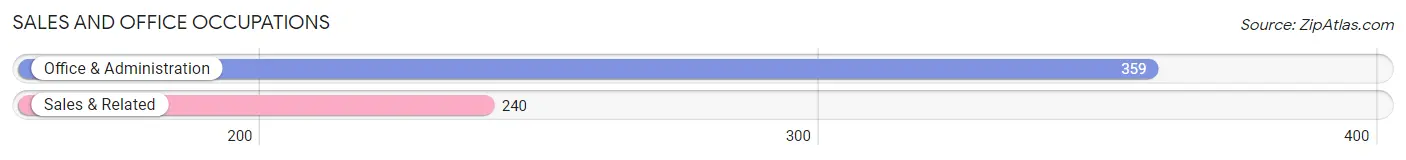
Sales and Office Occupations
The most common Sales and Office occupations in Whitfield are Office & Administration (359 | 12.3%), and Sales & Related (240 | 8.2%).
Sales and Office Occupations by Sex
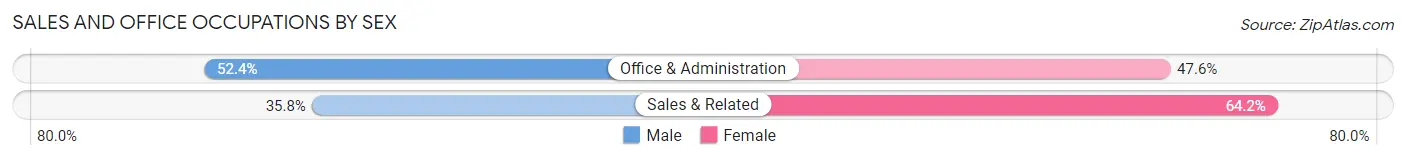
| Occupation | Male | Female |
| Sales & Related | 86 (35.8%) | 154 (64.2%) |
| Office & Administration | 188 (52.4%) | 171 (47.6%) |
| Total (Category) | 274 (45.7%) | 325 (54.3%) |
| Total (Overall) | 1,448 (49.7%) | 1,468 (50.3%) |
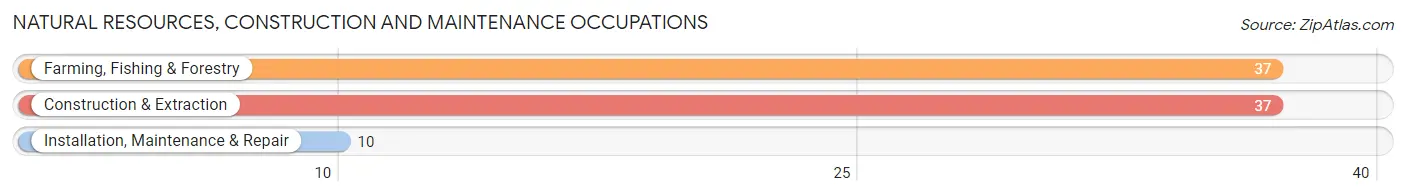
Natural Resources, Construction and Maintenance Occupations
The most common Natural Resources, Construction and Maintenance occupations in Whitfield are Farming, Fishing & Forestry (37 | 1.3%), Construction & Extraction (37 | 1.3%), and Installation, Maintenance & Repair (10 | 0.3%).
Natural Resources, Construction and Maintenance Occupations by Sex
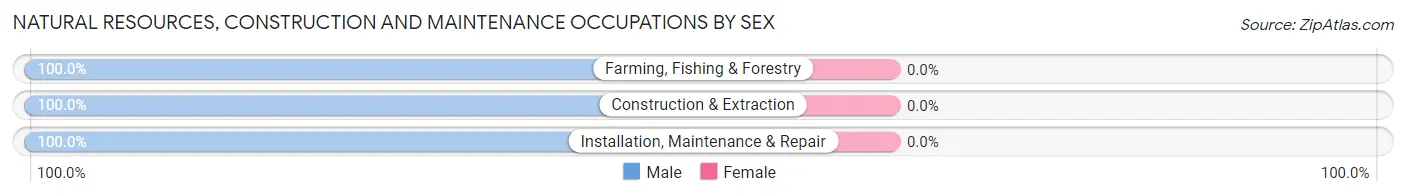
| Occupation | Male | Female |
| Farming, Fishing & Forestry | 37 (100.0%) | 0 (0.0%) |
| Construction & Extraction | 37 (100.0%) | 0 (0.0%) |
| Installation, Maintenance & Repair | 10 (100.0%) | 0 (0.0%) |
| Total (Category) | 84 (100.0%) | 0 (0.0%) |
| Total (Overall) | 1,448 (49.7%) | 1,468 (50.3%) |
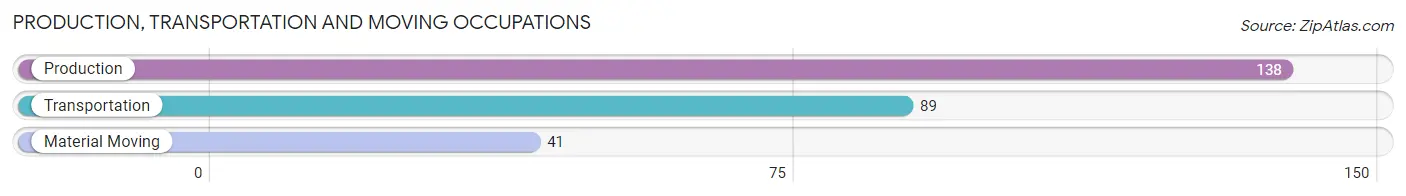
Production, Transportation and Moving Occupations
The most common Production, Transportation and Moving occupations in Whitfield are Production (138 | 4.7%), Transportation (89 | 3.0%), and Material Moving (41 | 1.4%).
Production, Transportation and Moving Occupations by Sex
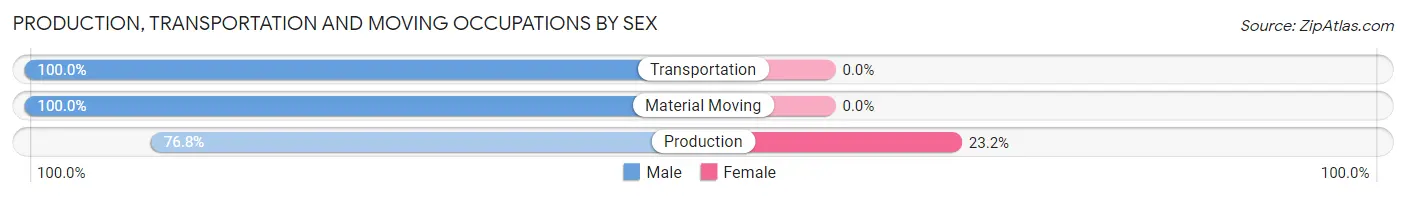
| Occupation | Male | Female |
| Production | 106 (76.8%) | 32 (23.2%) |
| Transportation | 89 (100.0%) | 0 (0.0%) |
| Material Moving | 41 (100.0%) | 0 (0.0%) |
| Total (Category) | 236 (88.1%) | 32 (11.9%) |
| Total (Overall) | 1,448 (49.7%) | 1,468 (50.3%) |
Employment Industries by Sex in Whitfield
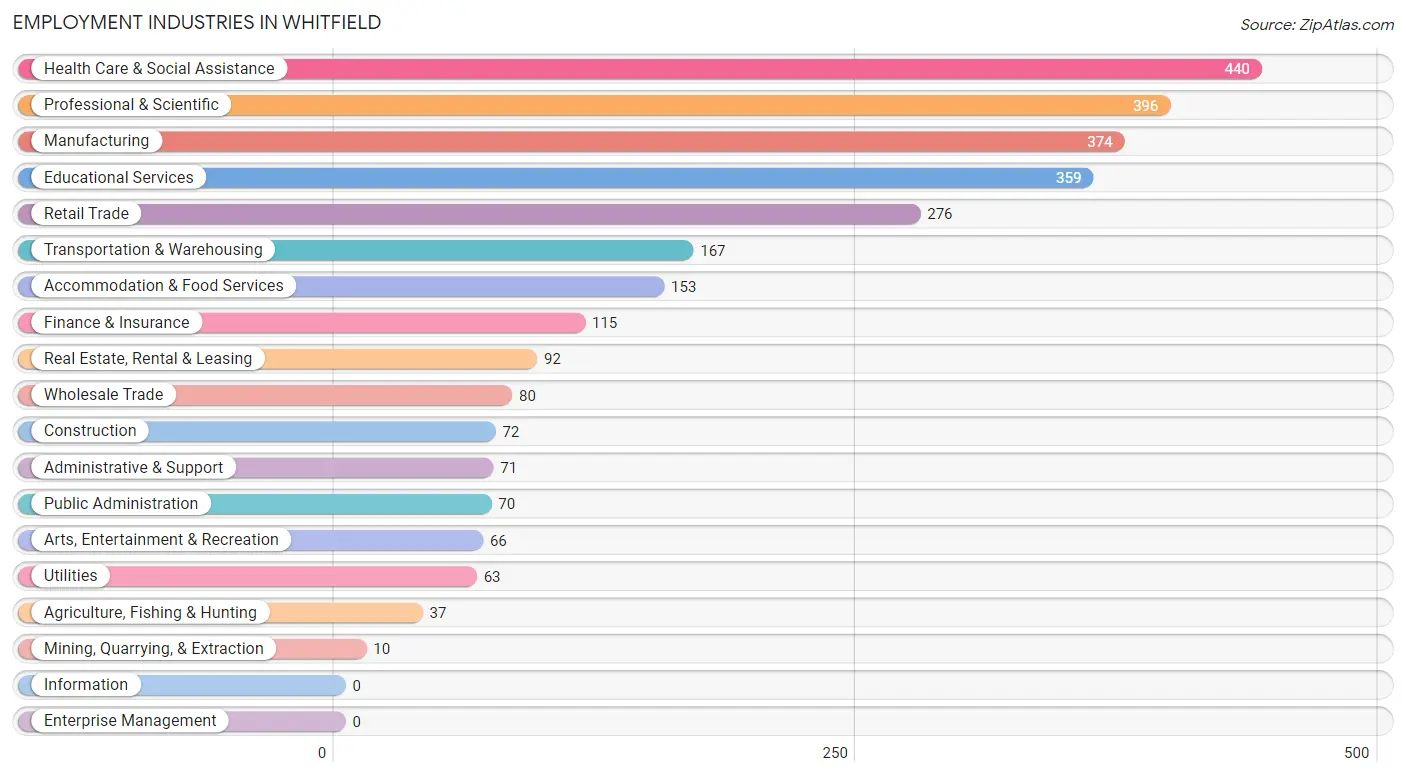
Employment Industries in Whitfield
The major employment industries in Whitfield include Health Care & Social Assistance (440 | 15.1%), Professional & Scientific (396 | 13.6%), Manufacturing (374 | 12.8%), Educational Services (359 | 12.3%), and Retail Trade (276 | 9.5%).
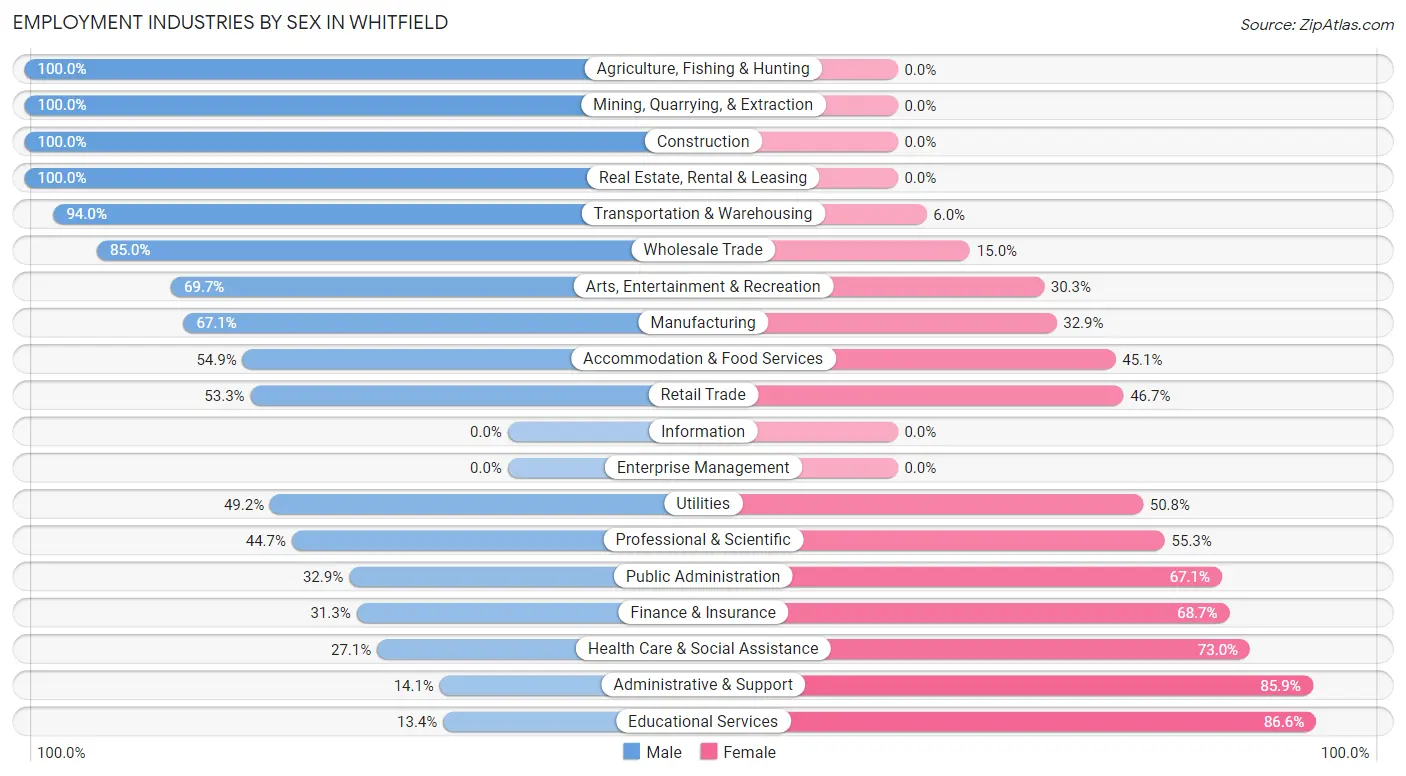
Employment Industries by Sex in Whitfield
The Whitfield industries that see more men than women are Agriculture, Fishing & Hunting (100.0%), Mining, Quarrying, & Extraction (100.0%), and Construction (100.0%), whereas the industries that tend to have a higher number of women are Educational Services (86.6%), Administrative & Support (85.9%), and Health Care & Social Assistance (73.0%).
| Industry | Male | Female |
| Agriculture, Fishing & Hunting | 37 (100.0%) | 0 (0.0%) |
| Mining, Quarrying, & Extraction | 10 (100.0%) | 0 (0.0%) |
| Construction | 72 (100.0%) | 0 (0.0%) |
| Manufacturing | 251 (67.1%) | 123 (32.9%) |
| Wholesale Trade | 68 (85.0%) | 12 (15.0%) |
| Retail Trade | 147 (53.3%) | 129 (46.7%) |
| Transportation & Warehousing | 157 (94.0%) | 10 (6.0%) |
| Utilities | 31 (49.2%) | 32 (50.8%) |
| Information | 0 (0.0%) | 0 (0.0%) |
| Finance & Insurance | 36 (31.3%) | 79 (68.7%) |
| Real Estate, Rental & Leasing | 92 (100.0%) | 0 (0.0%) |
| Professional & Scientific | 177 (44.7%) | 219 (55.3%) |
| Enterprise Management | 0 (0.0%) | 0 (0.0%) |
| Administrative & Support | 10 (14.1%) | 61 (85.9%) |
| Educational Services | 48 (13.4%) | 311 (86.6%) |
| Health Care & Social Assistance | 119 (27.1%) | 321 (73.0%) |
| Arts, Entertainment & Recreation | 46 (69.7%) | 20 (30.3%) |
| Accommodation & Food Services | 84 (54.9%) | 69 (45.1%) |
| Public Administration | 23 (32.9%) | 47 (67.1%) |
| Total | 1,448 (49.7%) | 1,468 (50.3%) |
Education in Whitfield
School Enrollment in Whitfield
The most common levels of schooling among the 1,157 students in Whitfield are elementary school (333 | 28.8%), middle school (197 | 17.0%), and high school (182 | 15.7%).
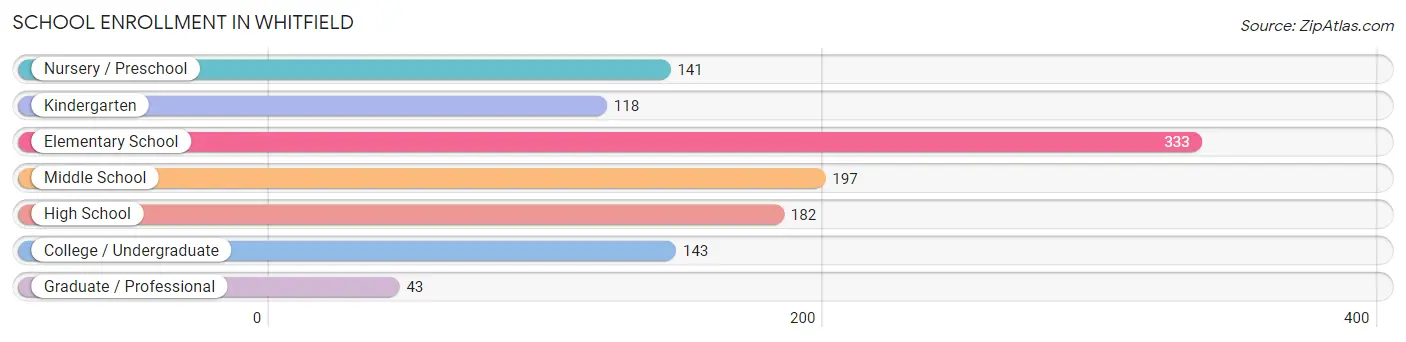
| School Level | # Students | % Students |
| Nursery / Preschool | 141 | 12.2% |
| Kindergarten | 118 | 10.2% |
| Elementary School | 333 | 28.8% |
| Middle School | 197 | 17.0% |
| High School | 182 | 15.7% |
| College / Undergraduate | 143 | 12.4% |
| Graduate / Professional | 43 | 3.7% |
| Total | 1,157 | 100.0% |
School Enrollment by Age by Funding Source in Whitfield
Out of a total of 1,157 students who are enrolled in schools in Whitfield, 180 (15.6%) attend a private institution, while the remaining 977 (84.4%) are enrolled in public schools. The age group of 25 to 34 year olds has the highest likelihood of being enrolled in private schools, with 42 (100.0% in the age bracket) enrolled. Conversely, the age group of 15 to 17 year olds has the lowest likelihood of being enrolled in a private school, with 158 (100.0% in the age bracket) attending a public institution.
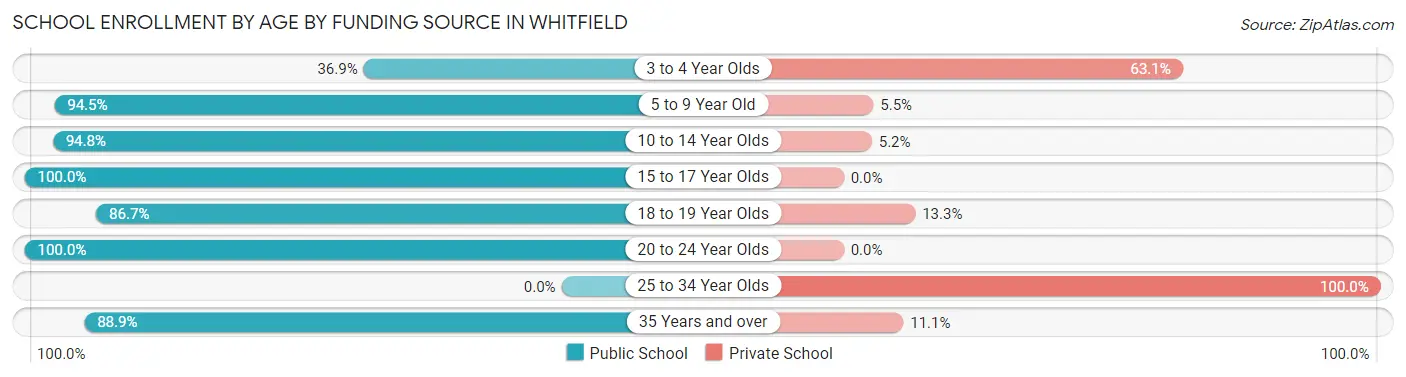
| Age Bracket | Public School | Private School |
| 3 to 4 Year Olds | 52 (36.9%) | 89 (63.1%) |
| 5 to 9 Year Old | 410 (94.5%) | 24 (5.5%) |
| 10 to 14 Year Olds | 199 (94.8%) | 11 (5.2%) |
| 15 to 17 Year Olds | 158 (100.0%) | 0 (0.0%) |
| 18 to 19 Year Olds | 39 (86.7%) | 6 (13.3%) |
| 20 to 24 Year Olds | 55 (100.0%) | 0 (0.0%) |
| 25 to 34 Year Olds | 0 (0.0%) | 42 (100.0%) |
| 35 Years and over | 64 (88.9%) | 8 (11.1%) |
| Total | 977 (84.4%) | 180 (15.6%) |
Educational Attainment by Field of Study in Whitfield
Business (343 | 15.9%), education (328 | 15.2%), bio, nature & agricultural (224 | 10.4%), computers & mathematics (210 | 9.7%), and science & technology (188 | 8.7%) are the most common fields of study among 2,159 individuals in Whitfield who have obtained a bachelor's degree or higher.
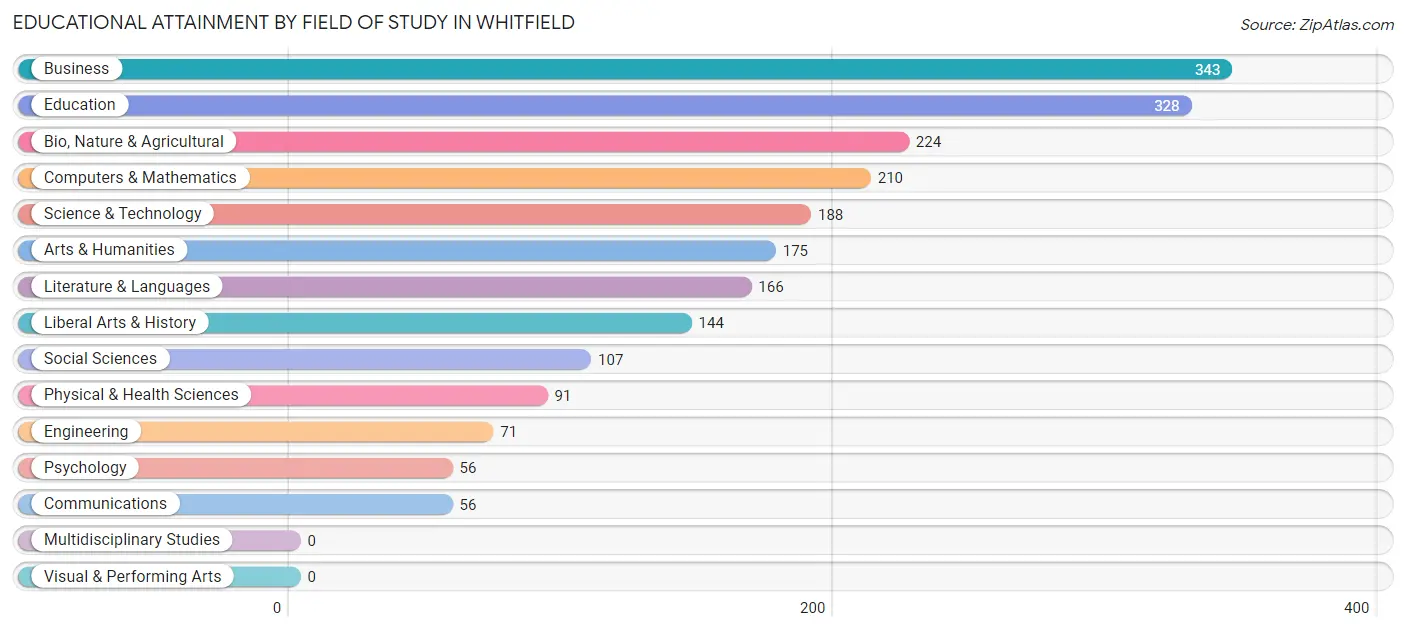
| Field of Study | # Graduates | % Graduates |
| Computers & Mathematics | 210 | 9.7% |
| Bio, Nature & Agricultural | 224 | 10.4% |
| Physical & Health Sciences | 91 | 4.2% |
| Psychology | 56 | 2.6% |
| Social Sciences | 107 | 5.0% |
| Engineering | 71 | 3.3% |
| Multidisciplinary Studies | 0 | 0.0% |
| Science & Technology | 188 | 8.7% |
| Business | 343 | 15.9% |
| Education | 328 | 15.2% |
| Literature & Languages | 166 | 7.7% |
| Liberal Arts & History | 144 | 6.7% |
| Visual & Performing Arts | 0 | 0.0% |
| Communications | 56 | 2.6% |
| Arts & Humanities | 175 | 8.1% |
| Total | 2,159 | 100.0% |
Transportation & Commute in Whitfield
Vehicle Availability by Sex in Whitfield
The most prevalent vehicle ownership categories in Whitfield are males with 2 vehicles (776, accounting for 54.5%) and females with 2 vehicles (642, making up 53.0%).
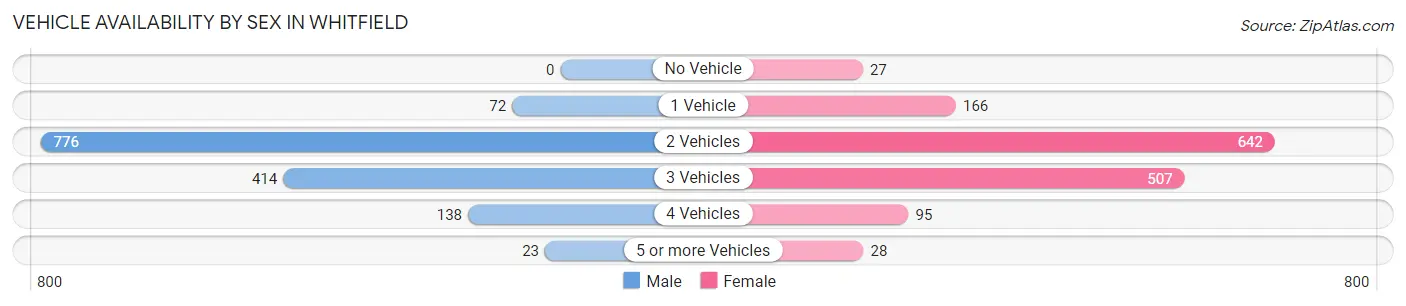
| Vehicles Available | Male | Female |
| No Vehicle | 0 (0.0%) | 27 (1.8%) |
| 1 Vehicle | 72 (5.1%) | 166 (11.3%) |
| 2 Vehicles | 776 (54.5%) | 642 (43.8%) |
| 3 Vehicles | 414 (29.1%) | 507 (34.6%) |
| 4 Vehicles | 138 (9.7%) | 95 (6.5%) |
| 5 or more Vehicles | 23 (1.6%) | 28 (1.9%) |
| Total | 1,423 (100.0%) | 1,465 (100.0%) |
Commute Time in Whitfield
The most frequently occuring commute durations in Whitfield are 15 to 19 minutes (579 commuters, 22.7%), 10 to 14 minutes (418 commuters, 16.4%), and 5 to 9 minutes (364 commuters, 14.3%).
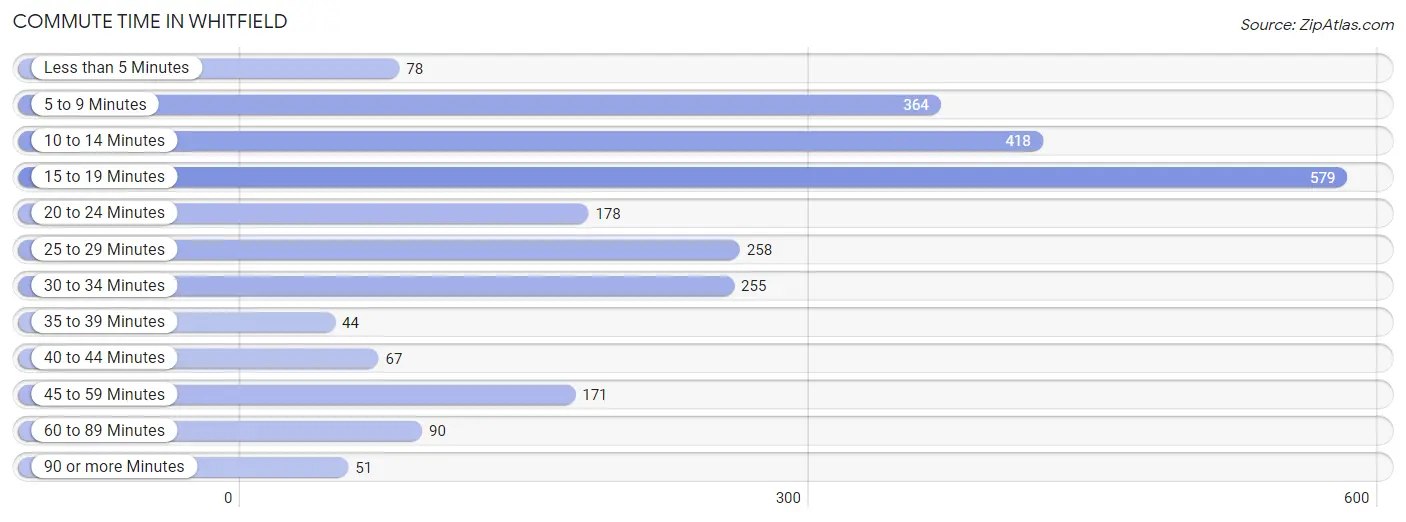
| Commute Time | # Commuters | % Commuters |
| Less than 5 Minutes | 78 | 3.1% |
| 5 to 9 Minutes | 364 | 14.3% |
| 10 to 14 Minutes | 418 | 16.4% |
| 15 to 19 Minutes | 579 | 22.7% |
| 20 to 24 Minutes | 178 | 7.0% |
| 25 to 29 Minutes | 258 | 10.1% |
| 30 to 34 Minutes | 255 | 10.0% |
| 35 to 39 Minutes | 44 | 1.7% |
| 40 to 44 Minutes | 67 | 2.6% |
| 45 to 59 Minutes | 171 | 6.7% |
| 60 to 89 Minutes | 90 | 3.5% |
| 90 or more Minutes | 51 | 2.0% |
Commute Time by Sex in Whitfield
The most common commute times in Whitfield are 25 to 29 minutes (252 commuters, 19.3%) for males and 15 to 19 minutes (353 commuters, 28.3%) for females.
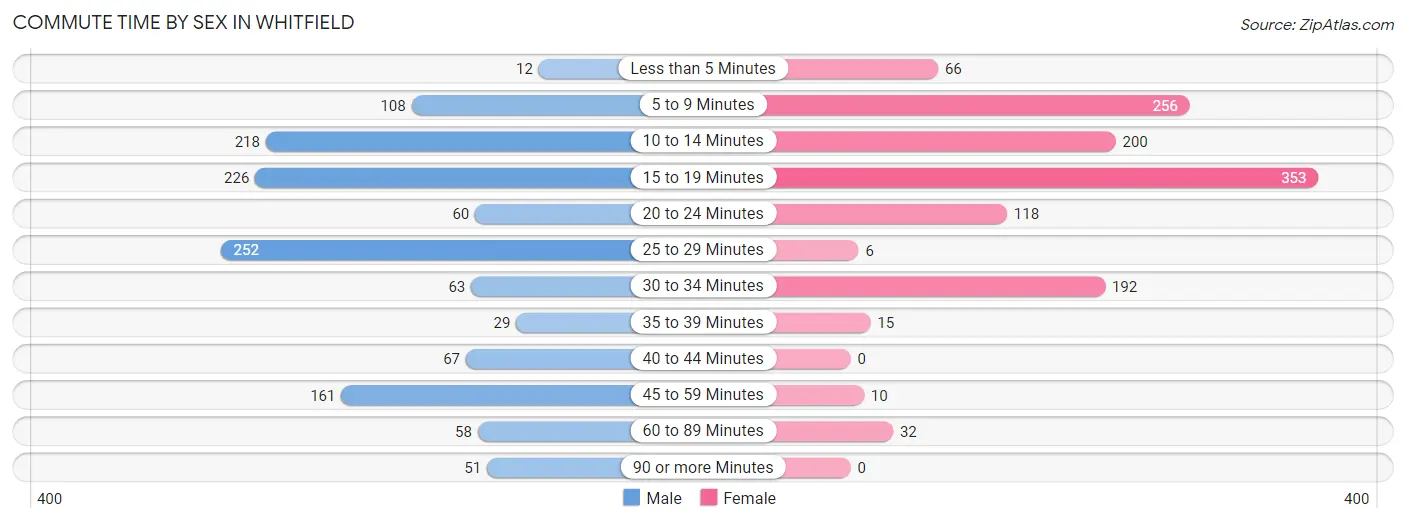
| Commute Time | Male | Female |
| Less than 5 Minutes | 12 (0.9%) | 66 (5.3%) |
| 5 to 9 Minutes | 108 (8.3%) | 256 (20.5%) |
| 10 to 14 Minutes | 218 (16.7%) | 200 (16.0%) |
| 15 to 19 Minutes | 226 (17.3%) | 353 (28.3%) |
| 20 to 24 Minutes | 60 (4.6%) | 118 (9.5%) |
| 25 to 29 Minutes | 252 (19.3%) | 6 (0.5%) |
| 30 to 34 Minutes | 63 (4.8%) | 192 (15.4%) |
| 35 to 39 Minutes | 29 (2.2%) | 15 (1.2%) |
| 40 to 44 Minutes | 67 (5.1%) | 0 (0.0%) |
| 45 to 59 Minutes | 161 (12.3%) | 10 (0.8%) |
| 60 to 89 Minutes | 58 (4.4%) | 32 (2.6%) |
| 90 or more Minutes | 51 (3.9%) | 0 (0.0%) |
Time of Departure to Work by Sex in Whitfield
The most frequent times of departure to work in Whitfield are 6:30 AM to 6:59 AM (235, 18.0%) for males and 6:30 AM to 6:59 AM (359, 28.8%) for females.
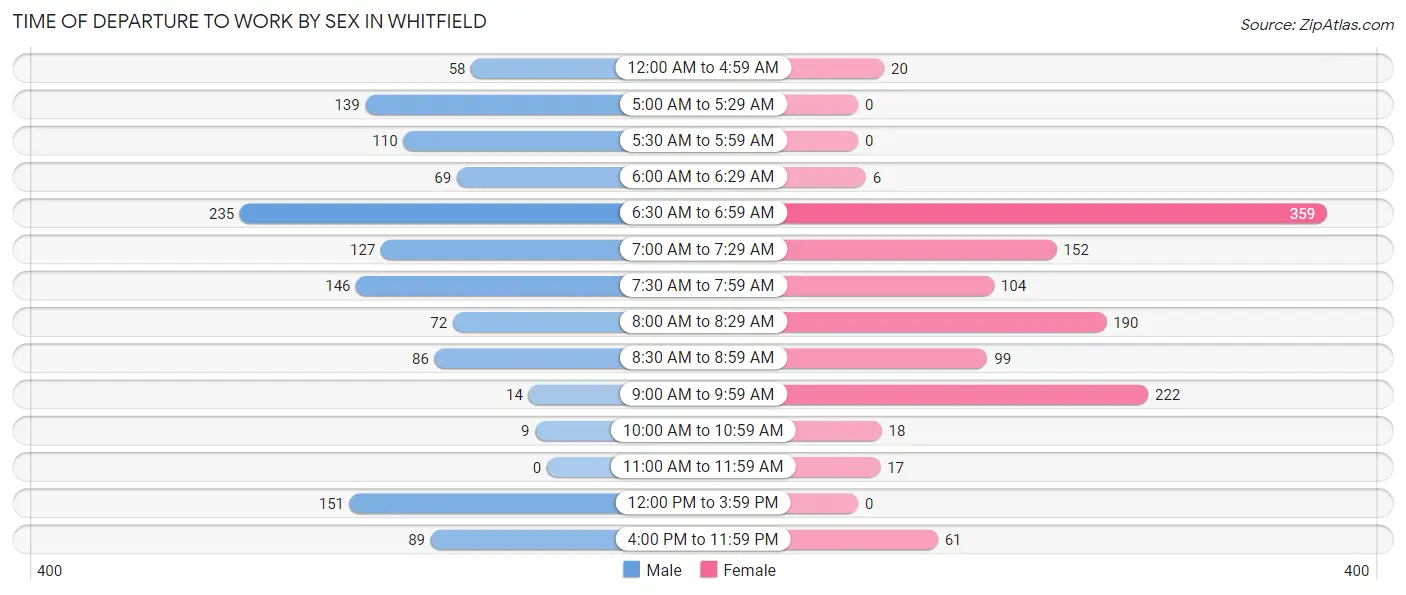
| Time of Departure | Male | Female |
| 12:00 AM to 4:59 AM | 58 (4.4%) | 20 (1.6%) |
| 5:00 AM to 5:29 AM | 139 (10.6%) | 0 (0.0%) |
| 5:30 AM to 5:59 AM | 110 (8.4%) | 0 (0.0%) |
| 6:00 AM to 6:29 AM | 69 (5.3%) | 6 (0.5%) |
| 6:30 AM to 6:59 AM | 235 (18.0%) | 359 (28.8%) |
| 7:00 AM to 7:29 AM | 127 (9.7%) | 152 (12.2%) |
| 7:30 AM to 7:59 AM | 146 (11.2%) | 104 (8.3%) |
| 8:00 AM to 8:29 AM | 72 (5.5%) | 190 (15.2%) |
| 8:30 AM to 8:59 AM | 86 (6.6%) | 99 (7.9%) |
| 9:00 AM to 9:59 AM | 14 (1.1%) | 222 (17.8%) |
| 10:00 AM to 10:59 AM | 9 (0.7%) | 18 (1.4%) |
| 11:00 AM to 11:59 AM | 0 (0.0%) | 17 (1.4%) |
| 12:00 PM to 3:59 PM | 151 (11.6%) | 0 (0.0%) |
| 4:00 PM to 11:59 PM | 89 (6.8%) | 61 (4.9%) |
| Total | 1,305 (100.0%) | 1,248 (100.0%) |
Housing Occupancy in Whitfield
Occupancy by Ownership in Whitfield
Of the total 1,935 dwellings in Whitfield, owner-occupied units account for 1,831 (94.6%), while renter-occupied units make up 104 (5.4%).
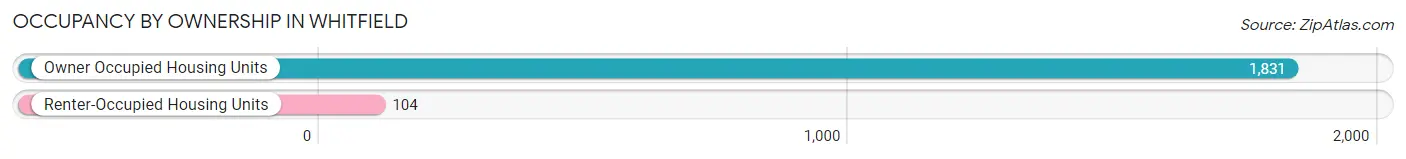
| Occupancy | # Housing Units | % Housing Units |
| Owner Occupied Housing Units | 1,831 | 94.6% |
| Renter-Occupied Housing Units | 104 | 5.4% |
| Total Occupied Housing Units | 1,935 | 100.0% |
Occupancy by Household Size in Whitfield
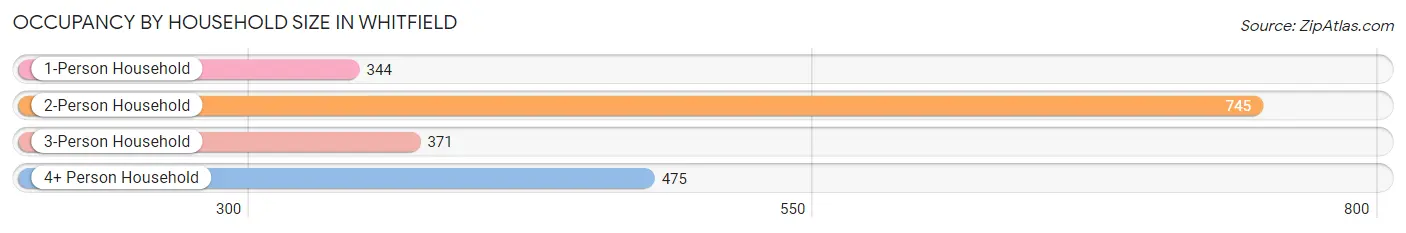
| Household Size | # Housing Units | % Housing Units |
| 1-Person Household | 344 | 17.8% |
| 2-Person Household | 745 | 38.5% |
| 3-Person Household | 371 | 19.2% |
| 4+ Person Household | 475 | 24.5% |
| Total Housing Units | 1,935 | 100.0% |
Occupancy by Ownership by Household Size in Whitfield
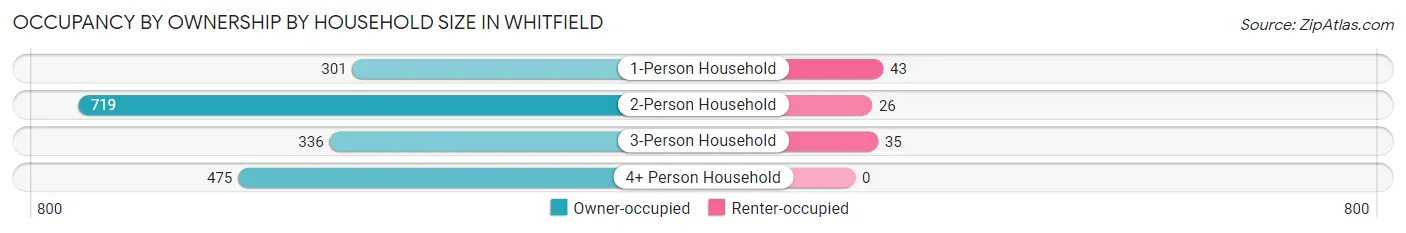
| Household Size | Owner-occupied | Renter-occupied |
| 1-Person Household | 301 (87.5%) | 43 (12.5%) |
| 2-Person Household | 719 (96.5%) | 26 (3.5%) |
| 3-Person Household | 336 (90.6%) | 35 (9.4%) |
| 4+ Person Household | 475 (100.0%) | 0 (0.0%) |
| Total Housing Units | 1,831 (94.6%) | 104 (5.4%) |
Occupancy by Educational Attainment in Whitfield
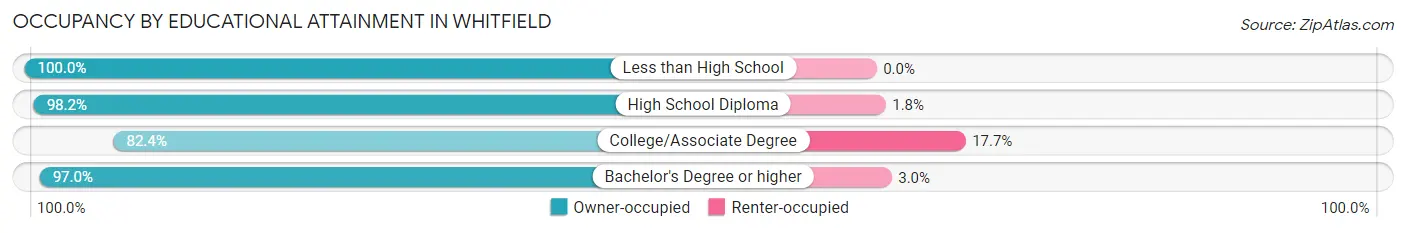
| Household Size | Owner-occupied | Renter-occupied |
| Less than High School | 35 (100.0%) | 0 (0.0%) |
| High School Diploma | 435 (98.2%) | 8 (1.8%) |
| College/Associate Degree | 294 (82.4%) | 63 (17.6%) |
| Bachelor's Degree or higher | 1,067 (97.0%) | 33 (3.0%) |
Occupancy by Age of Householder in Whitfield
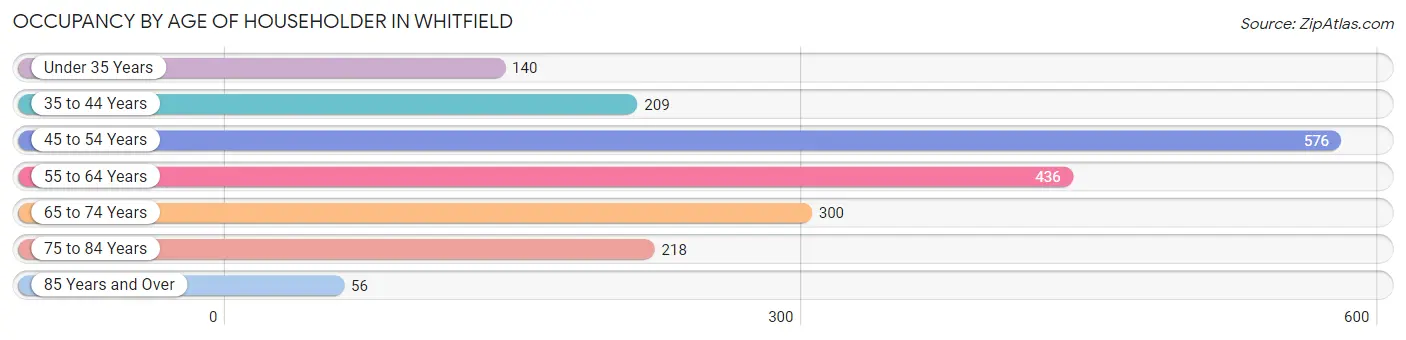
| Age Bracket | # Households | % Households |
| Under 35 Years | 140 | 7.2% |
| 35 to 44 Years | 209 | 10.8% |
| 45 to 54 Years | 576 | 29.8% |
| 55 to 64 Years | 436 | 22.5% |
| 65 to 74 Years | 300 | 15.5% |
| 75 to 84 Years | 218 | 11.3% |
| 85 Years and Over | 56 | 2.9% |
| Total | 1,935 | 100.0% |
Housing Finances in Whitfield
Median Income by Occupancy in Whitfield
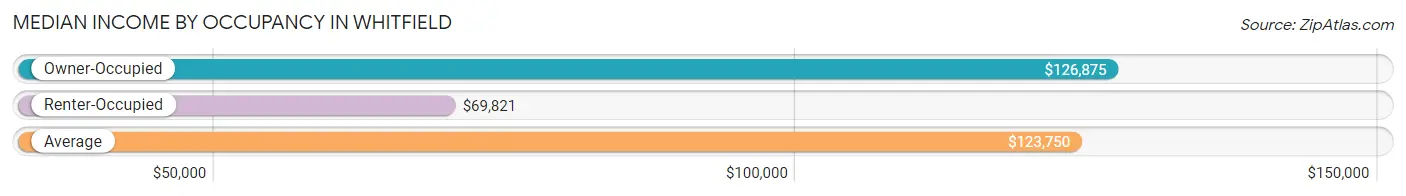
| Occupancy Type | # Households | Median Income |
| Owner-Occupied | 1,831 (94.6%) | $126,875 |
| Renter-Occupied | 104 (5.4%) | $69,821 |
| Average | 1,935 (100.0%) | $123,750 |
Occupancy by Householder Income Bracket in Whitfield
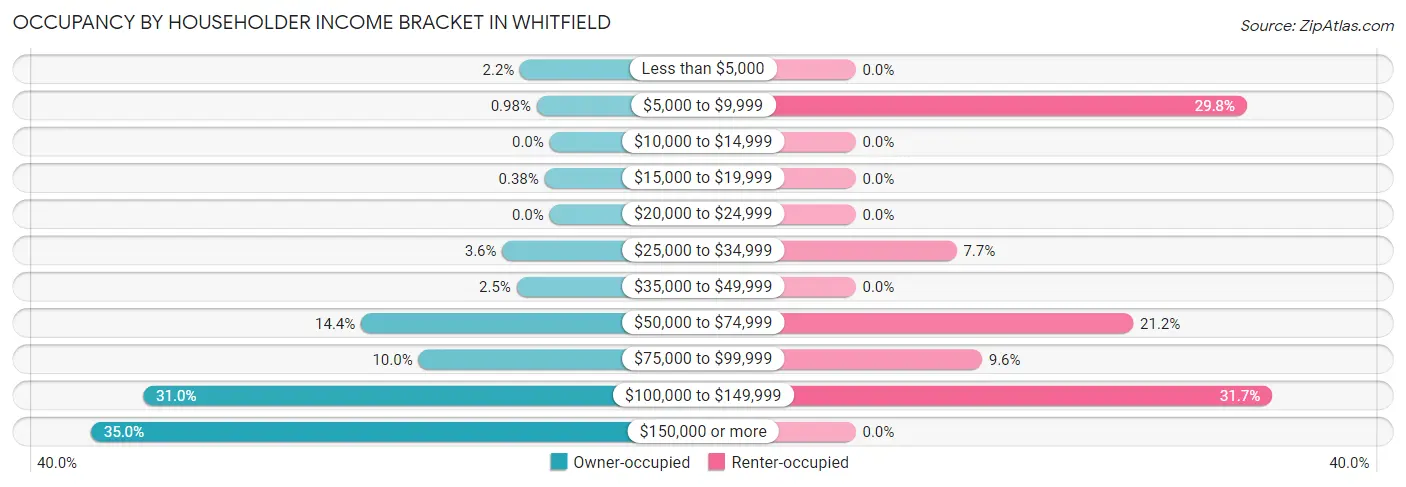
| Income Bracket | Owner-occupied | Renter-occupied |
| Less than $5,000 | 41 (2.2%) | 0 (0.0%) |
| $5,000 to $9,999 | 18 (1.0%) | 31 (29.8%) |
| $10,000 to $14,999 | 0 (0.0%) | 0 (0.0%) |
| $15,000 to $19,999 | 7 (0.4%) | 0 (0.0%) |
| $20,000 to $24,999 | 0 (0.0%) | 0 (0.0%) |
| $25,000 to $34,999 | 66 (3.6%) | 8 (7.7%) |
| $35,000 to $49,999 | 46 (2.5%) | 0 (0.0%) |
| $50,000 to $74,999 | 263 (14.4%) | 22 (21.1%) |
| $75,000 to $99,999 | 183 (10.0%) | 10 (9.6%) |
| $100,000 to $149,999 | 567 (31.0%) | 33 (31.7%) |
| $150,000 or more | 640 (34.9%) | 0 (0.0%) |
| Total | 1,831 (100.0%) | 104 (100.0%) |
Monthly Housing Cost Tiers in Whitfield
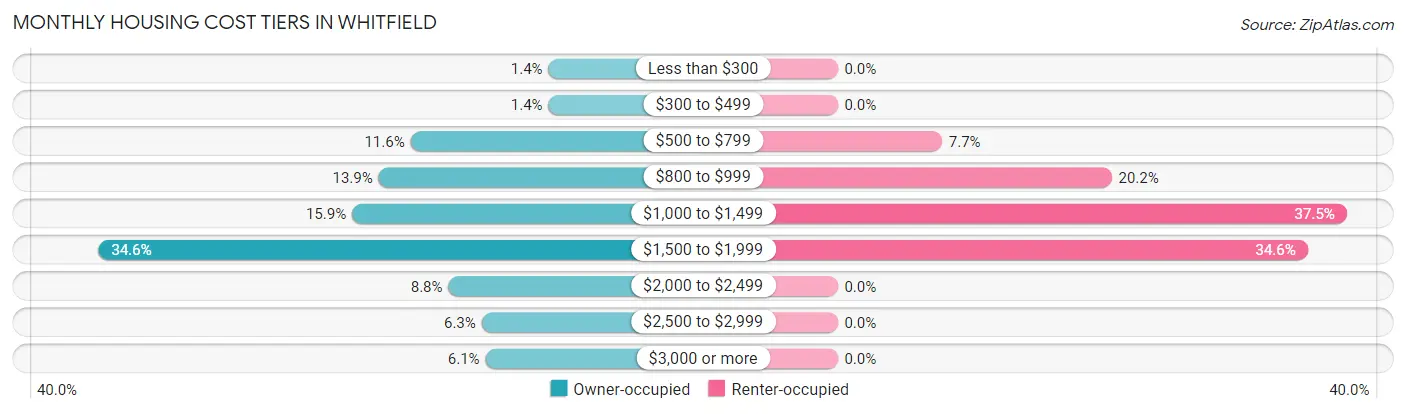
| Monthly Cost | Owner-occupied | Renter-occupied |
| Less than $300 | 26 (1.4%) | 0 (0.0%) |
| $300 to $499 | 26 (1.4%) | 0 (0.0%) |
| $500 to $799 | 212 (11.6%) | 8 (7.7%) |
| $800 to $999 | 255 (13.9%) | 21 (20.2%) |
| $1,000 to $1,499 | 291 (15.9%) | 39 (37.5%) |
| $1,500 to $1,999 | 633 (34.6%) | 36 (34.6%) |
| $2,000 to $2,499 | 161 (8.8%) | 0 (0.0%) |
| $2,500 to $2,999 | 116 (6.3%) | 0 (0.0%) |
| $3,000 or more | 111 (6.1%) | 0 (0.0%) |
| Total | 1,831 (100.0%) | 104 (100.0%) |
Physical Housing Characteristics in Whitfield
Housing Structures in Whitfield
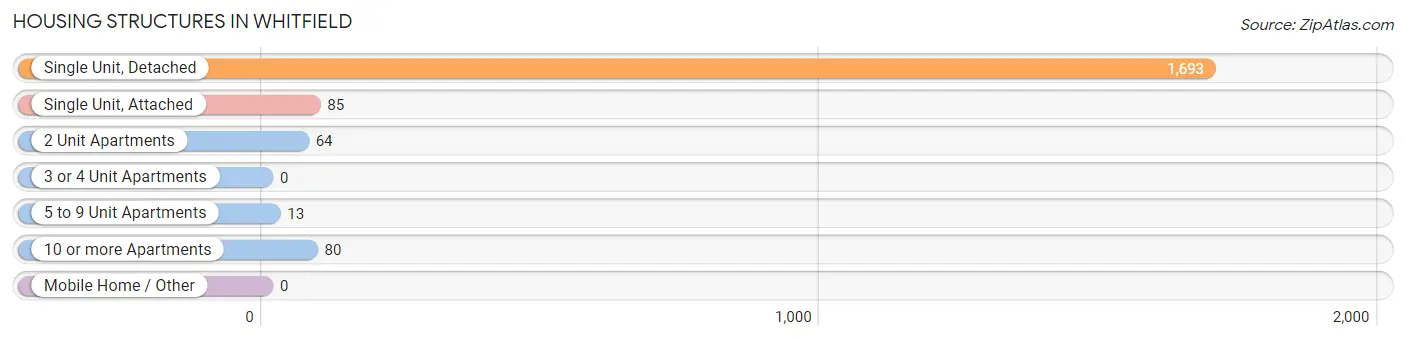
| Structure Type | # Housing Units | % Housing Units |
| Single Unit, Detached | 1,693 | 87.5% |
| Single Unit, Attached | 85 | 4.4% |
| 2 Unit Apartments | 64 | 3.3% |
| 3 or 4 Unit Apartments | 0 | 0.0% |
| 5 to 9 Unit Apartments | 13 | 0.7% |
| 10 or more Apartments | 80 | 4.1% |
| Mobile Home / Other | 0 | 0.0% |
| Total | 1,935 | 100.0% |
Housing Structures by Occupancy in Whitfield
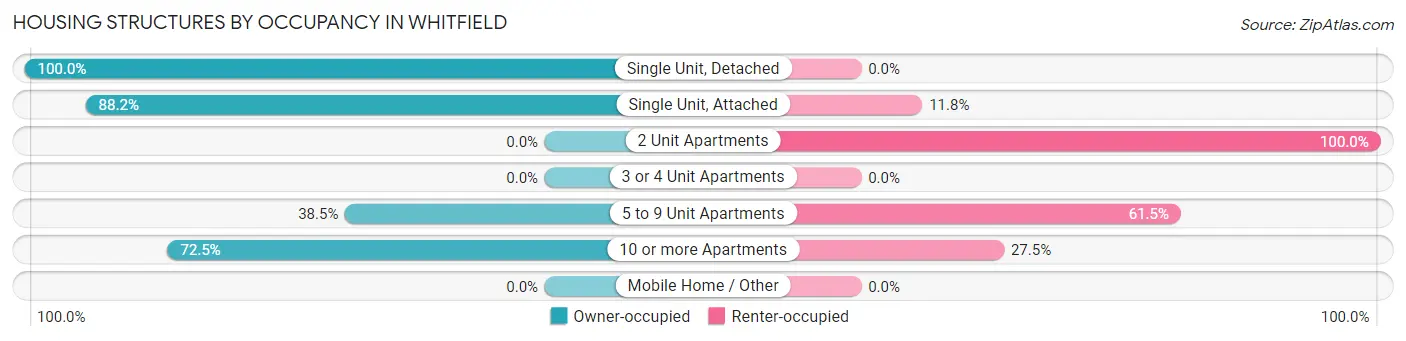
| Structure Type | Owner-occupied | Renter-occupied |
| Single Unit, Detached | 1,693 (100.0%) | 0 (0.0%) |
| Single Unit, Attached | 75 (88.2%) | 10 (11.8%) |
| 2 Unit Apartments | 0 (0.0%) | 64 (100.0%) |
| 3 or 4 Unit Apartments | 0 (0.0%) | 0 (0.0%) |
| 5 to 9 Unit Apartments | 5 (38.5%) | 8 (61.5%) |
| 10 or more Apartments | 58 (72.5%) | 22 (27.5%) |
| Mobile Home / Other | 0 (0.0%) | 0 (0.0%) |
| Total | 1,831 (94.6%) | 104 (5.4%) |
Housing Structures by Number of Rooms in Whitfield
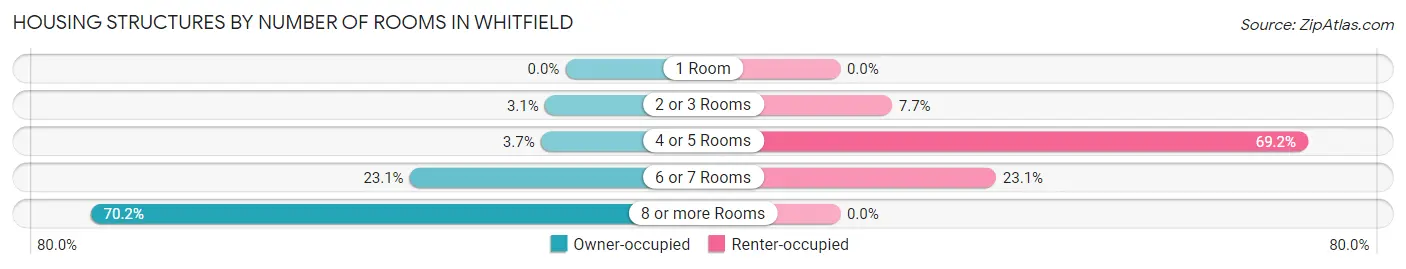
| Number of Rooms | Owner-occupied | Renter-occupied |
| 1 Room | 0 (0.0%) | 0 (0.0%) |
| 2 or 3 Rooms | 56 (3.1%) | 8 (7.7%) |
| 4 or 5 Rooms | 67 (3.7%) | 72 (69.2%) |
| 6 or 7 Rooms | 422 (23.1%) | 24 (23.1%) |
| 8 or more Rooms | 1,286 (70.2%) | 0 (0.0%) |
| Total | 1,831 (100.0%) | 104 (100.0%) |
Housing Structure by Heating Type in Whitfield
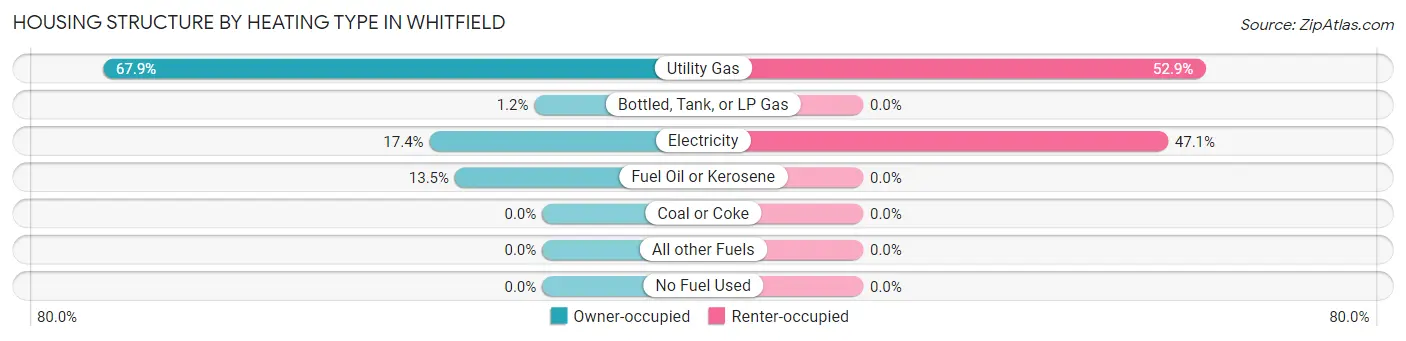
| Heating Type | Owner-occupied | Renter-occupied |
| Utility Gas | 1,243 (67.9%) | 55 (52.9%) |
| Bottled, Tank, or LP Gas | 22 (1.2%) | 0 (0.0%) |
| Electricity | 319 (17.4%) | 49 (47.1%) |
| Fuel Oil or Kerosene | 247 (13.5%) | 0 (0.0%) |
| Coal or Coke | 0 (0.0%) | 0 (0.0%) |
| All other Fuels | 0 (0.0%) | 0 (0.0%) |
| No Fuel Used | 0 (0.0%) | 0 (0.0%) |
| Total | 1,831 (100.0%) | 104 (100.0%) |
Household Vehicle Usage in Whitfield
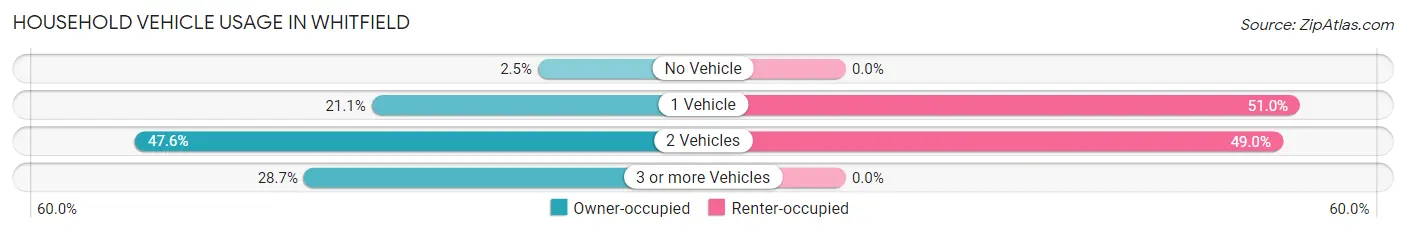
| Vehicles per Household | Owner-occupied | Renter-occupied |
| No Vehicle | 46 (2.5%) | 0 (0.0%) |
| 1 Vehicle | 387 (21.1%) | 53 (51.0%) |
| 2 Vehicles | 872 (47.6%) | 51 (49.0%) |
| 3 or more Vehicles | 526 (28.7%) | 0 (0.0%) |
| Total | 1,831 (100.0%) | 104 (100.0%) |
Real Estate & Mortgages in Whitfield
Real Estate and Mortgage Overview in Whitfield
| Characteristic | Without Mortgage | With Mortgage |
| Housing Units | 562 | 1,269 |
| Median Property Value | $291,100 | $261,300 |
| Median Household Income | $118,235 | $420 |
| Monthly Housing Costs | $878 | $111 |
| Real Estate Taxes | $5,699 | $0 |
Property Value by Mortgage Status in Whitfield
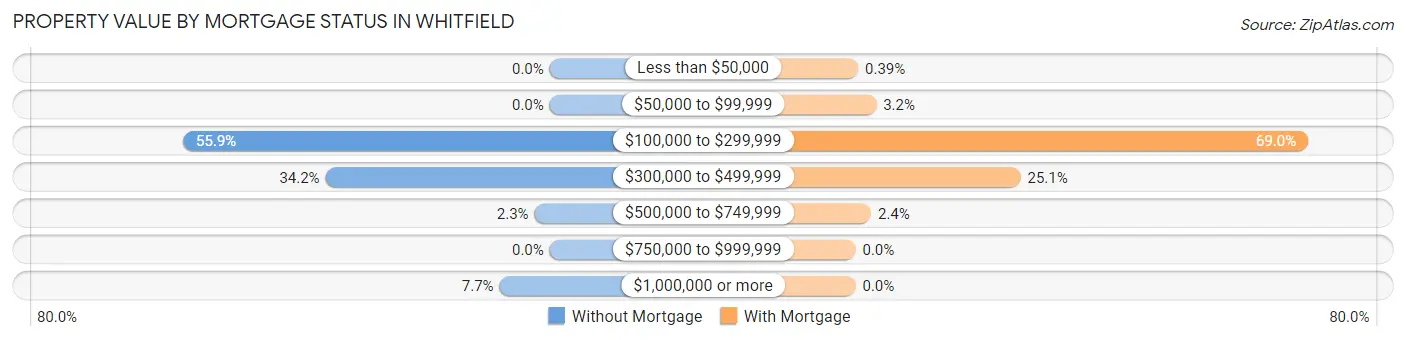
| Property Value | Without Mortgage | With Mortgage |
| Less than $50,000 | 0 (0.0%) | 5 (0.4%) |
| $50,000 to $99,999 | 0 (0.0%) | 40 (3.2%) |
| $100,000 to $299,999 | 314 (55.9%) | 875 (69.0%) |
| $300,000 to $499,999 | 192 (34.2%) | 319 (25.1%) |
| $500,000 to $749,999 | 13 (2.3%) | 30 (2.4%) |
| $750,000 to $999,999 | 0 (0.0%) | 0 (0.0%) |
| $1,000,000 or more | 43 (7.6%) | 0 (0.0%) |
| Total | 562 (100.0%) | 1,269 (100.0%) |
Household Income by Mortgage Status in Whitfield
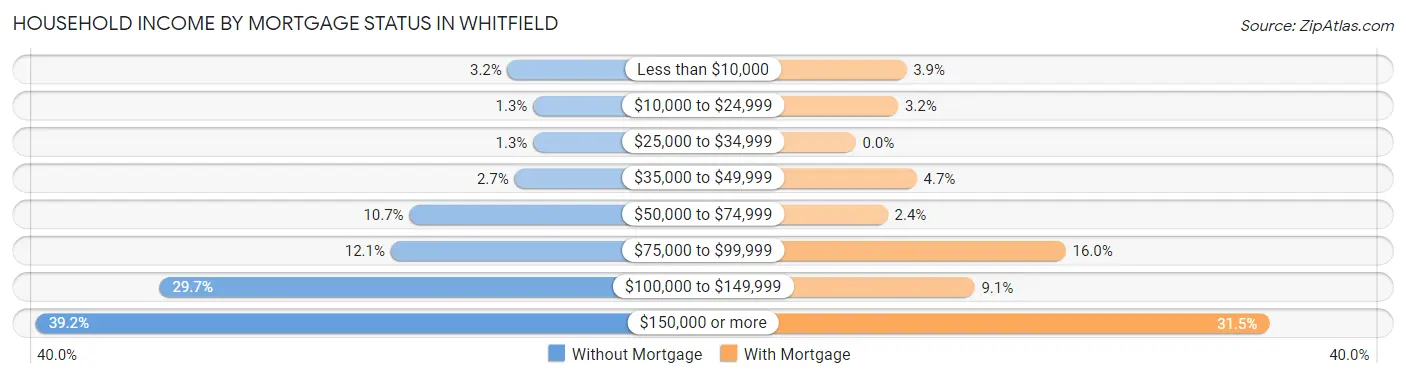
| Household Income | Without Mortgage | With Mortgage |
| Less than $10,000 | 18 (3.2%) | 49 (3.9%) |
| $10,000 to $24,999 | 7 (1.3%) | 41 (3.2%) |
| $25,000 to $34,999 | 7 (1.3%) | 0 (0.0%) |
| $35,000 to $49,999 | 15 (2.7%) | 59 (4.6%) |
| $50,000 to $74,999 | 60 (10.7%) | 31 (2.4%) |
| $75,000 to $99,999 | 68 (12.1%) | 203 (16.0%) |
| $100,000 to $149,999 | 167 (29.7%) | 115 (9.1%) |
| $150,000 or more | 220 (39.2%) | 400 (31.5%) |
| Total | 562 (100.0%) | 1,269 (100.0%) |
Property Value to Household Income Ratio in Whitfield
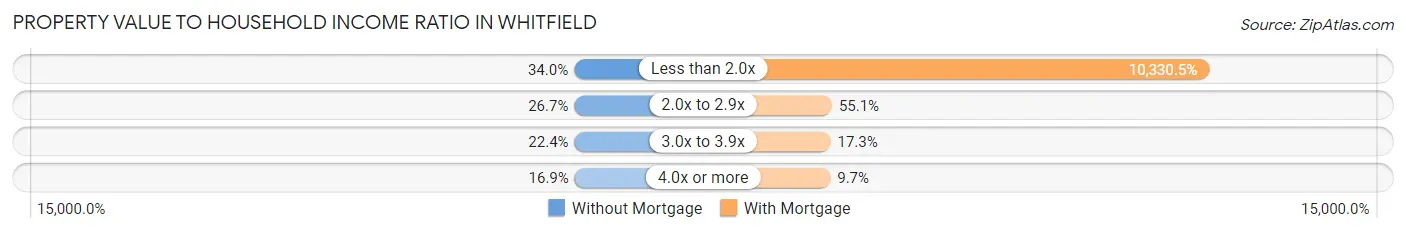
| Value-to-Income Ratio | Without Mortgage | With Mortgage |
| Less than 2.0x | 191 (34.0%) | 131,094 (10,330.5%) |
| 2.0x to 2.9x | 150 (26.7%) | 699 (55.1%) |
| 3.0x to 3.9x | 126 (22.4%) | 219 (17.3%) |
| 4.0x or more | 95 (16.9%) | 123 (9.7%) |
| Total | 562 (100.0%) | 1,269 (100.0%) |
Real Estate Taxes by Mortgage Status in Whitfield
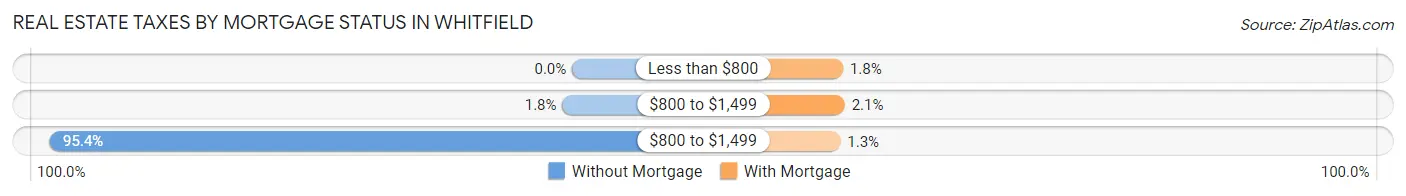
| Property Taxes | Without Mortgage | With Mortgage |
| Less than $800 | 0 (0.0%) | 23 (1.8%) |
| $800 to $1,499 | 10 (1.8%) | 27 (2.1%) |
| $800 to $1,499 | 536 (95.4%) | 17 (1.3%) |
| Total | 562 (100.0%) | 1,269 (100.0%) |
Health & Disability in Whitfield
Health Insurance Coverage by Age in Whitfield
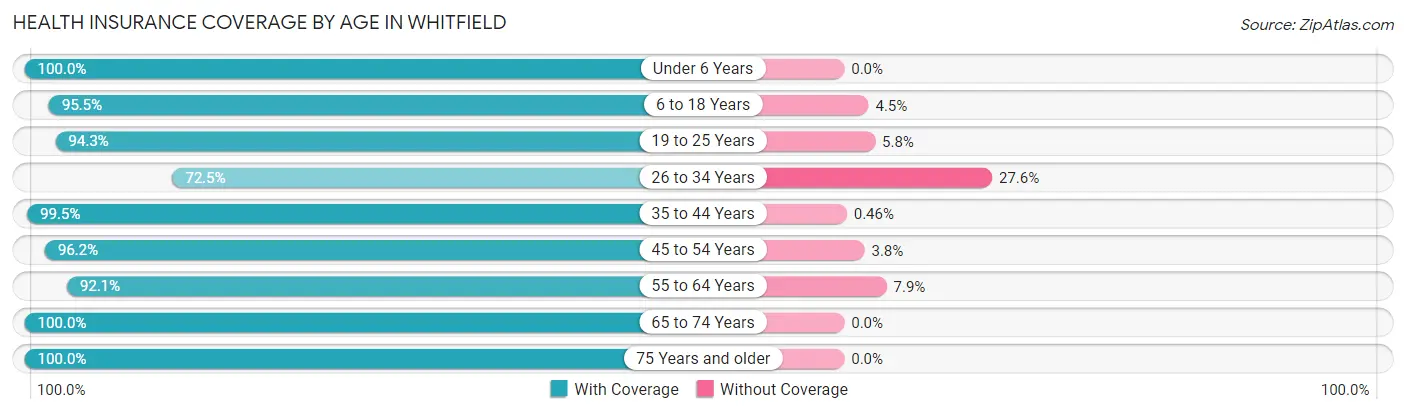
| Age Bracket | With Coverage | Without Coverage |
| Under 6 Years | 342 (100.0%) | 0 (0.0%) |
| 6 to 18 Years | 761 (95.5%) | 36 (4.5%) |
| 19 to 25 Years | 295 (94.3%) | 18 (5.8%) |
| 26 to 34 Years | 263 (72.5%) | 100 (27.6%) |
| 35 to 44 Years | 646 (99.5%) | 3 (0.5%) |
| 45 to 54 Years | 1,099 (96.2%) | 43 (3.8%) |
| 55 to 64 Years | 549 (92.1%) | 47 (7.9%) |
| 65 to 74 Years | 624 (100.0%) | 0 (0.0%) |
| 75 Years and older | 443 (100.0%) | 0 (0.0%) |
| Total | 5,022 (95.3%) | 247 (4.7%) |
Health Insurance Coverage by Citizenship Status in Whitfield
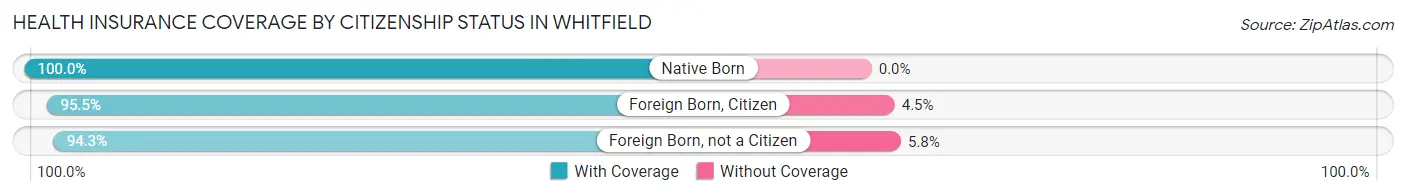
| Citizenship Status | With Coverage | Without Coverage |
| Native Born | 342 (100.0%) | 0 (0.0%) |
| Foreign Born, Citizen | 761 (95.5%) | 36 (4.5%) |
| Foreign Born, not a Citizen | 295 (94.3%) | 18 (5.8%) |
Health Insurance Coverage by Household Income in Whitfield
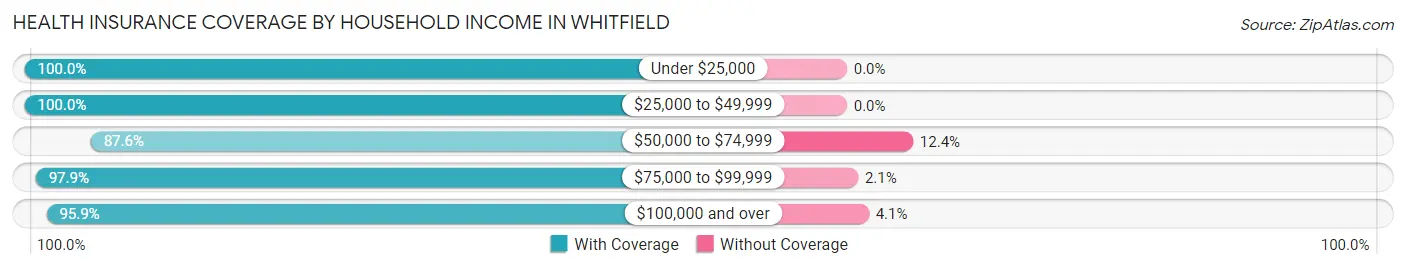
| Household Income | With Coverage | Without Coverage |
| Under $25,000 | 151 (100.0%) | 0 (0.0%) |
| $25,000 to $49,999 | 186 (100.0%) | 0 (0.0%) |
| $50,000 to $74,999 | 580 (87.6%) | 82 (12.4%) |
| $75,000 to $99,999 | 469 (97.9%) | 10 (2.1%) |
| $100,000 and over | 3,629 (95.9%) | 155 (4.1%) |
Public vs Private Health Insurance Coverage by Age in Whitfield
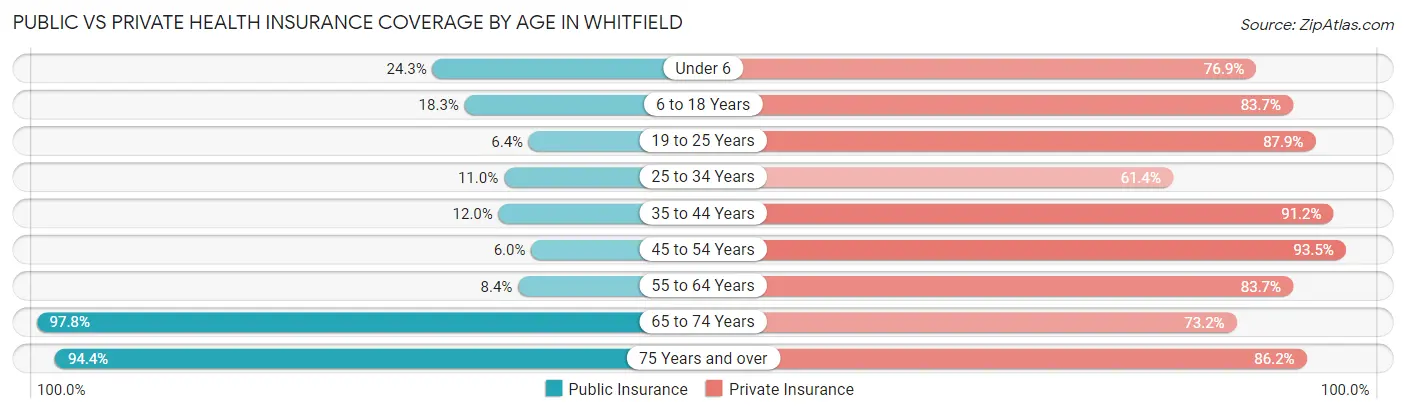
| Age Bracket | Public Insurance | Private Insurance |
| Under 6 | 83 (24.3%) | 263 (76.9%) |
| 6 to 18 Years | 146 (18.3%) | 667 (83.7%) |
| 19 to 25 Years | 20 (6.4%) | 275 (87.9%) |
| 25 to 34 Years | 40 (11.0%) | 223 (61.4%) |
| 35 to 44 Years | 78 (12.0%) | 592 (91.2%) |
| 45 to 54 Years | 68 (5.9%) | 1,068 (93.5%) |
| 55 to 64 Years | 50 (8.4%) | 499 (83.7%) |
| 65 to 74 Years | 610 (97.8%) | 457 (73.2%) |
| 75 Years and over | 418 (94.4%) | 382 (86.2%) |
| Total | 1,513 (28.7%) | 4,426 (84.0%) |
Disability Status by Sex by Age in Whitfield
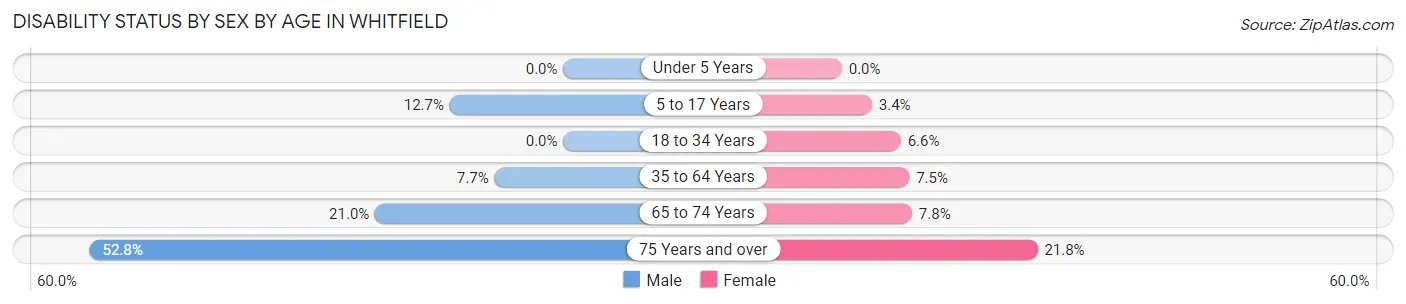
| Age Bracket | Male | Female |
| Under 5 Years | 0 (0.0%) | 0 (0.0%) |
| 5 to 17 Years | 62 (12.7%) | 12 (3.4%) |
| 18 to 34 Years | 0 (0.0%) | 25 (6.6%) |
| 35 to 64 Years | 84 (7.7%) | 97 (7.5%) |
| 65 to 74 Years | 61 (21.0%) | 26 (7.8%) |
| 75 Years and over | 86 (52.8%) | 61 (21.8%) |
Disability Class by Sex by Age in Whitfield
Disability Class: Hearing Difficulty
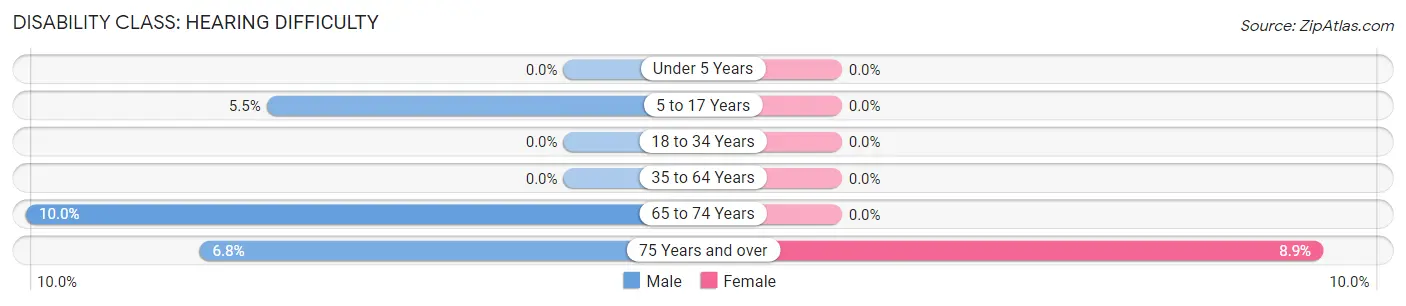
| Age Bracket | Male | Female |
| Under 5 Years | 0 (0.0%) | 0 (0.0%) |
| 5 to 17 Years | 27 (5.5%) | 0 (0.0%) |
| 18 to 34 Years | 0 (0.0%) | 0 (0.0%) |
| 35 to 64 Years | 0 (0.0%) | 0 (0.0%) |
| 65 to 74 Years | 29 (10.0%) | 0 (0.0%) |
| 75 Years and over | 11 (6.8%) | 25 (8.9%) |
Disability Class: Vision Difficulty
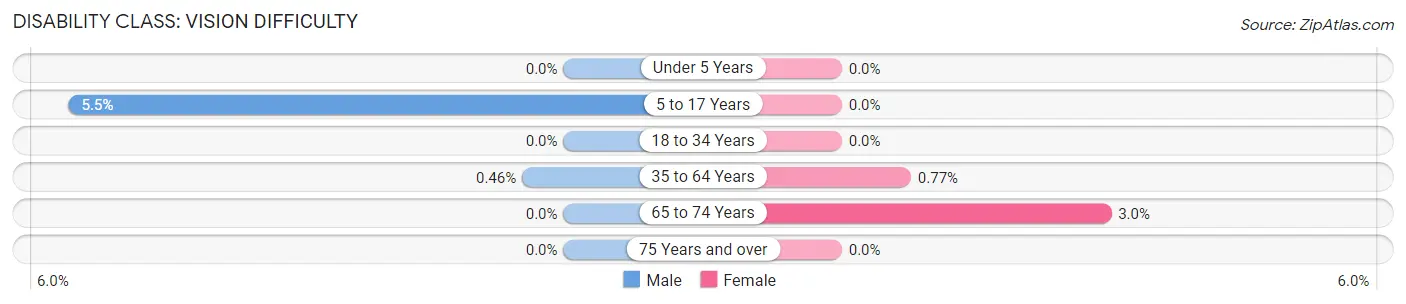
| Age Bracket | Male | Female |
| Under 5 Years | 0 (0.0%) | 0 (0.0%) |
| 5 to 17 Years | 27 (5.5%) | 0 (0.0%) |
| 18 to 34 Years | 0 (0.0%) | 0 (0.0%) |
| 35 to 64 Years | 5 (0.5%) | 10 (0.8%) |
| 65 to 74 Years | 0 (0.0%) | 10 (3.0%) |
| 75 Years and over | 0 (0.0%) | 0 (0.0%) |
Disability Class: Cognitive Difficulty
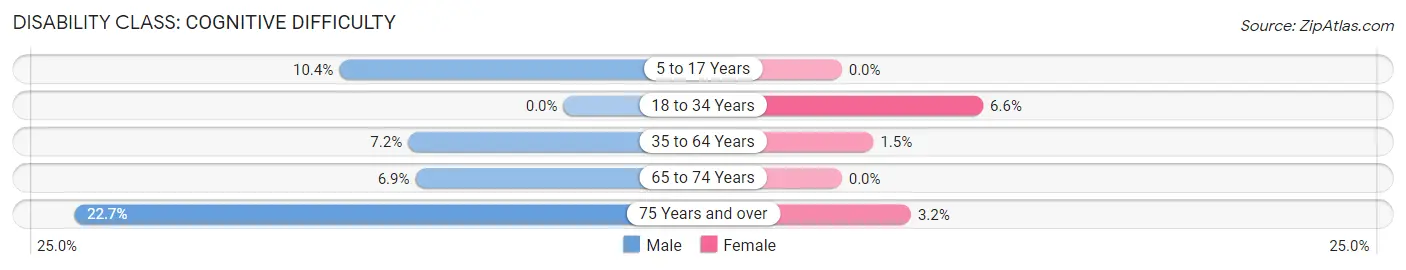
| Age Bracket | Male | Female |
| 5 to 17 Years | 51 (10.4%) | 0 (0.0%) |
| 18 to 34 Years | 0 (0.0%) | 25 (6.6%) |
| 35 to 64 Years | 79 (7.2%) | 19 (1.5%) |
| 65 to 74 Years | 20 (6.9%) | 0 (0.0%) |
| 75 Years and over | 37 (22.7%) | 9 (3.2%) |
Disability Class: Ambulatory Difficulty
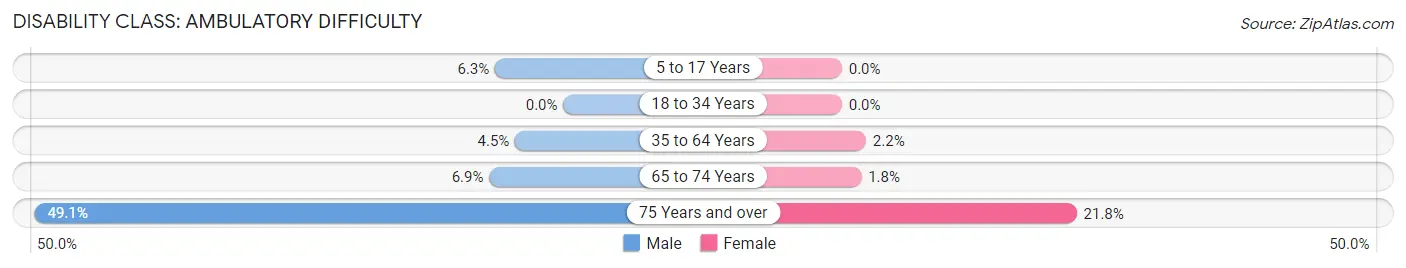
| Age Bracket | Male | Female |
| 5 to 17 Years | 31 (6.3%) | 0 (0.0%) |
| 18 to 34 Years | 0 (0.0%) | 0 (0.0%) |
| 35 to 64 Years | 49 (4.5%) | 29 (2.2%) |
| 65 to 74 Years | 20 (6.9%) | 6 (1.8%) |
| 75 Years and over | 80 (49.1%) | 61 (21.8%) |
Disability Class: Self-Care Difficulty
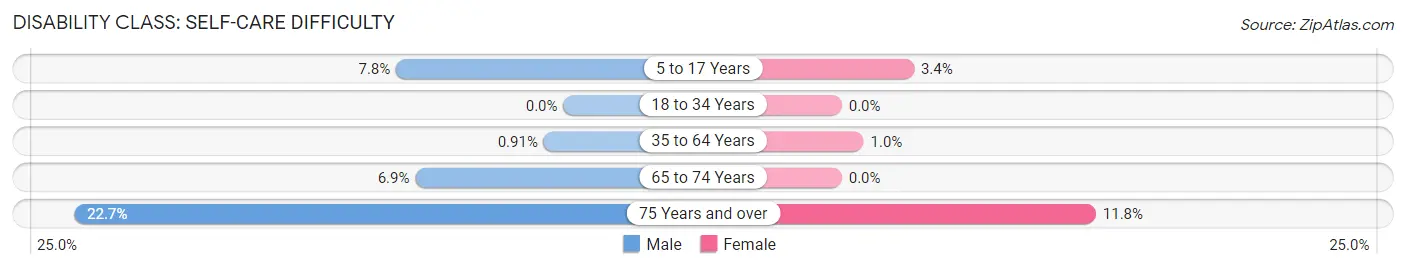
| Age Bracket | Male | Female |
| 5 to 17 Years | 38 (7.8%) | 12 (3.4%) |
| 18 to 34 Years | 0 (0.0%) | 0 (0.0%) |
| 35 to 64 Years | 10 (0.9%) | 13 (1.0%) |
| 65 to 74 Years | 20 (6.9%) | 0 (0.0%) |
| 75 Years and over | 37 (22.7%) | 33 (11.8%) |
Technology Access in Whitfield
Computing Device Access in Whitfield
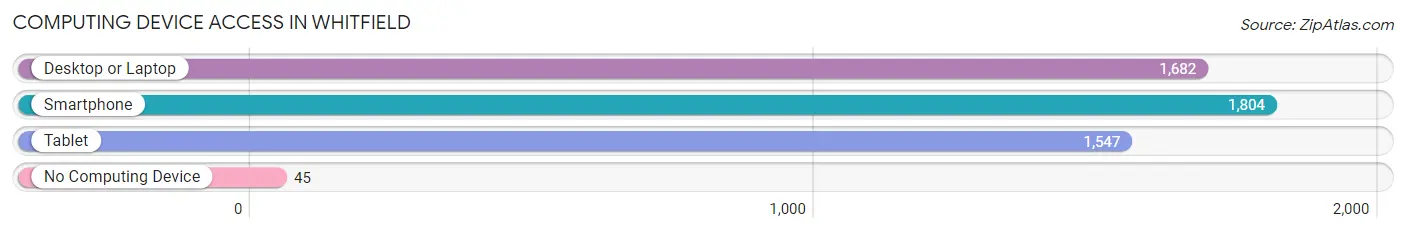
| Device Type | # Households | % Households |
| Desktop or Laptop | 1,682 | 86.9% |
| Smartphone | 1,804 | 93.2% |
| Tablet | 1,547 | 79.9% |
| No Computing Device | 45 | 2.3% |
| Total | 1,935 | 100.0% |
Internet Access in Whitfield
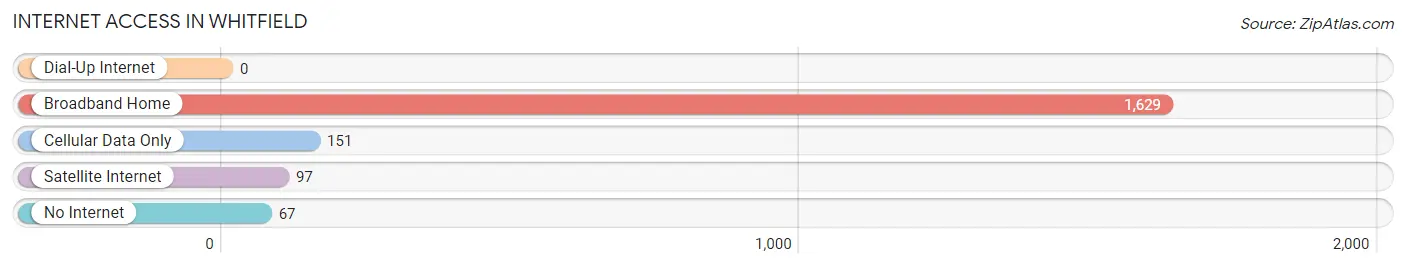
| Internet Type | # Households | % Households |
| Dial-Up Internet | 0 | 0.0% |
| Broadband Home | 1,629 | 84.2% |
| Cellular Data Only | 151 | 7.8% |
| Satellite Internet | 97 | 5.0% |
| No Internet | 67 | 3.5% |
| Total | 1,935 | 100.0% |
Whitfield Summary
Whitfield is a small borough located in the Allegheny Mountains of Pennsylvania. It is situated in the northern part of the state, about 25 miles south of the state capital of Harrisburg. The borough is part of the greater Scranton-Wilkes-Barre metropolitan area and is home to a population of just over 1,000 people.
History
The area that is now Whitfield was first settled in the late 1700s by a group of German immigrants. The town was originally known as “Whitefield”, after the white clay found in the area. The name was later changed to Whitfield in 1845.
The town was officially incorporated in 1851 and quickly became a center of industry. The town was home to several coal mines, as well as a number of factories and mills. The town also had a thriving lumber industry, with several sawmills located in the area.
The town experienced a period of growth in the late 19th and early 20th centuries, with the population reaching its peak of 1,500 in 1910. However, the Great Depression and the decline of the coal industry in the area led to a period of economic decline. The population of the town has remained relatively stable since then, with the current population estimated at just over 1,000 people.
Geography
Whitfield is located in the northern part of Pennsylvania, in the Allegheny Mountains. The borough is situated in Lackawanna County, about 25 miles south of the state capital of Harrisburg. The town is located in a valley, surrounded by hills and mountains. The town is situated along the Lackawanna River, which provides a source of water for the town.
The climate in Whitfield is typical of the region, with cold winters and warm summers. The average annual temperature is around 50 degrees Fahrenheit, with an average annual precipitation of around 40 inches.
Economy
The economy of Whitfield is largely based on the service industry. The town is home to a number of small businesses, including restaurants, retail stores, and professional services. The town is also home to a number of manufacturing companies, including a paper mill and a plastics factory.
The town is also home to a number of tourist attractions, including a historic train station and a number of outdoor recreation areas. The town is also home to a number of festivals and events throughout the year, including the Whitfield County Fair and the Whitfield County Music Festival.
Demographics
The population of Whitfield is estimated to be just over 1,000 people. The town is predominantly white, with a small minority population. The median household income in the town is around $40,000, and the median home value is around $100,000. The town has a low unemployment rate, with most of the population employed in the service industry.
Whitfield is a small town with a rich history and a vibrant economy. The town is home to a diverse population and a number of attractions and events. The town is a great place to live and work, and is a great place to visit for those looking for a unique experience.
Common Questions
What is Per Capita Income in Whitfield?
Per Capita income in Whitfield is $54,428.
What is the Median Family Income in Whitfield?
Median Family Income in Whitfield is $136,004.
What is the Median Household income in Whitfield?
Median Household Income in Whitfield is $123,750.
What is Income or Wage Gap in Whitfield?
Income or Wage Gap in Whitfield is 16.1%.
Women in Whitfield earn 83.9 cents for every dollar earned by a man.
What is Inequality or Gini Index in Whitfield?
Inequality or Gini Index in Whitfield is 0.37.
What is the Total Population of Whitfield?
Total Population of Whitfield is 5,269.
What is the Total Male Population of Whitfield?
Total Male Population of Whitfield is 2,437.
What is the Total Female Population of Whitfield?
Total Female Population of Whitfield is 2,832.
What is the Ratio of Males per 100 Females in Whitfield?
There are 86.05 Males per 100 Females in Whitfield.
What is the Ratio of Females per 100 Males in Whitfield?
There are 116.21 Females per 100 Males in Whitfield.
What is the Median Population Age in Whitfield?
Median Population Age in Whitfield is 46.6 Years.
What is the Average Family Size in Whitfield
Average Family Size in Whitfield is 3.2 People.
What is the Average Household Size in Whitfield
Average Household Size in Whitfield is 2.7 People.
How Large is the Labor Force in Whitfield?
There are 2,978 People in the Labor Forcein in Whitfield.
What is the Percentage of People in the Labor Force in Whitfield?
70.2% of People are in the Labor Force in Whitfield.
What is the Unemployment Rate in Whitfield?
Unemployment Rate in Whitfield is 2.0%.