Woodbourne, PA Map & Demographics
Woodbourne Map
Woodbourne Overview
$76,184
PER CAPITA INCOME
$176,972
AVG FAMILY INCOME
$163,083
AVG HOUSEHOLD INCOME
22.0%
WAGE / INCOME GAP [ % ]
78.0¢/ $1
WAGE / INCOME GAP [ $ ]
0.42
INEQUALITY / GINI INDEX
3,348
TOTAL POPULATION
1,606
MALE POPULATION
1,742
FEMALE POPULATION
92.19
MALES / 100 FEMALES
108.47
FEMALES / 100 MALES
48.7
MEDIAN AGE
3.0
AVG FAMILY SIZE
2.6
AVG HOUSEHOLD SIZE
2,028
LABOR FORCE [ PEOPLE ]
71.4%
PERCENT IN LABOR FORCE
4.4%
UNEMPLOYMENT RATE
Income in Woodbourne
Income Overview in Woodbourne
Per Capita Income in Woodbourne is $76,184, while median incomes of families and households are $176,972 and $163,083 respectively.
| Characteristic | Number | Measure |
| Per Capita Income | 3,348 | $76,184 |
| Median Family Income | 1,046 | $176,972 |
| Mean Family Income | 1,046 | $228,804 |
| Median Household Income | 1,267 | $163,083 |
| Mean Household Income | 1,267 | $203,958 |
| Income Deficit | 1,046 | $0 |
| Wage / Income Gap (%) | 3,348 | 21.97% |
| Wage / Income Gap ($) | 3,348 | 78.03¢ per $1 |
| Gini / Inequality Index | 3,348 | 0.42 |
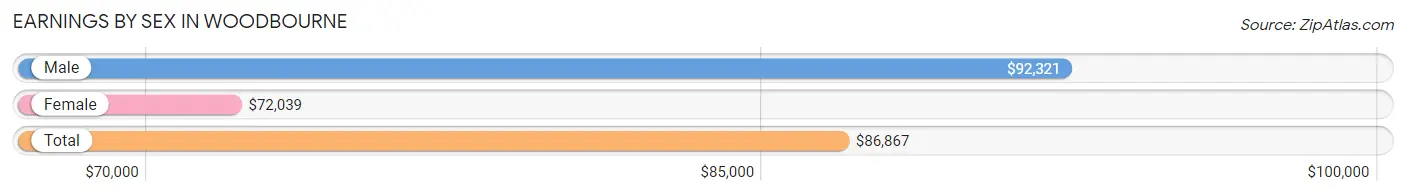
Earnings by Sex in Woodbourne
Average Earnings in Woodbourne are $86,867, $92,321 for men and $72,039 for women, a difference of 22.0%.
| Sex | Number | Average Earnings |
| Male | 1,110 (54.4%) | $92,321 |
| Female | 931 (45.6%) | $72,039 |
| Total | 2,041 (100.0%) | $86,867 |
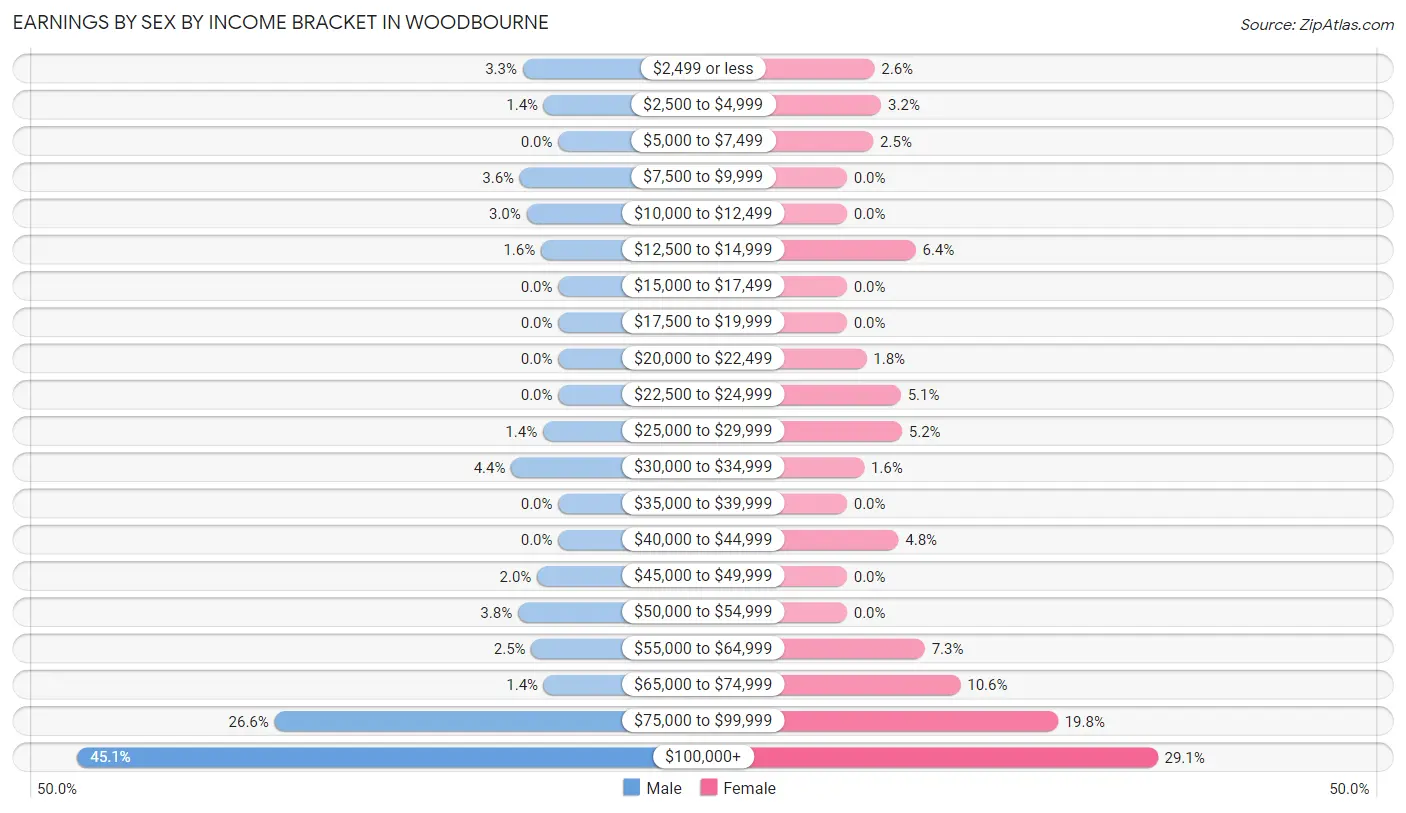
Earnings by Sex by Income Bracket in Woodbourne
The most common earnings brackets in Woodbourne are $100,000+ for men (500 | 45.1%) and $100,000+ for women (271 | 29.1%).
| Income | Male | Female |
| $2,499 or less | 37 (3.3%) | 24 (2.6%) |
| $2,500 to $4,999 | 15 (1.3%) | 30 (3.2%) |
| $5,000 to $7,499 | 0 (0.0%) | 23 (2.5%) |
| $7,500 to $9,999 | 40 (3.6%) | 0 (0.0%) |
| $10,000 to $12,499 | 33 (3.0%) | 0 (0.0%) |
| $12,500 to $14,999 | 18 (1.6%) | 60 (6.4%) |
| $15,000 to $17,499 | 0 (0.0%) | 0 (0.0%) |
| $17,500 to $19,999 | 0 (0.0%) | 0 (0.0%) |
| $20,000 to $22,499 | 0 (0.0%) | 17 (1.8%) |
| $22,500 to $24,999 | 0 (0.0%) | 47 (5.1%) |
| $25,000 to $29,999 | 16 (1.4%) | 48 (5.2%) |
| $30,000 to $34,999 | 49 (4.4%) | 15 (1.6%) |
| $35,000 to $39,999 | 0 (0.0%) | 0 (0.0%) |
| $40,000 to $44,999 | 0 (0.0%) | 45 (4.8%) |
| $45,000 to $49,999 | 22 (2.0%) | 0 (0.0%) |
| $50,000 to $54,999 | 42 (3.8%) | 0 (0.0%) |
| $55,000 to $64,999 | 28 (2.5%) | 68 (7.3%) |
| $65,000 to $74,999 | 15 (1.3%) | 99 (10.6%) |
| $75,000 to $99,999 | 295 (26.6%) | 184 (19.8%) |
| $100,000+ | 500 (45.1%) | 271 (29.1%) |
| Total | 1,110 (100.0%) | 931 (100.0%) |
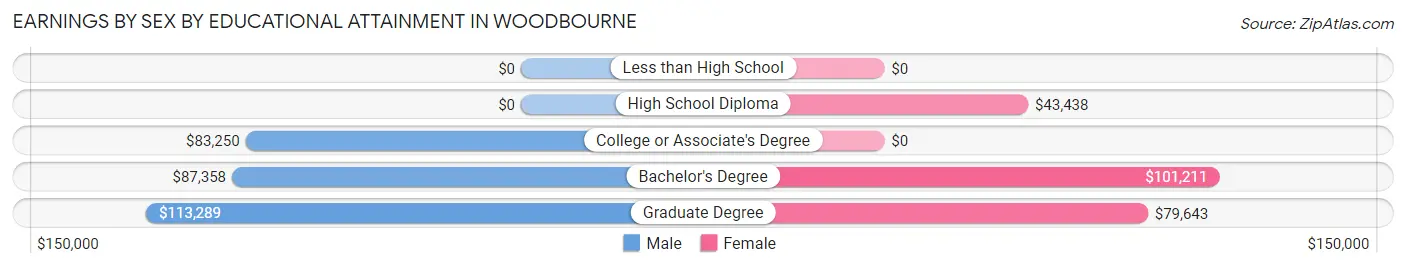
Earnings by Sex by Educational Attainment in Woodbourne
Average earnings in Woodbourne are $93,565 for men and $80,600 for women, a difference of 13.9%. Men with an educational attainment of graduate degree enjoy the highest average annual earnings of $113,289, while those with college or associate's degree education earn the least with $83,250. Women with an educational attainment of bachelor's degree earn the most with the average annual earnings of $101,211, while those with high school diploma education have the smallest earnings of $43,438.
| Educational Attainment | Male Income | Female Income |
| Less than High School | - | - |
| High School Diploma | - | - |
| College or Associate's Degree | $83,250 | $0 |
| Bachelor's Degree | $87,358 | $101,211 |
| Graduate Degree | $113,289 | $79,643 |
| Total | $93,565 | $80,600 |
Family Income in Woodbourne
Family Income Brackets in Woodbourne
According to the Woodbourne family income data, there are 453 families falling into the $200,000+ income range, which is the most common income bracket and makes up 43.3% of all families.
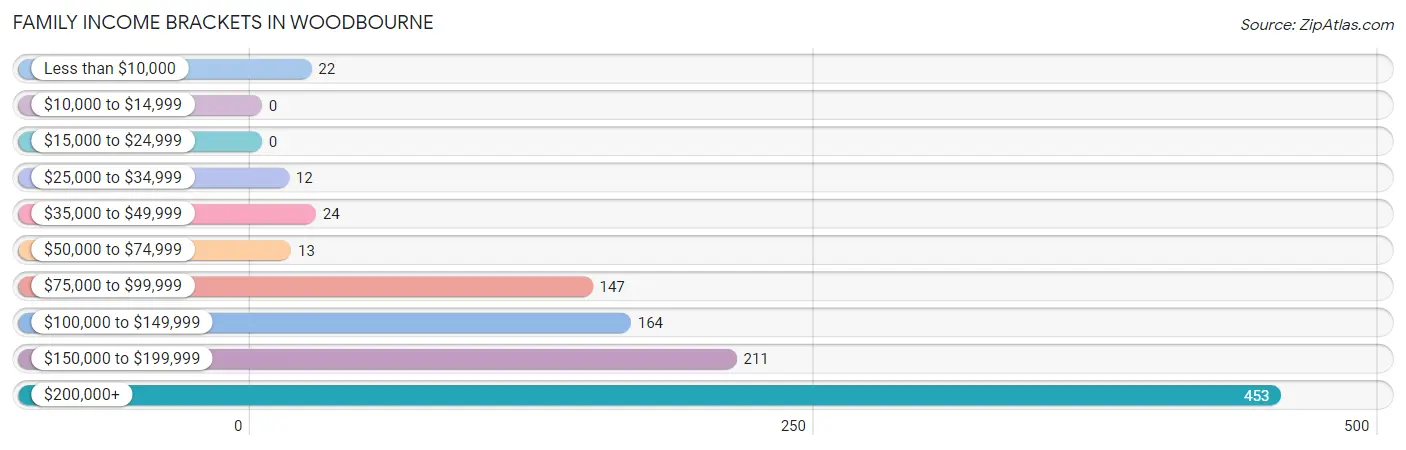
| Income Bracket | # Families | % Families |
| Less than $10,000 | 22 | 2.1% |
| $10,000 to $14,999 | 0 | 0.0% |
| $15,000 to $24,999 | 0 | 0.0% |
| $25,000 to $34,999 | 12 | 1.1% |
| $35,000 to $49,999 | 24 | 2.3% |
| $50,000 to $74,999 | 13 | 1.2% |
| $75,000 to $99,999 | 147 | 14.1% |
| $100,000 to $149,999 | 164 | 15.7% |
| $150,000 to $199,999 | 211 | 20.2% |
| $200,000+ | 453 | 43.3% |
Family Income by Famaliy Size in Woodbourne
5-person families (87 | 8.3%) account for the highest median family income in Woodbourne with $225,208 per family, while 3-person families (219 | 20.9%) have the highest median income of $74,661 per family member.
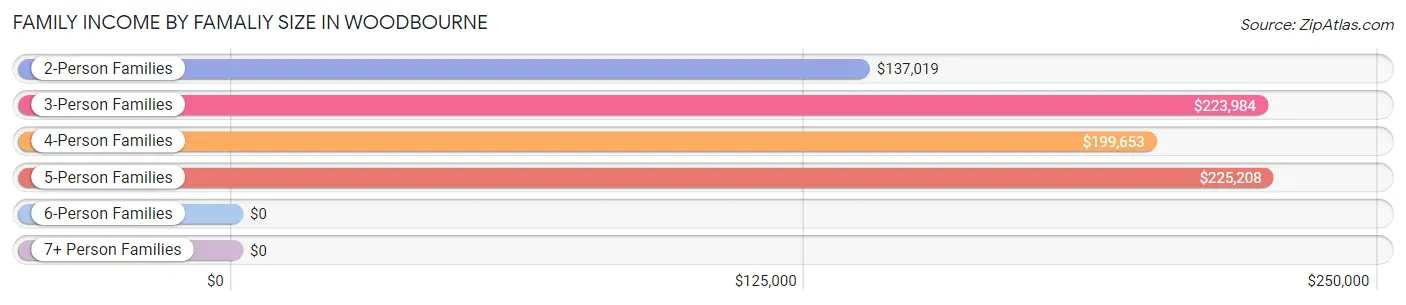
| Income Bracket | # Families | Median Income |
| 2-Person Families | 515 (49.2%) | $137,019 |
| 3-Person Families | 219 (20.9%) | $223,984 |
| 4-Person Families | 225 (21.5%) | $199,653 |
| 5-Person Families | 87 (8.3%) | $225,208 |
| 6-Person Families | 0 (0.0%) | $0 |
| 7+ Person Families | 0 (0.0%) | $0 |
| Total | 1,046 (100.0%) | $176,972 |
Family Income by Number of Earners in Woodbourne
The median family income in Woodbourne is $176,972, with families comprising 3+ earners (125) having the highest median family income of $250,001, while families with no earners (78) have the lowest median family income of $53,462, accounting for 11.9% and 7.5% of families, respectively.
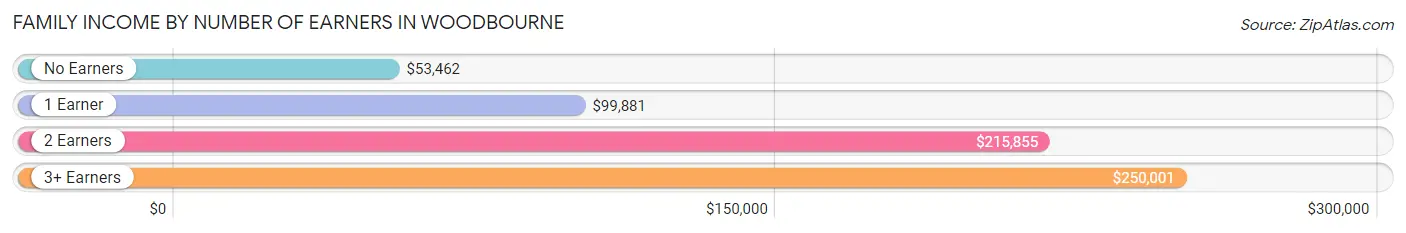
| Number of Earners | # Families | Median Income |
| No Earners | 78 (7.5%) | $53,462 |
| 1 Earner | 248 (23.7%) | $99,881 |
| 2 Earners | 595 (56.9%) | $215,855 |
| 3+ Earners | 125 (11.9%) | $250,001 |
| Total | 1,046 (100.0%) | $176,972 |
Household Income in Woodbourne
Household Income Brackets in Woodbourne
With 480 households falling in the category, the $200,000+ income range is the most frequent in Woodbourne, accounting for 37.9% of all households.
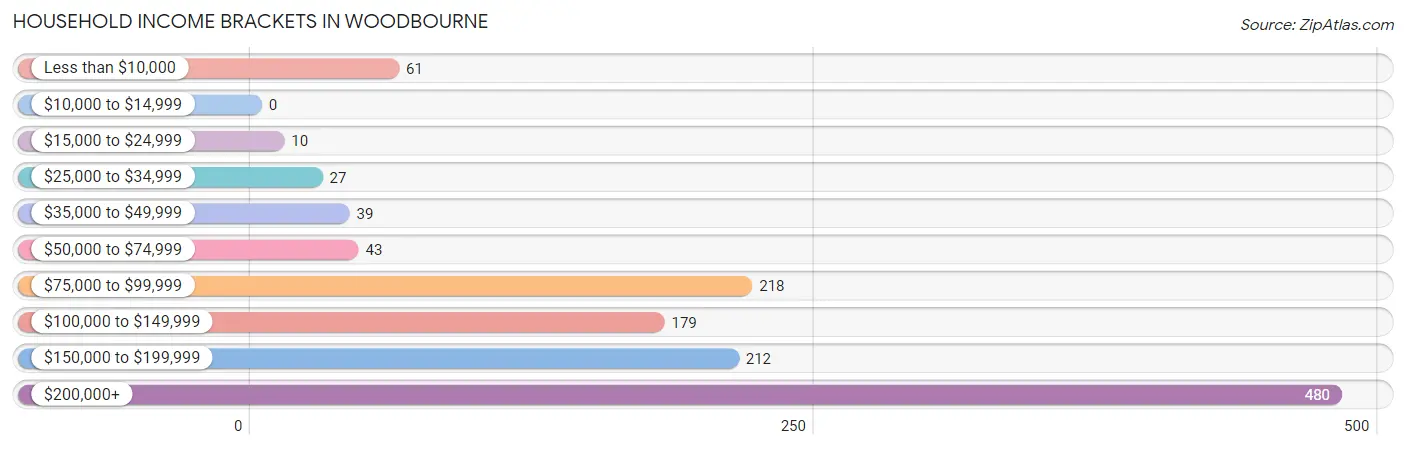
| Income Bracket | # Households | % Households |
| Less than $10,000 | 61 | 4.8% |
| $10,000 to $14,999 | 0 | 0.0% |
| $15,000 to $24,999 | 10 | 0.8% |
| $25,000 to $34,999 | 27 | 2.1% |
| $35,000 to $49,999 | 39 | 3.1% |
| $50,000 to $74,999 | 43 | 3.4% |
| $75,000 to $99,999 | 218 | 17.2% |
| $100,000 to $149,999 | 179 | 14.1% |
| $150,000 to $199,999 | 212 | 16.7% |
| $200,000+ | 480 | 37.9% |
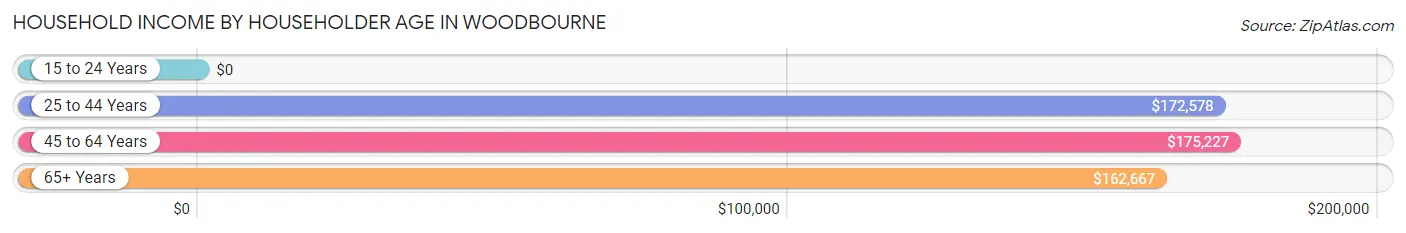
Household Income by Householder Age in Woodbourne
The median household income in Woodbourne is $163,083, with the highest median household income of $175,227 found in the 45 to 64 years age bracket for the primary householder. A total of 592 households (46.7%) fall into this category.
| Income Bracket | # Households | Median Income |
| 15 to 24 Years | 0 (0.0%) | $0 |
| 25 to 44 Years | 377 (29.8%) | $172,578 |
| 45 to 64 Years | 592 (46.7%) | $175,227 |
| 65+ Years | 298 (23.5%) | $162,667 |
| Total | 1,267 (100.0%) | $163,083 |
Poverty in Woodbourne
Income Below Poverty by Sex and Age in Woodbourne
With 5.3% poverty level for males and 5.0% for females among the residents of Woodbourne, 15 year old males and 12 to 14 year old females are the most vulnerable to poverty, with 24 males (100.0%) and 24 females (100.0%) in their respective age groups living below the poverty level.
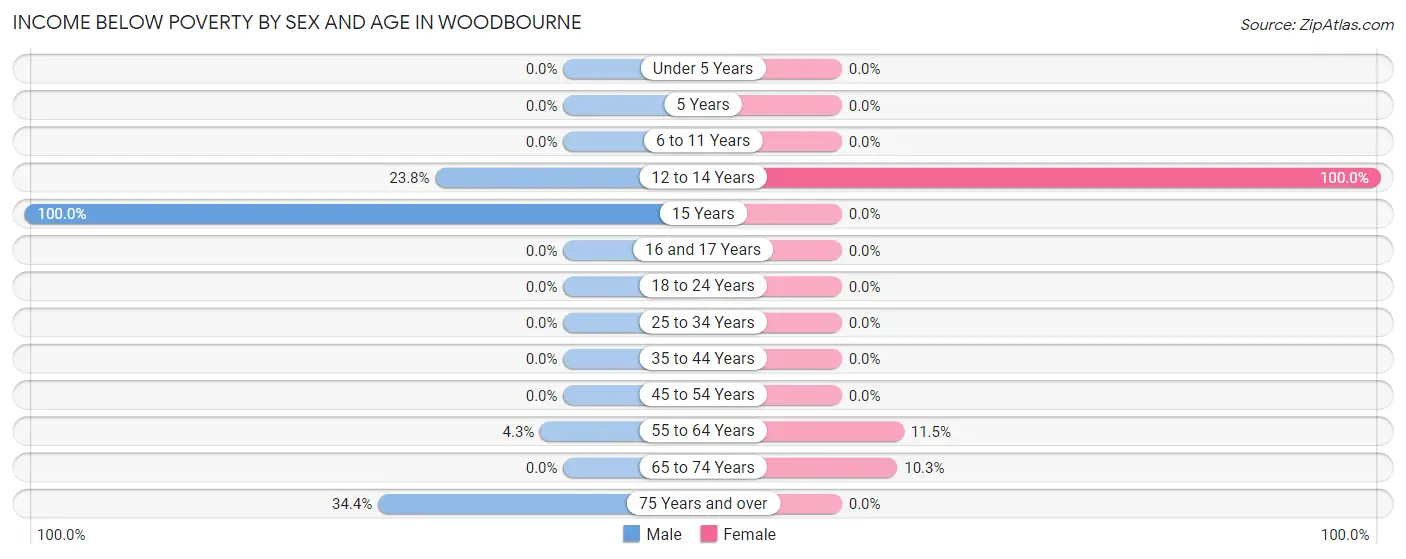
| Age Bracket | Male | Female |
| Under 5 Years | 0 (0.0%) | 0 (0.0%) |
| 5 Years | 0 (0.0%) | 0 (0.0%) |
| 6 to 11 Years | 0 (0.0%) | 0 (0.0%) |
| 12 to 14 Years | 24 (23.8%) | 24 (100.0%) |
| 15 Years | 24 (100.0%) | 0 (0.0%) |
| 16 and 17 Years | 0 (0.0%) | 0 (0.0%) |
| 18 to 24 Years | 0 (0.0%) | 0 (0.0%) |
| 25 to 34 Years | 0 (0.0%) | 0 (0.0%) |
| 35 to 44 Years | 0 (0.0%) | 0 (0.0%) |
| 45 to 54 Years | 0 (0.0%) | 0 (0.0%) |
| 55 to 64 Years | 15 (4.3%) | 39 (11.5%) |
| 65 to 74 Years | 0 (0.0%) | 24 (10.3%) |
| 75 Years and over | 22 (34.4%) | 0 (0.0%) |
| Total | 85 (5.3%) | 87 (5.0%) |
Income Above Poverty by Sex and Age in Woodbourne
According to the poverty statistics in Woodbourne, males aged under 5 years and females aged under 5 years are the age groups that are most secure financially, with 100.0% of males and 100.0% of females in these age groups living above the poverty line.
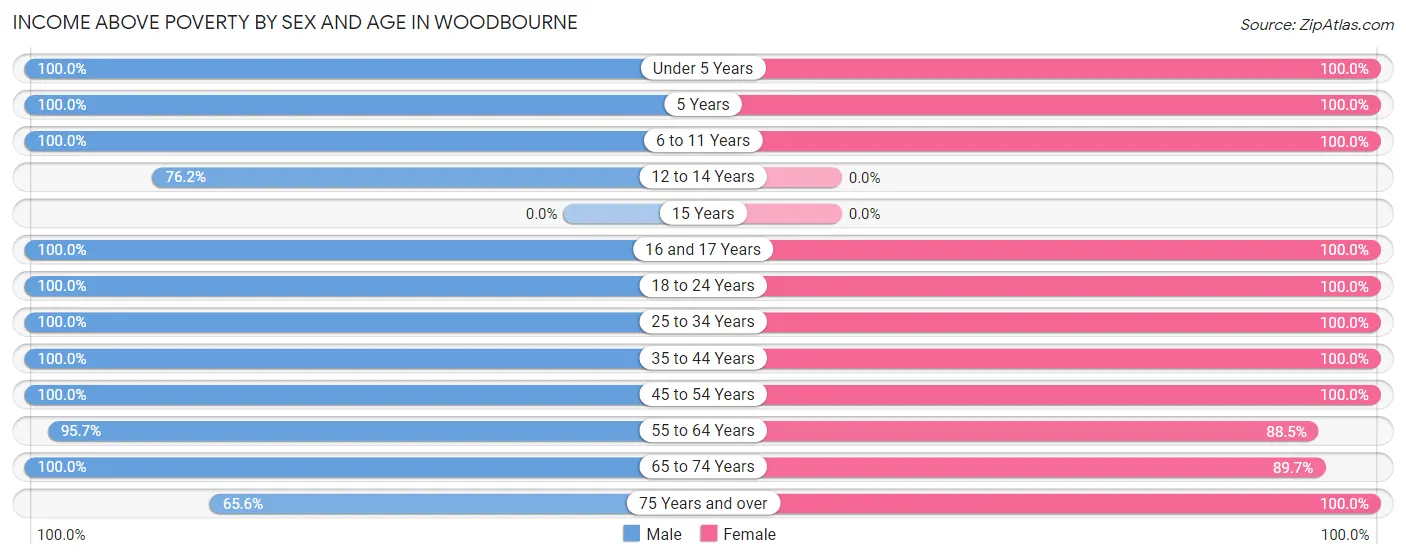
| Age Bracket | Male | Female |
| Under 5 Years | 56 (100.0%) | 84 (100.0%) |
| 5 Years | 33 (100.0%) | 15 (100.0%) |
| 6 to 11 Years | 114 (100.0%) | 57 (100.0%) |
| 12 to 14 Years | 77 (76.2%) | 0 (0.0%) |
| 15 Years | 0 (0.0%) | 0 (0.0%) |
| 16 and 17 Years | 26 (100.0%) | 20 (100.0%) |
| 18 to 24 Years | 35 (100.0%) | 104 (100.0%) |
| 25 to 34 Years | 194 (100.0%) | 272 (100.0%) |
| 35 to 44 Years | 176 (100.0%) | 205 (100.0%) |
| 45 to 54 Years | 178 (100.0%) | 107 (100.0%) |
| 55 to 64 Years | 334 (95.7%) | 300 (88.5%) |
| 65 to 74 Years | 256 (100.0%) | 209 (89.7%) |
| 75 Years and over | 42 (65.6%) | 282 (100.0%) |
| Total | 1,521 (94.7%) | 1,655 (95.0%) |
Income Below Poverty Among Married-Couple Families in Woodbourne
The poverty statistics for married-couple families in Woodbourne show that 2.4% or 22 of the total 917 families live below the poverty line. Families with 3 or 4 children have the highest poverty rate of 36.7%, comprising of 22 families. On the other hand, families with no children have the lowest poverty rate of 0.0%, which includes 0 families.
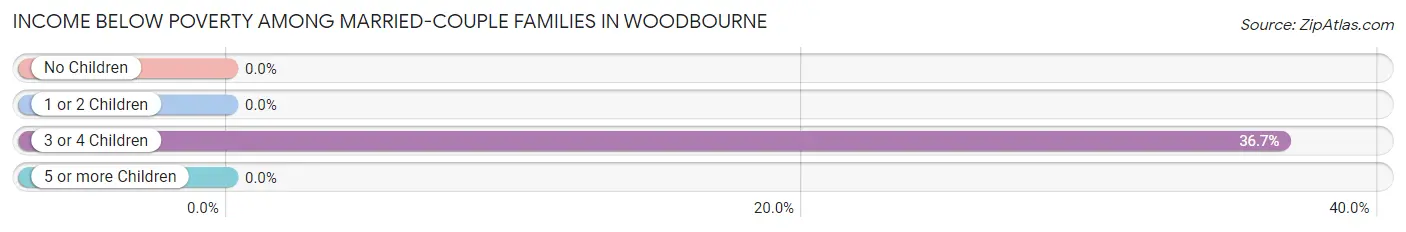
| Children | Above Poverty | Below Poverty |
| No Children | 564 (100.0%) | 0 (0.0%) |
| 1 or 2 Children | 293 (100.0%) | 0 (0.0%) |
| 3 or 4 Children | 38 (63.3%) | 22 (36.7%) |
| 5 or more Children | 0 (0.0%) | 0 (0.0%) |
| Total | 895 (97.6%) | 22 (2.4%) |
Income Below Poverty Among Single-Parent Households in Woodbourne
| Children | Single Father | Single Mother |
| No Children | 0 (0.0%) | 0 (0.0%) |
| 1 or 2 Children | 0 (0.0%) | 0 (0.0%) |
| 3 or 4 Children | 0 (0.0%) | 0 (0.0%) |
| 5 or more Children | 0 (0.0%) | 0 (0.0%) |
| Total | 0 (0.0%) | 0 (0.0%) |
Income Below Poverty Among Married-Couple vs Single-Parent Households in Woodbourne
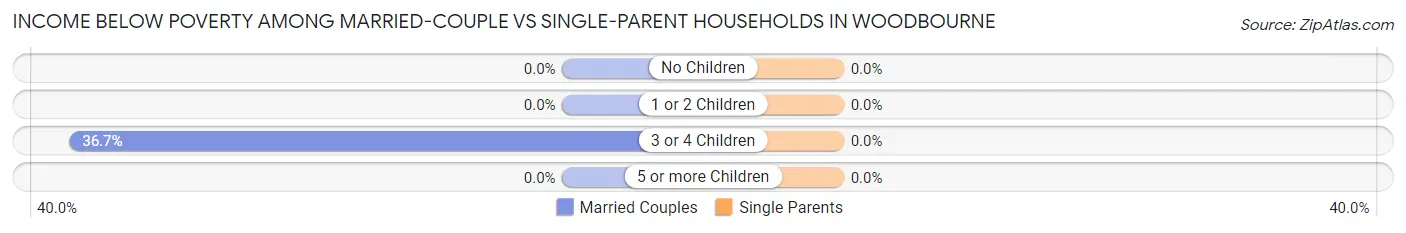
| Children | Married-Couple Families | Single-Parent Households |
| No Children | 0 (0.0%) | 0 (0.0%) |
| 1 or 2 Children | 0 (0.0%) | 0 (0.0%) |
| 3 or 4 Children | 22 (36.7%) | 0 (0.0%) |
| 5 or more Children | 0 (0.0%) | 0 (0.0%) |
| Total | 22 (2.4%) | 0 (0.0%) |
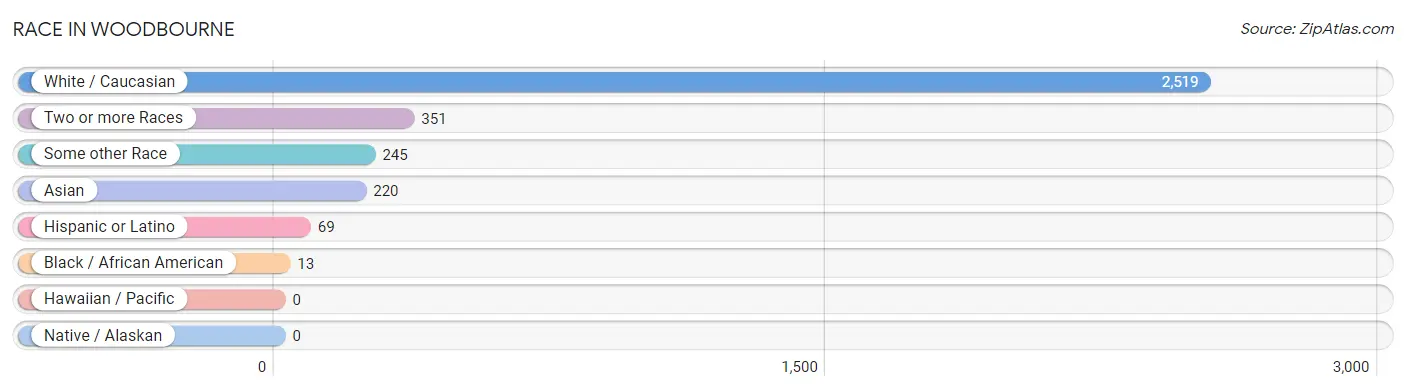
Race in Woodbourne
The most populous races in Woodbourne are White / Caucasian (2,519 | 75.2%), Two or more Races (351 | 10.5%), and Some other Race (245 | 7.3%).
| Race | # Population | % Population |
| Asian | 220 | 6.6% |
| Black / African American | 13 | 0.4% |
| Hawaiian / Pacific | 0 | 0.0% |
| Hispanic or Latino | 69 | 2.1% |
| Native / Alaskan | 0 | 0.0% |
| White / Caucasian | 2,519 | 75.2% |
| Two or more Races | 351 | 10.5% |
| Some other Race | 245 | 7.3% |
| Total | 3,348 | 100.0% |
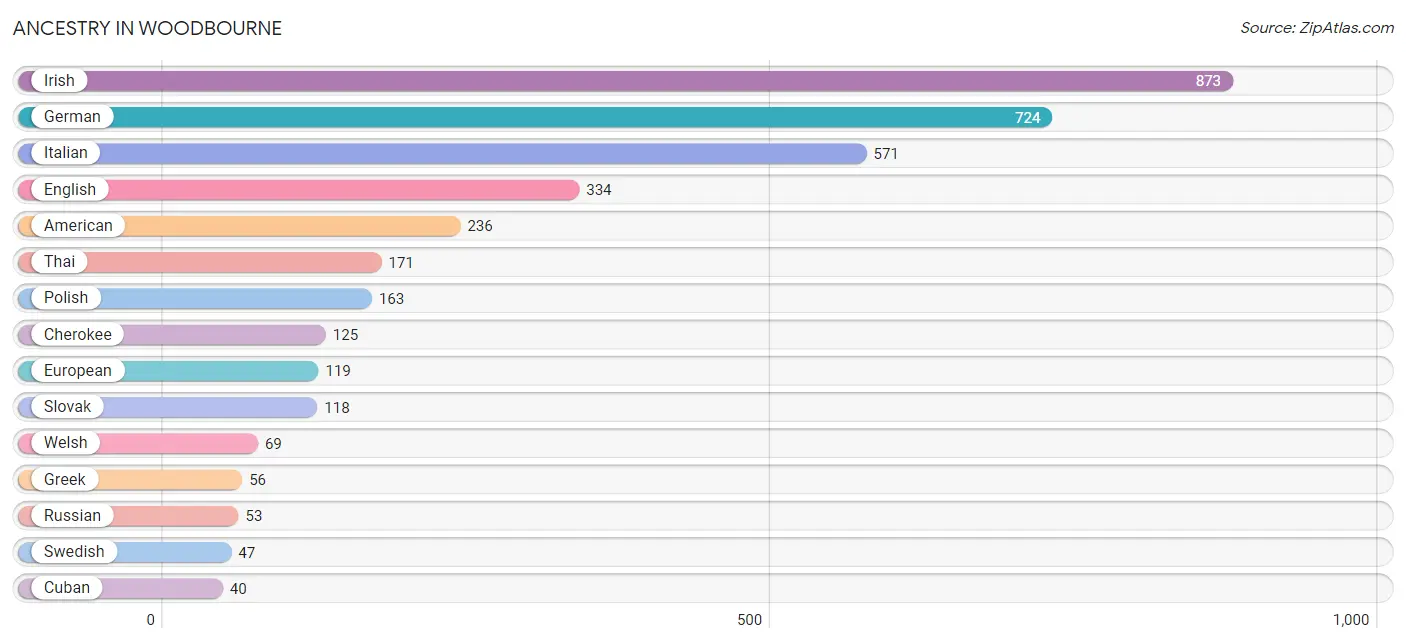
Ancestry in Woodbourne
The most populous ancestries reported in Woodbourne are Irish (873 | 26.1%), German (724 | 21.6%), Italian (571 | 17.1%), English (334 | 10.0%), and American (236 | 7.0%), together accounting for 81.8% of all Woodbourne residents.
| Ancestry | # Population | % Population |
| American | 236 | 7.0% |
| Arab | 6 | 0.2% |
| Burmese | 25 | 0.7% |
| Cherokee | 125 | 3.7% |
| Cuban | 40 | 1.2% |
| Eastern European | 7 | 0.2% |
| Ecuadorian | 29 | 0.9% |
| English | 334 | 10.0% |
| European | 119 | 3.5% |
| French | 15 | 0.4% |
| German | 724 | 21.6% |
| Greek | 56 | 1.7% |
| Indian (Asian) | 15 | 0.4% |
| Irish | 873 | 26.1% |
| Israeli | 14 | 0.4% |
| Italian | 571 | 17.1% |
| Pennsylvania German | 16 | 0.5% |
| Polish | 163 | 4.9% |
| Romanian | 22 | 0.7% |
| Russian | 53 | 1.6% |
| Scotch-Irish | 15 | 0.4% |
| Slovak | 118 | 3.5% |
| South American | 29 | 0.9% |
| Sri Lankan | 15 | 0.4% |
| Swedish | 47 | 1.4% |
| Thai | 171 | 5.1% |
| Ukrainian | 31 | 0.9% |
| Welsh | 69 | 2.1% | View All 28 Rows |
Immigrants in Woodbourne
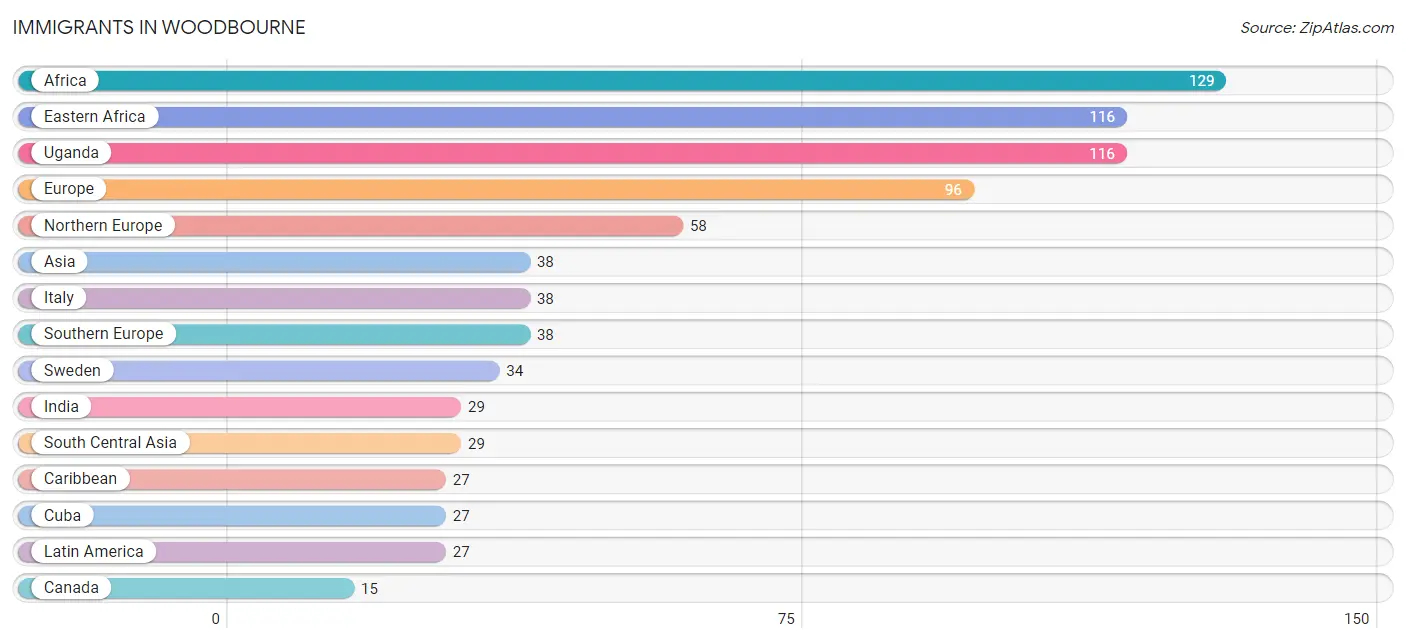
The most numerous immigrant groups reported in Woodbourne came from Africa (129 | 3.8%), Eastern Africa (116 | 3.5%), Uganda (116 | 3.5%), Europe (96 | 2.9%), and Northern Europe (58 | 1.7%), together accounting for 15.4% of all Woodbourne residents.
| Immigration Origin | # Population | % Population |
| Africa | 129 | 3.8% |
| Asia | 38 | 1.1% |
| Canada | 15 | 0.4% |
| Caribbean | 27 | 0.8% |
| Cuba | 27 | 0.8% |
| Eastern Africa | 116 | 3.5% |
| Europe | 96 | 2.9% |
| India | 29 | 0.9% |
| Italy | 38 | 1.1% |
| Latin America | 27 | 0.8% |
| Northern Europe | 58 | 1.7% |
| Sierra Leone | 13 | 0.4% |
| South Central Asia | 29 | 0.9% |
| South Eastern Asia | 9 | 0.3% |
| Southern Europe | 38 | 1.1% |
| Sweden | 34 | 1.0% |
| Uganda | 116 | 3.5% |
| Vietnam | 9 | 0.3% |
| Western Africa | 13 | 0.4% | View All 19 Rows |
Sex and Age in Woodbourne
Sex and Age in Woodbourne
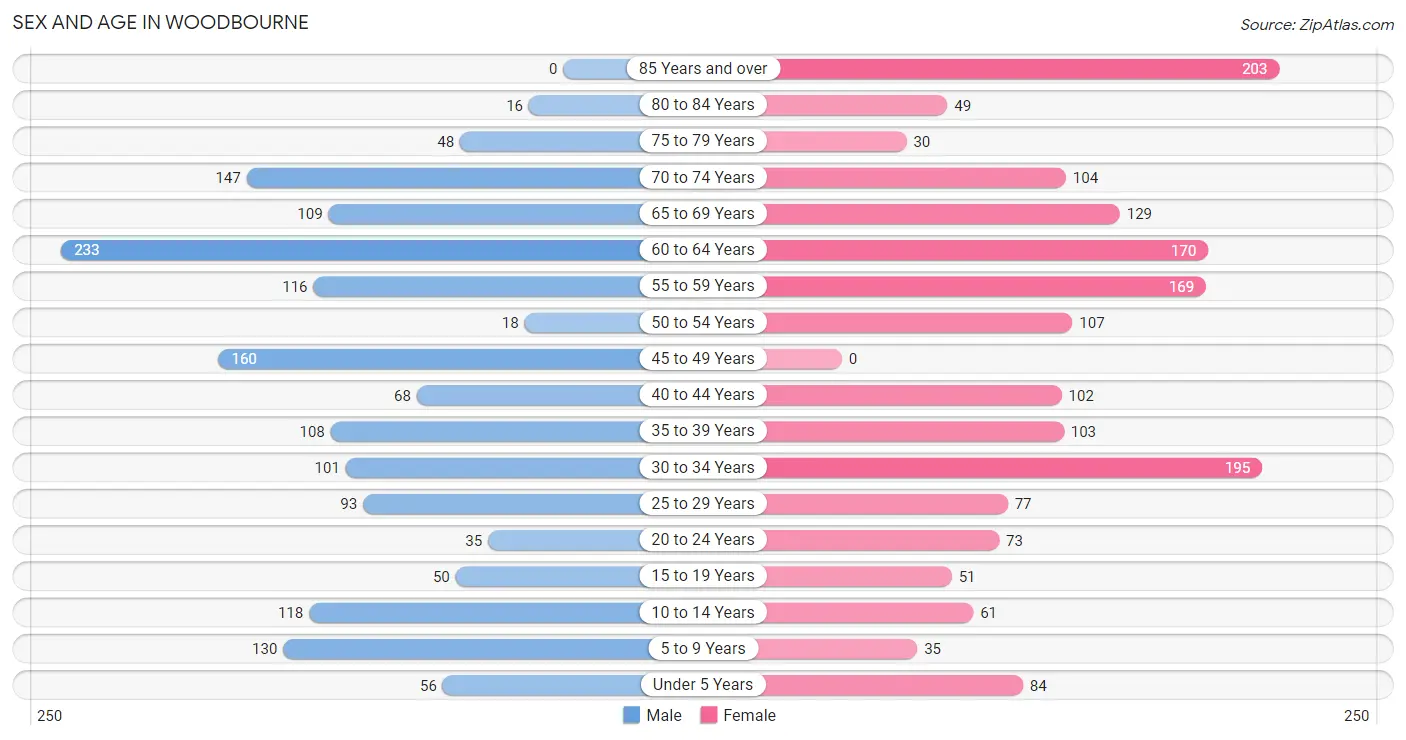
The most populous age groups in Woodbourne are 60 to 64 Years (233 | 14.5%) for men and 85 Years and over (203 | 11.7%) for women.
| Age Bracket | Male | Female |
| Under 5 Years | 56 (3.5%) | 84 (4.8%) |
| 5 to 9 Years | 130 (8.1%) | 35 (2.0%) |
| 10 to 14 Years | 118 (7.3%) | 61 (3.5%) |
| 15 to 19 Years | 50 (3.1%) | 51 (2.9%) |
| 20 to 24 Years | 35 (2.2%) | 73 (4.2%) |
| 25 to 29 Years | 93 (5.8%) | 77 (4.4%) |
| 30 to 34 Years | 101 (6.3%) | 195 (11.2%) |
| 35 to 39 Years | 108 (6.7%) | 103 (5.9%) |
| 40 to 44 Years | 68 (4.2%) | 102 (5.9%) |
| 45 to 49 Years | 160 (10.0%) | 0 (0.0%) |
| 50 to 54 Years | 18 (1.1%) | 107 (6.1%) |
| 55 to 59 Years | 116 (7.2%) | 169 (9.7%) |
| 60 to 64 Years | 233 (14.5%) | 170 (9.8%) |
| 65 to 69 Years | 109 (6.8%) | 129 (7.4%) |
| 70 to 74 Years | 147 (9.1%) | 104 (6.0%) |
| 75 to 79 Years | 48 (3.0%) | 30 (1.7%) |
| 80 to 84 Years | 16 (1.0%) | 49 (2.8%) |
| 85 Years and over | 0 (0.0%) | 203 (11.7%) |
| Total | 1,606 (100.0%) | 1,742 (100.0%) |
Families and Households in Woodbourne
Median Family Size in Woodbourne
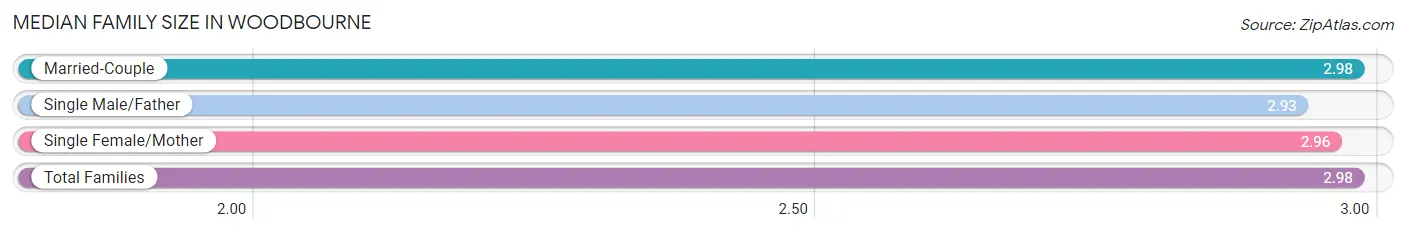
The median family size in Woodbourne is 2.98 persons per family, with married-couple families (917 | 87.7%) accounting for the largest median family size of 2.98 persons per family. On the other hand, single male/father families (105 | 10.0%) represent the smallest median family size with 2.93 persons per family.
| Family Type | # Families | Family Size |
| Married-Couple | 917 (87.7%) | 2.98 |
| Single Male/Father | 105 (10.0%) | 2.93 |
| Single Female/Mother | 24 (2.3%) | 2.96 |
| Total Families | 1,046 (100.0%) | 2.98 |
Median Household Size in Woodbourne
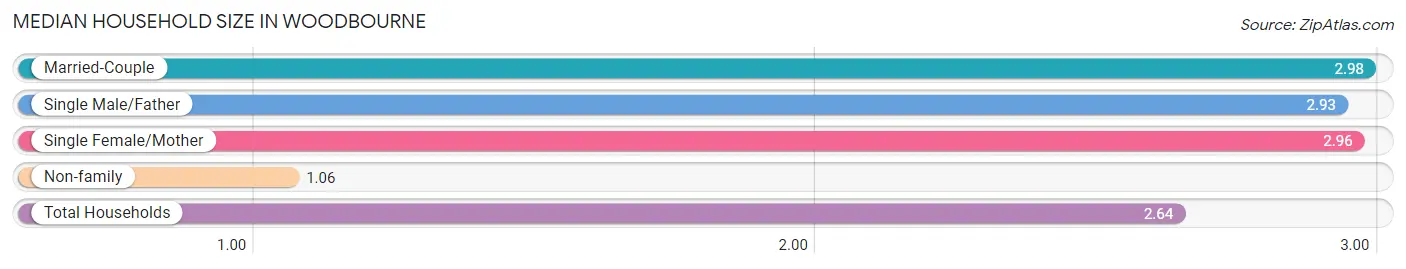
The median household size in Woodbourne is 2.64 persons per household, with married-couple households (917 | 72.4%) accounting for the largest median household size of 2.98 persons per household. non-family households (221 | 17.4%) represent the smallest median household size with 1.06 persons per household.
| Household Type | # Households | Household Size |
| Married-Couple | 917 (72.4%) | 2.98 |
| Single Male/Father | 105 (8.3%) | 2.93 |
| Single Female/Mother | 24 (1.9%) | 2.96 |
| Non-family | 221 (17.4%) | 1.06 |
| Total Households | 1,267 (100.0%) | 2.64 |
Household Size by Marriage Status in Woodbourne
Out of a total of 1,267 households in Woodbourne, 1,046 (82.6%) are family households, while 221 (17.4%) are nonfamily households. The most numerous type of family households are 2-person households, comprising 515, and the most common type of nonfamily households are 1-person households, comprising 206.
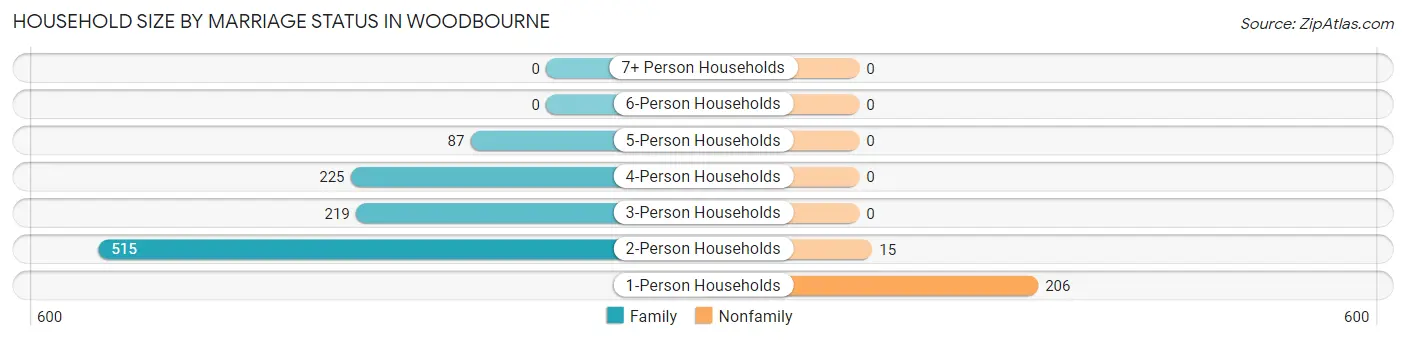
| Household Size | Family Households | Nonfamily Households |
| 1-Person Households | - | 206 (16.3%) |
| 2-Person Households | 515 (40.6%) | 15 (1.2%) |
| 3-Person Households | 219 (17.3%) | 0 (0.0%) |
| 4-Person Households | 225 (17.8%) | 0 (0.0%) |
| 5-Person Households | 87 (6.9%) | 0 (0.0%) |
| 6-Person Households | 0 (0.0%) | 0 (0.0%) |
| 7+ Person Households | 0 (0.0%) | 0 (0.0%) |
| Total | 1,046 (82.6%) | 221 (17.4%) |
Female Fertility in Woodbourne
Fertility by Age in Woodbourne
Average fertility rate in Woodbourne is 88.0 births per 1,000 women. Women in the age bracket of 35 to 50 years have the highest fertility rate with 185.0 births per 1,000 women. Women in the age bracket of 35 to 50 years acount for 71.7% of all women with births.
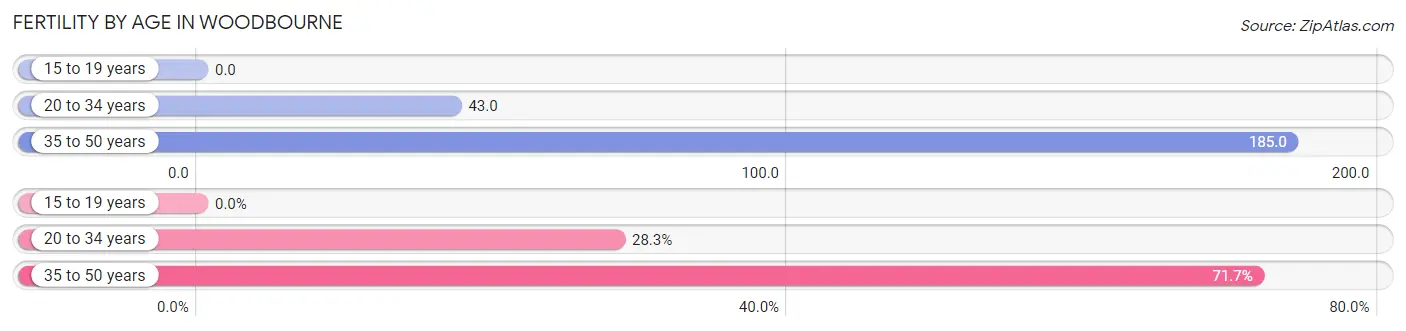
| Age Bracket | Women with Births | Births / 1,000 Women |
| 15 to 19 years | 0 (0.0%) | 0.0 |
| 20 to 34 years | 15 (28.3%) | 43.0 |
| 35 to 50 years | 38 (71.7%) | 185.0 |
| Total | 53 (100.0%) | 88.0 |
Fertility by Age by Marriage Status in Woodbourne
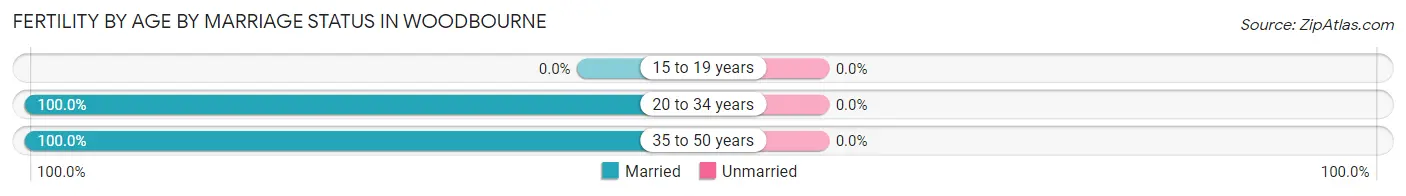
| Age Bracket | Married | Unmarried |
| 15 to 19 years | 0 (0.0%) | 0 (0.0%) |
| 20 to 34 years | 15 (100.0%) | 0 (0.0%) |
| 35 to 50 years | 38 (100.0%) | 0 (0.0%) |
| Total | 53 (100.0%) | 0 (0.0%) |
Fertility by Education in Woodbourne
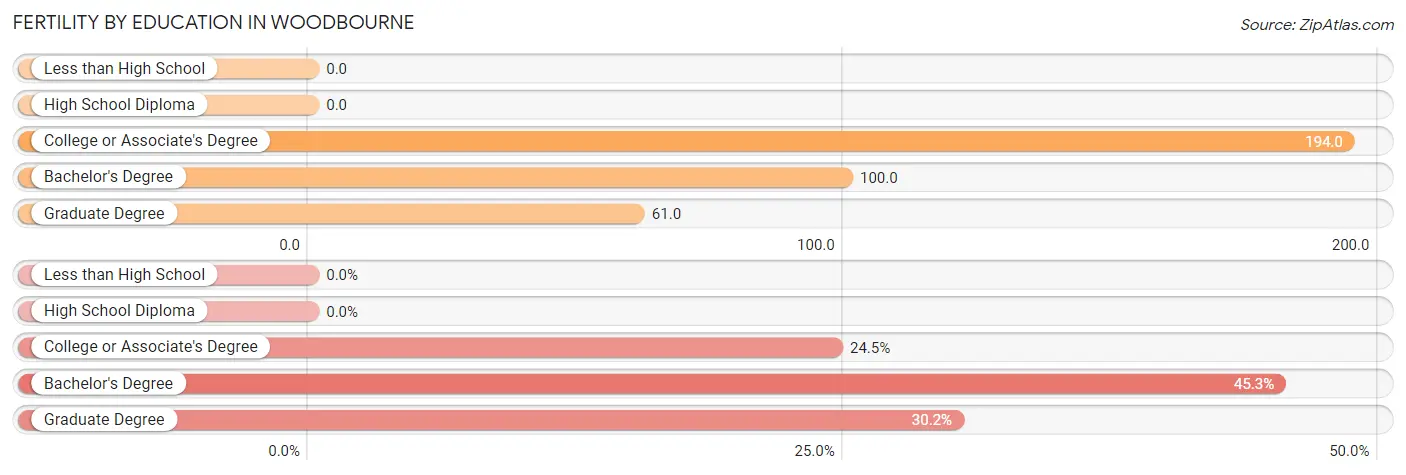
| Educational Attainment | Women with Births | Births / 1,000 Women |
| Less than High School | 0 (0.0%) | 0.0 |
| High School Diploma | 0 (0.0%) | 0.0 |
| College or Associate's Degree | 13 (24.5%) | 194.0 |
| Bachelor's Degree | 24 (45.3%) | 100.0 |
| Graduate Degree | 16 (30.2%) | 61.0 |
| Total | 53 (100.0%) | 88.0 |
Fertility by Education by Marriage Status in Woodbourne
| Educational Attainment | Married | Unmarried |
| Less than High School | 0 (0.0%) | 0 (0.0%) |
| High School Diploma | 0 (0.0%) | 0 (0.0%) |
| College or Associate's Degree | 13 (100.0%) | 0 (0.0%) |
| Bachelor's Degree | 24 (100.0%) | 0 (0.0%) |
| Graduate Degree | 16 (100.0%) | 0 (0.0%) |
| Total | 53 (100.0%) | 0 (0.0%) |
Employment Characteristics in Woodbourne
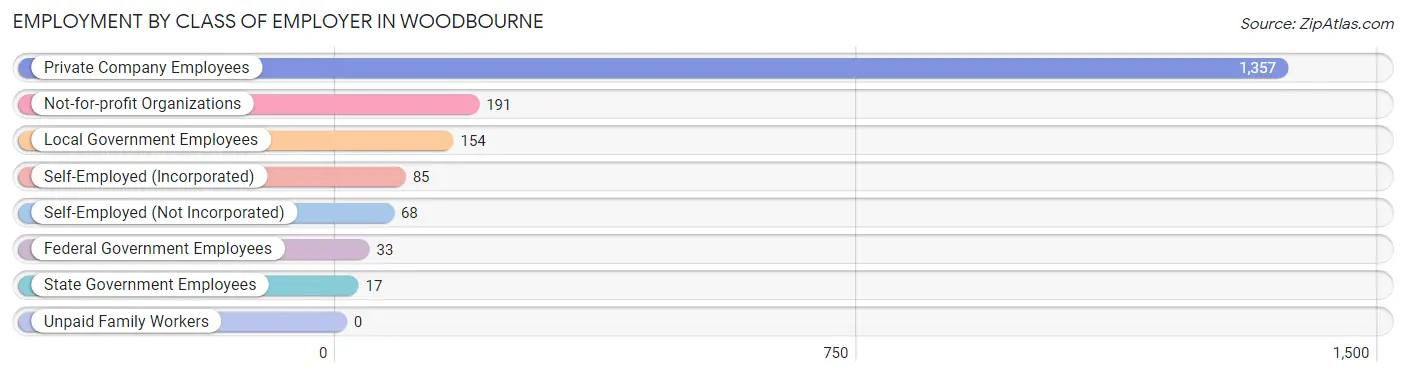
Employment by Class of Employer in Woodbourne
Among the 1,905 employed individuals in Woodbourne, private company employees (1,357 | 71.2%), not-for-profit organizations (191 | 10.0%), and local government employees (154 | 8.1%) make up the most common classes of employment.
| Employer Class | # Employees | % Employees |
| Private Company Employees | 1,357 | 71.2% |
| Self-Employed (Incorporated) | 85 | 4.5% |
| Self-Employed (Not Incorporated) | 68 | 3.6% |
| Not-for-profit Organizations | 191 | 10.0% |
| Local Government Employees | 154 | 8.1% |
| State Government Employees | 17 | 0.9% |
| Federal Government Employees | 33 | 1.7% |
| Unpaid Family Workers | 0 | 0.0% |
| Total | 1,905 | 100.0% |
Employment Status by Age in Woodbourne
According to the labor force statistics for Woodbourne, out of the total population over 16 years of age (2,840), 71.4% or 2,028 individuals are in the labor force, with 4.4% or 89 of them unemployed. The age group with the highest labor force participation rate is 20 to 24 years, with 100.0% or 108 individuals in the labor force. Within the labor force, the 30 to 34 years age range has the highest percentage of unemployed individuals, with 11.8% or 35 of them being unemployed.
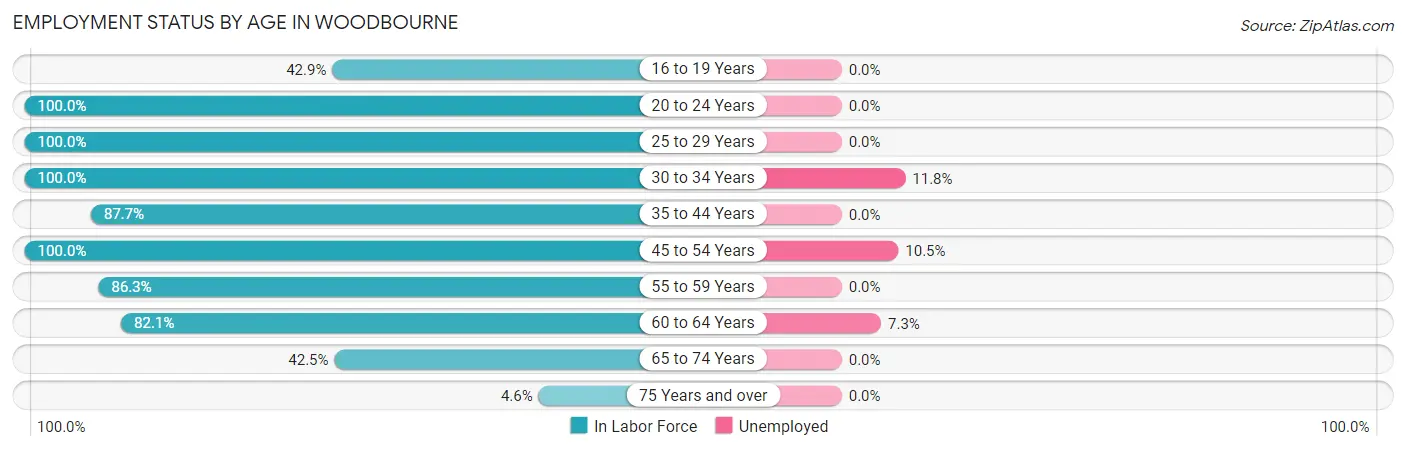
| Age Bracket | In Labor Force | Unemployed |
| 16 to 19 Years | 33 (42.9%) | 0 (0.0%) |
| 20 to 24 Years | 108 (100.0%) | 0 (0.0%) |
| 25 to 29 Years | 170 (100.0%) | 0 (0.0%) |
| 30 to 34 Years | 296 (100.0%) | 35 (11.8%) |
| 35 to 44 Years | 334 (87.7%) | 0 (0.0%) |
| 45 to 54 Years | 285 (100.0%) | 30 (10.5%) |
| 55 to 59 Years | 246 (86.3%) | 0 (0.0%) |
| 60 to 64 Years | 331 (82.1%) | 24 (7.3%) |
| 65 to 74 Years | 208 (42.5%) | 0 (0.0%) |
| 75 Years and over | 16 (4.6%) | 0 (0.0%) |
| Total | 2,028 (71.4%) | 89 (4.4%) |
Employment Status by Educational Attainment in Woodbourne
According to labor force statistics for Woodbourne, 91.3% of individuals (1,662) out of the total population between 25 and 64 years of age (1,820) are in the labor force, with 5.4% or 90 of them being unemployed. The group with the highest labor force participation rate are those with the educational attainment of less than high school, with 100.0% or 15 individuals in the labor force. Within the labor force, individuals with high school diploma education have the highest percentage of unemployment, with 31.9% or 30 of them being unemployed.
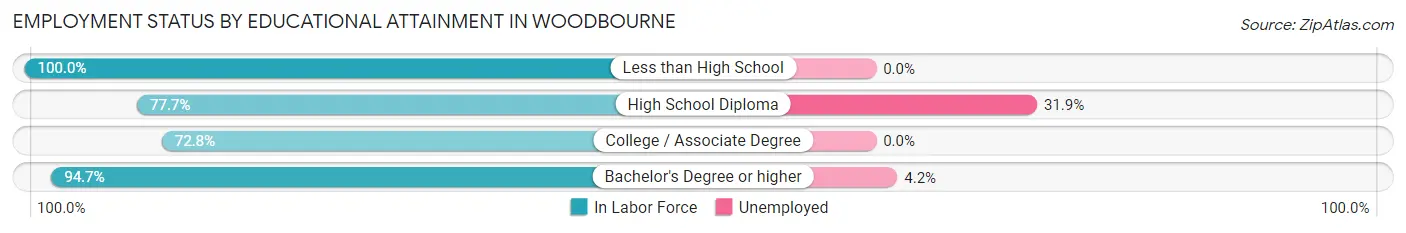
| Educational Attainment | In Labor Force | Unemployed |
| Less than High School | 15 (100.0%) | 0 (0.0%) |
| High School Diploma | 94 (77.7%) | 39 (31.9%) |
| College / Associate Degree | 139 (72.8%) | 0 (0.0%) |
| Bachelor's Degree or higher | 1,414 (94.7%) | 63 (4.2%) |
| Total | 1,662 (91.3%) | 98 (5.4%) |
Employment Occupations by Sex in Woodbourne
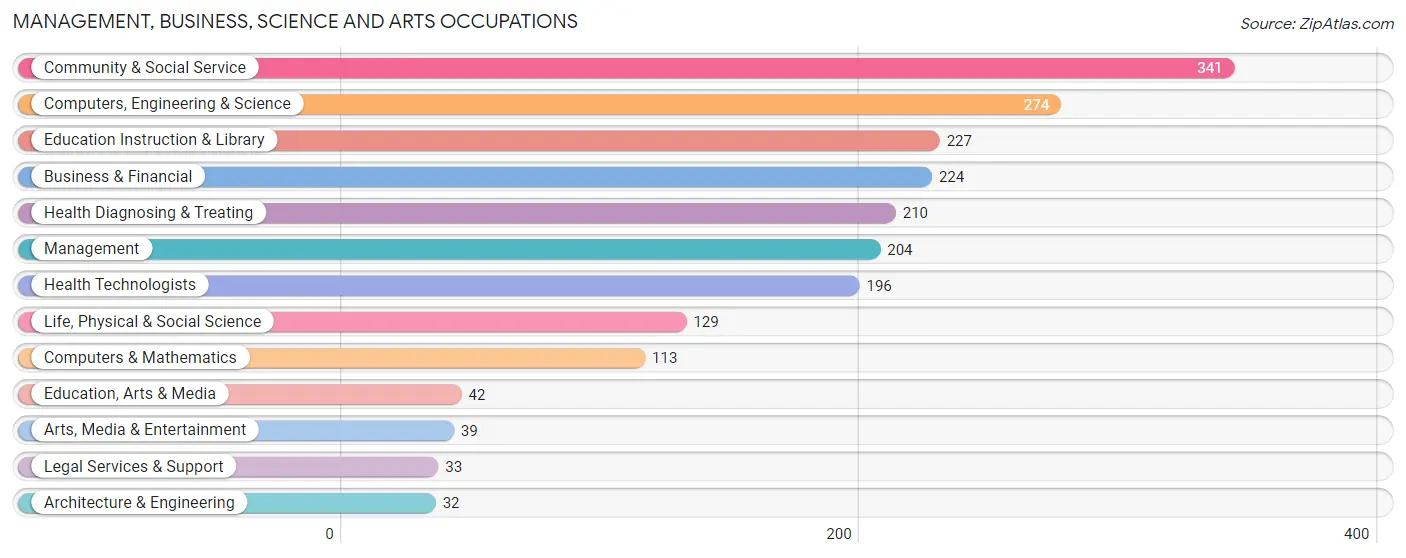
Management, Business, Science and Arts Occupations
The most common Management, Business, Science and Arts occupations in Woodbourne are Community & Social Service (341 | 17.6%), Computers, Engineering & Science (274 | 14.1%), Education Instruction & Library (227 | 11.7%), Business & Financial (224 | 11.6%), and Health Diagnosing & Treating (210 | 10.8%).
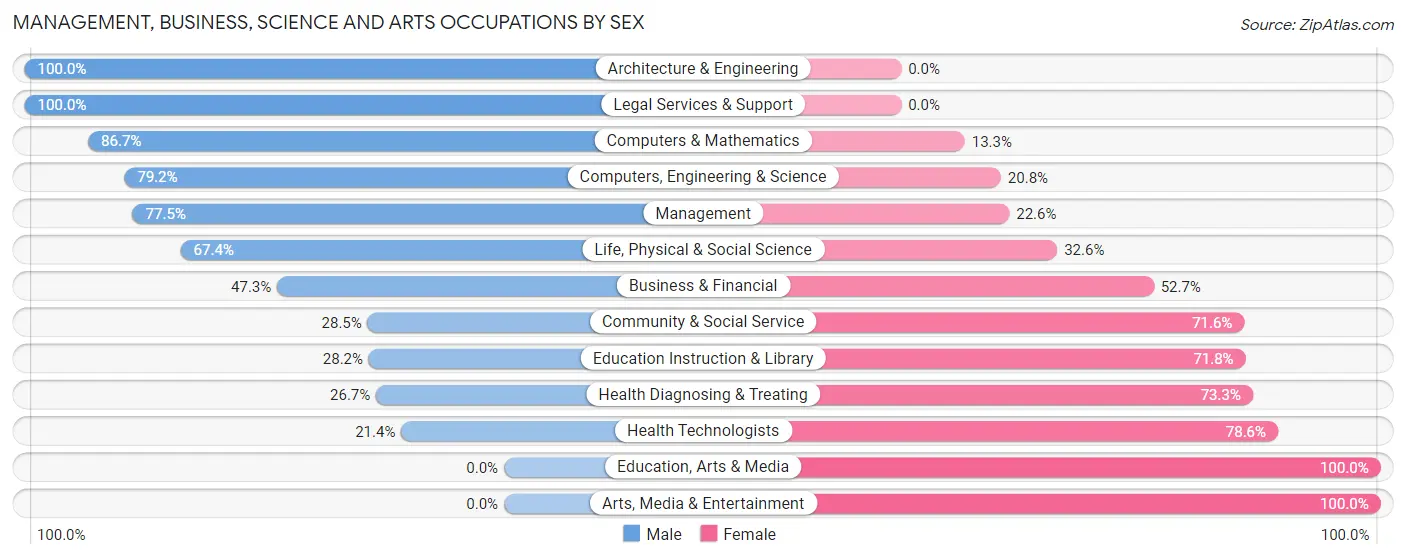
Management, Business, Science and Arts Occupations by Sex
Within the Management, Business, Science and Arts occupations in Woodbourne, the most male-oriented occupations are Architecture & Engineering (100.0%), Legal Services & Support (100.0%), and Computers & Mathematics (86.7%), while the most female-oriented occupations are Education, Arts & Media (100.0%), Arts, Media & Entertainment (100.0%), and Health Technologists (78.6%).
| Occupation | Male | Female |
| Management | 158 (77.4%) | 46 (22.6%) |
| Business & Financial | 106 (47.3%) | 118 (52.7%) |
| Computers, Engineering & Science | 217 (79.2%) | 57 (20.8%) |
| Computers & Mathematics | 98 (86.7%) | 15 (13.3%) |
| Architecture & Engineering | 32 (100.0%) | 0 (0.0%) |
| Life, Physical & Social Science | 87 (67.4%) | 42 (32.6%) |
| Community & Social Service | 97 (28.4%) | 244 (71.6%) |
| Education, Arts & Media | 0 (0.0%) | 42 (100.0%) |
| Legal Services & Support | 33 (100.0%) | 0 (0.0%) |
| Education Instruction & Library | 64 (28.2%) | 163 (71.8%) |
| Arts, Media & Entertainment | 0 (0.0%) | 39 (100.0%) |
| Health Diagnosing & Treating | 56 (26.7%) | 154 (73.3%) |
| Health Technologists | 42 (21.4%) | 154 (78.6%) |
| Total (Category) | 634 (50.6%) | 619 (49.4%) |
| Total (Overall) | 1,058 (54.6%) | 880 (45.4%) |
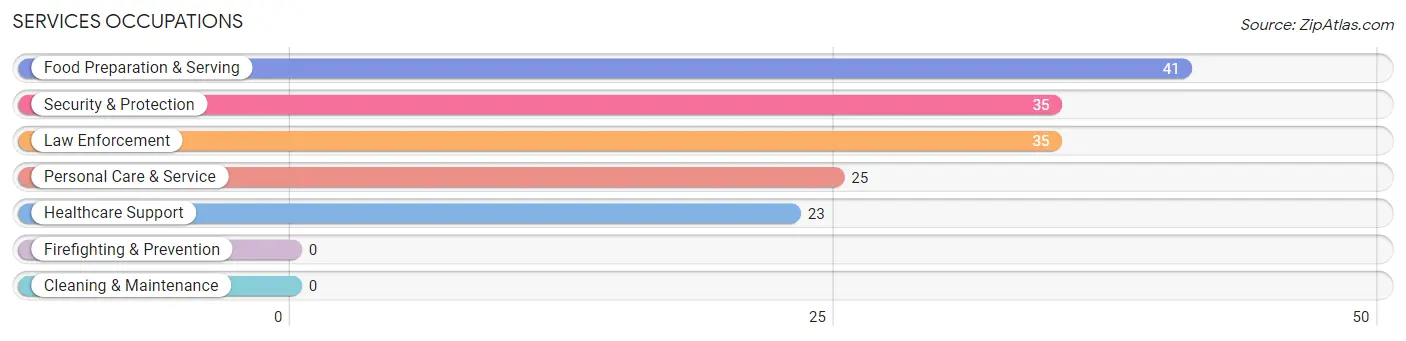
Services Occupations
The most common Services occupations in Woodbourne are Food Preparation & Serving (41 | 2.1%), Security & Protection (35 | 1.8%), Law Enforcement (35 | 1.8%), Personal Care & Service (25 | 1.3%), and Healthcare Support (23 | 1.2%).
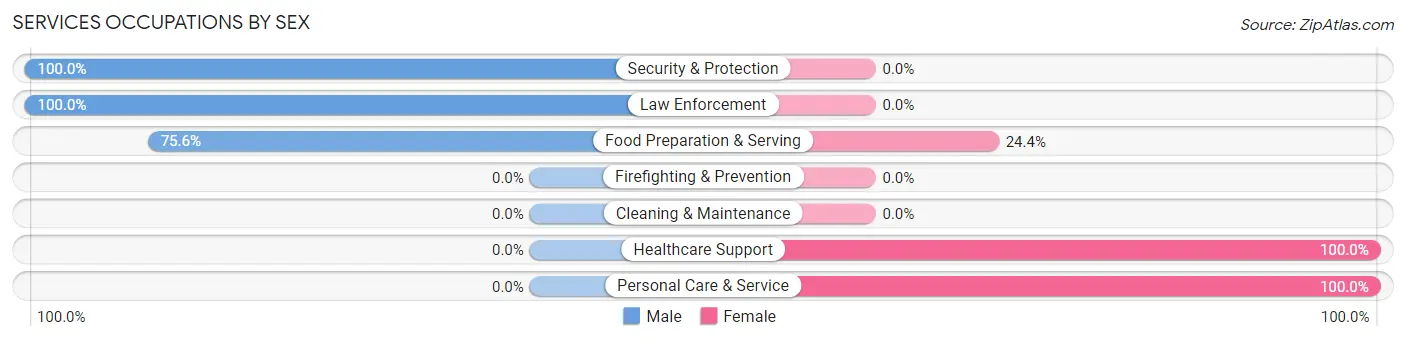
Services Occupations by Sex
Within the Services occupations in Woodbourne, the most male-oriented occupations are Security & Protection (100.0%), Law Enforcement (100.0%), and Food Preparation & Serving (75.6%), while the most female-oriented occupations are Healthcare Support (100.0%), Personal Care & Service (100.0%), and Food Preparation & Serving (24.4%).
| Occupation | Male | Female |
| Healthcare Support | 0 (0.0%) | 23 (100.0%) |
| Security & Protection | 35 (100.0%) | 0 (0.0%) |
| Firefighting & Prevention | 0 (0.0%) | 0 (0.0%) |
| Law Enforcement | 35 (100.0%) | 0 (0.0%) |
| Food Preparation & Serving | 31 (75.6%) | 10 (24.4%) |
| Cleaning & Maintenance | 0 (0.0%) | 0 (0.0%) |
| Personal Care & Service | 0 (0.0%) | 25 (100.0%) |
| Total (Category) | 66 (53.2%) | 58 (46.8%) |
| Total (Overall) | 1,058 (54.6%) | 880 (45.4%) |
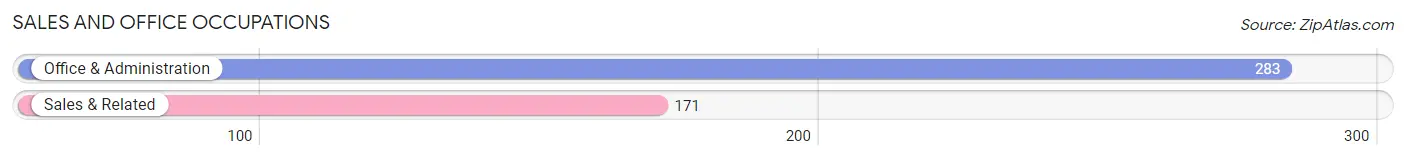
Sales and Office Occupations
The most common Sales and Office occupations in Woodbourne are Office & Administration (283 | 14.6%), and Sales & Related (171 | 8.8%).
Sales and Office Occupations by Sex
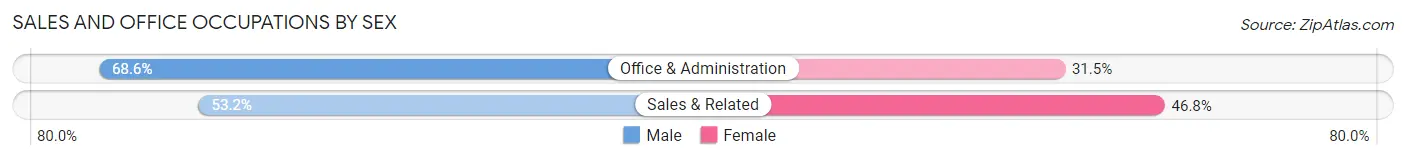
| Occupation | Male | Female |
| Sales & Related | 91 (53.2%) | 80 (46.8%) |
| Office & Administration | 194 (68.5%) | 89 (31.5%) |
| Total (Category) | 285 (62.8%) | 169 (37.2%) |
| Total (Overall) | 1,058 (54.6%) | 880 (45.4%) |
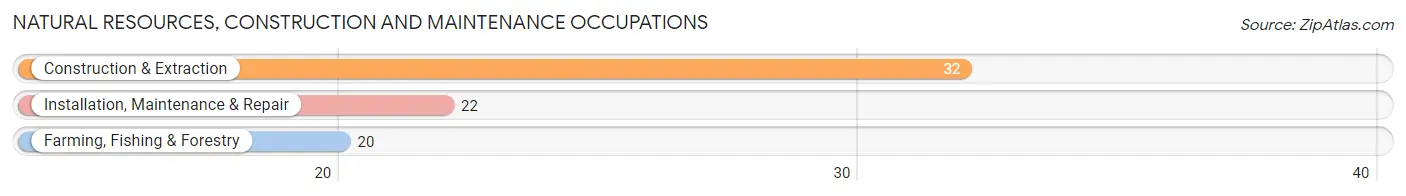
Natural Resources, Construction and Maintenance Occupations
The most common Natural Resources, Construction and Maintenance occupations in Woodbourne are Construction & Extraction (32 | 1.7%), Installation, Maintenance & Repair (22 | 1.1%), and Farming, Fishing & Forestry (20 | 1.0%).
Natural Resources, Construction and Maintenance Occupations by Sex
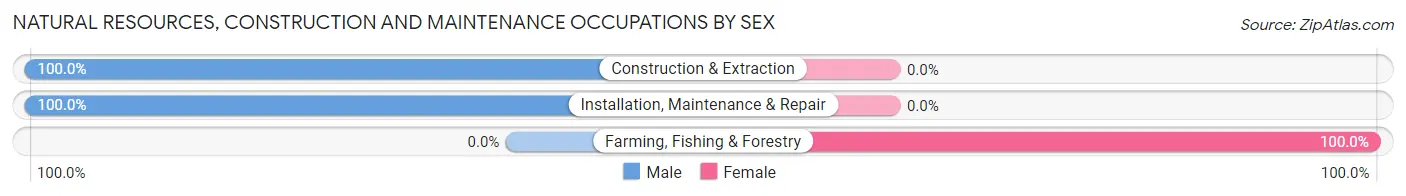
| Occupation | Male | Female |
| Farming, Fishing & Forestry | 0 (0.0%) | 20 (100.0%) |
| Construction & Extraction | 32 (100.0%) | 0 (0.0%) |
| Installation, Maintenance & Repair | 22 (100.0%) | 0 (0.0%) |
| Total (Category) | 54 (73.0%) | 20 (27.0%) |
| Total (Overall) | 1,058 (54.6%) | 880 (45.4%) |
Production, Transportation and Moving Occupations
The most common Production, Transportation and Moving occupations in Woodbourne are Material Moving (19 | 1.0%), and Transportation (14 | 0.7%).
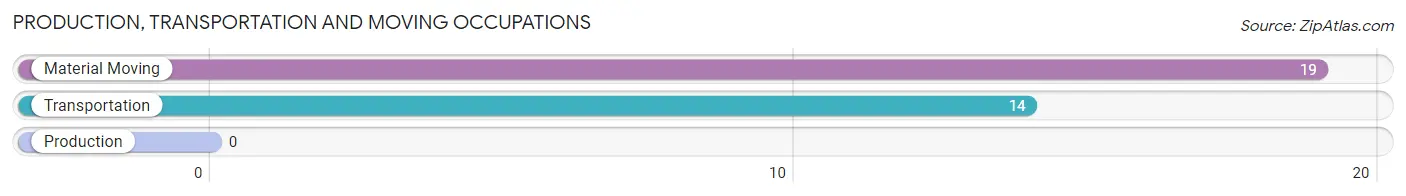
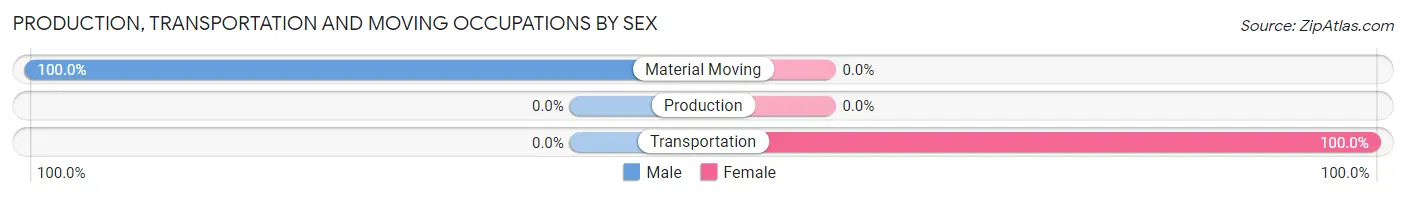
Production, Transportation and Moving Occupations by Sex
| Occupation | Male | Female |
| Production | 0 (0.0%) | 0 (0.0%) |
| Transportation | 0 (0.0%) | 14 (100.0%) |
| Material Moving | 19 (100.0%) | 0 (0.0%) |
| Total (Category) | 19 (57.6%) | 14 (42.4%) |
| Total (Overall) | 1,058 (54.6%) | 880 (45.4%) |
Employment Industries by Sex in Woodbourne
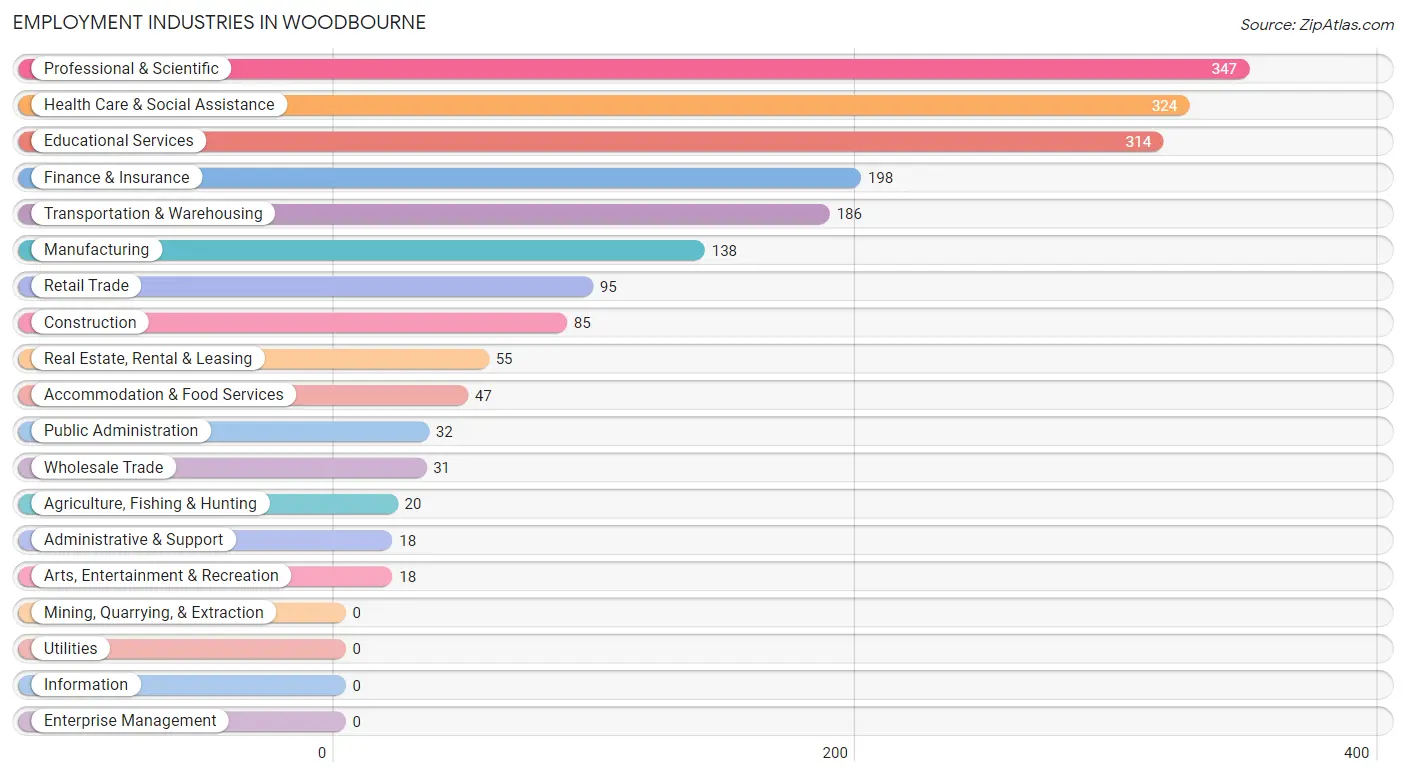
Employment Industries in Woodbourne
The major employment industries in Woodbourne include Professional & Scientific (347 | 17.9%), Health Care & Social Assistance (324 | 16.7%), Educational Services (314 | 16.2%), Finance & Insurance (198 | 10.2%), and Transportation & Warehousing (186 | 9.6%).
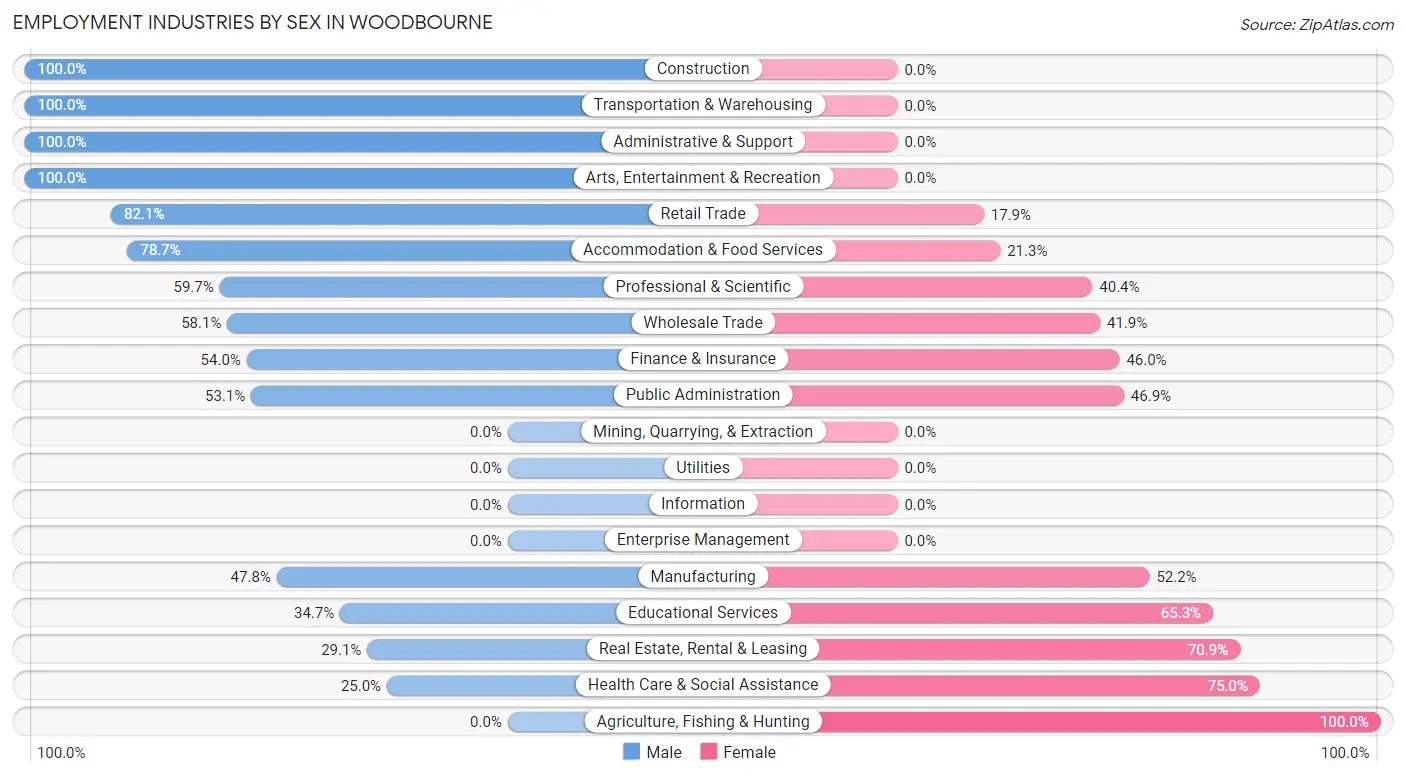
Employment Industries by Sex in Woodbourne
The Woodbourne industries that see more men than women are Construction (100.0%), Transportation & Warehousing (100.0%), and Administrative & Support (100.0%), whereas the industries that tend to have a higher number of women are Agriculture, Fishing & Hunting (100.0%), Health Care & Social Assistance (75.0%), and Real Estate, Rental & Leasing (70.9%).
| Industry | Male | Female |
| Agriculture, Fishing & Hunting | 0 (0.0%) | 20 (100.0%) |
| Mining, Quarrying, & Extraction | 0 (0.0%) | 0 (0.0%) |
| Construction | 85 (100.0%) | 0 (0.0%) |
| Manufacturing | 66 (47.8%) | 72 (52.2%) |
| Wholesale Trade | 18 (58.1%) | 13 (41.9%) |
| Retail Trade | 78 (82.1%) | 17 (17.9%) |
| Transportation & Warehousing | 186 (100.0%) | 0 (0.0%) |
| Utilities | 0 (0.0%) | 0 (0.0%) |
| Information | 0 (0.0%) | 0 (0.0%) |
| Finance & Insurance | 107 (54.0%) | 91 (46.0%) |
| Real Estate, Rental & Leasing | 16 (29.1%) | 39 (70.9%) |
| Professional & Scientific | 207 (59.7%) | 140 (40.4%) |
| Enterprise Management | 0 (0.0%) | 0 (0.0%) |
| Administrative & Support | 18 (100.0%) | 0 (0.0%) |
| Educational Services | 109 (34.7%) | 205 (65.3%) |
| Health Care & Social Assistance | 81 (25.0%) | 243 (75.0%) |
| Arts, Entertainment & Recreation | 18 (100.0%) | 0 (0.0%) |
| Accommodation & Food Services | 37 (78.7%) | 10 (21.3%) |
| Public Administration | 17 (53.1%) | 15 (46.9%) |
| Total | 1,058 (54.6%) | 880 (45.4%) |
Education in Woodbourne
School Enrollment in Woodbourne
The most common levels of schooling among the 658 students in Woodbourne are middle school (143 | 21.7%), elementary school (136 | 20.7%), and college / undergraduate (118 | 17.9%).
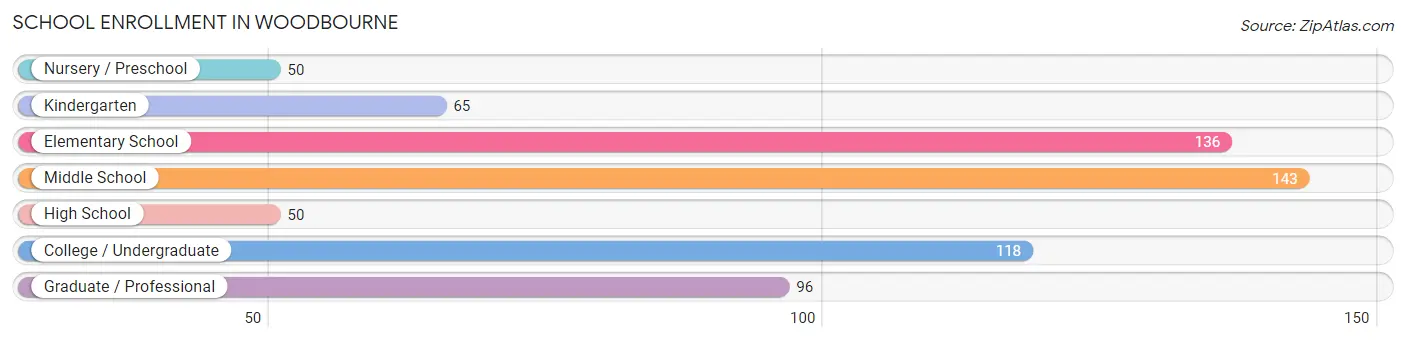
| School Level | # Students | % Students |
| Nursery / Preschool | 50 | 7.6% |
| Kindergarten | 65 | 9.9% |
| Elementary School | 136 | 20.7% |
| Middle School | 143 | 21.7% |
| High School | 50 | 7.6% |
| College / Undergraduate | 118 | 17.9% |
| Graduate / Professional | 96 | 14.6% |
| Total | 658 | 100.0% |
School Enrollment by Age by Funding Source in Woodbourne
Out of a total of 658 students who are enrolled in schools in Woodbourne, 199 (30.2%) attend a private institution, while the remaining 459 (69.8%) are enrolled in public schools. The age group of 18 to 19 year olds has the highest likelihood of being enrolled in private schools, with 31 (100.0% in the age bracket) enrolled. Conversely, the age group of 5 to 9 year old has the lowest likelihood of being enrolled in a private school, with 165 (100.0% in the age bracket) attending a public institution.
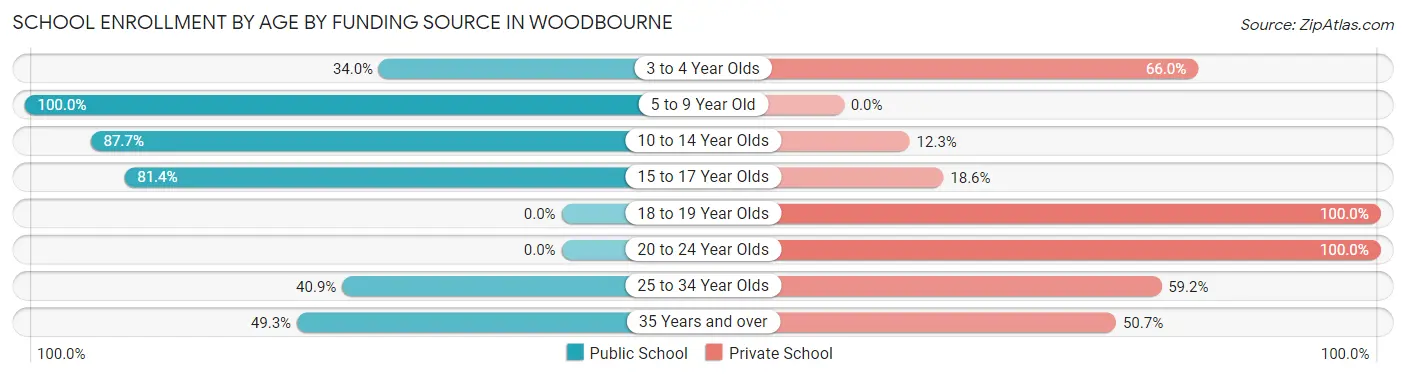
| Age Bracket | Public School | Private School |
| 3 to 4 Year Olds | 17 (34.0%) | 33 (66.0%) |
| 5 to 9 Year Old | 165 (100.0%) | 0 (0.0%) |
| 10 to 14 Year Olds | 157 (87.7%) | 22 (12.3%) |
| 15 to 17 Year Olds | 57 (81.4%) | 13 (18.6%) |
| 18 to 19 Year Olds | 0 (0.0%) | 31 (100.0%) |
| 20 to 24 Year Olds | 0 (0.0%) | 23 (100.0%) |
| 25 to 34 Year Olds | 29 (40.8%) | 42 (59.2%) |
| 35 Years and over | 34 (49.3%) | 35 (50.7%) |
| Total | 459 (69.8%) | 199 (30.2%) |
Educational Attainment by Field of Study in Woodbourne
Business (432 | 20.7%), bio, nature & agricultural (240 | 11.5%), arts & humanities (227 | 10.9%), education (205 | 9.8%), and communications (180 | 8.6%) are the most common fields of study among 2,088 individuals in Woodbourne who have obtained a bachelor's degree or higher.
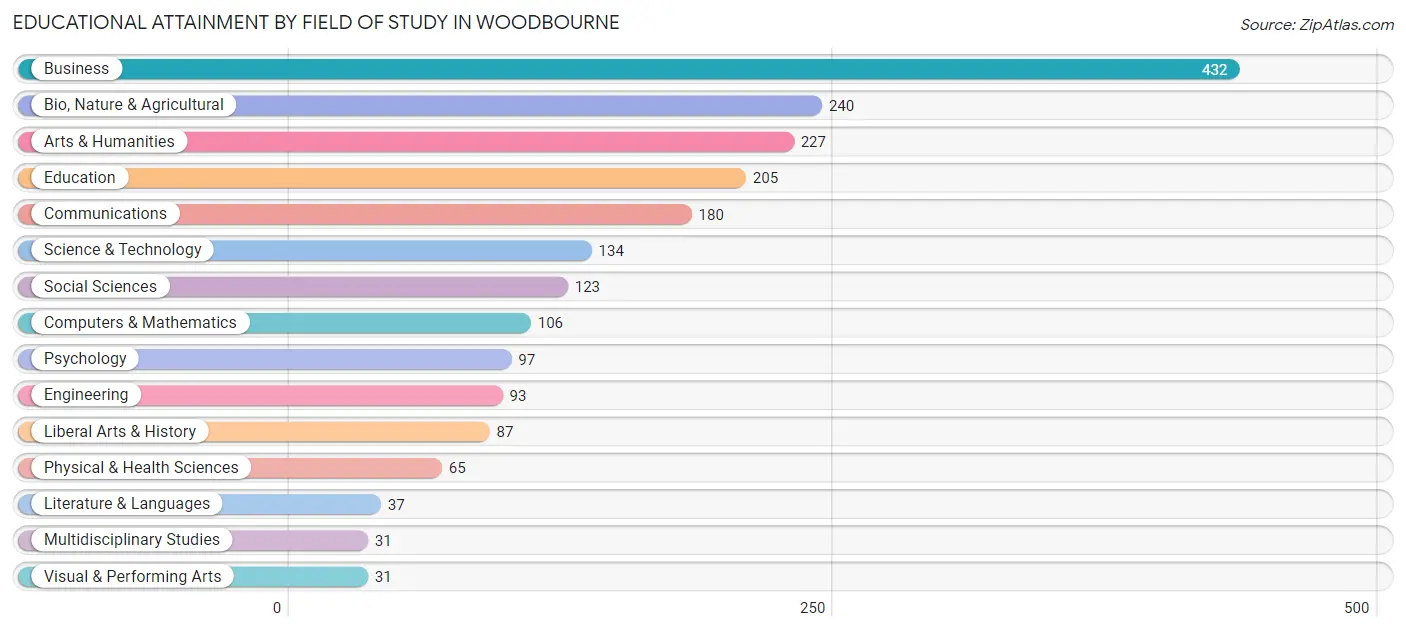
| Field of Study | # Graduates | % Graduates |
| Computers & Mathematics | 106 | 5.1% |
| Bio, Nature & Agricultural | 240 | 11.5% |
| Physical & Health Sciences | 65 | 3.1% |
| Psychology | 97 | 4.6% |
| Social Sciences | 123 | 5.9% |
| Engineering | 93 | 4.4% |
| Multidisciplinary Studies | 31 | 1.5% |
| Science & Technology | 134 | 6.4% |
| Business | 432 | 20.7% |
| Education | 205 | 9.8% |
| Literature & Languages | 37 | 1.8% |
| Liberal Arts & History | 87 | 4.2% |
| Visual & Performing Arts | 31 | 1.5% |
| Communications | 180 | 8.6% |
| Arts & Humanities | 227 | 10.9% |
| Total | 2,088 | 100.0% |
Transportation & Commute in Woodbourne
Vehicle Availability by Sex in Woodbourne
The most prevalent vehicle ownership categories in Woodbourne are males with 2 vehicles (469, accounting for 45.1%) and females with 2 vehicles (428, making up 54.3%).
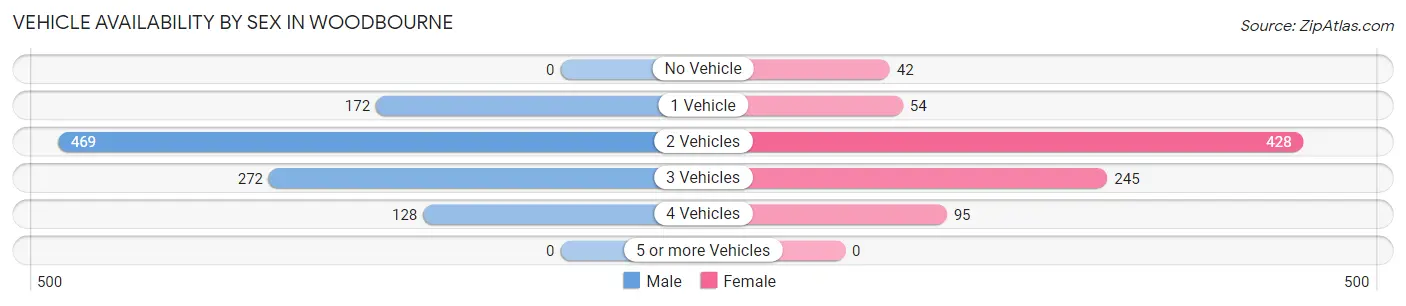
| Vehicles Available | Male | Female |
| No Vehicle | 0 (0.0%) | 42 (4.9%) |
| 1 Vehicle | 172 (16.5%) | 54 (6.2%) |
| 2 Vehicles | 469 (45.1%) | 428 (49.5%) |
| 3 Vehicles | 272 (26.1%) | 245 (28.4%) |
| 4 Vehicles | 128 (12.3%) | 95 (11.0%) |
| 5 or more Vehicles | 0 (0.0%) | 0 (0.0%) |
| Total | 1,041 (100.0%) | 864 (100.0%) |
Commute Time in Woodbourne
The most frequently occuring commute durations in Woodbourne are 45 to 59 minutes (345 commuters, 20.9%), 20 to 24 minutes (235 commuters, 14.3%), and 60 to 89 minutes (195 commuters, 11.8%).
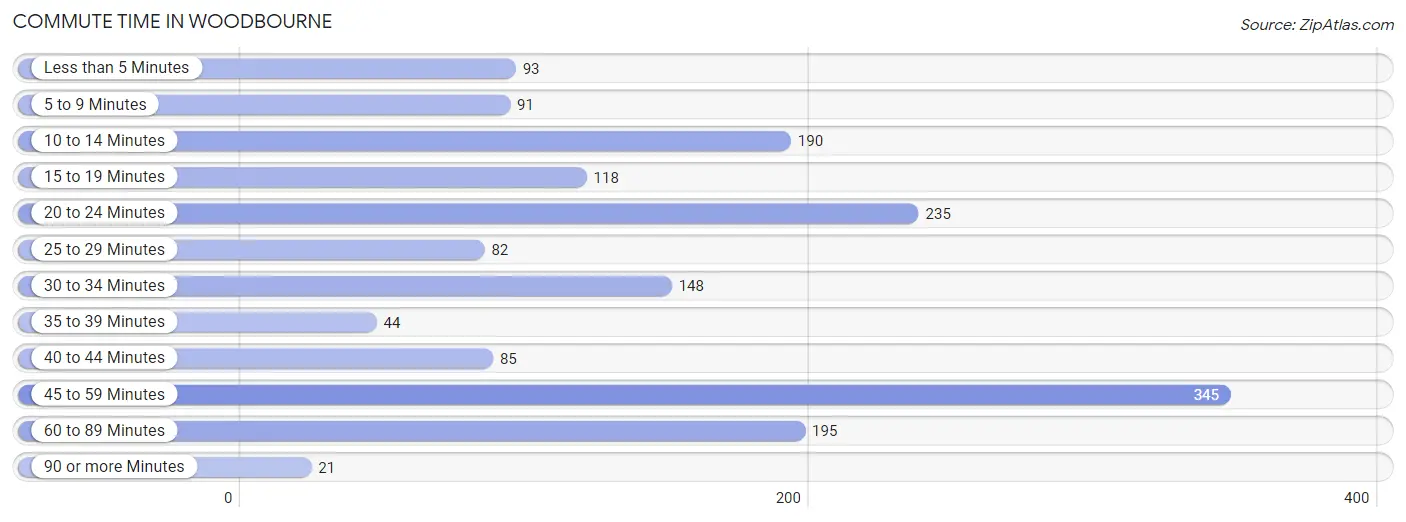
| Commute Time | # Commuters | % Commuters |
| Less than 5 Minutes | 93 | 5.7% |
| 5 to 9 Minutes | 91 | 5.5% |
| 10 to 14 Minutes | 190 | 11.5% |
| 15 to 19 Minutes | 118 | 7.2% |
| 20 to 24 Minutes | 235 | 14.3% |
| 25 to 29 Minutes | 82 | 5.0% |
| 30 to 34 Minutes | 148 | 9.0% |
| 35 to 39 Minutes | 44 | 2.7% |
| 40 to 44 Minutes | 85 | 5.2% |
| 45 to 59 Minutes | 345 | 20.9% |
| 60 to 89 Minutes | 195 | 11.8% |
| 90 or more Minutes | 21 | 1.3% |
Commute Time by Sex in Woodbourne
The most common commute times in Woodbourne are 20 to 24 minutes (208 commuters, 22.3%) for males and 45 to 59 minutes (180 commuters, 25.2%) for females.
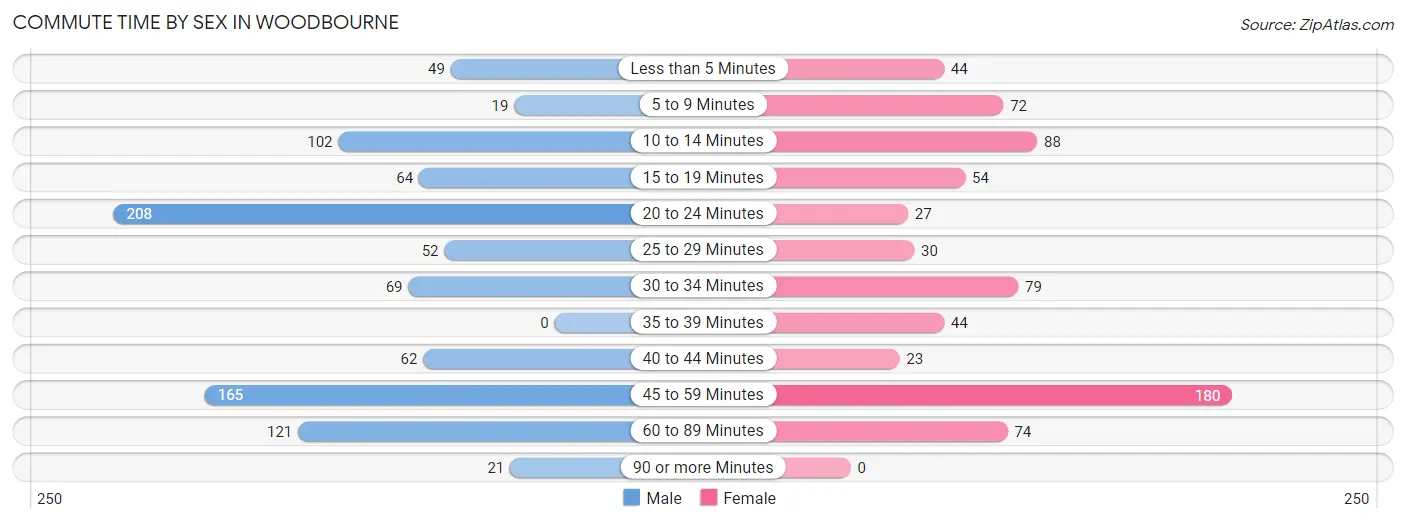
| Commute Time | Male | Female |
| Less than 5 Minutes | 49 (5.3%) | 44 (6.1%) |
| 5 to 9 Minutes | 19 (2.0%) | 72 (10.1%) |
| 10 to 14 Minutes | 102 (10.9%) | 88 (12.3%) |
| 15 to 19 Minutes | 64 (6.9%) | 54 (7.5%) |
| 20 to 24 Minutes | 208 (22.3%) | 27 (3.8%) |
| 25 to 29 Minutes | 52 (5.6%) | 30 (4.2%) |
| 30 to 34 Minutes | 69 (7.4%) | 79 (11.1%) |
| 35 to 39 Minutes | 0 (0.0%) | 44 (6.1%) |
| 40 to 44 Minutes | 62 (6.7%) | 23 (3.2%) |
| 45 to 59 Minutes | 165 (17.7%) | 180 (25.2%) |
| 60 to 89 Minutes | 121 (13.0%) | 74 (10.3%) |
| 90 or more Minutes | 21 (2.2%) | 0 (0.0%) |
Time of Departure to Work by Sex in Woodbourne
The most frequent times of departure to work in Woodbourne are 6:30 AM to 6:59 AM (250, 26.8%) for males and 9:00 AM to 9:59 AM (168, 23.5%) for females.
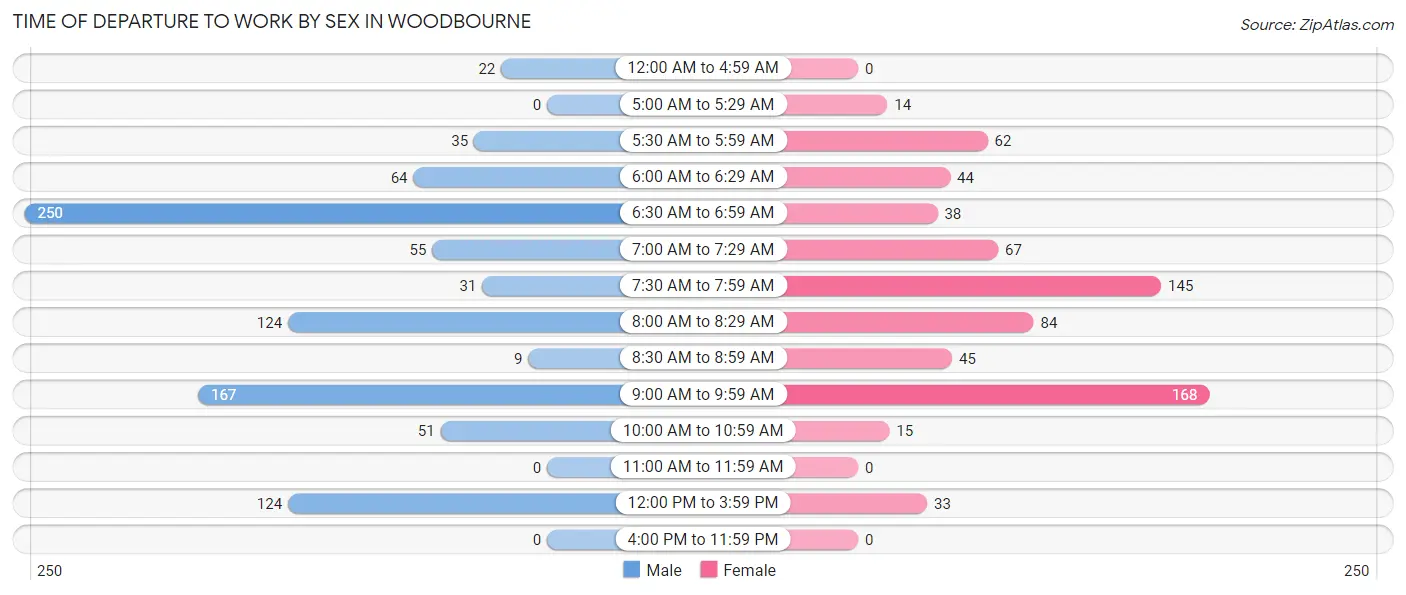
| Time of Departure | Male | Female |
| 12:00 AM to 4:59 AM | 22 (2.4%) | 0 (0.0%) |
| 5:00 AM to 5:29 AM | 0 (0.0%) | 14 (2.0%) |
| 5:30 AM to 5:59 AM | 35 (3.8%) | 62 (8.7%) |
| 6:00 AM to 6:29 AM | 64 (6.9%) | 44 (6.1%) |
| 6:30 AM to 6:59 AM | 250 (26.8%) | 38 (5.3%) |
| 7:00 AM to 7:29 AM | 55 (5.9%) | 67 (9.4%) |
| 7:30 AM to 7:59 AM | 31 (3.3%) | 145 (20.3%) |
| 8:00 AM to 8:29 AM | 124 (13.3%) | 84 (11.7%) |
| 8:30 AM to 8:59 AM | 9 (1.0%) | 45 (6.3%) |
| 9:00 AM to 9:59 AM | 167 (17.9%) | 168 (23.5%) |
| 10:00 AM to 10:59 AM | 51 (5.5%) | 15 (2.1%) |
| 11:00 AM to 11:59 AM | 0 (0.0%) | 0 (0.0%) |
| 12:00 PM to 3:59 PM | 124 (13.3%) | 33 (4.6%) |
| 4:00 PM to 11:59 PM | 0 (0.0%) | 0 (0.0%) |
| Total | 932 (100.0%) | 715 (100.0%) |
Housing Occupancy in Woodbourne
Occupancy by Ownership in Woodbourne
Of the total 1,267 dwellings in Woodbourne, owner-occupied units account for 897 (70.8%), while renter-occupied units make up 370 (29.2%).
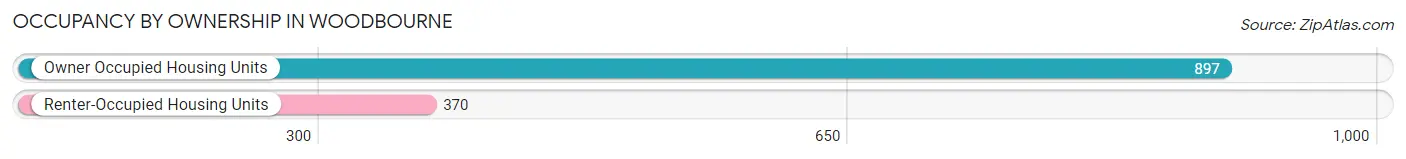
| Occupancy | # Housing Units | % Housing Units |
| Owner Occupied Housing Units | 897 | 70.8% |
| Renter-Occupied Housing Units | 370 | 29.2% |
| Total Occupied Housing Units | 1,267 | 100.0% |
Occupancy by Household Size in Woodbourne
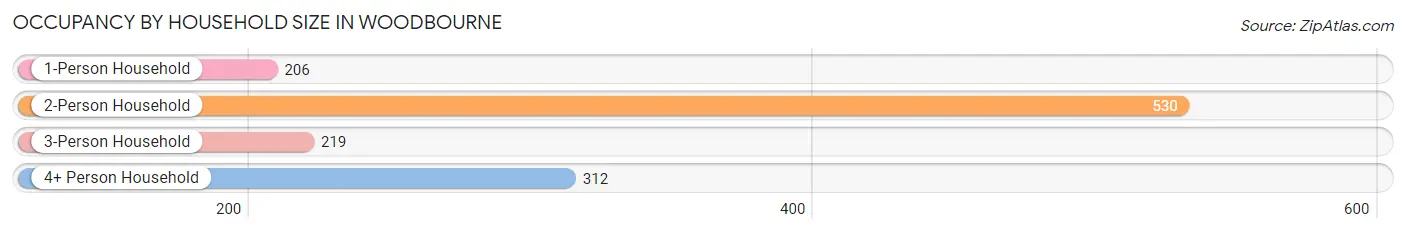
| Household Size | # Housing Units | % Housing Units |
| 1-Person Household | 206 | 16.3% |
| 2-Person Household | 530 | 41.8% |
| 3-Person Household | 219 | 17.3% |
| 4+ Person Household | 312 | 24.6% |
| Total Housing Units | 1,267 | 100.0% |
Occupancy by Ownership by Household Size in Woodbourne
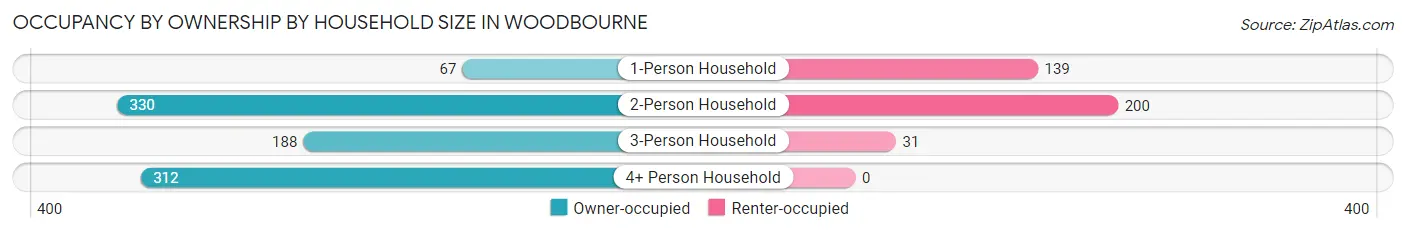
| Household Size | Owner-occupied | Renter-occupied |
| 1-Person Household | 67 (32.5%) | 139 (67.5%) |
| 2-Person Household | 330 (62.3%) | 200 (37.7%) |
| 3-Person Household | 188 (85.8%) | 31 (14.2%) |
| 4+ Person Household | 312 (100.0%) | 0 (0.0%) |
| Total Housing Units | 897 (70.8%) | 370 (29.2%) |
Occupancy by Educational Attainment in Woodbourne
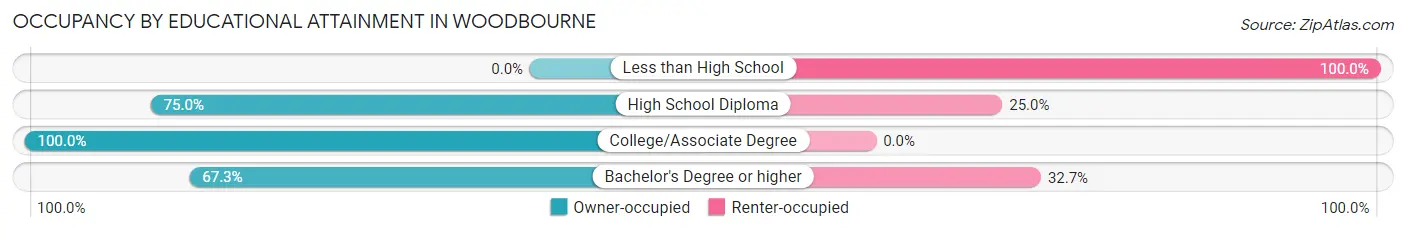
| Household Size | Owner-occupied | Renter-occupied |
| Less than High School | 0 (0.0%) | 15 (100.0%) |
| High School Diploma | 30 (75.0%) | 10 (25.0%) |
| College/Associate Degree | 156 (100.0%) | 0 (0.0%) |
| Bachelor's Degree or higher | 711 (67.3%) | 345 (32.7%) |
Occupancy by Age of Householder in Woodbourne
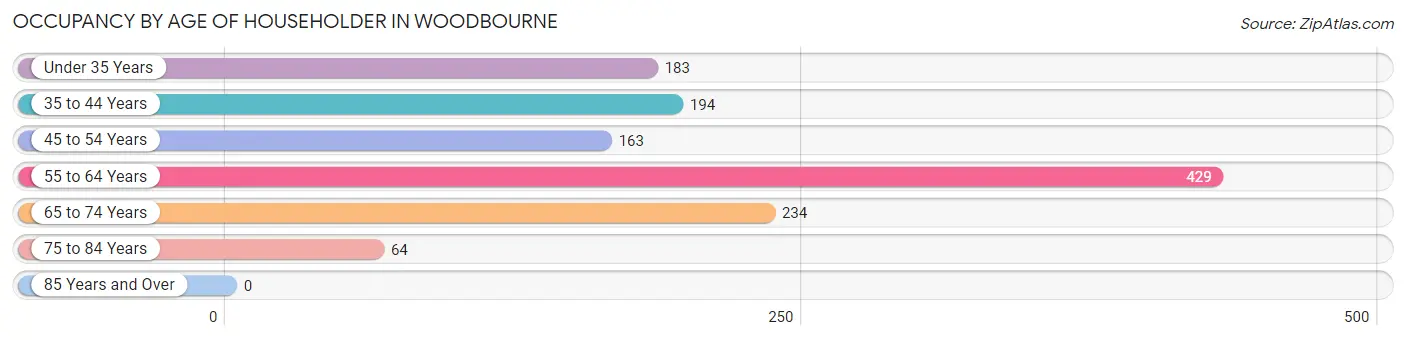
| Age Bracket | # Households | % Households |
| Under 35 Years | 183 | 14.4% |
| 35 to 44 Years | 194 | 15.3% |
| 45 to 54 Years | 163 | 12.9% |
| 55 to 64 Years | 429 | 33.9% |
| 65 to 74 Years | 234 | 18.5% |
| 75 to 84 Years | 64 | 5.1% |
| 85 Years and Over | 0 | 0.0% |
| Total | 1,267 | 100.0% |
Housing Finances in Woodbourne
Median Income by Occupancy in Woodbourne
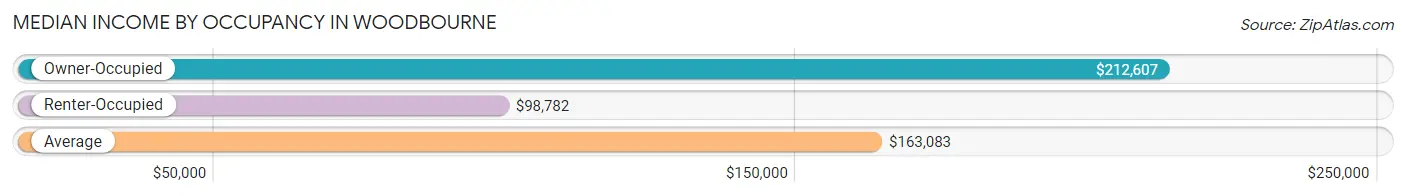
| Occupancy Type | # Households | Median Income |
| Owner-Occupied | 897 (70.8%) | $212,607 |
| Renter-Occupied | 370 (29.2%) | $98,782 |
| Average | 1,267 (100.0%) | $163,083 |
Occupancy by Householder Income Bracket in Woodbourne
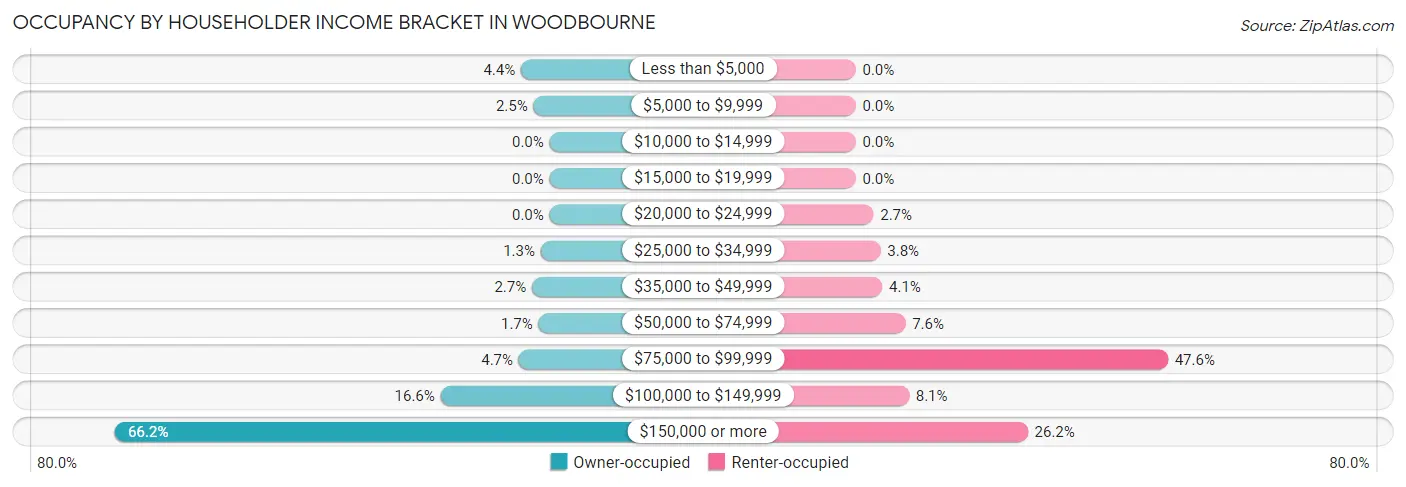
| Income Bracket | Owner-occupied | Renter-occupied |
| Less than $5,000 | 39 (4.3%) | 0 (0.0%) |
| $5,000 to $9,999 | 22 (2.5%) | 0 (0.0%) |
| $10,000 to $14,999 | 0 (0.0%) | 0 (0.0%) |
| $15,000 to $19,999 | 0 (0.0%) | 0 (0.0%) |
| $20,000 to $24,999 | 0 (0.0%) | 10 (2.7%) |
| $25,000 to $34,999 | 12 (1.3%) | 14 (3.8%) |
| $35,000 to $49,999 | 24 (2.7%) | 15 (4.1%) |
| $50,000 to $74,999 | 15 (1.7%) | 28 (7.6%) |
| $75,000 to $99,999 | 42 (4.7%) | 176 (47.6%) |
| $100,000 to $149,999 | 149 (16.6%) | 30 (8.1%) |
| $150,000 or more | 594 (66.2%) | 97 (26.2%) |
| Total | 897 (100.0%) | 370 (100.0%) |
Monthly Housing Cost Tiers in Woodbourne
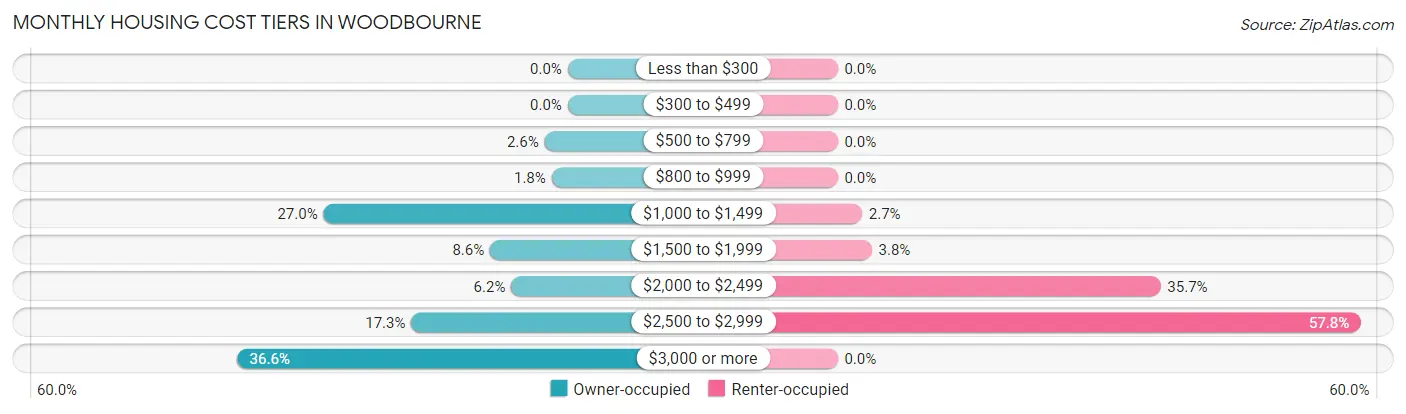
| Monthly Cost | Owner-occupied | Renter-occupied |
| Less than $300 | 0 (0.0%) | 0 (0.0%) |
| $300 to $499 | 0 (0.0%) | 0 (0.0%) |
| $500 to $799 | 23 (2.6%) | 0 (0.0%) |
| $800 to $999 | 16 (1.8%) | 0 (0.0%) |
| $1,000 to $1,499 | 242 (27.0%) | 10 (2.7%) |
| $1,500 to $1,999 | 77 (8.6%) | 14 (3.8%) |
| $2,000 to $2,499 | 56 (6.2%) | 132 (35.7%) |
| $2,500 to $2,999 | 155 (17.3%) | 214 (57.8%) |
| $3,000 or more | 328 (36.6%) | 0 (0.0%) |
| Total | 897 (100.0%) | 370 (100.0%) |
Physical Housing Characteristics in Woodbourne
Housing Structures in Woodbourne
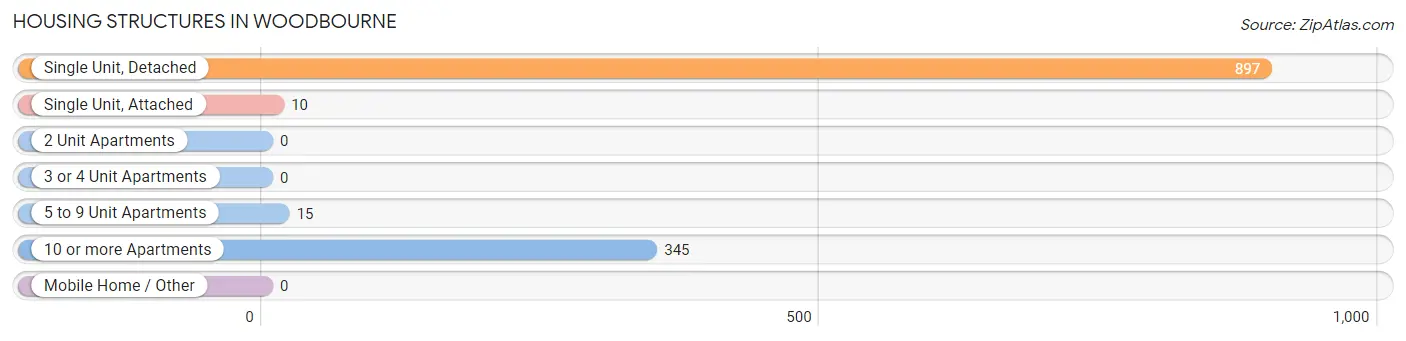
| Structure Type | # Housing Units | % Housing Units |
| Single Unit, Detached | 897 | 70.8% |
| Single Unit, Attached | 10 | 0.8% |
| 2 Unit Apartments | 0 | 0.0% |
| 3 or 4 Unit Apartments | 0 | 0.0% |
| 5 to 9 Unit Apartments | 15 | 1.2% |
| 10 or more Apartments | 345 | 27.2% |
| Mobile Home / Other | 0 | 0.0% |
| Total | 1,267 | 100.0% |
Housing Structures by Occupancy in Woodbourne
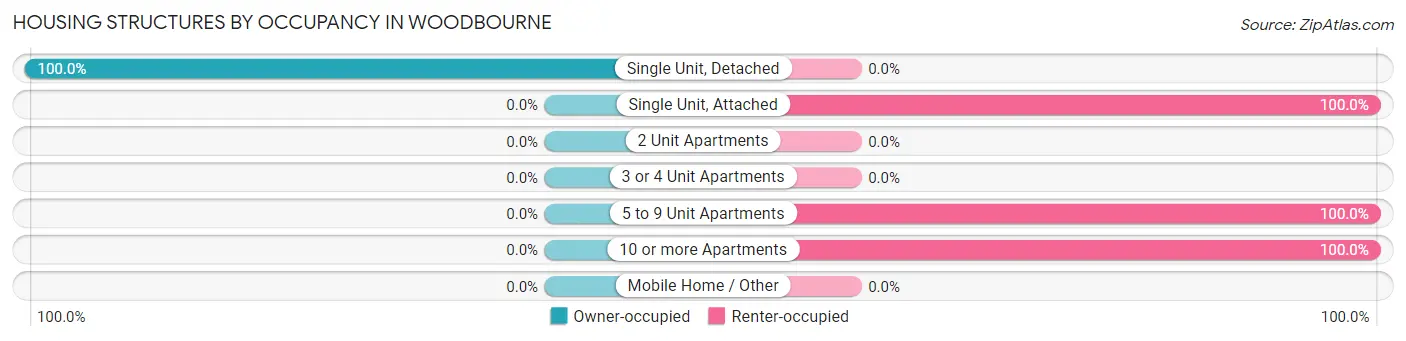
| Structure Type | Owner-occupied | Renter-occupied |
| Single Unit, Detached | 897 (100.0%) | 0 (0.0%) |
| Single Unit, Attached | 0 (0.0%) | 10 (100.0%) |
| 2 Unit Apartments | 0 (0.0%) | 0 (0.0%) |
| 3 or 4 Unit Apartments | 0 (0.0%) | 0 (0.0%) |
| 5 to 9 Unit Apartments | 0 (0.0%) | 15 (100.0%) |
| 10 or more Apartments | 0 (0.0%) | 345 (100.0%) |
| Mobile Home / Other | 0 (0.0%) | 0 (0.0%) |
| Total | 897 (70.8%) | 370 (29.2%) |
Housing Structures by Number of Rooms in Woodbourne
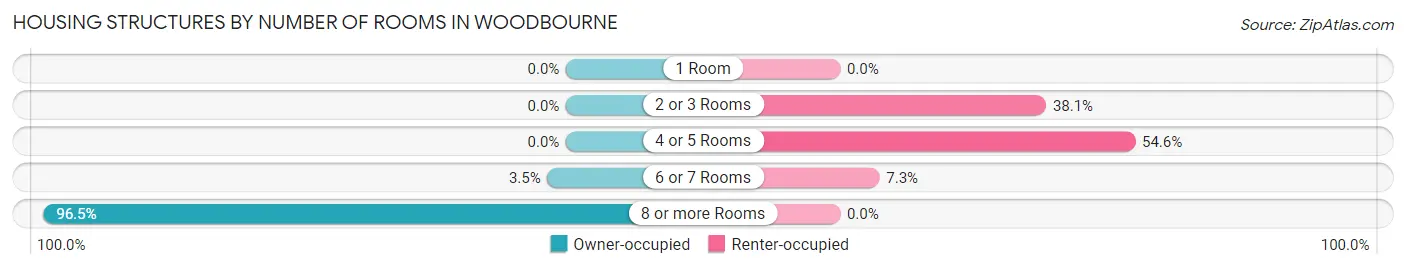
| Number of Rooms | Owner-occupied | Renter-occupied |
| 1 Room | 0 (0.0%) | 0 (0.0%) |
| 2 or 3 Rooms | 0 (0.0%) | 141 (38.1%) |
| 4 or 5 Rooms | 0 (0.0%) | 202 (54.6%) |
| 6 or 7 Rooms | 31 (3.5%) | 27 (7.3%) |
| 8 or more Rooms | 866 (96.5%) | 0 (0.0%) |
| Total | 897 (100.0%) | 370 (100.0%) |
Housing Structure by Heating Type in Woodbourne
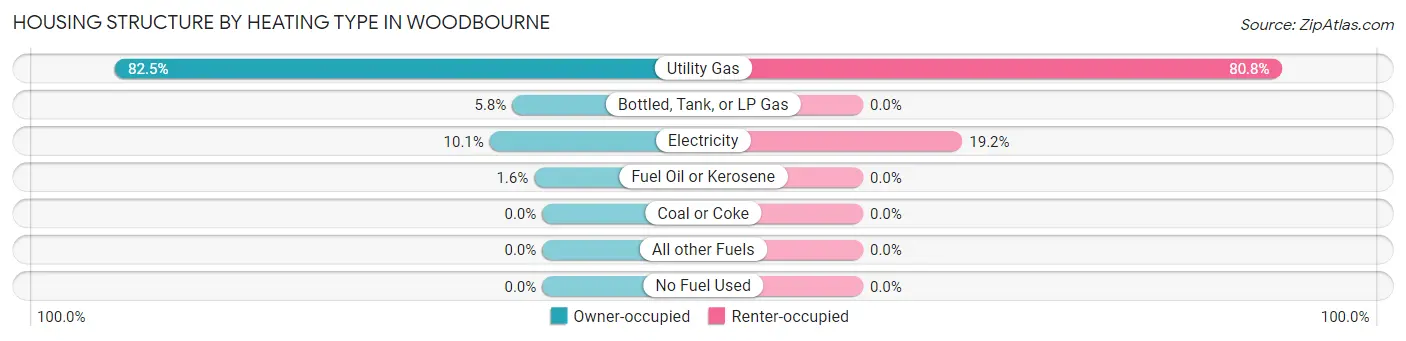
| Heating Type | Owner-occupied | Renter-occupied |
| Utility Gas | 740 (82.5%) | 299 (80.8%) |
| Bottled, Tank, or LP Gas | 52 (5.8%) | 0 (0.0%) |
| Electricity | 91 (10.1%) | 71 (19.2%) |
| Fuel Oil or Kerosene | 14 (1.6%) | 0 (0.0%) |
| Coal or Coke | 0 (0.0%) | 0 (0.0%) |
| All other Fuels | 0 (0.0%) | 0 (0.0%) |
| No Fuel Used | 0 (0.0%) | 0 (0.0%) |
| Total | 897 (100.0%) | 370 (100.0%) |
Household Vehicle Usage in Woodbourne
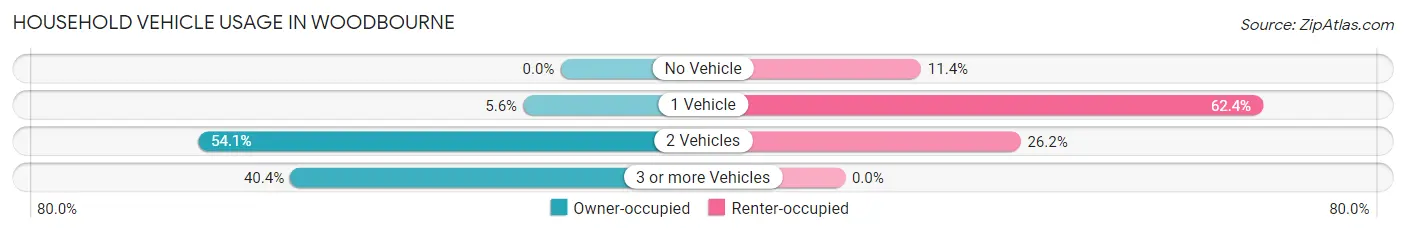
| Vehicles per Household | Owner-occupied | Renter-occupied |
| No Vehicle | 0 (0.0%) | 42 (11.4%) |
| 1 Vehicle | 50 (5.6%) | 231 (62.4%) |
| 2 Vehicles | 485 (54.1%) | 97 (26.2%) |
| 3 or more Vehicles | 362 (40.4%) | 0 (0.0%) |
| Total | 897 (100.0%) | 370 (100.0%) |
Real Estate & Mortgages in Woodbourne
Real Estate and Mortgage Overview in Woodbourne
| Characteristic | Without Mortgage | With Mortgage |
| Housing Units | 310 | 587 |
| Median Property Value | $572,900 | $599,500 |
| Median Household Income | $190,109 | $438 |
| Monthly Housing Costs | $1,359 | $328 |
| Real Estate Taxes | $9,238 | $0 |
Property Value by Mortgage Status in Woodbourne
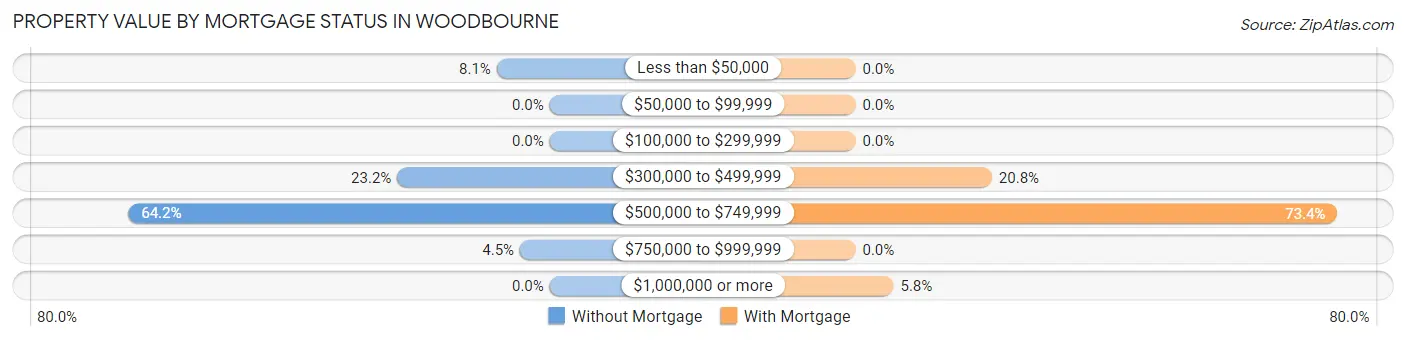
| Property Value | Without Mortgage | With Mortgage |
| Less than $50,000 | 25 (8.1%) | 0 (0.0%) |
| $50,000 to $99,999 | 0 (0.0%) | 0 (0.0%) |
| $100,000 to $299,999 | 0 (0.0%) | 0 (0.0%) |
| $300,000 to $499,999 | 72 (23.2%) | 122 (20.8%) |
| $500,000 to $749,999 | 199 (64.2%) | 431 (73.4%) |
| $750,000 to $999,999 | 14 (4.5%) | 0 (0.0%) |
| $1,000,000 or more | 0 (0.0%) | 34 (5.8%) |
| Total | 310 (100.0%) | 587 (100.0%) |
Household Income by Mortgage Status in Woodbourne
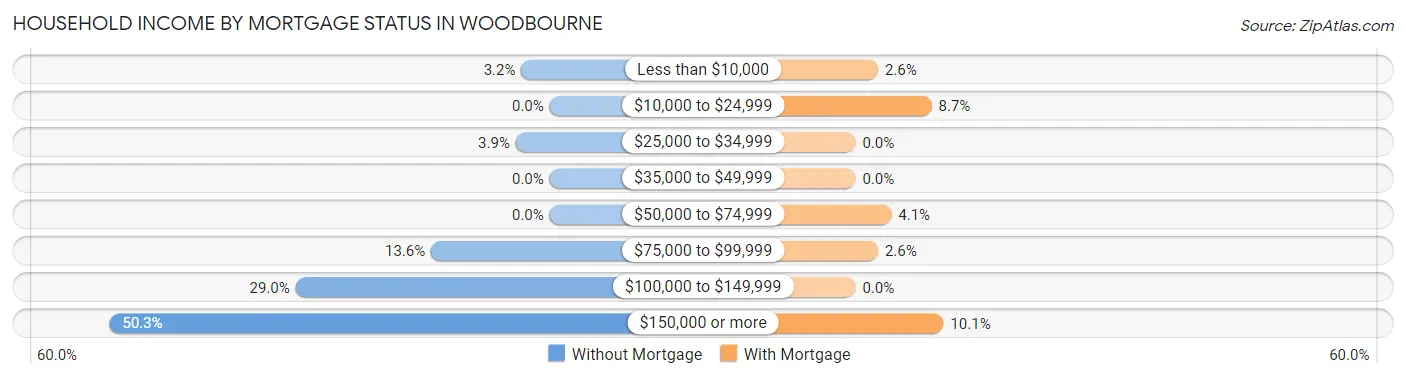
| Household Income | Without Mortgage | With Mortgage |
| Less than $10,000 | 10 (3.2%) | 15 (2.6%) |
| $10,000 to $24,999 | 0 (0.0%) | 51 (8.7%) |
| $25,000 to $34,999 | 12 (3.9%) | 0 (0.0%) |
| $35,000 to $49,999 | 0 (0.0%) | 0 (0.0%) |
| $50,000 to $74,999 | 0 (0.0%) | 24 (4.1%) |
| $75,000 to $99,999 | 42 (13.6%) | 15 (2.6%) |
| $100,000 to $149,999 | 90 (29.0%) | 0 (0.0%) |
| $150,000 or more | 156 (50.3%) | 59 (10.1%) |
| Total | 310 (100.0%) | 587 (100.0%) |
Property Value to Household Income Ratio in Woodbourne
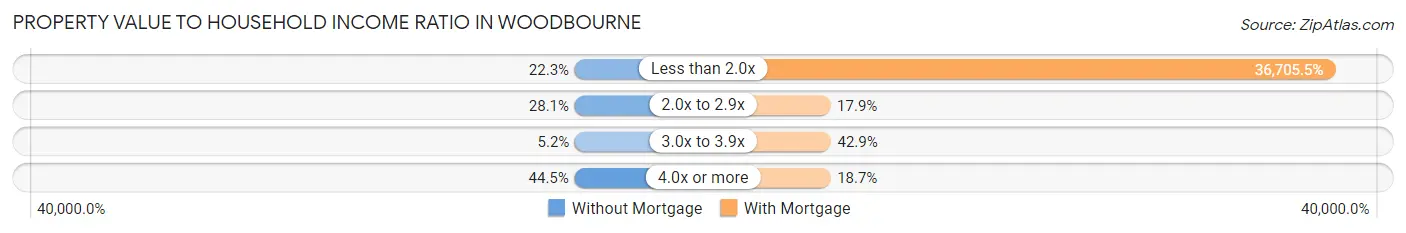
| Value-to-Income Ratio | Without Mortgage | With Mortgage |
| Less than 2.0x | 69 (22.3%) | 215,461 (36,705.5%) |
| 2.0x to 2.9x | 87 (28.1%) | 105 (17.9%) |
| 3.0x to 3.9x | 16 (5.2%) | 252 (42.9%) |
| 4.0x or more | 138 (44.5%) | 110 (18.7%) |
| Total | 310 (100.0%) | 587 (100.0%) |
Real Estate Taxes by Mortgage Status in Woodbourne
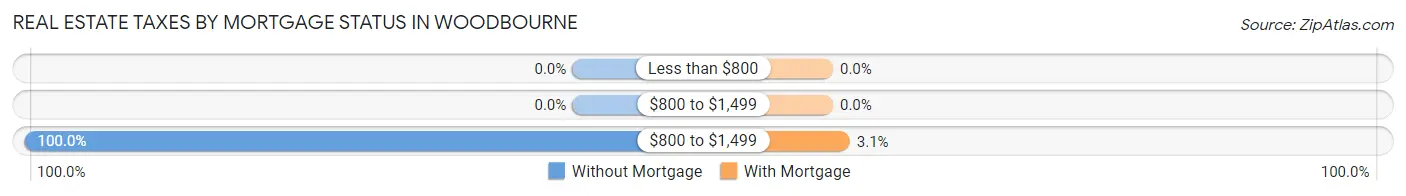
| Property Taxes | Without Mortgage | With Mortgage |
| Less than $800 | 0 (0.0%) | 0 (0.0%) |
| $800 to $1,499 | 0 (0.0%) | 0 (0.0%) |
| $800 to $1,499 | 310 (100.0%) | 18 (3.1%) |
| Total | 310 (100.0%) | 587 (100.0%) |
Health & Disability in Woodbourne
Health Insurance Coverage by Age in Woodbourne
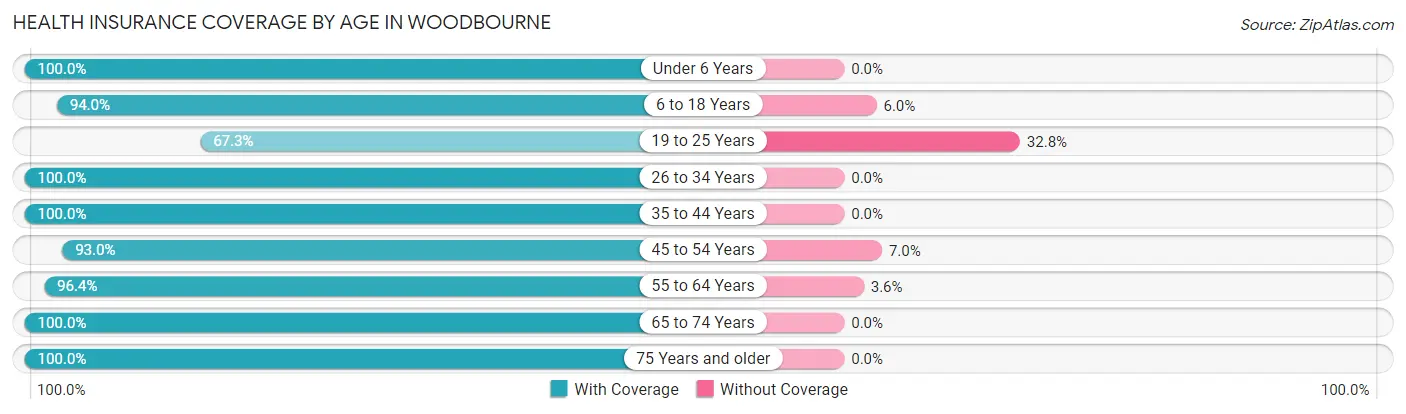
| Age Bracket | With Coverage | Without Coverage |
| Under 6 Years | 188 (100.0%) | 0 (0.0%) |
| 6 to 18 Years | 344 (94.0%) | 22 (6.0%) |
| 19 to 25 Years | 115 (67.2%) | 56 (32.8%) |
| 26 to 34 Years | 434 (100.0%) | 0 (0.0%) |
| 35 to 44 Years | 381 (100.0%) | 0 (0.0%) |
| 45 to 54 Years | 265 (93.0%) | 20 (7.0%) |
| 55 to 64 Years | 663 (96.4%) | 25 (3.6%) |
| 65 to 74 Years | 489 (100.0%) | 0 (0.0%) |
| 75 Years and older | 346 (100.0%) | 0 (0.0%) |
| Total | 3,225 (96.3%) | 123 (3.7%) |
Health Insurance Coverage by Citizenship Status in Woodbourne
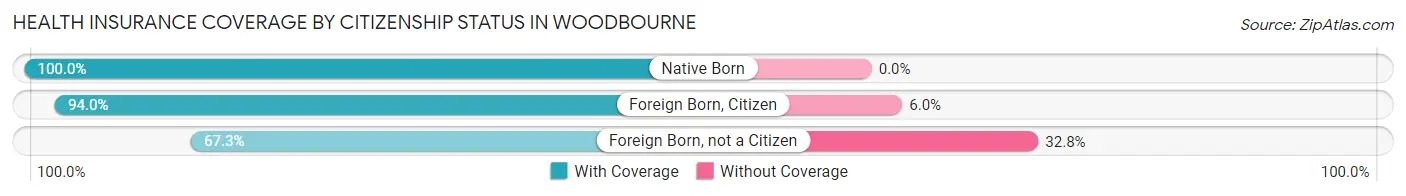
| Citizenship Status | With Coverage | Without Coverage |
| Native Born | 188 (100.0%) | 0 (0.0%) |
| Foreign Born, Citizen | 344 (94.0%) | 22 (6.0%) |
| Foreign Born, not a Citizen | 115 (67.2%) | 56 (32.8%) |
Health Insurance Coverage by Household Income in Woodbourne
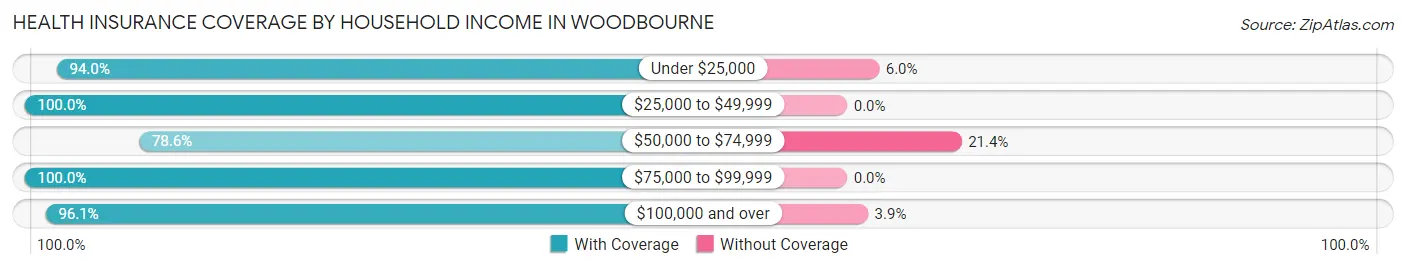
| Household Income | With Coverage | Without Coverage |
| Under $25,000 | 157 (94.0%) | 10 (6.0%) |
| $25,000 to $49,999 | 124 (100.0%) | 0 (0.0%) |
| $50,000 to $74,999 | 55 (78.6%) | 15 (21.4%) |
| $75,000 to $99,999 | 483 (100.0%) | 0 (0.0%) |
| $100,000 and over | 2,406 (96.1%) | 98 (3.9%) |
Public vs Private Health Insurance Coverage by Age in Woodbourne
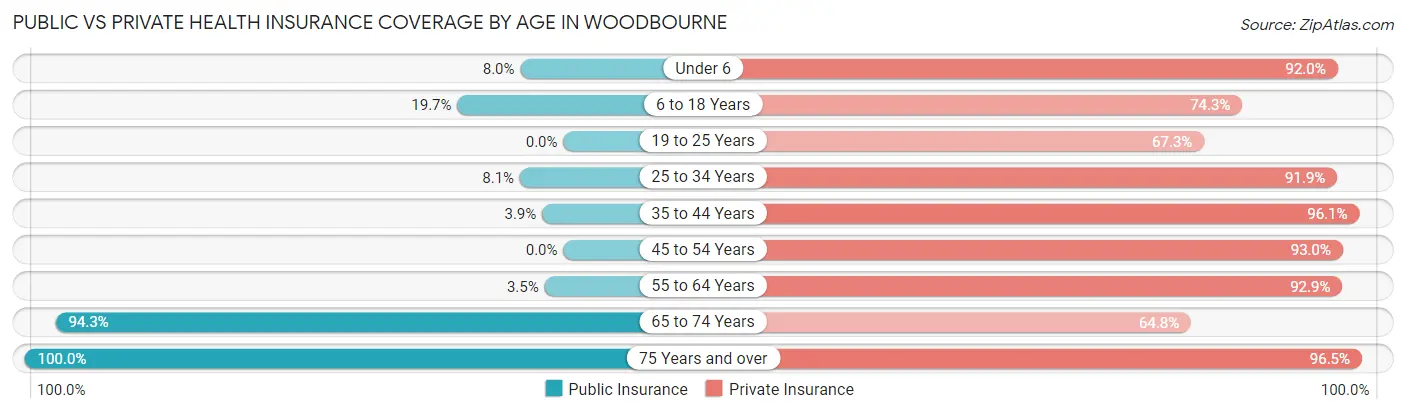
| Age Bracket | Public Insurance | Private Insurance |
| Under 6 | 15 (8.0%) | 173 (92.0%) |
| 6 to 18 Years | 72 (19.7%) | 272 (74.3%) |
| 19 to 25 Years | 0 (0.0%) | 115 (67.2%) |
| 25 to 34 Years | 35 (8.1%) | 399 (91.9%) |
| 35 to 44 Years | 15 (3.9%) | 366 (96.1%) |
| 45 to 54 Years | 0 (0.0%) | 265 (93.0%) |
| 55 to 64 Years | 24 (3.5%) | 639 (92.9%) |
| 65 to 74 Years | 461 (94.3%) | 317 (64.8%) |
| 75 Years and over | 346 (100.0%) | 334 (96.5%) |
| Total | 968 (28.9%) | 2,880 (86.0%) |
Disability Status by Sex by Age in Woodbourne
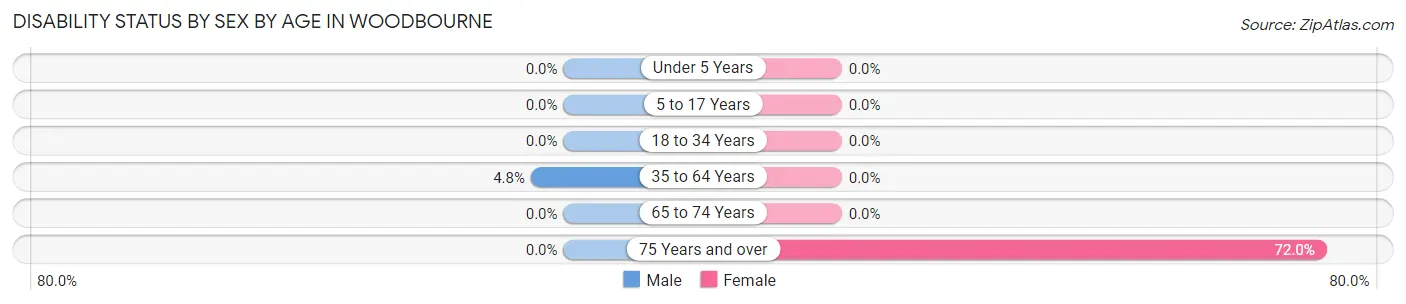
| Age Bracket | Male | Female |
| Under 5 Years | 0 (0.0%) | 0 (0.0%) |
| 5 to 17 Years | 0 (0.0%) | 0 (0.0%) |
| 18 to 34 Years | 0 (0.0%) | 0 (0.0%) |
| 35 to 64 Years | 34 (4.8%) | 0 (0.0%) |
| 65 to 74 Years | 0 (0.0%) | 0 (0.0%) |
| 75 Years and over | 0 (0.0%) | 203 (72.0%) |
Disability Class by Sex by Age in Woodbourne
Disability Class: Hearing Difficulty
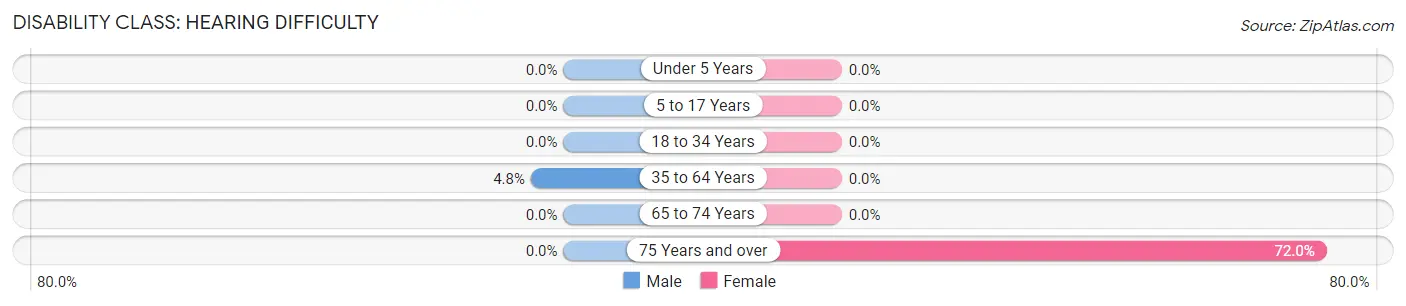
| Age Bracket | Male | Female |
| Under 5 Years | 0 (0.0%) | 0 (0.0%) |
| 5 to 17 Years | 0 (0.0%) | 0 (0.0%) |
| 18 to 34 Years | 0 (0.0%) | 0 (0.0%) |
| 35 to 64 Years | 34 (4.8%) | 0 (0.0%) |
| 65 to 74 Years | 0 (0.0%) | 0 (0.0%) |
| 75 Years and over | 0 (0.0%) | 203 (72.0%) |
Disability Class: Vision Difficulty
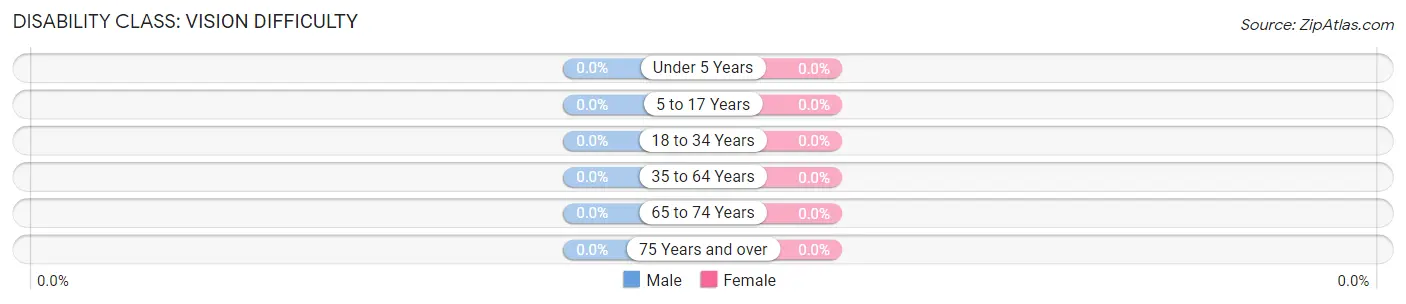
| Age Bracket | Male | Female |
| Under 5 Years | 0 (0.0%) | 0 (0.0%) |
| 5 to 17 Years | 0 (0.0%) | 0 (0.0%) |
| 18 to 34 Years | 0 (0.0%) | 0 (0.0%) |
| 35 to 64 Years | 0 (0.0%) | 0 (0.0%) |
| 65 to 74 Years | 0 (0.0%) | 0 (0.0%) |
| 75 Years and over | 0 (0.0%) | 0 (0.0%) |
Disability Class: Cognitive Difficulty
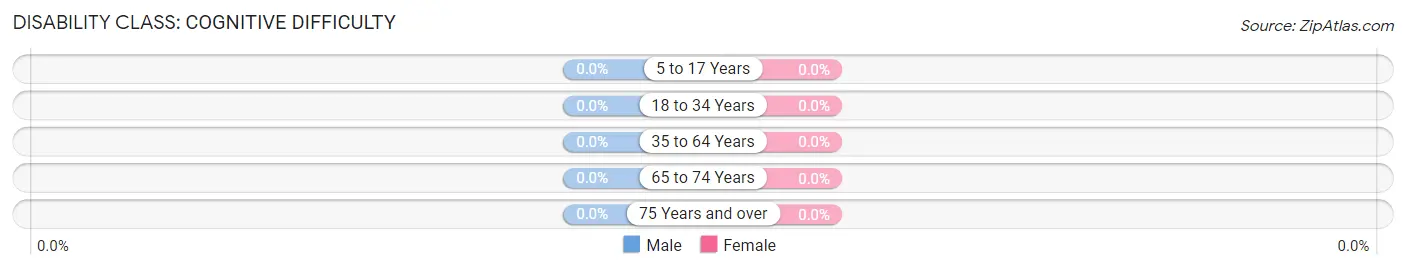
| Age Bracket | Male | Female |
| 5 to 17 Years | 0 (0.0%) | 0 (0.0%) |
| 18 to 34 Years | 0 (0.0%) | 0 (0.0%) |
| 35 to 64 Years | 0 (0.0%) | 0 (0.0%) |
| 65 to 74 Years | 0 (0.0%) | 0 (0.0%) |
| 75 Years and over | 0 (0.0%) | 0 (0.0%) |
Disability Class: Ambulatory Difficulty
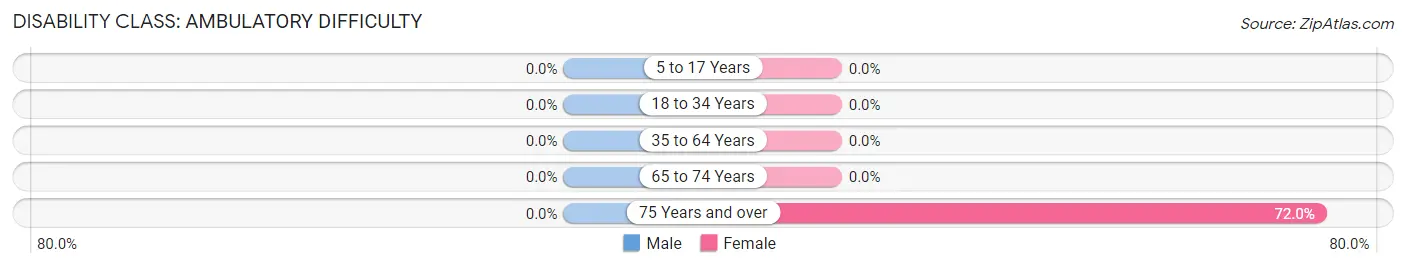
| Age Bracket | Male | Female |
| 5 to 17 Years | 0 (0.0%) | 0 (0.0%) |
| 18 to 34 Years | 0 (0.0%) | 0 (0.0%) |
| 35 to 64 Years | 0 (0.0%) | 0 (0.0%) |
| 65 to 74 Years | 0 (0.0%) | 0 (0.0%) |
| 75 Years and over | 0 (0.0%) | 203 (72.0%) |
Disability Class: Self-Care Difficulty
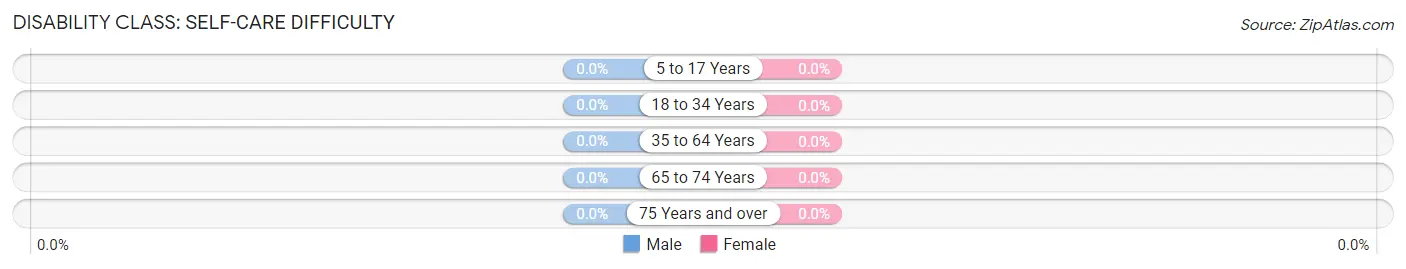
| Age Bracket | Male | Female |
| 5 to 17 Years | 0 (0.0%) | 0 (0.0%) |
| 18 to 34 Years | 0 (0.0%) | 0 (0.0%) |
| 35 to 64 Years | 0 (0.0%) | 0 (0.0%) |
| 65 to 74 Years | 0 (0.0%) | 0 (0.0%) |
| 75 Years and over | 0 (0.0%) | 0 (0.0%) |
Technology Access in Woodbourne
Computing Device Access in Woodbourne
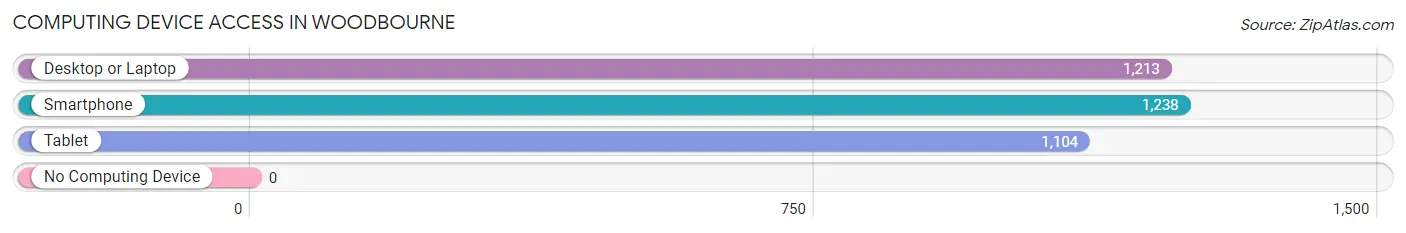
| Device Type | # Households | % Households |
| Desktop or Laptop | 1,213 | 95.7% |
| Smartphone | 1,238 | 97.7% |
| Tablet | 1,104 | 87.1% |
| No Computing Device | 0 | 0.0% |
| Total | 1,267 | 100.0% |
Internet Access in Woodbourne
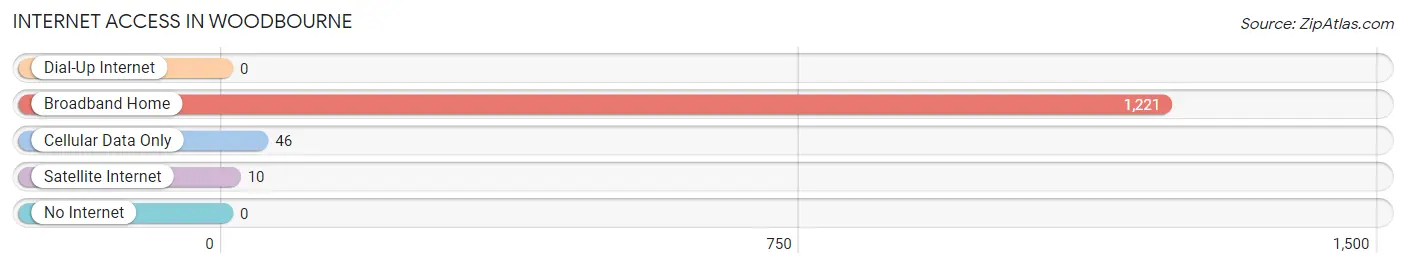
| Internet Type | # Households | % Households |
| Dial-Up Internet | 0 | 0.0% |
| Broadband Home | 1,221 | 96.4% |
| Cellular Data Only | 46 | 3.6% |
| Satellite Internet | 10 | 0.8% |
| No Internet | 0 | 0.0% |
| Total | 1,267 | 100.0% |
Woodbourne Summary
Woodbourne is a small borough located in the state of Pennsylvania, in the United States of America. It is situated in the northern part of the state, in the county of Sullivan. The population of Woodbourne was 1,845 as of the 2010 census.
Geography
Woodbourne is located at 41°25'N 75°45'W. It is situated in the northern part of the state, in the county of Sullivan. The borough is bordered by the townships of Cherry, Colley, Davidson, and Elkland. The terrain of the area is mostly hilly, with some flat areas. The highest point in the borough is located at an elevation of 1,845 feet. The climate of the area is humid continental, with cold winters and warm summers.
History
Woodbourne was founded in 1845 by a group of settlers from New England. The town was named after the nearby Woodbourne Creek. The first post office was established in 1848. The town grew slowly, and by the early 1900s, it had a population of around 500 people.
In the early 20th century, the town began to experience a period of growth. The population increased to 1,000 by the 1930s. During this time, the town was home to several businesses, including a sawmill, a gristmill, and a tannery.
In the 1950s, the town experienced a period of decline. Many of the businesses closed, and the population decreased to around 500. In the late 1970s, the town began to experience a period of revitalization. Several new businesses opened, and the population increased to 1,000 by the 1990s.
Economy
The economy of Woodbourne is largely based on tourism. The town is home to several tourist attractions, including the Woodbourne Historical Society Museum, the Woodbourne Railroad Museum, and the Woodbourne Art Gallery. The town is also home to several restaurants, shops, and other businesses.
Demographics
As of the 2010 census, the population of Woodbourne was 1,845. The racial makeup of the town was 97.3% White, 0.7% African American, 0.3% Native American, 0.2% Asian, 0.1% Pacific Islander, 0.3% from other races, and 1.2% from two or more races. Hispanic or Latino of any race were 1.2% of the population.
The median household income in Woodbourne was $37,917, and the median family income was $45,000. The per capita income was $19,945. About 11.2% of families and 14.2% of the population were below the poverty line, including 18.2% of those under age 18 and 8.3% of those age 65 or over.
Conclusion
Woodbourne is a small borough located in the state of Pennsylvania. It is situated in the northern part of the state, in the county of Sullivan. The population of Woodbourne was 1,845 as of the 2010 census. The economy of the town is largely based on tourism, and the town is home to several tourist attractions. The racial makeup of the town is mostly White, with a small percentage of African American, Native American, Asian, and Pacific Islander residents. The median household income in Woodbourne was $37,917, and the median family income was $45,000.
Common Questions
What is Per Capita Income in Woodbourne?
Per Capita income in Woodbourne is $76,184.
What is the Median Family Income in Woodbourne?
Median Family Income in Woodbourne is $176,972.
What is the Median Household income in Woodbourne?
Median Household Income in Woodbourne is $163,083.
What is Income or Wage Gap in Woodbourne?
Income or Wage Gap in Woodbourne is 22.0%.
Women in Woodbourne earn 78.0 cents for every dollar earned by a man.
What is Inequality or Gini Index in Woodbourne?
Inequality or Gini Index in Woodbourne is 0.42.
What is the Total Population of Woodbourne?
Total Population of Woodbourne is 3,348.
What is the Total Male Population of Woodbourne?
Total Male Population of Woodbourne is 1,606.
What is the Total Female Population of Woodbourne?
Total Female Population of Woodbourne is 1,742.
What is the Ratio of Males per 100 Females in Woodbourne?
There are 92.19 Males per 100 Females in Woodbourne.
What is the Ratio of Females per 100 Males in Woodbourne?
There are 108.47 Females per 100 Males in Woodbourne.
What is the Median Population Age in Woodbourne?
Median Population Age in Woodbourne is 48.7 Years.
What is the Average Family Size in Woodbourne
Average Family Size in Woodbourne is 3.0 People.
What is the Average Household Size in Woodbourne
Average Household Size in Woodbourne is 2.6 People.
How Large is the Labor Force in Woodbourne?
There are 2,028 People in the Labor Forcein in Woodbourne.
What is the Percentage of People in the Labor Force in Woodbourne?
71.4% of People are in the Labor Force in Woodbourne.
What is the Unemployment Rate in Woodbourne?
Unemployment Rate in Woodbourne is 4.4%.