Mount Eagle, PA Map & Demographics
Mount Eagle Map
Mount Eagle Overview
$43,541
PER CAPITA INCOME
$100,625
AVG FAMILY INCOME
$63,333
AVG HOUSEHOLD INCOME
21.1%
WAGE / INCOME GAP [ % ]
78.9¢/ $1
WAGE / INCOME GAP [ $ ]
0.36
INEQUALITY / GINI INDEX
94
TOTAL POPULATION
56
MALE POPULATION
38
FEMALE POPULATION
147.37
MALES / 100 FEMALES
67.86
FEMALES / 100 MALES
55.1
MEDIAN AGE
2.7
AVG FAMILY SIZE
2.1
AVG HOUSEHOLD SIZE
61
LABOR FORCE [ PEOPLE ]
73.5%
PERCENT IN LABOR FORCE
Income in Mount Eagle
Income Overview in Mount Eagle
Per Capita Income in Mount Eagle is $43,541, while median incomes of families and households are $100,625 and $63,333 respectively.
| Characteristic | Number | Measure |
| Per Capita Income | 94 | $43,541 |
| Median Family Income | 30 | $100,625 |
| Mean Family Income | 30 | $108,623 |
| Median Household Income | 44 | $63,333 |
| Mean Household Income | 44 | $88,325 |
| Income Deficit | 30 | $0 |
| Wage / Income Gap (%) | 94 | 21.12% |
| Wage / Income Gap ($) | 94 | 78.88¢ per $1 |
| Gini / Inequality Index | 94 | 0.36 |
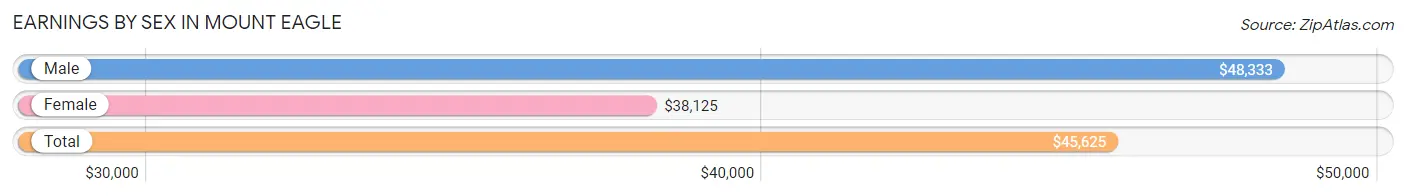
Earnings by Sex in Mount Eagle
Average Earnings in Mount Eagle are $45,625, $48,333 for men and $38,125 for women, a difference of 21.1%.
| Sex | Number | Average Earnings |
| Male | 38 (62.3%) | $48,333 |
| Female | 23 (37.7%) | $38,125 |
| Total | 61 (100.0%) | $45,625 |
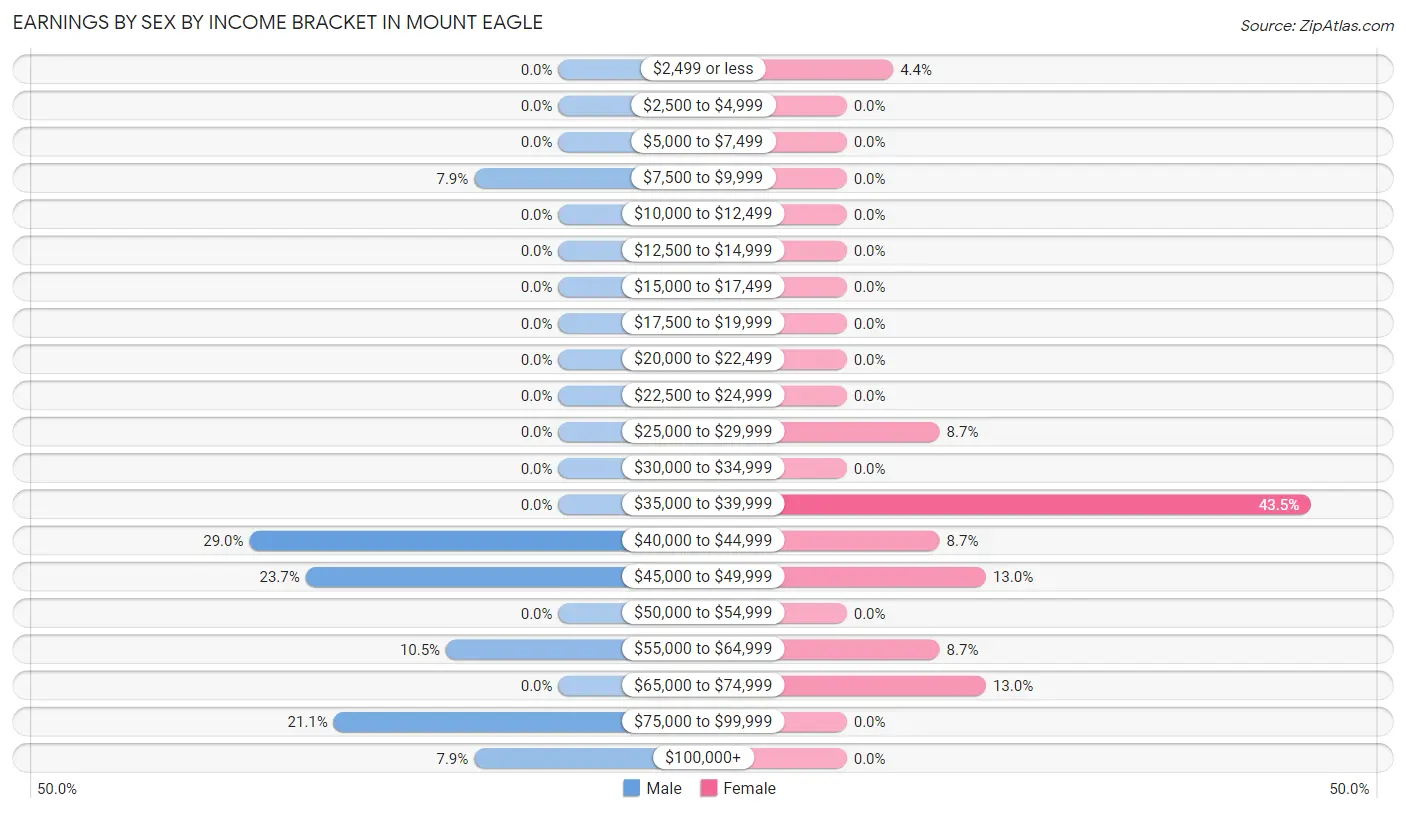
Earnings by Sex by Income Bracket in Mount Eagle
The most common earnings brackets in Mount Eagle are $40,000 to $44,999 for men (11 | 28.9%) and $35,000 to $39,999 for women (10 | 43.5%).
| Income | Male | Female |
| $2,499 or less | 0 (0.0%) | 1 (4.3%) |
| $2,500 to $4,999 | 0 (0.0%) | 0 (0.0%) |
| $5,000 to $7,499 | 0 (0.0%) | 0 (0.0%) |
| $7,500 to $9,999 | 3 (7.9%) | 0 (0.0%) |
| $10,000 to $12,499 | 0 (0.0%) | 0 (0.0%) |
| $12,500 to $14,999 | 0 (0.0%) | 0 (0.0%) |
| $15,000 to $17,499 | 0 (0.0%) | 0 (0.0%) |
| $17,500 to $19,999 | 0 (0.0%) | 0 (0.0%) |
| $20,000 to $22,499 | 0 (0.0%) | 0 (0.0%) |
| $22,500 to $24,999 | 0 (0.0%) | 0 (0.0%) |
| $25,000 to $29,999 | 0 (0.0%) | 2 (8.7%) |
| $30,000 to $34,999 | 0 (0.0%) | 0 (0.0%) |
| $35,000 to $39,999 | 0 (0.0%) | 10 (43.5%) |
| $40,000 to $44,999 | 11 (28.9%) | 2 (8.7%) |
| $45,000 to $49,999 | 9 (23.7%) | 3 (13.0%) |
| $50,000 to $54,999 | 0 (0.0%) | 0 (0.0%) |
| $55,000 to $64,999 | 4 (10.5%) | 2 (8.7%) |
| $65,000 to $74,999 | 0 (0.0%) | 3 (13.0%) |
| $75,000 to $99,999 | 8 (21.0%) | 0 (0.0%) |
| $100,000+ | 3 (7.9%) | 0 (0.0%) |
| Total | 38 (100.0%) | 23 (100.0%) |
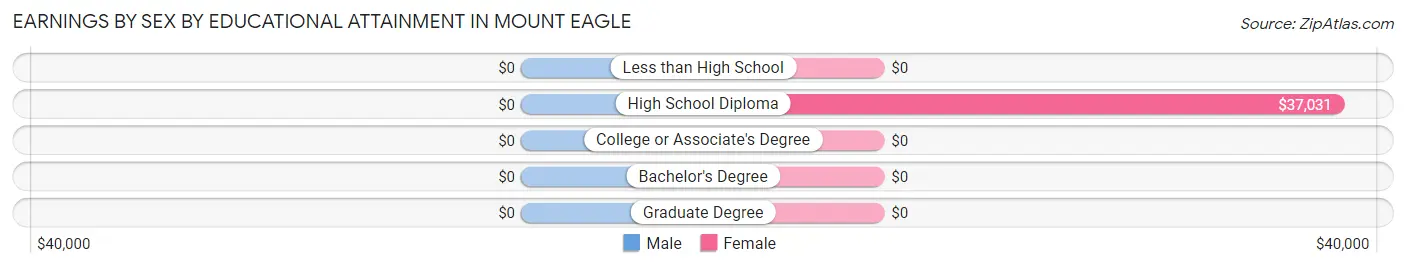
Earnings by Sex by Educational Attainment in Mount Eagle
| Educational Attainment | Male Income | Female Income |
| Less than High School | - | - |
| High School Diploma | - | - |
| College or Associate's Degree | - | - |
| Bachelor's Degree | - | - |
| Graduate Degree | - | - |
| Total | $60,417 | $38,750 |
Family Income in Mount Eagle
Family Income Brackets in Mount Eagle
According to the Mount Eagle family income data, there are 10 families falling into the $150,000 to $199,999 income range, which is the most common income bracket and makes up 33.3% of all families.
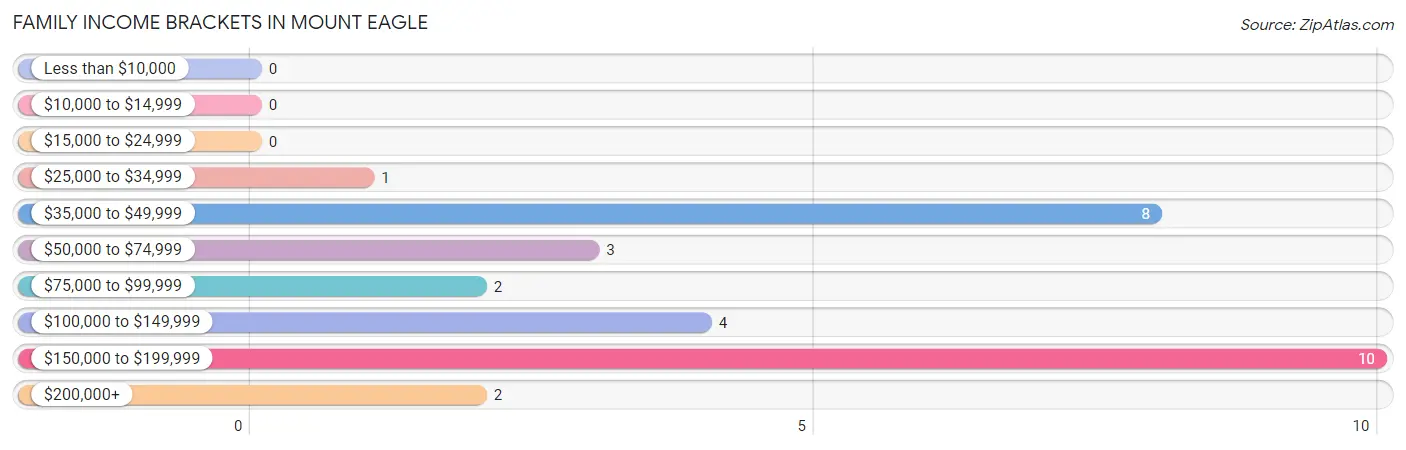
| Income Bracket | # Families | % Families |
| Less than $10,000 | 0 | 0.0% |
| $10,000 to $14,999 | 0 | 0.0% |
| $15,000 to $24,999 | 0 | 0.0% |
| $25,000 to $34,999 | 1 | 3.3% |
| $35,000 to $49,999 | 8 | 26.7% |
| $50,000 to $74,999 | 3 | 10.0% |
| $75,000 to $99,999 | 2 | 6.7% |
| $100,000 to $149,999 | 4 | 13.3% |
| $150,000 to $199,999 | 10 | 33.3% |
| $200,000+ | 2 | 6.7% |
Family Income by Famaliy Size in Mount Eagle
2-person families (18 | 60.0%) account for the highest median family income in Mount Eagle with $50,000 per family, while 2-person families (18 | 60.0%) have the highest median income of $25,000 per family member.
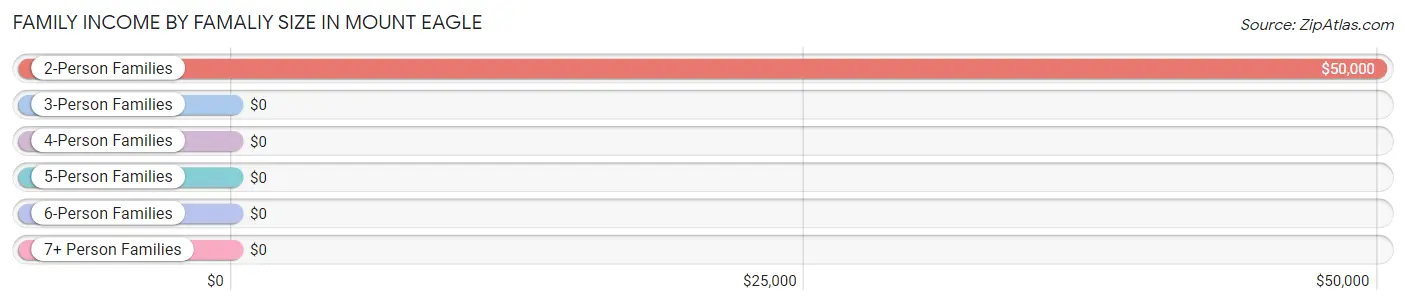
| Income Bracket | # Families | Median Income |
| 2-Person Families | 18 (60.0%) | $50,000 |
| 3-Person Families | 10 (33.3%) | $0 |
| 4-Person Families | 2 (6.7%) | $0 |
| 5-Person Families | 0 (0.0%) | $0 |
| 6-Person Families | 0 (0.0%) | $0 |
| 7+ Person Families | 0 (0.0%) | $0 |
| Total | 30 (100.0%) | $100,625 |
Family Income by Number of Earners in Mount Eagle
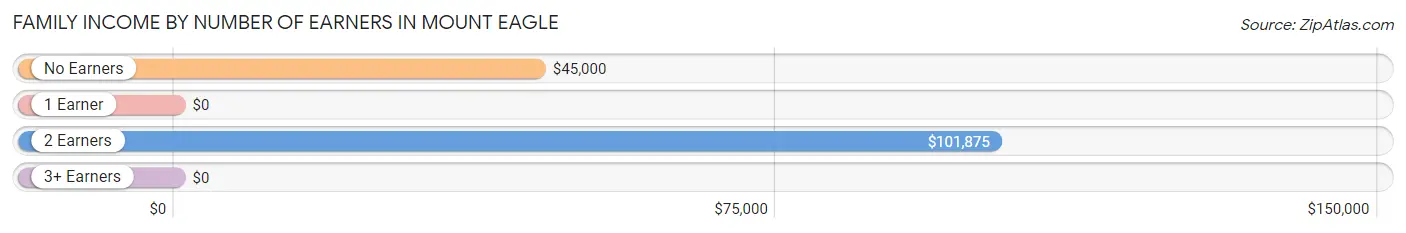
| Number of Earners | # Families | Median Income |
| No Earners | 6 (20.0%) | $45,000 |
| 1 Earner | 8 (26.7%) | $0 |
| 2 Earners | 6 (20.0%) | $101,875 |
| 3+ Earners | 10 (33.3%) | $0 |
| Total | 30 (100.0%) | $100,625 |
Household Income in Mount Eagle
Household Income Brackets in Mount Eagle
With 10 households falling in the category, the $35,000 to $49,999 income range is the most frequent in Mount Eagle, accounting for 22.7% of all households.
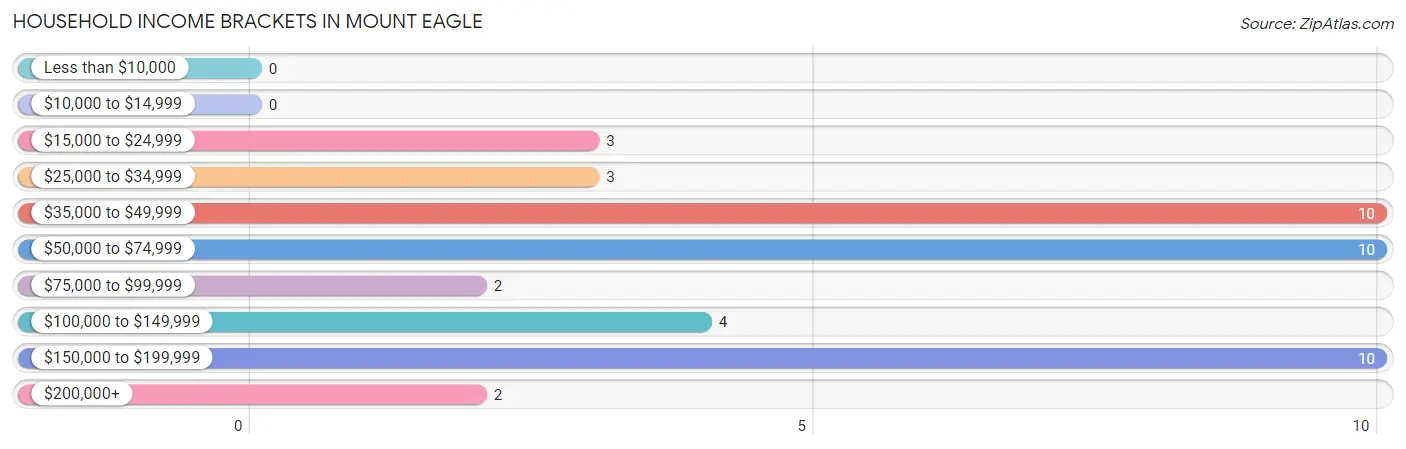
| Income Bracket | # Households | % Households |
| Less than $10,000 | 0 | 0.0% |
| $10,000 to $14,999 | 0 | 0.0% |
| $15,000 to $24,999 | 3 | 6.8% |
| $25,000 to $34,999 | 3 | 6.8% |
| $35,000 to $49,999 | 10 | 22.7% |
| $50,000 to $74,999 | 10 | 22.7% |
| $75,000 to $99,999 | 2 | 4.5% |
| $100,000 to $149,999 | 4 | 9.1% |
| $150,000 to $199,999 | 10 | 22.7% |
| $200,000+ | 2 | 4.5% |
Household Income by Householder Age in Mount Eagle
The median household income in Mount Eagle is $63,333, with the highest median household income of $63,333 found in the 25 to 44 years age bracket for the primary householder. A total of 14 households (31.8%) fall into this category.
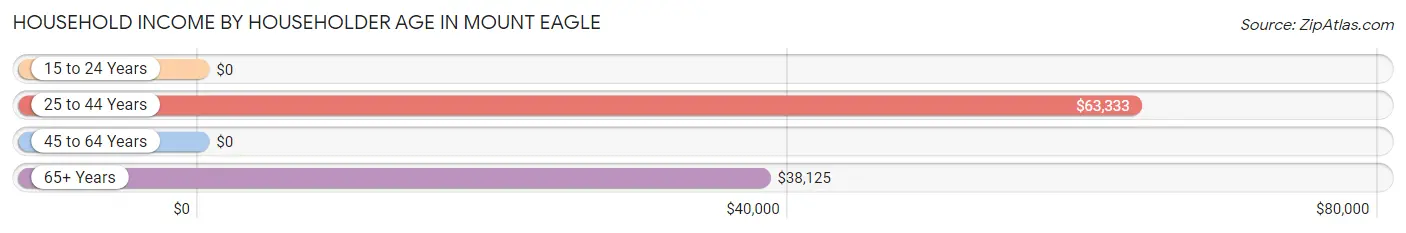
| Income Bracket | # Households | Median Income |
| 15 to 24 Years | 0 (0.0%) | $0 |
| 25 to 44 Years | 14 (31.8%) | $63,333 |
| 45 to 64 Years | 17 (38.6%) | $0 |
| 65+ Years | 13 (29.5%) | $38,125 |
| Total | 44 (100.0%) | $63,333 |
Poverty in Mount Eagle
Income Below Poverty by Sex and Age in Mount Eagle
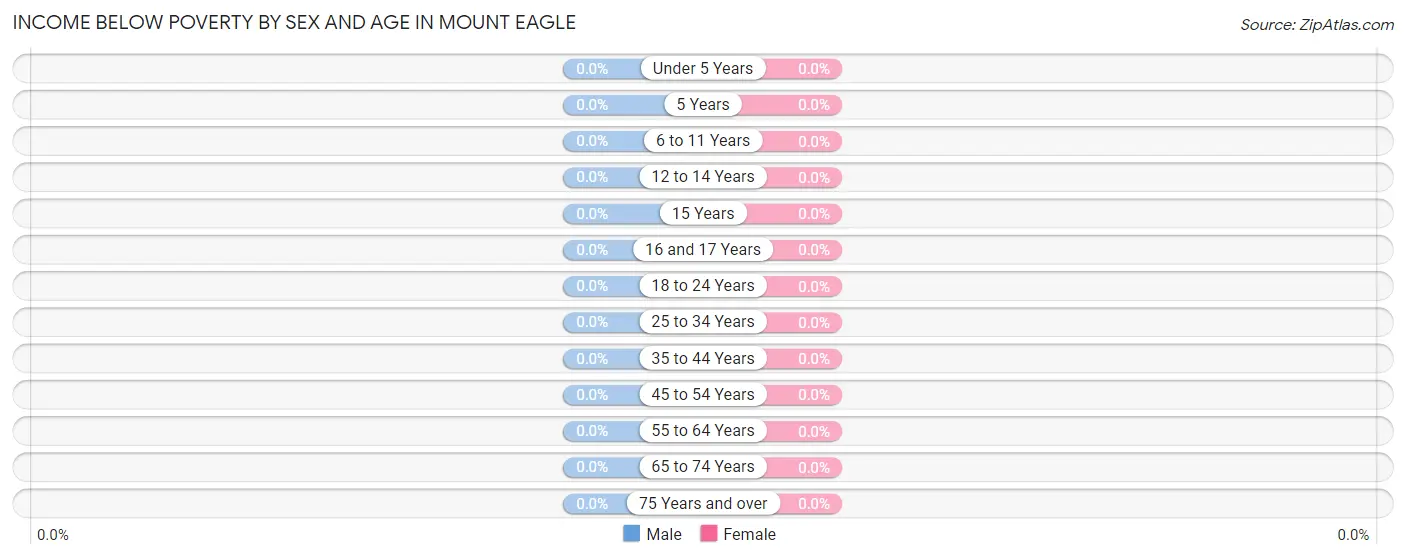
| Age Bracket | Male | Female |
| Under 5 Years | 0 (0.0%) | 0 (0.0%) |
| 5 Years | 0 (0.0%) | 0 (0.0%) |
| 6 to 11 Years | 0 (0.0%) | 0 (0.0%) |
| 12 to 14 Years | 0 (0.0%) | 0 (0.0%) |
| 15 Years | 0 (0.0%) | 0 (0.0%) |
| 16 and 17 Years | 0 (0.0%) | 0 (0.0%) |
| 18 to 24 Years | 0 (0.0%) | 0 (0.0%) |
| 25 to 34 Years | 0 (0.0%) | 0 (0.0%) |
| 35 to 44 Years | 0 (0.0%) | 0 (0.0%) |
| 45 to 54 Years | 0 (0.0%) | 0 (0.0%) |
| 55 to 64 Years | 0 (0.0%) | 0 (0.0%) |
| 65 to 74 Years | 0 (0.0%) | 0 (0.0%) |
| 75 Years and over | 0 (0.0%) | 0 (0.0%) |
| Total | 0 (0.0%) | 0 (0.0%) |
Income Above Poverty by Sex and Age in Mount Eagle
According to the poverty statistics in Mount Eagle, males aged 6 to 11 years and females aged 6 to 11 years are the age groups that are most secure financially, with 100.0% of males and 100.0% of females in these age groups living above the poverty line.
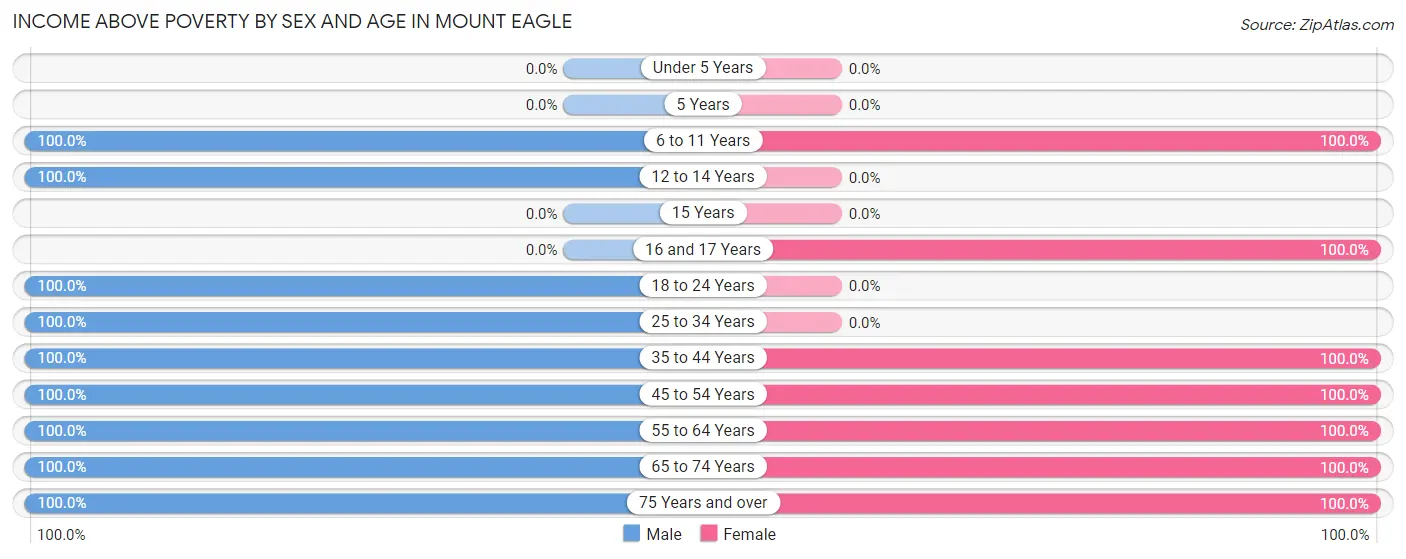
| Age Bracket | Male | Female |
| Under 5 Years | 0 (0.0%) | 0 (0.0%) |
| 5 Years | 0 (0.0%) | 0 (0.0%) |
| 6 to 11 Years | 3 (100.0%) | 5 (100.0%) |
| 12 to 14 Years | 3 (100.0%) | 0 (0.0%) |
| 15 Years | 0 (0.0%) | 0 (0.0%) |
| 16 and 17 Years | 0 (0.0%) | 1 (100.0%) |
| 18 to 24 Years | 9 (100.0%) | 0 (0.0%) |
| 25 to 34 Years | 9 (100.0%) | 0 (0.0%) |
| 35 to 44 Years | 6 (100.0%) | 5 (100.0%) |
| 45 to 54 Years | 3 (100.0%) | 2 (100.0%) |
| 55 to 64 Years | 15 (100.0%) | 15 (100.0%) |
| 65 to 74 Years | 5 (100.0%) | 5 (100.0%) |
| 75 Years and over | 3 (100.0%) | 5 (100.0%) |
| Total | 56 (100.0%) | 38 (100.0%) |
Income Below Poverty Among Married-Couple Families in Mount Eagle
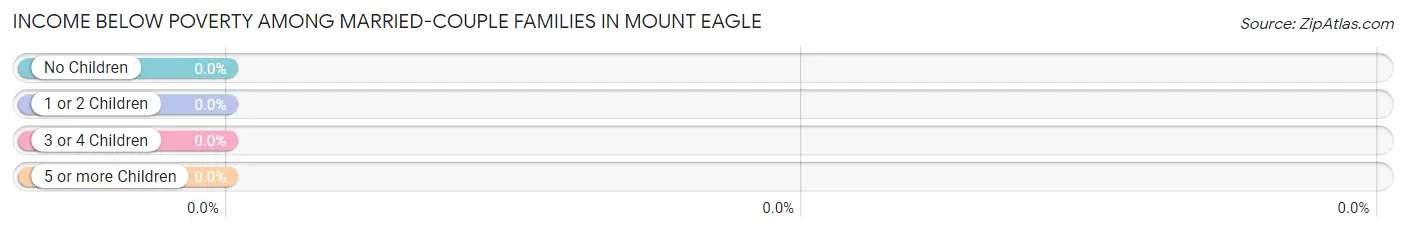
| Children | Above Poverty | Below Poverty |
| No Children | 16 (100.0%) | 0 (0.0%) |
| 1 or 2 Children | 5 (100.0%) | 0 (0.0%) |
| 3 or 4 Children | 0 (0.0%) | 0 (0.0%) |
| 5 or more Children | 0 (0.0%) | 0 (0.0%) |
| Total | 21 (100.0%) | 0 (0.0%) |
Income Below Poverty Among Single-Parent Households in Mount Eagle
| Children | Single Father | Single Mother |
| No Children | 0 (0.0%) | 0 (0.0%) |
| 1 or 2 Children | 0 (0.0%) | 0 (0.0%) |
| 3 or 4 Children | 0 (0.0%) | 0 (0.0%) |
| 5 or more Children | 0 (0.0%) | 0 (0.0%) |
| Total | 0 (0.0%) | 0 (0.0%) |
Income Below Poverty Among Married-Couple vs Single-Parent Households in Mount Eagle
| Children | Married-Couple Families | Single-Parent Households |
| No Children | 0 (0.0%) | 0 (0.0%) |
| 1 or 2 Children | 0 (0.0%) | 0 (0.0%) |
| 3 or 4 Children | 0 (0.0%) | 0 (0.0%) |
| 5 or more Children | 0 (0.0%) | 0 (0.0%) |
| Total | 0 (0.0%) | 0 (0.0%) |
Race in Mount Eagle
The most populous races in Mount Eagle are White / Caucasian (93 | 98.9%), Hispanic or Latino (1 | 1.1%), and Two or more Races (1 | 1.1%).
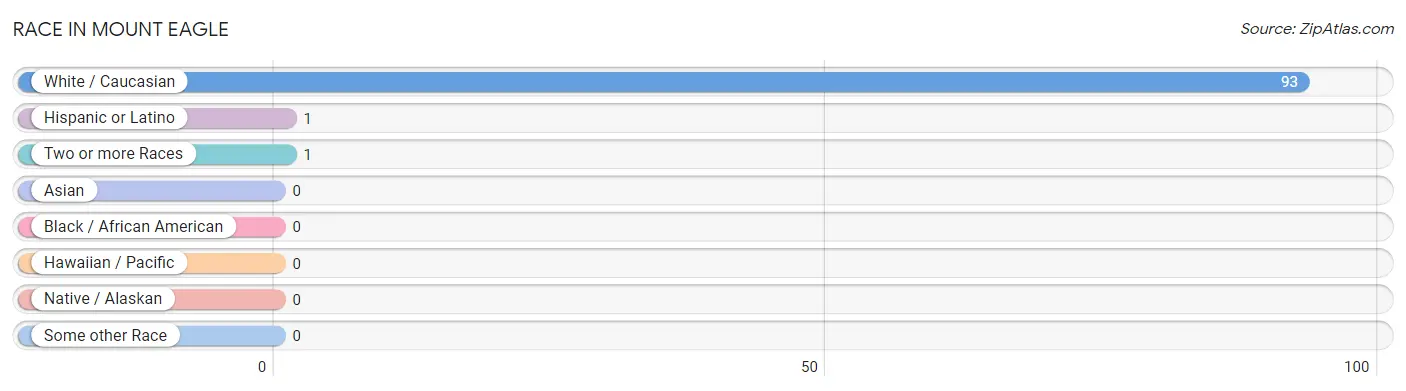
| Race | # Population | % Population |
| Asian | 0 | 0.0% |
| Black / African American | 0 | 0.0% |
| Hawaiian / Pacific | 0 | 0.0% |
| Hispanic or Latino | 1 | 1.1% |
| Native / Alaskan | 0 | 0.0% |
| White / Caucasian | 93 | 98.9% |
| Two or more Races | 1 | 1.1% |
| Some other Race | 0 | 0.0% |
| Total | 94 | 100.0% |
Ancestry in Mount Eagle
The most populous ancestries reported in Mount Eagle are German (27 | 28.7%), Irish (14 | 14.9%), Pennsylvania German (12 | 12.8%), Polish (11 | 11.7%), and Italian (6 | 6.4%), together accounting for 74.5% of all Mount Eagle residents.
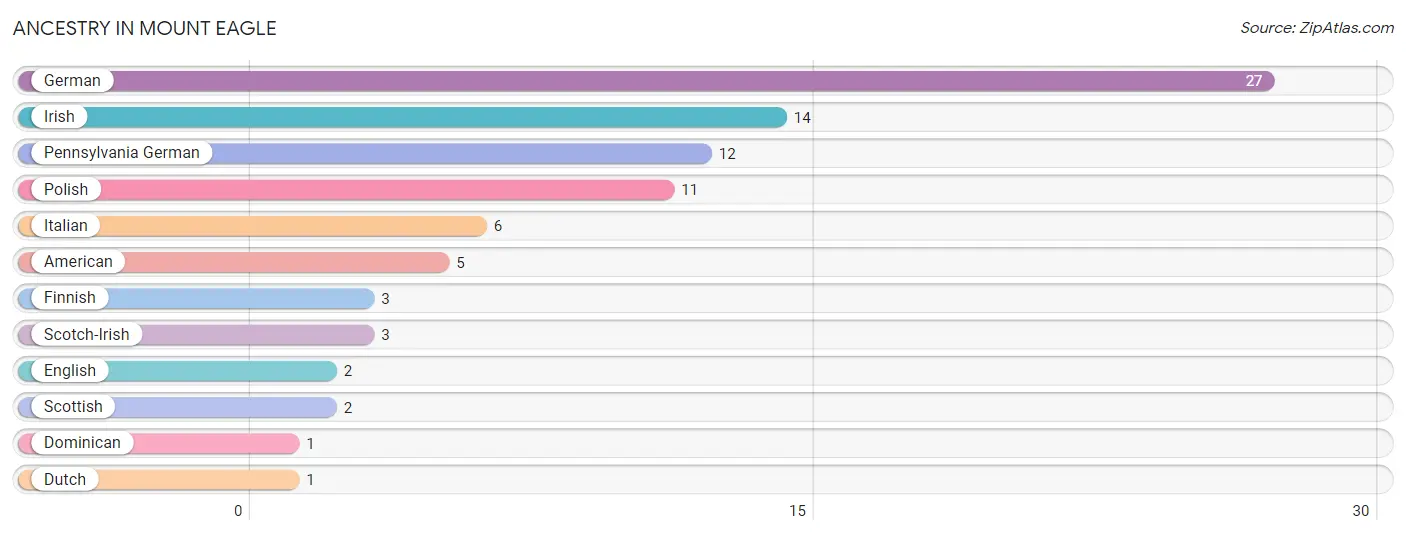
| Ancestry | # Population | % Population |
| American | 5 | 5.3% |
| Dominican | 1 | 1.1% |
| Dutch | 1 | 1.1% |
| English | 2 | 2.1% |
| Finnish | 3 | 3.2% |
| German | 27 | 28.7% |
| Irish | 14 | 14.9% |
| Italian | 6 | 6.4% |
| Pennsylvania German | 12 | 12.8% |
| Polish | 11 | 11.7% |
| Scotch-Irish | 3 | 3.2% |
| Scottish | 2 | 2.1% | View All 12 Rows |
Immigrants in Mount Eagle

| Immigration Origin | # Population | % Population | View All 0 Rows |
Sex and Age in Mount Eagle
Sex and Age in Mount Eagle
The most populous age groups in Mount Eagle are 55 to 59 Years (11 | 19.6%) for men and 55 to 59 Years (12 | 31.6%) for women.
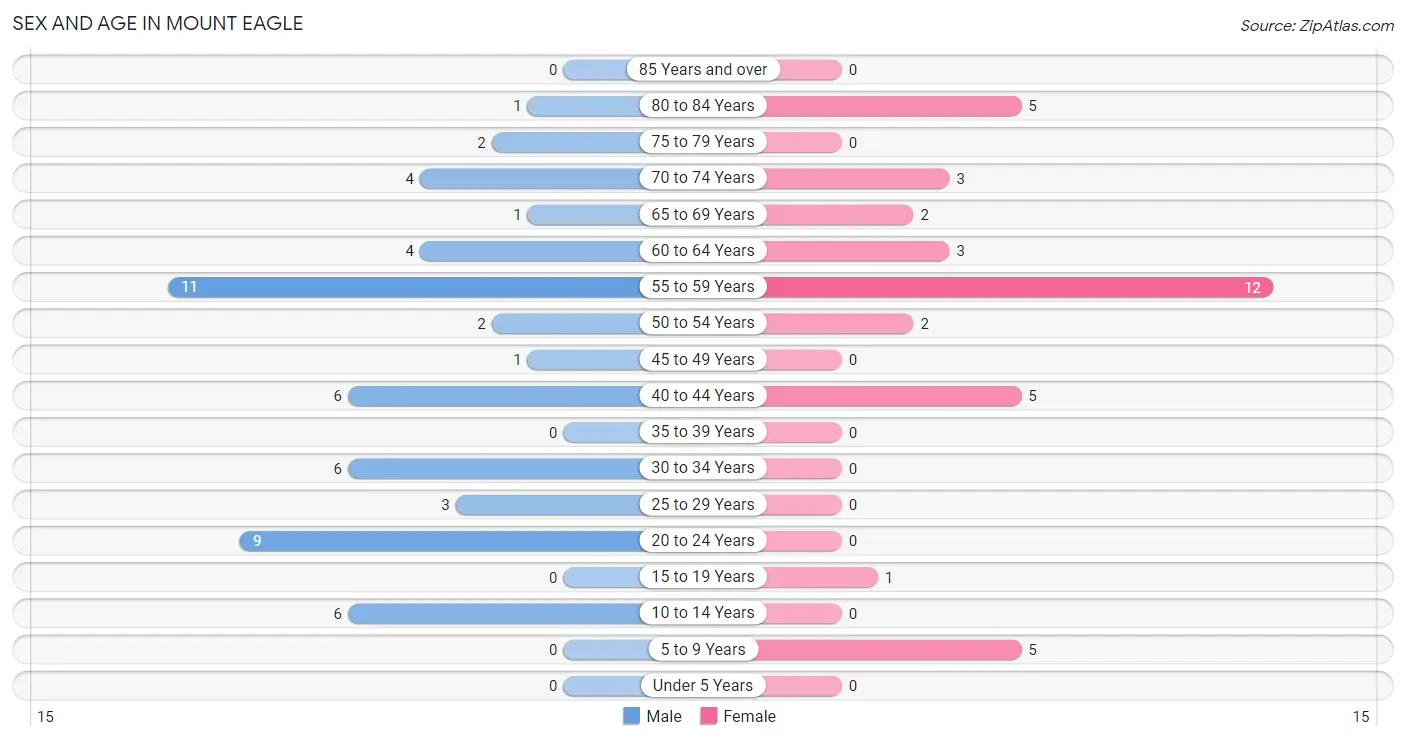
| Age Bracket | Male | Female |
| Under 5 Years | 0 (0.0%) | 0 (0.0%) |
| 5 to 9 Years | 0 (0.0%) | 5 (13.2%) |
| 10 to 14 Years | 6 (10.7%) | 0 (0.0%) |
| 15 to 19 Years | 0 (0.0%) | 1 (2.6%) |
| 20 to 24 Years | 9 (16.1%) | 0 (0.0%) |
| 25 to 29 Years | 3 (5.4%) | 0 (0.0%) |
| 30 to 34 Years | 6 (10.7%) | 0 (0.0%) |
| 35 to 39 Years | 0 (0.0%) | 0 (0.0%) |
| 40 to 44 Years | 6 (10.7%) | 5 (13.2%) |
| 45 to 49 Years | 1 (1.8%) | 0 (0.0%) |
| 50 to 54 Years | 2 (3.6%) | 2 (5.3%) |
| 55 to 59 Years | 11 (19.6%) | 12 (31.6%) |
| 60 to 64 Years | 4 (7.1%) | 3 (7.9%) |
| 65 to 69 Years | 1 (1.8%) | 2 (5.3%) |
| 70 to 74 Years | 4 (7.1%) | 3 (7.9%) |
| 75 to 79 Years | 2 (3.6%) | 0 (0.0%) |
| 80 to 84 Years | 1 (1.8%) | 5 (13.2%) |
| 85 Years and over | 0 (0.0%) | 0 (0.0%) |
| Total | 56 (100.0%) | 38 (100.0%) |
Families and Households in Mount Eagle
Median Family Size in Mount Eagle
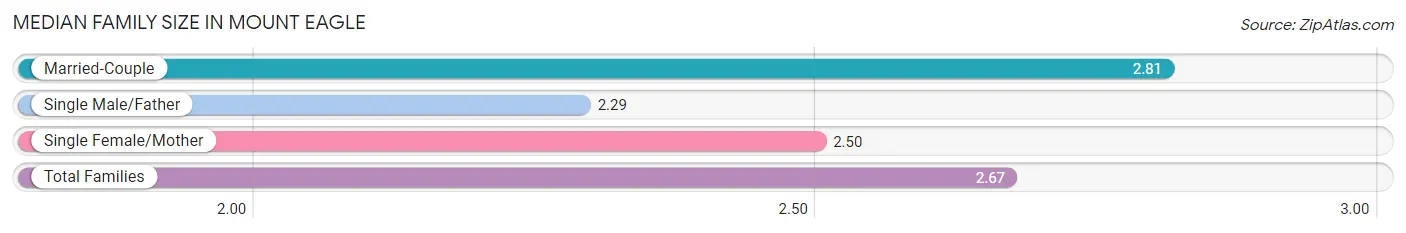
The median family size in Mount Eagle is 2.67 persons per family, with married-couple families (21 | 70.0%) accounting for the largest median family size of 2.81 persons per family. On the other hand, single male/father families (7 | 23.3%) represent the smallest median family size with 2.29 persons per family.
| Family Type | # Families | Family Size |
| Married-Couple | 21 (70.0%) | 2.81 |
| Single Male/Father | 7 (23.3%) | 2.29 |
| Single Female/Mother | 2 (6.7%) | 2.50 |
| Total Families | 30 (100.0%) | 2.67 |
Median Household Size in Mount Eagle
| Household Type | # Households | Household Size |
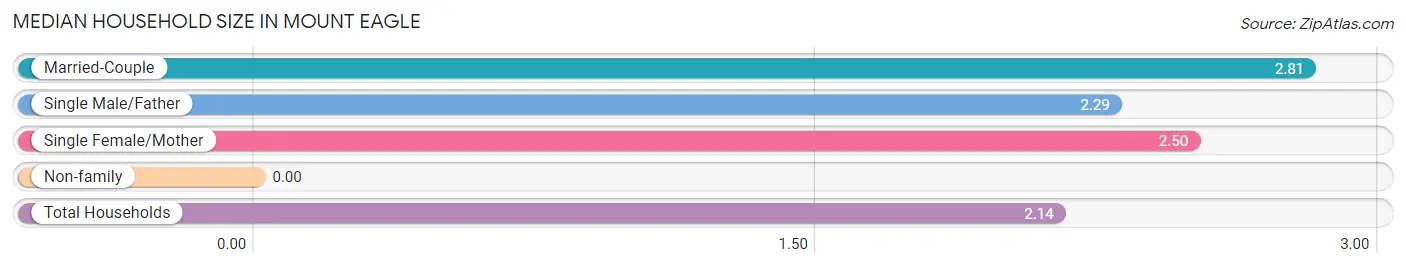
| Married-Couple | 21 (47.7%) | 2.81 |
| Single Male/Father | 7 (15.9%) | 2.29 |
| Single Female/Mother | 2 (4.5%) | 2.50 |
| Non-family | 14 (31.8%) | - |
| Total Households | 44 (100.0%) | 2.14 |
Household Size by Marriage Status in Mount Eagle
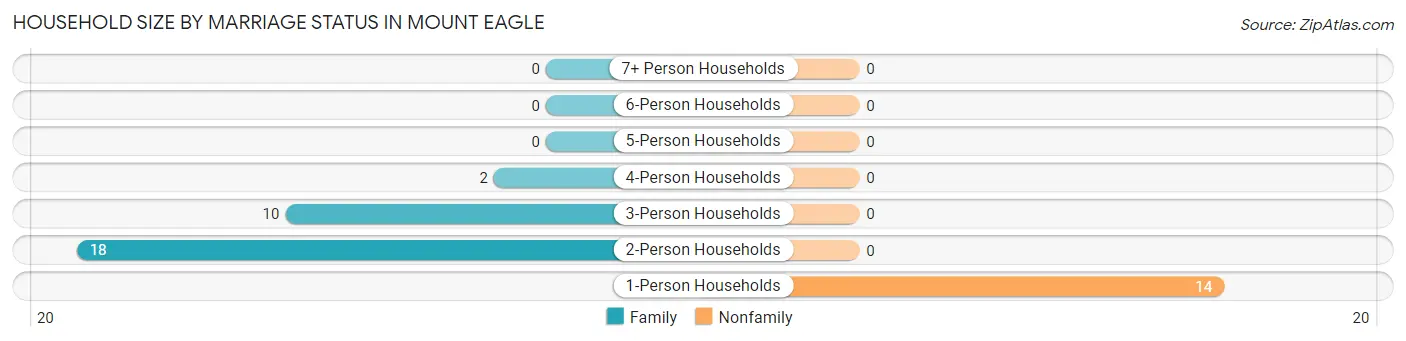
Out of a total of 44 households in Mount Eagle, 30 (68.2%) are family households, while 14 (31.8%) are nonfamily households. The most numerous type of family households are 2-person households, comprising 18, and the most common type of nonfamily households are 1-person households, comprising 14.
| Household Size | Family Households | Nonfamily Households |
| 1-Person Households | - | 14 (31.8%) |
| 2-Person Households | 18 (40.9%) | 0 (0.0%) |
| 3-Person Households | 10 (22.7%) | 0 (0.0%) |
| 4-Person Households | 2 (4.5%) | 0 (0.0%) |
| 5-Person Households | 0 (0.0%) | 0 (0.0%) |
| 6-Person Households | 0 (0.0%) | 0 (0.0%) |
| 7+ Person Households | 0 (0.0%) | 0 (0.0%) |
| Total | 30 (68.2%) | 14 (31.8%) |
Female Fertility in Mount Eagle
Fertility by Age in Mount Eagle
| Age Bracket | Women with Births | Births / 1,000 Women |
| 15 to 19 years | 0 (0.0%) | 0.0 |
| 20 to 34 years | 0 (0.0%) | 0.0 |
| 35 to 50 years | 0 (0.0%) | 0.0 |
| Total | 0 (0.0%) | 0.0 |
Fertility by Age by Marriage Status in Mount Eagle
| Age Bracket | Married | Unmarried |
| 15 to 19 years | 0 (0.0%) | 0 (0.0%) |
| 20 to 34 years | 0 (0.0%) | 0 (0.0%) |
| 35 to 50 years | 0 (0.0%) | 0 (0.0%) |
| Total | 0 (0.0%) | 0 (0.0%) |
Fertility by Education in Mount Eagle
| Educational Attainment | Women with Births | Births / 1,000 Women |
| Less than High School | 0 (0.0%) | 0.0 |
| High School Diploma | 0 (0.0%) | 0.0 |
| College or Associate's Degree | 0 (0.0%) | 0.0 |
| Bachelor's Degree | 0 (0.0%) | 0.0 |
| Graduate Degree | 0 (0.0%) | 0.0 |
| Total | 0 (0.0%) | 0.0 |
Fertility by Education by Marriage Status in Mount Eagle
| Educational Attainment | Married | Unmarried |
| Less than High School | 0 (0.0%) | 0 (0.0%) |
| High School Diploma | 0 (0.0%) | 0 (0.0%) |
| College or Associate's Degree | 0 (0.0%) | 0 (0.0%) |
| Bachelor's Degree | 0 (0.0%) | 0 (0.0%) |
| Graduate Degree | 0 (0.0%) | 0 (0.0%) |
| Total | 0 (0.0%) | 0 (0.0%) |
Employment Characteristics in Mount Eagle
Employment by Class of Employer in Mount Eagle
Among the 61 employed individuals in Mount Eagle, private company employees (43 | 70.5%), state government employees (11 | 18.0%), and not-for-profit organizations (4 | 6.6%) make up the most common classes of employment.
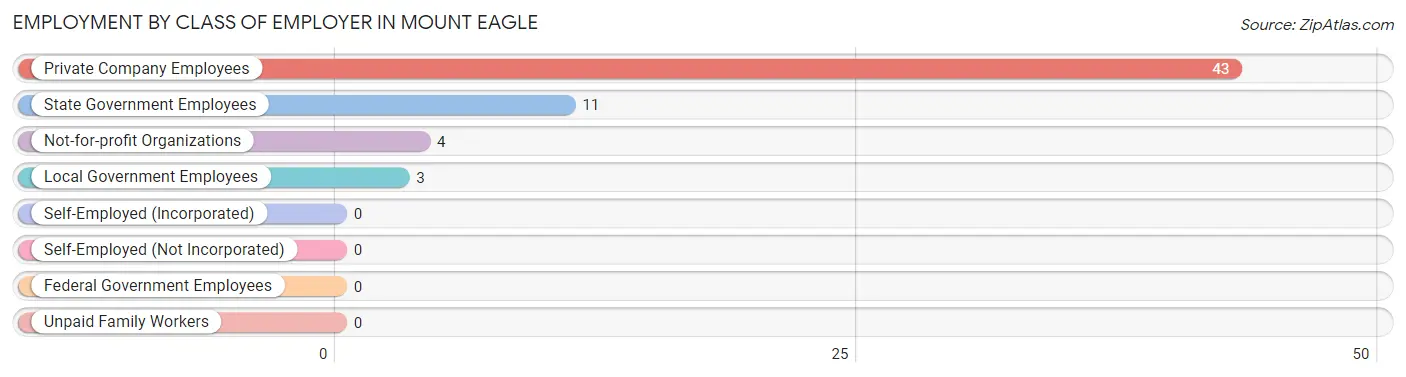
| Employer Class | # Employees | % Employees |
| Private Company Employees | 43 | 70.5% |
| Self-Employed (Incorporated) | 0 | 0.0% |
| Self-Employed (Not Incorporated) | 0 | 0.0% |
| Not-for-profit Organizations | 4 | 6.6% |
| Local Government Employees | 3 | 4.9% |
| State Government Employees | 11 | 18.0% |
| Federal Government Employees | 0 | 0.0% |
| Unpaid Family Workers | 0 | 0.0% |
| Total | 61 | 100.0% |
Employment Status by Age in Mount Eagle
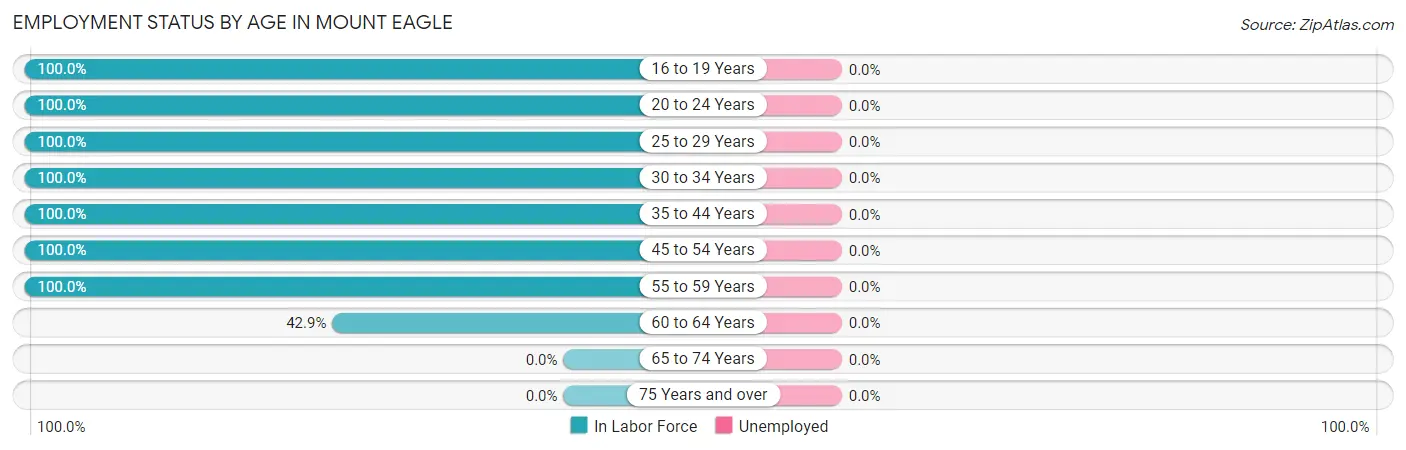
| Age Bracket | In Labor Force | Unemployed |
| 16 to 19 Years | 1 (100.0%) | 0 (0.0%) |
| 20 to 24 Years | 9 (100.0%) | 0 (0.0%) |
| 25 to 29 Years | 3 (100.0%) | 0 (0.0%) |
| 30 to 34 Years | 6 (100.0%) | 0 (0.0%) |
| 35 to 44 Years | 11 (100.0%) | 0 (0.0%) |
| 45 to 54 Years | 5 (100.0%) | 0 (0.0%) |
| 55 to 59 Years | 23 (100.0%) | 0 (0.0%) |
| 60 to 64 Years | 3 (42.9%) | 0 (0.0%) |
| 65 to 74 Years | 0 (0.0%) | 0 (0.0%) |
| 75 Years and over | 0 (0.0%) | 0 (0.0%) |
| Total | 61 (73.5%) | 0 (0.0%) |
Employment Status by Educational Attainment in Mount Eagle
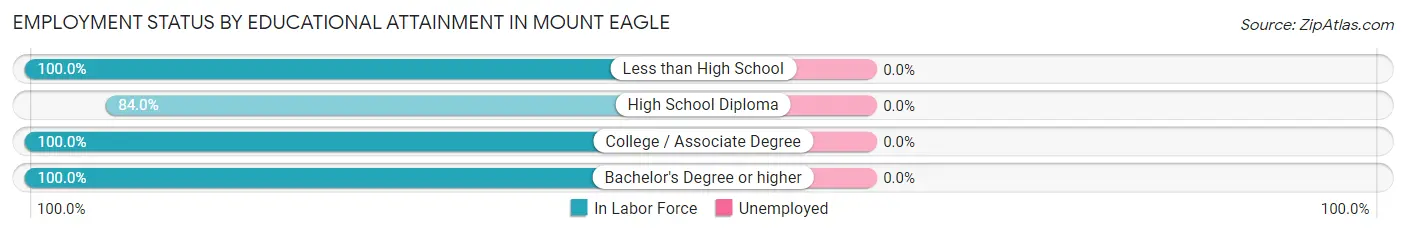
| Educational Attainment | In Labor Force | Unemployed |
| Less than High School | 2 (100.0%) | 0 (0.0%) |
| High School Diploma | 21 (84.0%) | 0 (0.0%) |
| College / Associate Degree | 9 (100.0%) | 0 (0.0%) |
| Bachelor's Degree or higher | 19 (100.0%) | 0 (0.0%) |
| Total | 51 (92.7%) | 0 (0.0%) |
Employment Occupations by Sex in Mount Eagle
Management, Business, Science and Arts Occupations
The most common Management, Business, Science and Arts occupations in Mount Eagle are Community & Social Service (8 | 13.1%), Education Instruction & Library (8 | 13.1%), Computers, Engineering & Science (4 | 6.6%), Business & Financial (3 | 4.9%), and Life, Physical & Social Science (3 | 4.9%).
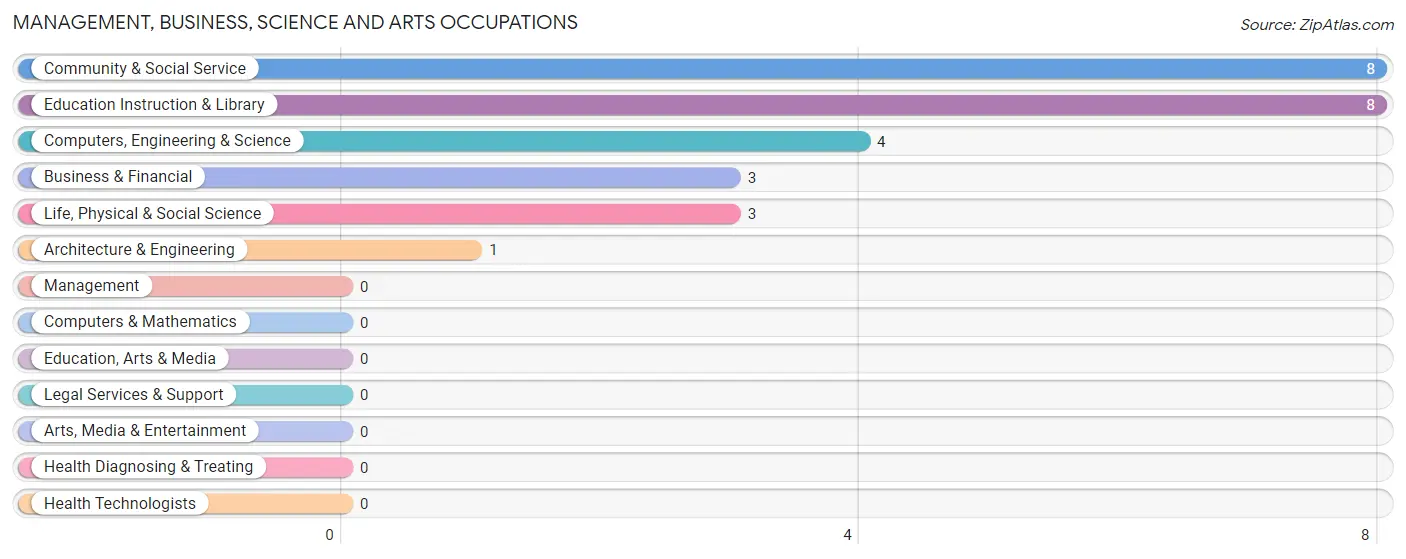
Management, Business, Science and Arts Occupations by Sex
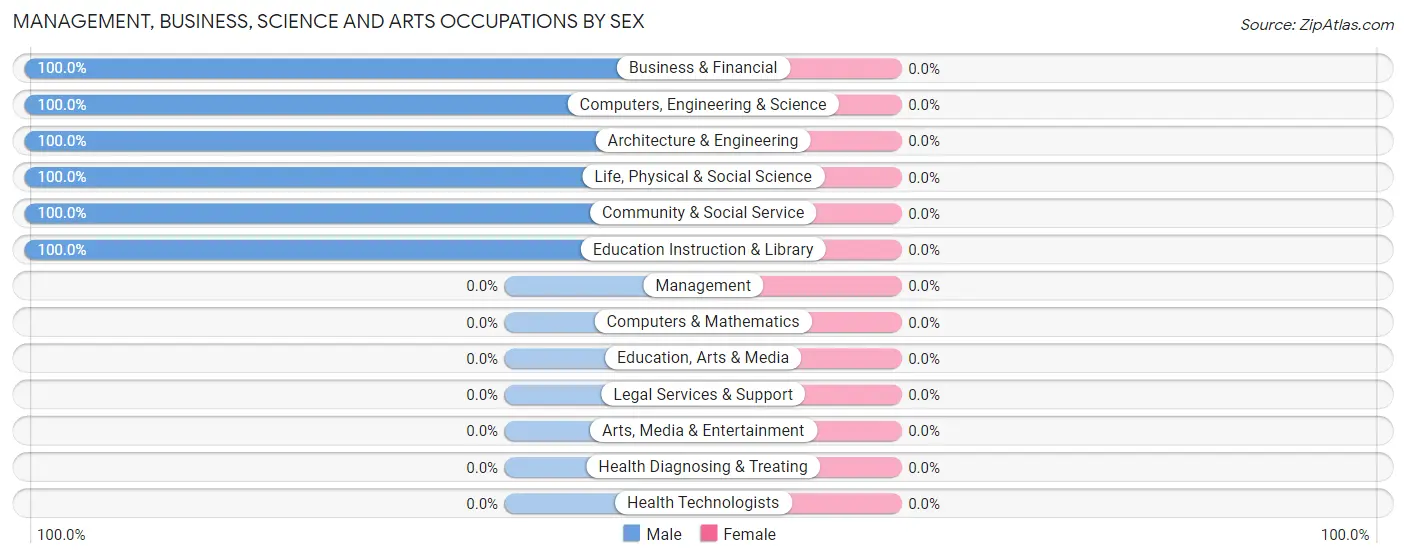
| Occupation | Male | Female |
| Management | 0 (0.0%) | 0 (0.0%) |
| Business & Financial | 3 (100.0%) | 0 (0.0%) |
| Computers, Engineering & Science | 4 (100.0%) | 0 (0.0%) |
| Computers & Mathematics | 0 (0.0%) | 0 (0.0%) |
| Architecture & Engineering | 1 (100.0%) | 0 (0.0%) |
| Life, Physical & Social Science | 3 (100.0%) | 0 (0.0%) |
| Community & Social Service | 8 (100.0%) | 0 (0.0%) |
| Education, Arts & Media | 0 (0.0%) | 0 (0.0%) |
| Legal Services & Support | 0 (0.0%) | 0 (0.0%) |
| Education Instruction & Library | 8 (100.0%) | 0 (0.0%) |
| Arts, Media & Entertainment | 0 (0.0%) | 0 (0.0%) |
| Health Diagnosing & Treating | 0 (0.0%) | 0 (0.0%) |
| Health Technologists | 0 (0.0%) | 0 (0.0%) |
| Total (Category) | 15 (100.0%) | 0 (0.0%) |
| Total (Overall) | 38 (62.3%) | 23 (37.7%) |
Services Occupations
The most common Services occupations in Mount Eagle are Personal Care & Service (7 | 11.5%), and Cleaning & Maintenance (2 | 3.3%).
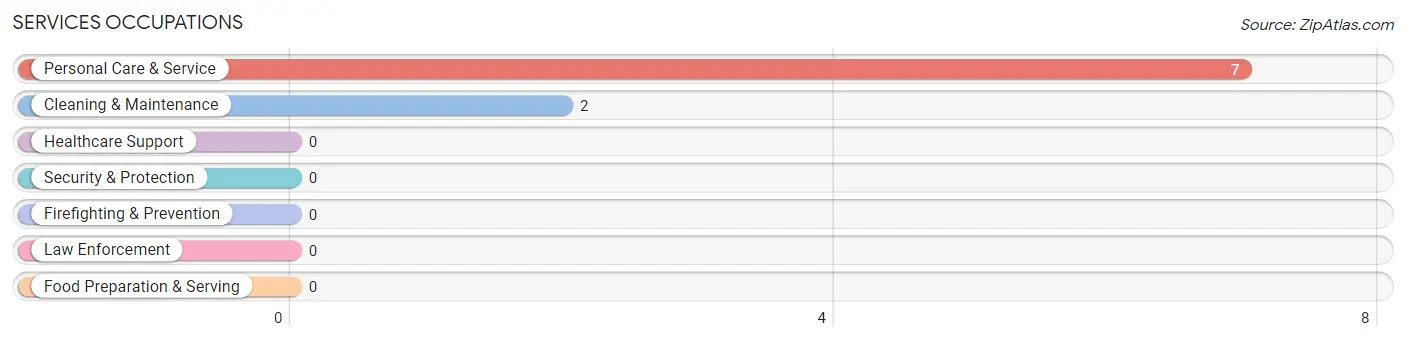
Services Occupations by Sex
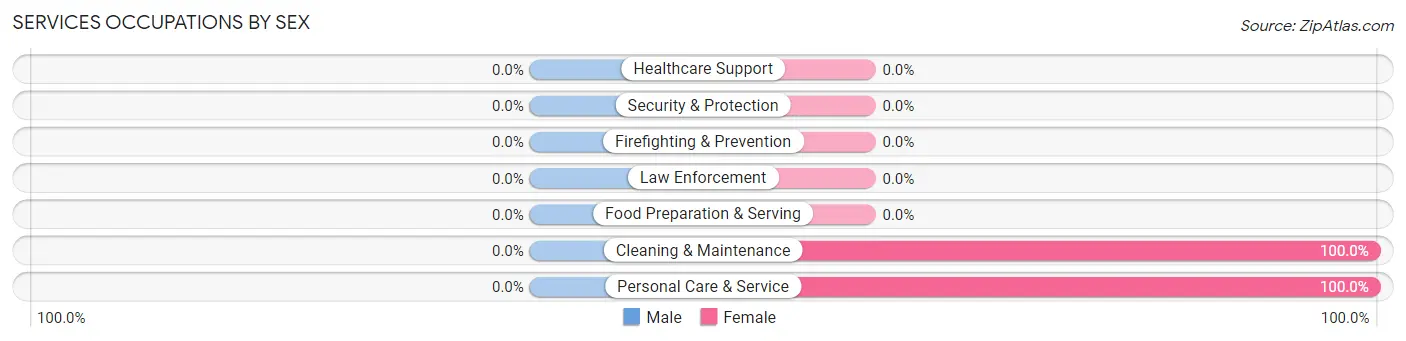
| Occupation | Male | Female |
| Healthcare Support | 0 (0.0%) | 0 (0.0%) |
| Security & Protection | 0 (0.0%) | 0 (0.0%) |
| Firefighting & Prevention | 0 (0.0%) | 0 (0.0%) |
| Law Enforcement | 0 (0.0%) | 0 (0.0%) |
| Food Preparation & Serving | 0 (0.0%) | 0 (0.0%) |
| Cleaning & Maintenance | 0 (0.0%) | 2 (100.0%) |
| Personal Care & Service | 0 (0.0%) | 7 (100.0%) |
| Total (Category) | 0 (0.0%) | 9 (100.0%) |
| Total (Overall) | 38 (62.3%) | 23 (37.7%) |
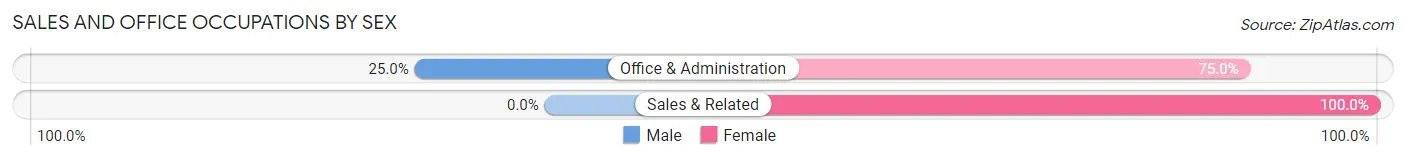
Sales and Office Occupations
The most common Sales and Office occupations in Mount Eagle are Office & Administration (12 | 19.7%), and Sales & Related (3 | 4.9%).
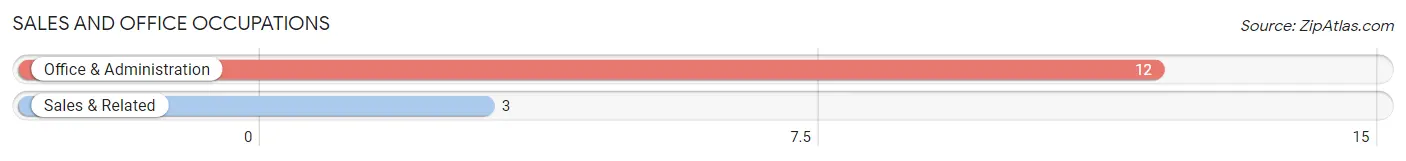
Sales and Office Occupations by Sex
| Occupation | Male | Female |
| Sales & Related | 0 (0.0%) | 3 (100.0%) |
| Office & Administration | 3 (25.0%) | 9 (75.0%) |
| Total (Category) | 3 (20.0%) | 12 (80.0%) |
| Total (Overall) | 38 (62.3%) | 23 (37.7%) |
Natural Resources, Construction and Maintenance Occupations
The most common Natural Resources, Construction and Maintenance occupations in Mount Eagle are , and Construction & Extraction (11 | 18.0%).
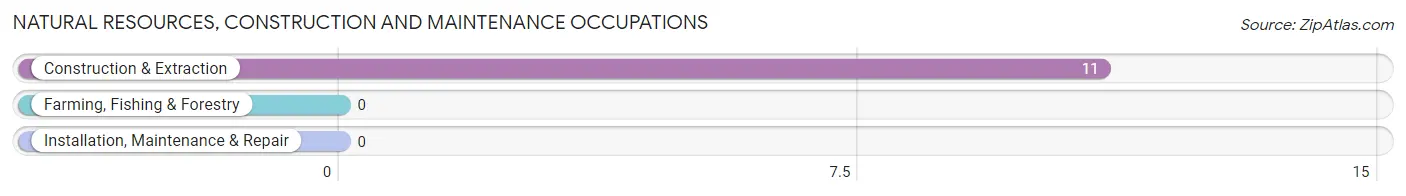
Natural Resources, Construction and Maintenance Occupations by Sex
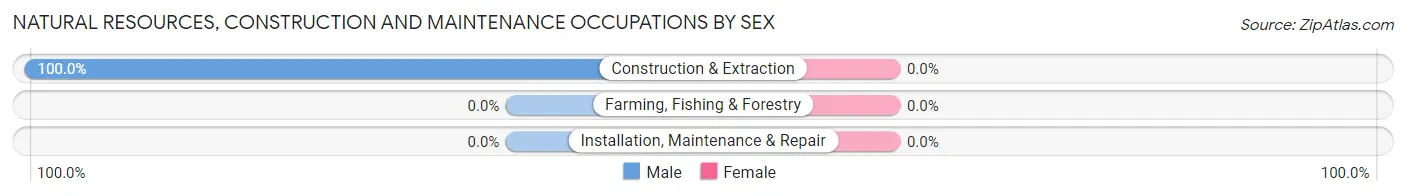
| Occupation | Male | Female |
| Farming, Fishing & Forestry | 0 (0.0%) | 0 (0.0%) |
| Construction & Extraction | 11 (100.0%) | 0 (0.0%) |
| Installation, Maintenance & Repair | 0 (0.0%) | 0 (0.0%) |
| Total (Category) | 11 (100.0%) | 0 (0.0%) |
| Total (Overall) | 38 (62.3%) | 23 (37.7%) |
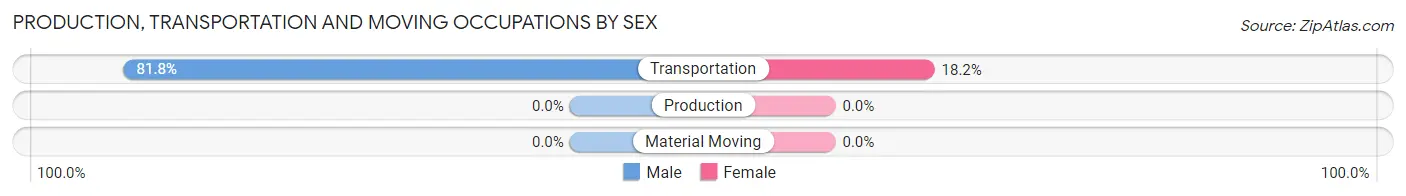
Production, Transportation and Moving Occupations
The most common Production, Transportation and Moving occupations in Mount Eagle are , and Transportation (11 | 18.0%).
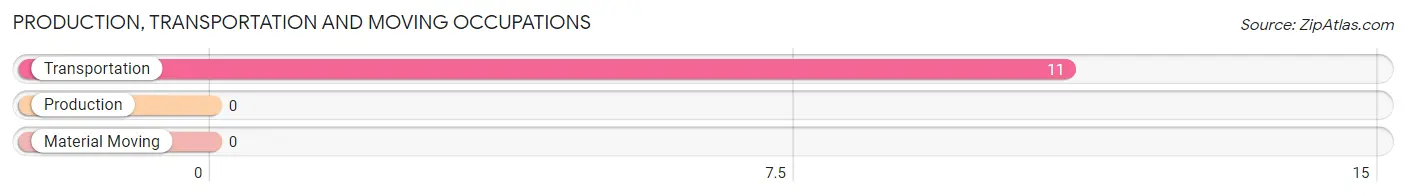
Production, Transportation and Moving Occupations by Sex
| Occupation | Male | Female |
| Production | 0 (0.0%) | 0 (0.0%) |
| Transportation | 9 (81.8%) | 2 (18.2%) |
| Material Moving | 0 (0.0%) | 0 (0.0%) |
| Total (Category) | 9 (81.8%) | 2 (18.2%) |
| Total (Overall) | 38 (62.3%) | 23 (37.7%) |
Employment Industries by Sex in Mount Eagle
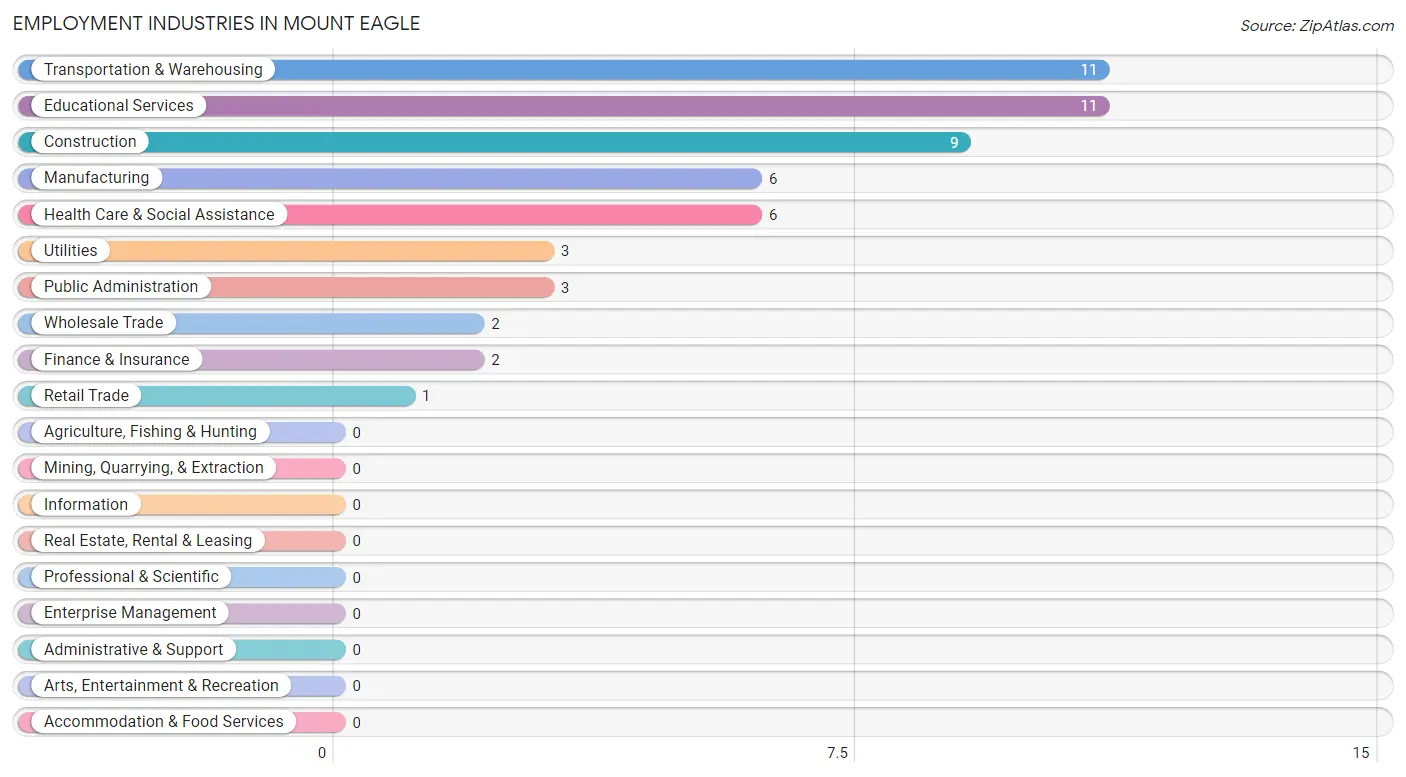
Employment Industries in Mount Eagle
The major employment industries in Mount Eagle include Transportation & Warehousing (11 | 18.0%), Educational Services (11 | 18.0%), Construction (9 | 14.7%), Manufacturing (6 | 9.8%), and Health Care & Social Assistance (6 | 9.8%).
Employment Industries by Sex in Mount Eagle
The Mount Eagle industries that see more men than women are Construction (100.0%), Manufacturing (100.0%), and Wholesale Trade (100.0%), whereas the industries that tend to have a higher number of women are Retail Trade (100.0%), Utilities (100.0%), and Finance & Insurance (100.0%).
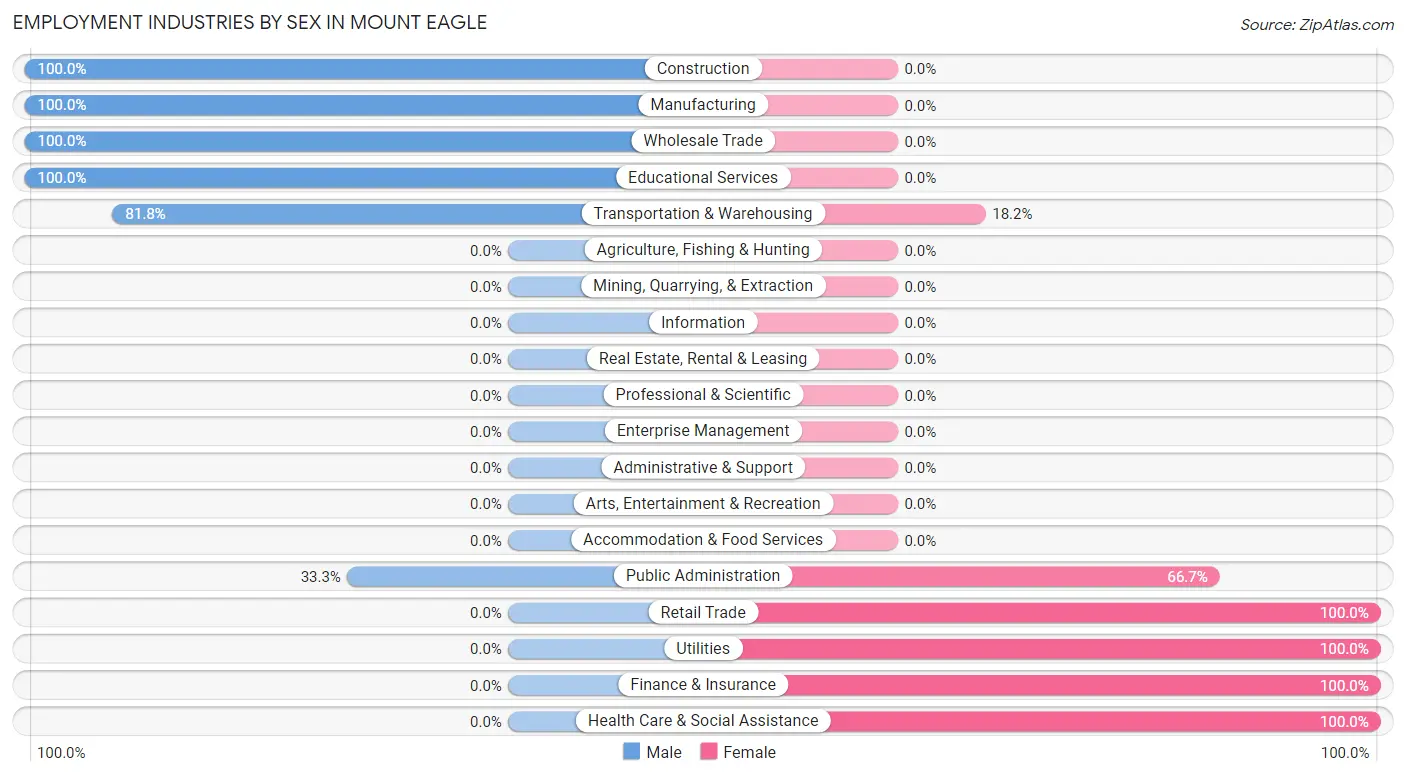
| Industry | Male | Female |
| Agriculture, Fishing & Hunting | 0 (0.0%) | 0 (0.0%) |
| Mining, Quarrying, & Extraction | 0 (0.0%) | 0 (0.0%) |
| Construction | 9 (100.0%) | 0 (0.0%) |
| Manufacturing | 6 (100.0%) | 0 (0.0%) |
| Wholesale Trade | 2 (100.0%) | 0 (0.0%) |
| Retail Trade | 0 (0.0%) | 1 (100.0%) |
| Transportation & Warehousing | 9 (81.8%) | 2 (18.2%) |
| Utilities | 0 (0.0%) | 3 (100.0%) |
| Information | 0 (0.0%) | 0 (0.0%) |
| Finance & Insurance | 0 (0.0%) | 2 (100.0%) |
| Real Estate, Rental & Leasing | 0 (0.0%) | 0 (0.0%) |
| Professional & Scientific | 0 (0.0%) | 0 (0.0%) |
| Enterprise Management | 0 (0.0%) | 0 (0.0%) |
| Administrative & Support | 0 (0.0%) | 0 (0.0%) |
| Educational Services | 11 (100.0%) | 0 (0.0%) |
| Health Care & Social Assistance | 0 (0.0%) | 6 (100.0%) |
| Arts, Entertainment & Recreation | 0 (0.0%) | 0 (0.0%) |
| Accommodation & Food Services | 0 (0.0%) | 0 (0.0%) |
| Public Administration | 1 (33.3%) | 2 (66.7%) |
| Total | 38 (62.3%) | 23 (37.7%) |
Education in Mount Eagle
School Enrollment in Mount Eagle
The most common levels of schooling among the 15 students in Mount Eagle are elementary school (5 | 33.3%), high school (4 | 26.7%), and middle school (3 | 20.0%).
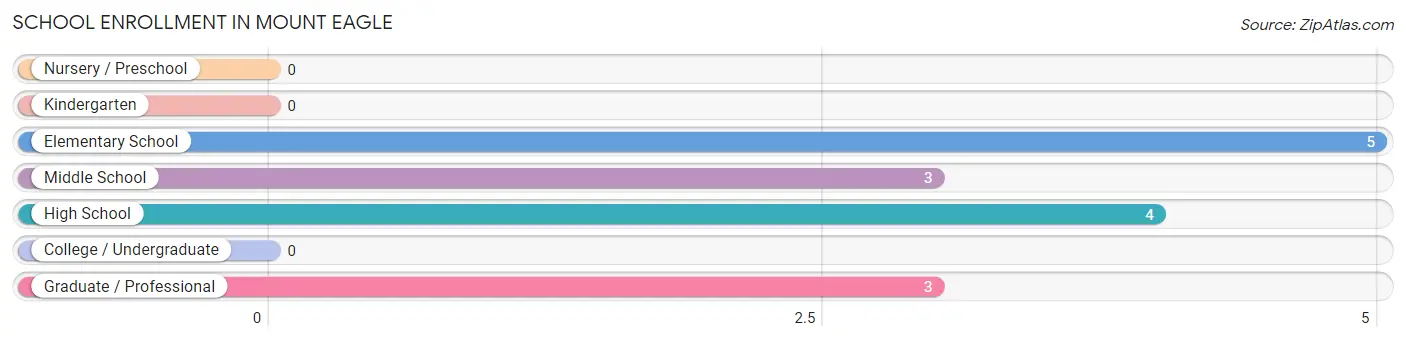
| School Level | # Students | % Students |
| Nursery / Preschool | 0 | 0.0% |
| Kindergarten | 0 | 0.0% |
| Elementary School | 5 | 33.3% |
| Middle School | 3 | 20.0% |
| High School | 4 | 26.7% |
| College / Undergraduate | 0 | 0.0% |
| Graduate / Professional | 3 | 20.0% |
| Total | 15 | 100.0% |
School Enrollment by Age by Funding Source in Mount Eagle
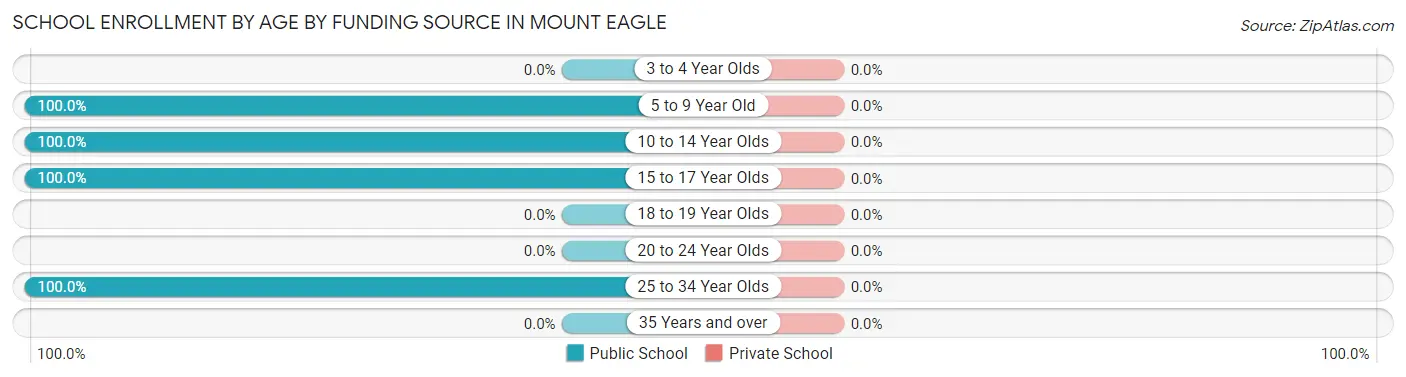
| Age Bracket | Public School | Private School |
| 3 to 4 Year Olds | 0 (0.0%) | 0 (0.0%) |
| 5 to 9 Year Old | 5 (100.0%) | 0 (0.0%) |
| 10 to 14 Year Olds | 6 (100.0%) | 0 (0.0%) |
| 15 to 17 Year Olds | 1 (100.0%) | 0 (0.0%) |
| 18 to 19 Year Olds | 0 (0.0%) | 0 (0.0%) |
| 20 to 24 Year Olds | 0 (0.0%) | 0 (0.0%) |
| 25 to 34 Year Olds | 3 (100.0%) | 0 (0.0%) |
| 35 Years and over | 0 (0.0%) | 0 (0.0%) |
| Total | 15 (100.0%) | 0 (0.0%) |
Educational Attainment by Field of Study in Mount Eagle
Bio, nature & agricultural (11 | 50.0%), business (6 | 27.3%), education (3 | 13.6%), and science & technology (2 | 9.1%) are the most common fields of study among 22 individuals in Mount Eagle who have obtained a bachelor's degree or higher.
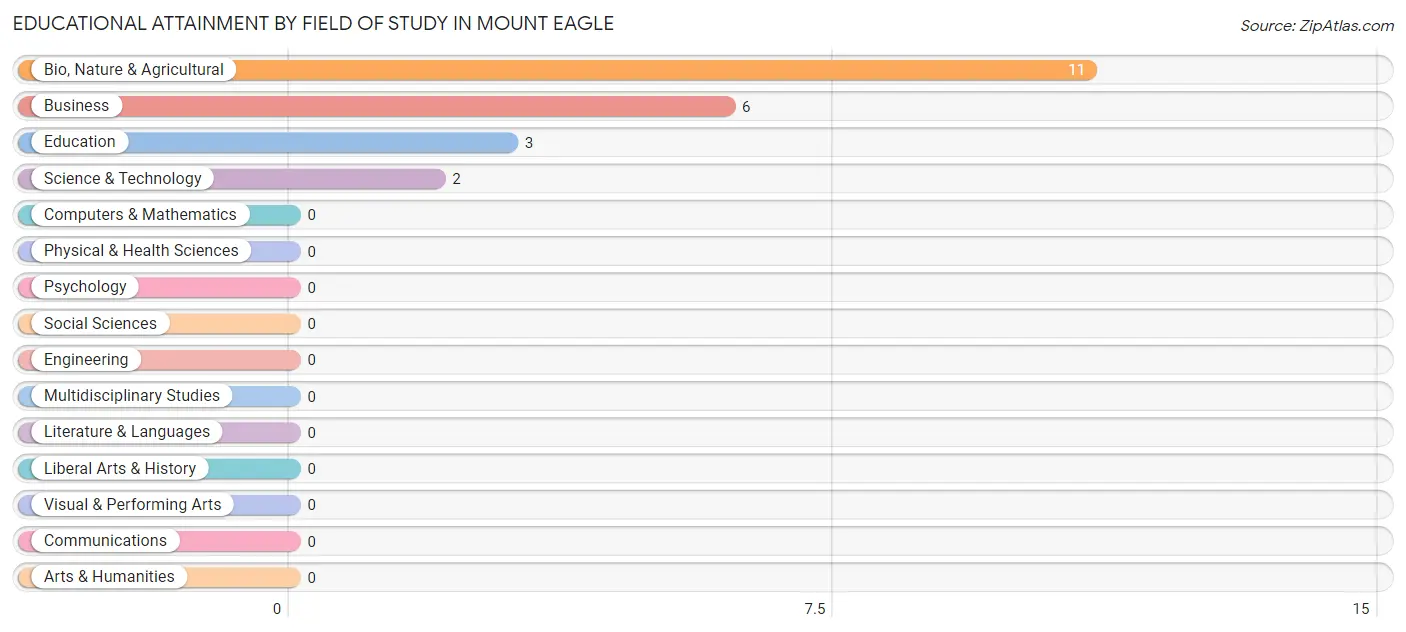
| Field of Study | # Graduates | % Graduates |
| Computers & Mathematics | 0 | 0.0% |
| Bio, Nature & Agricultural | 11 | 50.0% |
| Physical & Health Sciences | 0 | 0.0% |
| Psychology | 0 | 0.0% |
| Social Sciences | 0 | 0.0% |
| Engineering | 0 | 0.0% |
| Multidisciplinary Studies | 0 | 0.0% |
| Science & Technology | 2 | 9.1% |
| Business | 6 | 27.3% |
| Education | 3 | 13.6% |
| Literature & Languages | 0 | 0.0% |
| Liberal Arts & History | 0 | 0.0% |
| Visual & Performing Arts | 0 | 0.0% |
| Communications | 0 | 0.0% |
| Arts & Humanities | 0 | 0.0% |
| Total | 22 | 100.0% |
Transportation & Commute in Mount Eagle
Vehicle Availability by Sex in Mount Eagle
The most prevalent vehicle ownership categories in Mount Eagle are males with 3 vehicles (17, accounting for 44.7%) and females with 3 vehicles (7, making up 73.9%).
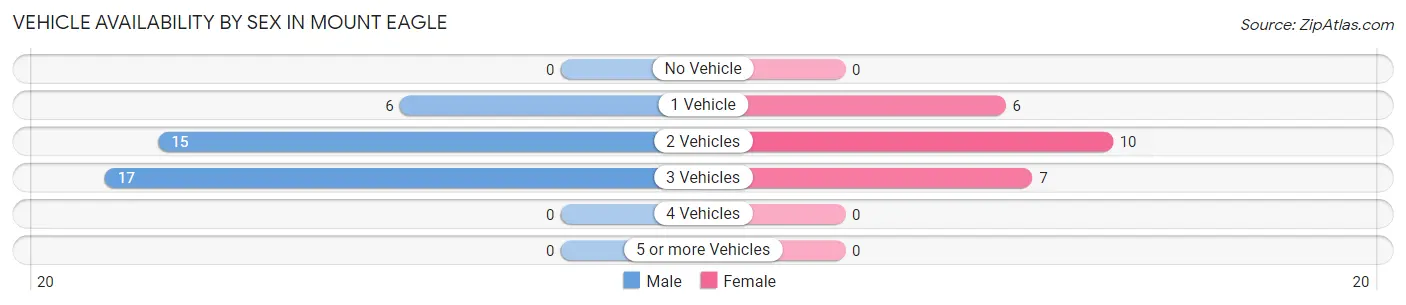
| Vehicles Available | Male | Female |
| No Vehicle | 0 (0.0%) | 0 (0.0%) |
| 1 Vehicle | 6 (15.8%) | 6 (26.1%) |
| 2 Vehicles | 15 (39.5%) | 10 (43.5%) |
| 3 Vehicles | 17 (44.7%) | 7 (30.4%) |
| 4 Vehicles | 0 (0.0%) | 0 (0.0%) |
| 5 or more Vehicles | 0 (0.0%) | 0 (0.0%) |
| Total | 38 (100.0%) | 23 (100.0%) |
Commute Time in Mount Eagle
The most frequently occuring commute durations in Mount Eagle are 25 to 29 minutes (18 commuters, 29.5%), 30 to 34 minutes (15 commuters, 24.6%), and 5 to 9 minutes (9 commuters, 14.7%).
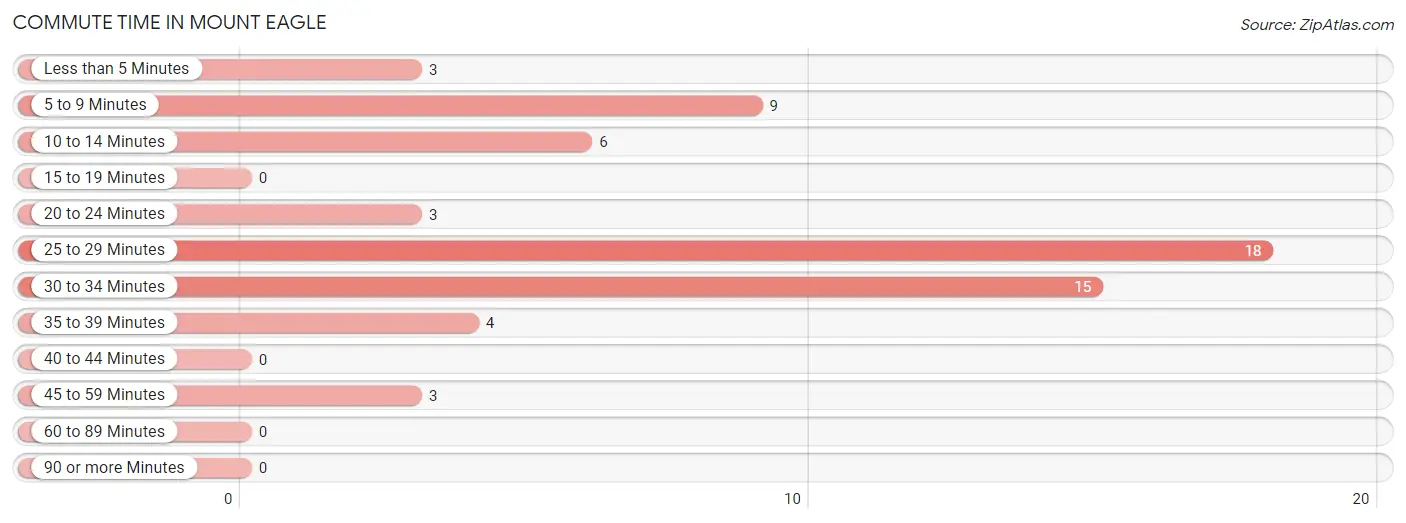
| Commute Time | # Commuters | % Commuters |
| Less than 5 Minutes | 3 | 4.9% |
| 5 to 9 Minutes | 9 | 14.7% |
| 10 to 14 Minutes | 6 | 9.8% |
| 15 to 19 Minutes | 0 | 0.0% |
| 20 to 24 Minutes | 3 | 4.9% |
| 25 to 29 Minutes | 18 | 29.5% |
| 30 to 34 Minutes | 15 | 24.6% |
| 35 to 39 Minutes | 4 | 6.6% |
| 40 to 44 Minutes | 0 | 0.0% |
| 45 to 59 Minutes | 3 | 4.9% |
| 60 to 89 Minutes | 0 | 0.0% |
| 90 or more Minutes | 0 | 0.0% |
Commute Time by Sex in Mount Eagle
The most common commute times in Mount Eagle are 30 to 34 minutes (13 commuters, 34.2%) for males and 25 to 29 minutes (11 commuters, 47.8%) for females.
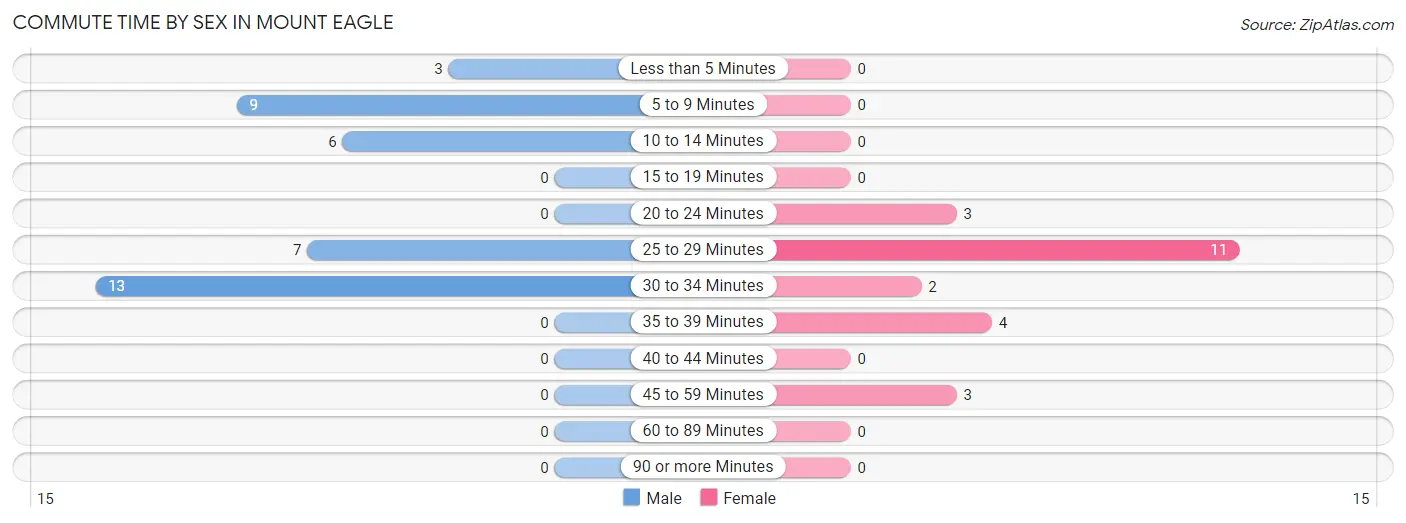
| Commute Time | Male | Female |
| Less than 5 Minutes | 3 (7.9%) | 0 (0.0%) |
| 5 to 9 Minutes | 9 (23.7%) | 0 (0.0%) |
| 10 to 14 Minutes | 6 (15.8%) | 0 (0.0%) |
| 15 to 19 Minutes | 0 (0.0%) | 0 (0.0%) |
| 20 to 24 Minutes | 0 (0.0%) | 3 (13.0%) |
| 25 to 29 Minutes | 7 (18.4%) | 11 (47.8%) |
| 30 to 34 Minutes | 13 (34.2%) | 2 (8.7%) |
| 35 to 39 Minutes | 0 (0.0%) | 4 (17.4%) |
| 40 to 44 Minutes | 0 (0.0%) | 0 (0.0%) |
| 45 to 59 Minutes | 0 (0.0%) | 3 (13.0%) |
| 60 to 89 Minutes | 0 (0.0%) | 0 (0.0%) |
| 90 or more Minutes | 0 (0.0%) | 0 (0.0%) |
Time of Departure to Work by Sex in Mount Eagle
The most frequent times of departure to work in Mount Eagle are 6:00 AM to 6:29 AM (12, 31.6%) for males and 7:00 AM to 7:29 AM (10, 43.5%) for females.
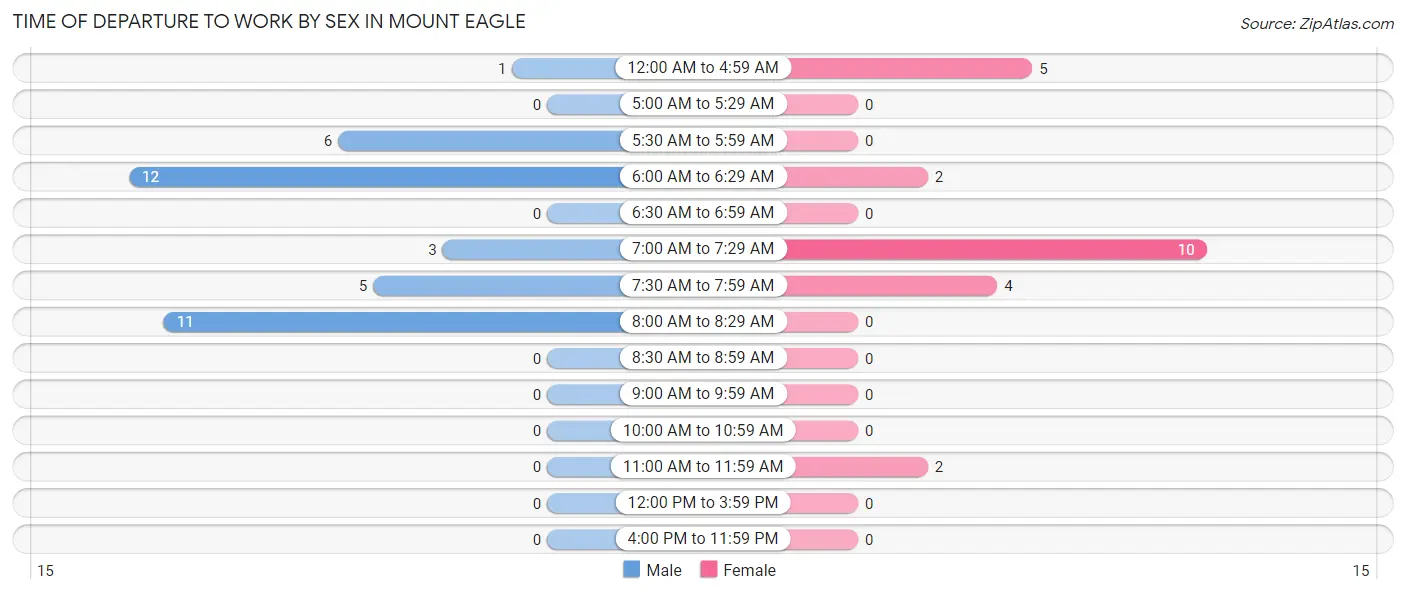
| Time of Departure | Male | Female |
| 12:00 AM to 4:59 AM | 1 (2.6%) | 5 (21.7%) |
| 5:00 AM to 5:29 AM | 0 (0.0%) | 0 (0.0%) |
| 5:30 AM to 5:59 AM | 6 (15.8%) | 0 (0.0%) |
| 6:00 AM to 6:29 AM | 12 (31.6%) | 2 (8.7%) |
| 6:30 AM to 6:59 AM | 0 (0.0%) | 0 (0.0%) |
| 7:00 AM to 7:29 AM | 3 (7.9%) | 10 (43.5%) |
| 7:30 AM to 7:59 AM | 5 (13.2%) | 4 (17.4%) |
| 8:00 AM to 8:29 AM | 11 (28.9%) | 0 (0.0%) |
| 8:30 AM to 8:59 AM | 0 (0.0%) | 0 (0.0%) |
| 9:00 AM to 9:59 AM | 0 (0.0%) | 0 (0.0%) |
| 10:00 AM to 10:59 AM | 0 (0.0%) | 0 (0.0%) |
| 11:00 AM to 11:59 AM | 0 (0.0%) | 2 (8.7%) |
| 12:00 PM to 3:59 PM | 0 (0.0%) | 0 (0.0%) |
| 4:00 PM to 11:59 PM | 0 (0.0%) | 0 (0.0%) |
| Total | 38 (100.0%) | 23 (100.0%) |
Housing Occupancy in Mount Eagle
Occupancy by Ownership in Mount Eagle
Of the total 44 dwellings in Mount Eagle, owner-occupied units account for 32 (72.7%), while renter-occupied units make up 12 (27.3%).
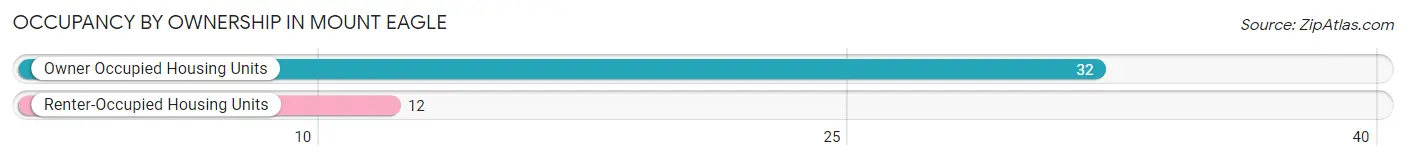
| Occupancy | # Housing Units | % Housing Units |
| Owner Occupied Housing Units | 32 | 72.7% |
| Renter-Occupied Housing Units | 12 | 27.3% |
| Total Occupied Housing Units | 44 | 100.0% |
Occupancy by Household Size in Mount Eagle
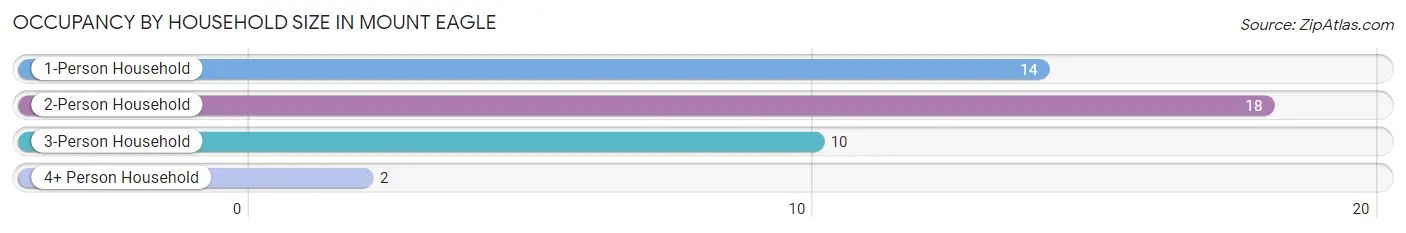
| Household Size | # Housing Units | % Housing Units |
| 1-Person Household | 14 | 31.8% |
| 2-Person Household | 18 | 40.9% |
| 3-Person Household | 10 | 22.7% |
| 4+ Person Household | 2 | 4.5% |
| Total Housing Units | 44 | 100.0% |
Occupancy by Ownership by Household Size in Mount Eagle
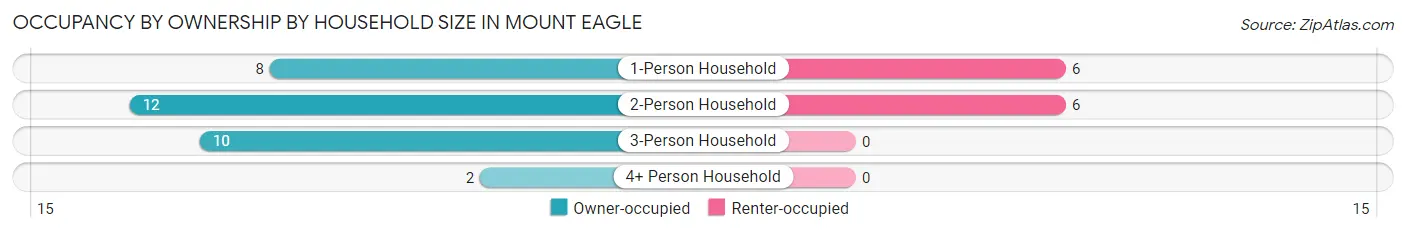
| Household Size | Owner-occupied | Renter-occupied |
| 1-Person Household | 8 (57.1%) | 6 (42.9%) |
| 2-Person Household | 12 (66.7%) | 6 (33.3%) |
| 3-Person Household | 10 (100.0%) | 0 (0.0%) |
| 4+ Person Household | 2 (100.0%) | 0 (0.0%) |
| Total Housing Units | 32 (72.7%) | 12 (27.3%) |
Occupancy by Educational Attainment in Mount Eagle
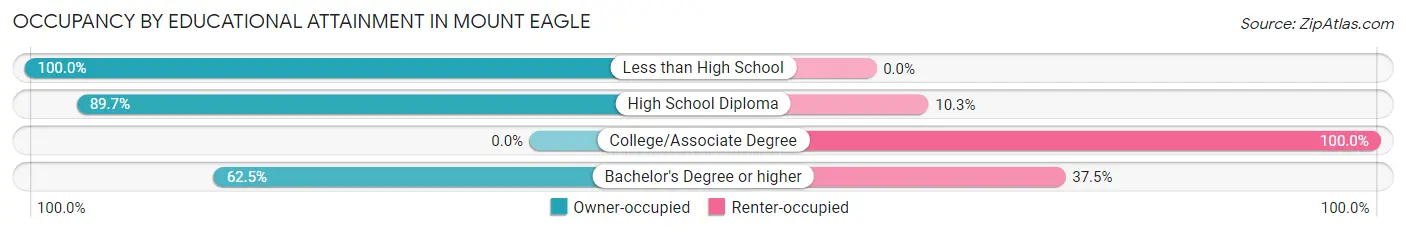
| Household Size | Owner-occupied | Renter-occupied |
| Less than High School | 1 (100.0%) | 0 (0.0%) |
| High School Diploma | 26 (89.7%) | 3 (10.3%) |
| College/Associate Degree | 0 (0.0%) | 6 (100.0%) |
| Bachelor's Degree or higher | 5 (62.5%) | 3 (37.5%) |
Occupancy by Age of Householder in Mount Eagle
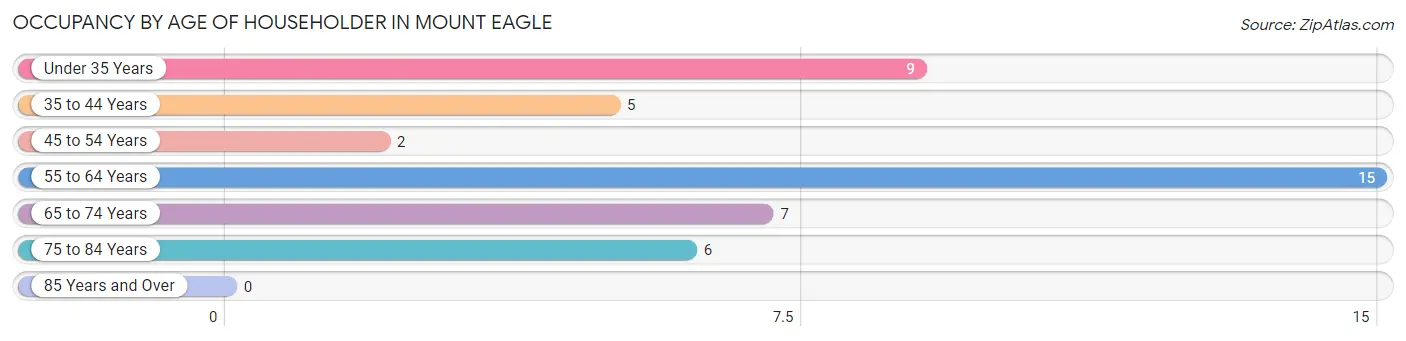
| Age Bracket | # Households | % Households |
| Under 35 Years | 9 | 20.4% |
| 35 to 44 Years | 5 | 11.4% |
| 45 to 54 Years | 2 | 4.5% |
| 55 to 64 Years | 15 | 34.1% |
| 65 to 74 Years | 7 | 15.9% |
| 75 to 84 Years | 6 | 13.6% |
| 85 Years and Over | 0 | 0.0% |
| Total | 44 | 100.0% |
Housing Finances in Mount Eagle
Median Income by Occupancy in Mount Eagle
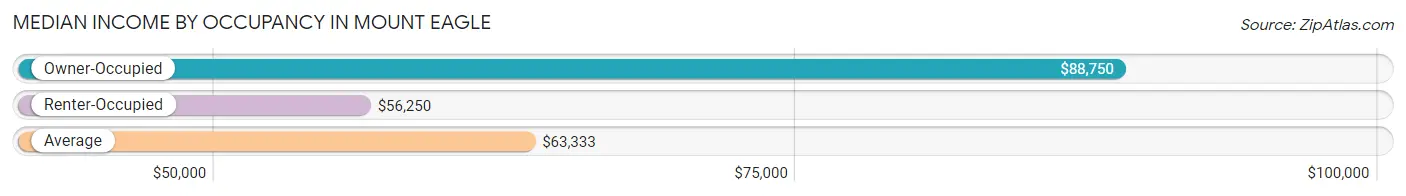
| Occupancy Type | # Households | Median Income |
| Owner-Occupied | 32 (72.7%) | $88,750 |
| Renter-Occupied | 12 (27.3%) | $56,250 |
| Average | 44 (100.0%) | $63,333 |
Occupancy by Householder Income Bracket in Mount Eagle
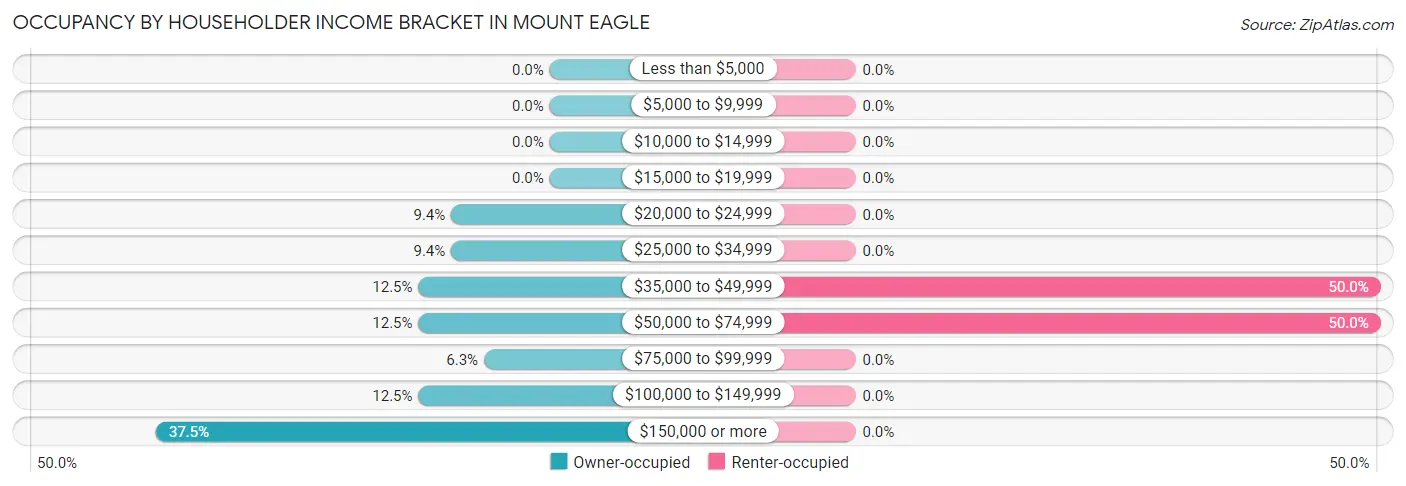
| Income Bracket | Owner-occupied | Renter-occupied |
| Less than $5,000 | 0 (0.0%) | 0 (0.0%) |
| $5,000 to $9,999 | 0 (0.0%) | 0 (0.0%) |
| $10,000 to $14,999 | 0 (0.0%) | 0 (0.0%) |
| $15,000 to $19,999 | 0 (0.0%) | 0 (0.0%) |
| $20,000 to $24,999 | 3 (9.4%) | 0 (0.0%) |
| $25,000 to $34,999 | 3 (9.4%) | 0 (0.0%) |
| $35,000 to $49,999 | 4 (12.5%) | 6 (50.0%) |
| $50,000 to $74,999 | 4 (12.5%) | 6 (50.0%) |
| $75,000 to $99,999 | 2 (6.2%) | 0 (0.0%) |
| $100,000 to $149,999 | 4 (12.5%) | 0 (0.0%) |
| $150,000 or more | 12 (37.5%) | 0 (0.0%) |
| Total | 32 (100.0%) | 12 (100.0%) |
Monthly Housing Cost Tiers in Mount Eagle
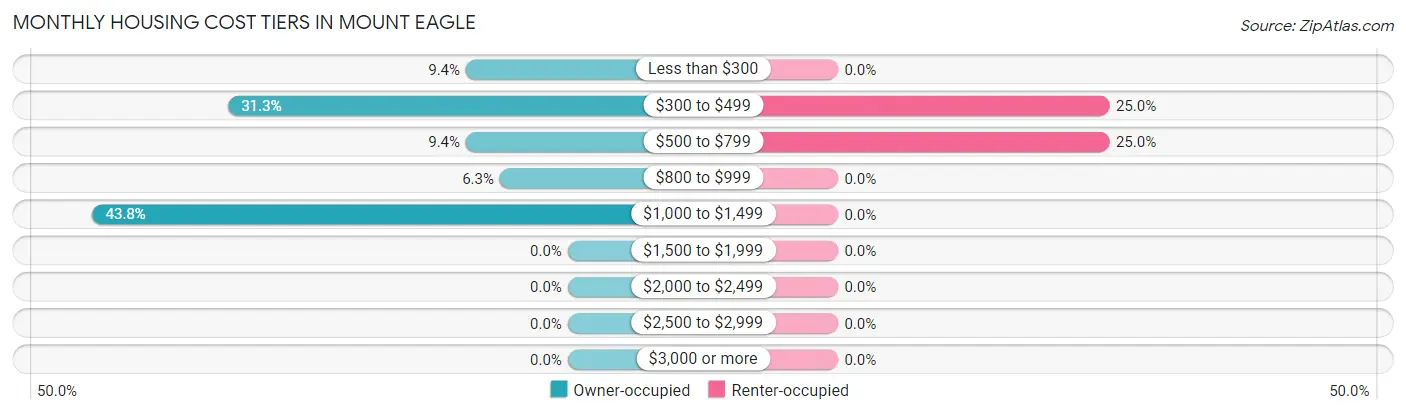
| Monthly Cost | Owner-occupied | Renter-occupied |
| Less than $300 | 3 (9.4%) | 0 (0.0%) |
| $300 to $499 | 10 (31.2%) | 3 (25.0%) |
| $500 to $799 | 3 (9.4%) | 3 (25.0%) |
| $800 to $999 | 2 (6.2%) | 0 (0.0%) |
| $1,000 to $1,499 | 14 (43.8%) | 0 (0.0%) |
| $1,500 to $1,999 | 0 (0.0%) | 0 (0.0%) |
| $2,000 to $2,499 | 0 (0.0%) | 0 (0.0%) |
| $2,500 to $2,999 | 0 (0.0%) | 0 (0.0%) |
| $3,000 or more | 0 (0.0%) | 0 (0.0%) |
| Total | 32 (100.0%) | 12 (100.0%) |
Physical Housing Characteristics in Mount Eagle
Housing Structures in Mount Eagle
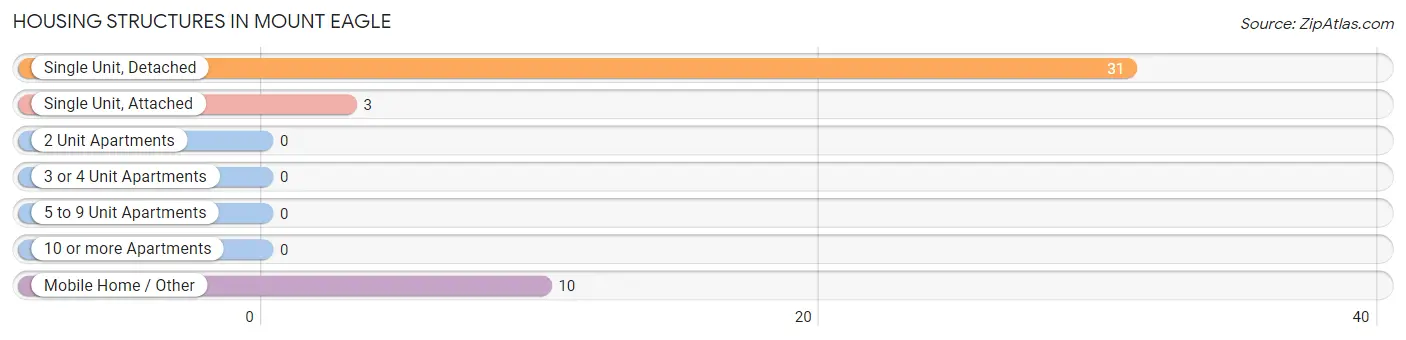
| Structure Type | # Housing Units | % Housing Units |
| Single Unit, Detached | 31 | 70.5% |
| Single Unit, Attached | 3 | 6.8% |
| 2 Unit Apartments | 0 | 0.0% |
| 3 or 4 Unit Apartments | 0 | 0.0% |
| 5 to 9 Unit Apartments | 0 | 0.0% |
| 10 or more Apartments | 0 | 0.0% |
| Mobile Home / Other | 10 | 22.7% |
| Total | 44 | 100.0% |
Housing Structures by Occupancy in Mount Eagle
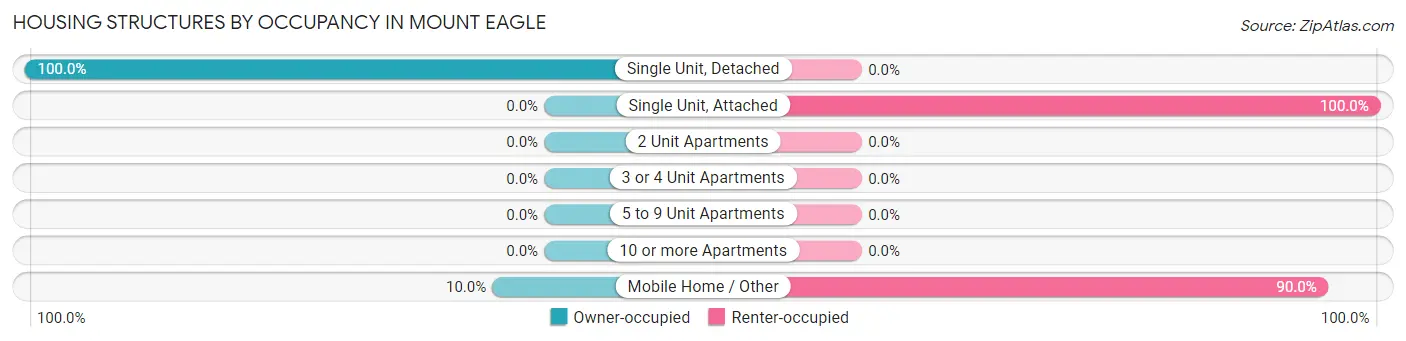
| Structure Type | Owner-occupied | Renter-occupied |
| Single Unit, Detached | 31 (100.0%) | 0 (0.0%) |
| Single Unit, Attached | 0 (0.0%) | 3 (100.0%) |
| 2 Unit Apartments | 0 (0.0%) | 0 (0.0%) |
| 3 or 4 Unit Apartments | 0 (0.0%) | 0 (0.0%) |
| 5 to 9 Unit Apartments | 0 (0.0%) | 0 (0.0%) |
| 10 or more Apartments | 0 (0.0%) | 0 (0.0%) |
| Mobile Home / Other | 1 (10.0%) | 9 (90.0%) |
| Total | 32 (72.7%) | 12 (27.3%) |
Housing Structures by Number of Rooms in Mount Eagle
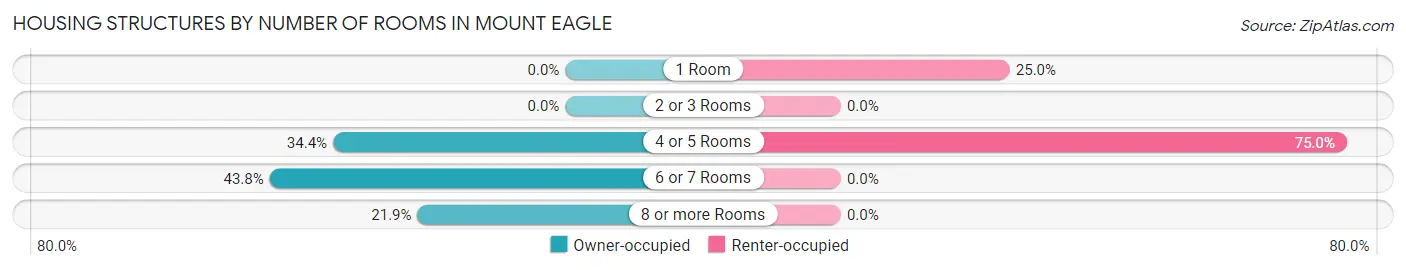
| Number of Rooms | Owner-occupied | Renter-occupied |
| 1 Room | 0 (0.0%) | 3 (25.0%) |
| 2 or 3 Rooms | 0 (0.0%) | 0 (0.0%) |
| 4 or 5 Rooms | 11 (34.4%) | 9 (75.0%) |
| 6 or 7 Rooms | 14 (43.8%) | 0 (0.0%) |
| 8 or more Rooms | 7 (21.9%) | 0 (0.0%) |
| Total | 32 (100.0%) | 12 (100.0%) |
Housing Structure by Heating Type in Mount Eagle
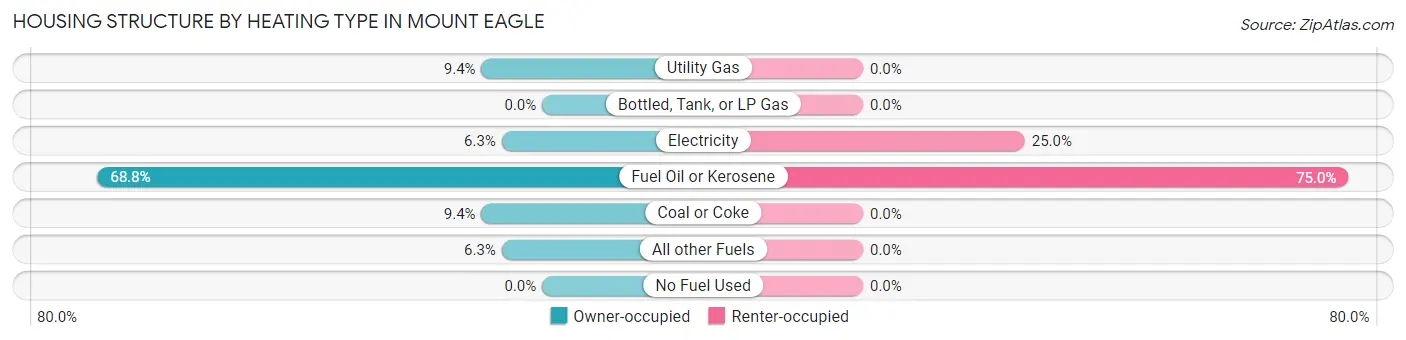
| Heating Type | Owner-occupied | Renter-occupied |
| Utility Gas | 3 (9.4%) | 0 (0.0%) |
| Bottled, Tank, or LP Gas | 0 (0.0%) | 0 (0.0%) |
| Electricity | 2 (6.2%) | 3 (25.0%) |
| Fuel Oil or Kerosene | 22 (68.8%) | 9 (75.0%) |
| Coal or Coke | 3 (9.4%) | 0 (0.0%) |
| All other Fuels | 2 (6.2%) | 0 (0.0%) |
| No Fuel Used | 0 (0.0%) | 0 (0.0%) |
| Total | 32 (100.0%) | 12 (100.0%) |
Household Vehicle Usage in Mount Eagle
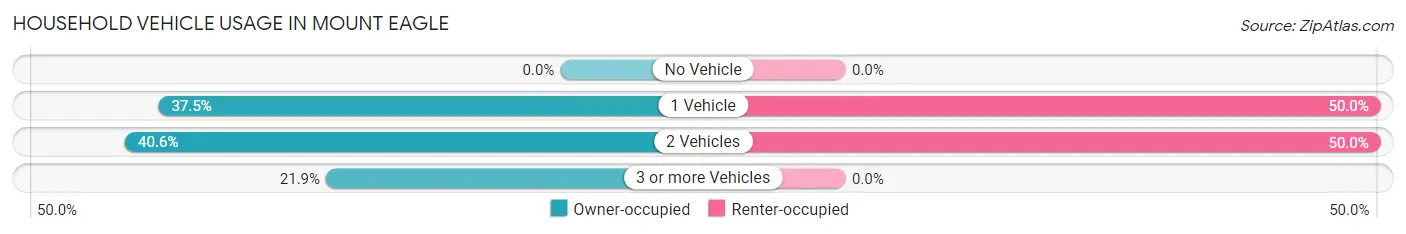
| Vehicles per Household | Owner-occupied | Renter-occupied |
| No Vehicle | 0 (0.0%) | 0 (0.0%) |
| 1 Vehicle | 12 (37.5%) | 6 (50.0%) |
| 2 Vehicles | 13 (40.6%) | 6 (50.0%) |
| 3 or more Vehicles | 7 (21.9%) | 0 (0.0%) |
| Total | 32 (100.0%) | 12 (100.0%) |
Real Estate & Mortgages in Mount Eagle
Real Estate and Mortgage Overview in Mount Eagle
| Characteristic | Without Mortgage | With Mortgage |
| Housing Units | 16 | 16 |
| Median Property Value | $118,800 | $171,400 |
| Median Household Income | $37,500 | $12 |
| Monthly Housing Costs | $400 | $0 |
| Real Estate Taxes | - | - |
Property Value by Mortgage Status in Mount Eagle
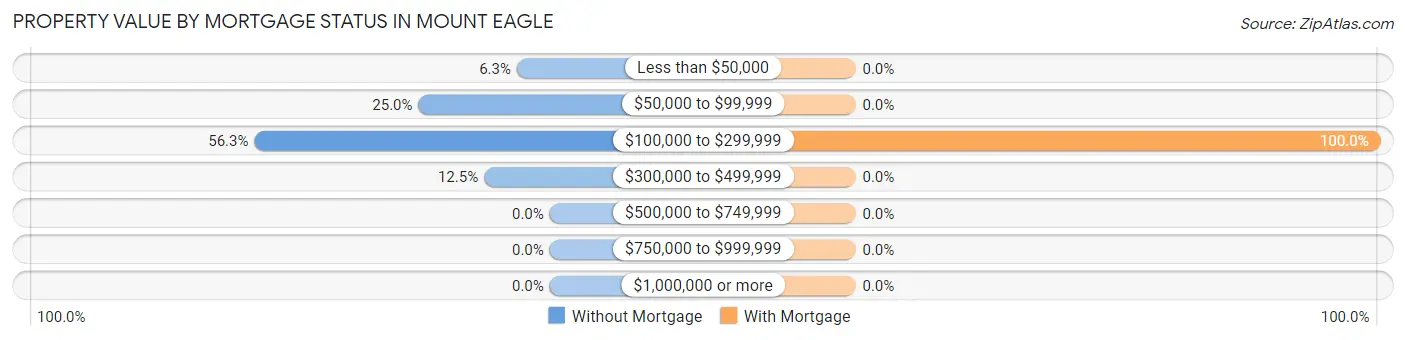
| Property Value | Without Mortgage | With Mortgage |
| Less than $50,000 | 1 (6.2%) | 0 (0.0%) |
| $50,000 to $99,999 | 4 (25.0%) | 0 (0.0%) |
| $100,000 to $299,999 | 9 (56.2%) | 16 (100.0%) |
| $300,000 to $499,999 | 2 (12.5%) | 0 (0.0%) |
| $500,000 to $749,999 | 0 (0.0%) | 0 (0.0%) |
| $750,000 to $999,999 | 0 (0.0%) | 0 (0.0%) |
| $1,000,000 or more | 0 (0.0%) | 0 (0.0%) |
| Total | 16 (100.0%) | 16 (100.0%) |
Household Income by Mortgage Status in Mount Eagle
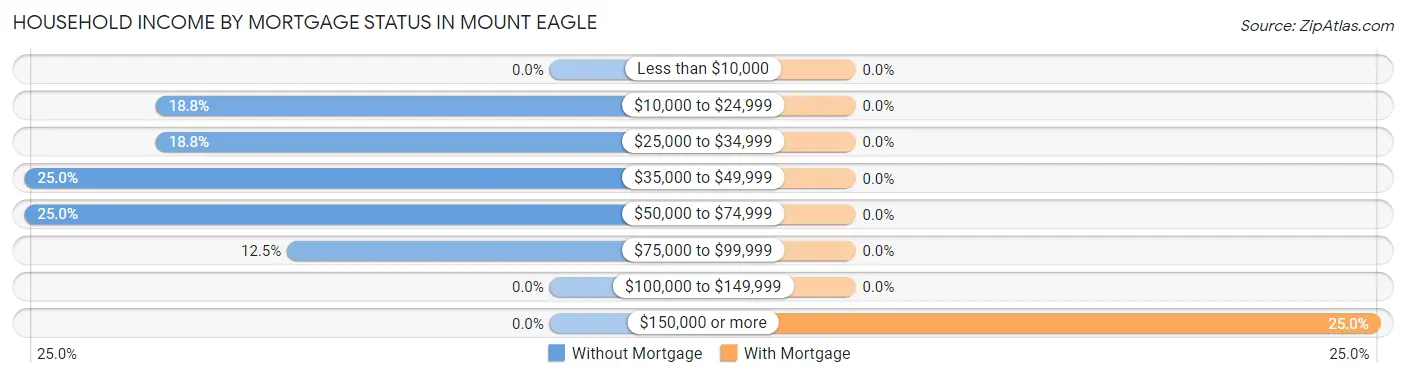
| Household Income | Without Mortgage | With Mortgage |
| Less than $10,000 | 0 (0.0%) | 0 (0.0%) |
| $10,000 to $24,999 | 3 (18.8%) | 0 (0.0%) |
| $25,000 to $34,999 | 3 (18.8%) | 0 (0.0%) |
| $35,000 to $49,999 | 4 (25.0%) | 0 (0.0%) |
| $50,000 to $74,999 | 4 (25.0%) | 0 (0.0%) |
| $75,000 to $99,999 | 2 (12.5%) | 0 (0.0%) |
| $100,000 to $149,999 | 0 (0.0%) | 0 (0.0%) |
| $150,000 or more | 0 (0.0%) | 4 (25.0%) |
| Total | 16 (100.0%) | 16 (100.0%) |
Property Value to Household Income Ratio in Mount Eagle
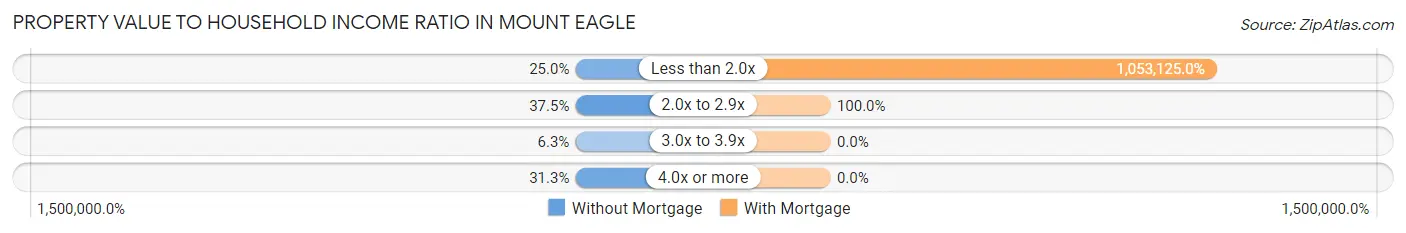
| Value-to-Income Ratio | Without Mortgage | With Mortgage |
| Less than 2.0x | 4 (25.0%) | 168,500 (1,053,125.0%) |
| 2.0x to 2.9x | 6 (37.5%) | 16 (100.0%) |
| 3.0x to 3.9x | 1 (6.2%) | 0 (0.0%) |
| 4.0x or more | 5 (31.2%) | 0 (0.0%) |
| Total | 16 (100.0%) | 16 (100.0%) |
Real Estate Taxes by Mortgage Status in Mount Eagle
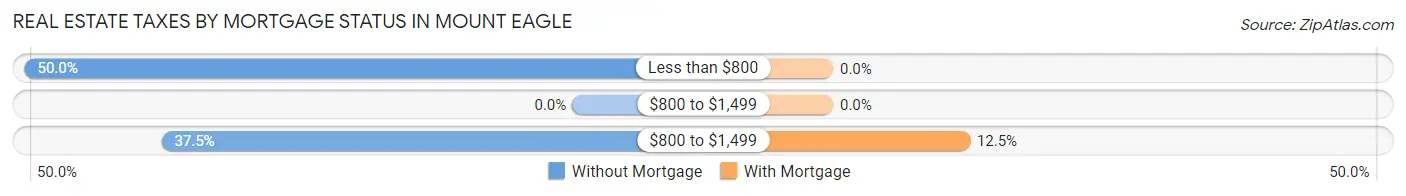
| Property Taxes | Without Mortgage | With Mortgage |
| Less than $800 | 8 (50.0%) | 0 (0.0%) |
| $800 to $1,499 | 0 (0.0%) | 0 (0.0%) |
| $800 to $1,499 | 6 (37.5%) | 2 (12.5%) |
| Total | 16 (100.0%) | 16 (100.0%) |
Health & Disability in Mount Eagle
Health Insurance Coverage by Age in Mount Eagle
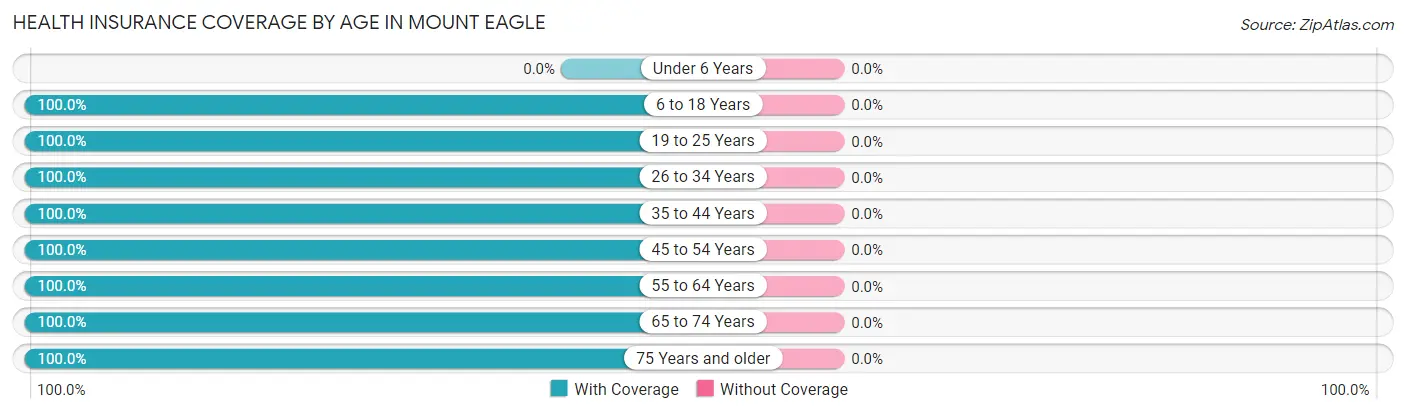
| Age Bracket | With Coverage | Without Coverage |
| Under 6 Years | 0 (0.0%) | 0 (0.0%) |
| 6 to 18 Years | 12 (100.0%) | 0 (0.0%) |
| 19 to 25 Years | 9 (100.0%) | 0 (0.0%) |
| 26 to 34 Years | 9 (100.0%) | 0 (0.0%) |
| 35 to 44 Years | 11 (100.0%) | 0 (0.0%) |
| 45 to 54 Years | 5 (100.0%) | 0 (0.0%) |
| 55 to 64 Years | 30 (100.0%) | 0 (0.0%) |
| 65 to 74 Years | 10 (100.0%) | 0 (0.0%) |
| 75 Years and older | 8 (100.0%) | 0 (0.0%) |
| Total | 94 (100.0%) | 0 (0.0%) |
Health Insurance Coverage by Citizenship Status in Mount Eagle
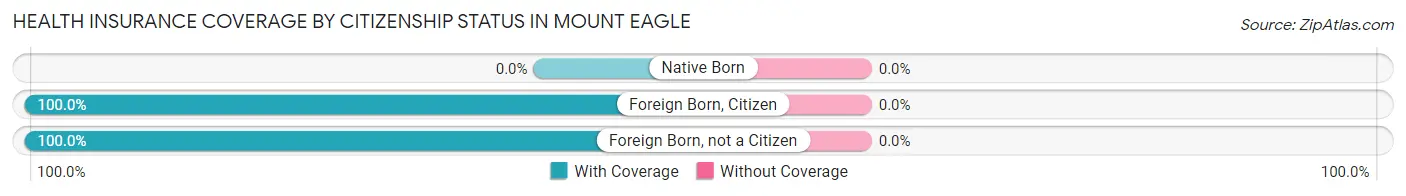
| Citizenship Status | With Coverage | Without Coverage |
| Native Born | 0 (0.0%) | 0 (0.0%) |
| Foreign Born, Citizen | 12 (100.0%) | 0 (0.0%) |
| Foreign Born, not a Citizen | 9 (100.0%) | 0 (0.0%) |
Health Insurance Coverage by Household Income in Mount Eagle
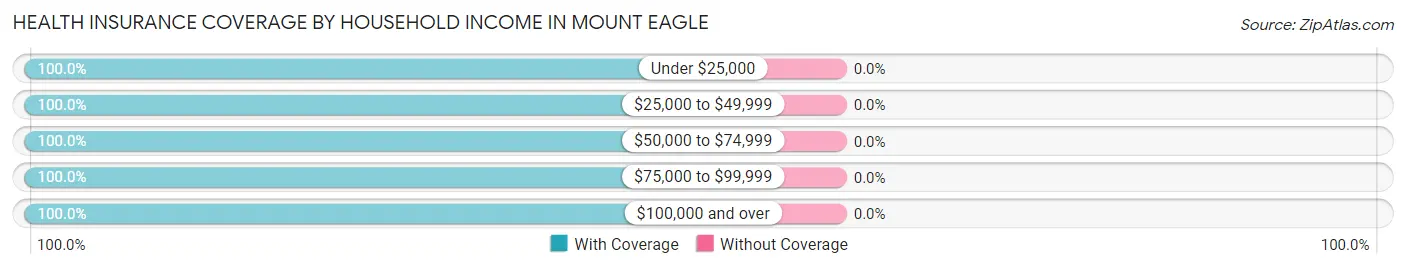
| Household Income | With Coverage | Without Coverage |
| Under $25,000 | 3 (100.0%) | 0 (0.0%) |
| $25,000 to $49,999 | 24 (100.0%) | 0 (0.0%) |
| $50,000 to $74,999 | 15 (100.0%) | 0 (0.0%) |
| $75,000 to $99,999 | 3 (100.0%) | 0 (0.0%) |
| $100,000 and over | 49 (100.0%) | 0 (0.0%) |
Public vs Private Health Insurance Coverage by Age in Mount Eagle
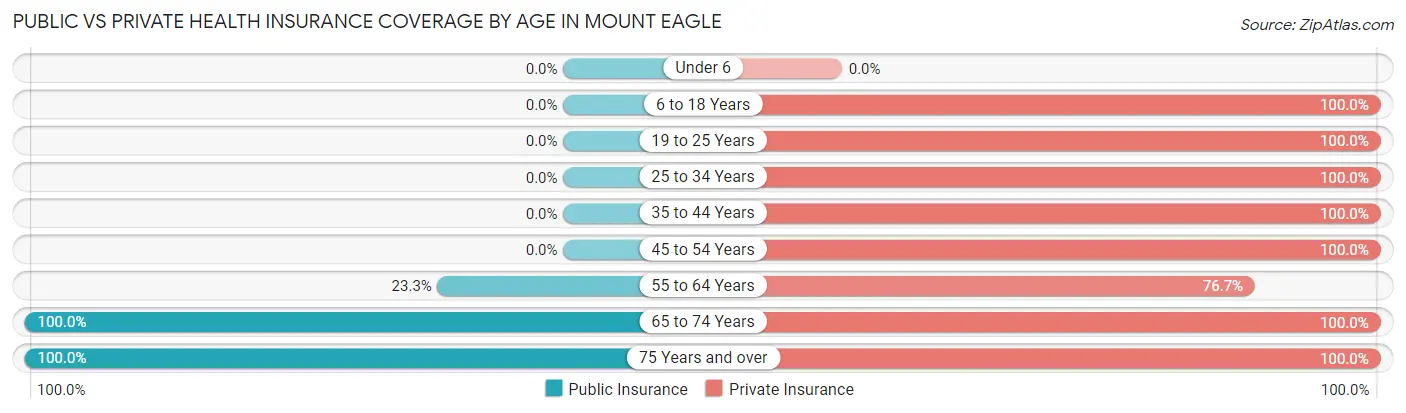
| Age Bracket | Public Insurance | Private Insurance |
| Under 6 | 0 (0.0%) | 0 (0.0%) |
| 6 to 18 Years | 0 (0.0%) | 12 (100.0%) |
| 19 to 25 Years | 0 (0.0%) | 9 (100.0%) |
| 25 to 34 Years | 0 (0.0%) | 9 (100.0%) |
| 35 to 44 Years | 0 (0.0%) | 11 (100.0%) |
| 45 to 54 Years | 0 (0.0%) | 5 (100.0%) |
| 55 to 64 Years | 7 (23.3%) | 23 (76.7%) |
| 65 to 74 Years | 10 (100.0%) | 10 (100.0%) |
| 75 Years and over | 8 (100.0%) | 8 (100.0%) |
| Total | 25 (26.6%) | 87 (92.5%) |
Disability Status by Sex by Age in Mount Eagle
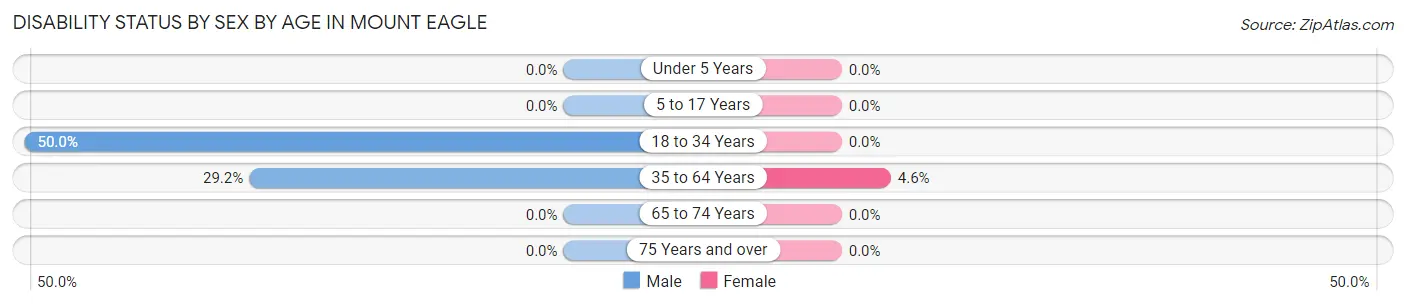
| Age Bracket | Male | Female |
| Under 5 Years | 0 (0.0%) | 0 (0.0%) |
| 5 to 17 Years | 0 (0.0%) | 0 (0.0%) |
| 18 to 34 Years | 9 (50.0%) | 0 (0.0%) |
| 35 to 64 Years | 7 (29.2%) | 1 (4.5%) |
| 65 to 74 Years | 0 (0.0%) | 0 (0.0%) |
| 75 Years and over | 0 (0.0%) | 0 (0.0%) |
Disability Class by Sex by Age in Mount Eagle
Disability Class: Hearing Difficulty
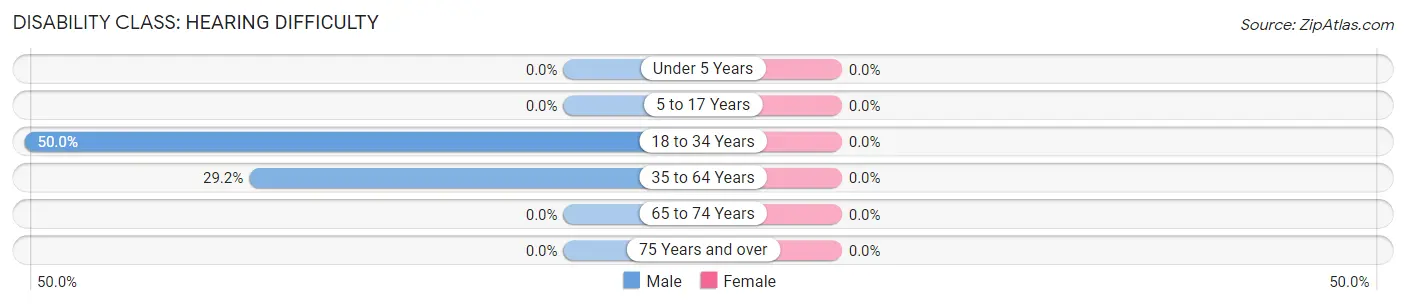
| Age Bracket | Male | Female |
| Under 5 Years | 0 (0.0%) | 0 (0.0%) |
| 5 to 17 Years | 0 (0.0%) | 0 (0.0%) |
| 18 to 34 Years | 9 (50.0%) | 0 (0.0%) |
| 35 to 64 Years | 7 (29.2%) | 0 (0.0%) |
| 65 to 74 Years | 0 (0.0%) | 0 (0.0%) |
| 75 Years and over | 0 (0.0%) | 0 (0.0%) |
Disability Class: Vision Difficulty
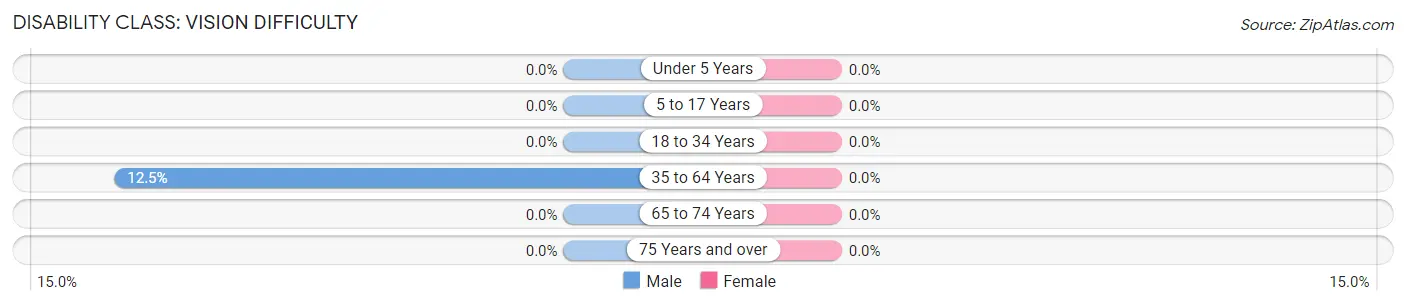
| Age Bracket | Male | Female |
| Under 5 Years | 0 (0.0%) | 0 (0.0%) |
| 5 to 17 Years | 0 (0.0%) | 0 (0.0%) |
| 18 to 34 Years | 0 (0.0%) | 0 (0.0%) |
| 35 to 64 Years | 3 (12.5%) | 0 (0.0%) |
| 65 to 74 Years | 0 (0.0%) | 0 (0.0%) |
| 75 Years and over | 0 (0.0%) | 0 (0.0%) |
Disability Class: Cognitive Difficulty
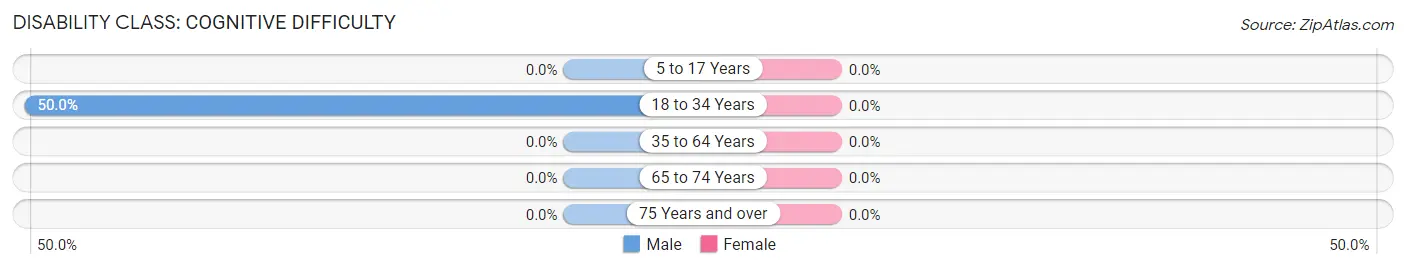
| Age Bracket | Male | Female |
| 5 to 17 Years | 0 (0.0%) | 0 (0.0%) |
| 18 to 34 Years | 9 (50.0%) | 0 (0.0%) |
| 35 to 64 Years | 0 (0.0%) | 0 (0.0%) |
| 65 to 74 Years | 0 (0.0%) | 0 (0.0%) |
| 75 Years and over | 0 (0.0%) | 0 (0.0%) |
Disability Class: Ambulatory Difficulty
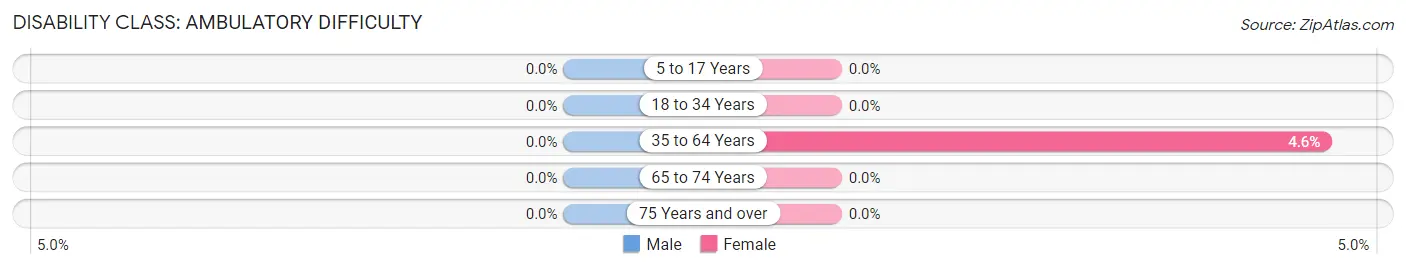
| Age Bracket | Male | Female |
| 5 to 17 Years | 0 (0.0%) | 0 (0.0%) |
| 18 to 34 Years | 0 (0.0%) | 0 (0.0%) |
| 35 to 64 Years | 0 (0.0%) | 1 (4.5%) |
| 65 to 74 Years | 0 (0.0%) | 0 (0.0%) |
| 75 Years and over | 0 (0.0%) | 0 (0.0%) |
Disability Class: Self-Care Difficulty
| Age Bracket | Male | Female |
| 5 to 17 Years | 0 (0.0%) | 0 (0.0%) |
| 18 to 34 Years | 0 (0.0%) | 0 (0.0%) |
| 35 to 64 Years | 0 (0.0%) | 0 (0.0%) |
| 65 to 74 Years | 0 (0.0%) | 0 (0.0%) |
| 75 Years and over | 0 (0.0%) | 0 (0.0%) |
Technology Access in Mount Eagle
Computing Device Access in Mount Eagle
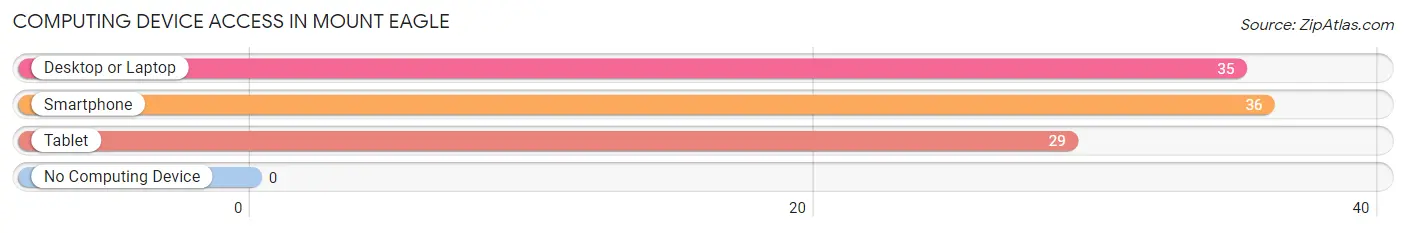
| Device Type | # Households | % Households |
| Desktop or Laptop | 35 | 79.5% |
| Smartphone | 36 | 81.8% |
| Tablet | 29 | 65.9% |
| No Computing Device | 0 | 0.0% |
| Total | 44 | 100.0% |
Internet Access in Mount Eagle
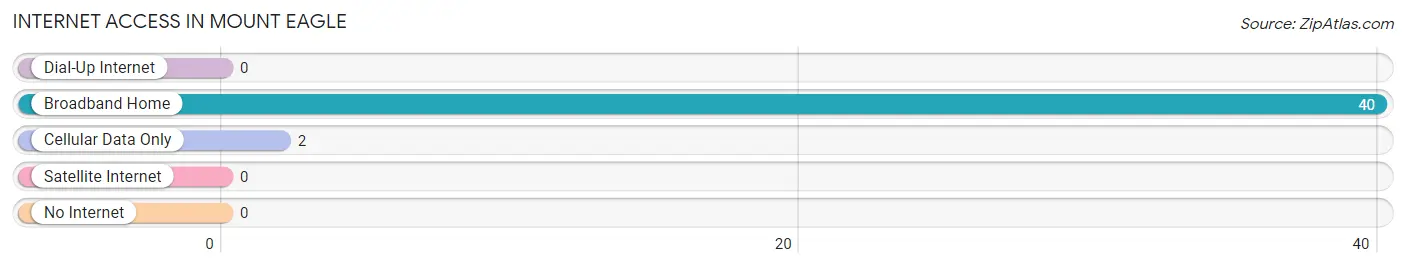
| Internet Type | # Households | % Households |
| Dial-Up Internet | 0 | 0.0% |
| Broadband Home | 40 | 90.9% |
| Cellular Data Only | 2 | 4.5% |
| Satellite Internet | 0 | 0.0% |
| No Internet | 0 | 0.0% |
| Total | 44 | 100.0% |
Mount Eagle Summary
History
Mount Eagle, Pennsylvania is a small borough located in the northern part of the state. It is situated in the Susquehanna Valley, approximately 20 miles south of the state capital of Harrisburg. The borough was founded in 1845 and was originally known as “Mount Eagle Station” due to its location on the Pennsylvania Railroad. The name was changed to Mount Eagle in 1887.
The area was first settled by German immigrants in the late 1700s. The first settlers were mostly farmers and the area was known for its fertile soil and abundant natural resources. The area was also known for its iron ore deposits, which were mined and used to produce iron products.
The borough was officially incorporated in 1845 and was named after the nearby mountain, Mount Eagle. The mountain was named after a local Native American chief, Chief Eagle. The borough was originally a small farming community, but it soon grew to become a bustling industrial center. The Pennsylvania Railroad was built through the area in 1848, and this helped to spur the growth of the borough.
The borough was home to several factories, including a paper mill, a brickyard, a sawmill, and a tannery. The borough also had a number of stores, churches, and schools. The population of the borough grew steadily throughout the 19th century and by the early 20th century, the population had reached 1,000.
Geography
Mount Eagle is located in the northern part of Pennsylvania in the Susquehanna Valley. The borough is situated on the east bank of the Susquehanna River, approximately 20 miles south of the state capital of Harrisburg. The borough is bordered by the boroughs of New Cumberland and Lemoyne to the north, and the townships of East Pennsboro and Hampden to the south.
The borough is located in a hilly region and is surrounded by several small mountains, including Mount Eagle. The borough has a total area of 0.7 square miles, all of which is land. The borough has a humid continental climate, with cold winters and hot, humid summers.
Economy
The economy of Mount Eagle is largely based on manufacturing and services. The borough is home to several factories, including a paper mill, a brickyard, a sawmill, and a tannery. The borough also has a number of stores, churches, and schools.
The borough is also home to several small businesses, including restaurants, retail stores, and professional services. The borough is also home to a number of medical facilities, including a hospital and several clinics.
Demographics
As of the 2010 census, the population of Mount Eagle was 1,845. The population is largely white (94.3%), with small percentages of African American (2.2%), Asian (1.2%), and Hispanic (1.2%) residents. The median household income is $45,938, and the median age is 43.
The borough is home to a number of churches, including the Mount Eagle United Methodist Church, the Mount Eagle Presbyterian Church, and the Mount Eagle Lutheran Church. The borough also has a number of schools, including the Mount Eagle Elementary School, the Mount Eagle Middle School, and the Mount Eagle High School.
Common Questions
What is Per Capita Income in Mount Eagle?
Per Capita income in Mount Eagle is $43,541.
What is the Median Family Income in Mount Eagle?
Median Family Income in Mount Eagle is $100,625.
What is the Median Household income in Mount Eagle?
Median Household Income in Mount Eagle is $63,333.
What is Income or Wage Gap in Mount Eagle?
Income or Wage Gap in Mount Eagle is 21.1%.
Women in Mount Eagle earn 78.9 cents for every dollar earned by a man.
What is Inequality or Gini Index in Mount Eagle?
Inequality or Gini Index in Mount Eagle is 0.36.
What is the Total Population of Mount Eagle?
Total Population of Mount Eagle is 94.
What is the Total Male Population of Mount Eagle?
Total Male Population of Mount Eagle is 56.
What is the Total Female Population of Mount Eagle?
Total Female Population of Mount Eagle is 38.
What is the Ratio of Males per 100 Females in Mount Eagle?
There are 147.37 Males per 100 Females in Mount Eagle.
What is the Ratio of Females per 100 Males in Mount Eagle?
There are 67.86 Females per 100 Males in Mount Eagle.
What is the Median Population Age in Mount Eagle?
Median Population Age in Mount Eagle is 55.1 Years.
What is the Average Family Size in Mount Eagle
Average Family Size in Mount Eagle is 2.7 People.
What is the Average Household Size in Mount Eagle
Average Household Size in Mount Eagle is 2.1 People.
How Large is the Labor Force in Mount Eagle?
There are 61 People in the Labor Forcein in Mount Eagle.
What is the Percentage of People in the Labor Force in Mount Eagle?
73.5% of People are in the Labor Force in Mount Eagle.