Davidsville, PA Map & Demographics
Davidsville Map
Davidsville Overview
$36,974
PER CAPITA INCOME
$91,705
AVG FAMILY INCOME
$53,326
AVG HOUSEHOLD INCOME
62.3%
WAGE / INCOME GAP [ % ]
37.7¢/ $1
WAGE / INCOME GAP [ $ ]
0.33
INEQUALITY / GINI INDEX
887
TOTAL POPULATION
462
MALE POPULATION
425
FEMALE POPULATION
108.71
MALES / 100 FEMALES
91.99
FEMALES / 100 MALES
65.4
MEDIAN AGE
2.6
AVG FAMILY SIZE
1.9
AVG HOUSEHOLD SIZE
317
LABOR FORCE [ PEOPLE ]
41.3%
PERCENT IN LABOR FORCE
Davidsville Zip Codes
Davidsville Area Codes
Income in Davidsville
Income Overview in Davidsville
Per Capita Income in Davidsville is $36,974, while median incomes of families and households are $91,705 and $53,326 respectively.
| Characteristic | Number | Measure |
| Per Capita Income | 887 | $36,974 |
| Median Family Income | 255 | $91,705 |
| Mean Family Income | 255 | $92,708 |
| Median Household Income | 455 | $53,326 |
| Mean Household Income | 455 | $68,678 |
| Income Deficit | 255 | $0 |
| Wage / Income Gap (%) | 887 | 62.30% |
| Wage / Income Gap ($) | 887 | 37.70¢ per $1 |
| Gini / Inequality Index | 887 | 0.33 |
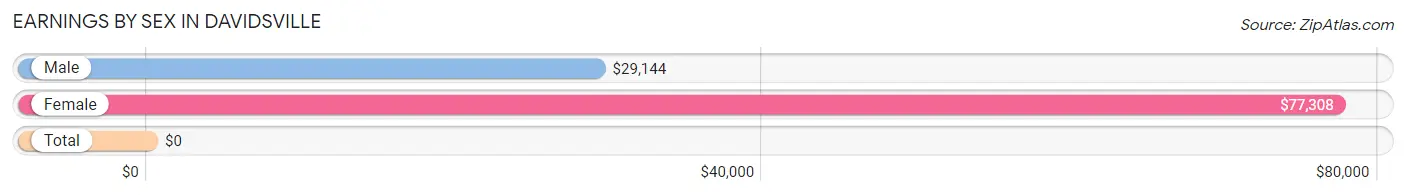
Earnings by Sex in Davidsville
| Sex | Number | Average Earnings |
| Male | 213 (67.2%) | $29,144 |
| Female | 104 (32.8%) | $77,308 |
| Total | 317 (100.0%) | $0 |
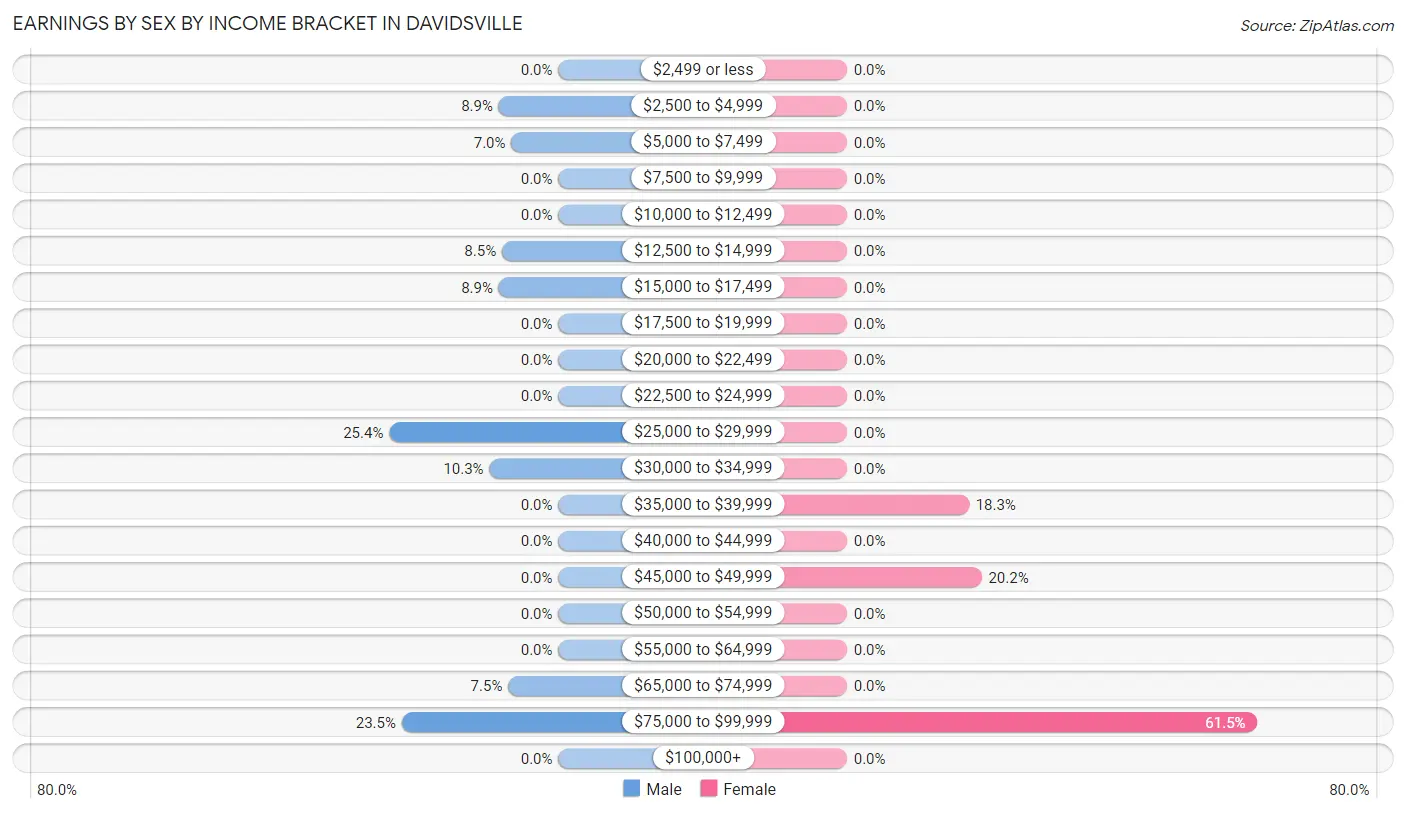
Earnings by Sex by Income Bracket in Davidsville
The most common earnings brackets in Davidsville are $25,000 to $29,999 for men (54 | 25.4%) and $75,000 to $99,999 for women (64 | 61.5%).
| Income | Male | Female |
| $2,499 or less | 0 (0.0%) | 0 (0.0%) |
| $2,500 to $4,999 | 19 (8.9%) | 0 (0.0%) |
| $5,000 to $7,499 | 15 (7.0%) | 0 (0.0%) |
| $7,500 to $9,999 | 0 (0.0%) | 0 (0.0%) |
| $10,000 to $12,499 | 0 (0.0%) | 0 (0.0%) |
| $12,500 to $14,999 | 18 (8.5%) | 0 (0.0%) |
| $15,000 to $17,499 | 19 (8.9%) | 0 (0.0%) |
| $17,500 to $19,999 | 0 (0.0%) | 0 (0.0%) |
| $20,000 to $22,499 | 0 (0.0%) | 0 (0.0%) |
| $22,500 to $24,999 | 0 (0.0%) | 0 (0.0%) |
| $25,000 to $29,999 | 54 (25.4%) | 0 (0.0%) |
| $30,000 to $34,999 | 22 (10.3%) | 0 (0.0%) |
| $35,000 to $39,999 | 0 (0.0%) | 19 (18.3%) |
| $40,000 to $44,999 | 0 (0.0%) | 0 (0.0%) |
| $45,000 to $49,999 | 0 (0.0%) | 21 (20.2%) |
| $50,000 to $54,999 | 0 (0.0%) | 0 (0.0%) |
| $55,000 to $64,999 | 0 (0.0%) | 0 (0.0%) |
| $65,000 to $74,999 | 16 (7.5%) | 0 (0.0%) |
| $75,000 to $99,999 | 50 (23.5%) | 64 (61.5%) |
| $100,000+ | 0 (0.0%) | 0 (0.0%) |
| Total | 213 (100.0%) | 104 (100.0%) |
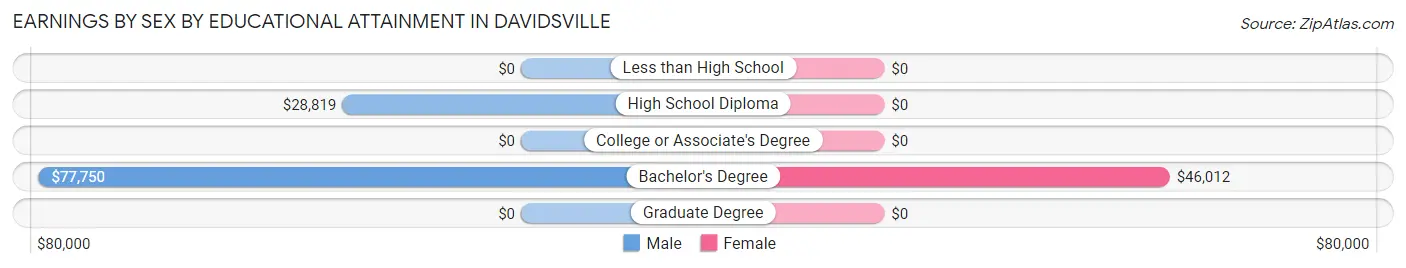
Earnings by Sex by Educational Attainment in Davidsville
Average earnings in Davidsville are $29,144 for men and $77,308 for women, a difference of 62.3%. Men with an educational attainment of bachelor's degree enjoy the highest average annual earnings of $77,750, while those with high school diploma education earn the least with $28,819. Women with an educational attainment of bachelor's degree earn the most with the average annual earnings of $46,012, while those with bachelor's degree education have the smallest earnings of $46,012.
| Educational Attainment | Male Income | Female Income |
| Less than High School | - | - |
| High School Diploma | $28,819 | $0 |
| College or Associate's Degree | - | - |
| Bachelor's Degree | $77,750 | $46,012 |
| Graduate Degree | - | - |
| Total | $29,144 | $77,308 |
Family Income in Davidsville
Family Income Brackets in Davidsville
According to the Davidsville family income data, there are 69 families falling into the $75,000 to $99,999 income range, which is the most common income bracket and makes up 27.1% of all families.
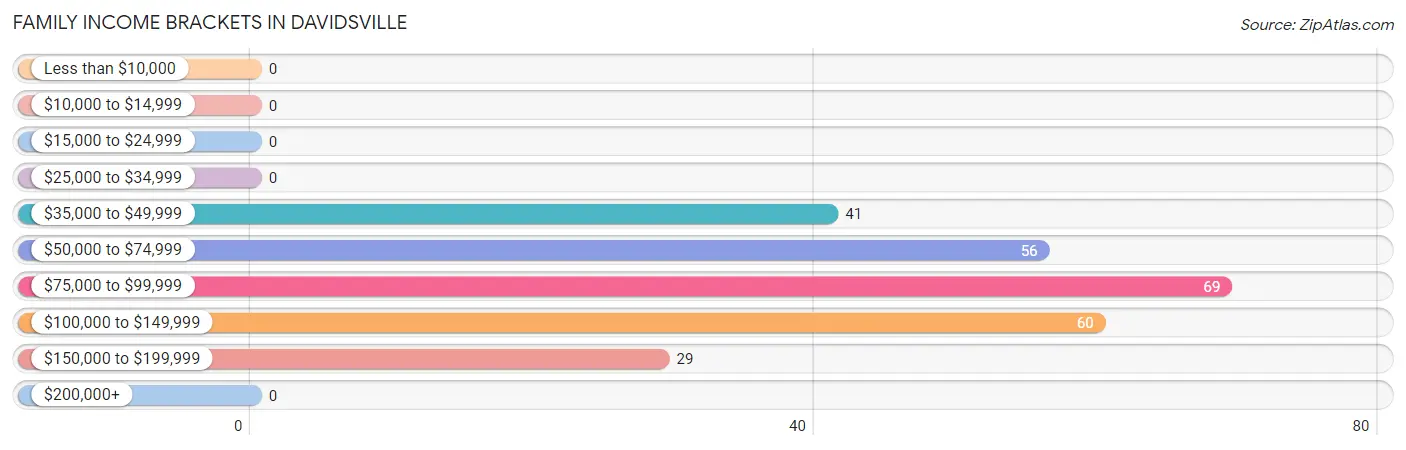
| Income Bracket | # Families | % Families |
| Less than $10,000 | 0 | 0.0% |
| $10,000 to $14,999 | 0 | 0.0% |
| $15,000 to $24,999 | 0 | 0.0% |
| $25,000 to $34,999 | 0 | 0.0% |
| $35,000 to $49,999 | 41 | 16.1% |
| $50,000 to $74,999 | 56 | 22.0% |
| $75,000 to $99,999 | 69 | 27.1% |
| $100,000 to $149,999 | 60 | 23.5% |
| $150,000 to $199,999 | 29 | 11.4% |
| $200,000+ | 0 | 0.0% |
Family Income by Famaliy Size in Davidsville
2-person families (203 | 79.6%) account for the highest median family income in Davidsville with $85,489 per family, while 2-person families (203 | 79.6%) have the highest median income of $42,744 per family member.
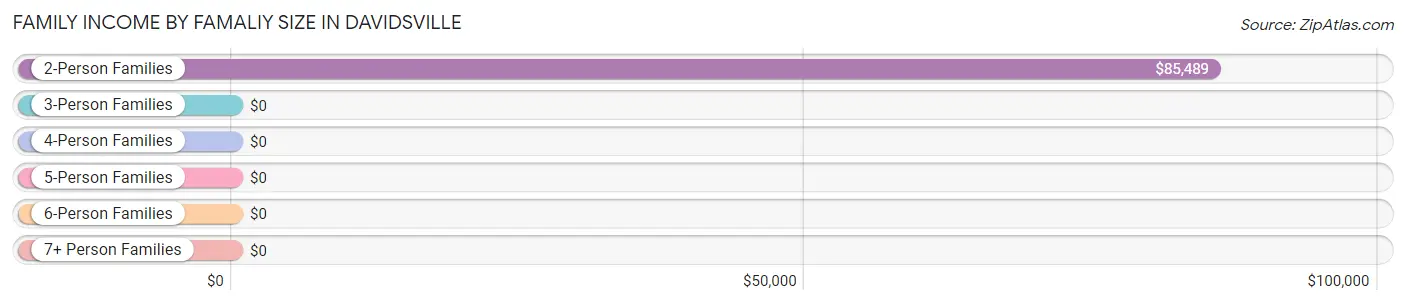
| Income Bracket | # Families | Median Income |
| 2-Person Families | 203 (79.6%) | $85,489 |
| 3-Person Families | 16 (6.3%) | $0 |
| 4-Person Families | 22 (8.6%) | $0 |
| 5-Person Families | 14 (5.5%) | $0 |
| 6-Person Families | 0 (0.0%) | $0 |
| 7+ Person Families | 0 (0.0%) | $0 |
| Total | 255 (100.0%) | $91,705 |
Family Income by Number of Earners in Davidsville
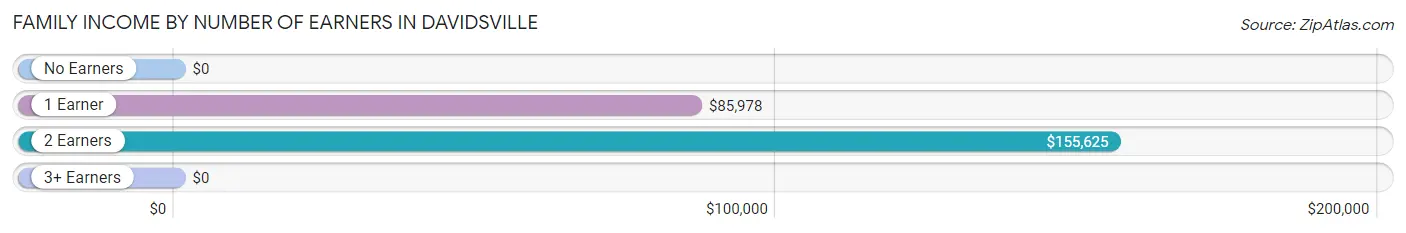
| Number of Earners | # Families | Median Income |
| No Earners | 74 (29.0%) | $0 |
| 1 Earner | 130 (51.0%) | $85,978 |
| 2 Earners | 51 (20.0%) | $155,625 |
| 3+ Earners | 0 (0.0%) | $0 |
| Total | 255 (100.0%) | $91,705 |
Household Income in Davidsville
Household Income Brackets in Davidsville
With 151 households falling in the category, the $35,000 to $49,999 income range is the most frequent in Davidsville, accounting for 33.2% of all households.
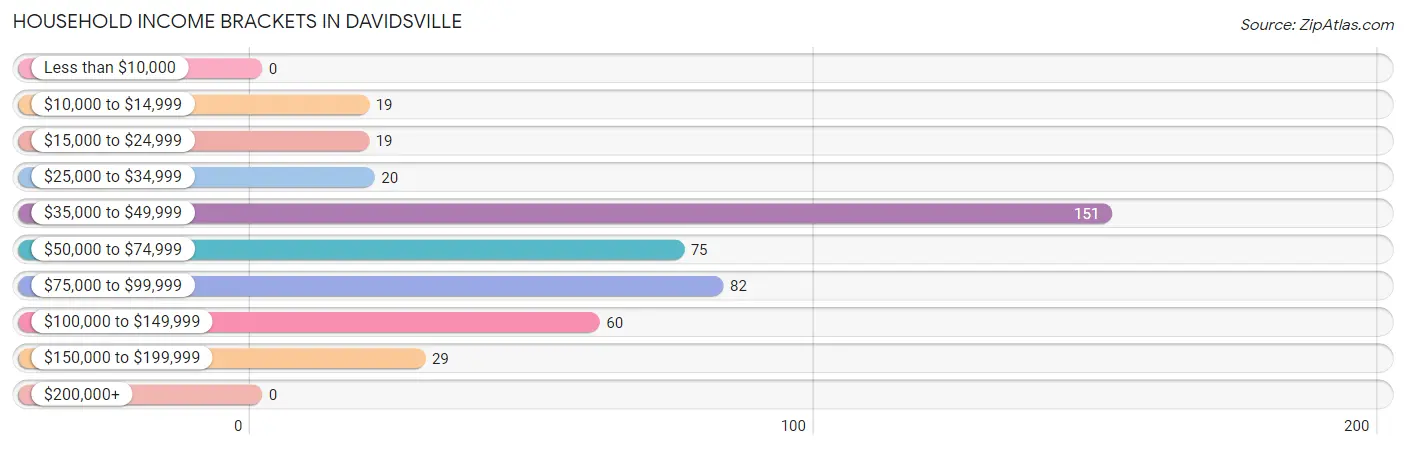
| Income Bracket | # Households | % Households |
| Less than $10,000 | 0 | 0.0% |
| $10,000 to $14,999 | 19 | 4.2% |
| $15,000 to $24,999 | 19 | 4.2% |
| $25,000 to $34,999 | 20 | 4.4% |
| $35,000 to $49,999 | 151 | 33.2% |
| $50,000 to $74,999 | 75 | 16.5% |
| $75,000 to $99,999 | 82 | 18.0% |
| $100,000 to $149,999 | 60 | 13.2% |
| $150,000 to $199,999 | 29 | 6.4% |
| $200,000+ | 0 | 0.0% |
Household Income by Householder Age in Davidsville
The median household income in Davidsville is $53,326, with the highest median household income of $128,807 found in the 25 to 44 years age bracket for the primary householder. A total of 49 households (10.8%) fall into this category.
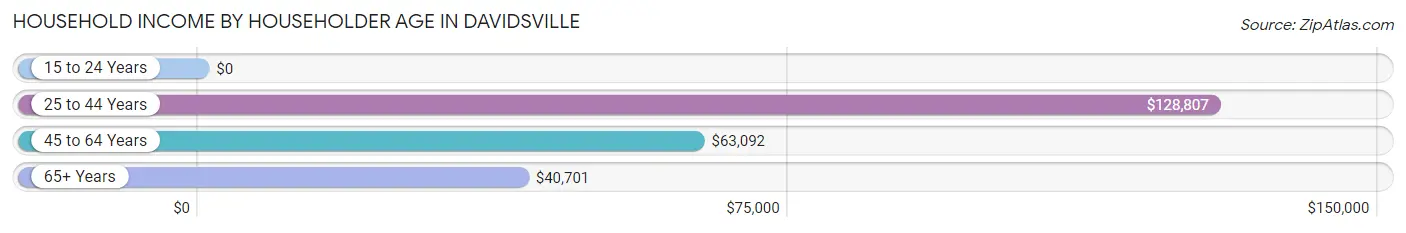
| Income Bracket | # Households | Median Income |
| 15 to 24 Years | 0 (0.0%) | $0 |
| 25 to 44 Years | 49 (10.8%) | $128,807 |
| 45 to 64 Years | 85 (18.7%) | $63,092 |
| 65+ Years | 321 (70.6%) | $40,701 |
| Total | 455 (100.0%) | $53,326 |
Poverty in Davidsville
Income Below Poverty by Sex and Age in Davidsville
With 3.3% poverty level for males and 4.5% for females among the residents of Davidsville, 25 to 34 year old males and 65 to 74 year old females are the most vulnerable to poverty, with 15 males (40.5%) and 19 females (17.3%) in their respective age groups living below the poverty level.
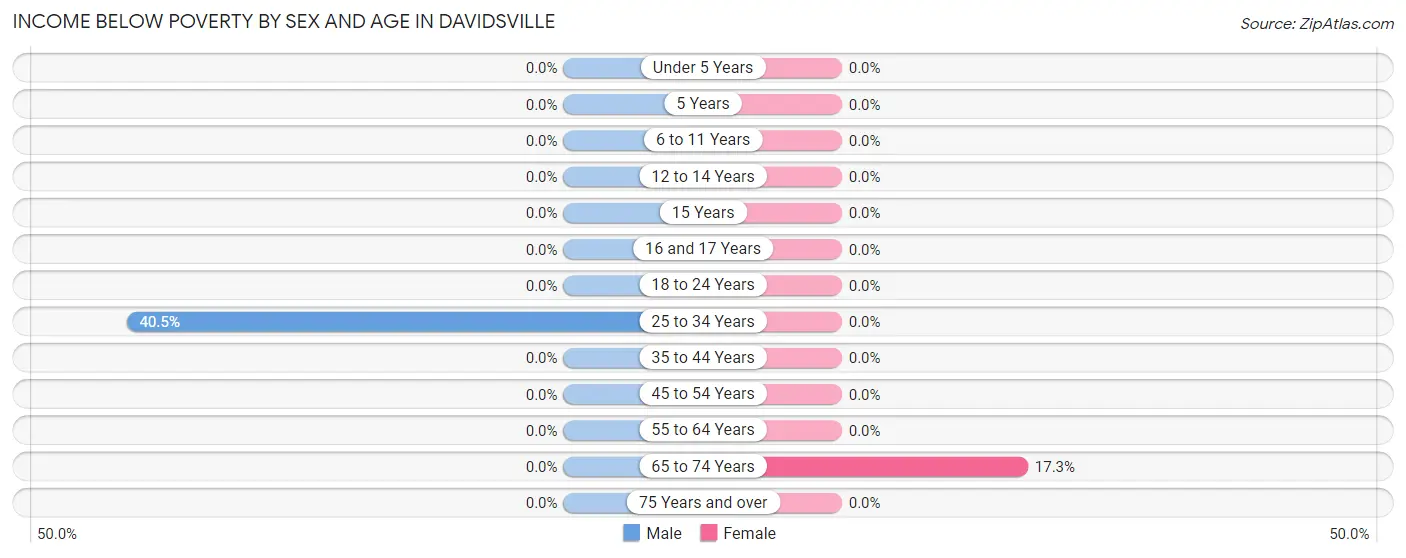
| Age Bracket | Male | Female |
| Under 5 Years | 0 (0.0%) | 0 (0.0%) |
| 5 Years | 0 (0.0%) | 0 (0.0%) |
| 6 to 11 Years | 0 (0.0%) | 0 (0.0%) |
| 12 to 14 Years | 0 (0.0%) | 0 (0.0%) |
| 15 Years | 0 (0.0%) | 0 (0.0%) |
| 16 and 17 Years | 0 (0.0%) | 0 (0.0%) |
| 18 to 24 Years | 0 (0.0%) | 0 (0.0%) |
| 25 to 34 Years | 15 (40.5%) | 0 (0.0%) |
| 35 to 44 Years | 0 (0.0%) | 0 (0.0%) |
| 45 to 54 Years | 0 (0.0%) | 0 (0.0%) |
| 55 to 64 Years | 0 (0.0%) | 0 (0.0%) |
| 65 to 74 Years | 0 (0.0%) | 19 (17.3%) |
| 75 Years and over | 0 (0.0%) | 0 (0.0%) |
| Total | 15 (3.3%) | 19 (4.5%) |
Income Above Poverty by Sex and Age in Davidsville
According to the poverty statistics in Davidsville, males aged under 5 years and females aged 15 years are the age groups that are most secure financially, with 100.0% of males and 100.0% of females in these age groups living above the poverty line.
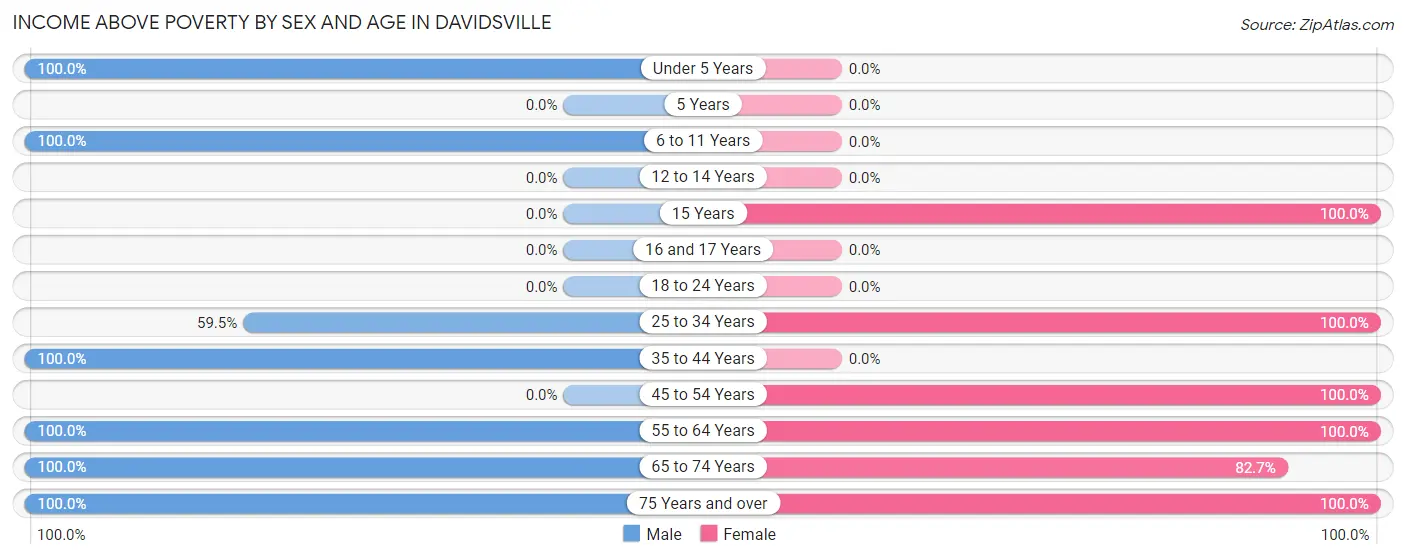
| Age Bracket | Male | Female |
| Under 5 Years | 76 (100.0%) | 0 (0.0%) |
| 5 Years | 0 (0.0%) | 0 (0.0%) |
| 6 to 11 Years | 17 (100.0%) | 0 (0.0%) |
| 12 to 14 Years | 0 (0.0%) | 0 (0.0%) |
| 15 Years | 0 (0.0%) | 26 (100.0%) |
| 16 and 17 Years | 0 (0.0%) | 0 (0.0%) |
| 18 to 24 Years | 0 (0.0%) | 0 (0.0%) |
| 25 to 34 Years | 22 (59.5%) | 48 (100.0%) |
| 35 to 44 Years | 37 (100.0%) | 0 (0.0%) |
| 45 to 54 Years | 0 (0.0%) | 19 (100.0%) |
| 55 to 64 Years | 102 (100.0%) | 69 (100.0%) |
| 65 to 74 Years | 90 (100.0%) | 91 (82.7%) |
| 75 Years and over | 103 (100.0%) | 153 (100.0%) |
| Total | 447 (96.8%) | 406 (95.5%) |
Income Below Poverty Among Married-Couple Families in Davidsville
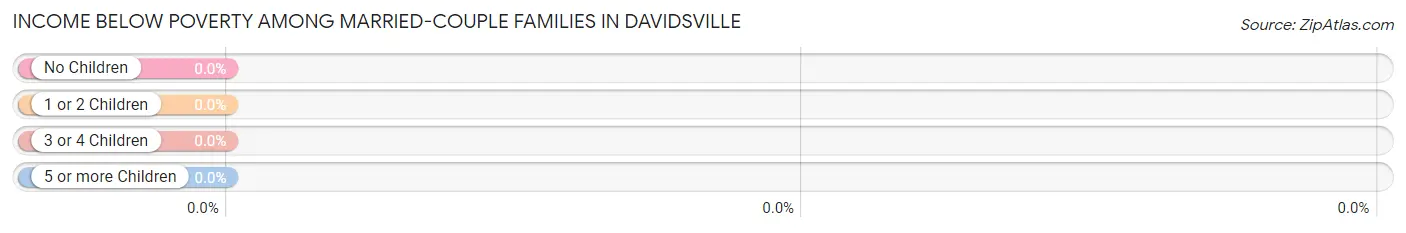
| Children | Above Poverty | Below Poverty |
| No Children | 177 (100.0%) | 0 (0.0%) |
| 1 or 2 Children | 22 (100.0%) | 0 (0.0%) |
| 3 or 4 Children | 14 (100.0%) | 0 (0.0%) |
| 5 or more Children | 0 (0.0%) | 0 (0.0%) |
| Total | 213 (100.0%) | 0 (0.0%) |
Income Below Poverty Among Single-Parent Households in Davidsville
| Children | Single Father | Single Mother |
| No Children | 0 (0.0%) | 0 (0.0%) |
| 1 or 2 Children | 0 (0.0%) | 0 (0.0%) |
| 3 or 4 Children | 0 (0.0%) | 0 (0.0%) |
| 5 or more Children | 0 (0.0%) | 0 (0.0%) |
| Total | 0 (0.0%) | 0 (0.0%) |
Income Below Poverty Among Married-Couple vs Single-Parent Households in Davidsville
| Children | Married-Couple Families | Single-Parent Households |
| No Children | 0 (0.0%) | 0 (0.0%) |
| 1 or 2 Children | 0 (0.0%) | 0 (0.0%) |
| 3 or 4 Children | 0 (0.0%) | 0 (0.0%) |
| 5 or more Children | 0 (0.0%) | 0 (0.0%) |
| Total | 0 (0.0%) | 0 (0.0%) |
Race in Davidsville
The most populous races in Davidsville are White / Caucasian (768 | 86.6%), Two or more Races (74 | 8.3%), and Asian (45 | 5.1%).
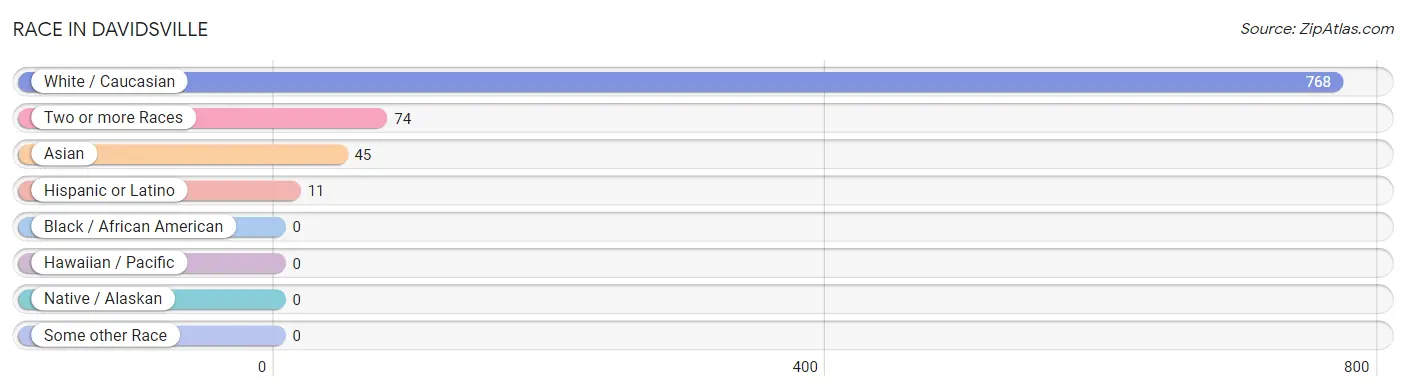
| Race | # Population | % Population |
| Asian | 45 | 5.1% |
| Black / African American | 0 | 0.0% |
| Hawaiian / Pacific | 0 | 0.0% |
| Hispanic or Latino | 11 | 1.2% |
| Native / Alaskan | 0 | 0.0% |
| White / Caucasian | 768 | 86.6% |
| Two or more Races | 74 | 8.3% |
| Some other Race | 0 | 0.0% |
| Total | 887 | 100.0% |
Ancestry in Davidsville
The most populous ancestries reported in Davidsville are German (258 | 29.1%), English (152 | 17.1%), Welsh (132 | 14.9%), Irish (77 | 8.7%), and Indian (Asian) (45 | 5.1%), together accounting for 74.9% of all Davidsville residents.
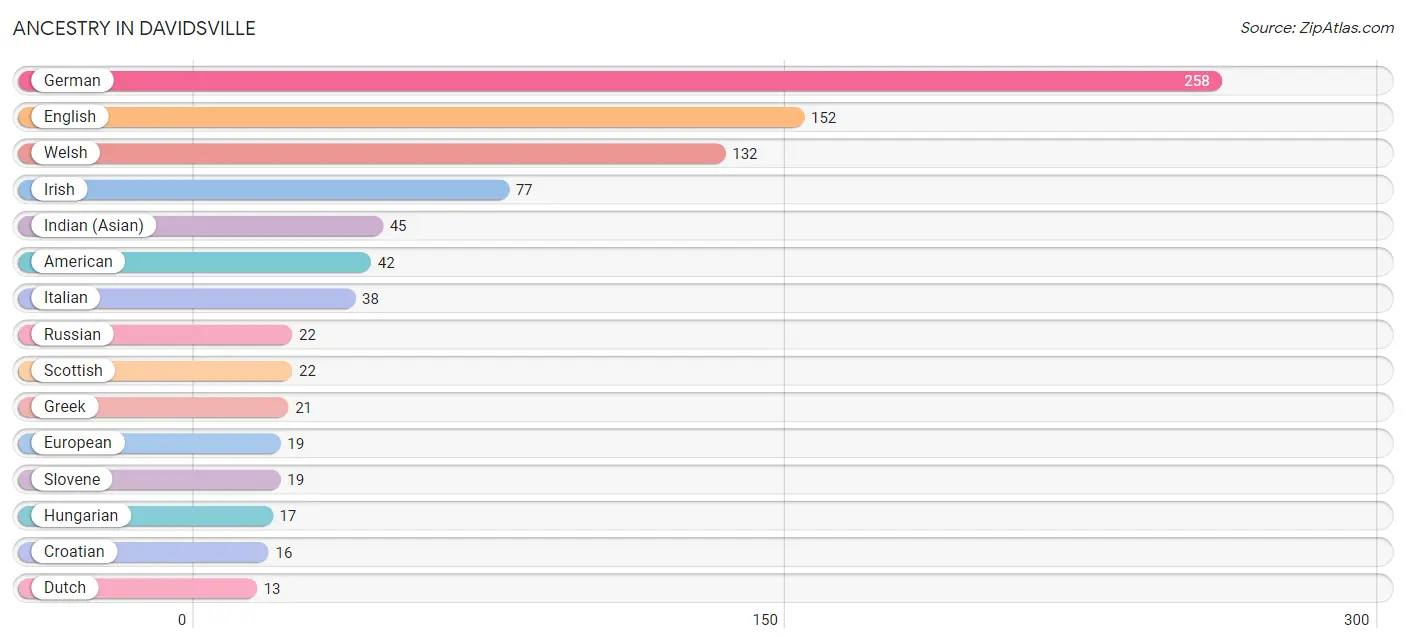
| Ancestry | # Population | % Population |
| American | 42 | 4.7% |
| Croatian | 16 | 1.8% |
| Dutch | 13 | 1.5% |
| English | 152 | 17.1% |
| European | 19 | 2.1% |
| German | 258 | 29.1% |
| Greek | 21 | 2.4% |
| Hungarian | 17 | 1.9% |
| Indian (Asian) | 45 | 5.1% |
| Irish | 77 | 8.7% |
| Italian | 38 | 4.3% |
| Mexican | 11 | 1.2% |
| Russian | 22 | 2.5% |
| Scottish | 22 | 2.5% |
| Slovene | 19 | 2.1% |
| Ukrainian | 13 | 1.5% |
| Welsh | 132 | 14.9% | View All 17 Rows |
Immigrants in Davidsville
The most numerous immigrant groups reported in Davidsville came from Asia (19 | 2.1%), China (19 | 2.1%), and Eastern Asia (19 | 2.1%), together accounting for 6.4% of all Davidsville residents.
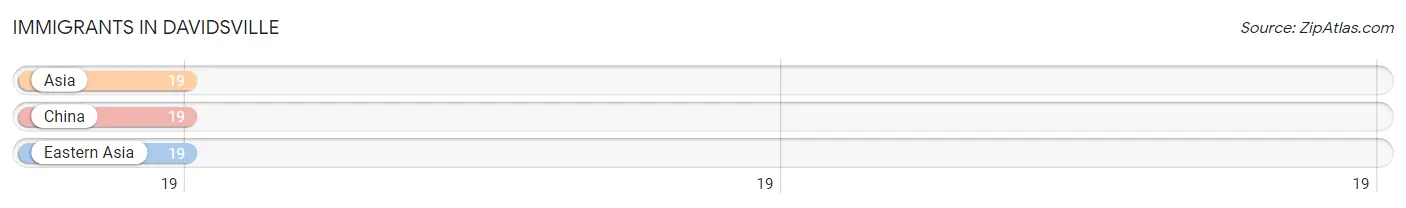
| Immigration Origin | # Population | % Population |
| Asia | 19 | 2.1% |
| China | 19 | 2.1% |
| Eastern Asia | 19 | 2.1% | View All 3 Rows |
Sex and Age in Davidsville
Sex and Age in Davidsville
The most populous age groups in Davidsville are 80 to 84 Years (103 | 22.3%) for men and 85 Years and over (110 | 25.9%) for women.
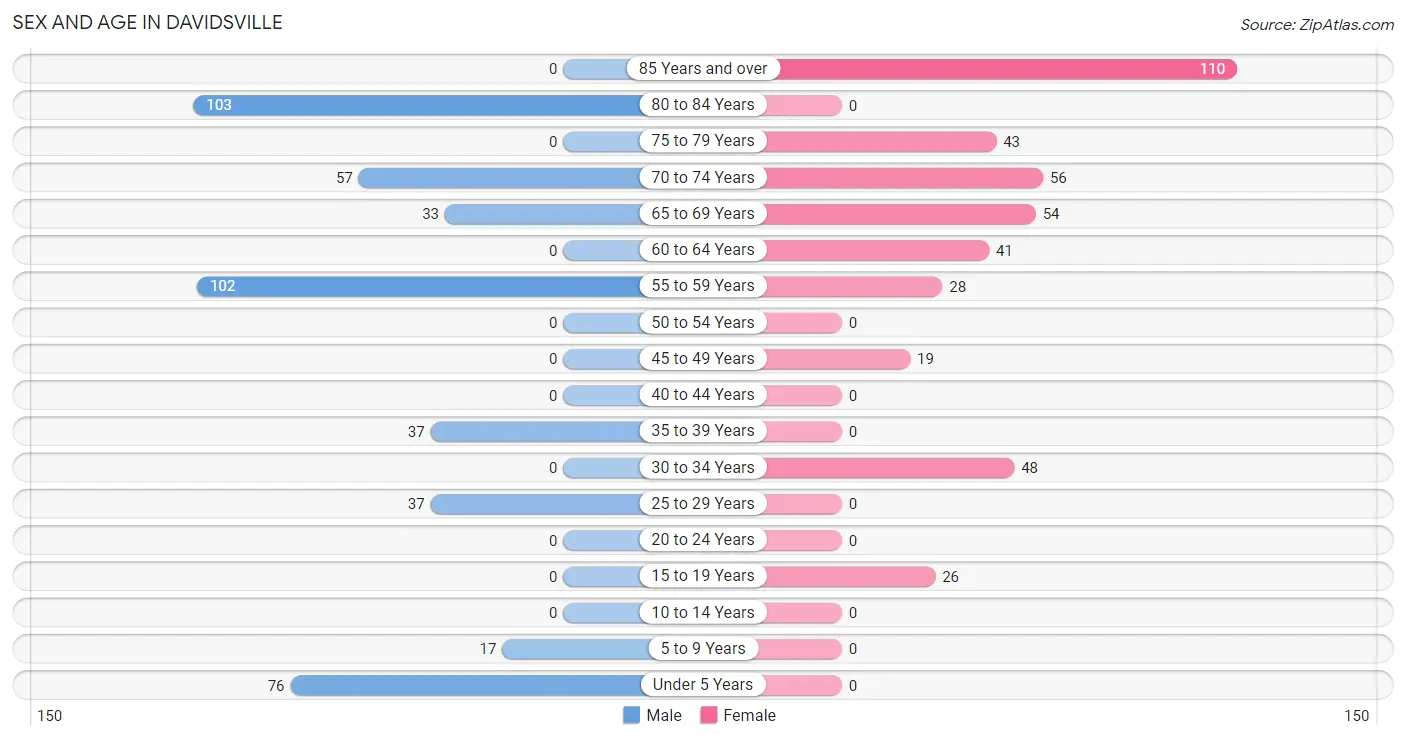
| Age Bracket | Male | Female |
| Under 5 Years | 76 (16.5%) | 0 (0.0%) |
| 5 to 9 Years | 17 (3.7%) | 0 (0.0%) |
| 10 to 14 Years | 0 (0.0%) | 0 (0.0%) |
| 15 to 19 Years | 0 (0.0%) | 26 (6.1%) |
| 20 to 24 Years | 0 (0.0%) | 0 (0.0%) |
| 25 to 29 Years | 37 (8.0%) | 0 (0.0%) |
| 30 to 34 Years | 0 (0.0%) | 48 (11.3%) |
| 35 to 39 Years | 37 (8.0%) | 0 (0.0%) |
| 40 to 44 Years | 0 (0.0%) | 0 (0.0%) |
| 45 to 49 Years | 0 (0.0%) | 19 (4.5%) |
| 50 to 54 Years | 0 (0.0%) | 0 (0.0%) |
| 55 to 59 Years | 102 (22.1%) | 28 (6.6%) |
| 60 to 64 Years | 0 (0.0%) | 41 (9.7%) |
| 65 to 69 Years | 33 (7.1%) | 54 (12.7%) |
| 70 to 74 Years | 57 (12.3%) | 56 (13.2%) |
| 75 to 79 Years | 0 (0.0%) | 43 (10.1%) |
| 80 to 84 Years | 103 (22.3%) | 0 (0.0%) |
| 85 Years and over | 0 (0.0%) | 110 (25.9%) |
| Total | 462 (100.0%) | 425 (100.0%) |
Families and Households in Davidsville
Median Family Size in Davidsville
The median family size in Davidsville is 2.64 persons per family, with single male/father families (23 | 9.0%) accounting for the largest median family size of 3.35 persons per family. On the other hand, single female/mother families (19 | 7.4%) represent the smallest median family size with 2.37 persons per family.
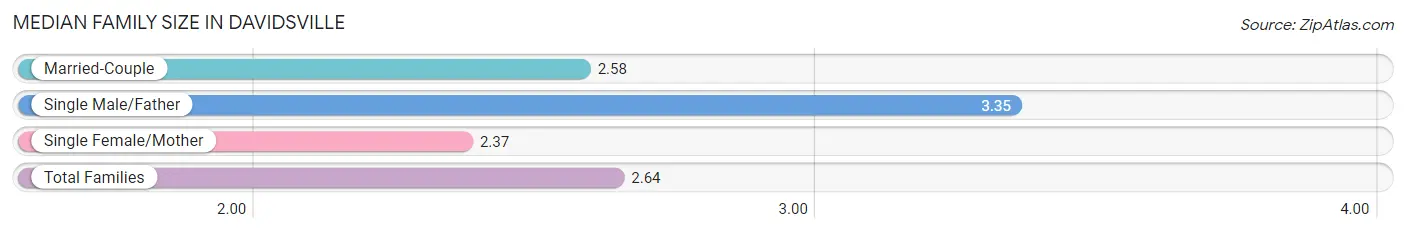
| Family Type | # Families | Family Size |
| Married-Couple | 213 (83.5%) | 2.58 |
| Single Male/Father | 23 (9.0%) | 3.35 |
| Single Female/Mother | 19 (7.4%) | 2.37 |
| Total Families | 255 (100.0%) | 2.64 |
Median Household Size in Davidsville
The median household size in Davidsville is 1.95 persons per household, with single male/father households (23 | 5.1%) accounting for the largest median household size of 3.35 persons per household. non-family households (200 | 44.0%) represent the smallest median household size with 1.08 persons per household.
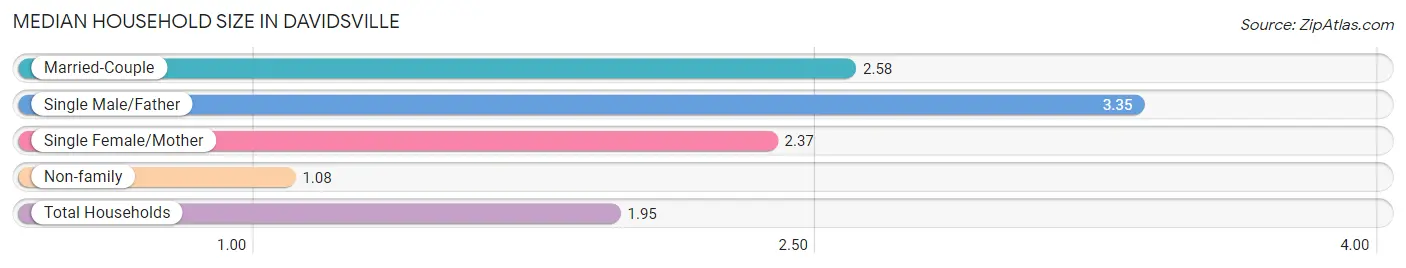
| Household Type | # Households | Household Size |
| Married-Couple | 213 (46.8%) | 2.58 |
| Single Male/Father | 23 (5.1%) | 3.35 |
| Single Female/Mother | 19 (4.2%) | 2.37 |
| Non-family | 200 (44.0%) | 1.08 |
| Total Households | 455 (100.0%) | 1.95 |
Household Size by Marriage Status in Davidsville
Out of a total of 455 households in Davidsville, 255 (56.0%) are family households, while 200 (44.0%) are nonfamily households. The most numerous type of family households are 2-person households, comprising 203, and the most common type of nonfamily households are 1-person households, comprising 187.
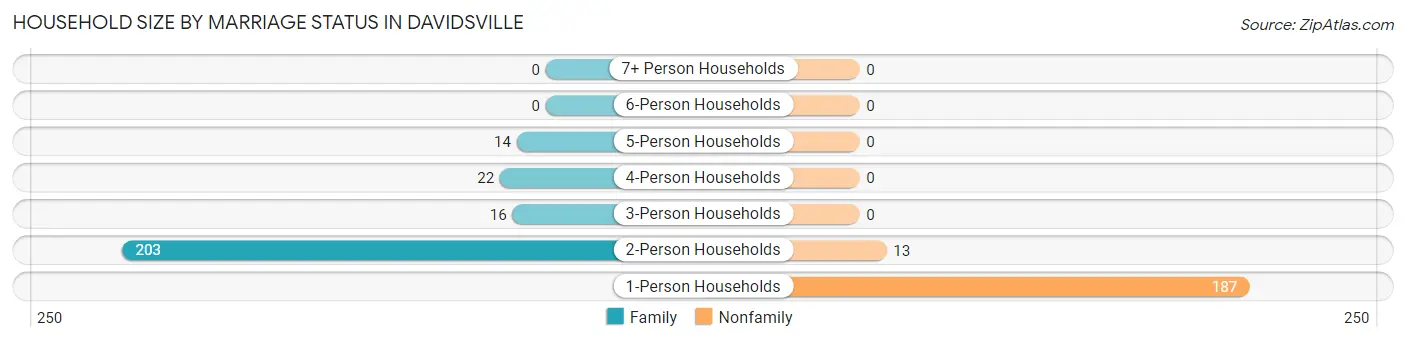
| Household Size | Family Households | Nonfamily Households |
| 1-Person Households | - | 187 (41.1%) |
| 2-Person Households | 203 (44.6%) | 13 (2.9%) |
| 3-Person Households | 16 (3.5%) | 0 (0.0%) |
| 4-Person Households | 22 (4.8%) | 0 (0.0%) |
| 5-Person Households | 14 (3.1%) | 0 (0.0%) |
| 6-Person Households | 0 (0.0%) | 0 (0.0%) |
| 7+ Person Households | 0 (0.0%) | 0 (0.0%) |
| Total | 255 (56.0%) | 200 (44.0%) |
Female Fertility in Davidsville
Fertility by Age in Davidsville
Average fertility rate in Davidsville is 226.0 births per 1,000 women. Women in the age bracket of 20 to 34 years have the highest fertility rate with 438.0 births per 1,000 women. Women in the age bracket of 20 to 34 years acount for 100.0% of all women with births.
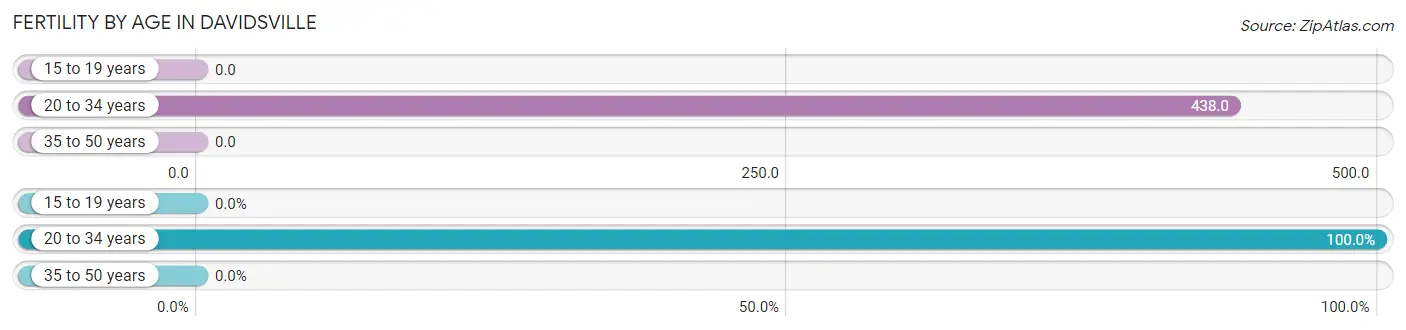
| Age Bracket | Women with Births | Births / 1,000 Women |
| 15 to 19 years | 0 (0.0%) | 0.0 |
| 20 to 34 years | 21 (100.0%) | 438.0 |
| 35 to 50 years | 0 (0.0%) | 0.0 |
| Total | 21 (100.0%) | 226.0 |
Fertility by Age by Marriage Status in Davidsville
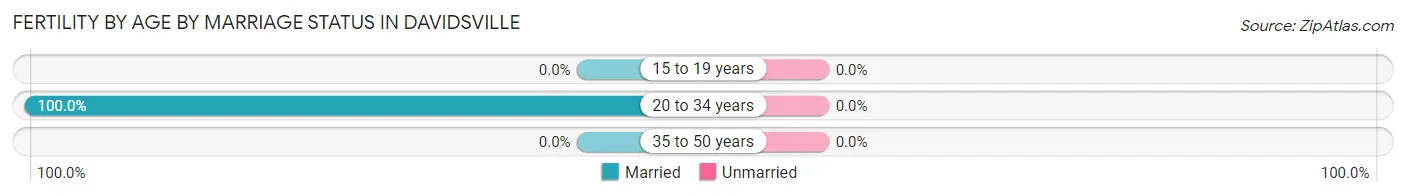
| Age Bracket | Married | Unmarried |
| 15 to 19 years | 0 (0.0%) | 0 (0.0%) |
| 20 to 34 years | 21 (100.0%) | 0 (0.0%) |
| 35 to 50 years | 0 (0.0%) | 0 (0.0%) |
| Total | 21 (100.0%) | 0 (0.0%) |
Fertility by Education in Davidsville
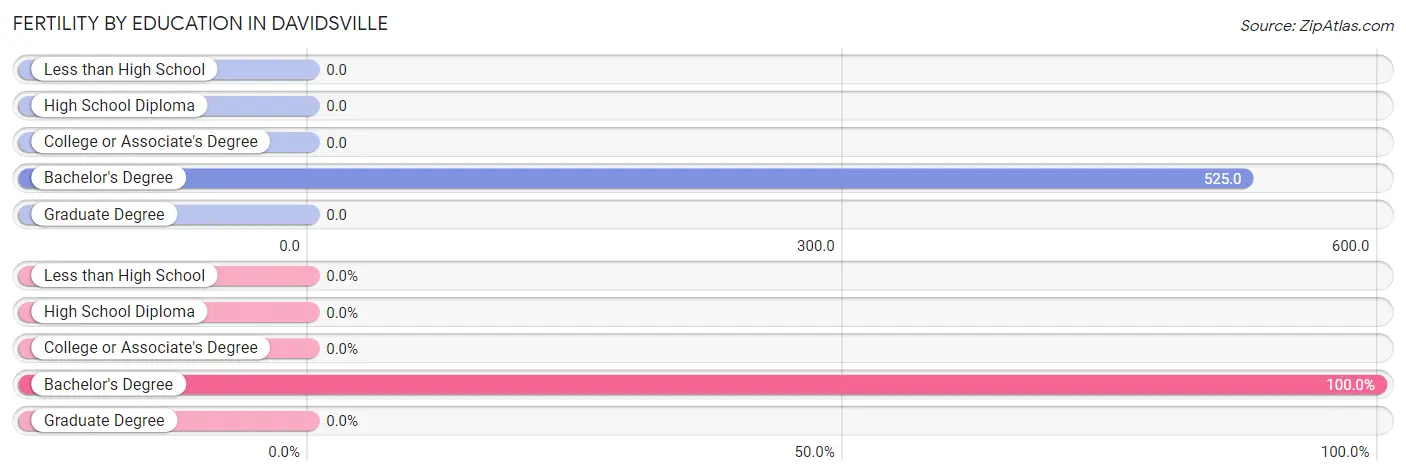
| Educational Attainment | Women with Births | Births / 1,000 Women |
| Less than High School | 0 (0.0%) | 0.0 |
| High School Diploma | 0 (0.0%) | 0.0 |
| College or Associate's Degree | 0 (0.0%) | 0.0 |
| Bachelor's Degree | 21 (100.0%) | 525.0 |
| Graduate Degree | 0 (0.0%) | 0.0 |
| Total | 21 (100.0%) | 226.0 |
Fertility by Education by Marriage Status in Davidsville
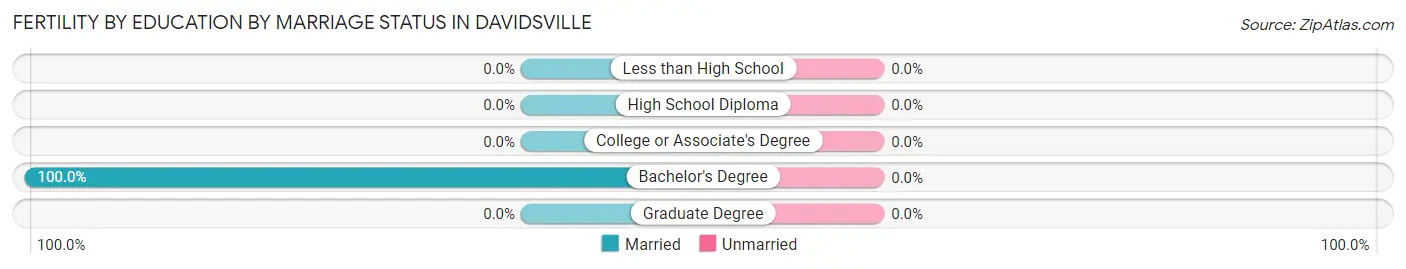
| Educational Attainment | Married | Unmarried |
| Less than High School | 0 (0.0%) | 0 (0.0%) |
| High School Diploma | 0 (0.0%) | 0 (0.0%) |
| College or Associate's Degree | 0 (0.0%) | 0 (0.0%) |
| Bachelor's Degree | 21 (100.0%) | 0 (0.0%) |
| Graduate Degree | 0 (0.0%) | 0 (0.0%) |
| Total | 21 (100.0%) | 0 (0.0%) |
Employment Characteristics in Davidsville
Employment by Class of Employer in Davidsville
Among the 302 employed individuals in Davidsville, private company employees (158 | 52.3%), not-for-profit organizations (53 | 17.5%), and local government employees (53 | 17.5%) make up the most common classes of employment.
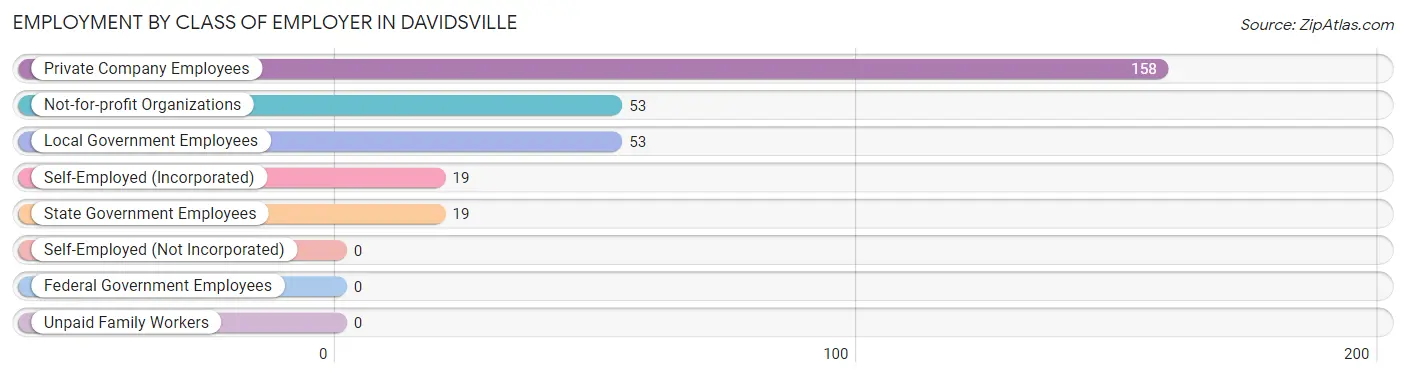
| Employer Class | # Employees | % Employees |
| Private Company Employees | 158 | 52.3% |
| Self-Employed (Incorporated) | 19 | 6.3% |
| Self-Employed (Not Incorporated) | 0 | 0.0% |
| Not-for-profit Organizations | 53 | 17.5% |
| Local Government Employees | 53 | 17.5% |
| State Government Employees | 19 | 6.3% |
| Federal Government Employees | 0 | 0.0% |
| Unpaid Family Workers | 0 | 0.0% |
| Total | 302 | 100.0% |
Employment Status by Age in Davidsville
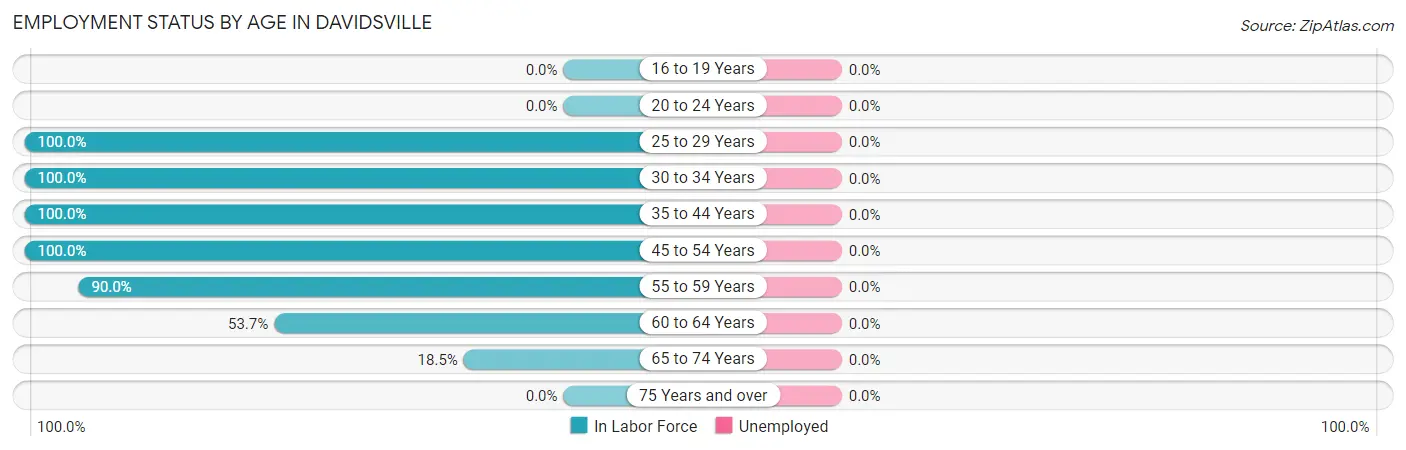
| Age Bracket | In Labor Force | Unemployed |
| 16 to 19 Years | 0 (0.0%) | 0 (0.0%) |
| 20 to 24 Years | 0 (0.0%) | 0 (0.0%) |
| 25 to 29 Years | 37 (100.0%) | 0 (0.0%) |
| 30 to 34 Years | 48 (100.0%) | 0 (0.0%) |
| 35 to 44 Years | 37 (100.0%) | 0 (0.0%) |
| 45 to 54 Years | 19 (100.0%) | 0 (0.0%) |
| 55 to 59 Years | 117 (90.0%) | 0 (0.0%) |
| 60 to 64 Years | 22 (53.7%) | 0 (0.0%) |
| 65 to 74 Years | 37 (18.5%) | 0 (0.0%) |
| 75 Years and over | 0 (0.0%) | 0 (0.0%) |
| Total | 317 (41.3%) | 0 (0.0%) |
Employment Status by Educational Attainment in Davidsville
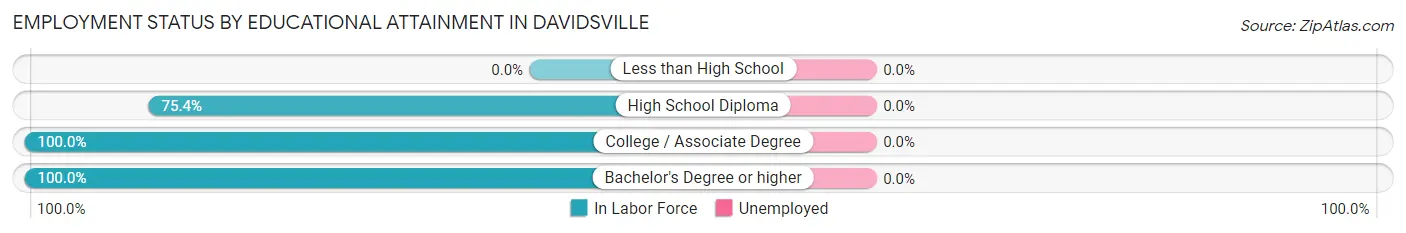
| Educational Attainment | In Labor Force | Unemployed |
| Less than High School | 0 (0.0%) | 0 (0.0%) |
| High School Diploma | 98 (75.4%) | 0 (0.0%) |
| College / Associate Degree | 41 (100.0%) | 0 (0.0%) |
| Bachelor's Degree or higher | 141 (100.0%) | 0 (0.0%) |
| Total | 280 (89.7%) | 0 (0.0%) |
Employment Occupations by Sex in Davidsville
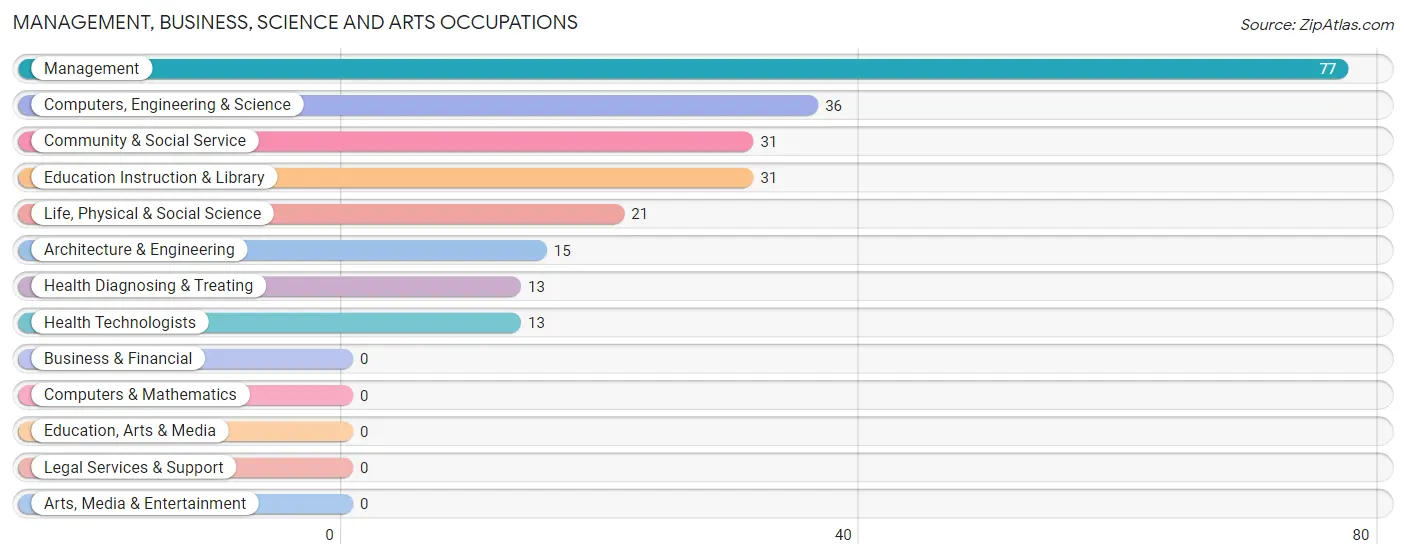
Management, Business, Science and Arts Occupations
The most common Management, Business, Science and Arts occupations in Davidsville are Management (77 | 24.3%), Computers, Engineering & Science (36 | 11.4%), Community & Social Service (31 | 9.8%), Education Instruction & Library (31 | 9.8%), and Life, Physical & Social Science (21 | 6.6%).
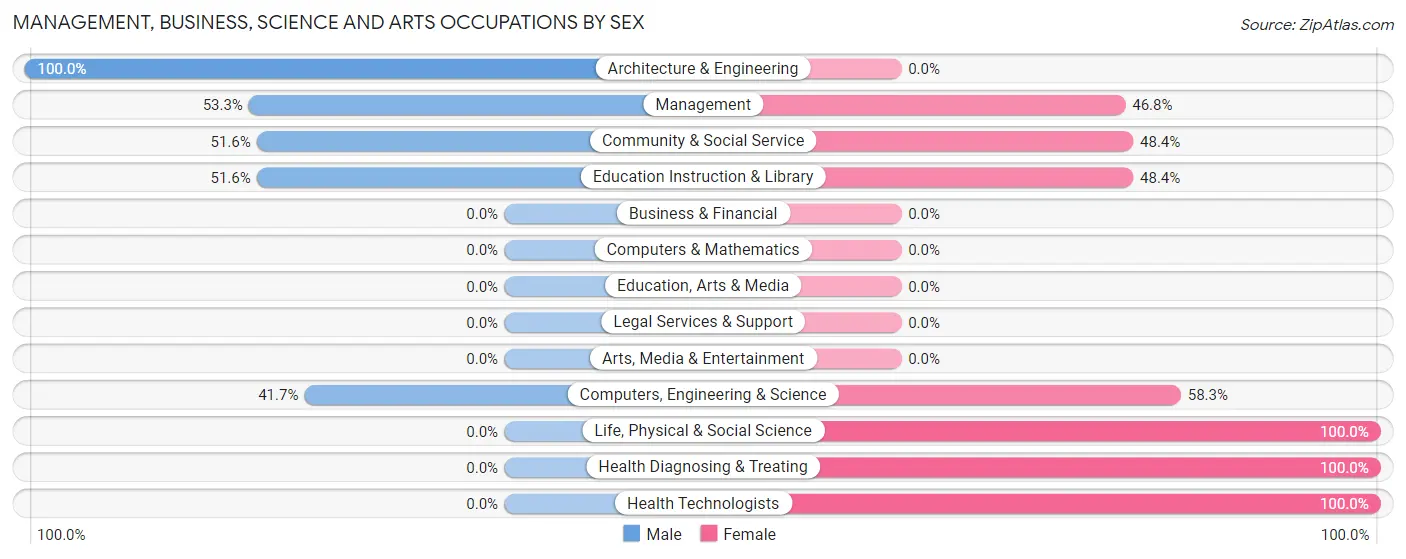
Management, Business, Science and Arts Occupations by Sex
Within the Management, Business, Science and Arts occupations in Davidsville, the most male-oriented occupations are Architecture & Engineering (100.0%), Management (53.2%), and Community & Social Service (51.6%), while the most female-oriented occupations are Life, Physical & Social Science (100.0%), Health Diagnosing & Treating (100.0%), and Health Technologists (100.0%).
| Occupation | Male | Female |
| Management | 41 (53.2%) | 36 (46.8%) |
| Business & Financial | 0 (0.0%) | 0 (0.0%) |
| Computers, Engineering & Science | 15 (41.7%) | 21 (58.3%) |
| Computers & Mathematics | 0 (0.0%) | 0 (0.0%) |
| Architecture & Engineering | 15 (100.0%) | 0 (0.0%) |
| Life, Physical & Social Science | 0 (0.0%) | 21 (100.0%) |
| Community & Social Service | 16 (51.6%) | 15 (48.4%) |
| Education, Arts & Media | 0 (0.0%) | 0 (0.0%) |
| Legal Services & Support | 0 (0.0%) | 0 (0.0%) |
| Education Instruction & Library | 16 (51.6%) | 15 (48.4%) |
| Arts, Media & Entertainment | 0 (0.0%) | 0 (0.0%) |
| Health Diagnosing & Treating | 0 (0.0%) | 13 (100.0%) |
| Health Technologists | 0 (0.0%) | 13 (100.0%) |
| Total (Category) | 72 (45.9%) | 85 (54.1%) |
| Total (Overall) | 213 (67.2%) | 104 (32.8%) |
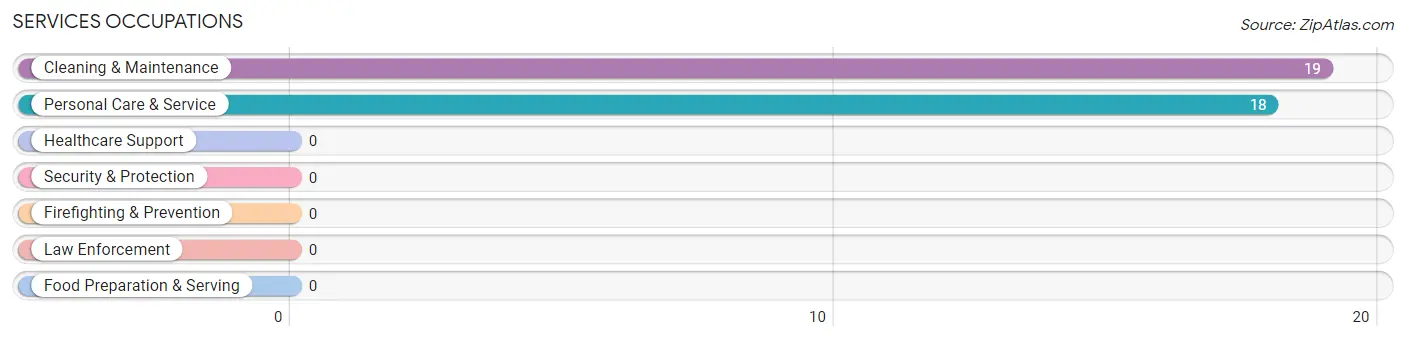
Services Occupations
The most common Services occupations in Davidsville are Cleaning & Maintenance (19 | 6.0%), and Personal Care & Service (18 | 5.7%).
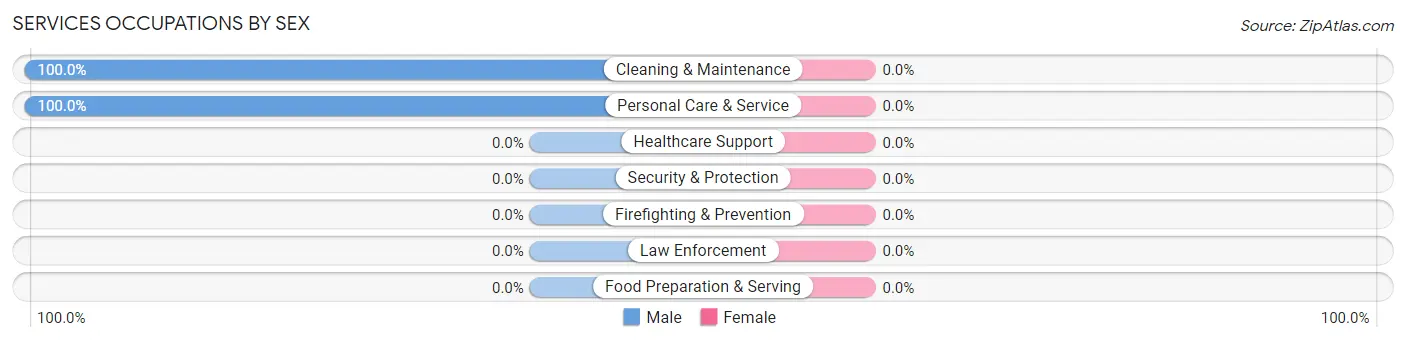
Services Occupations by Sex
| Occupation | Male | Female |
| Healthcare Support | 0 (0.0%) | 0 (0.0%) |
| Security & Protection | 0 (0.0%) | 0 (0.0%) |
| Firefighting & Prevention | 0 (0.0%) | 0 (0.0%) |
| Law Enforcement | 0 (0.0%) | 0 (0.0%) |
| Food Preparation & Serving | 0 (0.0%) | 0 (0.0%) |
| Cleaning & Maintenance | 19 (100.0%) | 0 (0.0%) |
| Personal Care & Service | 18 (100.0%) | 0 (0.0%) |
| Total (Category) | 37 (100.0%) | 0 (0.0%) |
| Total (Overall) | 213 (67.2%) | 104 (32.8%) |
Sales and Office Occupations
The most common Sales and Office occupations in Davidsville are , and Office & Administration (32 | 10.1%).
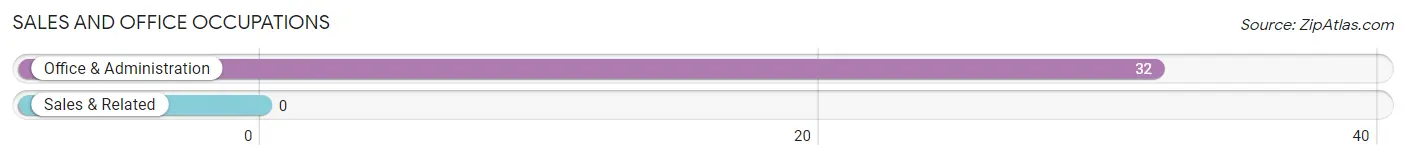
Sales and Office Occupations by Sex
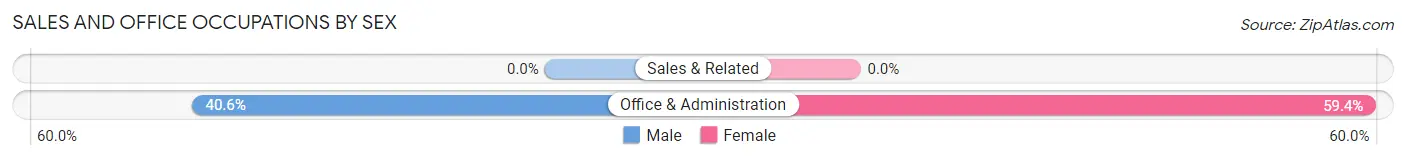
| Occupation | Male | Female |
| Sales & Related | 0 (0.0%) | 0 (0.0%) |
| Office & Administration | 13 (40.6%) | 19 (59.4%) |
| Total (Category) | 13 (40.6%) | 19 (59.4%) |
| Total (Overall) | 213 (67.2%) | 104 (32.8%) |
Natural Resources, Construction and Maintenance Occupations
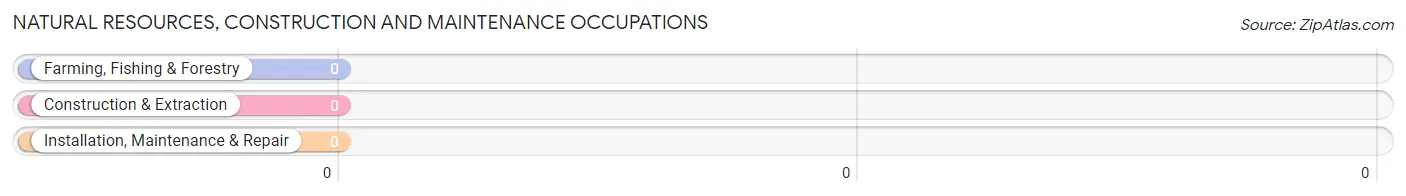
Natural Resources, Construction and Maintenance Occupations by Sex
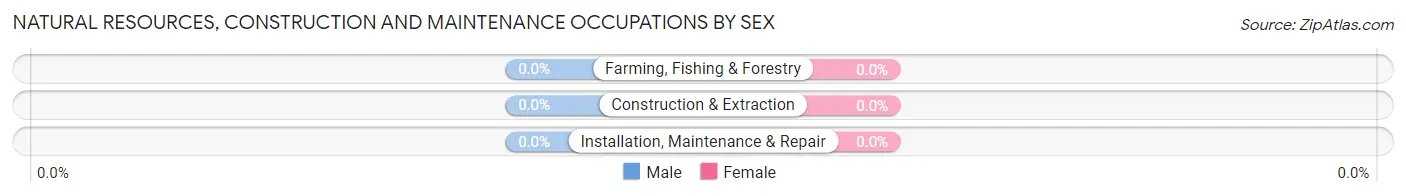
| Occupation | Male | Female |
| Farming, Fishing & Forestry | 0 (0.0%) | 0 (0.0%) |
| Construction & Extraction | 0 (0.0%) | 0 (0.0%) |
| Installation, Maintenance & Repair | 0 (0.0%) | 0 (0.0%) |
| Total (Category) | 0 (0.0%) | 0 (0.0%) |
| Total (Overall) | 213 (67.2%) | 104 (32.8%) |
Production, Transportation and Moving Occupations
The most common Production, Transportation and Moving occupations in Davidsville are Material Moving (69 | 21.8%), and Transportation (22 | 6.9%).
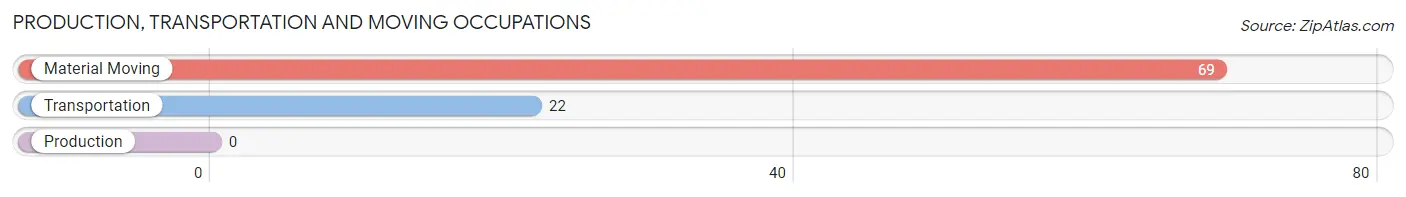
Production, Transportation and Moving Occupations by Sex
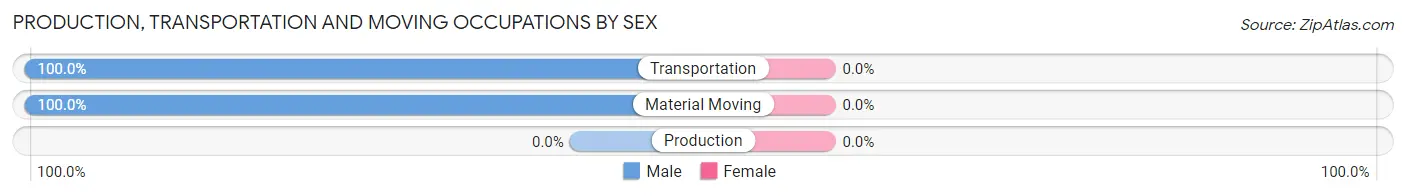
| Occupation | Male | Female |
| Production | 0 (0.0%) | 0 (0.0%) |
| Transportation | 22 (100.0%) | 0 (0.0%) |
| Material Moving | 69 (100.0%) | 0 (0.0%) |
| Total (Category) | 91 (100.0%) | 0 (0.0%) |
| Total (Overall) | 213 (67.2%) | 104 (32.8%) |
Employment Industries by Sex in Davidsville
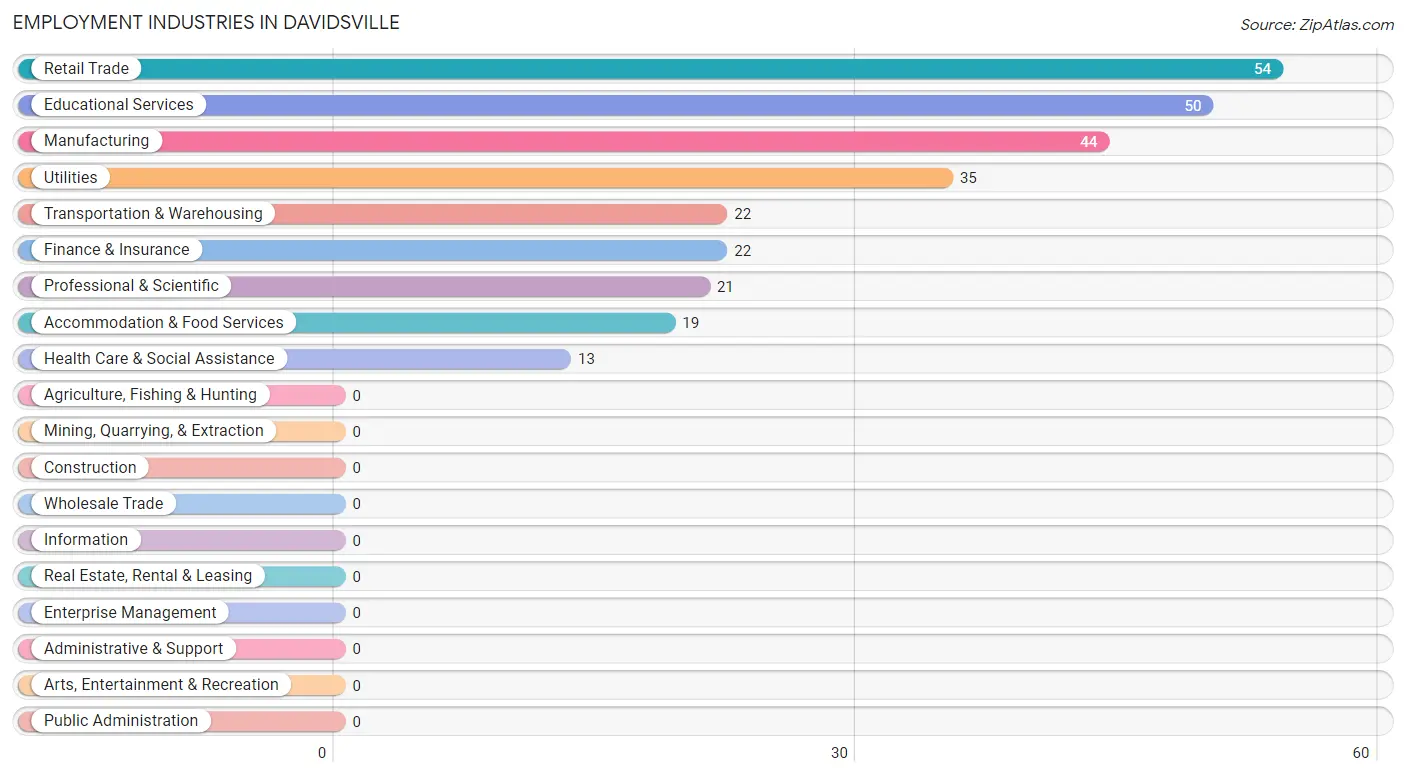
Employment Industries in Davidsville
The major employment industries in Davidsville include Retail Trade (54 | 17.0%), Educational Services (50 | 15.8%), Manufacturing (44 | 13.9%), Utilities (35 | 11.0%), and Transportation & Warehousing (22 | 6.9%).
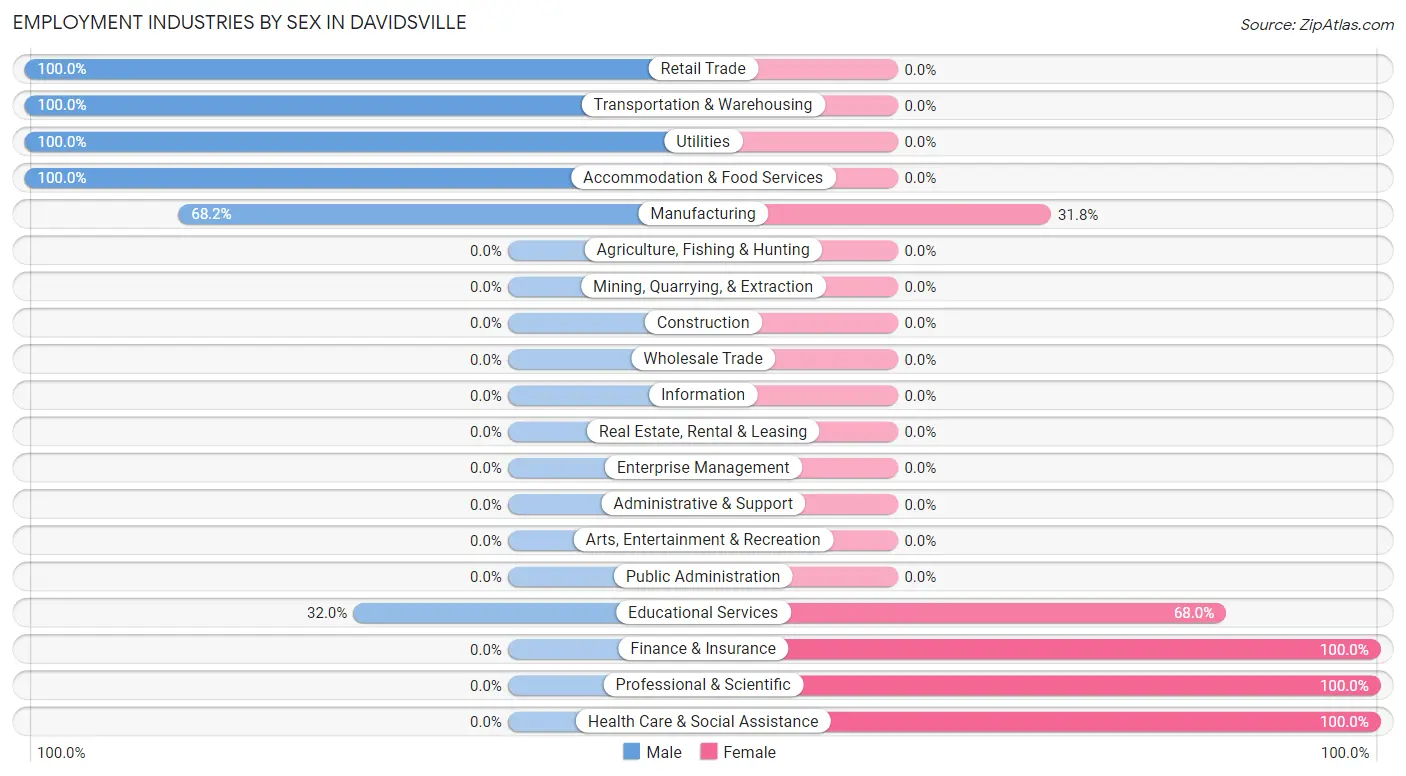
Employment Industries by Sex in Davidsville
The Davidsville industries that see more men than women are Retail Trade (100.0%), Transportation & Warehousing (100.0%), and Utilities (100.0%), whereas the industries that tend to have a higher number of women are Finance & Insurance (100.0%), Professional & Scientific (100.0%), and Health Care & Social Assistance (100.0%).
| Industry | Male | Female |
| Agriculture, Fishing & Hunting | 0 (0.0%) | 0 (0.0%) |
| Mining, Quarrying, & Extraction | 0 (0.0%) | 0 (0.0%) |
| Construction | 0 (0.0%) | 0 (0.0%) |
| Manufacturing | 30 (68.2%) | 14 (31.8%) |
| Wholesale Trade | 0 (0.0%) | 0 (0.0%) |
| Retail Trade | 54 (100.0%) | 0 (0.0%) |
| Transportation & Warehousing | 22 (100.0%) | 0 (0.0%) |
| Utilities | 35 (100.0%) | 0 (0.0%) |
| Information | 0 (0.0%) | 0 (0.0%) |
| Finance & Insurance | 0 (0.0%) | 22 (100.0%) |
| Real Estate, Rental & Leasing | 0 (0.0%) | 0 (0.0%) |
| Professional & Scientific | 0 (0.0%) | 21 (100.0%) |
| Enterprise Management | 0 (0.0%) | 0 (0.0%) |
| Administrative & Support | 0 (0.0%) | 0 (0.0%) |
| Educational Services | 16 (32.0%) | 34 (68.0%) |
| Health Care & Social Assistance | 0 (0.0%) | 13 (100.0%) |
| Arts, Entertainment & Recreation | 0 (0.0%) | 0 (0.0%) |
| Accommodation & Food Services | 19 (100.0%) | 0 (0.0%) |
| Public Administration | 0 (0.0%) | 0 (0.0%) |
| Total | 213 (67.2%) | 104 (32.8%) |
Education in Davidsville
School Enrollment in Davidsville
The most common levels of schooling among the 57 students in Davidsville are high school (26 | 45.6%), kindergarten (17 | 29.8%), and nursery / preschool (14 | 24.6%).
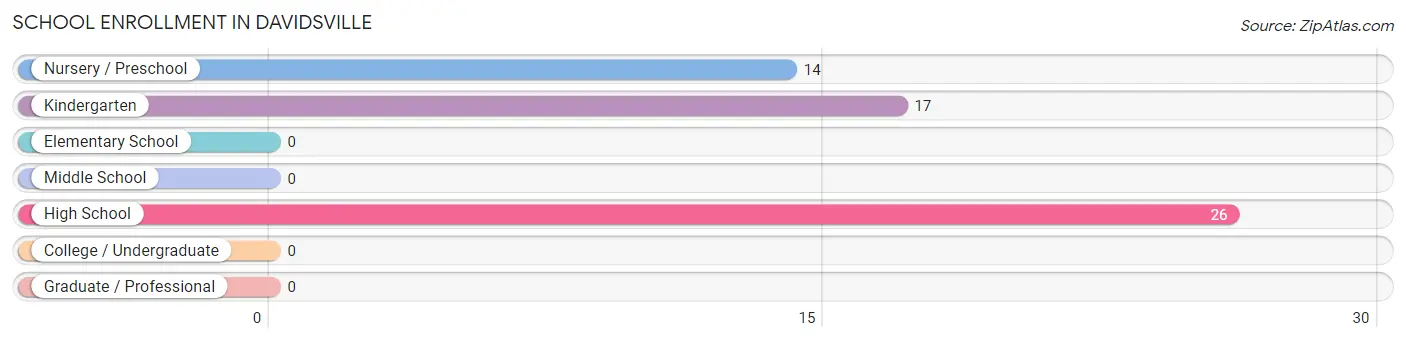
| School Level | # Students | % Students |
| Nursery / Preschool | 14 | 24.6% |
| Kindergarten | 17 | 29.8% |
| Elementary School | 0 | 0.0% |
| Middle School | 0 | 0.0% |
| High School | 26 | 45.6% |
| College / Undergraduate | 0 | 0.0% |
| Graduate / Professional | 0 | 0.0% |
| Total | 57 | 100.0% |
School Enrollment by Age by Funding Source in Davidsville
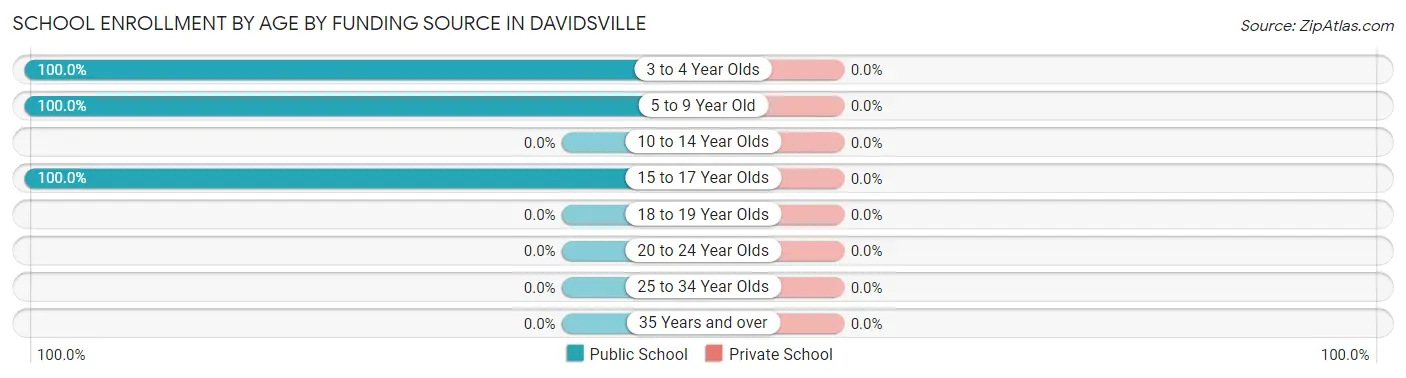
| Age Bracket | Public School | Private School |
| 3 to 4 Year Olds | 14 (100.0%) | 0 (0.0%) |
| 5 to 9 Year Old | 17 (100.0%) | 0 (0.0%) |
| 10 to 14 Year Olds | 0 (0.0%) | 0 (0.0%) |
| 15 to 17 Year Olds | 26 (100.0%) | 0 (0.0%) |
| 18 to 19 Year Olds | 0 (0.0%) | 0 (0.0%) |
| 20 to 24 Year Olds | 0 (0.0%) | 0 (0.0%) |
| 25 to 34 Year Olds | 0 (0.0%) | 0 (0.0%) |
| 35 Years and over | 0 (0.0%) | 0 (0.0%) |
| Total | 57 (100.0%) | 0 (0.0%) |
Educational Attainment by Field of Study in Davidsville
Education (70 | 29.7%), engineering (51 | 21.6%), science & technology (38 | 16.1%), business (37 | 15.7%), and arts & humanities (21 | 8.9%) are the most common fields of study among 236 individuals in Davidsville who have obtained a bachelor's degree or higher.
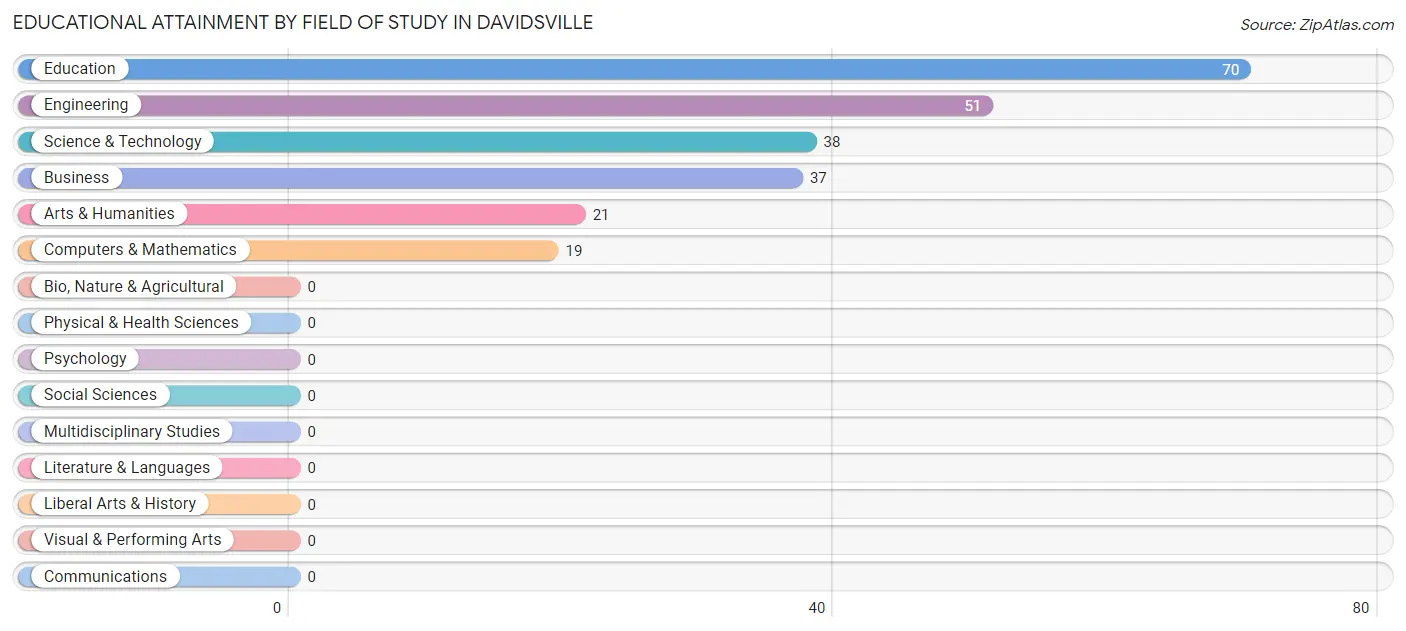
| Field of Study | # Graduates | % Graduates |
| Computers & Mathematics | 19 | 8.1% |
| Bio, Nature & Agricultural | 0 | 0.0% |
| Physical & Health Sciences | 0 | 0.0% |
| Psychology | 0 | 0.0% |
| Social Sciences | 0 | 0.0% |
| Engineering | 51 | 21.6% |
| Multidisciplinary Studies | 0 | 0.0% |
| Science & Technology | 38 | 16.1% |
| Business | 37 | 15.7% |
| Education | 70 | 29.7% |
| Literature & Languages | 0 | 0.0% |
| Liberal Arts & History | 0 | 0.0% |
| Visual & Performing Arts | 0 | 0.0% |
| Communications | 0 | 0.0% |
| Arts & Humanities | 21 | 8.9% |
| Total | 236 | 100.0% |
Transportation & Commute in Davidsville
Vehicle Availability by Sex in Davidsville
The most prevalent vehicle ownership categories in Davidsville are males with 2 vehicles (144, accounting for 72.7%) and females with 2 vehicles (72, making up 138.5%).
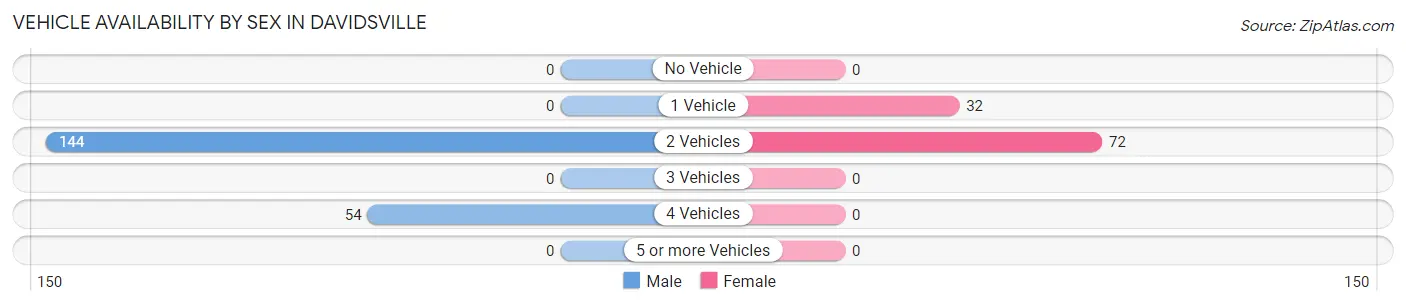
| Vehicles Available | Male | Female |
| No Vehicle | 0 (0.0%) | 0 (0.0%) |
| 1 Vehicle | 0 (0.0%) | 32 (30.8%) |
| 2 Vehicles | 144 (72.7%) | 72 (69.2%) |
| 3 Vehicles | 0 (0.0%) | 0 (0.0%) |
| 4 Vehicles | 54 (27.3%) | 0 (0.0%) |
| 5 or more Vehicles | 0 (0.0%) | 0 (0.0%) |
| Total | 198 (100.0%) | 104 (100.0%) |
Commute Time in Davidsville
The most frequently occuring commute durations in Davidsville are 15 to 19 minutes (88 commuters, 29.1%), 20 to 24 minutes (59 commuters, 19.5%), and 10 to 14 minutes (57 commuters, 18.9%).
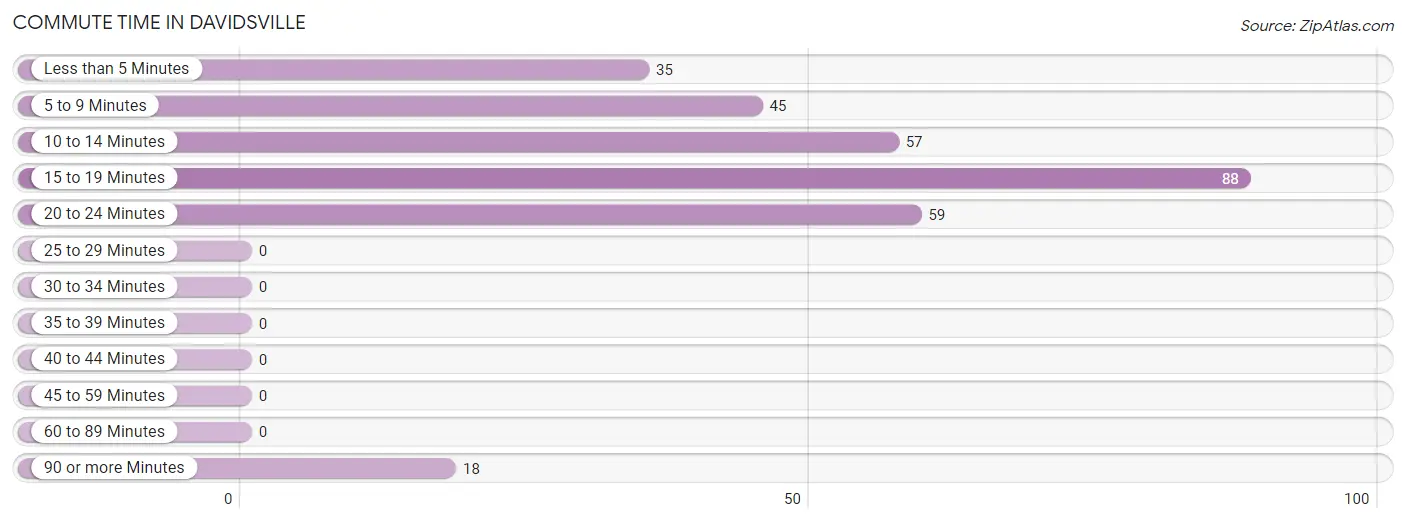
| Commute Time | # Commuters | % Commuters |
| Less than 5 Minutes | 35 | 11.6% |
| 5 to 9 Minutes | 45 | 14.9% |
| 10 to 14 Minutes | 57 | 18.9% |
| 15 to 19 Minutes | 88 | 29.1% |
| 20 to 24 Minutes | 59 | 19.5% |
| 25 to 29 Minutes | 0 | 0.0% |
| 30 to 34 Minutes | 0 | 0.0% |
| 35 to 39 Minutes | 0 | 0.0% |
| 40 to 44 Minutes | 0 | 0.0% |
| 45 to 59 Minutes | 0 | 0.0% |
| 60 to 89 Minutes | 0 | 0.0% |
| 90 or more Minutes | 18 | 6.0% |
Commute Time by Sex in Davidsville
The most common commute times in Davidsville are 15 to 19 minutes (67 commuters, 33.8%) for males and 20 to 24 minutes (37 commuters, 35.6%) for females.
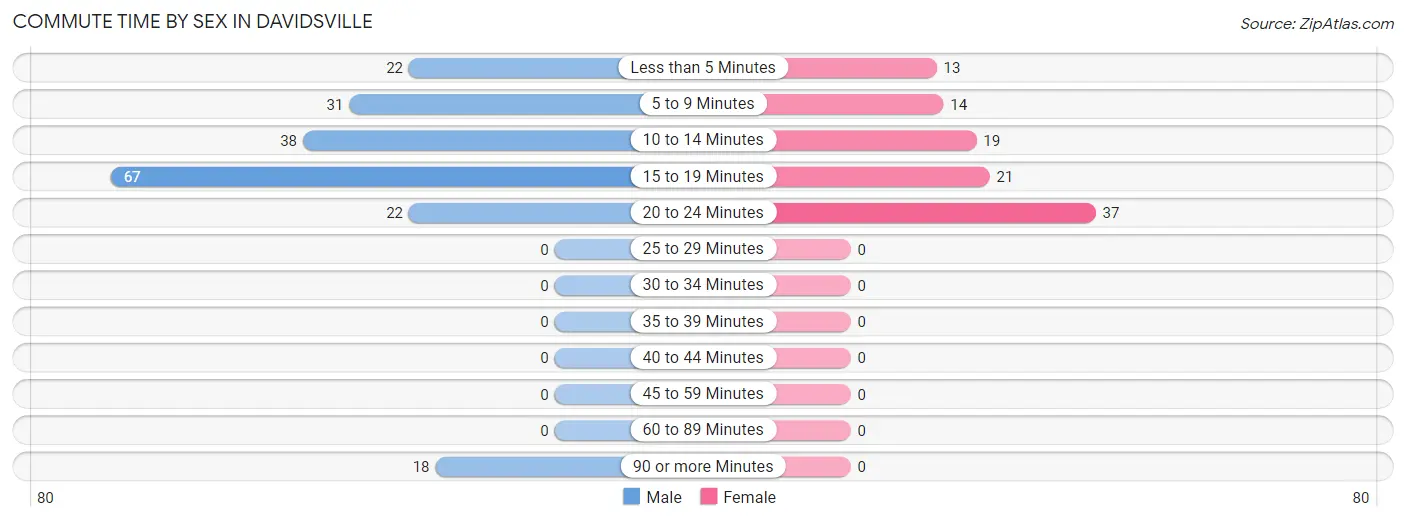
| Commute Time | Male | Female |
| Less than 5 Minutes | 22 (11.1%) | 13 (12.5%) |
| 5 to 9 Minutes | 31 (15.7%) | 14 (13.5%) |
| 10 to 14 Minutes | 38 (19.2%) | 19 (18.3%) |
| 15 to 19 Minutes | 67 (33.8%) | 21 (20.2%) |
| 20 to 24 Minutes | 22 (11.1%) | 37 (35.6%) |
| 25 to 29 Minutes | 0 (0.0%) | 0 (0.0%) |
| 30 to 34 Minutes | 0 (0.0%) | 0 (0.0%) |
| 35 to 39 Minutes | 0 (0.0%) | 0 (0.0%) |
| 40 to 44 Minutes | 0 (0.0%) | 0 (0.0%) |
| 45 to 59 Minutes | 0 (0.0%) | 0 (0.0%) |
| 60 to 89 Minutes | 0 (0.0%) | 0 (0.0%) |
| 90 or more Minutes | 18 (9.1%) | 0 (0.0%) |
Time of Departure to Work by Sex in Davidsville
The most frequent times of departure to work in Davidsville are 7:30 AM to 7:59 AM (91, 46.0%) for males and 7:30 AM to 7:59 AM (49, 47.1%) for females.
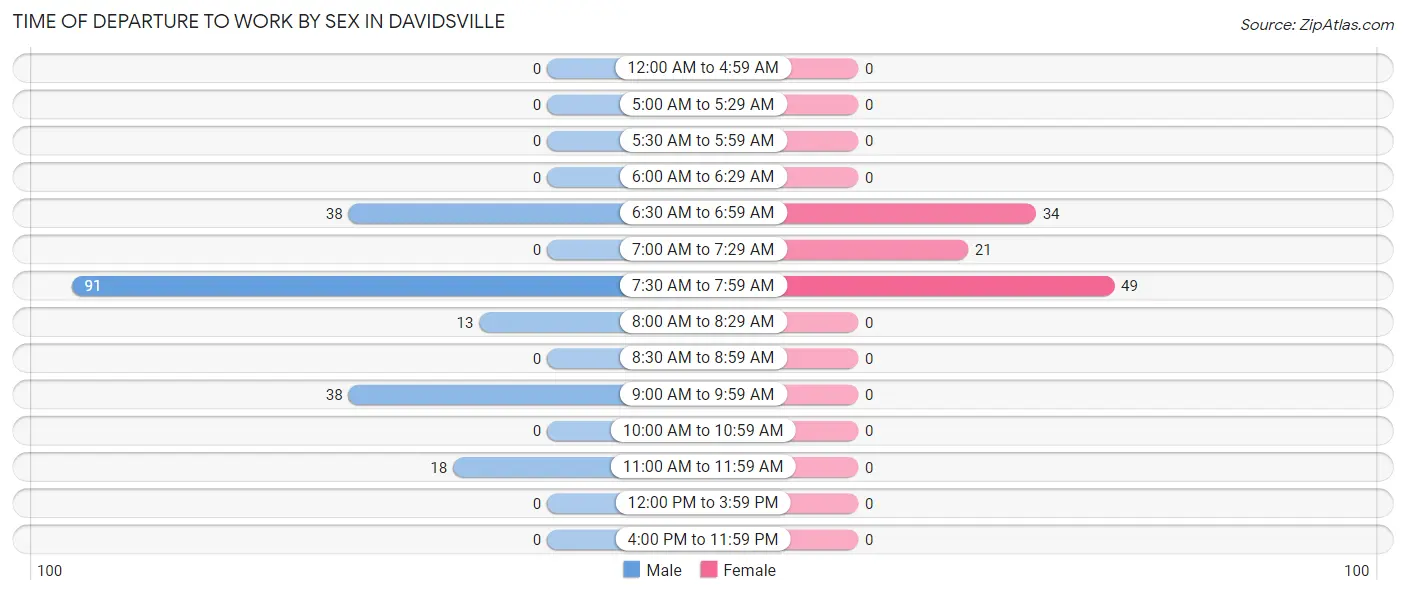
| Time of Departure | Male | Female |
| 12:00 AM to 4:59 AM | 0 (0.0%) | 0 (0.0%) |
| 5:00 AM to 5:29 AM | 0 (0.0%) | 0 (0.0%) |
| 5:30 AM to 5:59 AM | 0 (0.0%) | 0 (0.0%) |
| 6:00 AM to 6:29 AM | 0 (0.0%) | 0 (0.0%) |
| 6:30 AM to 6:59 AM | 38 (19.2%) | 34 (32.7%) |
| 7:00 AM to 7:29 AM | 0 (0.0%) | 21 (20.2%) |
| 7:30 AM to 7:59 AM | 91 (46.0%) | 49 (47.1%) |
| 8:00 AM to 8:29 AM | 13 (6.6%) | 0 (0.0%) |
| 8:30 AM to 8:59 AM | 0 (0.0%) | 0 (0.0%) |
| 9:00 AM to 9:59 AM | 38 (19.2%) | 0 (0.0%) |
| 10:00 AM to 10:59 AM | 0 (0.0%) | 0 (0.0%) |
| 11:00 AM to 11:59 AM | 18 (9.1%) | 0 (0.0%) |
| 12:00 PM to 3:59 PM | 0 (0.0%) | 0 (0.0%) |
| 4:00 PM to 11:59 PM | 0 (0.0%) | 0 (0.0%) |
| Total | 198 (100.0%) | 104 (100.0%) |
Housing Occupancy in Davidsville
Occupancy by Ownership in Davidsville
Of the total 455 dwellings in Davidsville, owner-occupied units account for 455 (100.0%), while renter-occupied units make up 0 (0.0%).
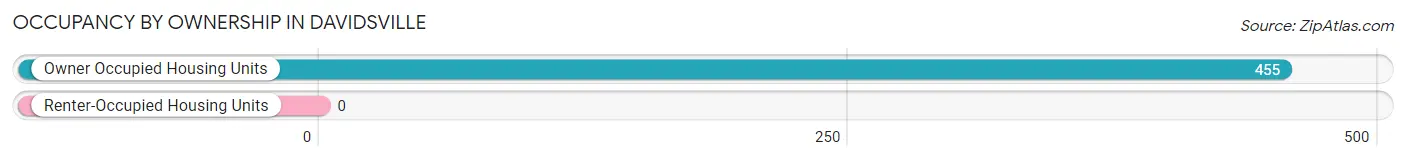
| Occupancy | # Housing Units | % Housing Units |
| Owner Occupied Housing Units | 455 | 100.0% |
| Renter-Occupied Housing Units | 0 | 0.0% |
| Total Occupied Housing Units | 455 | 100.0% |
Occupancy by Household Size in Davidsville
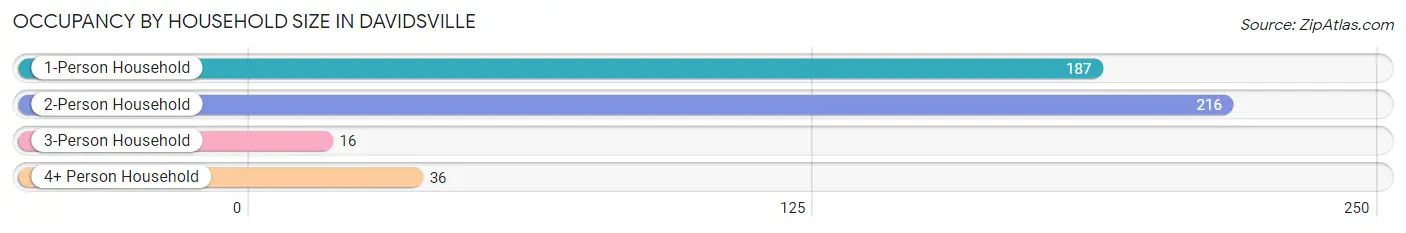
| Household Size | # Housing Units | % Housing Units |
| 1-Person Household | 187 | 41.1% |
| 2-Person Household | 216 | 47.5% |
| 3-Person Household | 16 | 3.5% |
| 4+ Person Household | 36 | 7.9% |
| Total Housing Units | 455 | 100.0% |
Occupancy by Ownership by Household Size in Davidsville
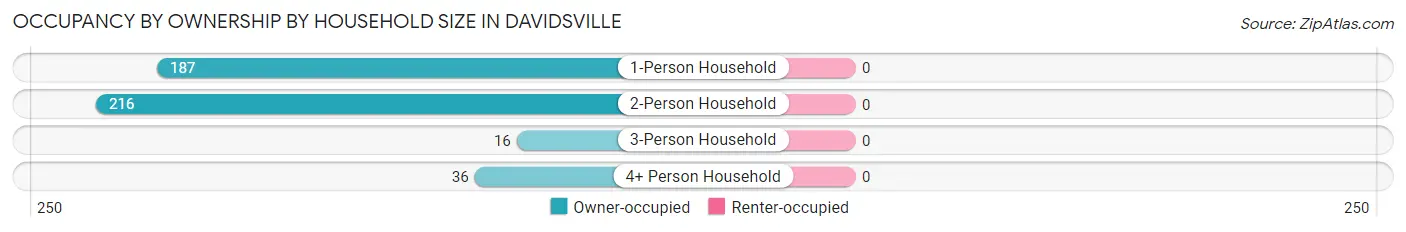
| Household Size | Owner-occupied | Renter-occupied |
| 1-Person Household | 187 (100.0%) | 0 (0.0%) |
| 2-Person Household | 216 (100.0%) | 0 (0.0%) |
| 3-Person Household | 16 (100.0%) | 0 (0.0%) |
| 4+ Person Household | 36 (100.0%) | 0 (0.0%) |
| Total Housing Units | 455 (100.0%) | 0 (0.0%) |
Occupancy by Educational Attainment in Davidsville
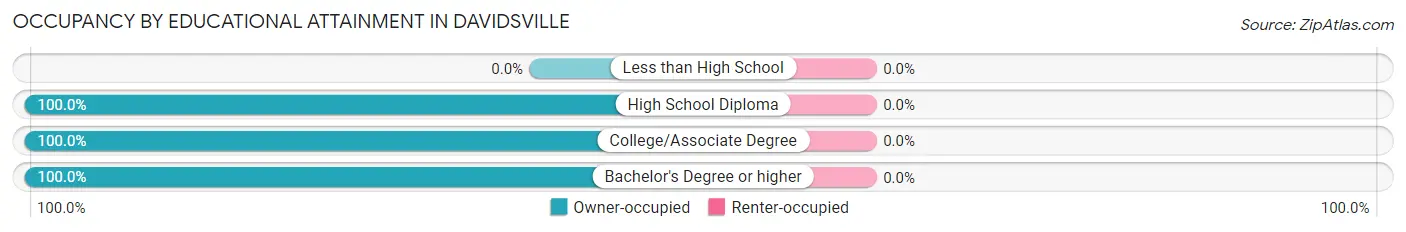
| Household Size | Owner-occupied | Renter-occupied |
| Less than High School | 0 (0.0%) | 0 (0.0%) |
| High School Diploma | 255 (100.0%) | 0 (0.0%) |
| College/Associate Degree | 71 (100.0%) | 0 (0.0%) |
| Bachelor's Degree or higher | 129 (100.0%) | 0 (0.0%) |
Occupancy by Age of Householder in Davidsville
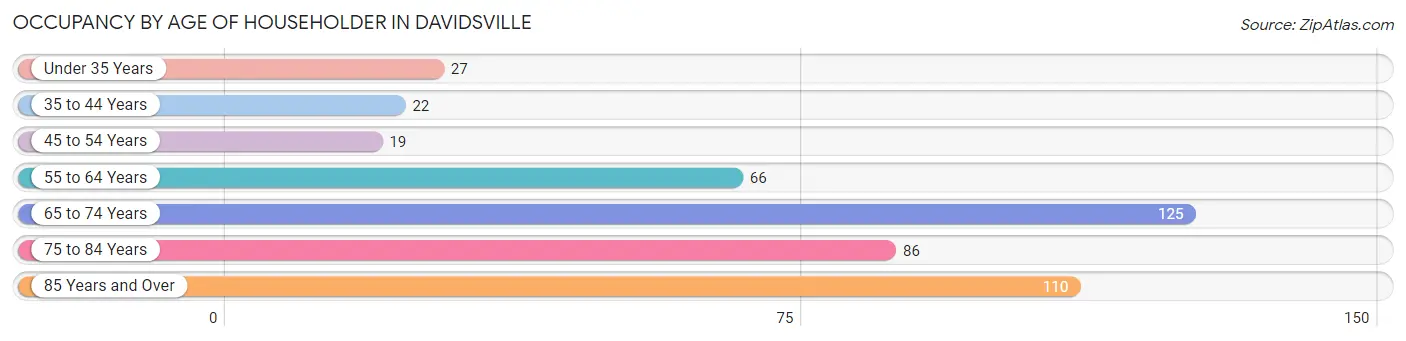
| Age Bracket | # Households | % Households |
| Under 35 Years | 27 | 5.9% |
| 35 to 44 Years | 22 | 4.8% |
| 45 to 54 Years | 19 | 4.2% |
| 55 to 64 Years | 66 | 14.5% |
| 65 to 74 Years | 125 | 27.5% |
| 75 to 84 Years | 86 | 18.9% |
| 85 Years and Over | 110 | 24.2% |
| Total | 455 | 100.0% |
Housing Finances in Davidsville
Median Income by Occupancy in Davidsville
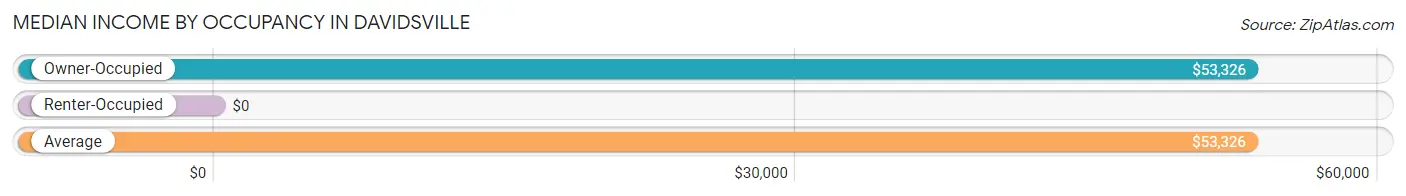
| Occupancy Type | # Households | Median Income |
| Owner-Occupied | 455 (100.0%) | $53,326 |
| Renter-Occupied | 0 (0.0%) | $0 |
| Average | 455 (100.0%) | $53,326 |
Occupancy by Householder Income Bracket in Davidsville
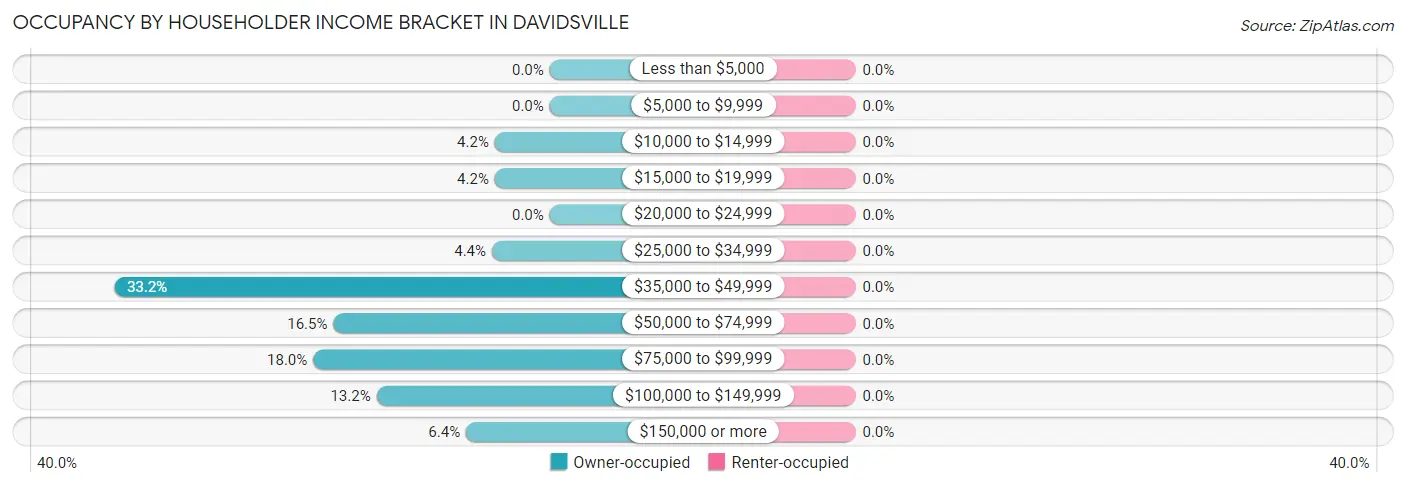
| Income Bracket | Owner-occupied | Renter-occupied |
| Less than $5,000 | 0 (0.0%) | 0 (0.0%) |
| $5,000 to $9,999 | 0 (0.0%) | 0 (0.0%) |
| $10,000 to $14,999 | 19 (4.2%) | 0 (0.0%) |
| $15,000 to $19,999 | 19 (4.2%) | 0 (0.0%) |
| $20,000 to $24,999 | 0 (0.0%) | 0 (0.0%) |
| $25,000 to $34,999 | 20 (4.4%) | 0 (0.0%) |
| $35,000 to $49,999 | 151 (33.2%) | 0 (0.0%) |
| $50,000 to $74,999 | 75 (16.5%) | 0 (0.0%) |
| $75,000 to $99,999 | 82 (18.0%) | 0 (0.0%) |
| $100,000 to $149,999 | 60 (13.2%) | 0 (0.0%) |
| $150,000 or more | 29 (6.4%) | 0 (0.0%) |
| Total | 455 (100.0%) | 0 (0.0%) |
Monthly Housing Cost Tiers in Davidsville
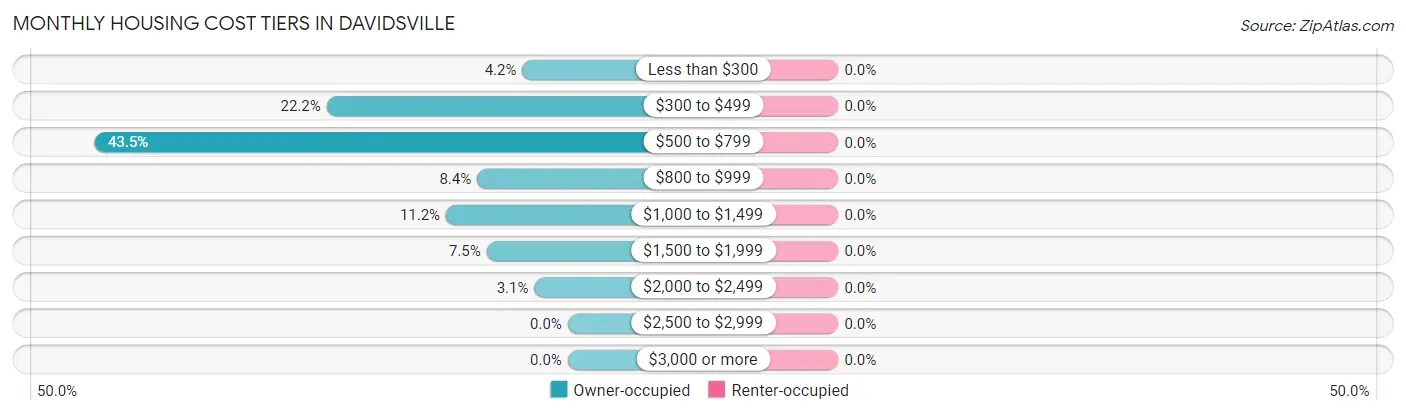
| Monthly Cost | Owner-occupied | Renter-occupied |
| Less than $300 | 19 (4.2%) | 0 (0.0%) |
| $300 to $499 | 101 (22.2%) | 0 (0.0%) |
| $500 to $799 | 198 (43.5%) | 0 (0.0%) |
| $800 to $999 | 38 (8.4%) | 0 (0.0%) |
| $1,000 to $1,499 | 51 (11.2%) | 0 (0.0%) |
| $1,500 to $1,999 | 34 (7.5%) | 0 (0.0%) |
| $2,000 to $2,499 | 14 (3.1%) | 0 (0.0%) |
| $2,500 to $2,999 | 0 (0.0%) | 0 (0.0%) |
| $3,000 or more | 0 (0.0%) | 0 (0.0%) |
| Total | 455 (100.0%) | 0 (0.0%) |
Physical Housing Characteristics in Davidsville
Housing Structures in Davidsville
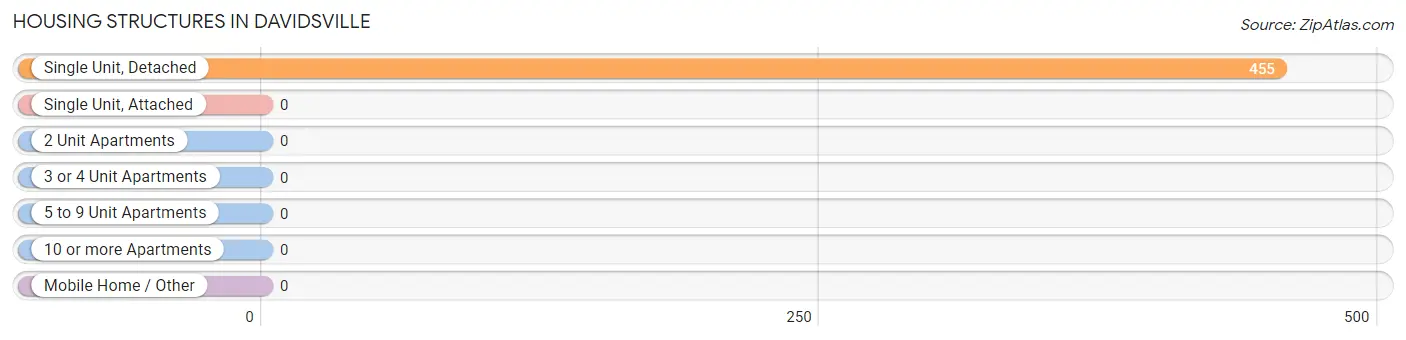
| Structure Type | # Housing Units | % Housing Units |
| Single Unit, Detached | 455 | 100.0% |
| Single Unit, Attached | 0 | 0.0% |
| 2 Unit Apartments | 0 | 0.0% |
| 3 or 4 Unit Apartments | 0 | 0.0% |
| 5 to 9 Unit Apartments | 0 | 0.0% |
| 10 or more Apartments | 0 | 0.0% |
| Mobile Home / Other | 0 | 0.0% |
| Total | 455 | 100.0% |
Housing Structures by Occupancy in Davidsville
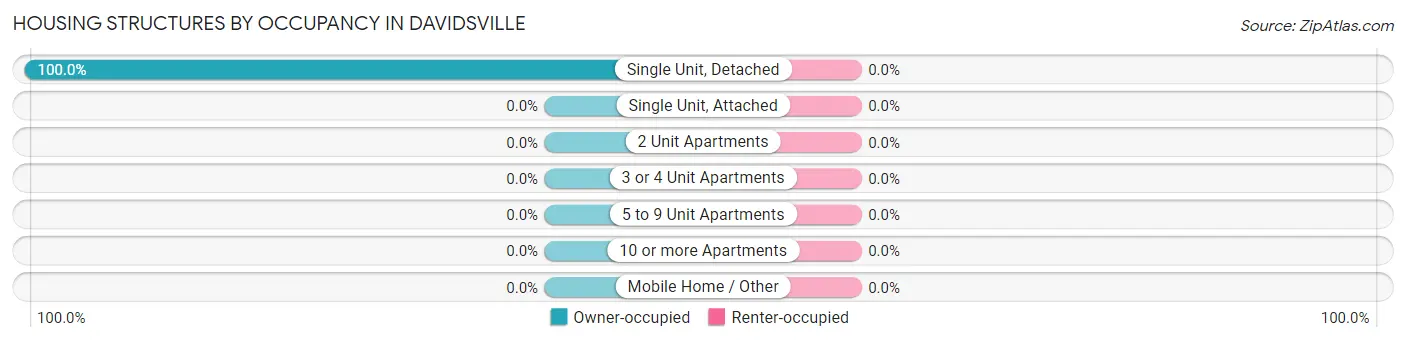
| Structure Type | Owner-occupied | Renter-occupied |
| Single Unit, Detached | 455 (100.0%) | 0 (0.0%) |
| Single Unit, Attached | 0 (0.0%) | 0 (0.0%) |
| 2 Unit Apartments | 0 (0.0%) | 0 (0.0%) |
| 3 or 4 Unit Apartments | 0 (0.0%) | 0 (0.0%) |
| 5 to 9 Unit Apartments | 0 (0.0%) | 0 (0.0%) |
| 10 or more Apartments | 0 (0.0%) | 0 (0.0%) |
| Mobile Home / Other | 0 (0.0%) | 0 (0.0%) |
| Total | 455 (100.0%) | 0 (0.0%) |
Housing Structures by Number of Rooms in Davidsville
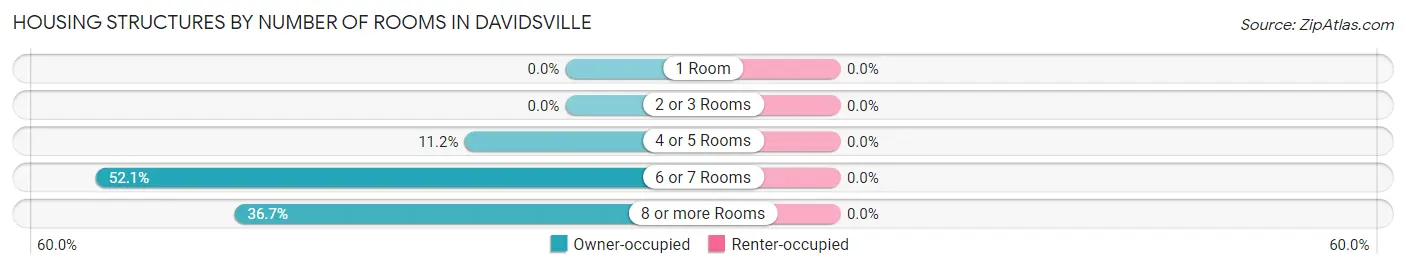
| Number of Rooms | Owner-occupied | Renter-occupied |
| 1 Room | 0 (0.0%) | 0 (0.0%) |
| 2 or 3 Rooms | 0 (0.0%) | 0 (0.0%) |
| 4 or 5 Rooms | 51 (11.2%) | 0 (0.0%) |
| 6 or 7 Rooms | 237 (52.1%) | 0 (0.0%) |
| 8 or more Rooms | 167 (36.7%) | 0 (0.0%) |
| Total | 455 (100.0%) | 0 (0.0%) |
Housing Structure by Heating Type in Davidsville
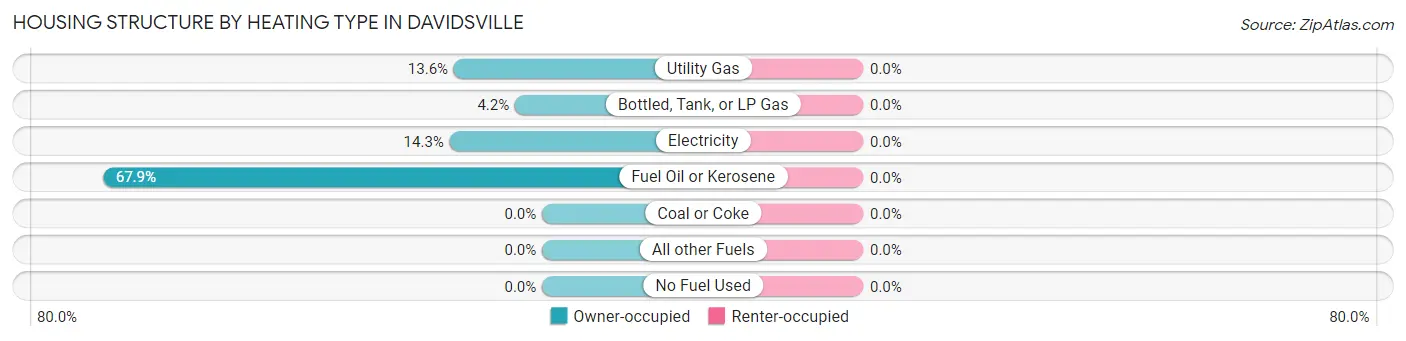
| Heating Type | Owner-occupied | Renter-occupied |
| Utility Gas | 62 (13.6%) | 0 (0.0%) |
| Bottled, Tank, or LP Gas | 19 (4.2%) | 0 (0.0%) |
| Electricity | 65 (14.3%) | 0 (0.0%) |
| Fuel Oil or Kerosene | 309 (67.9%) | 0 (0.0%) |
| Coal or Coke | 0 (0.0%) | 0 (0.0%) |
| All other Fuels | 0 (0.0%) | 0 (0.0%) |
| No Fuel Used | 0 (0.0%) | 0 (0.0%) |
| Total | 455 (100.0%) | 0 (0.0%) |
Household Vehicle Usage in Davidsville
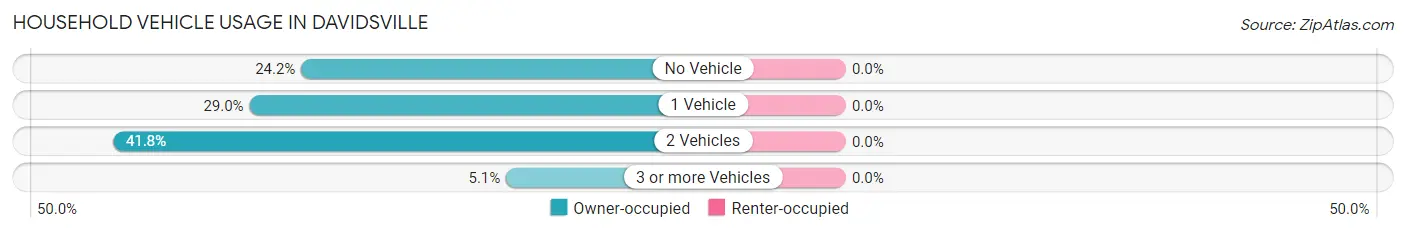
| Vehicles per Household | Owner-occupied | Renter-occupied |
| No Vehicle | 110 (24.2%) | 0 (0.0%) |
| 1 Vehicle | 132 (29.0%) | 0 (0.0%) |
| 2 Vehicles | 190 (41.8%) | 0 (0.0%) |
| 3 or more Vehicles | 23 (5.1%) | 0 (0.0%) |
| Total | 455 (100.0%) | 0 (0.0%) |
Real Estate & Mortgages in Davidsville
Real Estate and Mortgage Overview in Davidsville
| Characteristic | Without Mortgage | With Mortgage |
| Housing Units | 318 | 137 |
| Median Property Value | $215,900 | $171,800 |
| Median Household Income | $41,768 | $29 |
| Monthly Housing Costs | $704 | $0 |
| Real Estate Taxes | $3,099 | $0 |
Property Value by Mortgage Status in Davidsville
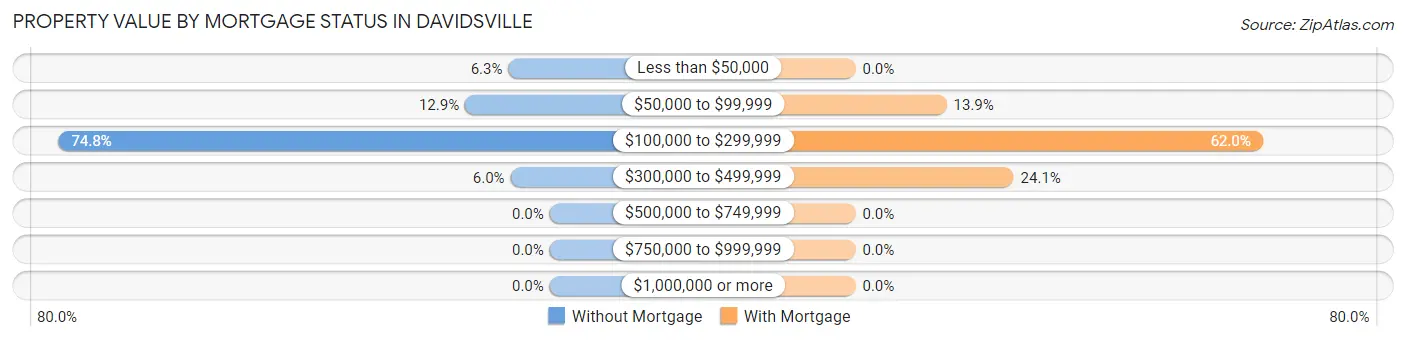
| Property Value | Without Mortgage | With Mortgage |
| Less than $50,000 | 20 (6.3%) | 0 (0.0%) |
| $50,000 to $99,999 | 41 (12.9%) | 19 (13.9%) |
| $100,000 to $299,999 | 238 (74.8%) | 85 (62.0%) |
| $300,000 to $499,999 | 19 (6.0%) | 33 (24.1%) |
| $500,000 to $749,999 | 0 (0.0%) | 0 (0.0%) |
| $750,000 to $999,999 | 0 (0.0%) | 0 (0.0%) |
| $1,000,000 or more | 0 (0.0%) | 0 (0.0%) |
| Total | 318 (100.0%) | 137 (100.0%) |
Household Income by Mortgage Status in Davidsville
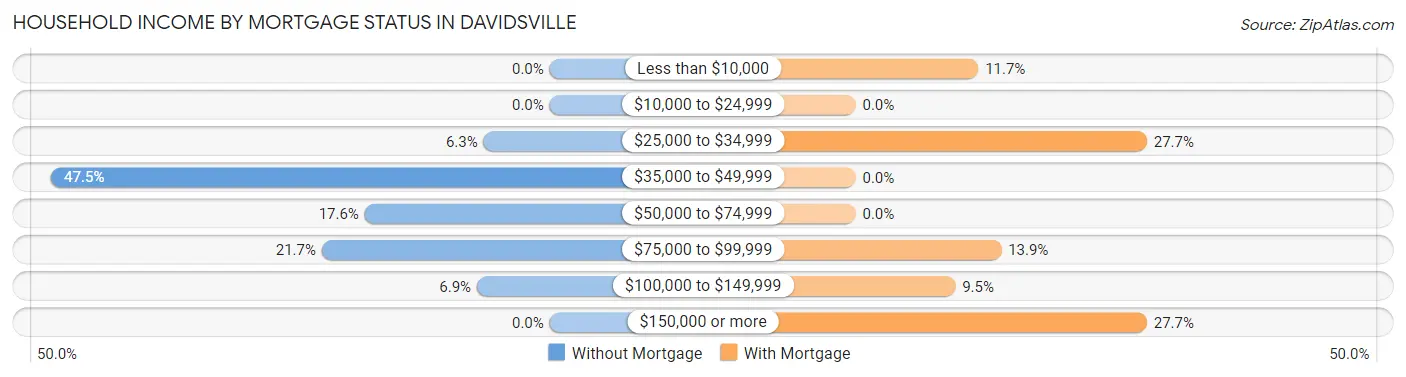
| Household Income | Without Mortgage | With Mortgage |
| Less than $10,000 | 0 (0.0%) | 16 (11.7%) |
| $10,000 to $24,999 | 0 (0.0%) | 0 (0.0%) |
| $25,000 to $34,999 | 20 (6.3%) | 38 (27.7%) |
| $35,000 to $49,999 | 151 (47.5%) | 0 (0.0%) |
| $50,000 to $74,999 | 56 (17.6%) | 0 (0.0%) |
| $75,000 to $99,999 | 69 (21.7%) | 19 (13.9%) |
| $100,000 to $149,999 | 22 (6.9%) | 13 (9.5%) |
| $150,000 or more | 0 (0.0%) | 38 (27.7%) |
| Total | 318 (100.0%) | 137 (100.0%) |
Property Value to Household Income Ratio in Davidsville
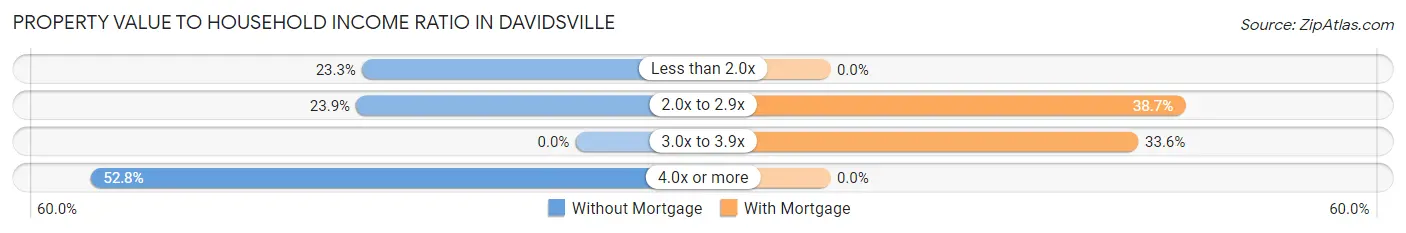
| Value-to-Income Ratio | Without Mortgage | With Mortgage |
| Less than 2.0x | 74 (23.3%) | 0 (0.0%) |
| 2.0x to 2.9x | 76 (23.9%) | 53 (38.7%) |
| 3.0x to 3.9x | 0 (0.0%) | 46 (33.6%) |
| 4.0x or more | 168 (52.8%) | 0 (0.0%) |
| Total | 318 (100.0%) | 137 (100.0%) |
Real Estate Taxes by Mortgage Status in Davidsville
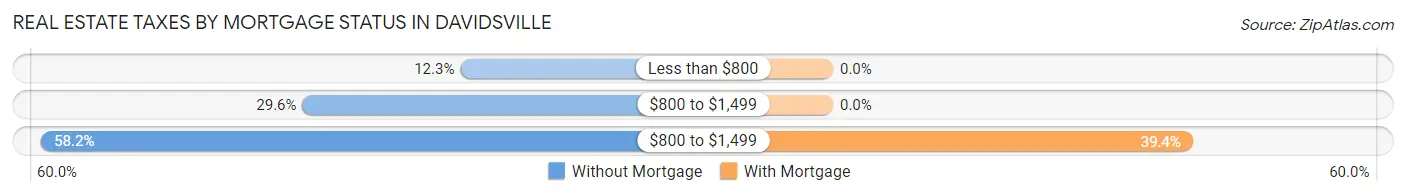
| Property Taxes | Without Mortgage | With Mortgage |
| Less than $800 | 39 (12.3%) | 0 (0.0%) |
| $800 to $1,499 | 94 (29.6%) | 0 (0.0%) |
| $800 to $1,499 | 185 (58.2%) | 54 (39.4%) |
| Total | 318 (100.0%) | 137 (100.0%) |
Health & Disability in Davidsville
Health Insurance Coverage by Age in Davidsville
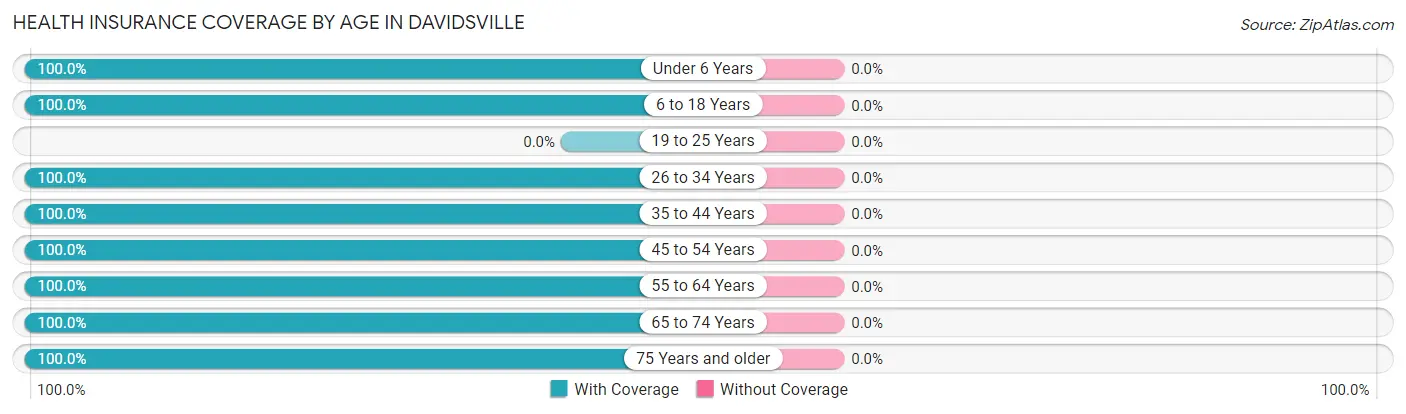
| Age Bracket | With Coverage | Without Coverage |
| Under 6 Years | 76 (100.0%) | 0 (0.0%) |
| 6 to 18 Years | 43 (100.0%) | 0 (0.0%) |
| 19 to 25 Years | 0 (0.0%) | 0 (0.0%) |
| 26 to 34 Years | 85 (100.0%) | 0 (0.0%) |
| 35 to 44 Years | 37 (100.0%) | 0 (0.0%) |
| 45 to 54 Years | 19 (100.0%) | 0 (0.0%) |
| 55 to 64 Years | 171 (100.0%) | 0 (0.0%) |
| 65 to 74 Years | 200 (100.0%) | 0 (0.0%) |
| 75 Years and older | 256 (100.0%) | 0 (0.0%) |
| Total | 887 (100.0%) | 0 (0.0%) |
Health Insurance Coverage by Citizenship Status in Davidsville
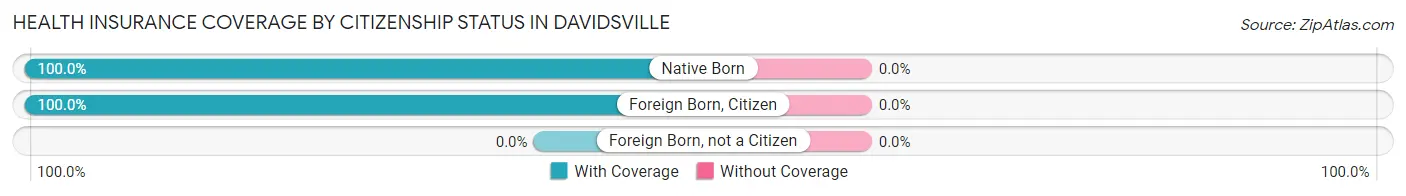
| Citizenship Status | With Coverage | Without Coverage |
| Native Born | 76 (100.0%) | 0 (0.0%) |
| Foreign Born, Citizen | 43 (100.0%) | 0 (0.0%) |
| Foreign Born, not a Citizen | 0 (0.0%) | 0 (0.0%) |
Health Insurance Coverage by Household Income in Davidsville
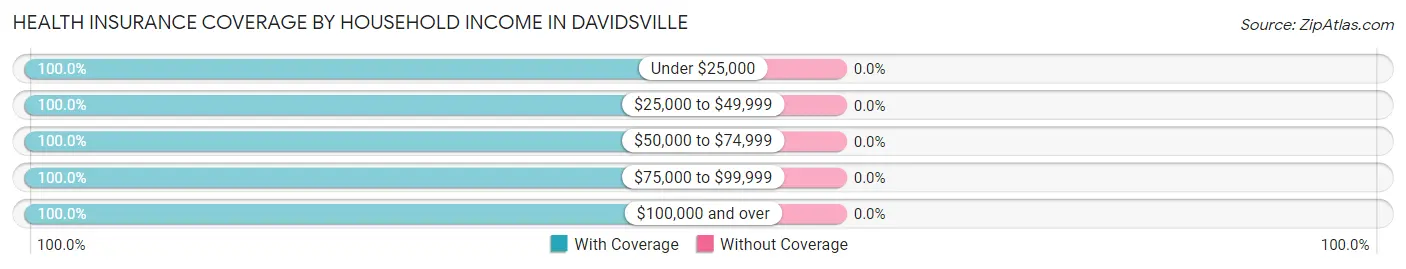
| Household Income | With Coverage | Without Coverage |
| Under $25,000 | 38 (100.0%) | 0 (0.0%) |
| $25,000 to $49,999 | 212 (100.0%) | 0 (0.0%) |
| $50,000 to $74,999 | 137 (100.0%) | 0 (0.0%) |
| $75,000 to $99,999 | 205 (100.0%) | 0 (0.0%) |
| $100,000 and over | 295 (100.0%) | 0 (0.0%) |
Public vs Private Health Insurance Coverage by Age in Davidsville
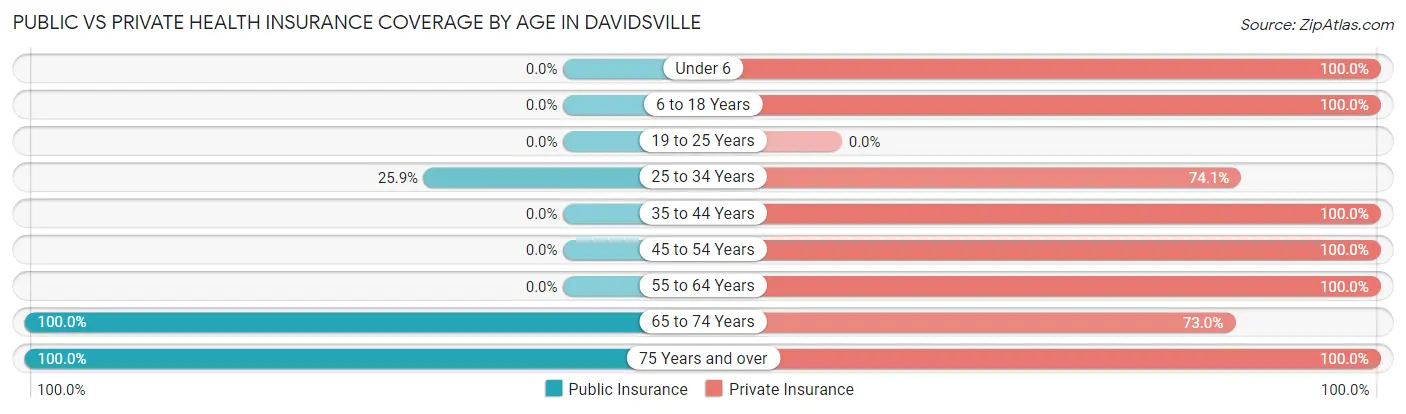
| Age Bracket | Public Insurance | Private Insurance |
| Under 6 | 0 (0.0%) | 76 (100.0%) |
| 6 to 18 Years | 0 (0.0%) | 43 (100.0%) |
| 19 to 25 Years | 0 (0.0%) | 0 (0.0%) |
| 25 to 34 Years | 22 (25.9%) | 63 (74.1%) |
| 35 to 44 Years | 0 (0.0%) | 37 (100.0%) |
| 45 to 54 Years | 0 (0.0%) | 19 (100.0%) |
| 55 to 64 Years | 0 (0.0%) | 171 (100.0%) |
| 65 to 74 Years | 200 (100.0%) | 146 (73.0%) |
| 75 Years and over | 256 (100.0%) | 256 (100.0%) |
| Total | 478 (53.9%) | 811 (91.4%) |
Disability Status by Sex by Age in Davidsville
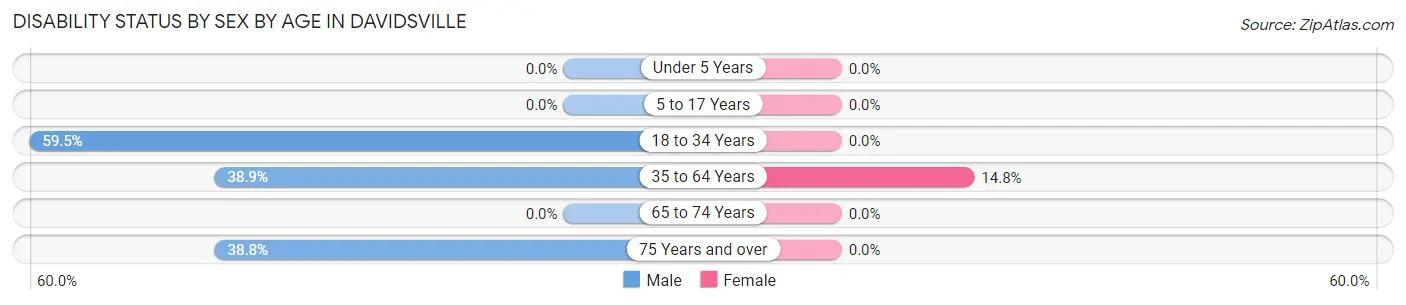
| Age Bracket | Male | Female |
| Under 5 Years | 0 (0.0%) | 0 (0.0%) |
| 5 to 17 Years | 0 (0.0%) | 0 (0.0%) |
| 18 to 34 Years | 22 (59.5%) | 0 (0.0%) |
| 35 to 64 Years | 54 (38.9%) | 13 (14.8%) |
| 65 to 74 Years | 0 (0.0%) | 0 (0.0%) |
| 75 Years and over | 40 (38.8%) | 0 (0.0%) |
Disability Class by Sex by Age in Davidsville
Disability Class: Hearing Difficulty
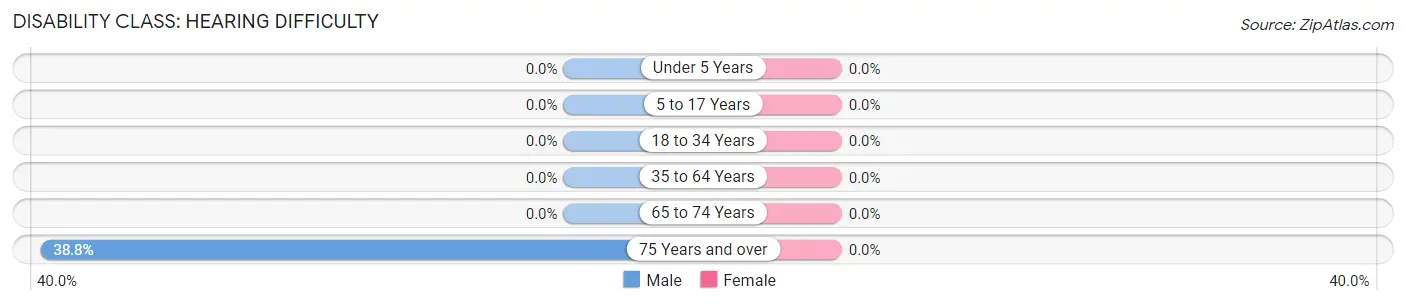
| Age Bracket | Male | Female |
| Under 5 Years | 0 (0.0%) | 0 (0.0%) |
| 5 to 17 Years | 0 (0.0%) | 0 (0.0%) |
| 18 to 34 Years | 0 (0.0%) | 0 (0.0%) |
| 35 to 64 Years | 0 (0.0%) | 0 (0.0%) |
| 65 to 74 Years | 0 (0.0%) | 0 (0.0%) |
| 75 Years and over | 40 (38.8%) | 0 (0.0%) |
Disability Class: Vision Difficulty
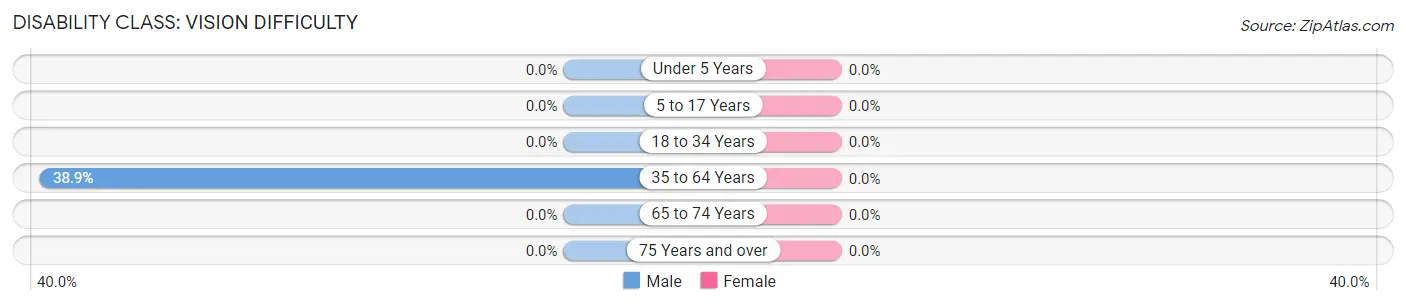
| Age Bracket | Male | Female |
| Under 5 Years | 0 (0.0%) | 0 (0.0%) |
| 5 to 17 Years | 0 (0.0%) | 0 (0.0%) |
| 18 to 34 Years | 0 (0.0%) | 0 (0.0%) |
| 35 to 64 Years | 54 (38.9%) | 0 (0.0%) |
| 65 to 74 Years | 0 (0.0%) | 0 (0.0%) |
| 75 Years and over | 0 (0.0%) | 0 (0.0%) |
Disability Class: Cognitive Difficulty
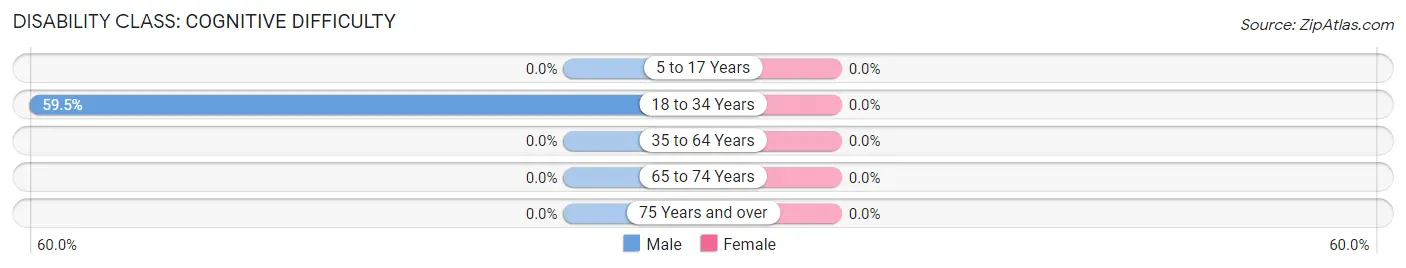
| Age Bracket | Male | Female |
| 5 to 17 Years | 0 (0.0%) | 0 (0.0%) |
| 18 to 34 Years | 22 (59.5%) | 0 (0.0%) |
| 35 to 64 Years | 0 (0.0%) | 0 (0.0%) |
| 65 to 74 Years | 0 (0.0%) | 0 (0.0%) |
| 75 Years and over | 0 (0.0%) | 0 (0.0%) |
Disability Class: Ambulatory Difficulty
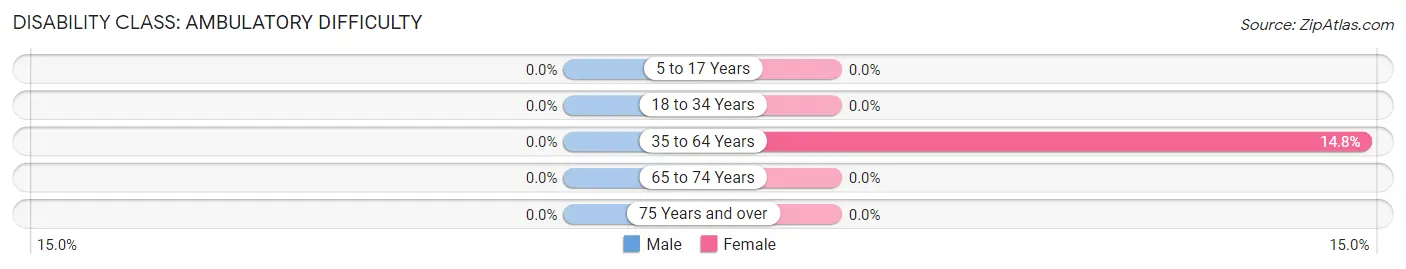
| Age Bracket | Male | Female |
| 5 to 17 Years | 0 (0.0%) | 0 (0.0%) |
| 18 to 34 Years | 0 (0.0%) | 0 (0.0%) |
| 35 to 64 Years | 0 (0.0%) | 13 (14.8%) |
| 65 to 74 Years | 0 (0.0%) | 0 (0.0%) |
| 75 Years and over | 0 (0.0%) | 0 (0.0%) |
Disability Class: Self-Care Difficulty
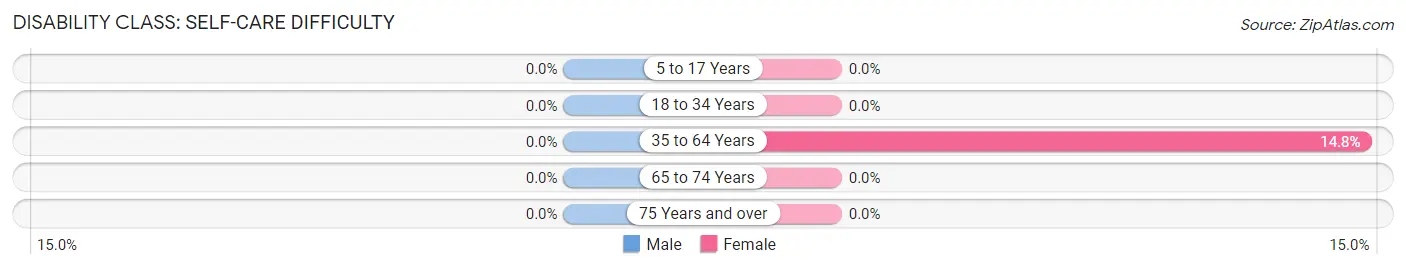
| Age Bracket | Male | Female |
| 5 to 17 Years | 0 (0.0%) | 0 (0.0%) |
| 18 to 34 Years | 0 (0.0%) | 0 (0.0%) |
| 35 to 64 Years | 0 (0.0%) | 13 (14.8%) |
| 65 to 74 Years | 0 (0.0%) | 0 (0.0%) |
| 75 Years and over | 0 (0.0%) | 0 (0.0%) |
Technology Access in Davidsville
Computing Device Access in Davidsville
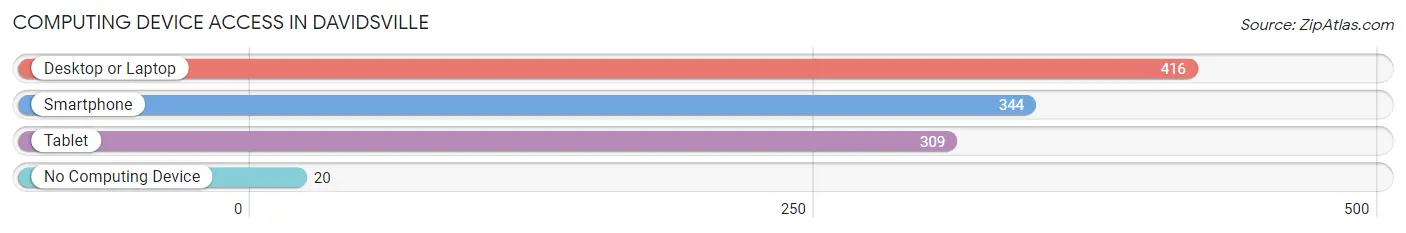
| Device Type | # Households | % Households |
| Desktop or Laptop | 416 | 91.4% |
| Smartphone | 344 | 75.6% |
| Tablet | 309 | 67.9% |
| No Computing Device | 20 | 4.4% |
| Total | 455 | 100.0% |
Internet Access in Davidsville
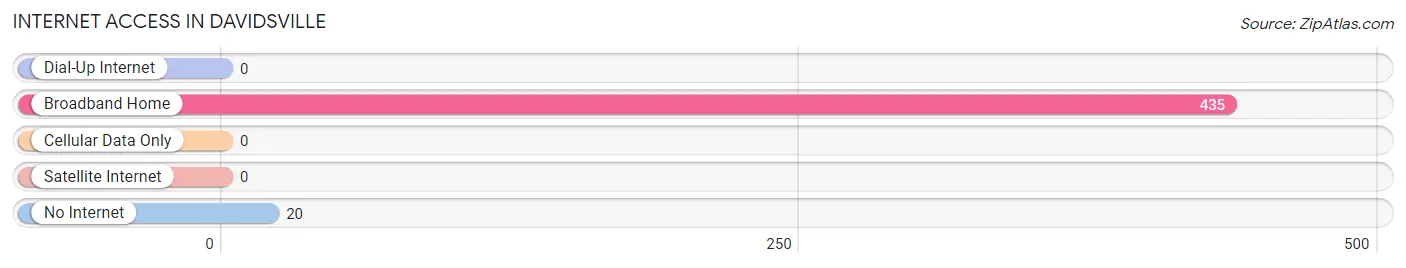
| Internet Type | # Households | % Households |
| Dial-Up Internet | 0 | 0.0% |
| Broadband Home | 435 | 95.6% |
| Cellular Data Only | 0 | 0.0% |
| Satellite Internet | 0 | 0.0% |
| No Internet | 20 | 4.4% |
| Total | 455 | 100.0% |
Davidsville Summary
Davidsville is a small borough located in Somerset County, Pennsylvania. It is situated in the foothills of the Allegheny Mountains, approximately 50 miles southeast of Pittsburgh. The population of Davidsville was 1,093 at the 2010 census.
History
Davidsville was founded in 1845 by David Miller, a German immigrant who had settled in the area in 1837. Miller purchased a tract of land from the local Native Americans and established a small village. The village was named after him and was incorporated as a borough in 1872.
The town grew slowly but steadily over the years, and by the early 20th century, it had become a thriving community. The town was home to several businesses, including a sawmill, a grist mill, a blacksmith shop, and a general store.
Geography
Davidsville is located at 40°14'17" North, 78°54'45" West (40.238, -78.912). According to the United States Census Bureau, the borough has a total area of 0.6 square miles, all of it land.
The borough is located in the foothills of the Allegheny Mountains, and is surrounded by rolling hills and farmland. The nearby towns of Stoystown, Boswell, and Jerome are all within a few miles of Davidsville.
Economy
Davidsville’s economy is largely based on agriculture and tourism. The town is home to several farms, which produce a variety of crops, including corn, soybeans, and hay. The town also has several small businesses, including a grocery store, a hardware store, and a restaurant.
Tourism is an important part of the local economy. The town is home to several attractions, including the Davidsville Historical Society Museum, the Davidsville Community Park, and the Davidsville Community Pool. The town also hosts several annual events, such as the Davidsville Days Festival and the Davidsville Car Show.
Demographics
As of the 2010 census, there were 1,093 people, 441 households, and 305 families residing in the borough. The population density was 1,817.5 people per square mile. The racial makeup of the borough was 97.7% White, 0.2% African American, 0.2% Native American, 0.2% Asian, 0.2% from other races, and 1.7% from two or more races. Hispanic or Latino of any race were 0.7% of the population.
There were 441 households, out of which 28.2% had children under the age of 18 living with them, 51.6% were married couples living together, 10.2% had a female householder with no husband present, and 33.2% were non-families. 29.2% of all households were made up of individuals, and 14.3% had someone living alone who was 65 years of age or older. The average household size was 2.47 and the average family size was 3.05.
In the borough, the population was spread out, with 24.2% under the age of 18, 7.2% from 18 to 24, 27.2% from 25 to 44, 24.2% from 45 to 64, and 17.2% who were 65 years of age or older. The median age was 39 years. For every 100 females, there were 94.2 males. For every 100 females age 18 and over, there were 91.2 males.
The median income for a household in the borough was $35,000, and the median income for a family was $41,250. Males had a median income of $30,000 versus $21,250 for females. The per capita income for the borough was $17,845. About 8.2% of families and 10.2% of the population were below the poverty line, including 14.3% of those under age 18 and 8.2% of those age 65 or over.
Common Questions
What is Per Capita Income in Davidsville?
Per Capita income in Davidsville is $36,974.
What is the Median Family Income in Davidsville?
Median Family Income in Davidsville is $91,705.
What is the Median Household income in Davidsville?
Median Household Income in Davidsville is $53,326.
What is Income or Wage Gap in Davidsville?
Income or Wage Gap in Davidsville is 62.3%.
Women in Davidsville earn 37.7 cents for every dollar earned by a man.
What is Inequality or Gini Index in Davidsville?
Inequality or Gini Index in Davidsville is 0.33.
What is the Total Population of Davidsville?
Total Population of Davidsville is 887.
What is the Total Male Population of Davidsville?
Total Male Population of Davidsville is 462.
What is the Total Female Population of Davidsville?
Total Female Population of Davidsville is 425.
What is the Ratio of Males per 100 Females in Davidsville?
There are 108.71 Males per 100 Females in Davidsville.
What is the Ratio of Females per 100 Males in Davidsville?
There are 91.99 Females per 100 Males in Davidsville.
What is the Median Population Age in Davidsville?
Median Population Age in Davidsville is 65.4 Years.
What is the Average Family Size in Davidsville
Average Family Size in Davidsville is 2.6 People.
What is the Average Household Size in Davidsville
Average Household Size in Davidsville is 1.9 People.
How Large is the Labor Force in Davidsville?
There are 317 People in the Labor Forcein in Davidsville.
What is the Percentage of People in the Labor Force in Davidsville?
41.3% of People are in the Labor Force in Davidsville.