Van Voorhis, PA Map & Demographics
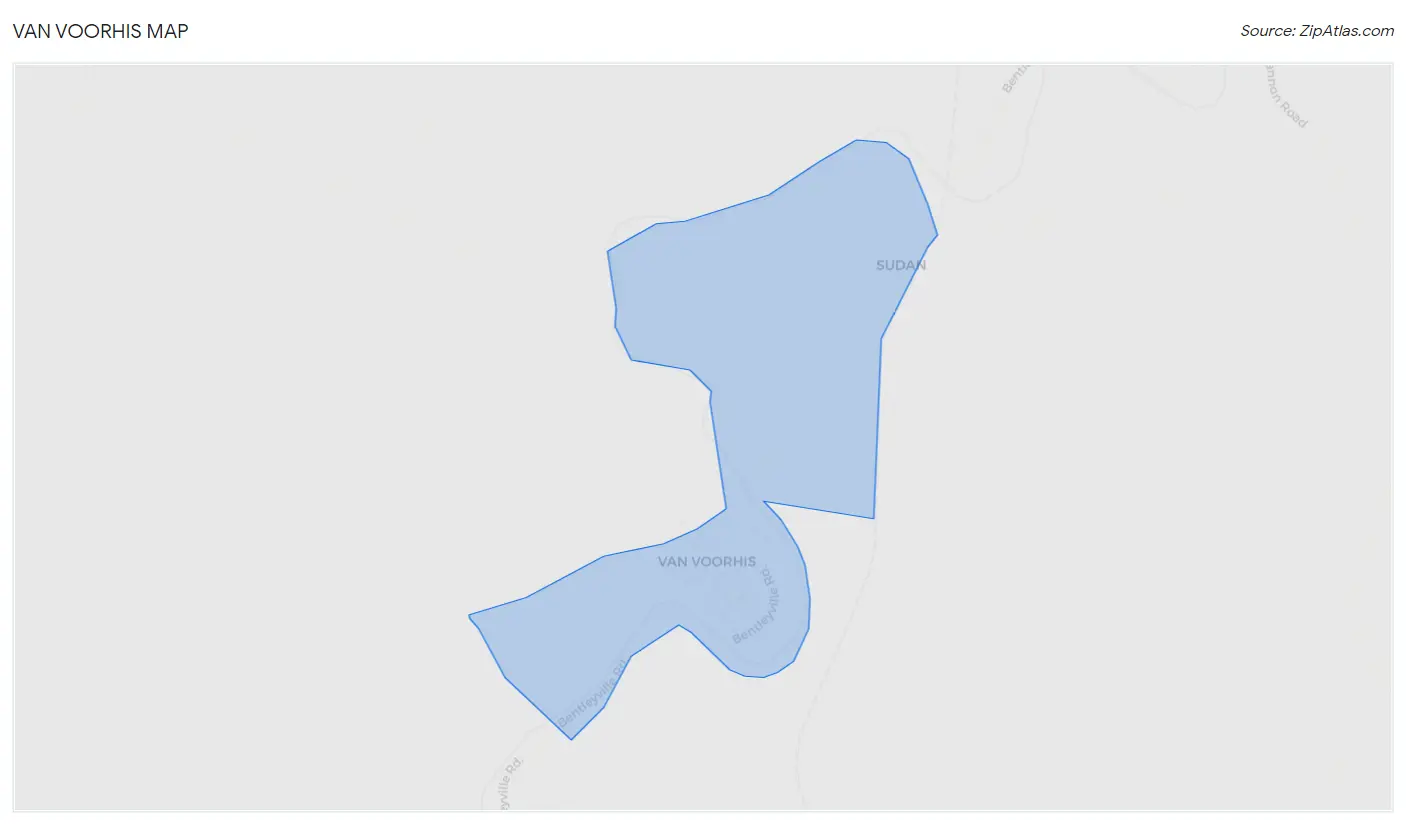
Van Voorhis Map
Van Voorhis Overview
$29,115
PER CAPITA INCOME
$39,294
AVG HOUSEHOLD INCOME
0.33
INEQUALITY / GINI INDEX
468
TOTAL POPULATION
247
MALE POPULATION
221
FEMALE POPULATION
111.76
MALES / 100 FEMALES
89.47
FEMALES / 100 MALES
66.4
MEDIAN AGE
2.4
AVG FAMILY SIZE
2.1
AVG HOUSEHOLD SIZE
52
LABOR FORCE [ PEOPLE ]
11.1%
PERCENT IN LABOR FORCE
Van Voorhis Zip Codes
Van Voorhis Area Codes
Income in Van Voorhis
Income Overview in Van Voorhis
| Characteristic | Number | Measure |
| Per Capita Income | 468 | $29,115 |
| Median Family Income | 72 | $0 |
| Mean Family Income | 72 | $113,185 |
| Median Household Income | 227 | $39,294 |
| Mean Household Income | 227 | $60,710 |
| Income Deficit | 72 | $0 |
| Wage / Income Gap (%) | 468 | 0.00% |
| Wage / Income Gap ($) | 468 | 100.00¢ per $1 |
| Gini / Inequality Index | 468 | 0.33 |
Earnings by Sex in Van Voorhis
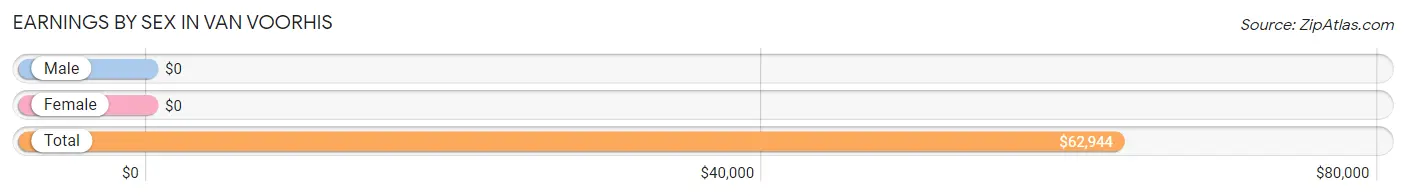
| Sex | Number | Average Earnings |
| Male | 21 (28.0%) | $0 |
| Female | 54 (72.0%) | $0 |
| Total | 75 (100.0%) | $62,944 |
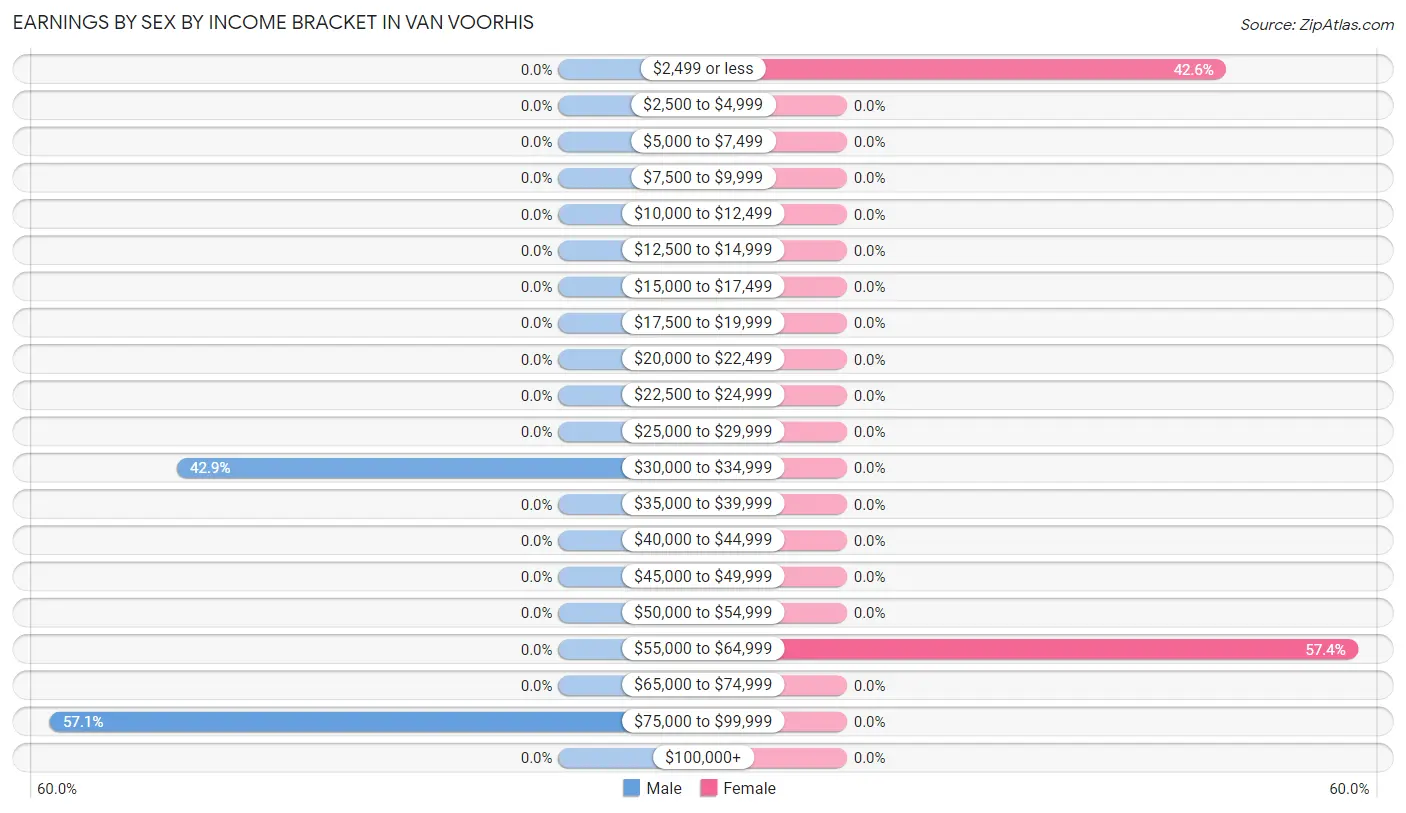
Earnings by Sex by Income Bracket in Van Voorhis
The most common earnings brackets in Van Voorhis are $75,000 to $99,999 for men (12 | 57.1%) and $55,000 to $64,999 for women (31 | 57.4%).
| Income | Male | Female |
| $2,499 or less | 0 (0.0%) | 23 (42.6%) |
| $2,500 to $4,999 | 0 (0.0%) | 0 (0.0%) |
| $5,000 to $7,499 | 0 (0.0%) | 0 (0.0%) |
| $7,500 to $9,999 | 0 (0.0%) | 0 (0.0%) |
| $10,000 to $12,499 | 0 (0.0%) | 0 (0.0%) |
| $12,500 to $14,999 | 0 (0.0%) | 0 (0.0%) |
| $15,000 to $17,499 | 0 (0.0%) | 0 (0.0%) |
| $17,500 to $19,999 | 0 (0.0%) | 0 (0.0%) |
| $20,000 to $22,499 | 0 (0.0%) | 0 (0.0%) |
| $22,500 to $24,999 | 0 (0.0%) | 0 (0.0%) |
| $25,000 to $29,999 | 0 (0.0%) | 0 (0.0%) |
| $30,000 to $34,999 | 9 (42.9%) | 0 (0.0%) |
| $35,000 to $39,999 | 0 (0.0%) | 0 (0.0%) |
| $40,000 to $44,999 | 0 (0.0%) | 0 (0.0%) |
| $45,000 to $49,999 | 0 (0.0%) | 0 (0.0%) |
| $50,000 to $54,999 | 0 (0.0%) | 0 (0.0%) |
| $55,000 to $64,999 | 0 (0.0%) | 31 (57.4%) |
| $65,000 to $74,999 | 0 (0.0%) | 0 (0.0%) |
| $75,000 to $99,999 | 12 (57.1%) | 0 (0.0%) |
| $100,000+ | 0 (0.0%) | 0 (0.0%) |
| Total | 21 (100.0%) | 54 (100.0%) |
Earnings by Sex by Educational Attainment in Van Voorhis
| Educational Attainment | Male Income | Female Income |
| Less than High School | - | - |
| High School Diploma | - | - |
| College or Associate's Degree | - | - |
| Bachelor's Degree | - | - |
| Graduate Degree | - | - |
| Total | - | - |
Family Income in Van Voorhis
Family Income Brackets in Van Voorhis
According to the Van Voorhis family income data, there are 33 families falling into the $150,000 to $199,999 income range, which is the most common income bracket and makes up 45.8% of all families.
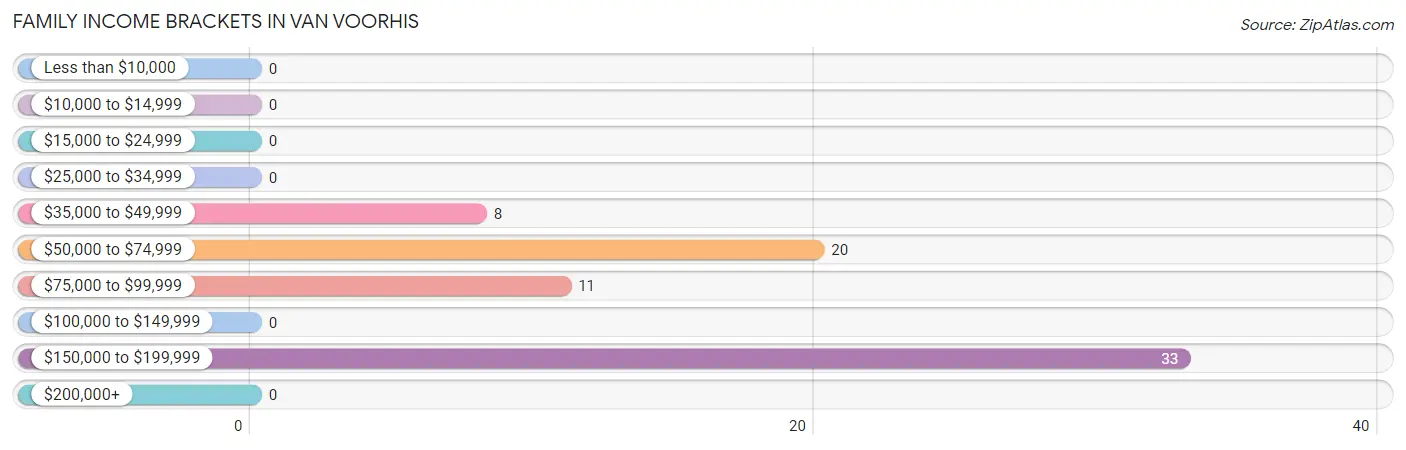
| Income Bracket | # Families | % Families |
| Less than $10,000 | 0 | 0.0% |
| $10,000 to $14,999 | 0 | 0.0% |
| $15,000 to $24,999 | 0 | 0.0% |
| $25,000 to $34,999 | 0 | 0.0% |
| $35,000 to $49,999 | 8 | 11.1% |
| $50,000 to $74,999 | 20 | 27.8% |
| $75,000 to $99,999 | 11 | 15.3% |
| $100,000 to $149,999 | 0 | 0.0% |
| $150,000 to $199,999 | 33 | 45.8% |
| $200,000+ | 0 | 0.0% |
Family Income by Famaliy Size in Van Voorhis
| Income Bracket | # Families | Median Income |
| 2-Person Families | 61 (84.7%) | $0 |
| 3-Person Families | 0 (0.0%) | $0 |
| 4-Person Families | 11 (15.3%) | $0 |
| 5-Person Families | 0 (0.0%) | $0 |
| 6-Person Families | 0 (0.0%) | $0 |
| 7+ Person Families | 0 (0.0%) | $0 |
| Total | 72 (100.0%) | $0 |
Family Income by Number of Earners in Van Voorhis
| Number of Earners | # Families | Median Income |
| No Earners | 20 (27.8%) | $0 |
| 1 Earner | 41 (56.9%) | $0 |
| 2 Earners | 0 (0.0%) | $0 |
| 3+ Earners | 11 (15.3%) | $0 |
| Total | 72 (100.0%) | $0 |
Household Income in Van Voorhis
Household Income Brackets in Van Voorhis
With 155 households falling in the category, the $35,000 to $49,999 income range is the most frequent in Van Voorhis, accounting for 68.3% of all households.
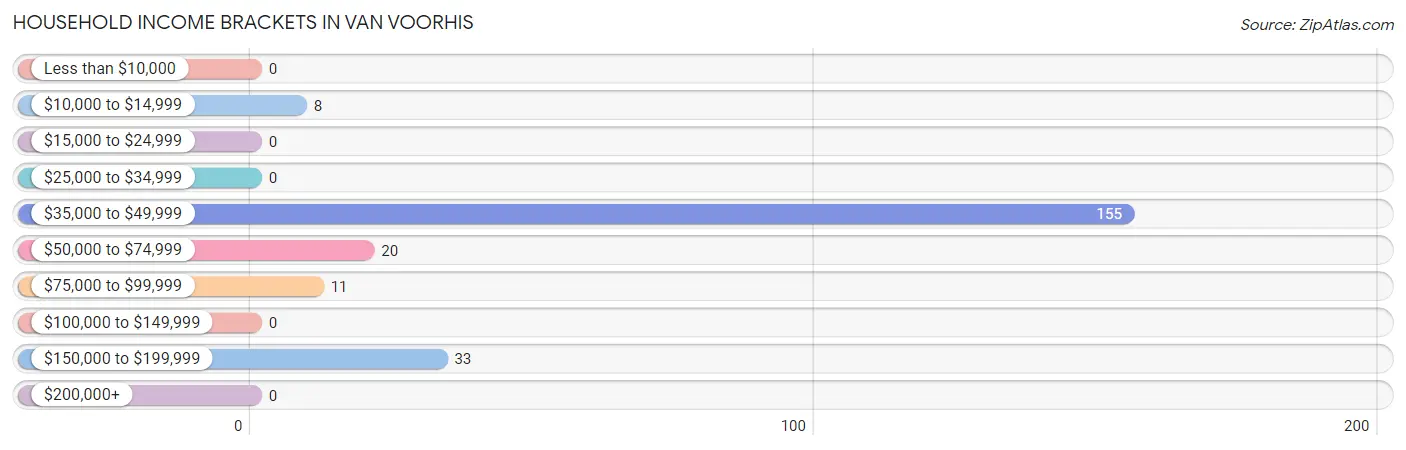
| Income Bracket | # Households | % Households |
| Less than $10,000 | 0 | 0.0% |
| $10,000 to $14,999 | 8 | 3.5% |
| $15,000 to $24,999 | 0 | 0.0% |
| $25,000 to $34,999 | 0 | 0.0% |
| $35,000 to $49,999 | 155 | 68.3% |
| $50,000 to $74,999 | 20 | 8.8% |
| $75,000 to $99,999 | 11 | 4.8% |
| $100,000 to $149,999 | 0 | 0.0% |
| $150,000 to $199,999 | 33 | 14.5% |
| $200,000+ | 0 | 0.0% |
Household Income by Householder Age in Van Voorhis
The median household income in Van Voorhis is $39,294, with the highest median household income of $39,133 found in the 65+ years age bracket for the primary householder. A total of 208 households (91.6%) fall into this category.
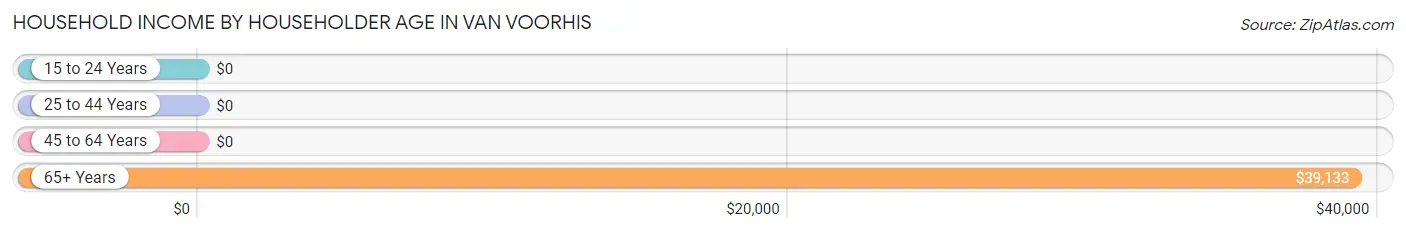
| Income Bracket | # Households | Median Income |
| 15 to 24 Years | 0 (0.0%) | $0 |
| 25 to 44 Years | 0 (0.0%) | $0 |
| 45 to 64 Years | 19 (8.4%) | $0 |
| 65+ Years | 208 (91.6%) | $39,133 |
| Total | 227 (100.0%) | $39,294 |
Poverty in Van Voorhis
Income Below Poverty by Sex and Age in Van Voorhis
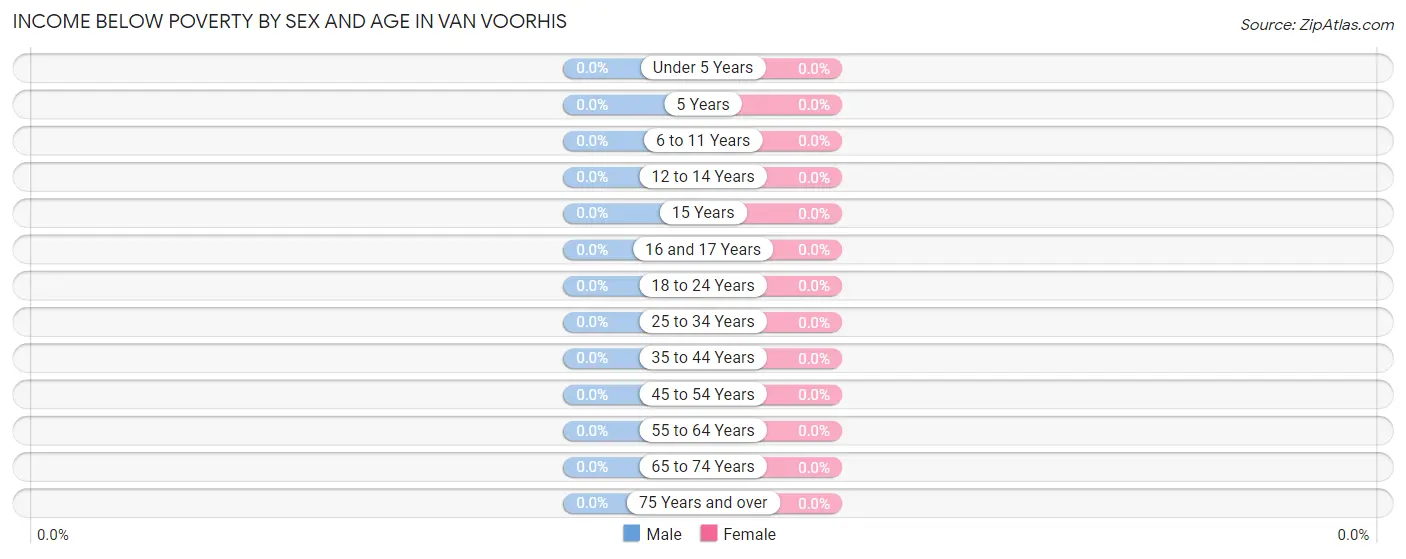
| Age Bracket | Male | Female |
| Under 5 Years | 0 (0.0%) | 0 (0.0%) |
| 5 Years | 0 (0.0%) | 0 (0.0%) |
| 6 to 11 Years | 0 (0.0%) | 0 (0.0%) |
| 12 to 14 Years | 0 (0.0%) | 0 (0.0%) |
| 15 Years | 0 (0.0%) | 0 (0.0%) |
| 16 and 17 Years | 0 (0.0%) | 0 (0.0%) |
| 18 to 24 Years | 0 (0.0%) | 0 (0.0%) |
| 25 to 34 Years | 0 (0.0%) | 0 (0.0%) |
| 35 to 44 Years | 0 (0.0%) | 0 (0.0%) |
| 45 to 54 Years | 0 (0.0%) | 0 (0.0%) |
| 55 to 64 Years | 0 (0.0%) | 0 (0.0%) |
| 65 to 74 Years | 0 (0.0%) | 0 (0.0%) |
| 75 Years and over | 0 (0.0%) | 0 (0.0%) |
| Total | 0 (0.0%) | 0 (0.0%) |
Income Above Poverty by Sex and Age in Van Voorhis
According to the poverty statistics in Van Voorhis, males aged 16 and 17 years and females aged 18 to 24 years are the age groups that are most secure financially, with 100.0% of males and 100.0% of females in these age groups living above the poverty line.
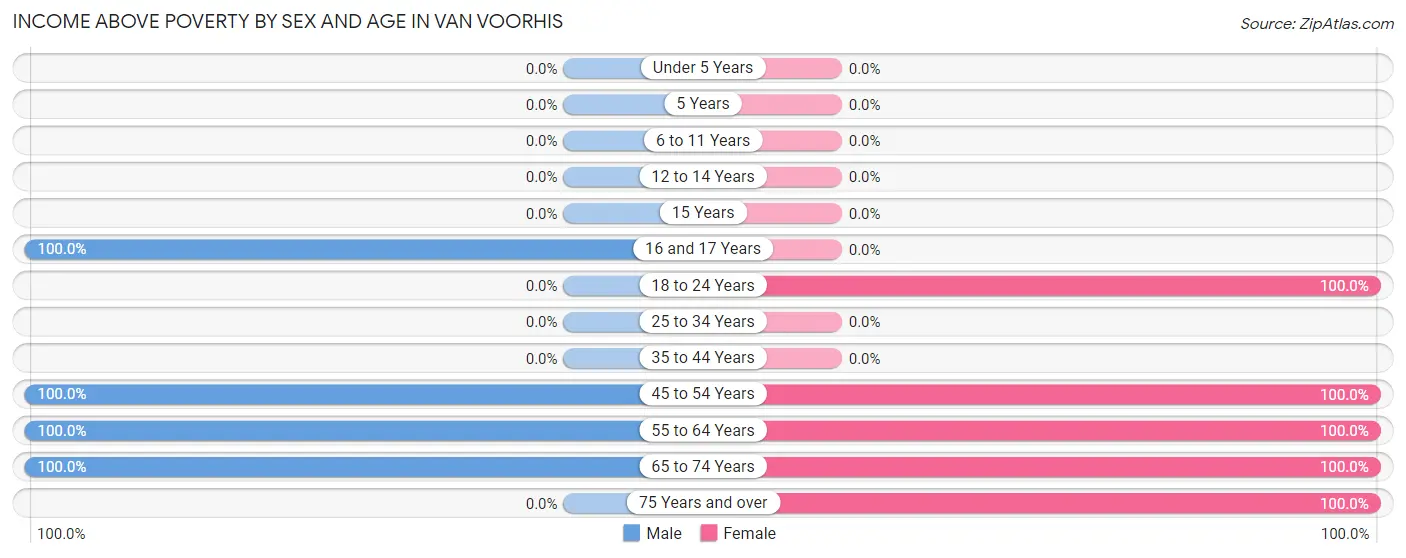
| Age Bracket | Male | Female |
| Under 5 Years | 0 (0.0%) | 0 (0.0%) |
| 5 Years | 0 (0.0%) | 0 (0.0%) |
| 6 to 11 Years | 0 (0.0%) | 0 (0.0%) |
| 12 to 14 Years | 0 (0.0%) | 0 (0.0%) |
| 15 Years | 0 (0.0%) | 0 (0.0%) |
| 16 and 17 Years | 12 (100.0%) | 0 (0.0%) |
| 18 to 24 Years | 0 (0.0%) | 12 (100.0%) |
| 25 to 34 Years | 0 (0.0%) | 0 (0.0%) |
| 35 to 44 Years | 0 (0.0%) | 0 (0.0%) |
| 45 to 54 Years | 21 (100.0%) | 11 (100.0%) |
| 55 to 64 Years | 29 (100.0%) | 31 (100.0%) |
| 65 to 74 Years | 185 (100.0%) | 147 (100.0%) |
| 75 Years and over | 0 (0.0%) | 20 (100.0%) |
| Total | 247 (100.0%) | 221 (100.0%) |
Income Below Poverty Among Married-Couple Families in Van Voorhis
| Children | Above Poverty | Below Poverty |
| No Children | 33 (100.0%) | 0 (0.0%) |
| 1 or 2 Children | 11 (100.0%) | 0 (0.0%) |
| 3 or 4 Children | 0 (0.0%) | 0 (0.0%) |
| 5 or more Children | 0 (0.0%) | 0 (0.0%) |
| Total | 44 (100.0%) | 0 (0.0%) |
Income Below Poverty Among Single-Parent Households in Van Voorhis
| Children | Single Father | Single Mother |
| No Children | 0 (0.0%) | 0 (0.0%) |
| 1 or 2 Children | 0 (0.0%) | 0 (0.0%) |
| 3 or 4 Children | 0 (0.0%) | 0 (0.0%) |
| 5 or more Children | 0 (0.0%) | 0 (0.0%) |
| Total | 0 (0.0%) | 0 (0.0%) |
Income Below Poverty Among Married-Couple vs Single-Parent Households in Van Voorhis
| Children | Married-Couple Families | Single-Parent Households |
| No Children | 0 (0.0%) | 0 (0.0%) |
| 1 or 2 Children | 0 (0.0%) | 0 (0.0%) |
| 3 or 4 Children | 0 (0.0%) | 0 (0.0%) |
| 5 or more Children | 0 (0.0%) | 0 (0.0%) |
| Total | 0 (0.0%) | 0 (0.0%) |
Race in Van Voorhis
The most populous races in Van Voorhis are , and White / Caucasian (468 | 100.0%).
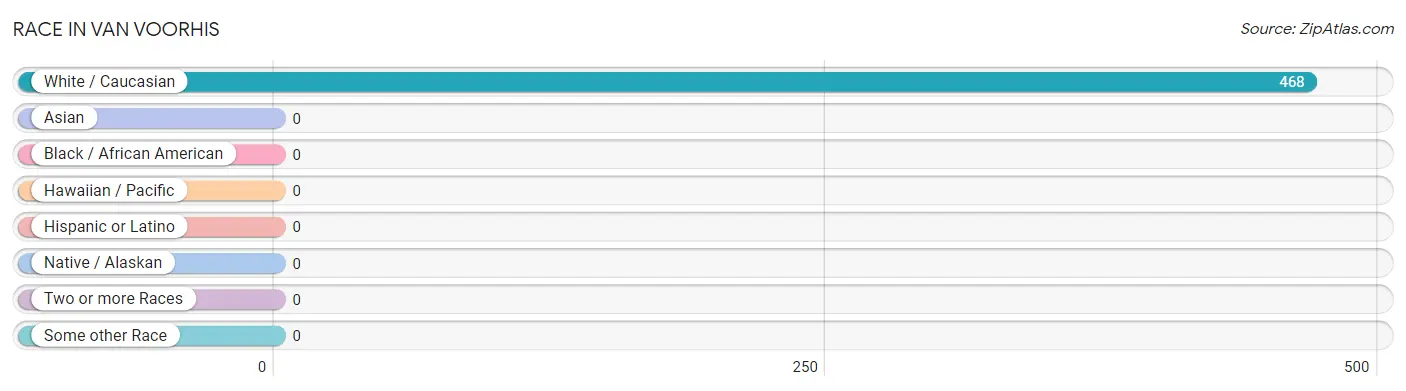
| Race | # Population | % Population |
| Asian | 0 | 0.0% |
| Black / African American | 0 | 0.0% |
| Hawaiian / Pacific | 0 | 0.0% |
| Hispanic or Latino | 0 | 0.0% |
| Native / Alaskan | 0 | 0.0% |
| White / Caucasian | 468 | 100.0% |
| Two or more Races | 0 | 0.0% |
| Some other Race | 0 | 0.0% |
| Total | 468 | 100.0% |
Ancestry in Van Voorhis
The most populous ancestries reported in Van Voorhis are Polish (147 | 31.4%), Czechoslovakian (144 | 30.8%), Italian (67 | 14.3%), Irish (66 | 14.1%), and Lithuanian (33 | 7.0%), together accounting for 97.6% of all Van Voorhis residents.
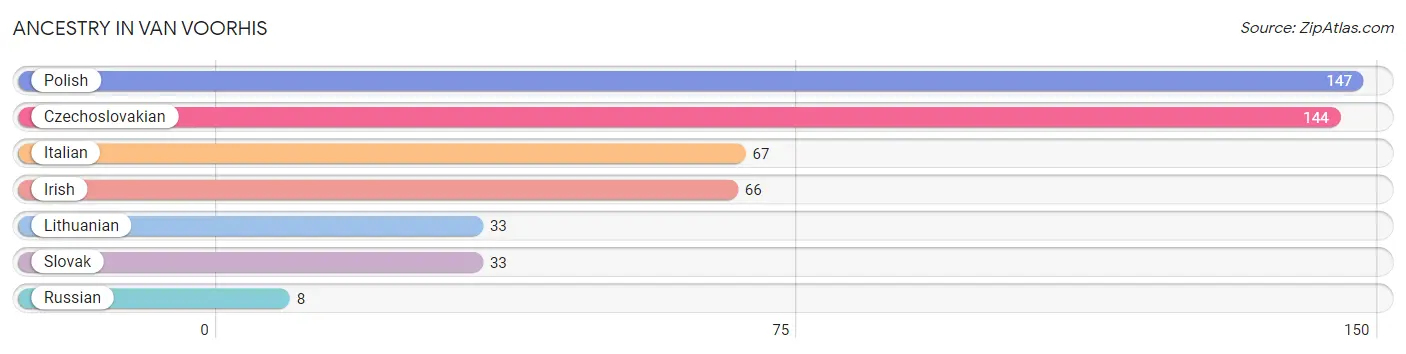
| Ancestry | # Population | % Population |
| Czechoslovakian | 144 | 30.8% |
| Irish | 66 | 14.1% |
| Italian | 67 | 14.3% |
| Lithuanian | 33 | 7.0% |
| Polish | 147 | 31.4% |
| Russian | 8 | 1.7% |
| Slovak | 33 | 7.0% | View All 7 Rows |
Immigrants in Van Voorhis

| Immigration Origin | # Population | % Population | View All 0 Rows |
Sex and Age in Van Voorhis
Sex and Age in Van Voorhis
The most populous age groups in Van Voorhis are 65 to 69 Years (144 | 58.3%) for men and 65 to 69 Years (147 | 66.5%) for women.
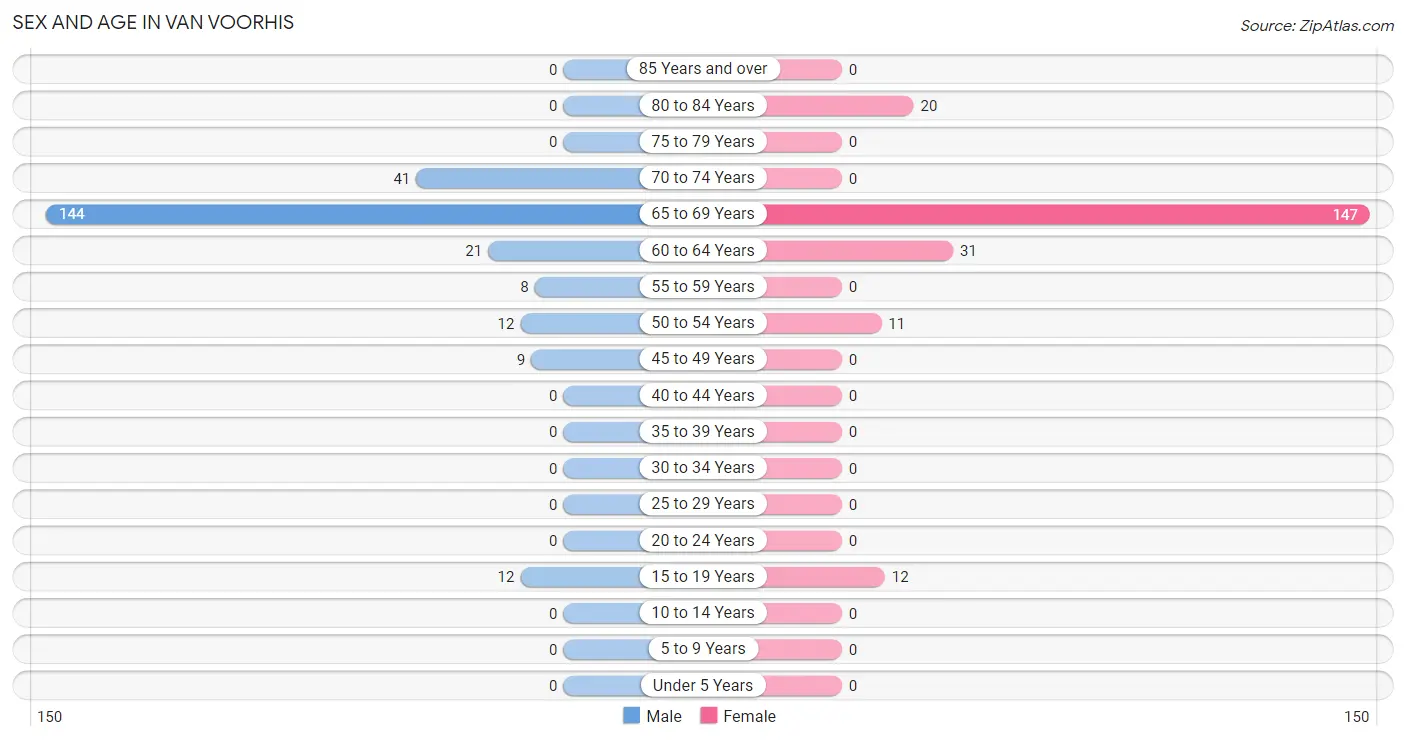
| Age Bracket | Male | Female |
| Under 5 Years | 0 (0.0%) | 0 (0.0%) |
| 5 to 9 Years | 0 (0.0%) | 0 (0.0%) |
| 10 to 14 Years | 0 (0.0%) | 0 (0.0%) |
| 15 to 19 Years | 12 (4.9%) | 12 (5.4%) |
| 20 to 24 Years | 0 (0.0%) | 0 (0.0%) |
| 25 to 29 Years | 0 (0.0%) | 0 (0.0%) |
| 30 to 34 Years | 0 (0.0%) | 0 (0.0%) |
| 35 to 39 Years | 0 (0.0%) | 0 (0.0%) |
| 40 to 44 Years | 0 (0.0%) | 0 (0.0%) |
| 45 to 49 Years | 9 (3.6%) | 0 (0.0%) |
| 50 to 54 Years | 12 (4.9%) | 11 (5.0%) |
| 55 to 59 Years | 8 (3.2%) | 0 (0.0%) |
| 60 to 64 Years | 21 (8.5%) | 31 (14.0%) |
| 65 to 69 Years | 144 (58.3%) | 147 (66.5%) |
| 70 to 74 Years | 41 (16.6%) | 0 (0.0%) |
| 75 to 79 Years | 0 (0.0%) | 0 (0.0%) |
| 80 to 84 Years | 0 (0.0%) | 20 (9.0%) |
| 85 Years and over | 0 (0.0%) | 0 (0.0%) |
| Total | 247 (100.0%) | 221 (100.0%) |
Families and Households in Van Voorhis
Median Family Size in Van Voorhis
The median family size in Van Voorhis is 2.35 persons per family, with married-couple families (44 | 61.1%) accounting for the largest median family size of 2.52 persons per family. On the other hand, single female/mother families (20 | 27.8%) represent the smallest median family size with 2.05 persons per family.
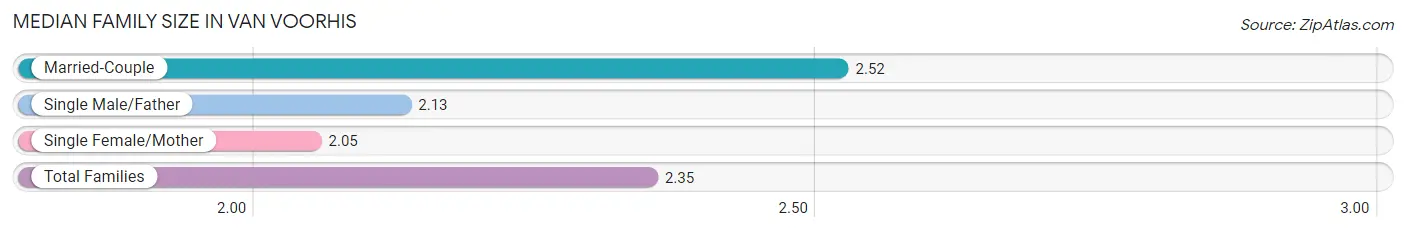
| Family Type | # Families | Family Size |
| Married-Couple | 44 (61.1%) | 2.52 |
| Single Male/Father | 8 (11.1%) | 2.13 |
| Single Female/Mother | 20 (27.8%) | 2.05 |
| Total Families | 72 (100.0%) | 2.35 |
Median Household Size in Van Voorhis
The median household size in Van Voorhis is 2.06 persons per household, with married-couple households (44 | 19.4%) accounting for the largest median household size of 2.52 persons per household. non-family households (155 | 68.3%) represent the smallest median household size with 1.93 persons per household.
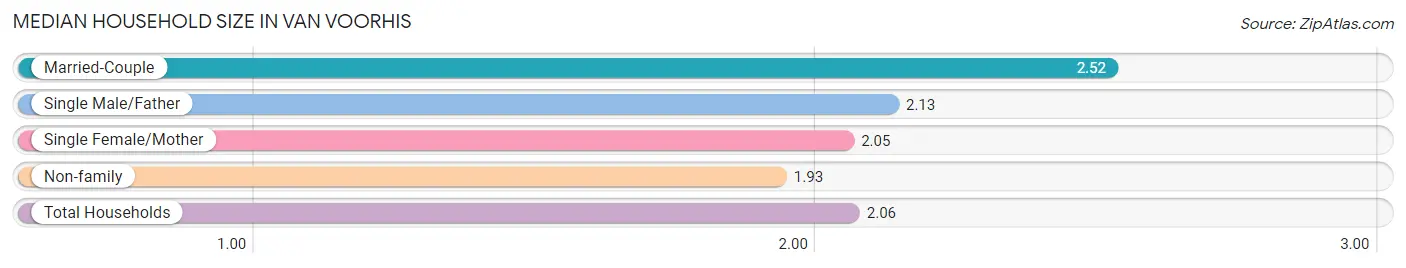
| Household Type | # Households | Household Size |
| Married-Couple | 44 (19.4%) | 2.52 |
| Single Male/Father | 8 (3.5%) | 2.13 |
| Single Female/Mother | 20 (8.8%) | 2.05 |
| Non-family | 155 (68.3%) | 1.93 |
| Total Households | 227 (100.0%) | 2.06 |
Household Size by Marriage Status in Van Voorhis
Out of a total of 227 households in Van Voorhis, 72 (31.7%) are family households, while 155 (68.3%) are nonfamily households. The most numerous type of family households are 2-person households, comprising 61, and the most common type of nonfamily households are 2-person households, comprising 147.
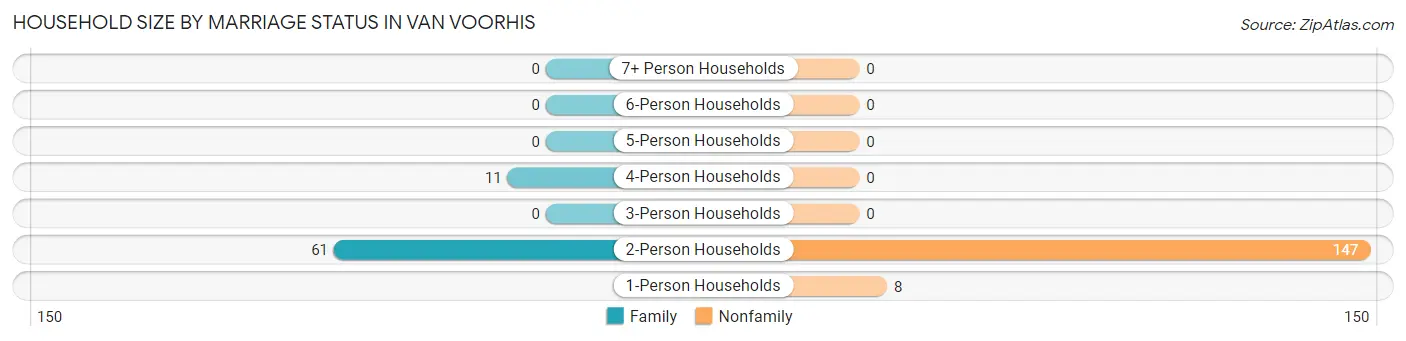
| Household Size | Family Households | Nonfamily Households |
| 1-Person Households | - | 8 (3.5%) |
| 2-Person Households | 61 (26.9%) | 147 (64.8%) |
| 3-Person Households | 0 (0.0%) | 0 (0.0%) |
| 4-Person Households | 11 (4.9%) | 0 (0.0%) |
| 5-Person Households | 0 (0.0%) | 0 (0.0%) |
| 6-Person Households | 0 (0.0%) | 0 (0.0%) |
| 7+ Person Households | 0 (0.0%) | 0 (0.0%) |
| Total | 72 (31.7%) | 155 (68.3%) |
Female Fertility in Van Voorhis
Fertility by Age in Van Voorhis
| Age Bracket | Women with Births | Births / 1,000 Women |
| 15 to 19 years | 0 (0.0%) | 0.0 |
| 20 to 34 years | 0 (0.0%) | 0.0 |
| 35 to 50 years | 0 (0.0%) | 0.0 |
| Total | 0 (0.0%) | 0.0 |
Fertility by Age by Marriage Status in Van Voorhis
| Age Bracket | Married | Unmarried |
| 15 to 19 years | 0 (0.0%) | 0 (0.0%) |
| 20 to 34 years | 0 (0.0%) | 0 (0.0%) |
| 35 to 50 years | 0 (0.0%) | 0 (0.0%) |
| Total | 0 (0.0%) | 0 (0.0%) |
Fertility by Education in Van Voorhis
| Educational Attainment | Women with Births | Births / 1,000 Women |
| Less than High School | 0 (0.0%) | 0.0 |
| High School Diploma | 0 (0.0%) | 0.0 |
| College or Associate's Degree | 0 (0.0%) | 0.0 |
| Bachelor's Degree | 0 (0.0%) | 0.0 |
| Graduate Degree | 0 (0.0%) | 0.0 |
| Total | 0 (0.0%) | 0.0 |
Fertility by Education by Marriage Status in Van Voorhis
| Educational Attainment | Married | Unmarried |
| Less than High School | 0 (0.0%) | 0 (0.0%) |
| High School Diploma | 0 (0.0%) | 0 (0.0%) |
| College or Associate's Degree | 0 (0.0%) | 0 (0.0%) |
| Bachelor's Degree | 0 (0.0%) | 0 (0.0%) |
| Graduate Degree | 0 (0.0%) | 0 (0.0%) |
| Total | 0 (0.0%) | 0 (0.0%) |
Employment Characteristics in Van Voorhis
Employment by Class of Employer in Van Voorhis
Among the 52 employed individuals in Van Voorhis, , and private company employees (52 | 100.0%) make up the most common classes of employment.
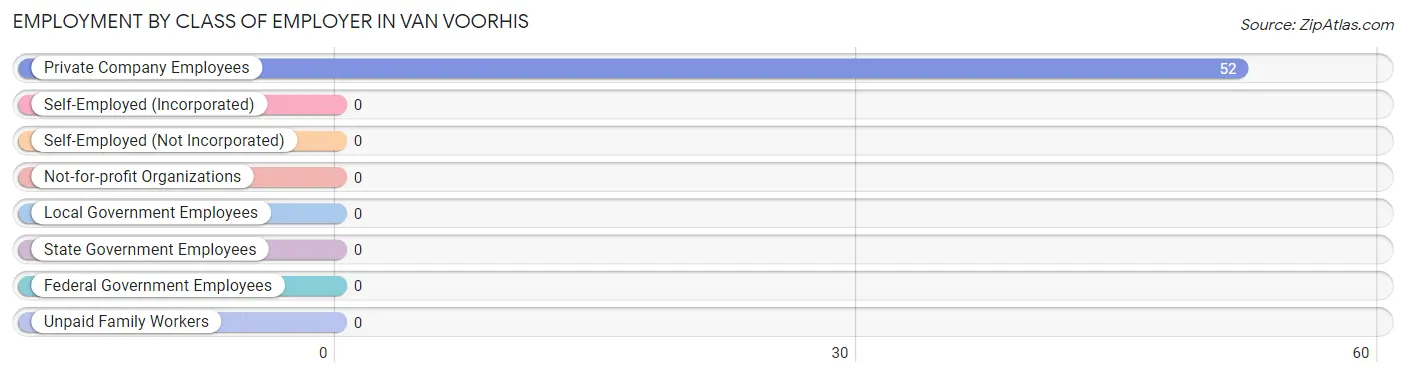
| Employer Class | # Employees | % Employees |
| Private Company Employees | 52 | 100.0% |
| Self-Employed (Incorporated) | 0 | 0.0% |
| Self-Employed (Not Incorporated) | 0 | 0.0% |
| Not-for-profit Organizations | 0 | 0.0% |
| Local Government Employees | 0 | 0.0% |
| State Government Employees | 0 | 0.0% |
| Federal Government Employees | 0 | 0.0% |
| Unpaid Family Workers | 0 | 0.0% |
| Total | 52 | 100.0% |
Employment Status by Age in Van Voorhis
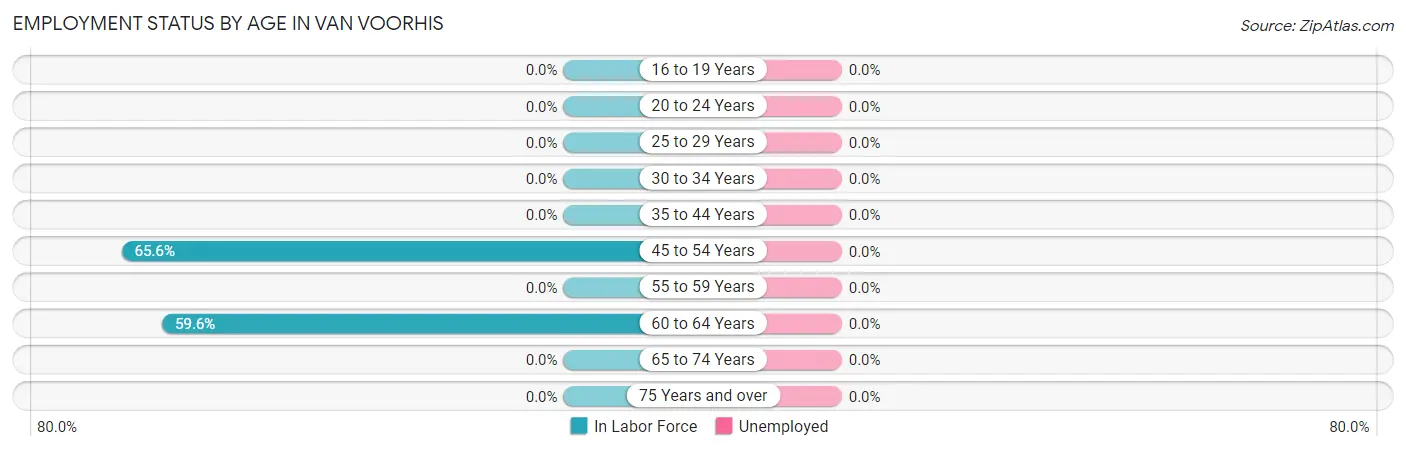
| Age Bracket | In Labor Force | Unemployed |
| 16 to 19 Years | 0 (0.0%) | 0 (0.0%) |
| 20 to 24 Years | 0 (0.0%) | 0 (0.0%) |
| 25 to 29 Years | 0 (0.0%) | 0 (0.0%) |
| 30 to 34 Years | 0 (0.0%) | 0 (0.0%) |
| 35 to 44 Years | 0 (0.0%) | 0 (0.0%) |
| 45 to 54 Years | 21 (65.6%) | 0 (0.0%) |
| 55 to 59 Years | 0 (0.0%) | 0 (0.0%) |
| 60 to 64 Years | 31 (59.6%) | 0 (0.0%) |
| 65 to 74 Years | 0 (0.0%) | 0 (0.0%) |
| 75 Years and over | 0 (0.0%) | 0 (0.0%) |
| Total | 52 (11.1%) | 0 (0.0%) |
Employment Status by Educational Attainment in Van Voorhis
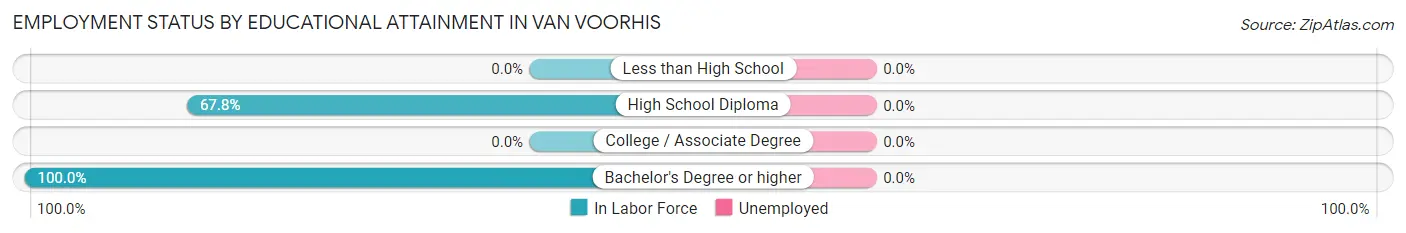
| Educational Attainment | In Labor Force | Unemployed |
| Less than High School | 0 (0.0%) | 0 (0.0%) |
| High School Diploma | 40 (67.8%) | 0 (0.0%) |
| College / Associate Degree | 0 (0.0%) | 0 (0.0%) |
| Bachelor's Degree or higher | 12 (100.0%) | 0 (0.0%) |
| Total | 52 (56.5%) | 0 (0.0%) |
Employment Occupations by Sex in Van Voorhis
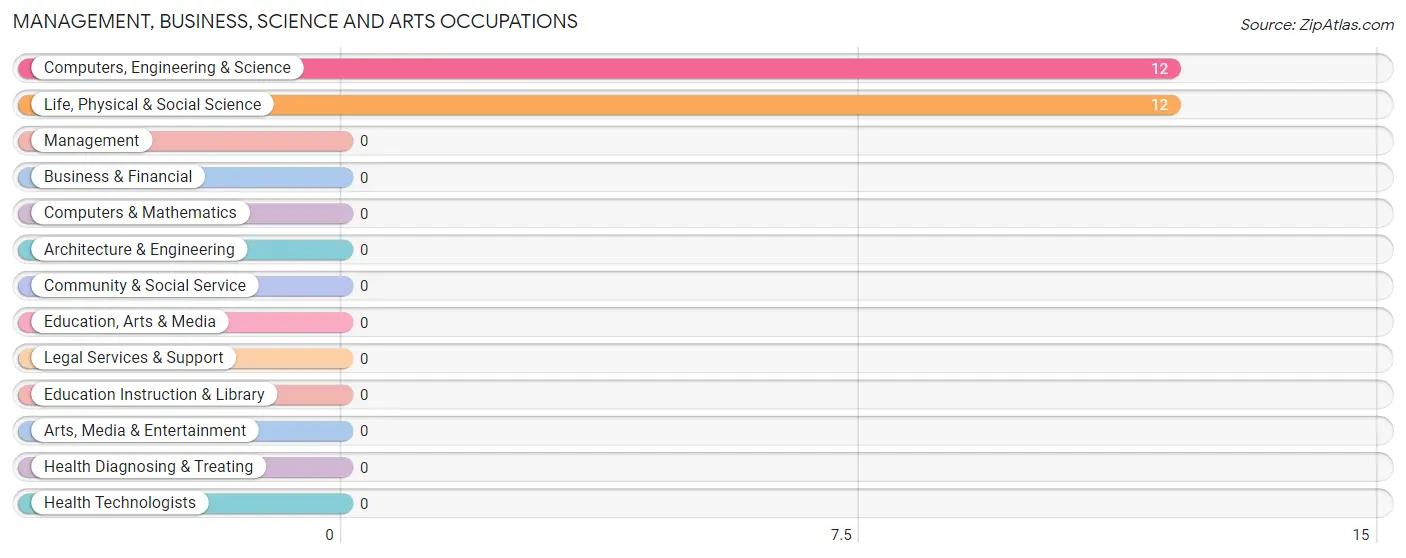
Management, Business, Science and Arts Occupations
The most common Management, Business, Science and Arts occupations in Van Voorhis are Computers, Engineering & Science (12 | 23.1%), and Life, Physical & Social Science (12 | 23.1%).
Management, Business, Science and Arts Occupations by Sex
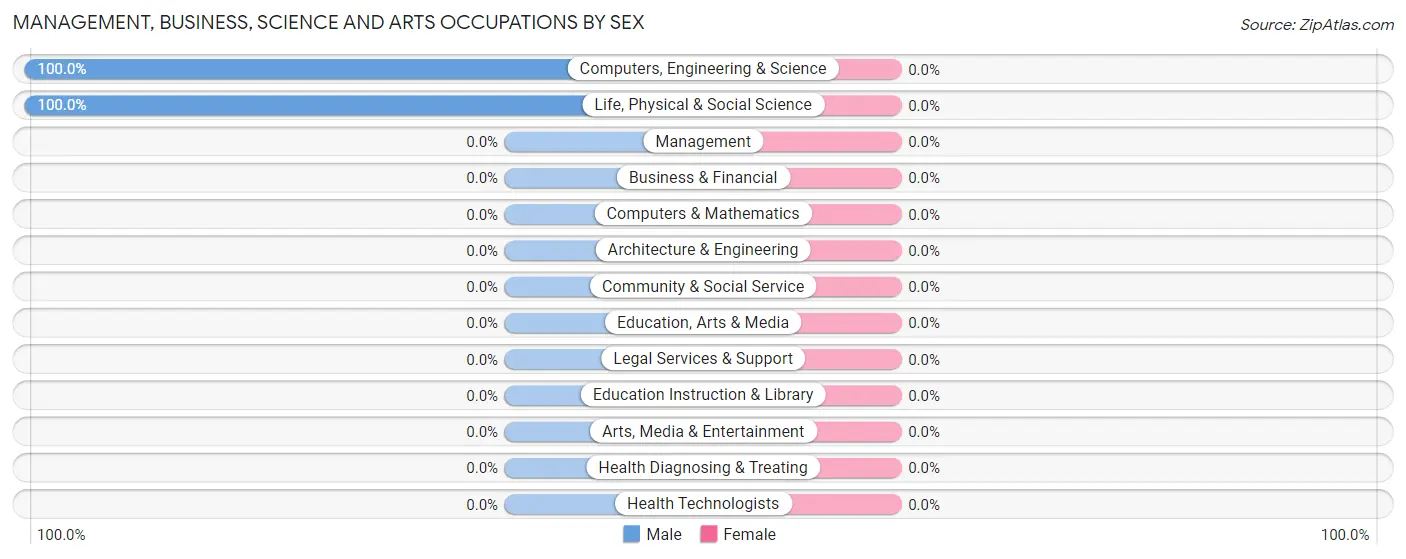
| Occupation | Male | Female |
| Management | 0 (0.0%) | 0 (0.0%) |
| Business & Financial | 0 (0.0%) | 0 (0.0%) |
| Computers, Engineering & Science | 12 (100.0%) | 0 (0.0%) |
| Computers & Mathematics | 0 (0.0%) | 0 (0.0%) |
| Architecture & Engineering | 0 (0.0%) | 0 (0.0%) |
| Life, Physical & Social Science | 12 (100.0%) | 0 (0.0%) |
| Community & Social Service | 0 (0.0%) | 0 (0.0%) |
| Education, Arts & Media | 0 (0.0%) | 0 (0.0%) |
| Legal Services & Support | 0 (0.0%) | 0 (0.0%) |
| Education Instruction & Library | 0 (0.0%) | 0 (0.0%) |
| Arts, Media & Entertainment | 0 (0.0%) | 0 (0.0%) |
| Health Diagnosing & Treating | 0 (0.0%) | 0 (0.0%) |
| Health Technologists | 0 (0.0%) | 0 (0.0%) |
| Total (Category) | 12 (100.0%) | 0 (0.0%) |
| Total (Overall) | 21 (40.4%) | 31 (59.6%) |
Services Occupations
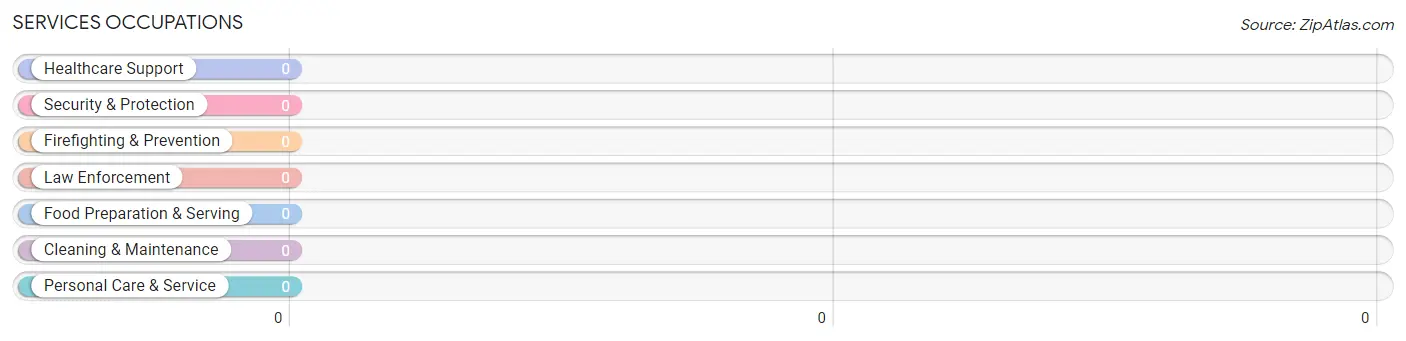
Services Occupations by Sex
| Occupation | Male | Female |
| Healthcare Support | 0 (0.0%) | 0 (0.0%) |
| Security & Protection | 0 (0.0%) | 0 (0.0%) |
| Firefighting & Prevention | 0 (0.0%) | 0 (0.0%) |
| Law Enforcement | 0 (0.0%) | 0 (0.0%) |
| Food Preparation & Serving | 0 (0.0%) | 0 (0.0%) |
| Cleaning & Maintenance | 0 (0.0%) | 0 (0.0%) |
| Personal Care & Service | 0 (0.0%) | 0 (0.0%) |
| Total (Category) | 0 (0.0%) | 0 (0.0%) |
| Total (Overall) | 21 (40.4%) | 31 (59.6%) |
Sales and Office Occupations
The most common Sales and Office occupations in Van Voorhis are , and Office & Administration (31 | 59.6%).
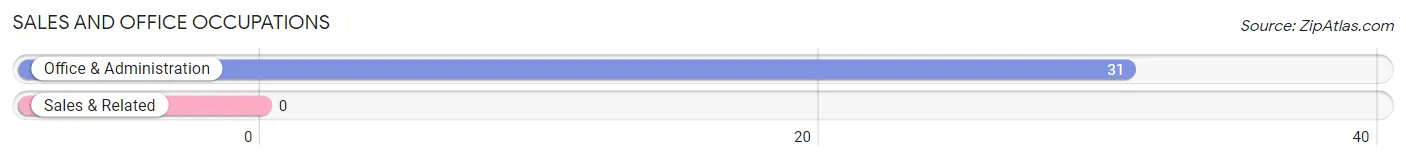
Sales and Office Occupations by Sex
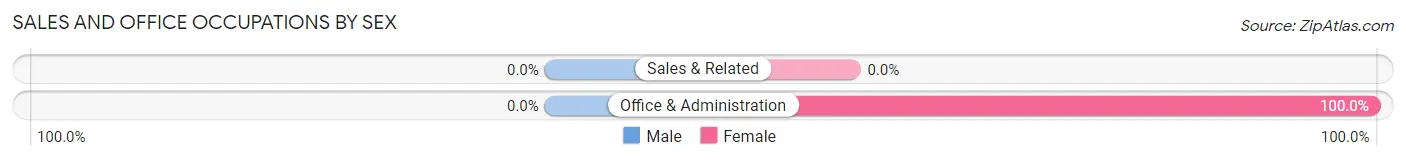
| Occupation | Male | Female |
| Sales & Related | 0 (0.0%) | 0 (0.0%) |
| Office & Administration | 0 (0.0%) | 31 (100.0%) |
| Total (Category) | 0 (0.0%) | 31 (100.0%) |
| Total (Overall) | 21 (40.4%) | 31 (59.6%) |
Natural Resources, Construction and Maintenance Occupations
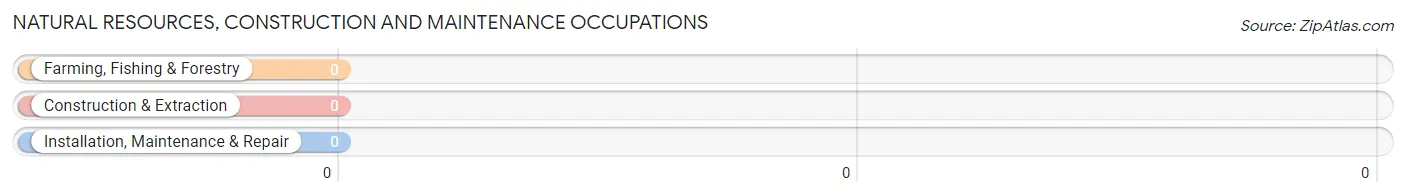
Natural Resources, Construction and Maintenance Occupations by Sex
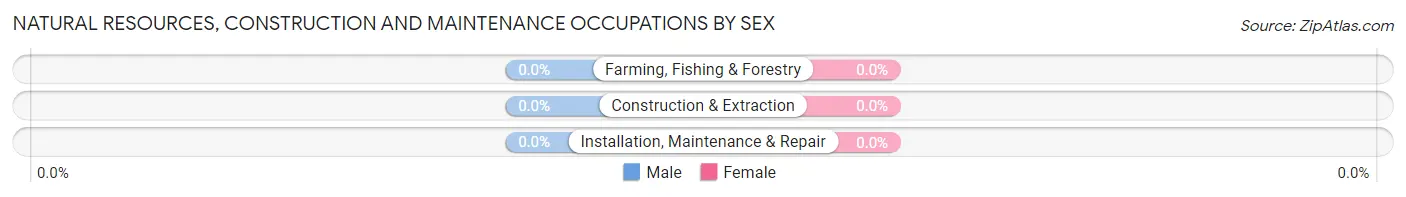
| Occupation | Male | Female |
| Farming, Fishing & Forestry | 0 (0.0%) | 0 (0.0%) |
| Construction & Extraction | 0 (0.0%) | 0 (0.0%) |
| Installation, Maintenance & Repair | 0 (0.0%) | 0 (0.0%) |
| Total (Category) | 0 (0.0%) | 0 (0.0%) |
| Total (Overall) | 21 (40.4%) | 31 (59.6%) |
Production, Transportation and Moving Occupations
The most common Production, Transportation and Moving occupations in Van Voorhis are , and Material Moving (9 | 17.3%).
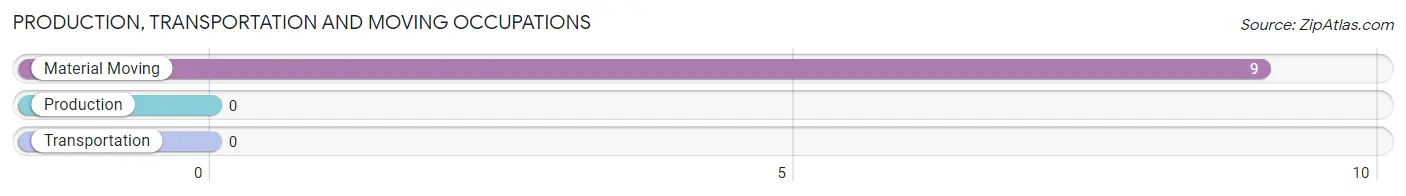
Production, Transportation and Moving Occupations by Sex
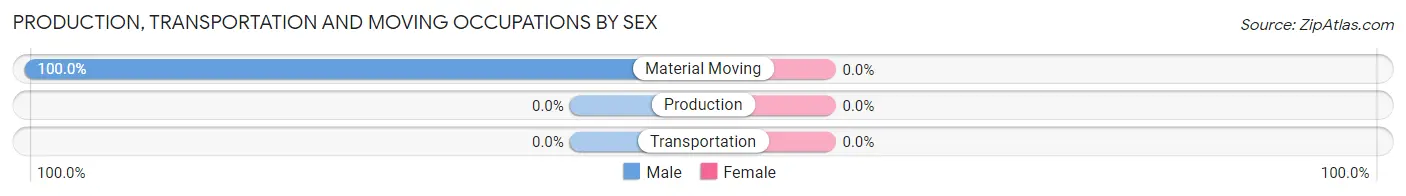
| Occupation | Male | Female |
| Production | 0 (0.0%) | 0 (0.0%) |
| Transportation | 0 (0.0%) | 0 (0.0%) |
| Material Moving | 9 (100.0%) | 0 (0.0%) |
| Total (Category) | 9 (100.0%) | 0 (0.0%) |
| Total (Overall) | 21 (40.4%) | 31 (59.6%) |
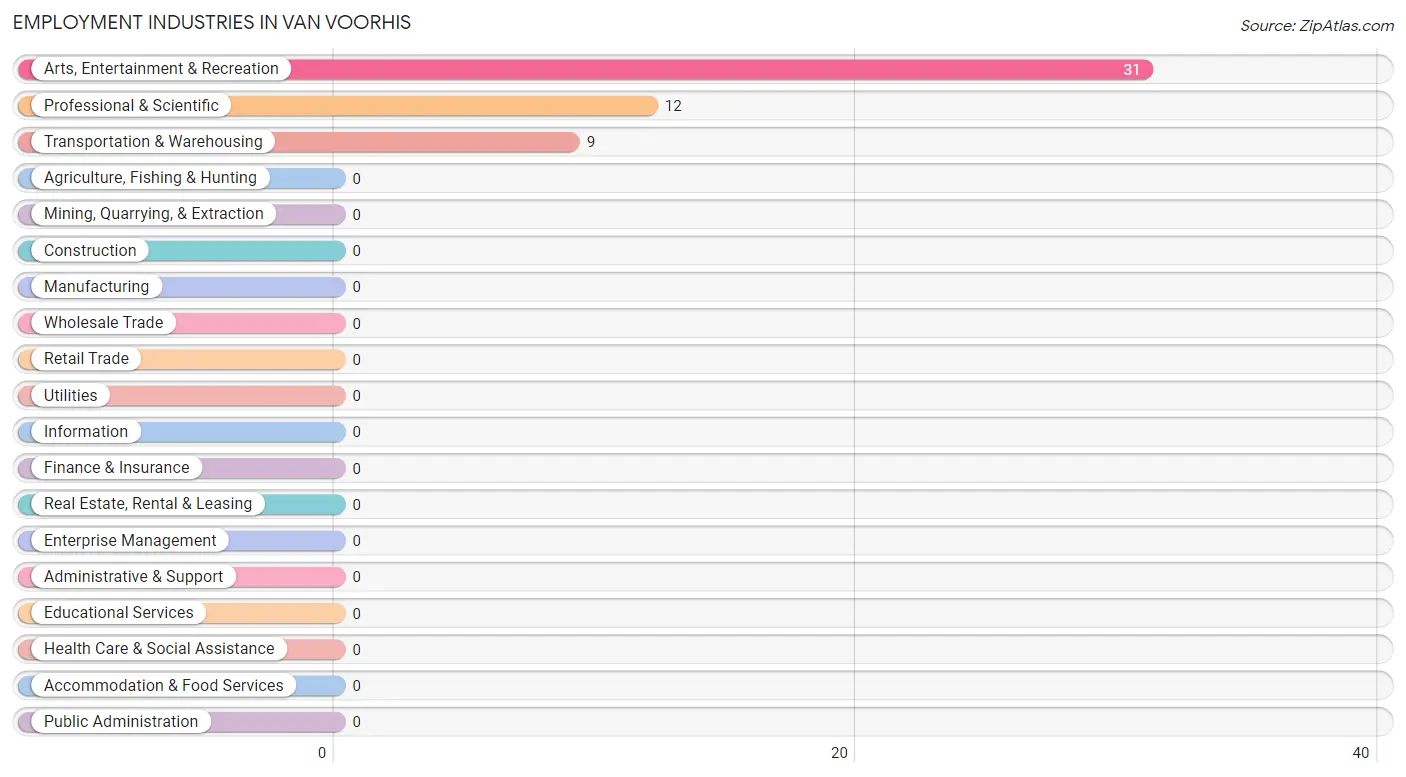
Employment Industries by Sex in Van Voorhis
Employment Industries in Van Voorhis
The major employment industries in Van Voorhis include Arts, Entertainment & Recreation (31 | 59.6%), Professional & Scientific (12 | 23.1%), and Transportation & Warehousing (9 | 17.3%).
Employment Industries by Sex in Van Voorhis
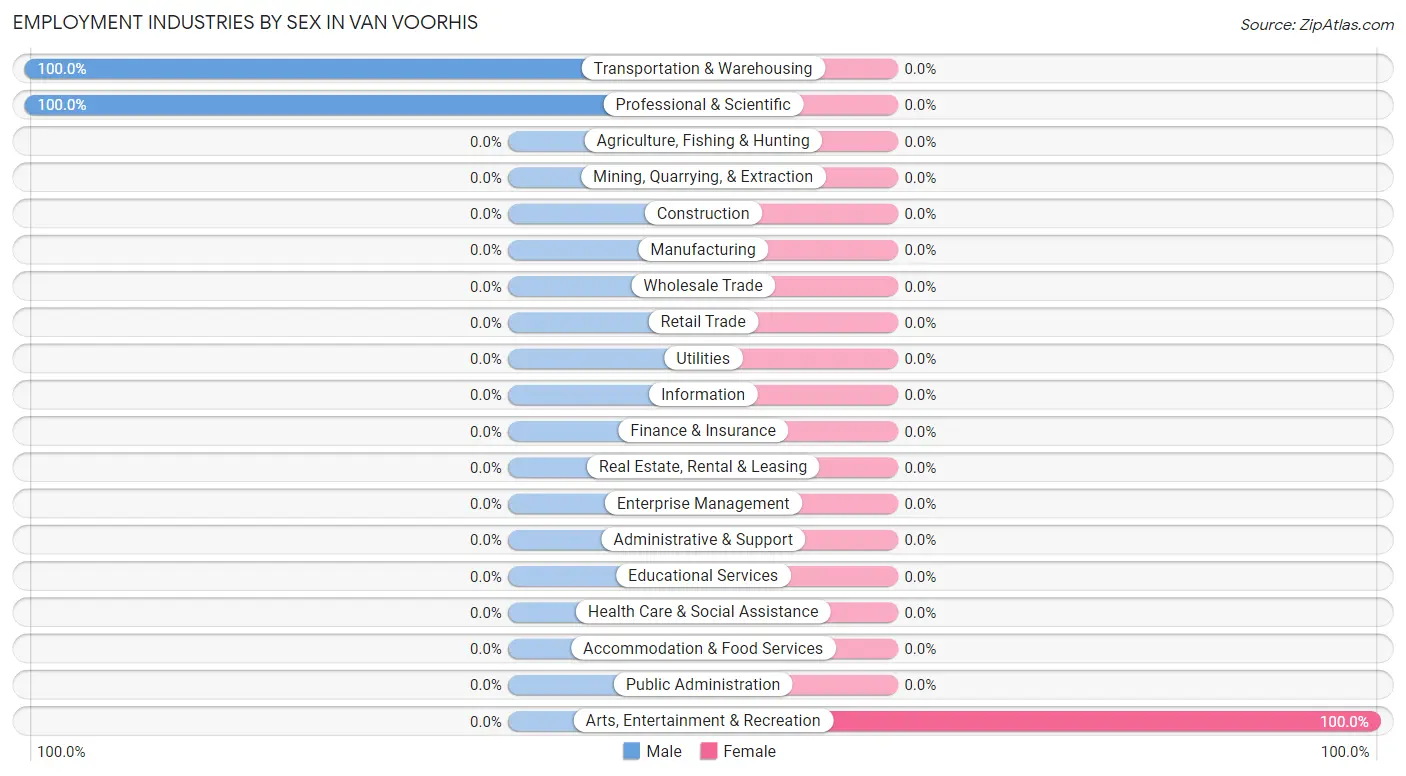
| Industry | Male | Female |
| Agriculture, Fishing & Hunting | 0 (0.0%) | 0 (0.0%) |
| Mining, Quarrying, & Extraction | 0 (0.0%) | 0 (0.0%) |
| Construction | 0 (0.0%) | 0 (0.0%) |
| Manufacturing | 0 (0.0%) | 0 (0.0%) |
| Wholesale Trade | 0 (0.0%) | 0 (0.0%) |
| Retail Trade | 0 (0.0%) | 0 (0.0%) |
| Transportation & Warehousing | 9 (100.0%) | 0 (0.0%) |
| Utilities | 0 (0.0%) | 0 (0.0%) |
| Information | 0 (0.0%) | 0 (0.0%) |
| Finance & Insurance | 0 (0.0%) | 0 (0.0%) |
| Real Estate, Rental & Leasing | 0 (0.0%) | 0 (0.0%) |
| Professional & Scientific | 12 (100.0%) | 0 (0.0%) |
| Enterprise Management | 0 (0.0%) | 0 (0.0%) |
| Administrative & Support | 0 (0.0%) | 0 (0.0%) |
| Educational Services | 0 (0.0%) | 0 (0.0%) |
| Health Care & Social Assistance | 0 (0.0%) | 0 (0.0%) |
| Arts, Entertainment & Recreation | 0 (0.0%) | 31 (100.0%) |
| Accommodation & Food Services | 0 (0.0%) | 0 (0.0%) |
| Public Administration | 0 (0.0%) | 0 (0.0%) |
| Total | 21 (40.4%) | 31 (59.6%) |
Education in Van Voorhis
School Enrollment in Van Voorhis
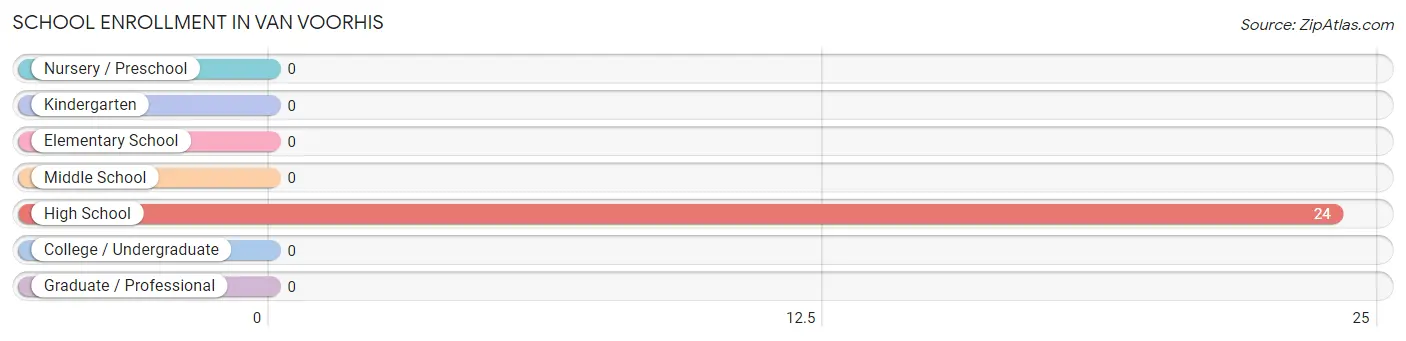
| School Level | # Students | % Students |
| Nursery / Preschool | 0 | 0.0% |
| Kindergarten | 0 | 0.0% |
| Elementary School | 0 | 0.0% |
| Middle School | 0 | 0.0% |
| High School | 24 | 100.0% |
| College / Undergraduate | 0 | 0.0% |
| Graduate / Professional | 0 | 0.0% |
| Total | 24 | 100.0% |
School Enrollment by Age by Funding Source in Van Voorhis
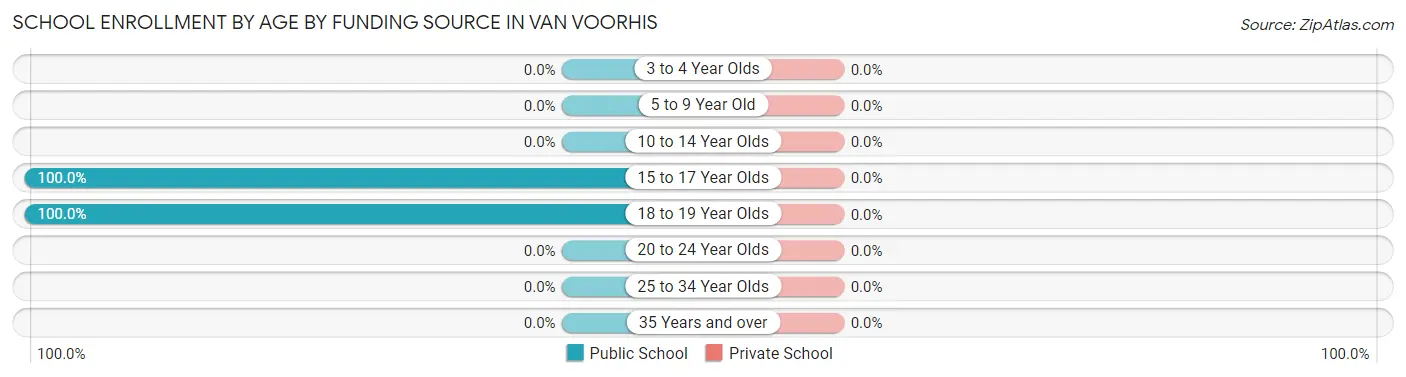
| Age Bracket | Public School | Private School |
| 3 to 4 Year Olds | 0 (0.0%) | 0 (0.0%) |
| 5 to 9 Year Old | 0 (0.0%) | 0 (0.0%) |
| 10 to 14 Year Olds | 0 (0.0%) | 0 (0.0%) |
| 15 to 17 Year Olds | 12 (100.0%) | 0 (0.0%) |
| 18 to 19 Year Olds | 12 (100.0%) | 0 (0.0%) |
| 20 to 24 Year Olds | 0 (0.0%) | 0 (0.0%) |
| 25 to 34 Year Olds | 0 (0.0%) | 0 (0.0%) |
| 35 Years and over | 0 (0.0%) | 0 (0.0%) |
| Total | 24 (100.0%) | 0 (0.0%) |
Educational Attainment by Field of Study in Van Voorhis
Business (33 | 73.3%), and education (12 | 26.7%) are the most common fields of study among 45 individuals in Van Voorhis who have obtained a bachelor's degree or higher.
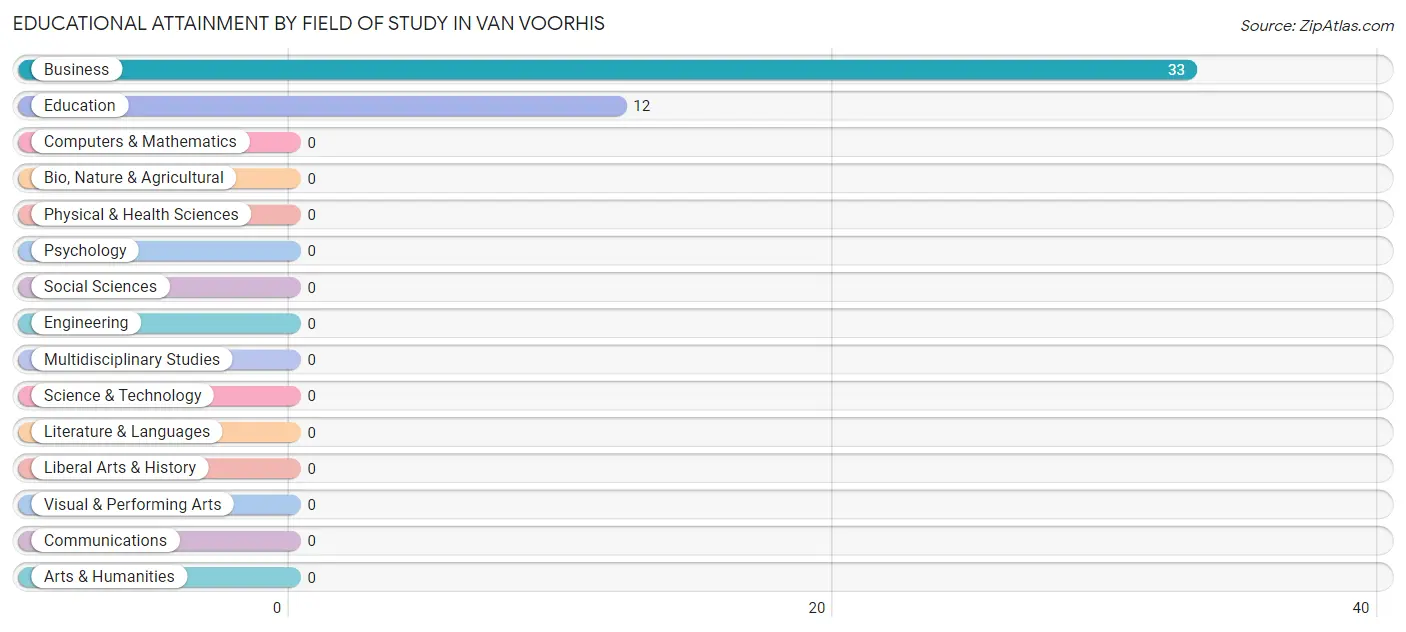
| Field of Study | # Graduates | % Graduates |
| Computers & Mathematics | 0 | 0.0% |
| Bio, Nature & Agricultural | 0 | 0.0% |
| Physical & Health Sciences | 0 | 0.0% |
| Psychology | 0 | 0.0% |
| Social Sciences | 0 | 0.0% |
| Engineering | 0 | 0.0% |
| Multidisciplinary Studies | 0 | 0.0% |
| Science & Technology | 0 | 0.0% |
| Business | 33 | 73.3% |
| Education | 12 | 26.7% |
| Literature & Languages | 0 | 0.0% |
| Liberal Arts & History | 0 | 0.0% |
| Visual & Performing Arts | 0 | 0.0% |
| Communications | 0 | 0.0% |
| Arts & Humanities | 0 | 0.0% |
| Total | 45 | 100.0% |
Transportation & Commute in Van Voorhis
Vehicle Availability by Sex in Van Voorhis
The most prevalent vehicle ownership categories in Van Voorhis are males with 2 vehicles (21, accounting for 100.0%) and females with 2 vehicles (0, making up 67.7%).
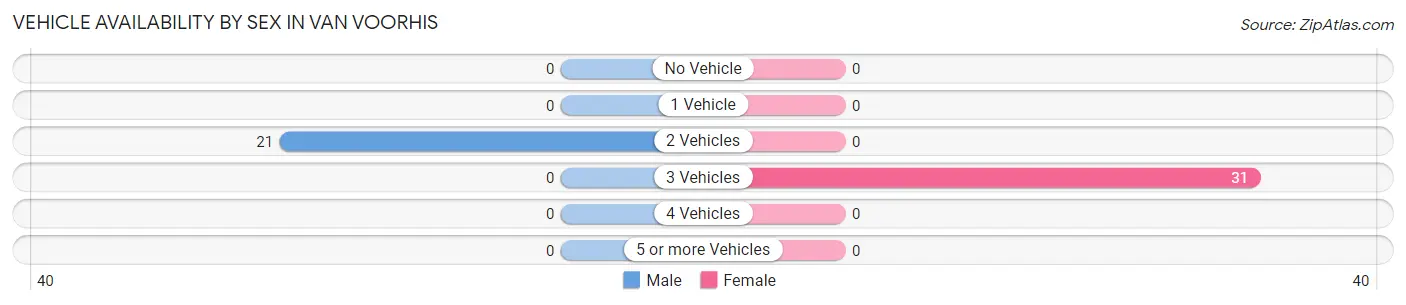
| Vehicles Available | Male | Female |
| No Vehicle | 0 (0.0%) | 0 (0.0%) |
| 1 Vehicle | 0 (0.0%) | 0 (0.0%) |
| 2 Vehicles | 21 (100.0%) | 0 (0.0%) |
| 3 Vehicles | 0 (0.0%) | 31 (100.0%) |
| 4 Vehicles | 0 (0.0%) | 0 (0.0%) |
| 5 or more Vehicles | 0 (0.0%) | 0 (0.0%) |
| Total | 21 (100.0%) | 31 (100.0%) |
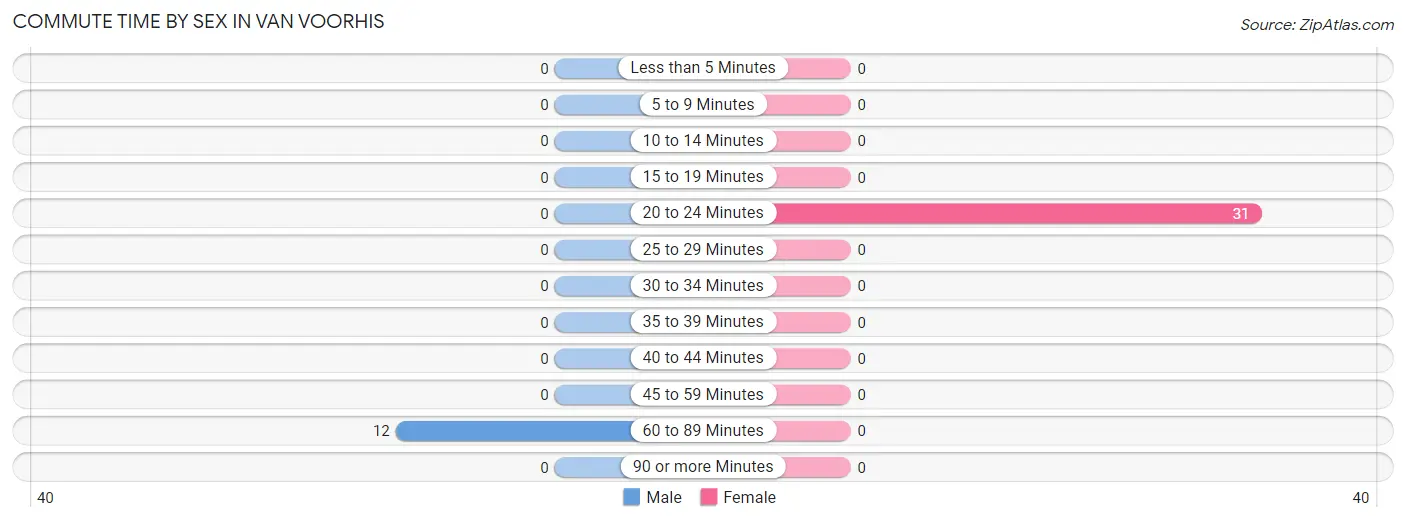
Commute Time in Van Voorhis
The most frequently occuring commute durations in Van Voorhis are 20 to 24 minutes (31 commuters, 72.1%), 60 to 89 minutes (12 commuters, 27.9%), and less than 5 minutes (0 commuters, 0.0%).
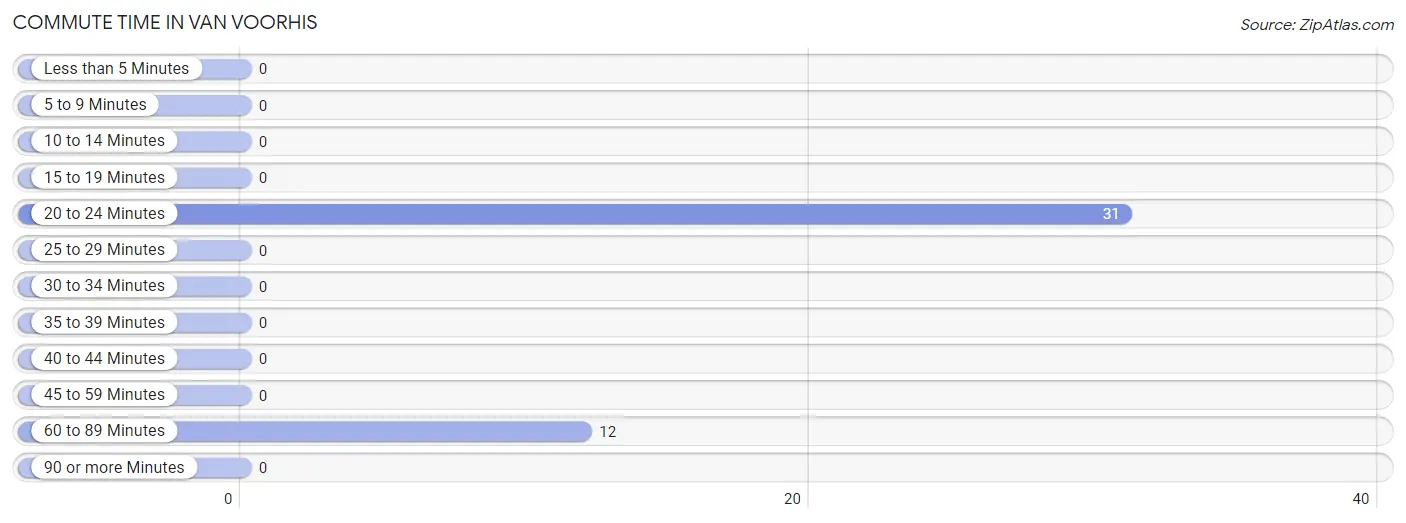
| Commute Time | # Commuters | % Commuters |
| Less than 5 Minutes | 0 | 0.0% |
| 5 to 9 Minutes | 0 | 0.0% |
| 10 to 14 Minutes | 0 | 0.0% |
| 15 to 19 Minutes | 0 | 0.0% |
| 20 to 24 Minutes | 31 | 72.1% |
| 25 to 29 Minutes | 0 | 0.0% |
| 30 to 34 Minutes | 0 | 0.0% |
| 35 to 39 Minutes | 0 | 0.0% |
| 40 to 44 Minutes | 0 | 0.0% |
| 45 to 59 Minutes | 0 | 0.0% |
| 60 to 89 Minutes | 12 | 27.9% |
| 90 or more Minutes | 0 | 0.0% |
Commute Time by Sex in Van Voorhis
The most common commute times in Van Voorhis are 60 to 89 minutes (12 commuters, 100.0%) for males and 20 to 24 minutes (31 commuters, 100.0%) for females.
| Commute Time | Male | Female |
| Less than 5 Minutes | 0 (0.0%) | 0 (0.0%) |
| 5 to 9 Minutes | 0 (0.0%) | 0 (0.0%) |
| 10 to 14 Minutes | 0 (0.0%) | 0 (0.0%) |
| 15 to 19 Minutes | 0 (0.0%) | 0 (0.0%) |
| 20 to 24 Minutes | 0 (0.0%) | 31 (100.0%) |
| 25 to 29 Minutes | 0 (0.0%) | 0 (0.0%) |
| 30 to 34 Minutes | 0 (0.0%) | 0 (0.0%) |
| 35 to 39 Minutes | 0 (0.0%) | 0 (0.0%) |
| 40 to 44 Minutes | 0 (0.0%) | 0 (0.0%) |
| 45 to 59 Minutes | 0 (0.0%) | 0 (0.0%) |
| 60 to 89 Minutes | 12 (100.0%) | 0 (0.0%) |
| 90 or more Minutes | 0 (0.0%) | 0 (0.0%) |
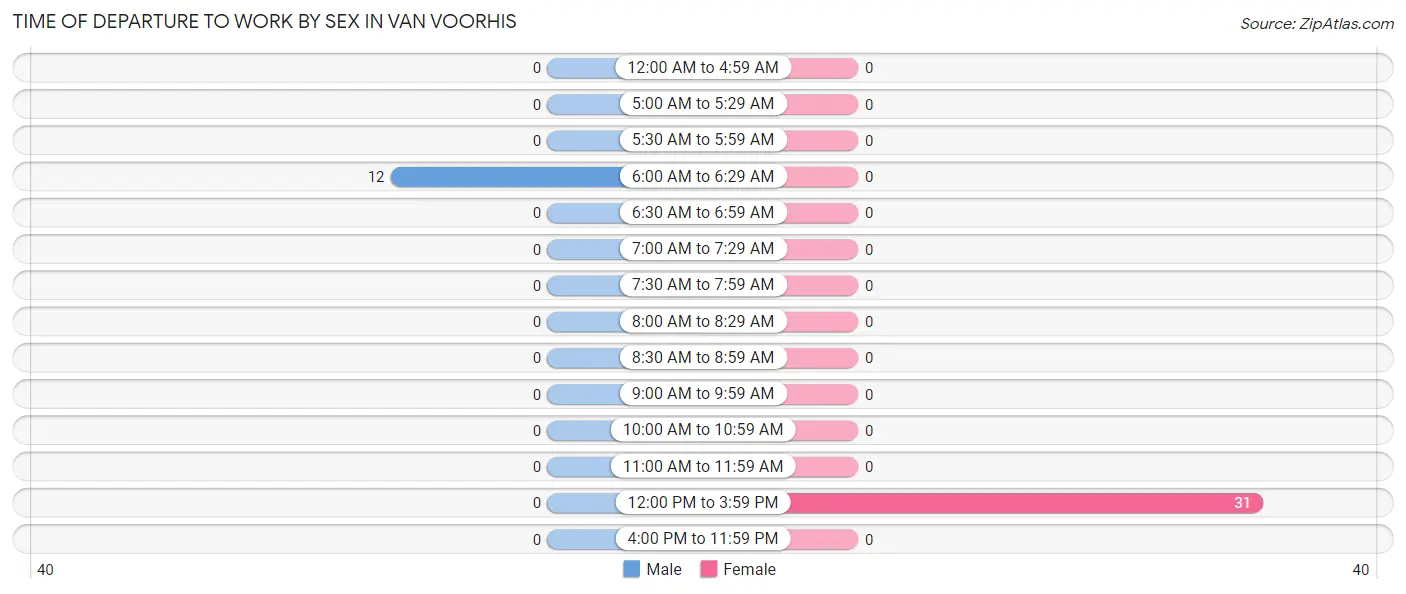
Time of Departure to Work by Sex in Van Voorhis
The most frequent times of departure to work in Van Voorhis are 6:00 AM to 6:29 AM (12, 100.0%) for males and 12:00 PM to 3:59 PM (31, 100.0%) for females.
| Time of Departure | Male | Female |
| 12:00 AM to 4:59 AM | 0 (0.0%) | 0 (0.0%) |
| 5:00 AM to 5:29 AM | 0 (0.0%) | 0 (0.0%) |
| 5:30 AM to 5:59 AM | 0 (0.0%) | 0 (0.0%) |
| 6:00 AM to 6:29 AM | 12 (100.0%) | 0 (0.0%) |
| 6:30 AM to 6:59 AM | 0 (0.0%) | 0 (0.0%) |
| 7:00 AM to 7:29 AM | 0 (0.0%) | 0 (0.0%) |
| 7:30 AM to 7:59 AM | 0 (0.0%) | 0 (0.0%) |
| 8:00 AM to 8:29 AM | 0 (0.0%) | 0 (0.0%) |
| 8:30 AM to 8:59 AM | 0 (0.0%) | 0 (0.0%) |
| 9:00 AM to 9:59 AM | 0 (0.0%) | 0 (0.0%) |
| 10:00 AM to 10:59 AM | 0 (0.0%) | 0 (0.0%) |
| 11:00 AM to 11:59 AM | 0 (0.0%) | 0 (0.0%) |
| 12:00 PM to 3:59 PM | 0 (0.0%) | 31 (100.0%) |
| 4:00 PM to 11:59 PM | 0 (0.0%) | 0 (0.0%) |
| Total | 12 (100.0%) | 31 (100.0%) |
Housing Occupancy in Van Voorhis
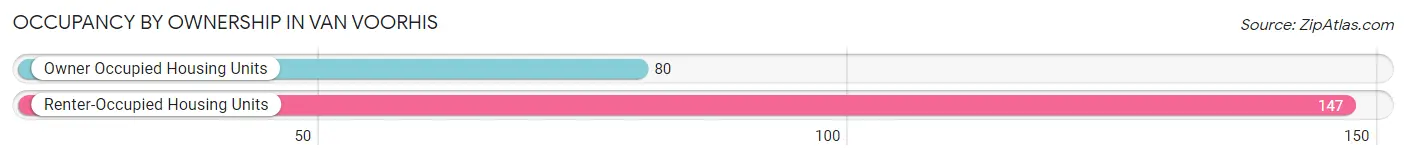
Occupancy by Ownership in Van Voorhis
Of the total 227 dwellings in Van Voorhis, owner-occupied units account for 80 (35.2%), while renter-occupied units make up 147 (64.8%).
| Occupancy | # Housing Units | % Housing Units |
| Owner Occupied Housing Units | 80 | 35.2% |
| Renter-Occupied Housing Units | 147 | 64.8% |
| Total Occupied Housing Units | 227 | 100.0% |
Occupancy by Household Size in Van Voorhis
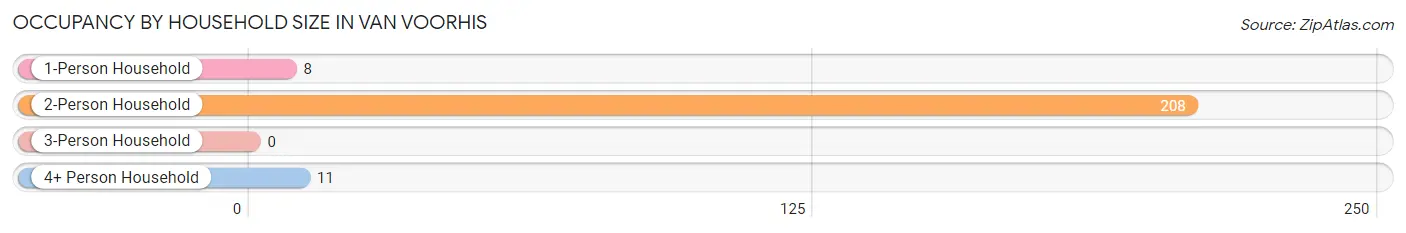
| Household Size | # Housing Units | % Housing Units |
| 1-Person Household | 8 | 3.5% |
| 2-Person Household | 208 | 91.6% |
| 3-Person Household | 0 | 0.0% |
| 4+ Person Household | 11 | 4.9% |
| Total Housing Units | 227 | 100.0% |
Occupancy by Ownership by Household Size in Van Voorhis
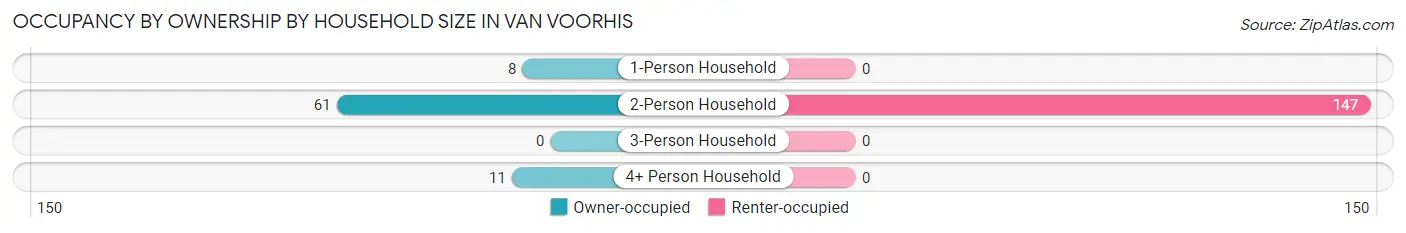
| Household Size | Owner-occupied | Renter-occupied |
| 1-Person Household | 8 (100.0%) | 0 (0.0%) |
| 2-Person Household | 61 (29.3%) | 147 (70.7%) |
| 3-Person Household | 0 (0.0%) | 0 (0.0%) |
| 4+ Person Household | 11 (100.0%) | 0 (0.0%) |
| Total Housing Units | 80 (35.2%) | 147 (64.8%) |
Occupancy by Educational Attainment in Van Voorhis
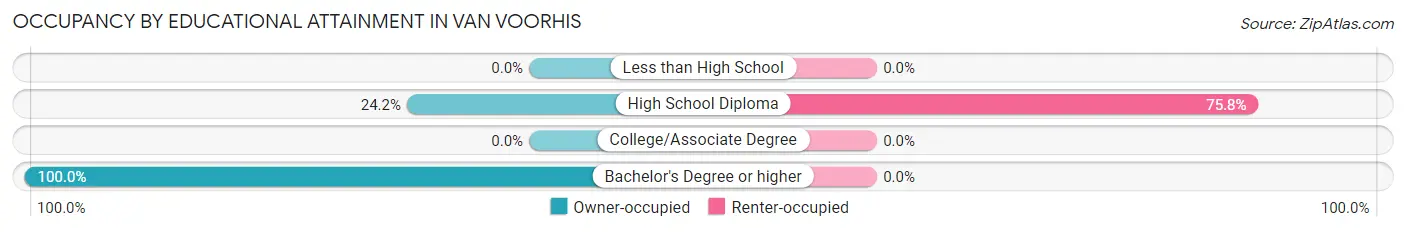
| Household Size | Owner-occupied | Renter-occupied |
| Less than High School | 0 (0.0%) | 0 (0.0%) |
| High School Diploma | 47 (24.2%) | 147 (75.8%) |
| College/Associate Degree | 0 (0.0%) | 0 (0.0%) |
| Bachelor's Degree or higher | 33 (100.0%) | 0 (0.0%) |
Occupancy by Age of Householder in Van Voorhis
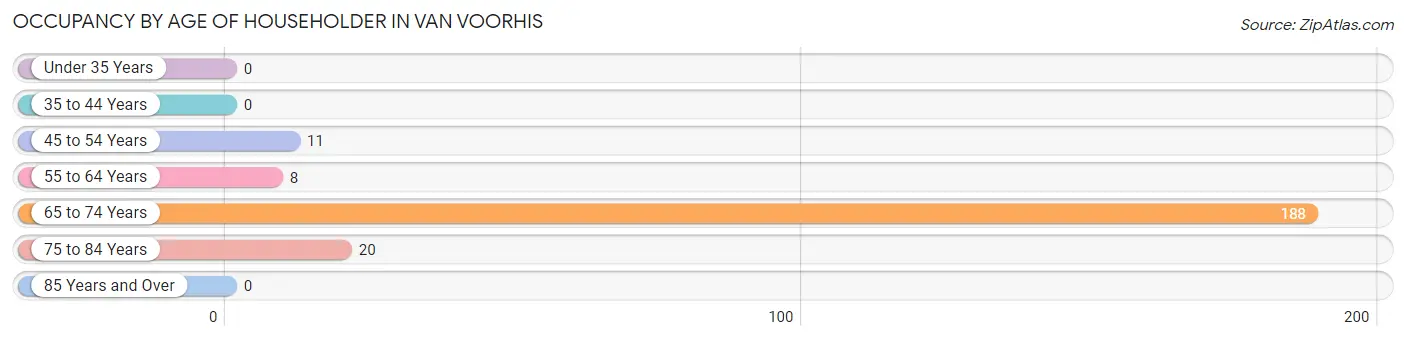
| Age Bracket | # Households | % Households |
| Under 35 Years | 0 | 0.0% |
| 35 to 44 Years | 0 | 0.0% |
| 45 to 54 Years | 11 | 4.9% |
| 55 to 64 Years | 8 | 3.5% |
| 65 to 74 Years | 188 | 82.8% |
| 75 to 84 Years | 20 | 8.8% |
| 85 Years and Over | 0 | 0.0% |
| Total | 227 | 100.0% |
Housing Finances in Van Voorhis
Median Income by Occupancy in Van Voorhis
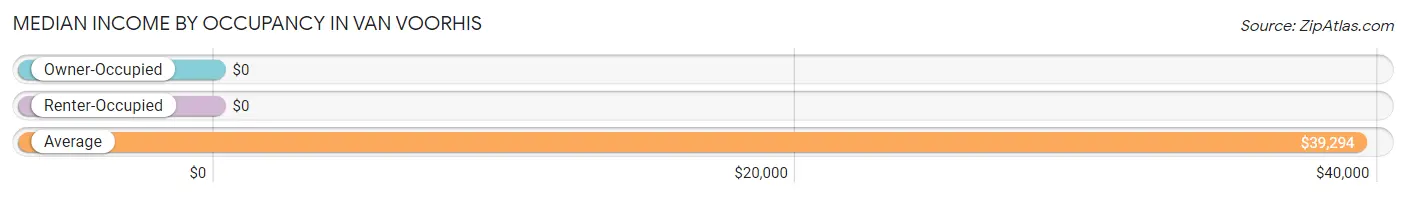
| Occupancy Type | # Households | Median Income |
| Owner-Occupied | 80 (35.2%) | $0 |
| Renter-Occupied | 147 (64.8%) | $0 |
| Average | 227 (100.0%) | $39,294 |
Occupancy by Householder Income Bracket in Van Voorhis
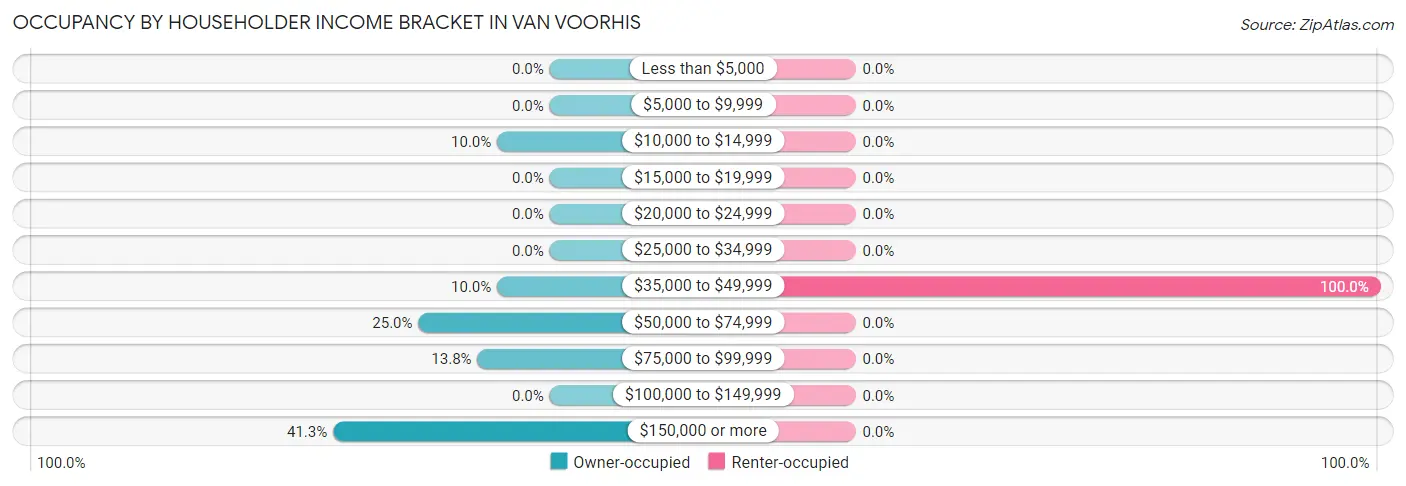
| Income Bracket | Owner-occupied | Renter-occupied |
| Less than $5,000 | 0 (0.0%) | 0 (0.0%) |
| $5,000 to $9,999 | 0 (0.0%) | 0 (0.0%) |
| $10,000 to $14,999 | 8 (10.0%) | 0 (0.0%) |
| $15,000 to $19,999 | 0 (0.0%) | 0 (0.0%) |
| $20,000 to $24,999 | 0 (0.0%) | 0 (0.0%) |
| $25,000 to $34,999 | 0 (0.0%) | 0 (0.0%) |
| $35,000 to $49,999 | 8 (10.0%) | 147 (100.0%) |
| $50,000 to $74,999 | 20 (25.0%) | 0 (0.0%) |
| $75,000 to $99,999 | 11 (13.8%) | 0 (0.0%) |
| $100,000 to $149,999 | 0 (0.0%) | 0 (0.0%) |
| $150,000 or more | 33 (41.2%) | 0 (0.0%) |
| Total | 80 (100.0%) | 147 (100.0%) |
Monthly Housing Cost Tiers in Van Voorhis
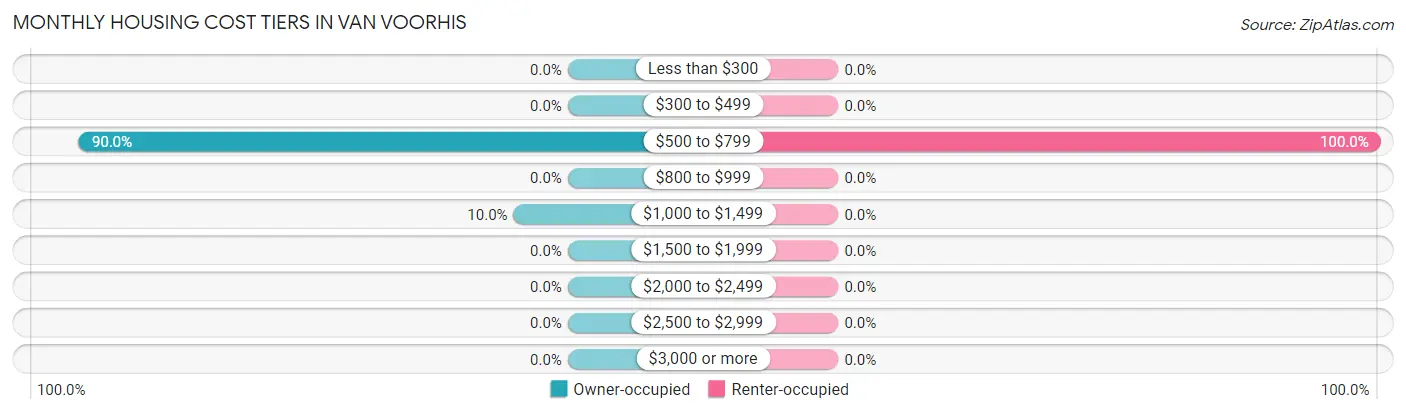
| Monthly Cost | Owner-occupied | Renter-occupied |
| Less than $300 | 0 (0.0%) | 0 (0.0%) |
| $300 to $499 | 0 (0.0%) | 0 (0.0%) |
| $500 to $799 | 72 (90.0%) | 147 (100.0%) |
| $800 to $999 | 0 (0.0%) | 0 (0.0%) |
| $1,000 to $1,499 | 8 (10.0%) | 0 (0.0%) |
| $1,500 to $1,999 | 0 (0.0%) | 0 (0.0%) |
| $2,000 to $2,499 | 0 (0.0%) | 0 (0.0%) |
| $2,500 to $2,999 | 0 (0.0%) | 0 (0.0%) |
| $3,000 or more | 0 (0.0%) | 0 (0.0%) |
| Total | 80 (100.0%) | 147 (100.0%) |
Physical Housing Characteristics in Van Voorhis
Housing Structures in Van Voorhis
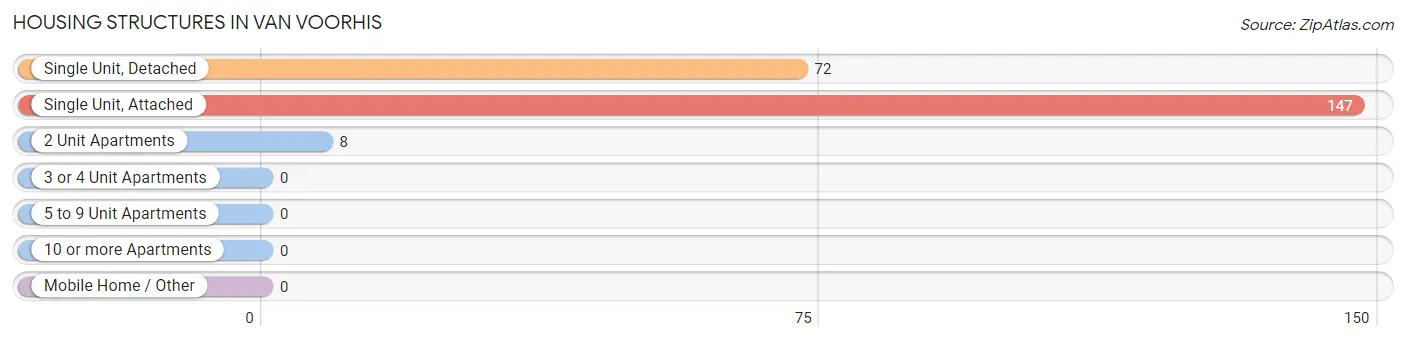
| Structure Type | # Housing Units | % Housing Units |
| Single Unit, Detached | 72 | 31.7% |
| Single Unit, Attached | 147 | 64.8% |
| 2 Unit Apartments | 8 | 3.5% |
| 3 or 4 Unit Apartments | 0 | 0.0% |
| 5 to 9 Unit Apartments | 0 | 0.0% |
| 10 or more Apartments | 0 | 0.0% |
| Mobile Home / Other | 0 | 0.0% |
| Total | 227 | 100.0% |
Housing Structures by Occupancy in Van Voorhis
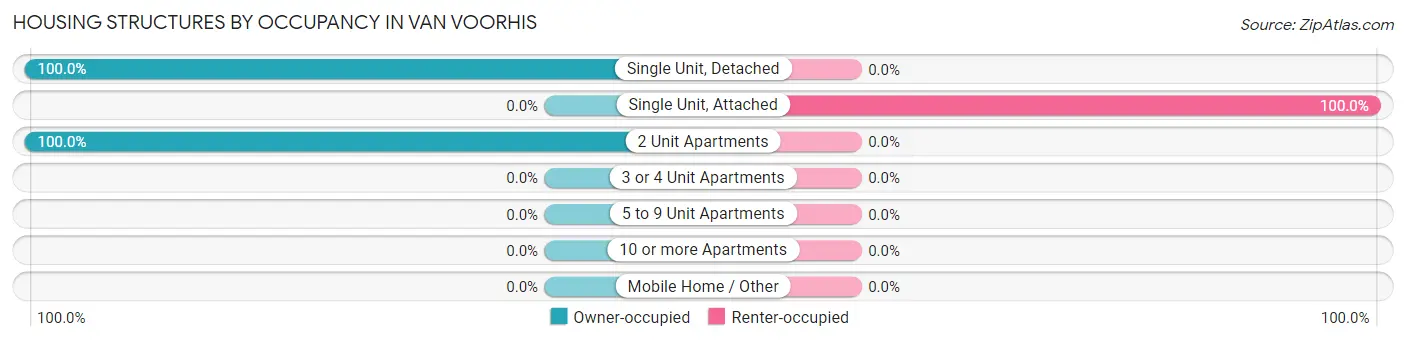
| Structure Type | Owner-occupied | Renter-occupied |
| Single Unit, Detached | 72 (100.0%) | 0 (0.0%) |
| Single Unit, Attached | 0 (0.0%) | 147 (100.0%) |
| 2 Unit Apartments | 8 (100.0%) | 0 (0.0%) |
| 3 or 4 Unit Apartments | 0 (0.0%) | 0 (0.0%) |
| 5 to 9 Unit Apartments | 0 (0.0%) | 0 (0.0%) |
| 10 or more Apartments | 0 (0.0%) | 0 (0.0%) |
| Mobile Home / Other | 0 (0.0%) | 0 (0.0%) |
| Total | 80 (35.2%) | 147 (64.8%) |
Housing Structures by Number of Rooms in Van Voorhis
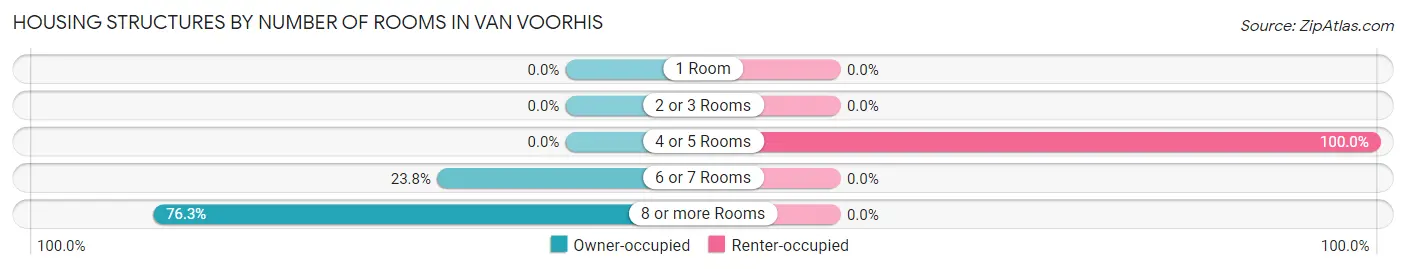
| Number of Rooms | Owner-occupied | Renter-occupied |
| 1 Room | 0 (0.0%) | 0 (0.0%) |
| 2 or 3 Rooms | 0 (0.0%) | 0 (0.0%) |
| 4 or 5 Rooms | 0 (0.0%) | 147 (100.0%) |
| 6 or 7 Rooms | 19 (23.7%) | 0 (0.0%) |
| 8 or more Rooms | 61 (76.2%) | 0 (0.0%) |
| Total | 80 (100.0%) | 147 (100.0%) |
Housing Structure by Heating Type in Van Voorhis
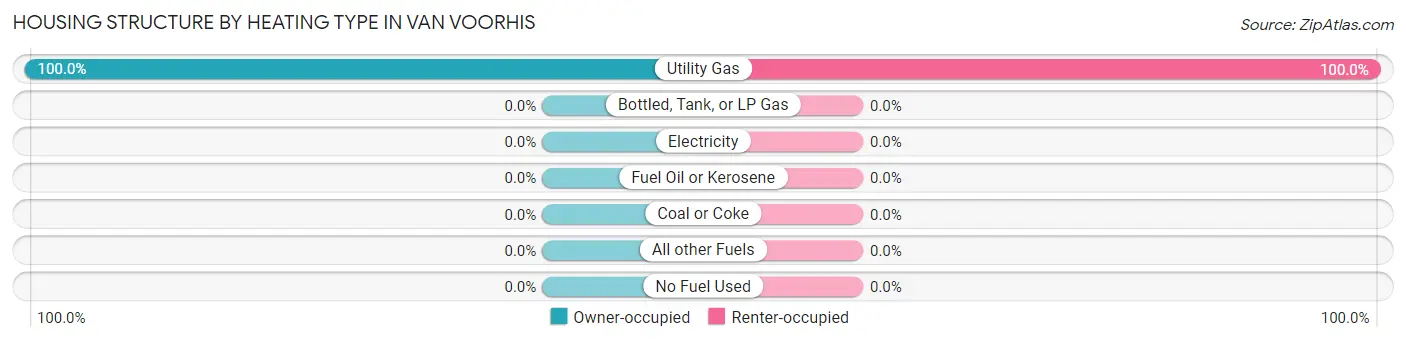
| Heating Type | Owner-occupied | Renter-occupied |
| Utility Gas | 80 (100.0%) | 147 (100.0%) |
| Bottled, Tank, or LP Gas | 0 (0.0%) | 0 (0.0%) |
| Electricity | 0 (0.0%) | 0 (0.0%) |
| Fuel Oil or Kerosene | 0 (0.0%) | 0 (0.0%) |
| Coal or Coke | 0 (0.0%) | 0 (0.0%) |
| All other Fuels | 0 (0.0%) | 0 (0.0%) |
| No Fuel Used | 0 (0.0%) | 0 (0.0%) |
| Total | 80 (100.0%) | 147 (100.0%) |
Household Vehicle Usage in Van Voorhis
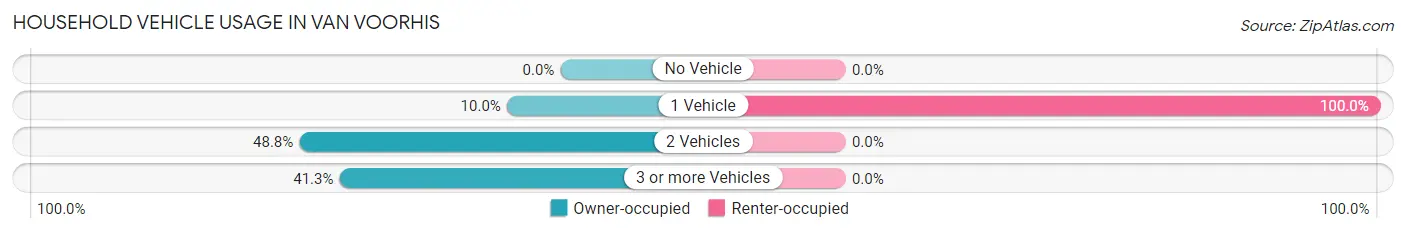
| Vehicles per Household | Owner-occupied | Renter-occupied |
| No Vehicle | 0 (0.0%) | 0 (0.0%) |
| 1 Vehicle | 8 (10.0%) | 147 (100.0%) |
| 2 Vehicles | 39 (48.7%) | 0 (0.0%) |
| 3 or more Vehicles | 33 (41.2%) | 0 (0.0%) |
| Total | 80 (100.0%) | 147 (100.0%) |
Real Estate & Mortgages in Van Voorhis
Real Estate and Mortgage Overview in Van Voorhis
| Characteristic | Without Mortgage | With Mortgage |
| Housing Units | 41 | 39 |
| Median Property Value | - | - |
| Median Household Income | - | - |
| Monthly Housing Costs | - | - |
| Real Estate Taxes | - | - |
Property Value by Mortgage Status in Van Voorhis
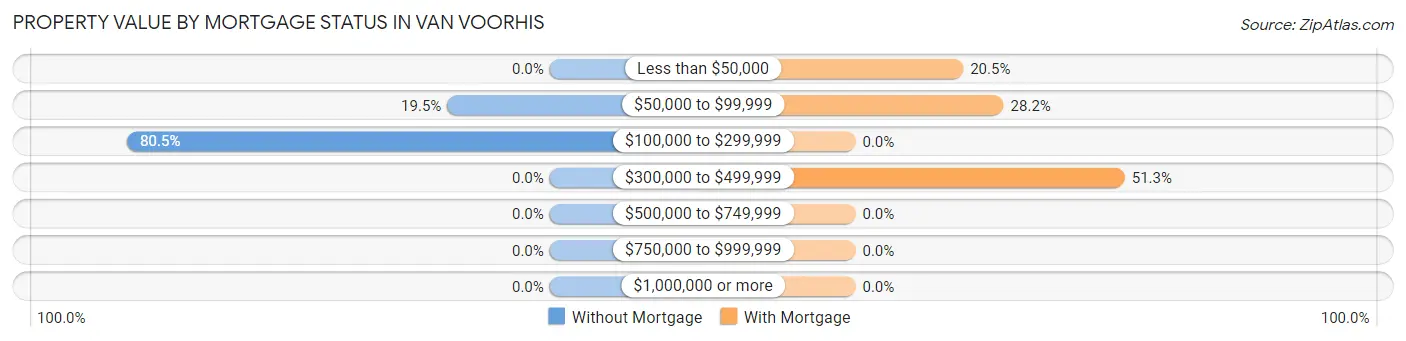
| Property Value | Without Mortgage | With Mortgage |
| Less than $50,000 | 0 (0.0%) | 8 (20.5%) |
| $50,000 to $99,999 | 8 (19.5%) | 11 (28.2%) |
| $100,000 to $299,999 | 33 (80.5%) | 0 (0.0%) |
| $300,000 to $499,999 | 0 (0.0%) | 20 (51.3%) |
| $500,000 to $749,999 | 0 (0.0%) | 0 (0.0%) |
| $750,000 to $999,999 | 0 (0.0%) | 0 (0.0%) |
| $1,000,000 or more | 0 (0.0%) | 0 (0.0%) |
| Total | 41 (100.0%) | 39 (100.0%) |
Household Income by Mortgage Status in Van Voorhis
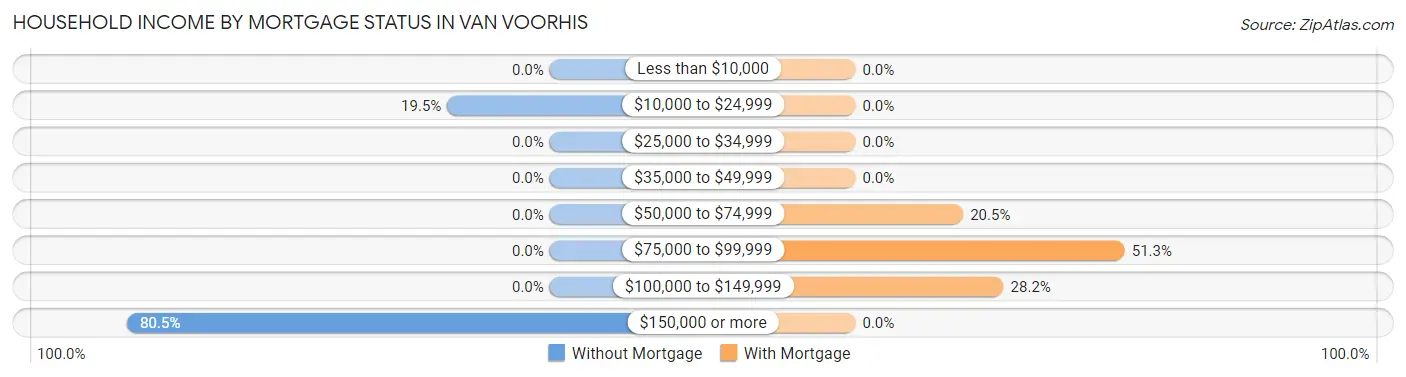
| Household Income | Without Mortgage | With Mortgage |
| Less than $10,000 | 0 (0.0%) | 0 (0.0%) |
| $10,000 to $24,999 | 8 (19.5%) | 0 (0.0%) |
| $25,000 to $34,999 | 0 (0.0%) | 0 (0.0%) |
| $35,000 to $49,999 | 0 (0.0%) | 0 (0.0%) |
| $50,000 to $74,999 | 0 (0.0%) | 8 (20.5%) |
| $75,000 to $99,999 | 0 (0.0%) | 20 (51.3%) |
| $100,000 to $149,999 | 0 (0.0%) | 11 (28.2%) |
| $150,000 or more | 33 (80.5%) | 0 (0.0%) |
| Total | 41 (100.0%) | 39 (100.0%) |
Property Value to Household Income Ratio in Van Voorhis
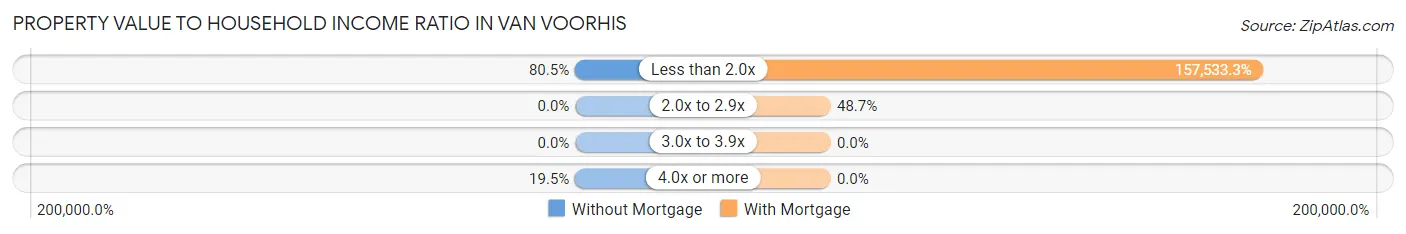
| Value-to-Income Ratio | Without Mortgage | With Mortgage |
| Less than 2.0x | 33 (80.5%) | 61,438 (157,533.3%) |
| 2.0x to 2.9x | 0 (0.0%) | 19 (48.7%) |
| 3.0x to 3.9x | 0 (0.0%) | 0 (0.0%) |
| 4.0x or more | 8 (19.5%) | 0 (0.0%) |
| Total | 41 (100.0%) | 39 (100.0%) |
Real Estate Taxes by Mortgage Status in Van Voorhis
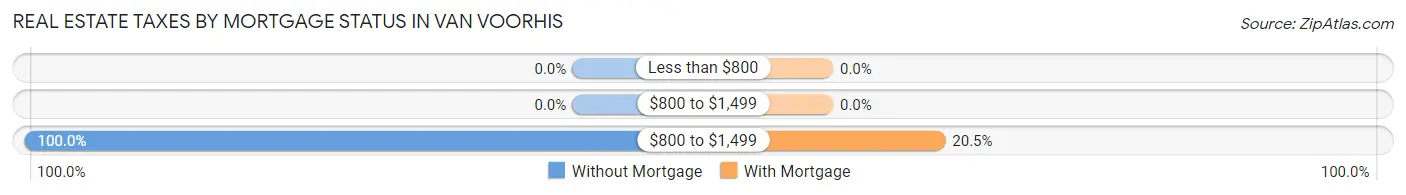
| Property Taxes | Without Mortgage | With Mortgage |
| Less than $800 | 0 (0.0%) | 0 (0.0%) |
| $800 to $1,499 | 0 (0.0%) | 0 (0.0%) |
| $800 to $1,499 | 41 (100.0%) | 8 (20.5%) |
| Total | 41 (100.0%) | 39 (100.0%) |
Health & Disability in Van Voorhis
Health Insurance Coverage by Age in Van Voorhis
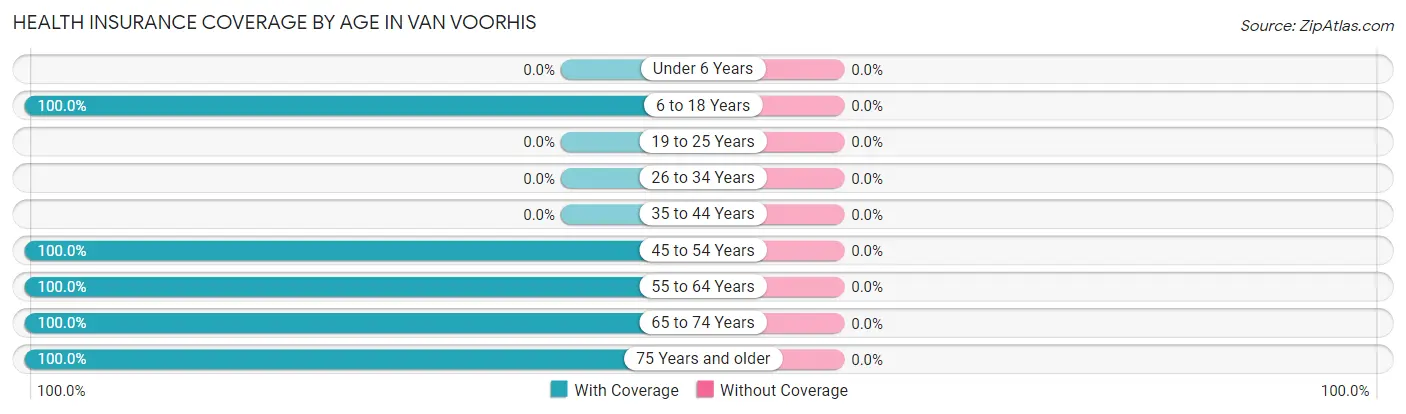
| Age Bracket | With Coverage | Without Coverage |
| Under 6 Years | 0 (0.0%) | 0 (0.0%) |
| 6 to 18 Years | 24 (100.0%) | 0 (0.0%) |
| 19 to 25 Years | 0 (0.0%) | 0 (0.0%) |
| 26 to 34 Years | 0 (0.0%) | 0 (0.0%) |
| 35 to 44 Years | 0 (0.0%) | 0 (0.0%) |
| 45 to 54 Years | 32 (100.0%) | 0 (0.0%) |
| 55 to 64 Years | 60 (100.0%) | 0 (0.0%) |
| 65 to 74 Years | 332 (100.0%) | 0 (0.0%) |
| 75 Years and older | 20 (100.0%) | 0 (0.0%) |
| Total | 468 (100.0%) | 0 (0.0%) |
Health Insurance Coverage by Citizenship Status in Van Voorhis
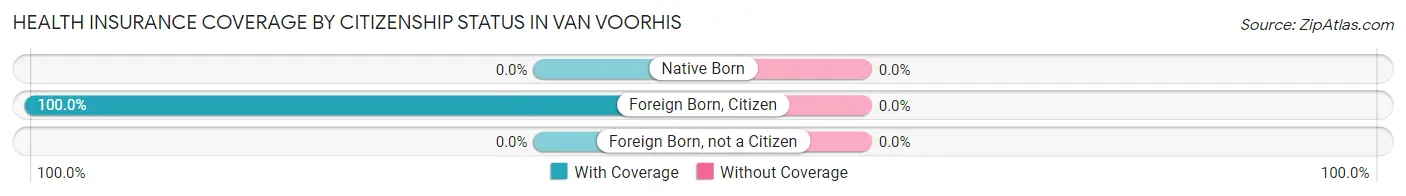
| Citizenship Status | With Coverage | Without Coverage |
| Native Born | 0 (0.0%) | 0 (0.0%) |
| Foreign Born, Citizen | 24 (100.0%) | 0 (0.0%) |
| Foreign Born, not a Citizen | 0 (0.0%) | 0 (0.0%) |
Health Insurance Coverage by Household Income in Van Voorhis
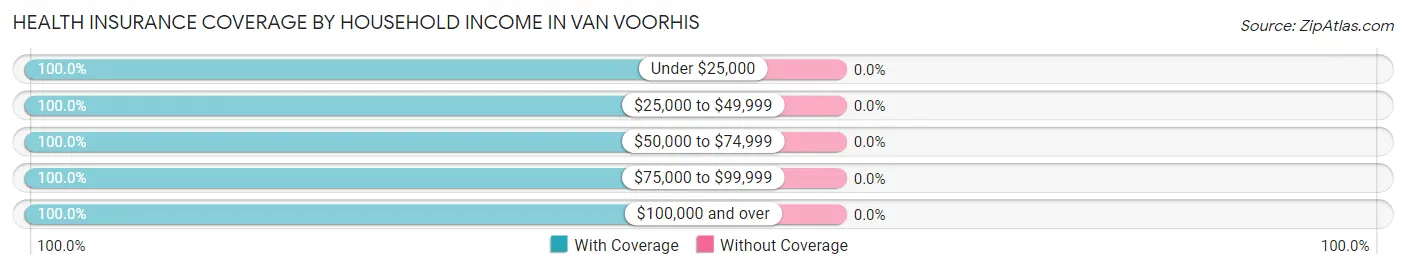
| Household Income | With Coverage | Without Coverage |
| Under $25,000 | 8 (100.0%) | 0 (0.0%) |
| $25,000 to $49,999 | 308 (100.0%) | 0 (0.0%) |
| $50,000 to $74,999 | 41 (100.0%) | 0 (0.0%) |
| $75,000 to $99,999 | 47 (100.0%) | 0 (0.0%) |
| $100,000 and over | 64 (100.0%) | 0 (0.0%) |
Public vs Private Health Insurance Coverage by Age in Van Voorhis
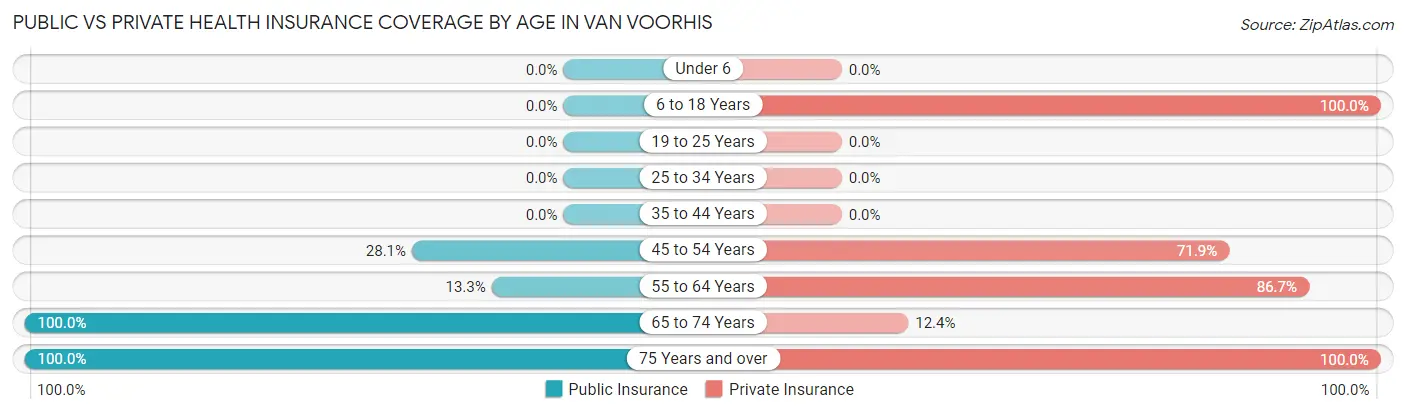
| Age Bracket | Public Insurance | Private Insurance |
| Under 6 | 0 (0.0%) | 0 (0.0%) |
| 6 to 18 Years | 0 (0.0%) | 24 (100.0%) |
| 19 to 25 Years | 0 (0.0%) | 0 (0.0%) |
| 25 to 34 Years | 0 (0.0%) | 0 (0.0%) |
| 35 to 44 Years | 0 (0.0%) | 0 (0.0%) |
| 45 to 54 Years | 9 (28.1%) | 23 (71.9%) |
| 55 to 64 Years | 8 (13.3%) | 52 (86.7%) |
| 65 to 74 Years | 332 (100.0%) | 41 (12.3%) |
| 75 Years and over | 20 (100.0%) | 20 (100.0%) |
| Total | 369 (78.8%) | 160 (34.2%) |
Disability Status by Sex by Age in Van Voorhis
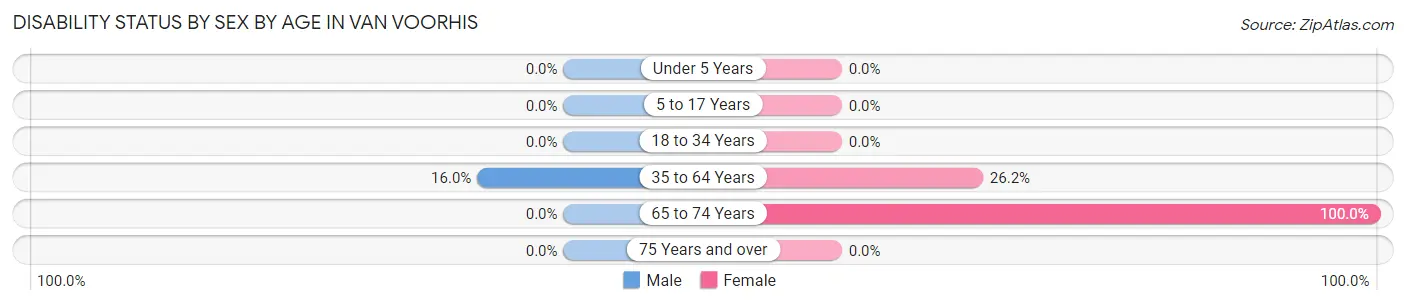
| Age Bracket | Male | Female |
| Under 5 Years | 0 (0.0%) | 0 (0.0%) |
| 5 to 17 Years | 0 (0.0%) | 0 (0.0%) |
| 18 to 34 Years | 0 (0.0%) | 0 (0.0%) |
| 35 to 64 Years | 8 (16.0%) | 11 (26.2%) |
| 65 to 74 Years | 0 (0.0%) | 147 (100.0%) |
| 75 Years and over | 0 (0.0%) | 0 (0.0%) |
Disability Class by Sex by Age in Van Voorhis
Disability Class: Hearing Difficulty
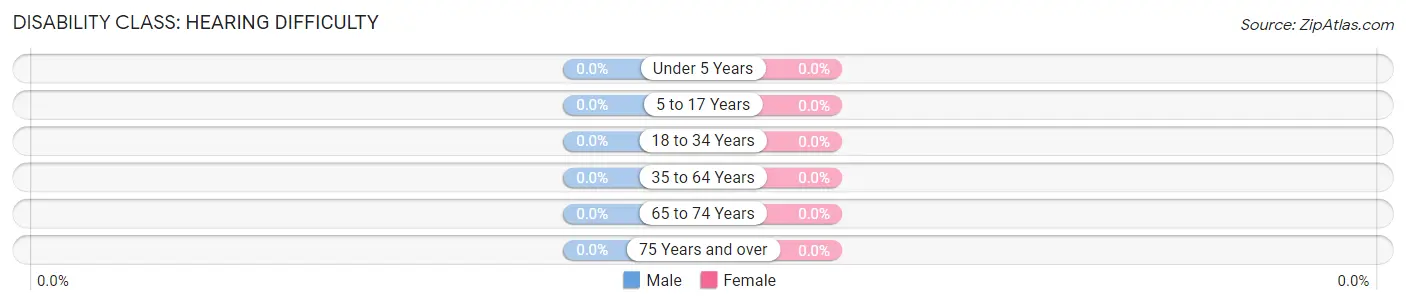
| Age Bracket | Male | Female |
| Under 5 Years | 0 (0.0%) | 0 (0.0%) |
| 5 to 17 Years | 0 (0.0%) | 0 (0.0%) |
| 18 to 34 Years | 0 (0.0%) | 0 (0.0%) |
| 35 to 64 Years | 0 (0.0%) | 0 (0.0%) |
| 65 to 74 Years | 0 (0.0%) | 0 (0.0%) |
| 75 Years and over | 0 (0.0%) | 0 (0.0%) |
Disability Class: Vision Difficulty
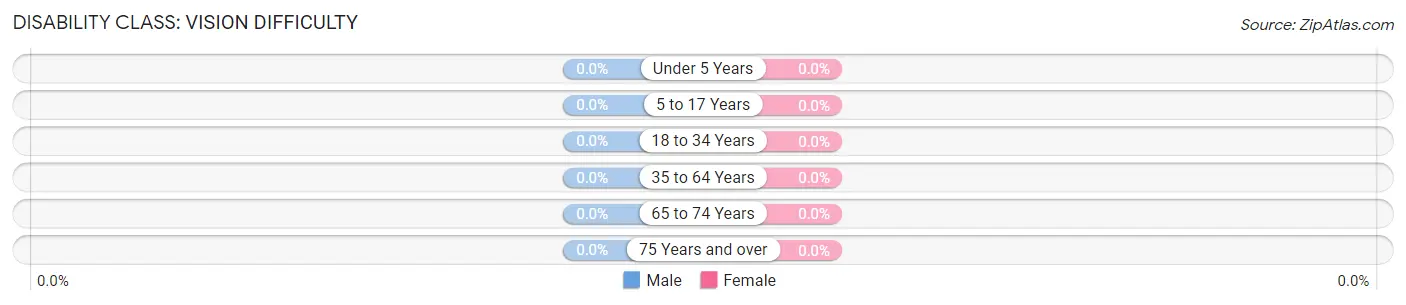
| Age Bracket | Male | Female |
| Under 5 Years | 0 (0.0%) | 0 (0.0%) |
| 5 to 17 Years | 0 (0.0%) | 0 (0.0%) |
| 18 to 34 Years | 0 (0.0%) | 0 (0.0%) |
| 35 to 64 Years | 0 (0.0%) | 0 (0.0%) |
| 65 to 74 Years | 0 (0.0%) | 0 (0.0%) |
| 75 Years and over | 0 (0.0%) | 0 (0.0%) |
Disability Class: Cognitive Difficulty
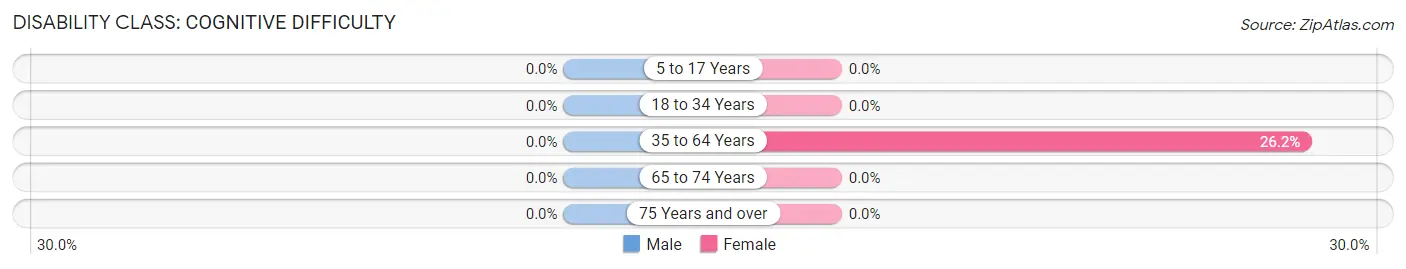
| Age Bracket | Male | Female |
| 5 to 17 Years | 0 (0.0%) | 0 (0.0%) |
| 18 to 34 Years | 0 (0.0%) | 0 (0.0%) |
| 35 to 64 Years | 0 (0.0%) | 11 (26.2%) |
| 65 to 74 Years | 0 (0.0%) | 0 (0.0%) |
| 75 Years and over | 0 (0.0%) | 0 (0.0%) |
Disability Class: Ambulatory Difficulty
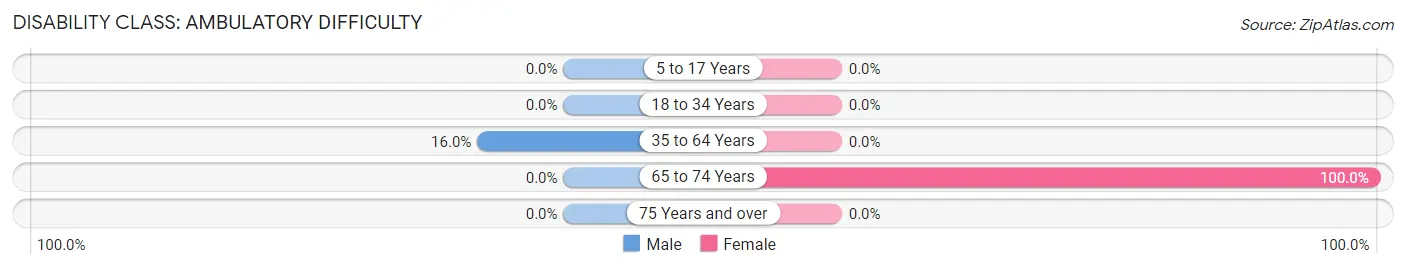
| Age Bracket | Male | Female |
| 5 to 17 Years | 0 (0.0%) | 0 (0.0%) |
| 18 to 34 Years | 0 (0.0%) | 0 (0.0%) |
| 35 to 64 Years | 8 (16.0%) | 0 (0.0%) |
| 65 to 74 Years | 0 (0.0%) | 147 (100.0%) |
| 75 Years and over | 0 (0.0%) | 0 (0.0%) |
Disability Class: Self-Care Difficulty
| Age Bracket | Male | Female |
| 5 to 17 Years | 0 (0.0%) | 0 (0.0%) |
| 18 to 34 Years | 0 (0.0%) | 0 (0.0%) |
| 35 to 64 Years | 0 (0.0%) | 0 (0.0%) |
| 65 to 74 Years | 0 (0.0%) | 0 (0.0%) |
| 75 Years and over | 0 (0.0%) | 0 (0.0%) |
Technology Access in Van Voorhis
Computing Device Access in Van Voorhis
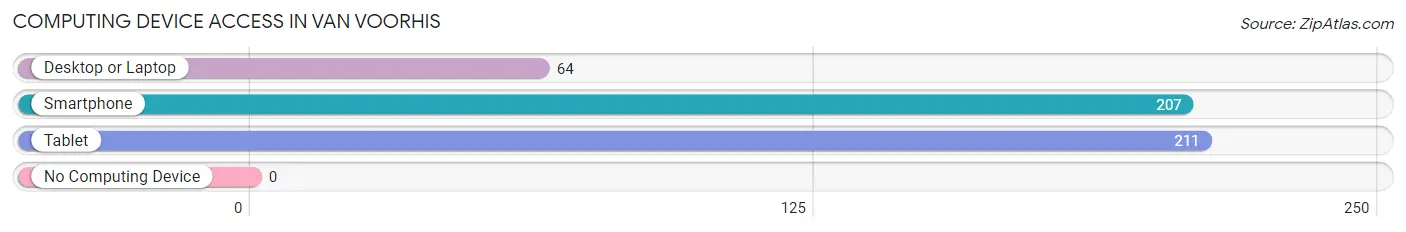
| Device Type | # Households | % Households |
| Desktop or Laptop | 64 | 28.2% |
| Smartphone | 207 | 91.2% |
| Tablet | 211 | 92.9% |
| No Computing Device | 0 | 0.0% |
| Total | 227 | 100.0% |
Internet Access in Van Voorhis
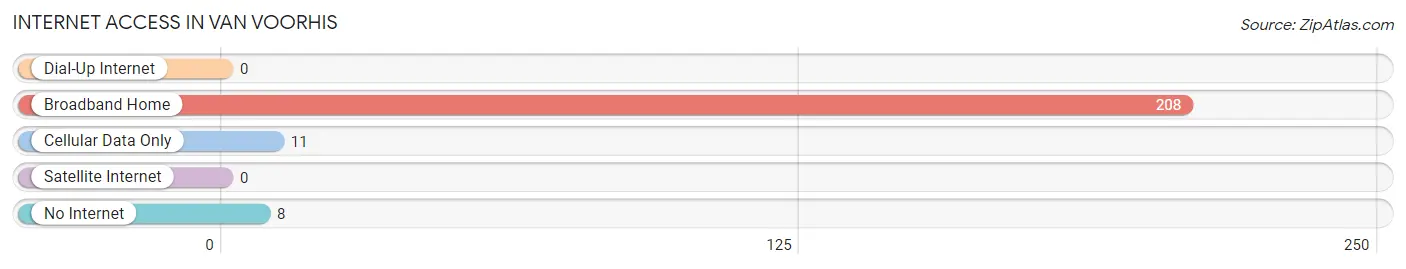
| Internet Type | # Households | % Households |
| Dial-Up Internet | 0 | 0.0% |
| Broadband Home | 208 | 91.6% |
| Cellular Data Only | 11 | 4.9% |
| Satellite Internet | 0 | 0.0% |
| No Internet | 8 | 3.5% |
| Total | 227 | 100.0% |
Van Voorhis Summary
PA History
Pennsylvania is a state located in the Northeastern and Mid-Atlantic regions of the United States. It is the 33rd most populous state in the country and the 6th most populous state in the Northeast. Pennsylvania was one of the original 13 colonies that formed the United States. It was founded by William Penn in 1681 and was the second state to ratify the United States Constitution in 1787. Pennsylvania has a rich history that includes the American Revolution, the Industrial Revolution, and the Civil War.
Pennsylvania was originally inhabited by Native American tribes such as the Lenape, Susquehannock, and Iroquois. The first European settlers arrived in the area in the early 1600s. William Penn founded the colony of Pennsylvania in 1681 and it was one of the original 13 colonies. Pennsylvania was a major center of the American Revolution and was the site of several important battles. After the Revolution, Pennsylvania became an important center of industry and manufacturing. The state was a major contributor to the Union during the Civil War and was the site of several major battles.
Geography
Pennsylvania is located in the Northeastern and Mid-Atlantic regions of the United States. It is bordered by New York to the north, New Jersey to the east, Delaware to the southeast, Maryland to the south, West Virginia to the southwest, and Ohio to the west. Pennsylvania has a total area of 46,055 square miles, making it the 33rd largest state in the country. The state is divided into 67 counties and has a population of 12,801,989 as of 2019.
Pennsylvania is home to a variety of landscapes, including mountains, valleys, rivers, and forests. The Appalachian Mountains run through the state, and the Allegheny Plateau is located in the western part of the state. The Delaware River forms the eastern border of the state, and the Susquehanna River runs through the center of the state. Pennsylvania also has several large lakes, including Lake Erie, Lake Wallenpaupack, and Lake Nockamixon.
Economy
Pennsylvania has a diverse economy that is driven by manufacturing, agriculture, and services. The state is home to several major industries, including steel, chemicals, food processing, and pharmaceuticals. Pennsylvania is also a major producer of coal, natural gas, and oil. The state is home to several Fortune 500 companies, including Comcast, Cigna, and Hershey.
Pennsylvania is also a major tourist destination, with attractions such as the Liberty Bell, Independence Hall, and the Philadelphia Museum of Art. The state is home to several major universities, including the University of Pennsylvania, Carnegie Mellon University, and the University of Pittsburgh.
Demographics
Pennsylvania has a population of 12,801,989 as of 2019. The state is home to a variety of ethnic and racial groups, including White (78.3%), Black or African American (11.2%), Hispanic or Latino (7.2%), Asian (3.2%), and Native American (0.4%). The state also has a large immigrant population, with over 1 million foreign-born residents.
The median household income in Pennsylvania is $60,821, and the median home value is $179,500. The state has a poverty rate of 12.3%, and the unemployment rate is 4.2%. The largest cities in Pennsylvania are Philadelphia, Pittsburgh, Allentown, Erie, and Reading.
Common Questions
What is Per Capita Income in Van Voorhis?
Per Capita income in Van Voorhis is $29,115.
What is the Median Household income in Van Voorhis?
Median Household Income in Van Voorhis is $39,294.
What is Inequality or Gini Index in Van Voorhis?
Inequality or Gini Index in Van Voorhis is 0.33.
What is the Total Population of Van Voorhis?
Total Population of Van Voorhis is 468.
What is the Total Male Population of Van Voorhis?
Total Male Population of Van Voorhis is 247.
What is the Total Female Population of Van Voorhis?
Total Female Population of Van Voorhis is 221.
What is the Ratio of Males per 100 Females in Van Voorhis?
There are 111.76 Males per 100 Females in Van Voorhis.
What is the Ratio of Females per 100 Males in Van Voorhis?
There are 89.47 Females per 100 Males in Van Voorhis.
What is the Median Population Age in Van Voorhis?
Median Population Age in Van Voorhis is 66.4 Years.
What is the Average Family Size in Van Voorhis
Average Family Size in Van Voorhis is 2.4 People.
What is the Average Household Size in Van Voorhis
Average Household Size in Van Voorhis is 2.1 People.
How Large is the Labor Force in Van Voorhis?
There are 52 People in the Labor Forcein in Van Voorhis.
What is the Percentage of People in the Labor Force in Van Voorhis?
11.1% of People are in the Labor Force in Van Voorhis.