Exton, PA Map & Demographics
Exton Map
Exton Overview
$64,679
PER CAPITA INCOME
$132,431
AVG FAMILY INCOME
$120,489
AVG HOUSEHOLD INCOME
49.6%
WAGE / INCOME GAP [ % ]
50.4¢/ $1
WAGE / INCOME GAP [ $ ]
0.41
INEQUALITY / GINI INDEX
6,272
TOTAL POPULATION
3,007
MALE POPULATION
3,265
FEMALE POPULATION
92.10
MALES / 100 FEMALES
108.58
FEMALES / 100 MALES
34.0
MEDIAN AGE
3.0
AVG FAMILY SIZE
2.4
AVG HOUSEHOLD SIZE
3,512
LABOR FORCE [ PEOPLE ]
70.1%
PERCENT IN LABOR FORCE
1.3%
UNEMPLOYMENT RATE
Exton Zip Codes
Income in Exton
Income Overview in Exton
Per Capita Income in Exton is $64,679, while median incomes of families and households are $132,431 and $120,489 respectively.
| Characteristic | Number | Measure |
| Per Capita Income | 6,272 | $64,679 |
| Median Family Income | 1,750 | $132,431 |
| Mean Family Income | 1,750 | $179,080 |
| Median Household Income | 2,579 | $120,489 |
| Mean Household Income | 2,579 | $155,756 |
| Income Deficit | 1,750 | $0 |
| Wage / Income Gap (%) | 6,272 | 49.65% |
| Wage / Income Gap ($) | 6,272 | 50.35¢ per $1 |
| Gini / Inequality Index | 6,272 | 0.41 |
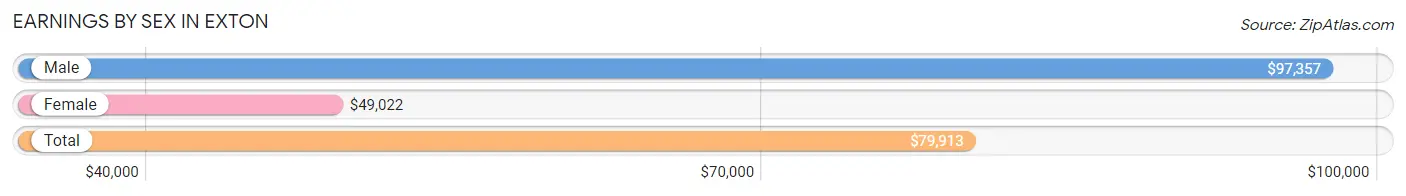
Earnings by Sex in Exton
Average Earnings in Exton are $79,913, $97,357 for men and $49,022 for women, a difference of 49.6%.
| Sex | Number | Average Earnings |
| Male | 2,201 (58.8%) | $97,357 |
| Female | 1,542 (41.2%) | $49,022 |
| Total | 3,743 (100.0%) | $79,913 |
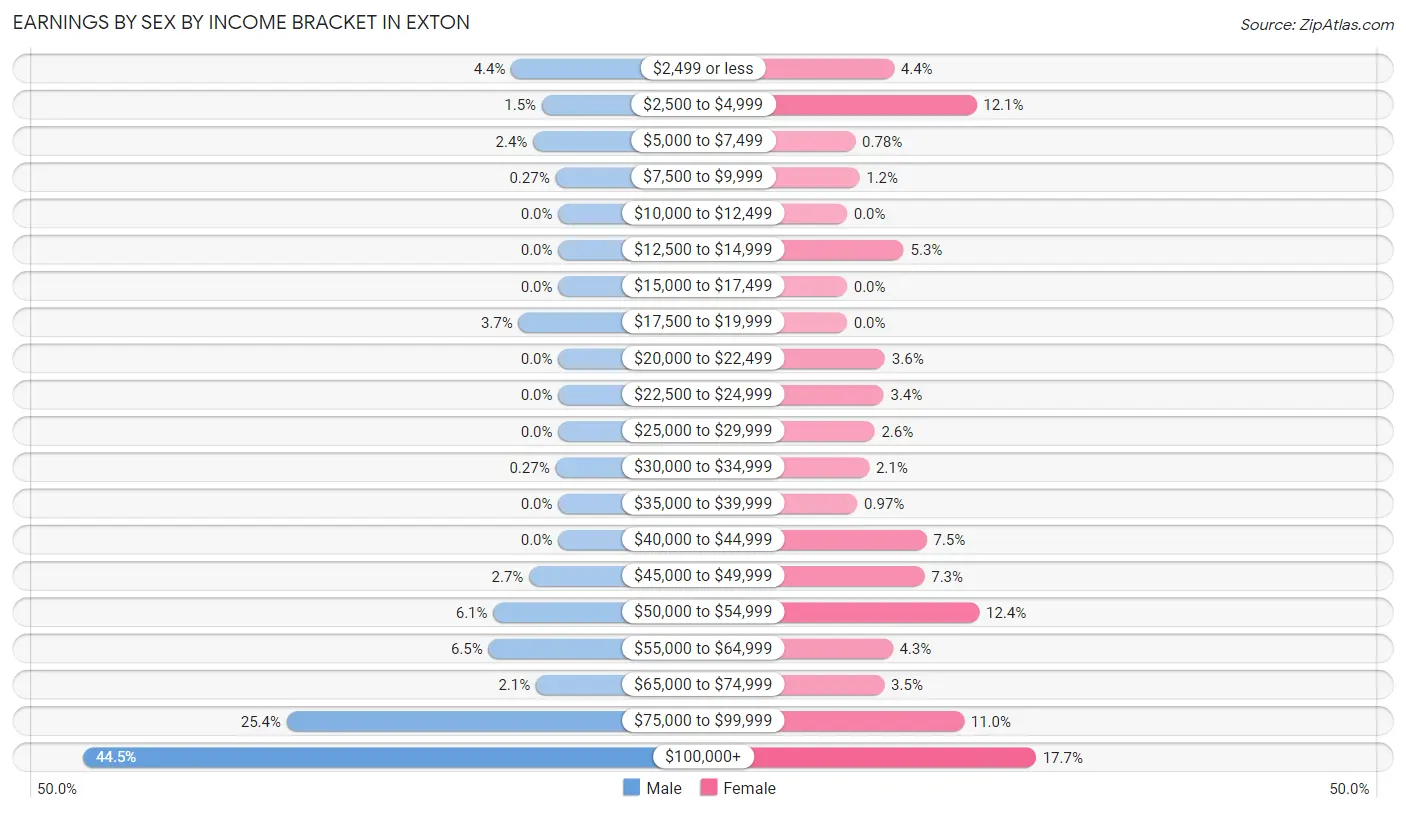
Earnings by Sex by Income Bracket in Exton
The most common earnings brackets in Exton are $100,000+ for men (980 | 44.5%) and $100,000+ for women (273 | 17.7%).
| Income | Male | Female |
| $2,499 or less | 97 (4.4%) | 68 (4.4%) |
| $2,500 to $4,999 | 34 (1.5%) | 187 (12.1%) |
| $5,000 to $7,499 | 52 (2.4%) | 12 (0.8%) |
| $7,500 to $9,999 | 6 (0.3%) | 18 (1.2%) |
| $10,000 to $12,499 | 0 (0.0%) | 0 (0.0%) |
| $12,500 to $14,999 | 0 (0.0%) | 82 (5.3%) |
| $15,000 to $17,499 | 0 (0.0%) | 0 (0.0%) |
| $17,500 to $19,999 | 82 (3.7%) | 0 (0.0%) |
| $20,000 to $22,499 | 0 (0.0%) | 55 (3.6%) |
| $22,500 to $24,999 | 0 (0.0%) | 53 (3.4%) |
| $25,000 to $29,999 | 0 (0.0%) | 40 (2.6%) |
| $30,000 to $34,999 | 6 (0.3%) | 32 (2.1%) |
| $35,000 to $39,999 | 0 (0.0%) | 15 (1.0%) |
| $40,000 to $44,999 | 0 (0.0%) | 115 (7.5%) |
| $45,000 to $49,999 | 60 (2.7%) | 112 (7.3%) |
| $50,000 to $54,999 | 134 (6.1%) | 191 (12.4%) |
| $55,000 to $64,999 | 144 (6.5%) | 66 (4.3%) |
| $65,000 to $74,999 | 46 (2.1%) | 54 (3.5%) |
| $75,000 to $99,999 | 560 (25.4%) | 169 (11.0%) |
| $100,000+ | 980 (44.5%) | 273 (17.7%) |
| Total | 2,201 (100.0%) | 1,542 (100.0%) |
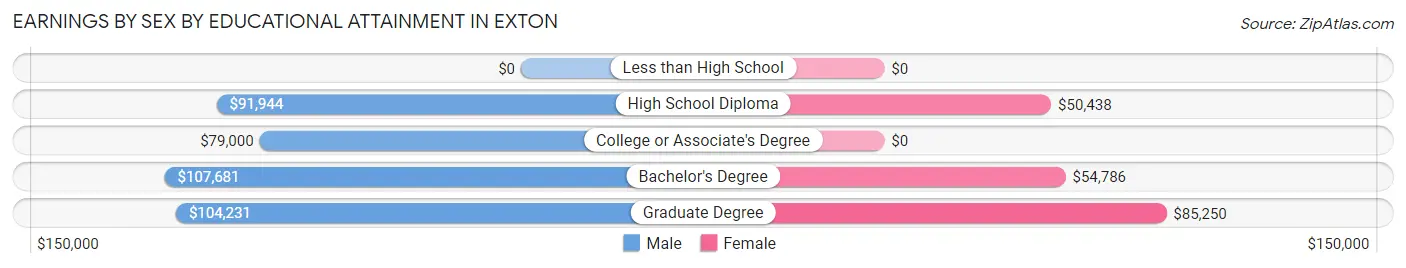
Earnings by Sex by Educational Attainment in Exton
Average earnings in Exton are $99,797 for men and $51,746 for women, a difference of 48.1%. Men with an educational attainment of bachelor's degree enjoy the highest average annual earnings of $107,681, while those with college or associate's degree education earn the least with $79,000. Women with an educational attainment of graduate degree earn the most with the average annual earnings of $85,250, while those with high school diploma education have the smallest earnings of $50,438.
| Educational Attainment | Male Income | Female Income |
| Less than High School | - | - |
| High School Diploma | $91,944 | $50,438 |
| College or Associate's Degree | $79,000 | $0 |
| Bachelor's Degree | $107,681 | $54,786 |
| Graduate Degree | $104,231 | $85,250 |
| Total | $99,797 | $51,746 |
Family Income in Exton
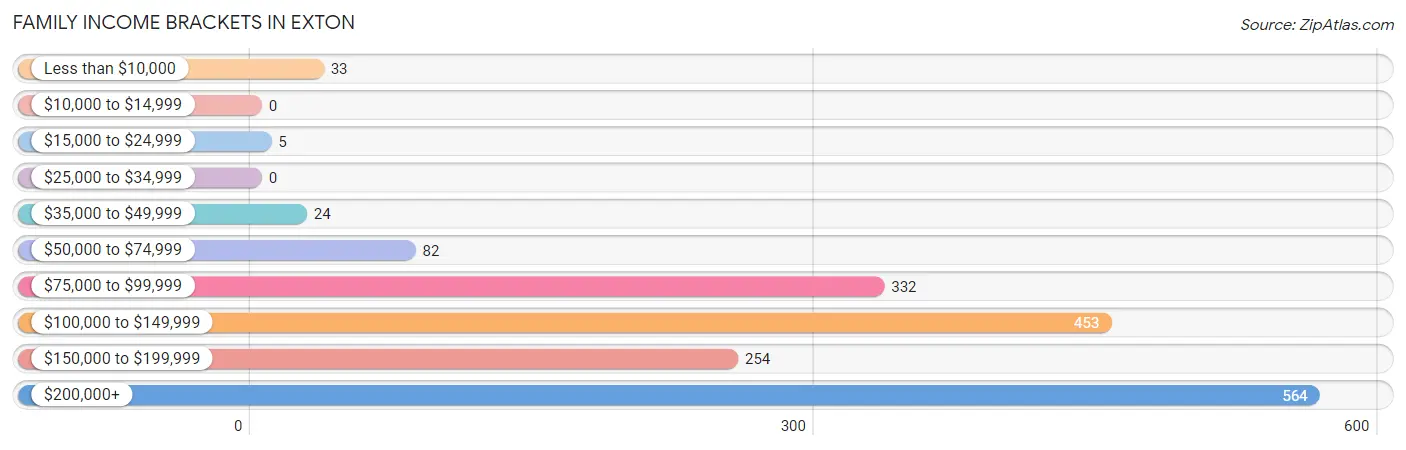
Family Income Brackets in Exton
According to the Exton family income data, there are 564 families falling into the $200,000+ income range, which is the most common income bracket and makes up 32.2% of all families.
| Income Bracket | # Families | % Families |
| Less than $10,000 | 33 | 1.9% |
| $10,000 to $14,999 | 0 | 0.0% |
| $15,000 to $24,999 | 5 | 0.3% |
| $25,000 to $34,999 | 0 | 0.0% |
| $35,000 to $49,999 | 24 | 1.4% |
| $50,000 to $74,999 | 82 | 4.7% |
| $75,000 to $99,999 | 332 | 19.0% |
| $100,000 to $149,999 | 453 | 25.9% |
| $150,000 to $199,999 | 254 | 14.5% |
| $200,000+ | 564 | 32.2% |
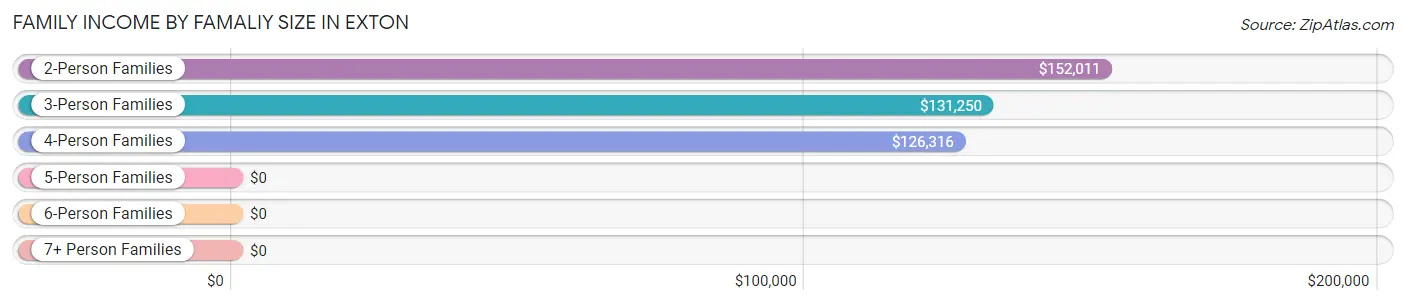
Family Income by Famaliy Size in Exton
2-person families (552 | 31.5%) account for the highest median family income in Exton with $152,011 per family, while 2-person families (552 | 31.5%) have the highest median income of $76,006 per family member.
| Income Bracket | # Families | Median Income |
| 2-Person Families | 552 (31.5%) | $152,011 |
| 3-Person Families | 675 (38.6%) | $131,250 |
| 4-Person Families | 404 (23.1%) | $126,316 |
| 5-Person Families | 119 (6.8%) | $0 |
| 6-Person Families | 0 (0.0%) | $0 |
| 7+ Person Families | 0 (0.0%) | $0 |
| Total | 1,750 (100.0%) | $132,431 |
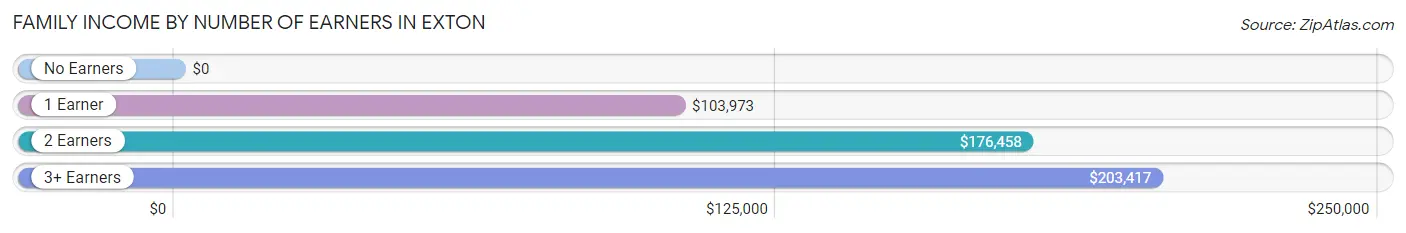
Family Income by Number of Earners in Exton
| Number of Earners | # Families | Median Income |
| No Earners | 49 (2.8%) | $0 |
| 1 Earner | 839 (47.9%) | $103,973 |
| 2 Earners | 600 (34.3%) | $176,458 |
| 3+ Earners | 262 (15.0%) | $203,417 |
| Total | 1,750 (100.0%) | $132,431 |
Household Income in Exton
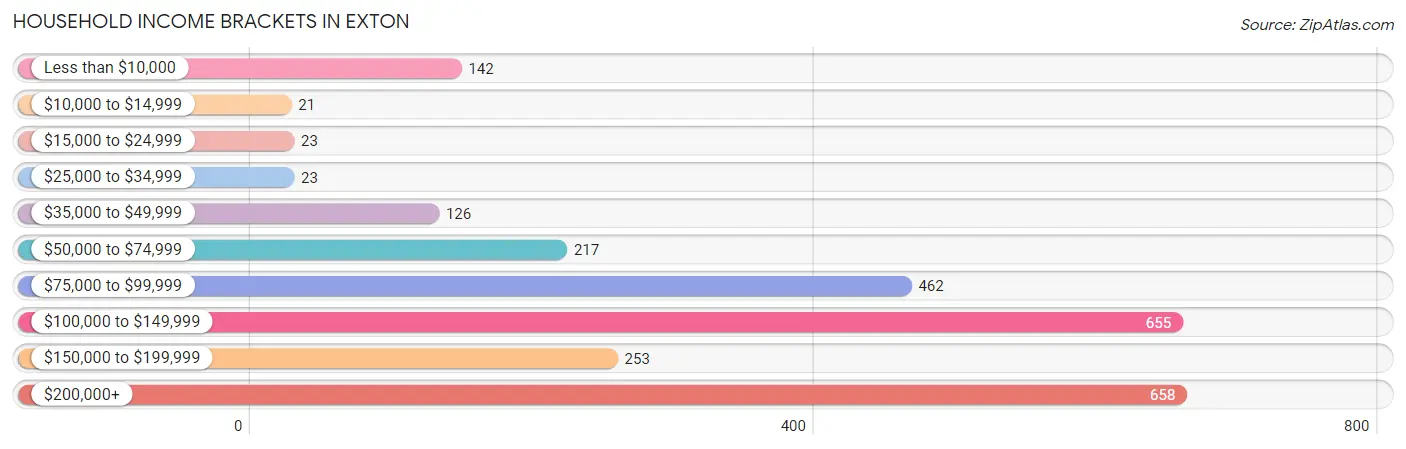
Household Income Brackets in Exton
With 658 households falling in the category, the $200,000+ income range is the most frequent in Exton, accounting for 25.5% of all households. In contrast, only 21 households (0.8%) fall into the $10,000 to $14,999 income bracket, making it the least populous group.
| Income Bracket | # Households | % Households |
| Less than $10,000 | 142 | 5.5% |
| $10,000 to $14,999 | 21 | 0.8% |
| $15,000 to $24,999 | 23 | 0.9% |
| $25,000 to $34,999 | 23 | 0.9% |
| $35,000 to $49,999 | 126 | 4.9% |
| $50,000 to $74,999 | 217 | 8.4% |
| $75,000 to $99,999 | 462 | 17.9% |
| $100,000 to $149,999 | 655 | 25.4% |
| $150,000 to $199,999 | 253 | 9.8% |
| $200,000+ | 658 | 25.5% |
Household Income by Householder Age in Exton
The median household income in Exton is $120,489, with the highest median household income of $203,014 found in the 45 to 64 years age bracket for the primary householder. A total of 689 households (26.7%) fall into this category. Meanwhile, the 15 to 24 years age bracket for the primary householder has the lowest median household income of $0, with 46 households (1.8%) in this group.
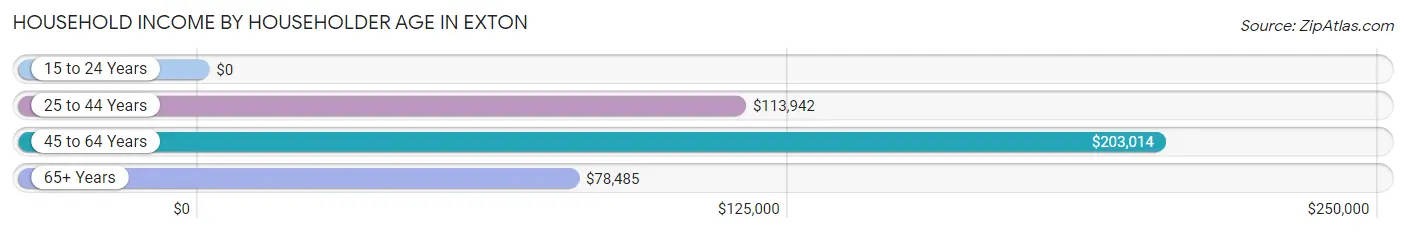
| Income Bracket | # Households | Median Income |
| 15 to 24 Years | 46 (1.8%) | $0 |
| 25 to 44 Years | 1,422 (55.1%) | $113,942 |
| 45 to 64 Years | 689 (26.7%) | $203,014 |
| 65+ Years | 422 (16.4%) | $78,485 |
| Total | 2,579 (100.0%) | $120,489 |
Poverty in Exton
Income Below Poverty by Sex and Age in Exton
With 1.1% poverty level for males and 7.2% for females among the residents of Exton, 25 to 34 year old males and 18 to 24 year old females are the most vulnerable to poverty, with 34 males (5.2%) and 51 females (31.1%) in their respective age groups living below the poverty level.
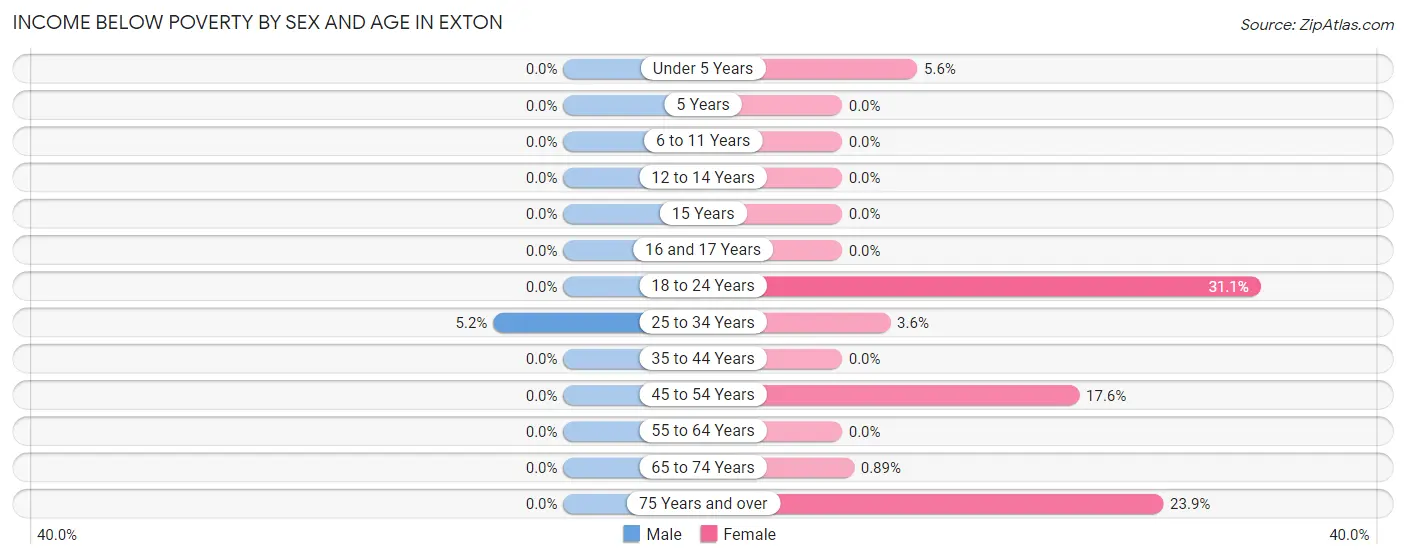
| Age Bracket | Male | Female |
| Under 5 Years | 0 (0.0%) | 28 (5.6%) |
| 5 Years | 0 (0.0%) | 0 (0.0%) |
| 6 to 11 Years | 0 (0.0%) | 0 (0.0%) |
| 12 to 14 Years | 0 (0.0%) | 0 (0.0%) |
| 15 Years | 0 (0.0%) | 0 (0.0%) |
| 16 and 17 Years | 0 (0.0%) | 0 (0.0%) |
| 18 to 24 Years | 0 (0.0%) | 51 (31.1%) |
| 25 to 34 Years | 34 (5.2%) | 33 (3.6%) |
| 35 to 44 Years | 0 (0.0%) | 0 (0.0%) |
| 45 to 54 Years | 0 (0.0%) | 80 (17.6%) |
| 55 to 64 Years | 0 (0.0%) | 0 (0.0%) |
| 65 to 74 Years | 0 (0.0%) | 2 (0.9%) |
| 75 Years and over | 0 (0.0%) | 42 (23.9%) |
| Total | 34 (1.1%) | 236 (7.2%) |
Income Above Poverty by Sex and Age in Exton
According to the poverty statistics in Exton, males aged under 5 years and females aged 6 to 11 years are the age groups that are most secure financially, with 100.0% of males and 100.0% of females in these age groups living above the poverty line.
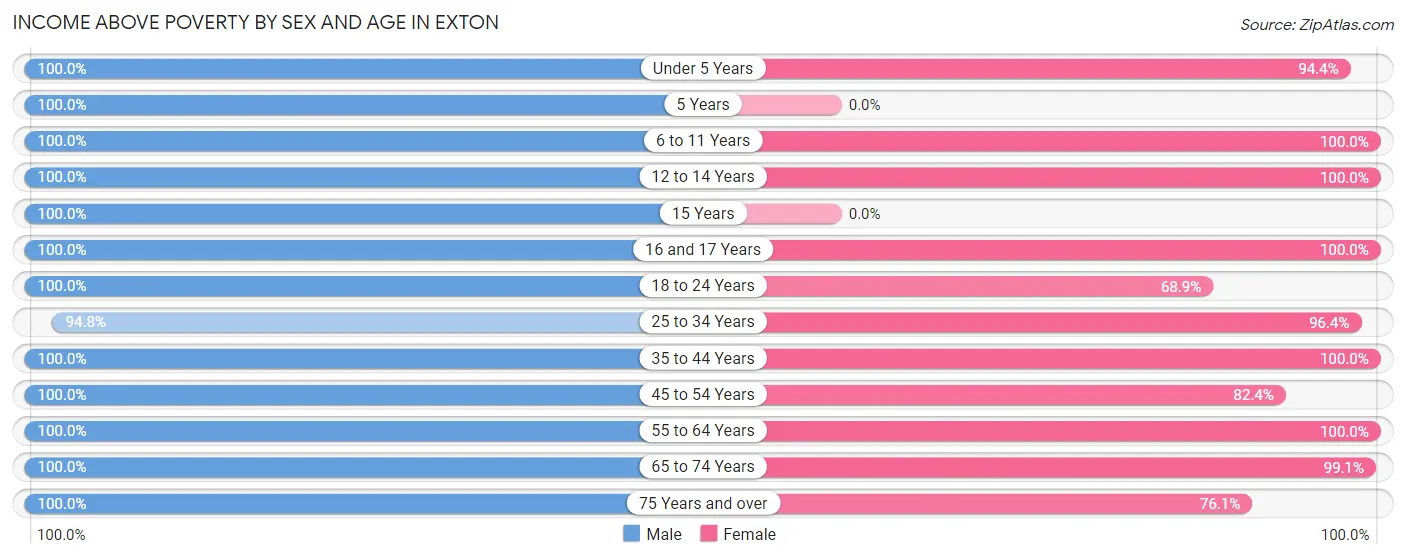
| Age Bracket | Male | Female |
| Under 5 Years | 277 (100.0%) | 473 (94.4%) |
| 5 Years | 20 (100.0%) | 0 (0.0%) |
| 6 to 11 Years | 153 (100.0%) | 132 (100.0%) |
| 12 to 14 Years | 82 (100.0%) | 54 (100.0%) |
| 15 Years | 43 (100.0%) | 0 (0.0%) |
| 16 and 17 Years | 89 (100.0%) | 75 (100.0%) |
| 18 to 24 Years | 222 (100.0%) | 113 (68.9%) |
| 25 to 34 Years | 618 (94.8%) | 887 (96.4%) |
| 35 to 44 Years | 595 (100.0%) | 375 (100.0%) |
| 45 to 54 Years | 328 (100.0%) | 374 (82.4%) |
| 55 to 64 Years | 271 (100.0%) | 183 (100.0%) |
| 65 to 74 Years | 179 (100.0%) | 222 (99.1%) |
| 75 Years and over | 96 (100.0%) | 134 (76.1%) |
| Total | 2,973 (98.9%) | 3,022 (92.8%) |
Income Below Poverty Among Married-Couple Families in Exton
The poverty statistics for married-couple families in Exton show that 2.1% or 34 of the total 1,637 families live below the poverty line. Families with 1 or 2 children have the highest poverty rate of 3.4%, comprising of 34 families. On the other hand, families with no children have the lowest poverty rate of 0.0%, which includes 0 families.
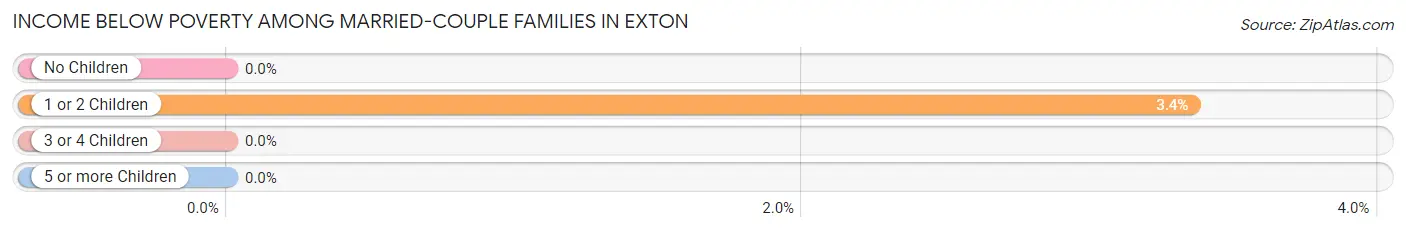
| Children | Above Poverty | Below Poverty |
| No Children | 593 (100.0%) | 0 (0.0%) |
| 1 or 2 Children | 981 (96.7%) | 34 (3.4%) |
| 3 or 4 Children | 29 (100.0%) | 0 (0.0%) |
| 5 or more Children | 0 (0.0%) | 0 (0.0%) |
| Total | 1,603 (97.9%) | 34 (2.1%) |
Income Below Poverty Among Single-Parent Households in Exton
| Children | Single Father | Single Mother |
| No Children | 0 (0.0%) | 0 (0.0%) |
| 1 or 2 Children | 0 (0.0%) | 0 (0.0%) |
| 3 or 4 Children | 0 (0.0%) | 0 (0.0%) |
| 5 or more Children | 0 (0.0%) | 0 (0.0%) |
| Total | 0 (0.0%) | 0 (0.0%) |
Income Below Poverty Among Married-Couple vs Single-Parent Households in Exton
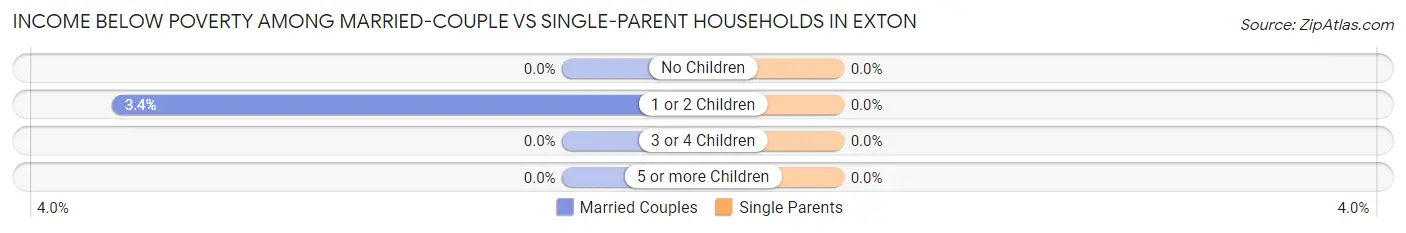
| Children | Married-Couple Families | Single-Parent Households |
| No Children | 0 (0.0%) | 0 (0.0%) |
| 1 or 2 Children | 34 (3.4%) | 0 (0.0%) |
| 3 or 4 Children | 0 (0.0%) | 0 (0.0%) |
| 5 or more Children | 0 (0.0%) | 0 (0.0%) |
| Total | 34 (2.1%) | 0 (0.0%) |
Race in Exton
The most populous races in Exton are White / Caucasian (4,151 | 66.2%), Asian (1,750 | 27.9%), and Some other Race (203 | 3.2%).
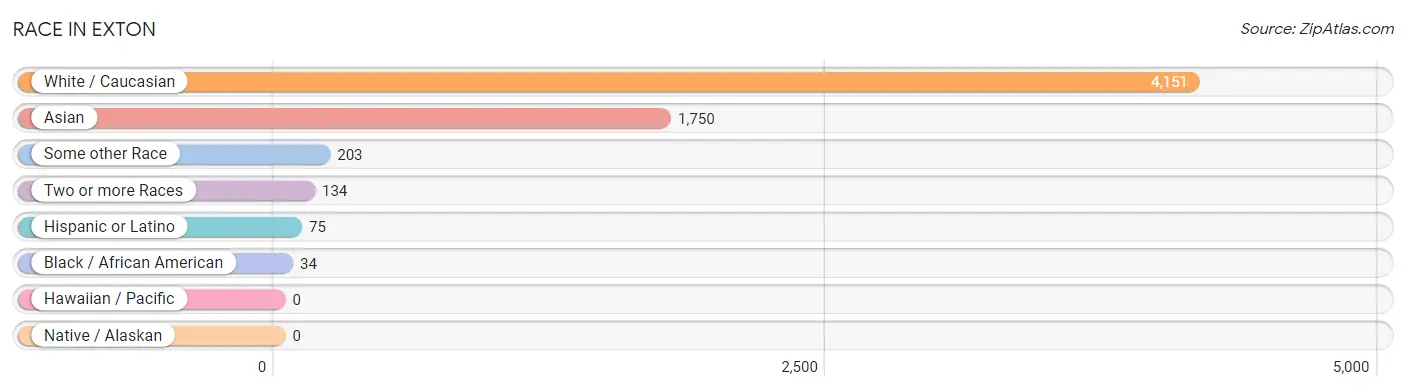
| Race | # Population | % Population |
| Asian | 1,750 | 27.9% |
| Black / African American | 34 | 0.5% |
| Hawaiian / Pacific | 0 | 0.0% |
| Hispanic or Latino | 75 | 1.2% |
| Native / Alaskan | 0 | 0.0% |
| White / Caucasian | 4,151 | 66.2% |
| Two or more Races | 134 | 2.1% |
| Some other Race | 203 | 3.2% |
| Total | 6,272 | 100.0% |
Ancestry in Exton
The most populous ancestries reported in Exton are Thai (1,572 | 25.1%), Irish (970 | 15.5%), German (866 | 13.8%), Italian (628 | 10.0%), and English (560 | 8.9%), together accounting for 73.3% of all Exton residents.
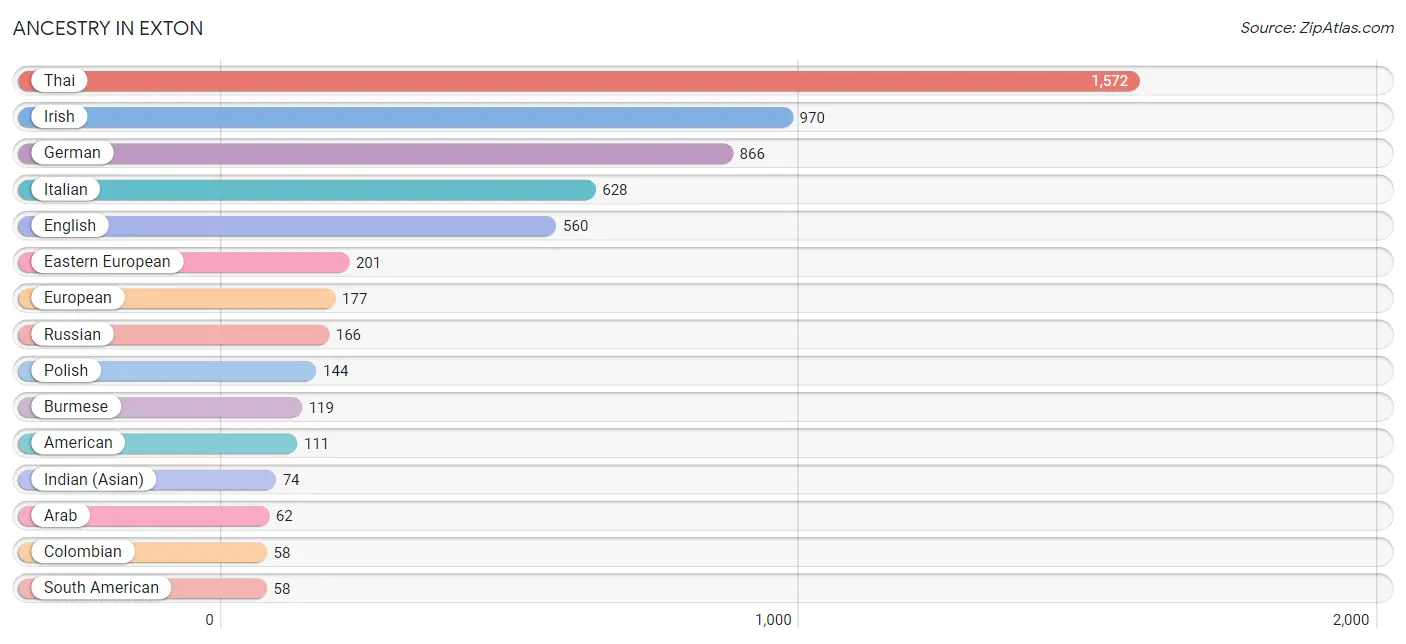
| Ancestry | # Population | % Population |
| American | 111 | 1.8% |
| Arab | 62 | 1.0% |
| Belgian | 6 | 0.1% |
| Bhutanese | 5 | 0.1% |
| Brazilian | 48 | 0.8% |
| British | 38 | 0.6% |
| Burmese | 119 | 1.9% |
| Canadian | 49 | 0.8% |
| Central American | 17 | 0.3% |
| Colombian | 58 | 0.9% |
| Croatian | 12 | 0.2% |
| Dutch | 25 | 0.4% |
| Eastern European | 201 | 3.2% |
| Egyptian | 47 | 0.7% |
| English | 560 | 8.9% |
| European | 177 | 2.8% |
| Filipino | 12 | 0.2% |
| French | 50 | 0.8% |
| German | 866 | 13.8% |
| Indian (Asian) | 74 | 1.2% |
| Irish | 970 | 15.5% |
| Italian | 628 | 10.0% |
| Lithuanian | 6 | 0.1% |
| Okinawan | 15 | 0.2% |
| Polish | 144 | 2.3% |
| Russian | 166 | 2.6% |
| Salvadoran | 17 | 0.3% |
| Scotch-Irish | 18 | 0.3% |
| Scottish | 51 | 0.8% |
| South American | 58 | 0.9% |
| Swedish | 14 | 0.2% |
| Syrian | 15 | 0.2% |
| Thai | 1,572 | 25.1% |
| Ukrainian | 43 | 0.7% |
| Welsh | 7 | 0.1% | View All 35 Rows |
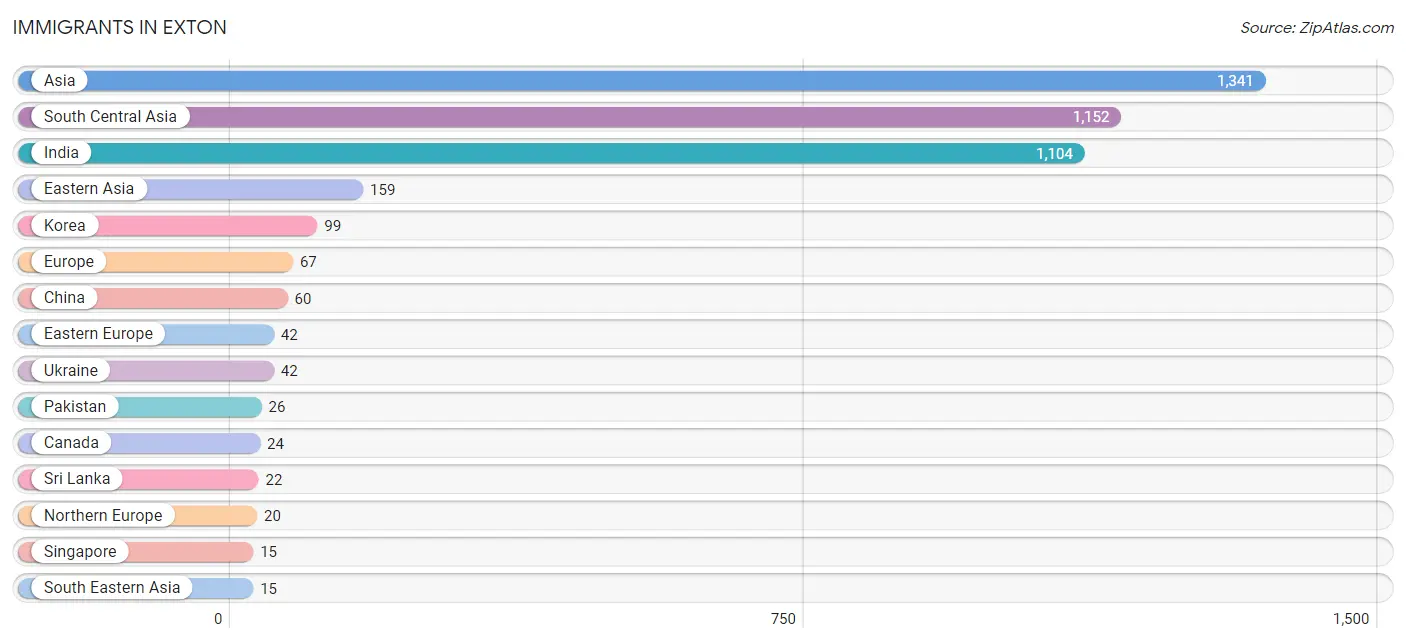
Immigrants in Exton
The most numerous immigrant groups reported in Exton came from Asia (1,341 | 21.4%), South Central Asia (1,152 | 18.4%), India (1,104 | 17.6%), Eastern Asia (159 | 2.5%), and Korea (99 | 1.6%), together accounting for 61.5% of all Exton residents.
| Immigration Origin | # Population | % Population |
| Asia | 1,341 | 21.4% |
| Canada | 24 | 0.4% |
| China | 60 | 1.0% |
| Eastern Asia | 159 | 2.5% |
| Eastern Europe | 42 | 0.7% |
| Europe | 67 | 1.1% |
| India | 1,104 | 17.6% |
| Korea | 99 | 1.6% |
| Netherlands | 5 | 0.1% |
| Northern Europe | 20 | 0.3% |
| Pakistan | 26 | 0.4% |
| Singapore | 15 | 0.2% |
| South Central Asia | 1,152 | 18.4% |
| South Eastern Asia | 15 | 0.2% |
| Sri Lanka | 22 | 0.4% |
| Taiwan | 12 | 0.2% |
| Ukraine | 42 | 0.7% |
| Western Asia | 15 | 0.2% |
| Western Europe | 5 | 0.1% | View All 19 Rows |
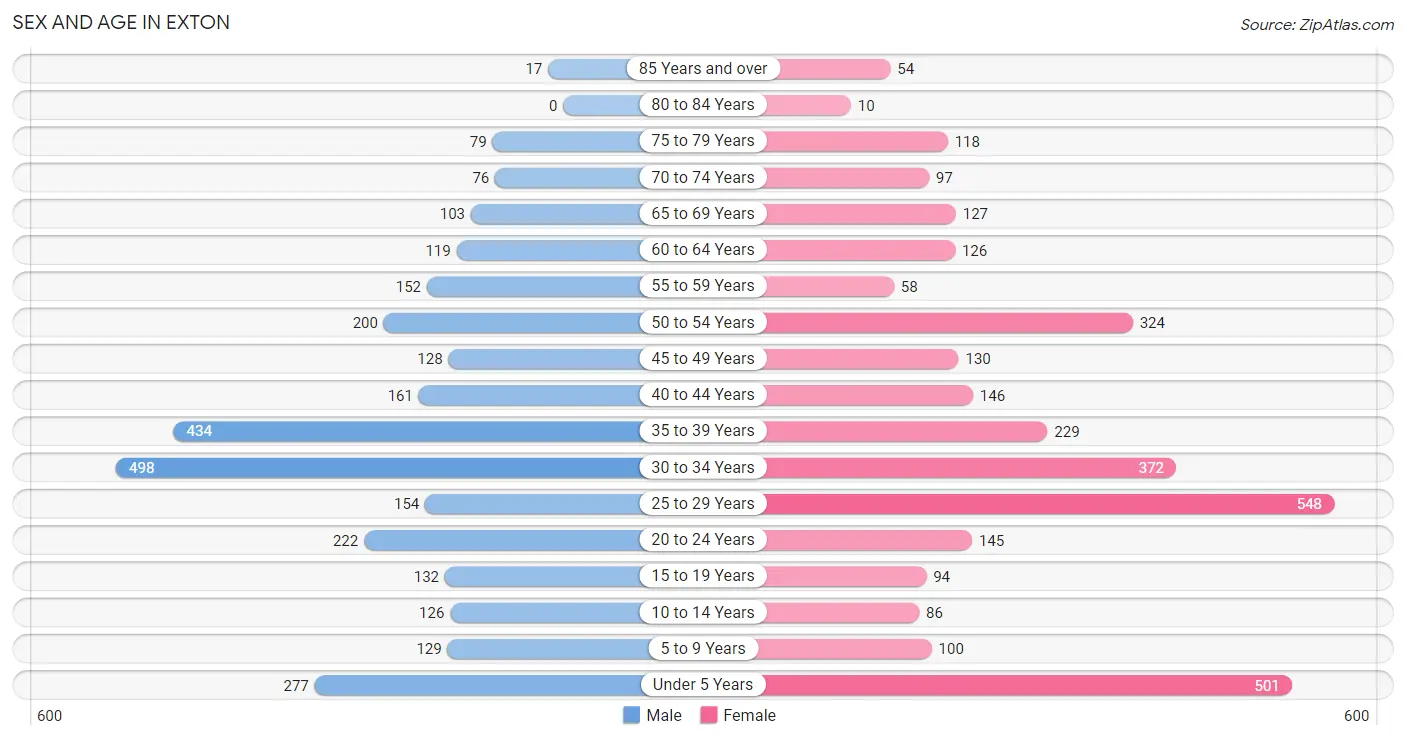
Sex and Age in Exton
Sex and Age in Exton
The most populous age groups in Exton are 30 to 34 Years (498 | 16.6%) for men and 25 to 29 Years (548 | 16.8%) for women.
| Age Bracket | Male | Female |
| Under 5 Years | 277 (9.2%) | 501 (15.3%) |
| 5 to 9 Years | 129 (4.3%) | 100 (3.1%) |
| 10 to 14 Years | 126 (4.2%) | 86 (2.6%) |
| 15 to 19 Years | 132 (4.4%) | 94 (2.9%) |
| 20 to 24 Years | 222 (7.4%) | 145 (4.4%) |
| 25 to 29 Years | 154 (5.1%) | 548 (16.8%) |
| 30 to 34 Years | 498 (16.6%) | 372 (11.4%) |
| 35 to 39 Years | 434 (14.4%) | 229 (7.0%) |
| 40 to 44 Years | 161 (5.3%) | 146 (4.5%) |
| 45 to 49 Years | 128 (4.3%) | 130 (4.0%) |
| 50 to 54 Years | 200 (6.7%) | 324 (9.9%) |
| 55 to 59 Years | 152 (5.1%) | 58 (1.8%) |
| 60 to 64 Years | 119 (4.0%) | 126 (3.9%) |
| 65 to 69 Years | 103 (3.4%) | 127 (3.9%) |
| 70 to 74 Years | 76 (2.5%) | 97 (3.0%) |
| 75 to 79 Years | 79 (2.6%) | 118 (3.6%) |
| 80 to 84 Years | 0 (0.0%) | 10 (0.3%) |
| 85 Years and over | 17 (0.6%) | 54 (1.7%) |
| Total | 3,007 (100.0%) | 3,265 (100.0%) |
Families and Households in Exton
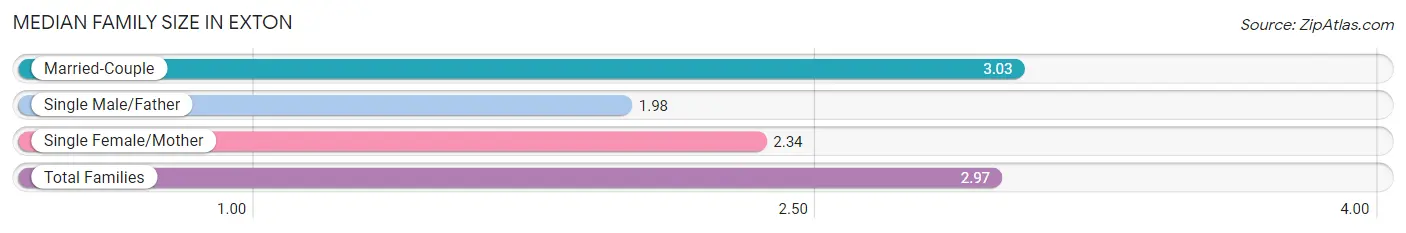
Median Family Size in Exton
The median family size in Exton is 2.97 persons per family, with married-couple families (1,637 | 93.5%) accounting for the largest median family size of 3.03 persons per family. On the other hand, single male/father families (42 | 2.4%) represent the smallest median family size with 1.98 persons per family.
| Family Type | # Families | Family Size |
| Married-Couple | 1,637 (93.5%) | 3.03 |
| Single Male/Father | 42 (2.4%) | 1.98 |
| Single Female/Mother | 71 (4.1%) | 2.34 |
| Total Families | 1,750 (100.0%) | 2.97 |
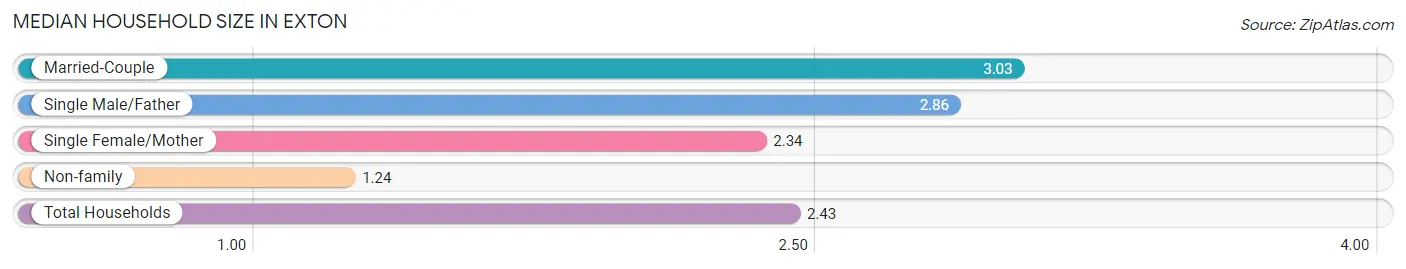
Median Household Size in Exton
The median household size in Exton is 2.43 persons per household, with married-couple households (1,637 | 63.5%) accounting for the largest median household size of 3.03 persons per household. non-family households (829 | 32.1%) represent the smallest median household size with 1.24 persons per household.
| Household Type | # Households | Household Size |
| Married-Couple | 1,637 (63.5%) | 3.03 |
| Single Male/Father | 42 (1.6%) | 2.86 |
| Single Female/Mother | 71 (2.8%) | 2.34 |
| Non-family | 829 (32.1%) | 1.24 |
| Total Households | 2,579 (100.0%) | 2.43 |
Household Size by Marriage Status in Exton
Out of a total of 2,579 households in Exton, 1,750 (67.9%) are family households, while 829 (32.1%) are nonfamily households. The most numerous type of family households are 3-person households, comprising 711, and the most common type of nonfamily households are 1-person households, comprising 636.
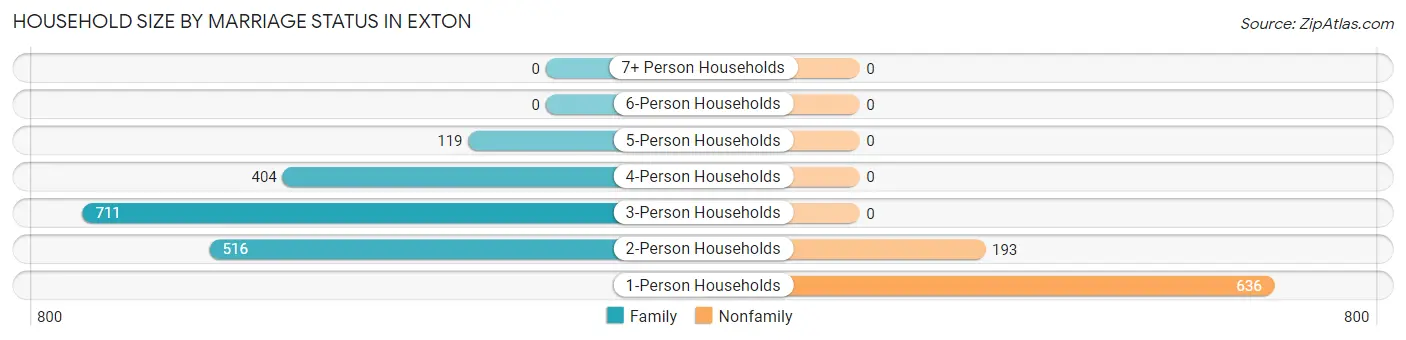
| Household Size | Family Households | Nonfamily Households |
| 1-Person Households | - | 636 (24.7%) |
| 2-Person Households | 516 (20.0%) | 193 (7.5%) |
| 3-Person Households | 711 (27.6%) | 0 (0.0%) |
| 4-Person Households | 404 (15.7%) | 0 (0.0%) |
| 5-Person Households | 119 (4.6%) | 0 (0.0%) |
| 6-Person Households | 0 (0.0%) | 0 (0.0%) |
| 7+ Person Households | 0 (0.0%) | 0 (0.0%) |
| Total | 1,750 (67.9%) | 829 (32.1%) |
Female Fertility in Exton
Fertility by Age in Exton
Average fertility rate in Exton is 32.0 births per 1,000 women. Women in the age bracket of 20 to 34 years have the highest fertility rate with 52.0 births per 1,000 women. Women in the age bracket of 20 to 34 years acount for 100.0% of all women with births.
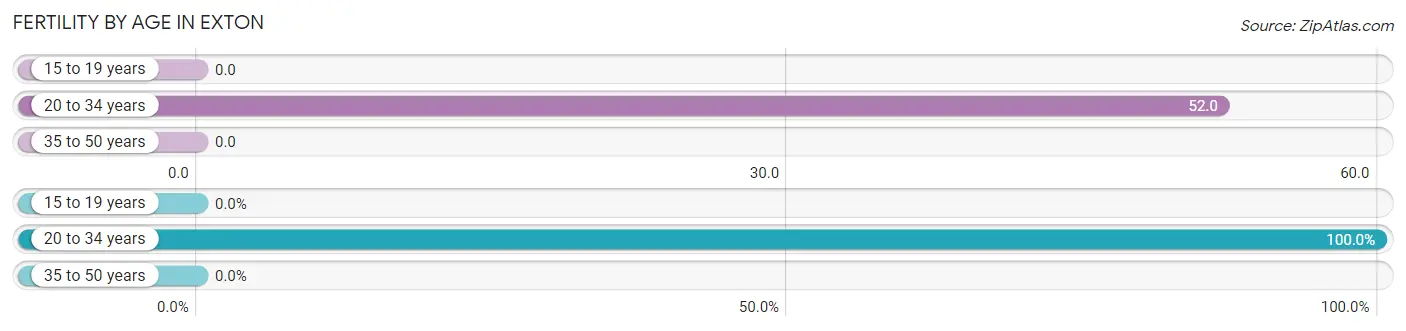
| Age Bracket | Women with Births | Births / 1,000 Women |
| 15 to 19 years | 0 (0.0%) | 0.0 |
| 20 to 34 years | 55 (100.0%) | 52.0 |
| 35 to 50 years | 0 (0.0%) | 0.0 |
| Total | 55 (100.0%) | 32.0 |
Fertility by Age by Marriage Status in Exton
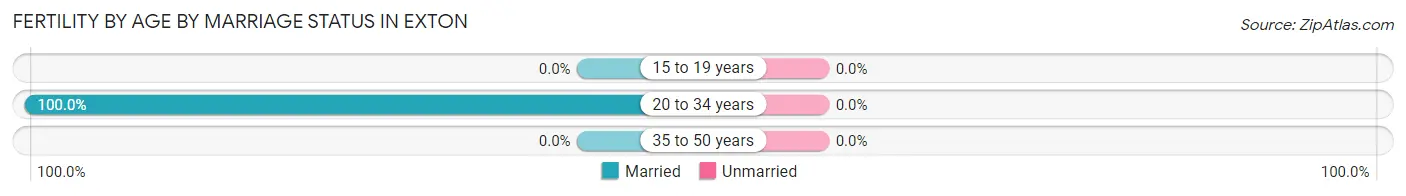
| Age Bracket | Married | Unmarried |
| 15 to 19 years | 0 (0.0%) | 0 (0.0%) |
| 20 to 34 years | 55 (100.0%) | 0 (0.0%) |
| 35 to 50 years | 0 (0.0%) | 0 (0.0%) |
| Total | 55 (100.0%) | 0 (0.0%) |
Fertility by Education in Exton
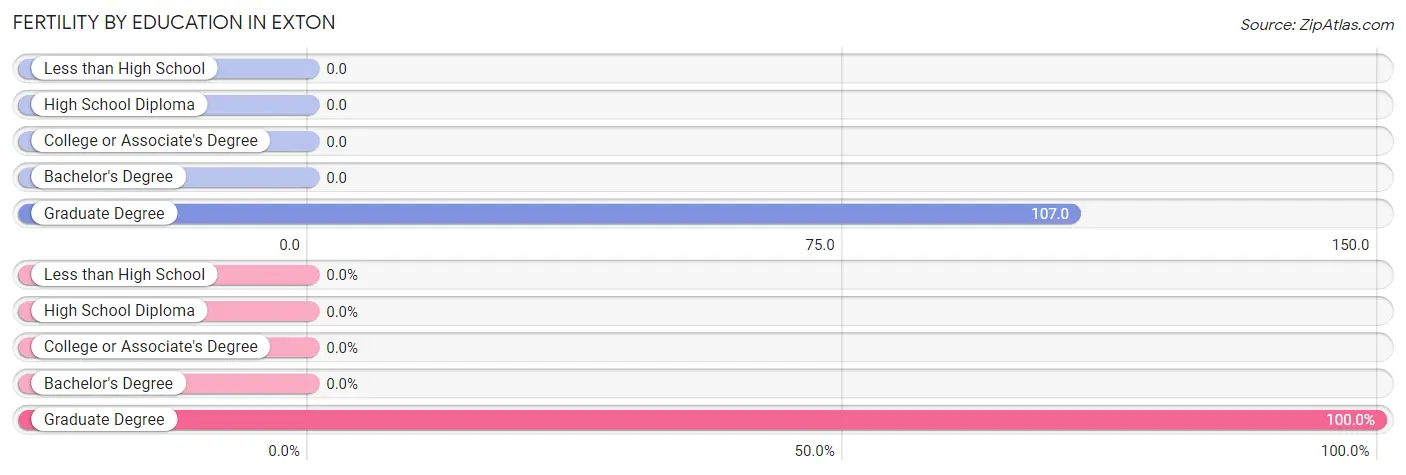
| Educational Attainment | Women with Births | Births / 1,000 Women |
| Less than High School | 0 (0.0%) | 0.0 |
| High School Diploma | 0 (0.0%) | 0.0 |
| College or Associate's Degree | 0 (0.0%) | 0.0 |
| Bachelor's Degree | 0 (0.0%) | 0.0 |
| Graduate Degree | 55 (100.0%) | 107.0 |
| Total | 55 (100.0%) | 32.0 |
Fertility by Education by Marriage Status in Exton
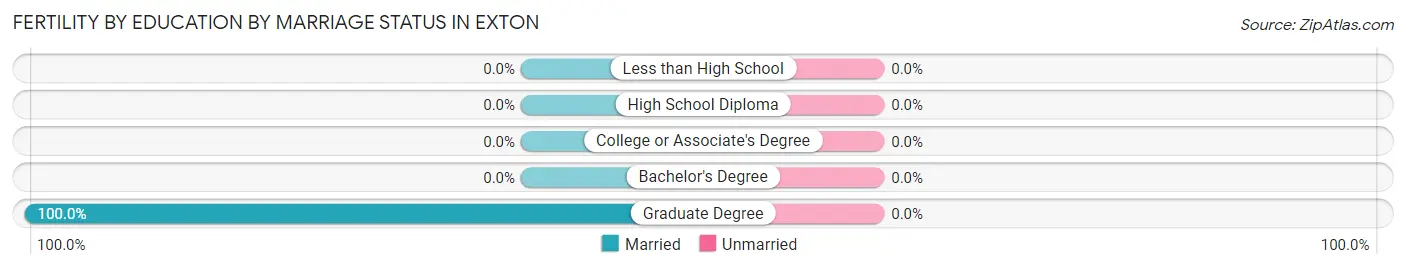
| Educational Attainment | Married | Unmarried |
| Less than High School | 0 (0.0%) | 0 (0.0%) |
| High School Diploma | 0 (0.0%) | 0 (0.0%) |
| College or Associate's Degree | 0 (0.0%) | 0 (0.0%) |
| Bachelor's Degree | 0 (0.0%) | 0 (0.0%) |
| Graduate Degree | 55 (100.0%) | 0 (0.0%) |
| Total | 55 (100.0%) | 0 (0.0%) |
Employment Characteristics in Exton
Employment by Class of Employer in Exton
Among the 3,405 employed individuals in Exton, private company employees (2,569 | 75.4%), not-for-profit organizations (352 | 10.3%), and self-employed (not incorporated) (106 | 3.1%) make up the most common classes of employment.
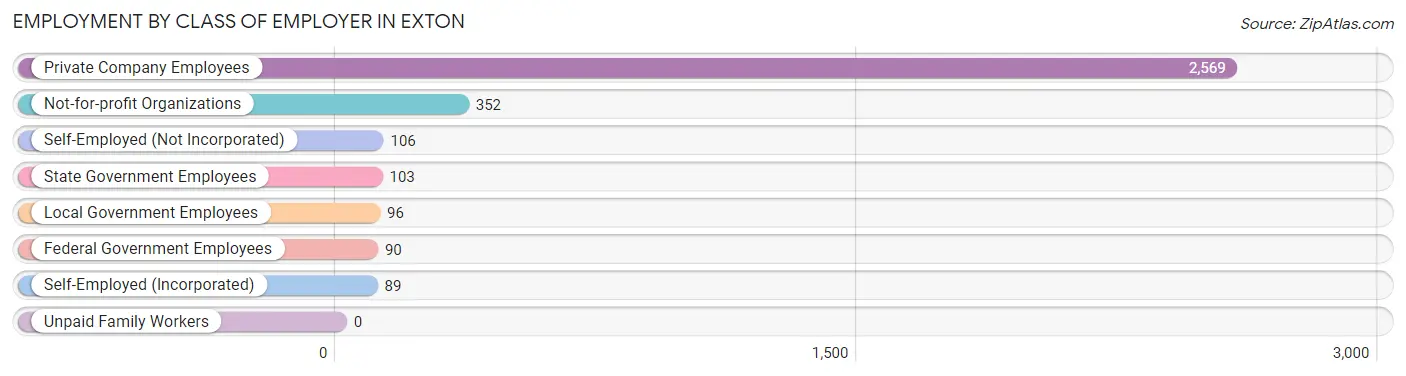
| Employer Class | # Employees | % Employees |
| Private Company Employees | 2,569 | 75.4% |
| Self-Employed (Incorporated) | 89 | 2.6% |
| Self-Employed (Not Incorporated) | 106 | 3.1% |
| Not-for-profit Organizations | 352 | 10.3% |
| Local Government Employees | 96 | 2.8% |
| State Government Employees | 103 | 3.0% |
| Federal Government Employees | 90 | 2.6% |
| Unpaid Family Workers | 0 | 0.0% |
| Total | 3,405 | 100.0% |
Employment Status by Age in Exton
According to the labor force statistics for Exton, out of the total population over 16 years of age (5,010), 70.1% or 3,512 individuals are in the labor force, with 1.3% or 46 of them unemployed. The age group with the highest labor force participation rate is 55 to 59 years, with 91.9% or 193 individuals in the labor force. Within the labor force, the 45 to 54 years age range has the highest percentage of unemployed individuals, with 2.8% or 20 of them being unemployed.
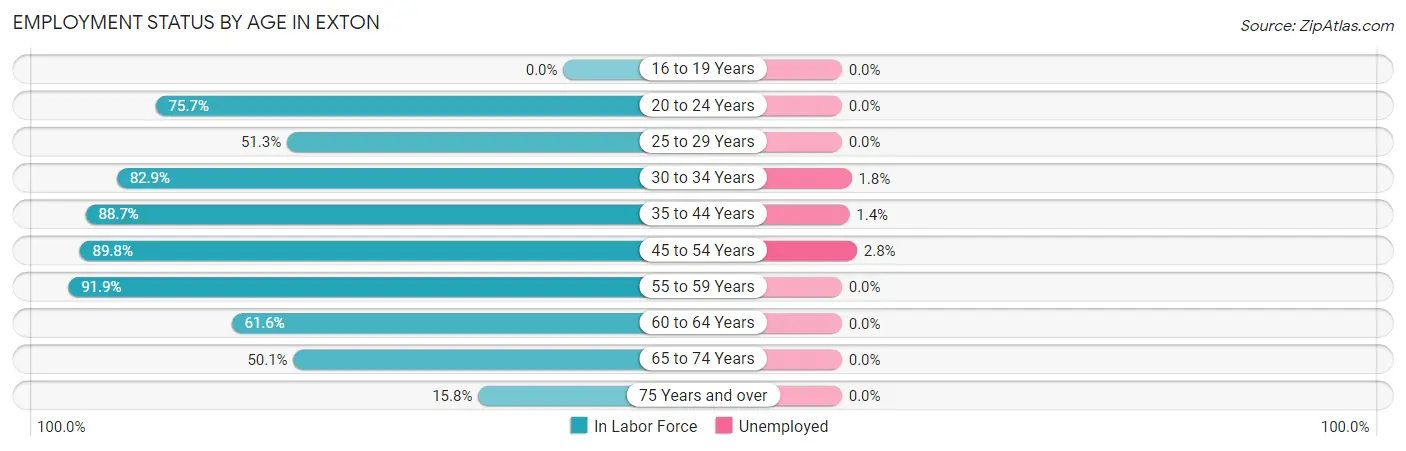
| Age Bracket | In Labor Force | Unemployed |
| 16 to 19 Years | 0 (0.0%) | 0 (0.0%) |
| 20 to 24 Years | 278 (75.7%) | 0 (0.0%) |
| 25 to 29 Years | 360 (51.3%) | 0 (0.0%) |
| 30 to 34 Years | 721 (82.9%) | 13 (1.8%) |
| 35 to 44 Years | 860 (88.7%) | 12 (1.4%) |
| 45 to 54 Years | 702 (89.8%) | 20 (2.8%) |
| 55 to 59 Years | 193 (91.9%) | 0 (0.0%) |
| 60 to 64 Years | 151 (61.6%) | 0 (0.0%) |
| 65 to 74 Years | 202 (50.1%) | 0 (0.0%) |
| 75 Years and over | 44 (15.8%) | 0 (0.0%) |
| Total | 3,512 (70.1%) | 46 (1.3%) |
Employment Status by Educational Attainment in Exton
According to labor force statistics for Exton, 79.0% of individuals (2,985) out of the total population between 25 and 64 years of age (3,779) are in the labor force, with 1.5% or 45 of them being unemployed. The group with the highest labor force participation rate are those with the educational attainment of high school diploma, with 84.4% or 407 individuals in the labor force. Within the labor force, individuals with high school diploma education have the highest percentage of unemployment, with 4.9% or 20 of them being unemployed.
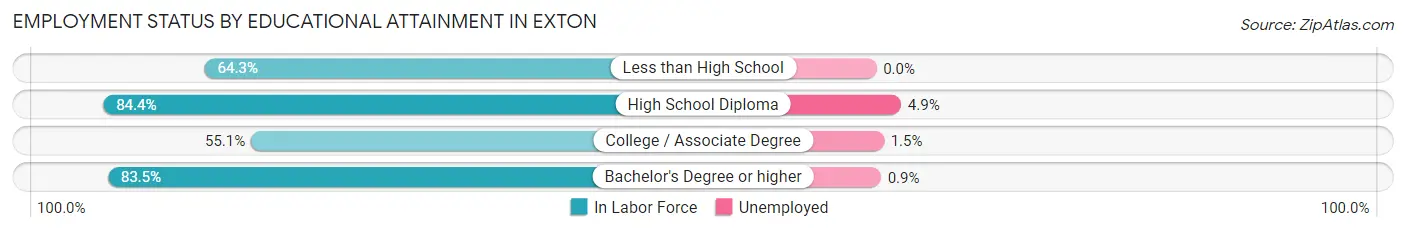
| Educational Attainment | In Labor Force | Unemployed |
| Less than High School | 9 (64.3%) | 0 (0.0%) |
| High School Diploma | 407 (84.4%) | 24 (4.9%) |
| College / Associate Degree | 327 (55.1%) | 9 (1.5%) |
| Bachelor's Degree or higher | 2,245 (83.5%) | 24 (0.9%) |
| Total | 2,985 (79.0%) | 57 (1.5%) |
Employment Occupations by Sex in Exton
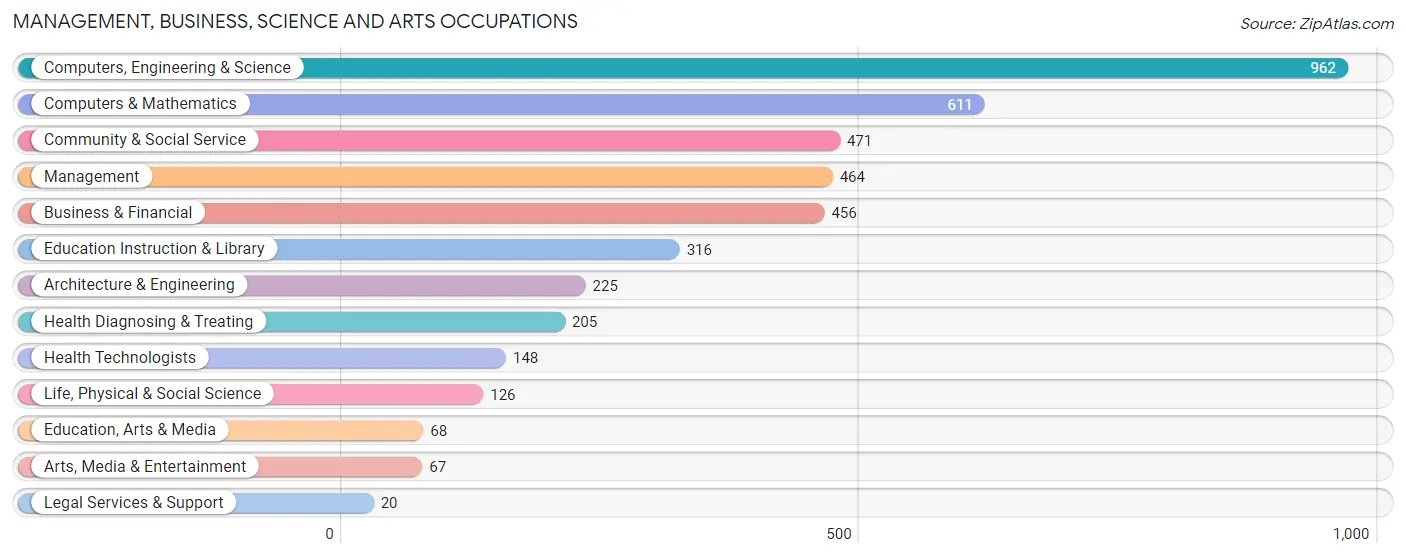
Management, Business, Science and Arts Occupations
The most common Management, Business, Science and Arts occupations in Exton are Computers, Engineering & Science (962 | 27.8%), Computers & Mathematics (611 | 17.6%), Community & Social Service (471 | 13.6%), Management (464 | 13.4%), and Business & Financial (456 | 13.2%).
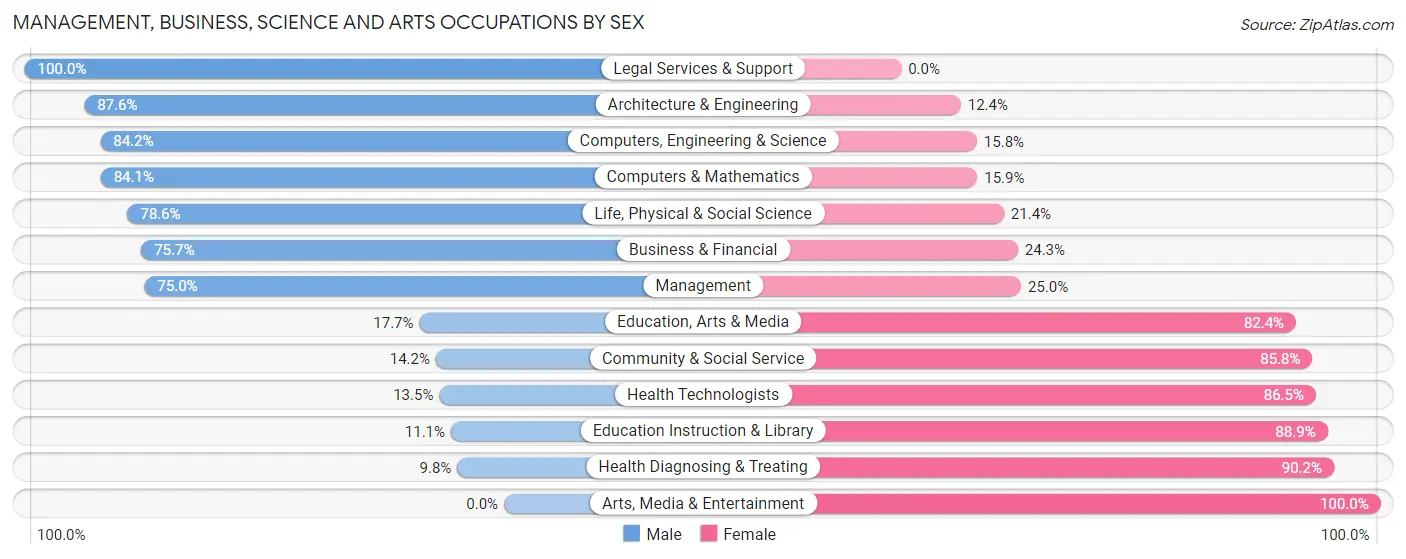
Management, Business, Science and Arts Occupations by Sex
Within the Management, Business, Science and Arts occupations in Exton, the most male-oriented occupations are Legal Services & Support (100.0%), Architecture & Engineering (87.6%), and Computers, Engineering & Science (84.2%), while the most female-oriented occupations are Arts, Media & Entertainment (100.0%), Health Diagnosing & Treating (90.2%), and Education Instruction & Library (88.9%).
| Occupation | Male | Female |
| Management | 348 (75.0%) | 116 (25.0%) |
| Business & Financial | 345 (75.7%) | 111 (24.3%) |
| Computers, Engineering & Science | 810 (84.2%) | 152 (15.8%) |
| Computers & Mathematics | 514 (84.1%) | 97 (15.9%) |
| Architecture & Engineering | 197 (87.6%) | 28 (12.4%) |
| Life, Physical & Social Science | 99 (78.6%) | 27 (21.4%) |
| Community & Social Service | 67 (14.2%) | 404 (85.8%) |
| Education, Arts & Media | 12 (17.6%) | 56 (82.4%) |
| Legal Services & Support | 20 (100.0%) | 0 (0.0%) |
| Education Instruction & Library | 35 (11.1%) | 281 (88.9%) |
| Arts, Media & Entertainment | 0 (0.0%) | 67 (100.0%) |
| Health Diagnosing & Treating | 20 (9.8%) | 185 (90.2%) |
| Health Technologists | 20 (13.5%) | 128 (86.5%) |
| Total (Category) | 1,590 (62.2%) | 968 (37.8%) |
| Total (Overall) | 2,013 (58.1%) | 1,453 (41.9%) |
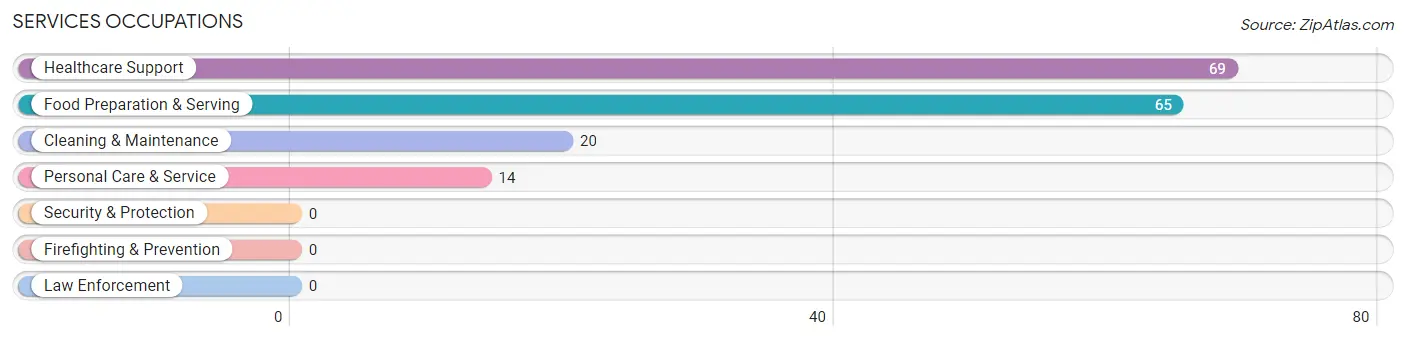
Services Occupations
The most common Services occupations in Exton are Healthcare Support (69 | 2.0%), Food Preparation & Serving (65 | 1.9%), Cleaning & Maintenance (20 | 0.6%), and Personal Care & Service (14 | 0.4%).
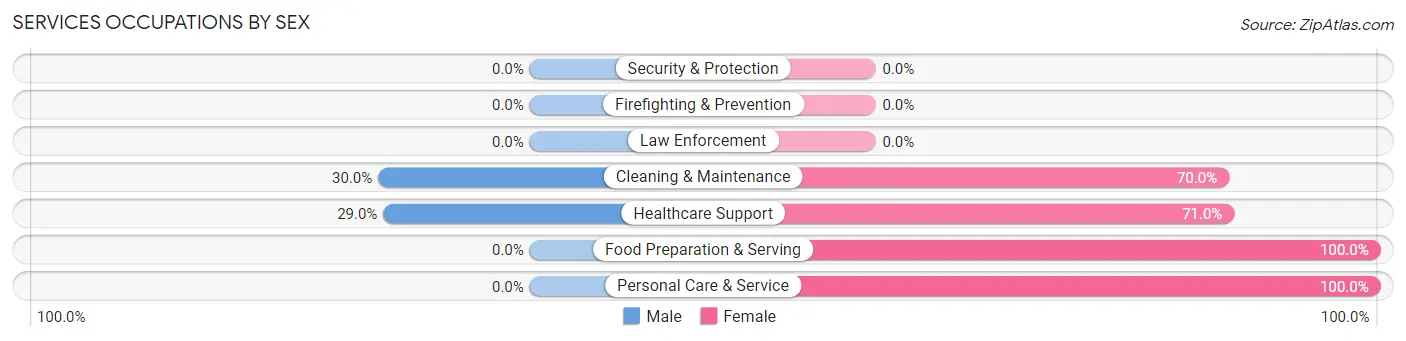
Services Occupations by Sex
Within the Services occupations in Exton, the most male-oriented occupations are Cleaning & Maintenance (30.0%), and Healthcare Support (29.0%), while the most female-oriented occupations are Food Preparation & Serving (100.0%), Personal Care & Service (100.0%), and Healthcare Support (71.0%).
| Occupation | Male | Female |
| Healthcare Support | 20 (29.0%) | 49 (71.0%) |
| Security & Protection | 0 (0.0%) | 0 (0.0%) |
| Firefighting & Prevention | 0 (0.0%) | 0 (0.0%) |
| Law Enforcement | 0 (0.0%) | 0 (0.0%) |
| Food Preparation & Serving | 0 (0.0%) | 65 (100.0%) |
| Cleaning & Maintenance | 6 (30.0%) | 14 (70.0%) |
| Personal Care & Service | 0 (0.0%) | 14 (100.0%) |
| Total (Category) | 26 (15.5%) | 142 (84.5%) |
| Total (Overall) | 2,013 (58.1%) | 1,453 (41.9%) |
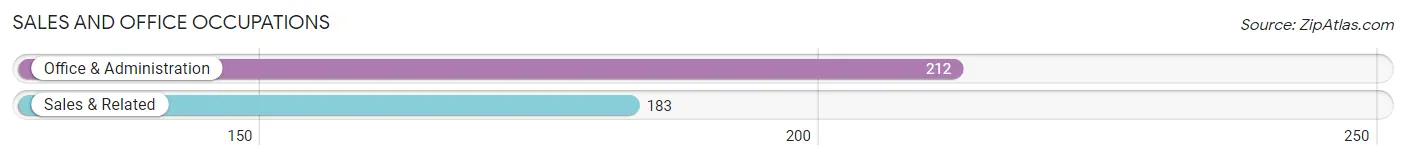
Sales and Office Occupations
The most common Sales and Office occupations in Exton are Office & Administration (212 | 6.1%), and Sales & Related (183 | 5.3%).
Sales and Office Occupations by Sex
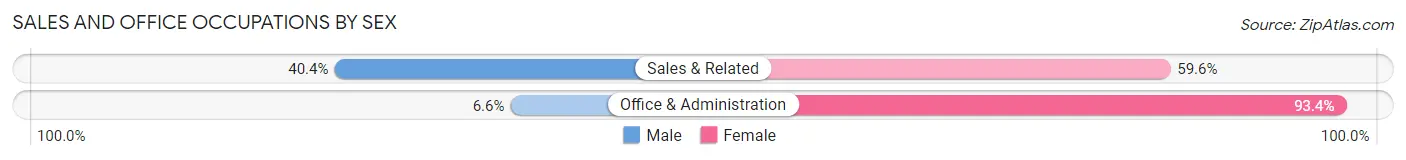
| Occupation | Male | Female |
| Sales & Related | 74 (40.4%) | 109 (59.6%) |
| Office & Administration | 14 (6.6%) | 198 (93.4%) |
| Total (Category) | 88 (22.3%) | 307 (77.7%) |
| Total (Overall) | 2,013 (58.1%) | 1,453 (41.9%) |
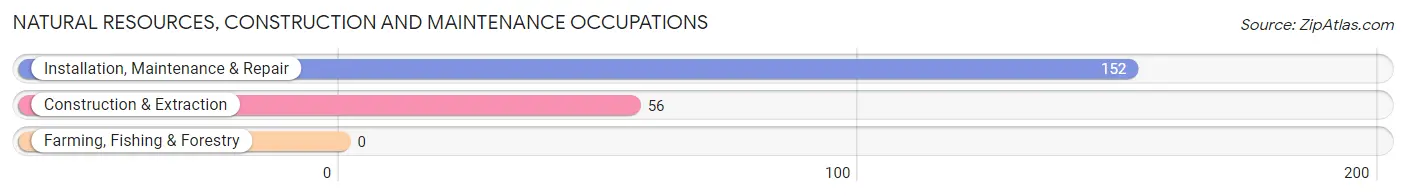
Natural Resources, Construction and Maintenance Occupations
The most common Natural Resources, Construction and Maintenance occupations in Exton are Installation, Maintenance & Repair (152 | 4.4%), and Construction & Extraction (56 | 1.6%).
Natural Resources, Construction and Maintenance Occupations by Sex
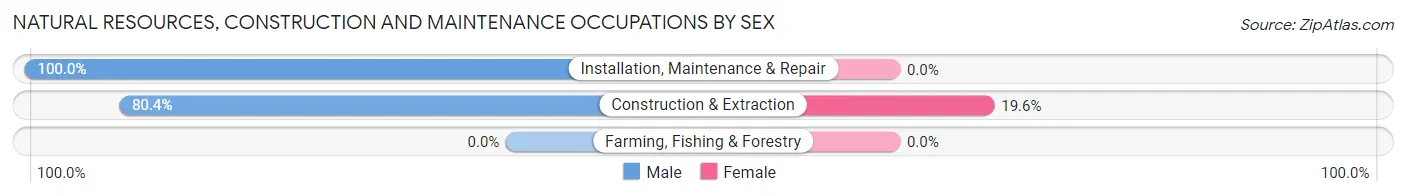
| Occupation | Male | Female |
| Farming, Fishing & Forestry | 0 (0.0%) | 0 (0.0%) |
| Construction & Extraction | 45 (80.4%) | 11 (19.6%) |
| Installation, Maintenance & Repair | 152 (100.0%) | 0 (0.0%) |
| Total (Category) | 197 (94.7%) | 11 (5.3%) |
| Total (Overall) | 2,013 (58.1%) | 1,453 (41.9%) |
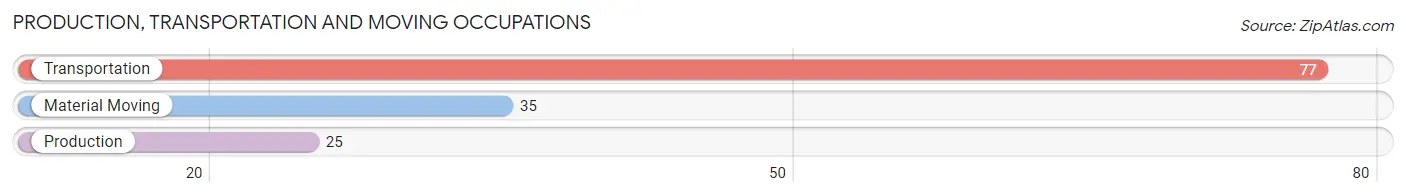
Production, Transportation and Moving Occupations
The most common Production, Transportation and Moving occupations in Exton are Transportation (77 | 2.2%), Material Moving (35 | 1.0%), and Production (25 | 0.7%).
Production, Transportation and Moving Occupations by Sex
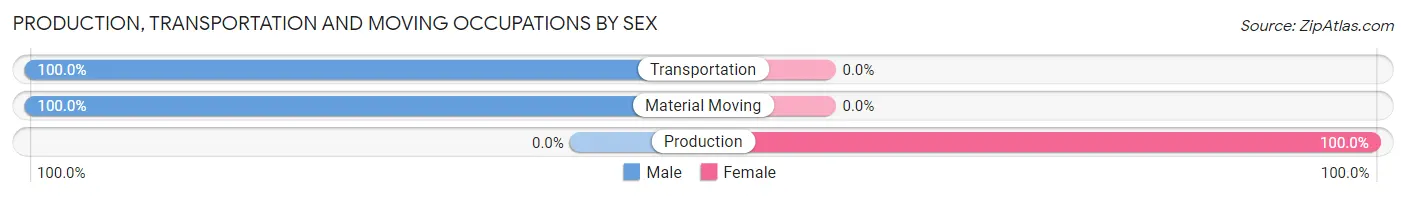
| Occupation | Male | Female |
| Production | 0 (0.0%) | 25 (100.0%) |
| Transportation | 77 (100.0%) | 0 (0.0%) |
| Material Moving | 35 (100.0%) | 0 (0.0%) |
| Total (Category) | 112 (81.8%) | 25 (18.2%) |
| Total (Overall) | 2,013 (58.1%) | 1,453 (41.9%) |
Employment Industries by Sex in Exton
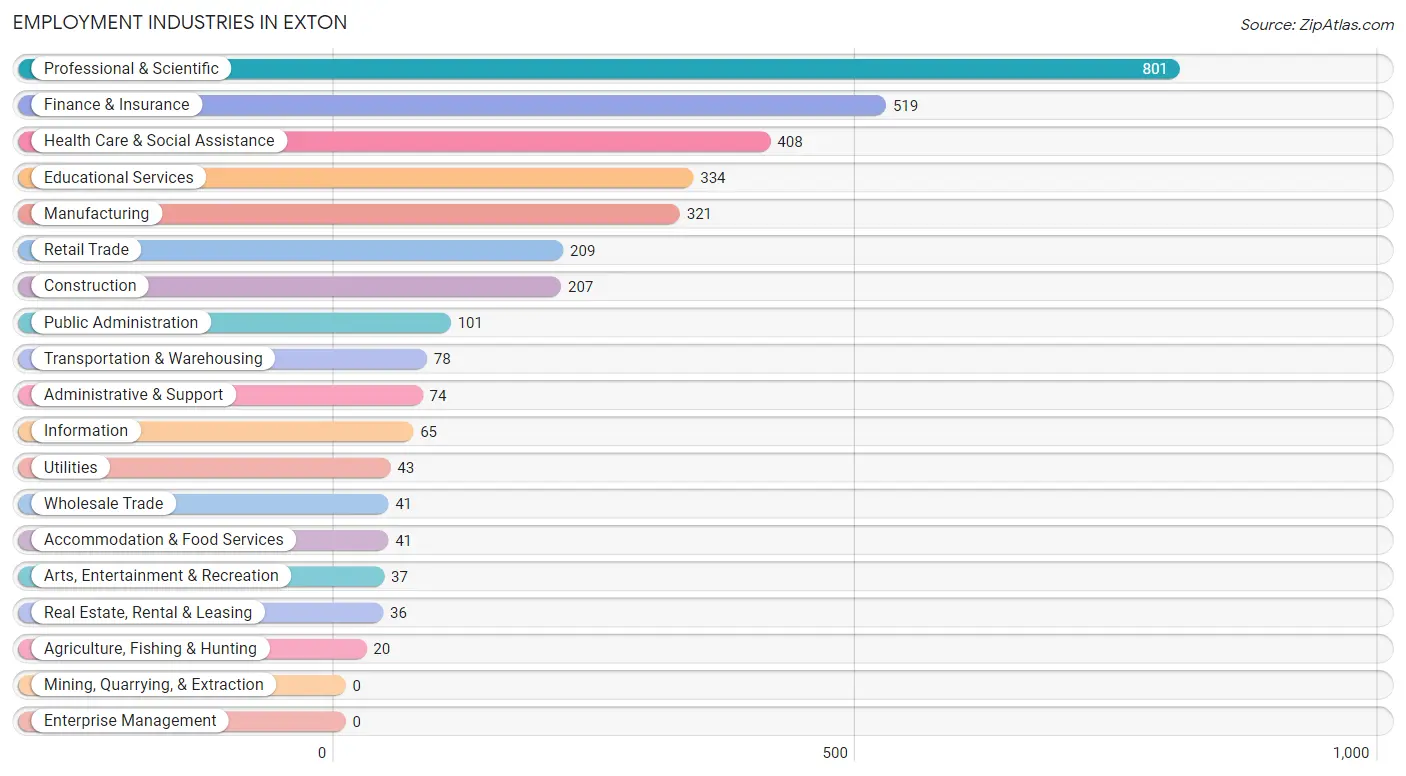
Employment Industries in Exton
The major employment industries in Exton include Professional & Scientific (801 | 23.1%), Finance & Insurance (519 | 15.0%), Health Care & Social Assistance (408 | 11.8%), Educational Services (334 | 9.6%), and Manufacturing (321 | 9.3%).
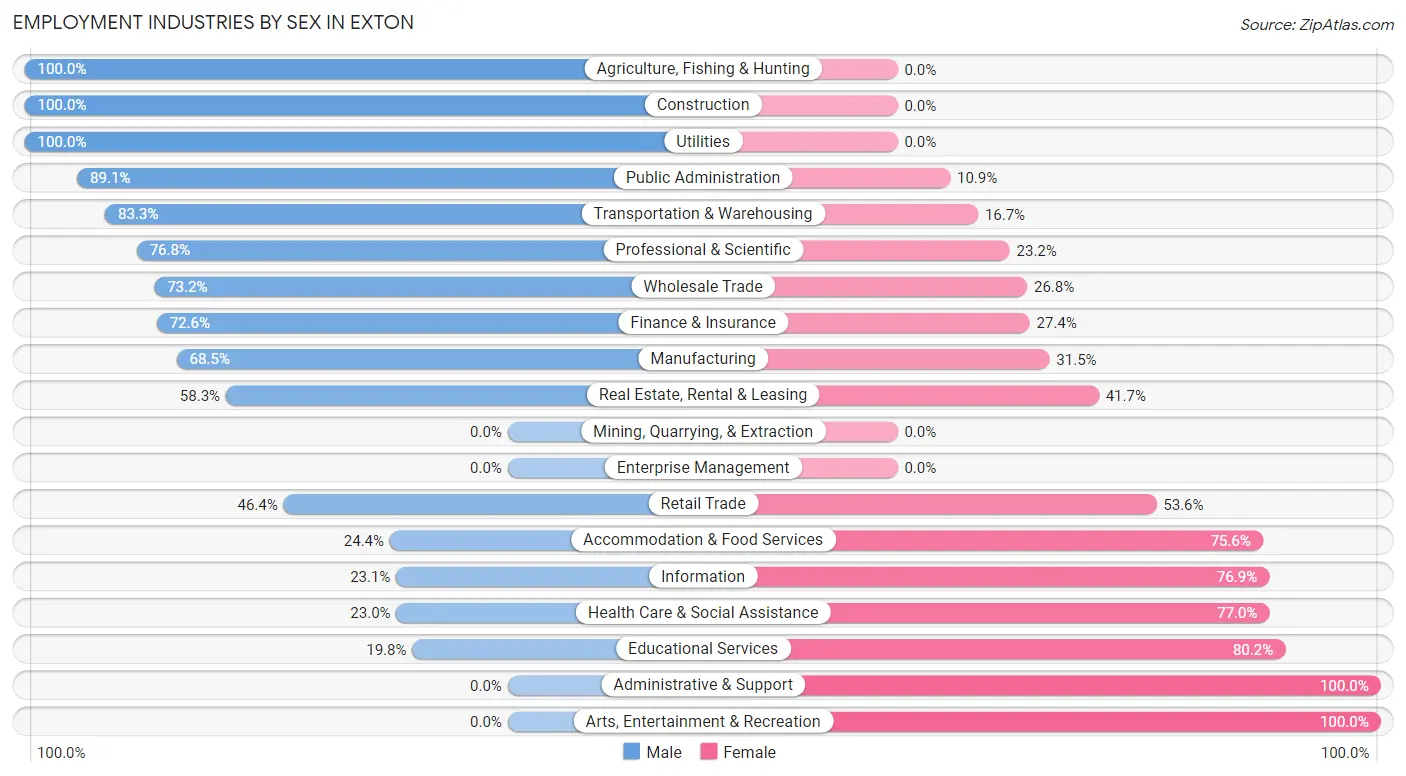
Employment Industries by Sex in Exton
The Exton industries that see more men than women are Agriculture, Fishing & Hunting (100.0%), Construction (100.0%), and Utilities (100.0%), whereas the industries that tend to have a higher number of women are Administrative & Support (100.0%), Arts, Entertainment & Recreation (100.0%), and Educational Services (80.2%).
| Industry | Male | Female |
| Agriculture, Fishing & Hunting | 20 (100.0%) | 0 (0.0%) |
| Mining, Quarrying, & Extraction | 0 (0.0%) | 0 (0.0%) |
| Construction | 207 (100.0%) | 0 (0.0%) |
| Manufacturing | 220 (68.5%) | 101 (31.5%) |
| Wholesale Trade | 30 (73.2%) | 11 (26.8%) |
| Retail Trade | 97 (46.4%) | 112 (53.6%) |
| Transportation & Warehousing | 65 (83.3%) | 13 (16.7%) |
| Utilities | 43 (100.0%) | 0 (0.0%) |
| Information | 15 (23.1%) | 50 (76.9%) |
| Finance & Insurance | 377 (72.6%) | 142 (27.4%) |
| Real Estate, Rental & Leasing | 21 (58.3%) | 15 (41.7%) |
| Professional & Scientific | 615 (76.8%) | 186 (23.2%) |
| Enterprise Management | 0 (0.0%) | 0 (0.0%) |
| Administrative & Support | 0 (0.0%) | 74 (100.0%) |
| Educational Services | 66 (19.8%) | 268 (80.2%) |
| Health Care & Social Assistance | 94 (23.0%) | 314 (77.0%) |
| Arts, Entertainment & Recreation | 0 (0.0%) | 37 (100.0%) |
| Accommodation & Food Services | 10 (24.4%) | 31 (75.6%) |
| Public Administration | 90 (89.1%) | 11 (10.9%) |
| Total | 2,013 (58.1%) | 1,453 (41.9%) |
Education in Exton
School Enrollment in Exton
The most common levels of schooling among the 926 students in Exton are high school (247 | 26.7%), middle school (171 | 18.5%), and graduate / professional (156 | 16.9%).
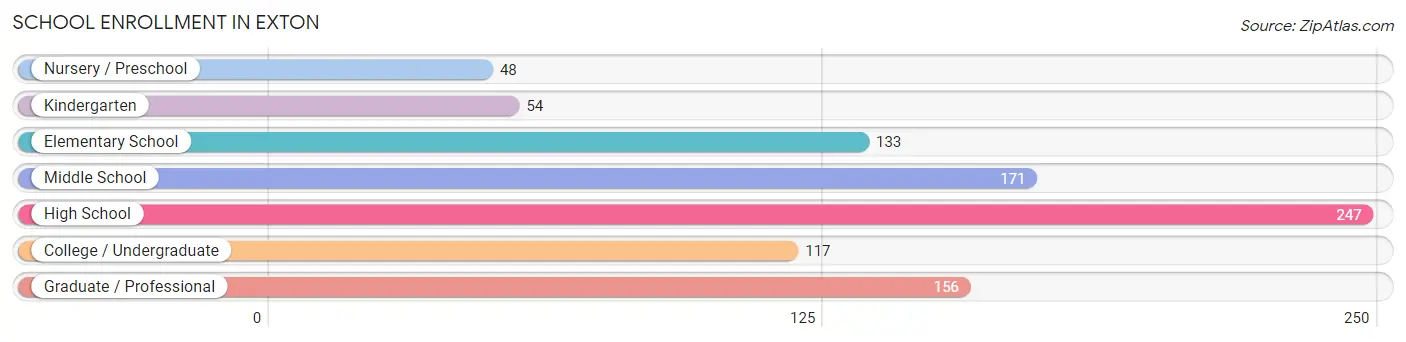
| School Level | # Students | % Students |
| Nursery / Preschool | 48 | 5.2% |
| Kindergarten | 54 | 5.8% |
| Elementary School | 133 | 14.4% |
| Middle School | 171 | 18.5% |
| High School | 247 | 26.7% |
| College / Undergraduate | 117 | 12.6% |
| Graduate / Professional | 156 | 16.9% |
| Total | 926 | 100.0% |
School Enrollment by Age by Funding Source in Exton
Out of a total of 926 students who are enrolled in schools in Exton, 354 (38.2%) attend a private institution, while the remaining 572 (61.8%) are enrolled in public schools. The age group of 3 to 4 year olds has the highest likelihood of being enrolled in private schools, with 28 (100.0% in the age bracket) enrolled. Conversely, the age group of 18 to 19 year olds has the lowest likelihood of being enrolled in a private school, with 19 (100.0% in the age bracket) attending a public institution.
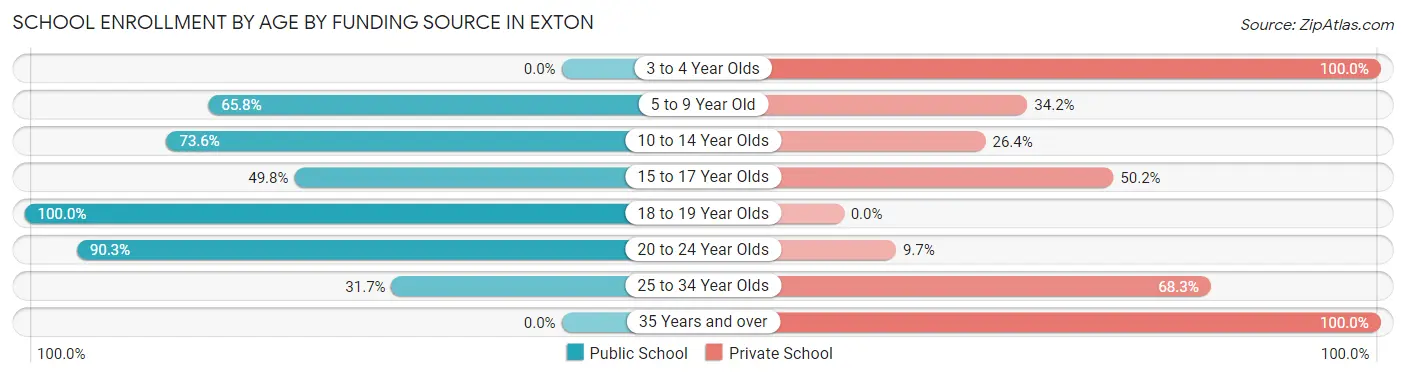
| Age Bracket | Public School | Private School |
| 3 to 4 Year Olds | 0 (0.0%) | 28 (100.0%) |
| 5 to 9 Year Old | 123 (65.8%) | 64 (34.2%) |
| 10 to 14 Year Olds | 156 (73.6%) | 56 (26.4%) |
| 15 to 17 Year Olds | 103 (49.8%) | 104 (50.2%) |
| 18 to 19 Year Olds | 19 (100.0%) | 0 (0.0%) |
| 20 to 24 Year Olds | 139 (90.3%) | 15 (9.7%) |
| 25 to 34 Year Olds | 32 (31.7%) | 69 (68.3%) |
| 35 Years and over | 0 (0.0%) | 18 (100.0%) |
| Total | 572 (61.8%) | 354 (38.2%) |
Educational Attainment by Field of Study in Exton
Computers & mathematics (564 | 17.1%), business (539 | 16.4%), engineering (458 | 13.9%), education (286 | 8.7%), and literature & languages (266 | 8.1%) are the most common fields of study among 3,294 individuals in Exton who have obtained a bachelor's degree or higher.
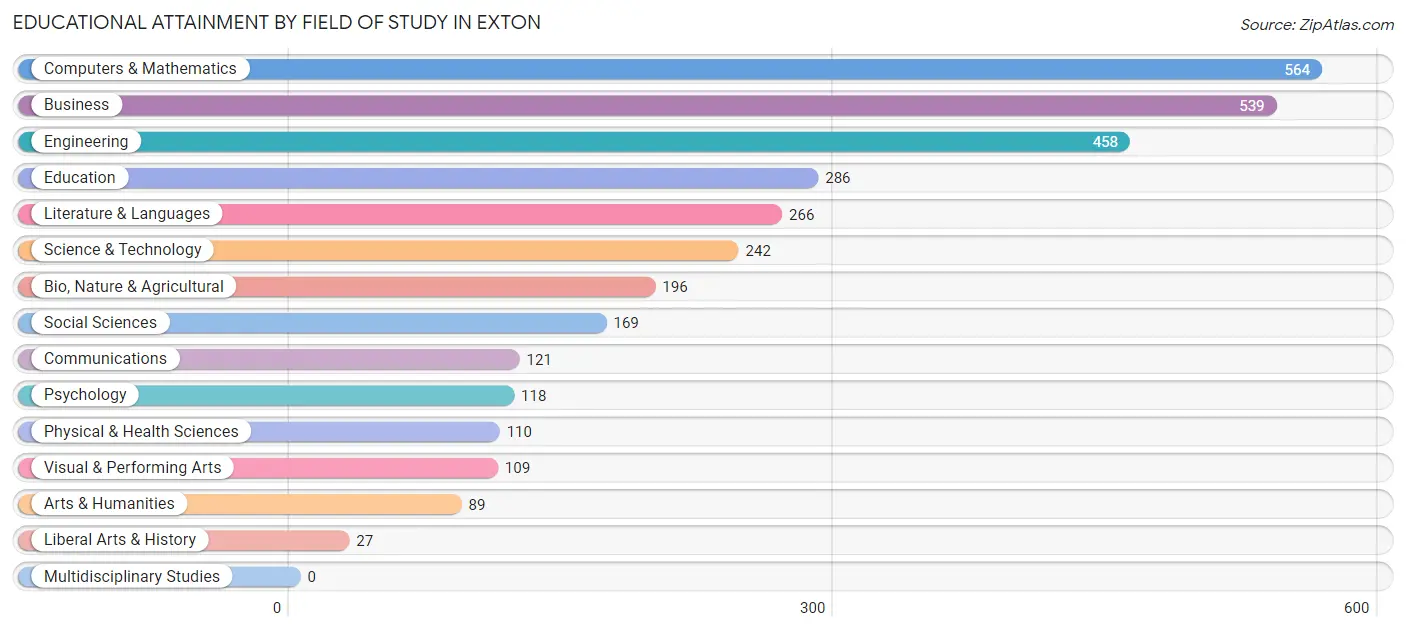
| Field of Study | # Graduates | % Graduates |
| Computers & Mathematics | 564 | 17.1% |
| Bio, Nature & Agricultural | 196 | 5.9% |
| Physical & Health Sciences | 110 | 3.3% |
| Psychology | 118 | 3.6% |
| Social Sciences | 169 | 5.1% |
| Engineering | 458 | 13.9% |
| Multidisciplinary Studies | 0 | 0.0% |
| Science & Technology | 242 | 7.3% |
| Business | 539 | 16.4% |
| Education | 286 | 8.7% |
| Literature & Languages | 266 | 8.1% |
| Liberal Arts & History | 27 | 0.8% |
| Visual & Performing Arts | 109 | 3.3% |
| Communications | 121 | 3.7% |
| Arts & Humanities | 89 | 2.7% |
| Total | 3,294 | 100.0% |
Transportation & Commute in Exton
Vehicle Availability by Sex in Exton
The most prevalent vehicle ownership categories in Exton are males with 2 vehicles (908, accounting for 45.1%) and females with 2 vehicles (589, making up 65.2%).
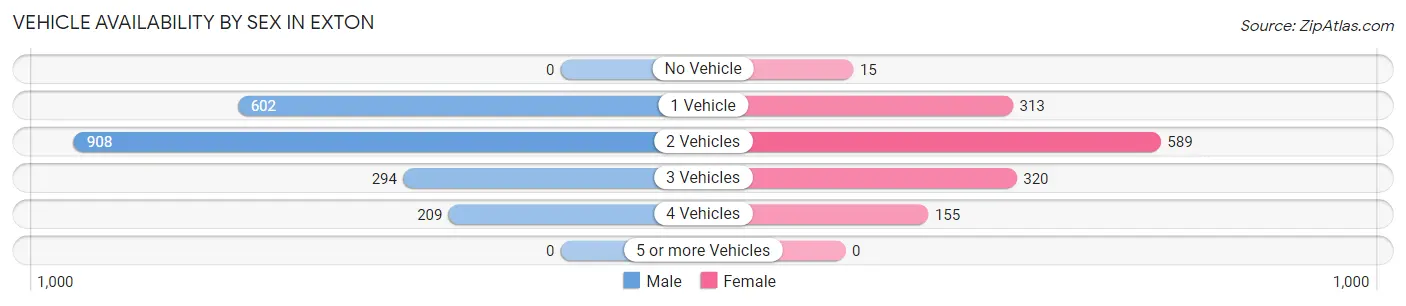
| Vehicles Available | Male | Female |
| No Vehicle | 0 (0.0%) | 15 (1.1%) |
| 1 Vehicle | 602 (29.9%) | 313 (22.5%) |
| 2 Vehicles | 908 (45.1%) | 589 (42.3%) |
| 3 Vehicles | 294 (14.6%) | 320 (23.0%) |
| 4 Vehicles | 209 (10.4%) | 155 (11.1%) |
| 5 or more Vehicles | 0 (0.0%) | 0 (0.0%) |
| Total | 2,013 (100.0%) | 1,392 (100.0%) |
Commute Time in Exton
The most frequently occuring commute durations in Exton are 15 to 19 minutes (597 commuters, 24.4%), 20 to 24 minutes (574 commuters, 23.4%), and 60 to 89 minutes (311 commuters, 12.7%).
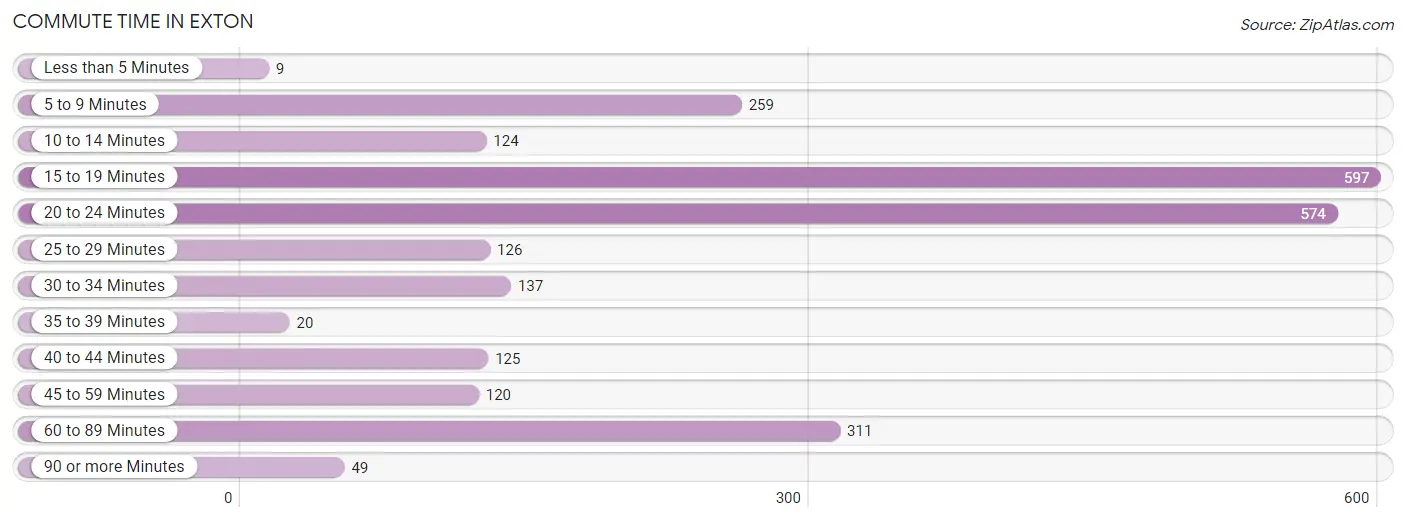
| Commute Time | # Commuters | % Commuters |
| Less than 5 Minutes | 9 | 0.4% |
| 5 to 9 Minutes | 259 | 10.6% |
| 10 to 14 Minutes | 124 | 5.1% |
| 15 to 19 Minutes | 597 | 24.4% |
| 20 to 24 Minutes | 574 | 23.4% |
| 25 to 29 Minutes | 126 | 5.1% |
| 30 to 34 Minutes | 137 | 5.6% |
| 35 to 39 Minutes | 20 | 0.8% |
| 40 to 44 Minutes | 125 | 5.1% |
| 45 to 59 Minutes | 120 | 4.9% |
| 60 to 89 Minutes | 311 | 12.7% |
| 90 or more Minutes | 49 | 2.0% |
Commute Time by Sex in Exton
The most common commute times in Exton are 15 to 19 minutes (382 commuters, 27.9%) for males and 20 to 24 minutes (304 commuters, 28.1%) for females.
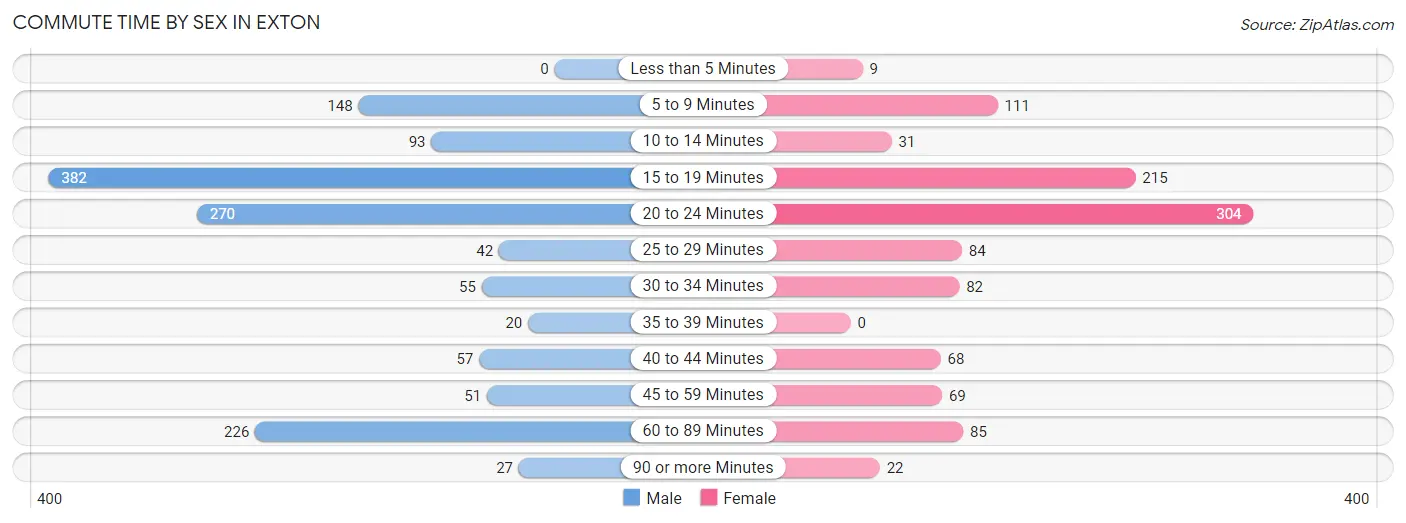
| Commute Time | Male | Female |
| Less than 5 Minutes | 0 (0.0%) | 9 (0.8%) |
| 5 to 9 Minutes | 148 (10.8%) | 111 (10.3%) |
| 10 to 14 Minutes | 93 (6.8%) | 31 (2.9%) |
| 15 to 19 Minutes | 382 (27.9%) | 215 (19.9%) |
| 20 to 24 Minutes | 270 (19.7%) | 304 (28.1%) |
| 25 to 29 Minutes | 42 (3.1%) | 84 (7.8%) |
| 30 to 34 Minutes | 55 (4.0%) | 82 (7.6%) |
| 35 to 39 Minutes | 20 (1.5%) | 0 (0.0%) |
| 40 to 44 Minutes | 57 (4.2%) | 68 (6.3%) |
| 45 to 59 Minutes | 51 (3.7%) | 69 (6.4%) |
| 60 to 89 Minutes | 226 (16.5%) | 85 (7.9%) |
| 90 or more Minutes | 27 (2.0%) | 22 (2.0%) |
Time of Departure to Work by Sex in Exton
The most frequent times of departure to work in Exton are 9:00 AM to 9:59 AM (318, 23.2%) for males and 7:30 AM to 7:59 AM (334, 30.9%) for females.
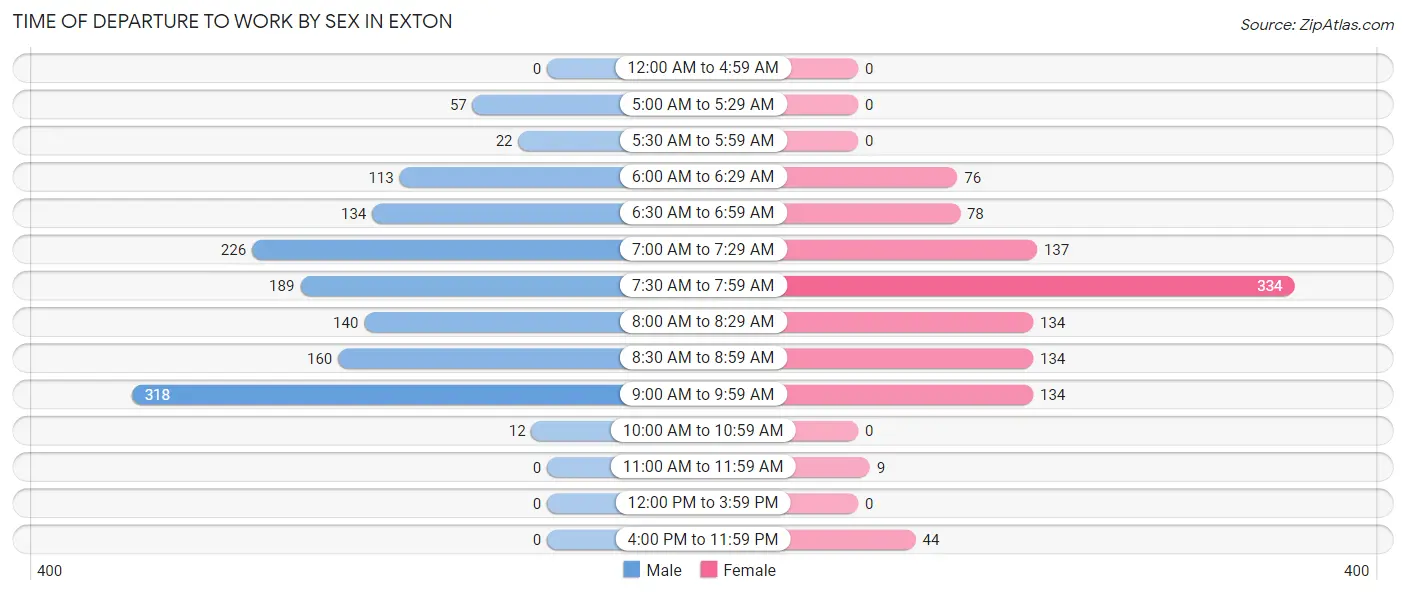
| Time of Departure | Male | Female |
| 12:00 AM to 4:59 AM | 0 (0.0%) | 0 (0.0%) |
| 5:00 AM to 5:29 AM | 57 (4.2%) | 0 (0.0%) |
| 5:30 AM to 5:59 AM | 22 (1.6%) | 0 (0.0%) |
| 6:00 AM to 6:29 AM | 113 (8.2%) | 76 (7.0%) |
| 6:30 AM to 6:59 AM | 134 (9.8%) | 78 (7.2%) |
| 7:00 AM to 7:29 AM | 226 (16.5%) | 137 (12.7%) |
| 7:30 AM to 7:59 AM | 189 (13.8%) | 334 (30.9%) |
| 8:00 AM to 8:29 AM | 140 (10.2%) | 134 (12.4%) |
| 8:30 AM to 8:59 AM | 160 (11.7%) | 134 (12.4%) |
| 9:00 AM to 9:59 AM | 318 (23.2%) | 134 (12.4%) |
| 10:00 AM to 10:59 AM | 12 (0.9%) | 0 (0.0%) |
| 11:00 AM to 11:59 AM | 0 (0.0%) | 9 (0.8%) |
| 12:00 PM to 3:59 PM | 0 (0.0%) | 0 (0.0%) |
| 4:00 PM to 11:59 PM | 0 (0.0%) | 44 (4.1%) |
| Total | 1,371 (100.0%) | 1,080 (100.0%) |
Housing Occupancy in Exton
Occupancy by Ownership in Exton
Of the total 2,579 dwellings in Exton, owner-occupied units account for 838 (32.5%), while renter-occupied units make up 1,741 (67.5%).
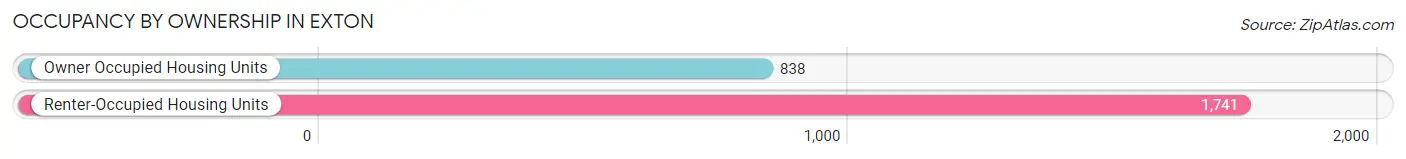
| Occupancy | # Housing Units | % Housing Units |
| Owner Occupied Housing Units | 838 | 32.5% |
| Renter-Occupied Housing Units | 1,741 | 67.5% |
| Total Occupied Housing Units | 2,579 | 100.0% |
Occupancy by Household Size in Exton
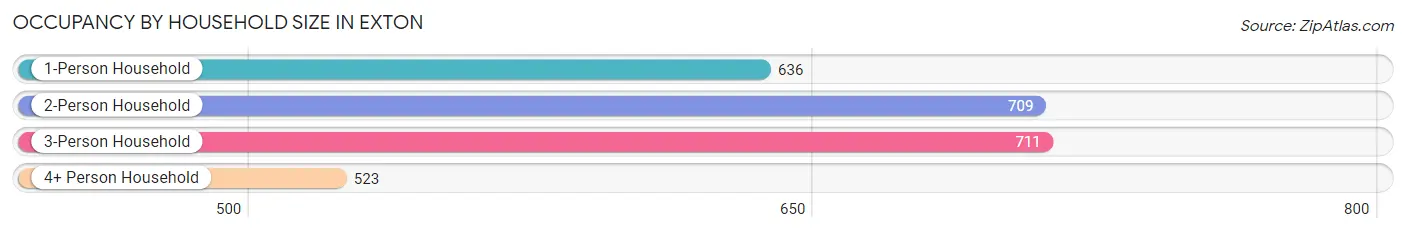
| Household Size | # Housing Units | % Housing Units |
| 1-Person Household | 636 | 24.7% |
| 2-Person Household | 709 | 27.5% |
| 3-Person Household | 711 | 27.6% |
| 4+ Person Household | 523 | 20.3% |
| Total Housing Units | 2,579 | 100.0% |
Occupancy by Ownership by Household Size in Exton
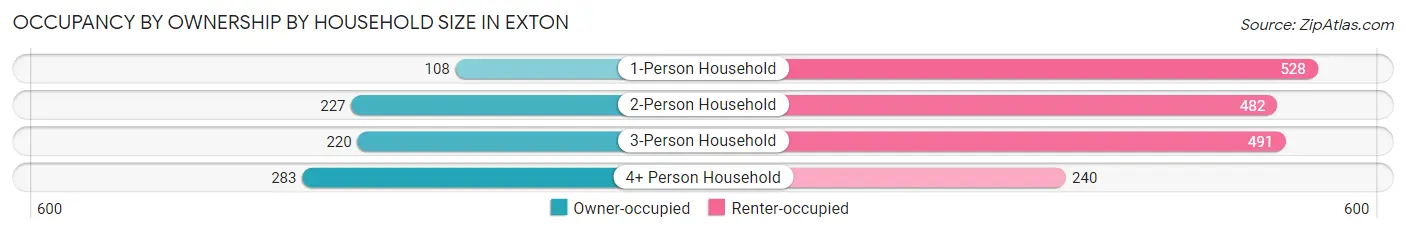
| Household Size | Owner-occupied | Renter-occupied |
| 1-Person Household | 108 (17.0%) | 528 (83.0%) |
| 2-Person Household | 227 (32.0%) | 482 (68.0%) |
| 3-Person Household | 220 (30.9%) | 491 (69.1%) |
| 4+ Person Household | 283 (54.1%) | 240 (45.9%) |
| Total Housing Units | 838 (32.5%) | 1,741 (67.5%) |
Occupancy by Educational Attainment in Exton
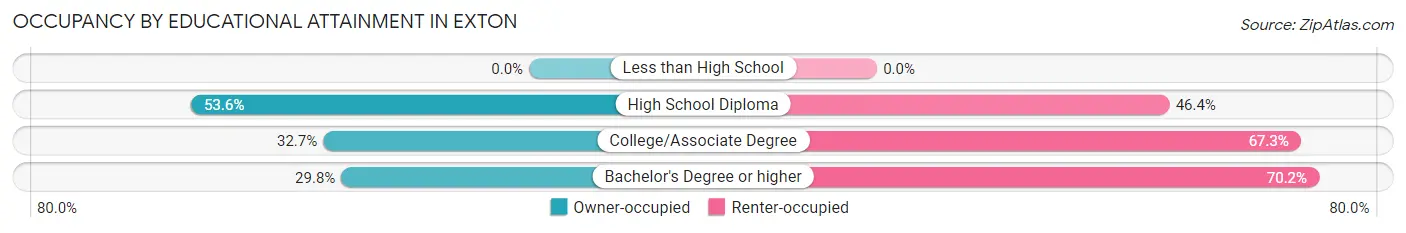
| Household Size | Owner-occupied | Renter-occupied |
| Less than High School | 0 (0.0%) | 0 (0.0%) |
| High School Diploma | 134 (53.6%) | 116 (46.4%) |
| College/Associate Degree | 115 (32.7%) | 237 (67.3%) |
| Bachelor's Degree or higher | 589 (29.8%) | 1,388 (70.2%) |
Occupancy by Age of Householder in Exton
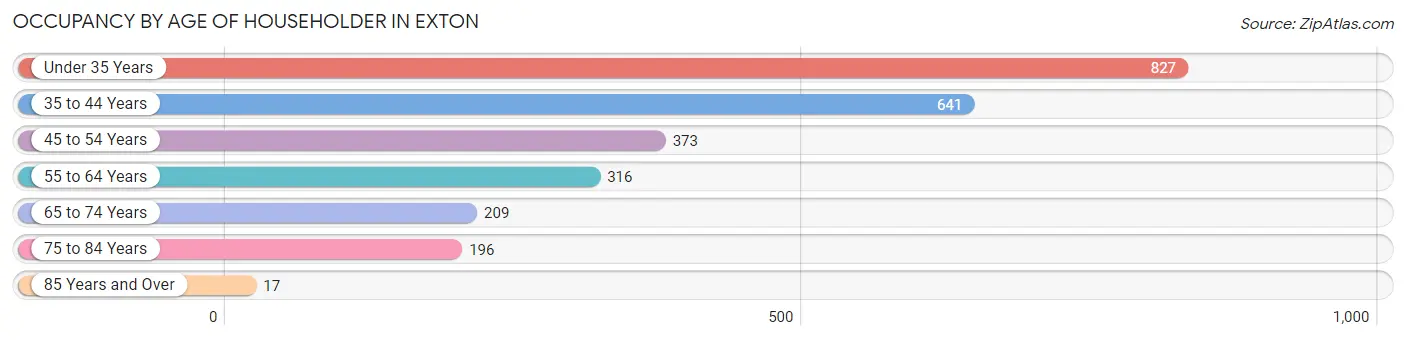
| Age Bracket | # Households | % Households |
| Under 35 Years | 827 | 32.1% |
| 35 to 44 Years | 641 | 24.8% |
| 45 to 54 Years | 373 | 14.5% |
| 55 to 64 Years | 316 | 12.2% |
| 65 to 74 Years | 209 | 8.1% |
| 75 to 84 Years | 196 | 7.6% |
| 85 Years and Over | 17 | 0.7% |
| Total | 2,579 | 100.0% |
Housing Finances in Exton
Median Income by Occupancy in Exton
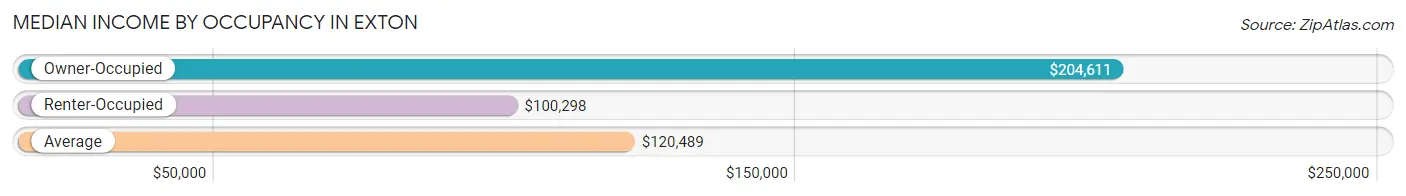
| Occupancy Type | # Households | Median Income |
| Owner-Occupied | 838 (32.5%) | $204,611 |
| Renter-Occupied | 1,741 (67.5%) | $100,298 |
| Average | 2,579 (100.0%) | $120,489 |
Occupancy by Householder Income Bracket in Exton
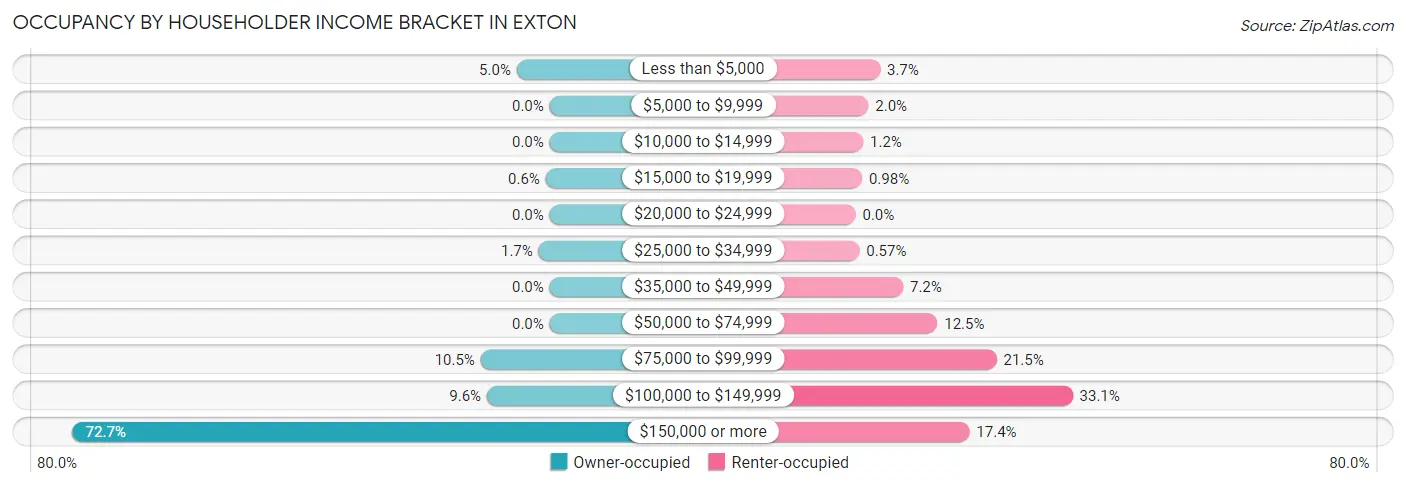
| Income Bracket | Owner-occupied | Renter-occupied |
| Less than $5,000 | 42 (5.0%) | 65 (3.7%) |
| $5,000 to $9,999 | 0 (0.0%) | 34 (1.9%) |
| $10,000 to $14,999 | 0 (0.0%) | 20 (1.1%) |
| $15,000 to $19,999 | 5 (0.6%) | 17 (1.0%) |
| $20,000 to $24,999 | 0 (0.0%) | 0 (0.0%) |
| $25,000 to $34,999 | 14 (1.7%) | 10 (0.6%) |
| $35,000 to $49,999 | 0 (0.0%) | 126 (7.2%) |
| $50,000 to $74,999 | 0 (0.0%) | 217 (12.5%) |
| $75,000 to $99,999 | 88 (10.5%) | 374 (21.5%) |
| $100,000 to $149,999 | 80 (9.6%) | 576 (33.1%) |
| $150,000 or more | 609 (72.7%) | 302 (17.3%) |
| Total | 838 (100.0%) | 1,741 (100.0%) |
Monthly Housing Cost Tiers in Exton
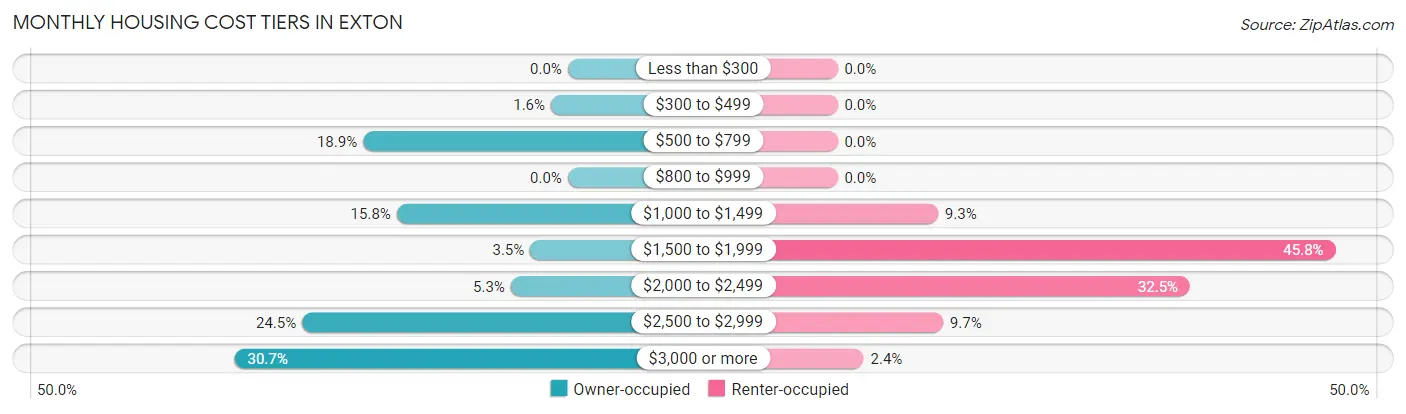
| Monthly Cost | Owner-occupied | Renter-occupied |
| Less than $300 | 0 (0.0%) | 0 (0.0%) |
| $300 to $499 | 13 (1.5%) | 0 (0.0%) |
| $500 to $799 | 158 (18.9%) | 0 (0.0%) |
| $800 to $999 | 0 (0.0%) | 0 (0.0%) |
| $1,000 to $1,499 | 132 (15.8%) | 161 (9.2%) |
| $1,500 to $1,999 | 29 (3.5%) | 798 (45.8%) |
| $2,000 to $2,499 | 44 (5.2%) | 565 (32.5%) |
| $2,500 to $2,999 | 205 (24.5%) | 169 (9.7%) |
| $3,000 or more | 257 (30.7%) | 42 (2.4%) |
| Total | 838 (100.0%) | 1,741 (100.0%) |
Physical Housing Characteristics in Exton
Housing Structures in Exton
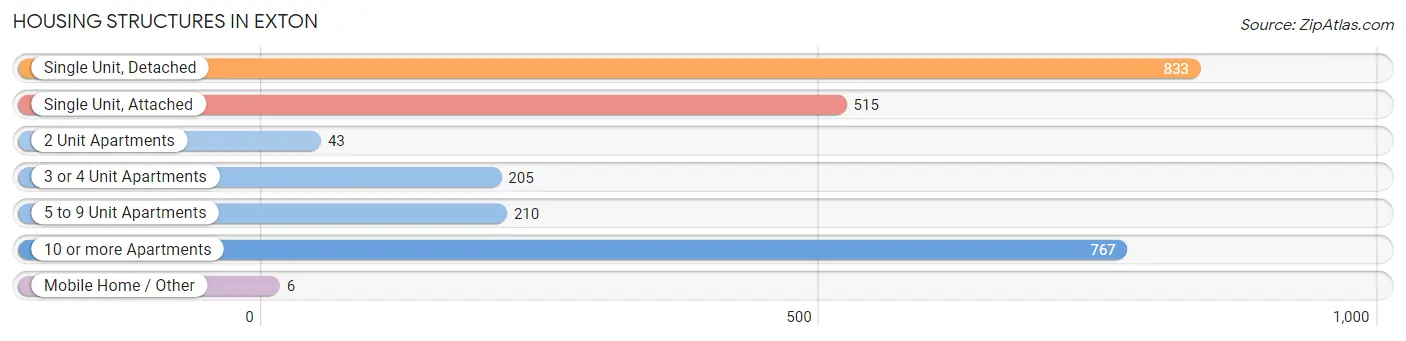
| Structure Type | # Housing Units | % Housing Units |
| Single Unit, Detached | 833 | 32.3% |
| Single Unit, Attached | 515 | 20.0% |
| 2 Unit Apartments | 43 | 1.7% |
| 3 or 4 Unit Apartments | 205 | 8.0% |
| 5 to 9 Unit Apartments | 210 | 8.1% |
| 10 or more Apartments | 767 | 29.7% |
| Mobile Home / Other | 6 | 0.2% |
| Total | 2,579 | 100.0% |
Housing Structures by Occupancy in Exton
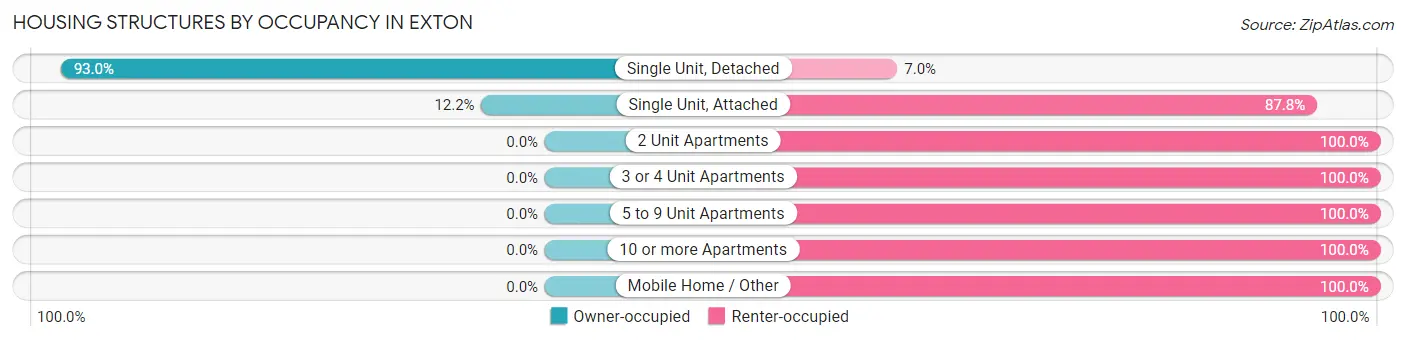
| Structure Type | Owner-occupied | Renter-occupied |
| Single Unit, Detached | 775 (93.0%) | 58 (7.0%) |
| Single Unit, Attached | 63 (12.2%) | 452 (87.8%) |
| 2 Unit Apartments | 0 (0.0%) | 43 (100.0%) |
| 3 or 4 Unit Apartments | 0 (0.0%) | 205 (100.0%) |
| 5 to 9 Unit Apartments | 0 (0.0%) | 210 (100.0%) |
| 10 or more Apartments | 0 (0.0%) | 767 (100.0%) |
| Mobile Home / Other | 0 (0.0%) | 6 (100.0%) |
| Total | 838 (32.5%) | 1,741 (67.5%) |
Housing Structures by Number of Rooms in Exton
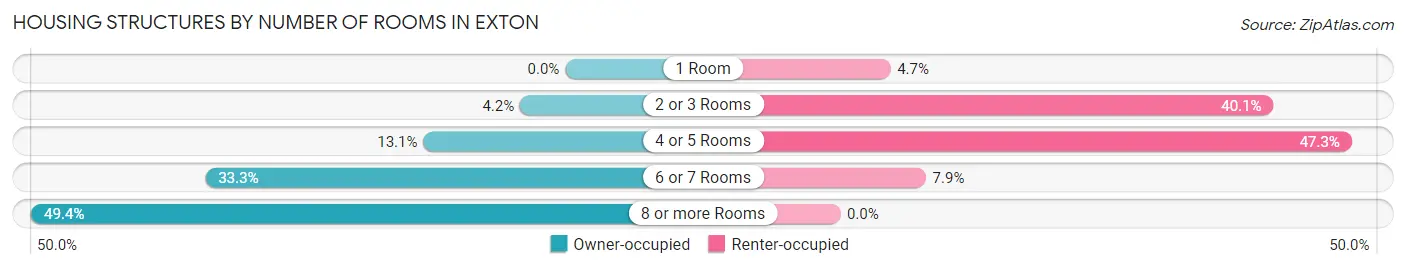
| Number of Rooms | Owner-occupied | Renter-occupied |
| 1 Room | 0 (0.0%) | 81 (4.6%) |
| 2 or 3 Rooms | 35 (4.2%) | 698 (40.1%) |
| 4 or 5 Rooms | 110 (13.1%) | 824 (47.3%) |
| 6 or 7 Rooms | 279 (33.3%) | 138 (7.9%) |
| 8 or more Rooms | 414 (49.4%) | 0 (0.0%) |
| Total | 838 (100.0%) | 1,741 (100.0%) |
Housing Structure by Heating Type in Exton
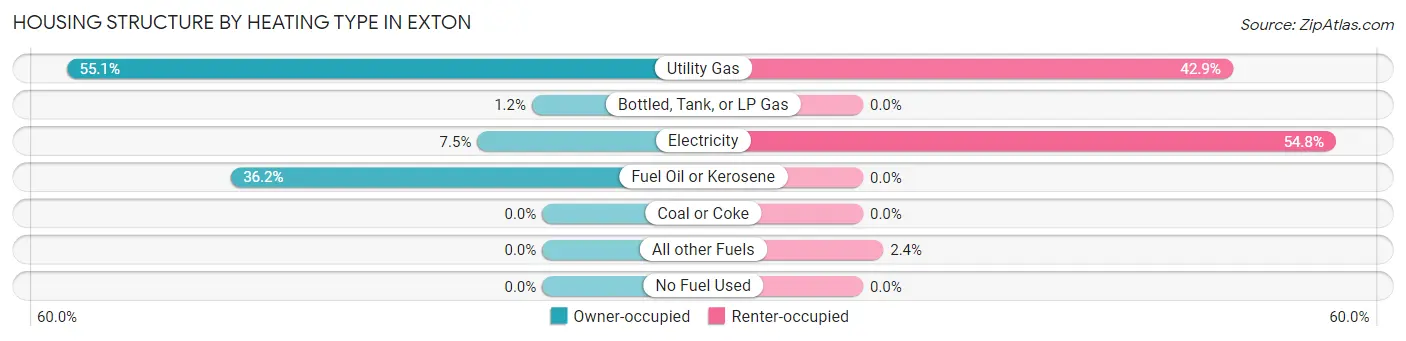
| Heating Type | Owner-occupied | Renter-occupied |
| Utility Gas | 462 (55.1%) | 746 (42.8%) |
| Bottled, Tank, or LP Gas | 10 (1.2%) | 0 (0.0%) |
| Electricity | 63 (7.5%) | 954 (54.8%) |
| Fuel Oil or Kerosene | 303 (36.2%) | 0 (0.0%) |
| Coal or Coke | 0 (0.0%) | 0 (0.0%) |
| All other Fuels | 0 (0.0%) | 41 (2.4%) |
| No Fuel Used | 0 (0.0%) | 0 (0.0%) |
| Total | 838 (100.0%) | 1,741 (100.0%) |
Household Vehicle Usage in Exton
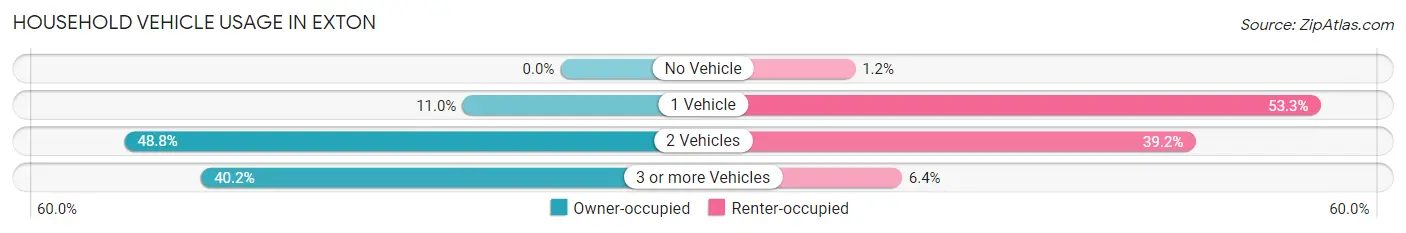
| Vehicles per Household | Owner-occupied | Renter-occupied |
| No Vehicle | 0 (0.0%) | 20 (1.1%) |
| 1 Vehicle | 92 (11.0%) | 927 (53.2%) |
| 2 Vehicles | 409 (48.8%) | 683 (39.2%) |
| 3 or more Vehicles | 337 (40.2%) | 111 (6.4%) |
| Total | 838 (100.0%) | 1,741 (100.0%) |
Real Estate & Mortgages in Exton
Real Estate and Mortgage Overview in Exton
| Characteristic | Without Mortgage | With Mortgage |
| Housing Units | 302 | 536 |
| Median Property Value | $356,500 | $593,200 |
| Median Household Income | $202,528 | $447 |
| Monthly Housing Costs | $757 | $257 |
| Real Estate Taxes | $4,778 | $0 |
Property Value by Mortgage Status in Exton
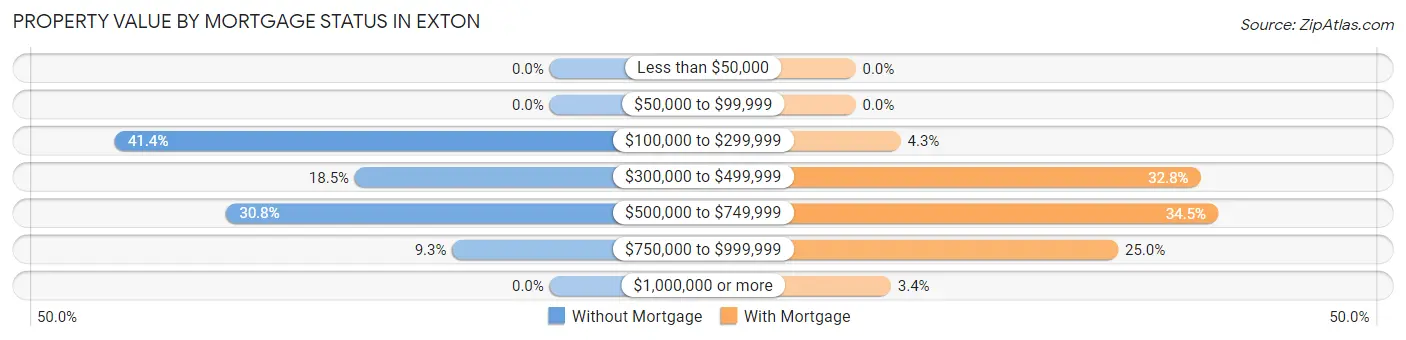
| Property Value | Without Mortgage | With Mortgage |
| Less than $50,000 | 0 (0.0%) | 0 (0.0%) |
| $50,000 to $99,999 | 0 (0.0%) | 0 (0.0%) |
| $100,000 to $299,999 | 125 (41.4%) | 23 (4.3%) |
| $300,000 to $499,999 | 56 (18.5%) | 176 (32.8%) |
| $500,000 to $749,999 | 93 (30.8%) | 185 (34.5%) |
| $750,000 to $999,999 | 28 (9.3%) | 134 (25.0%) |
| $1,000,000 or more | 0 (0.0%) | 18 (3.4%) |
| Total | 302 (100.0%) | 536 (100.0%) |
Household Income by Mortgage Status in Exton
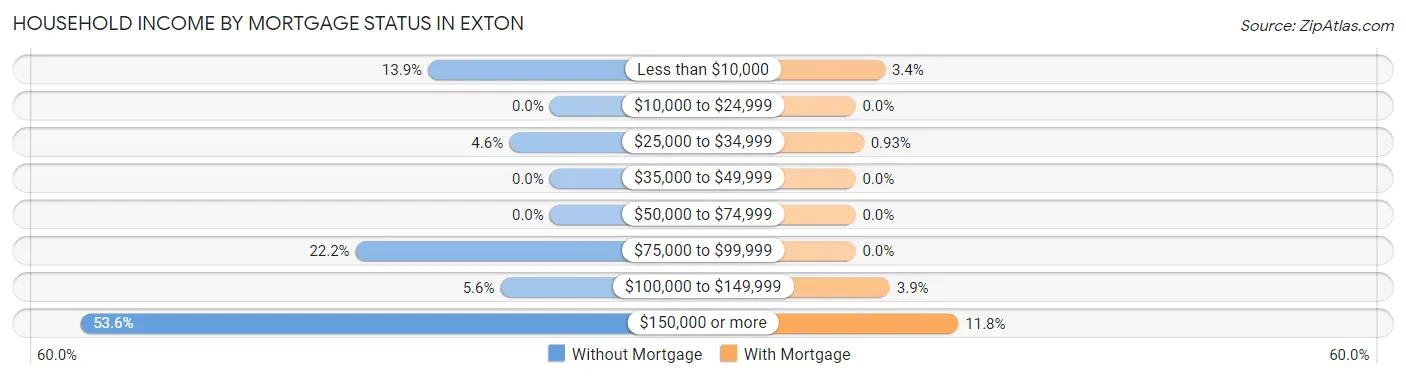
| Household Income | Without Mortgage | With Mortgage |
| Less than $10,000 | 42 (13.9%) | 18 (3.4%) |
| $10,000 to $24,999 | 0 (0.0%) | 0 (0.0%) |
| $25,000 to $34,999 | 14 (4.6%) | 5 (0.9%) |
| $35,000 to $49,999 | 0 (0.0%) | 0 (0.0%) |
| $50,000 to $74,999 | 0 (0.0%) | 0 (0.0%) |
| $75,000 to $99,999 | 67 (22.2%) | 0 (0.0%) |
| $100,000 to $149,999 | 17 (5.6%) | 21 (3.9%) |
| $150,000 or more | 162 (53.6%) | 63 (11.7%) |
| Total | 302 (100.0%) | 536 (100.0%) |
Property Value to Household Income Ratio in Exton
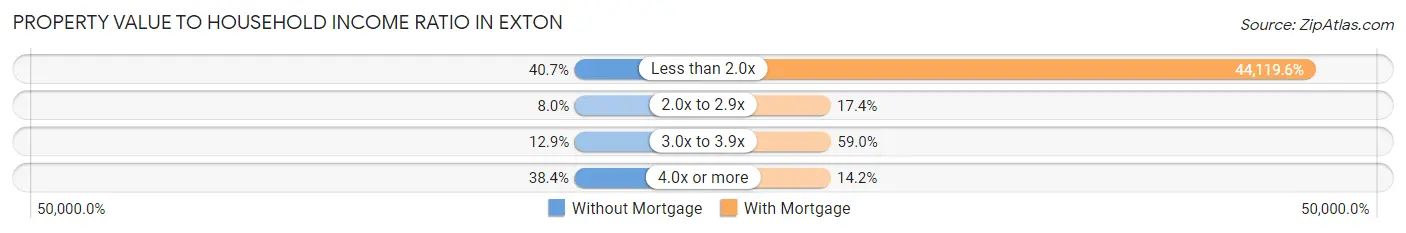
| Value-to-Income Ratio | Without Mortgage | With Mortgage |
| Less than 2.0x | 123 (40.7%) | 236,481 (44,119.6%) |
| 2.0x to 2.9x | 24 (8.0%) | 93 (17.3%) |
| 3.0x to 3.9x | 39 (12.9%) | 316 (59.0%) |
| 4.0x or more | 116 (38.4%) | 76 (14.2%) |
| Total | 302 (100.0%) | 536 (100.0%) |
Real Estate Taxes by Mortgage Status in Exton
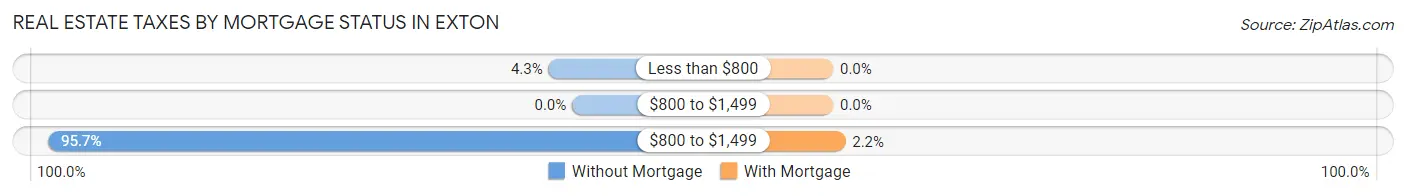
| Property Taxes | Without Mortgage | With Mortgage |
| Less than $800 | 13 (4.3%) | 0 (0.0%) |
| $800 to $1,499 | 0 (0.0%) | 0 (0.0%) |
| $800 to $1,499 | 289 (95.7%) | 12 (2.2%) |
| Total | 302 (100.0%) | 536 (100.0%) |
Health & Disability in Exton
Health Insurance Coverage by Age in Exton
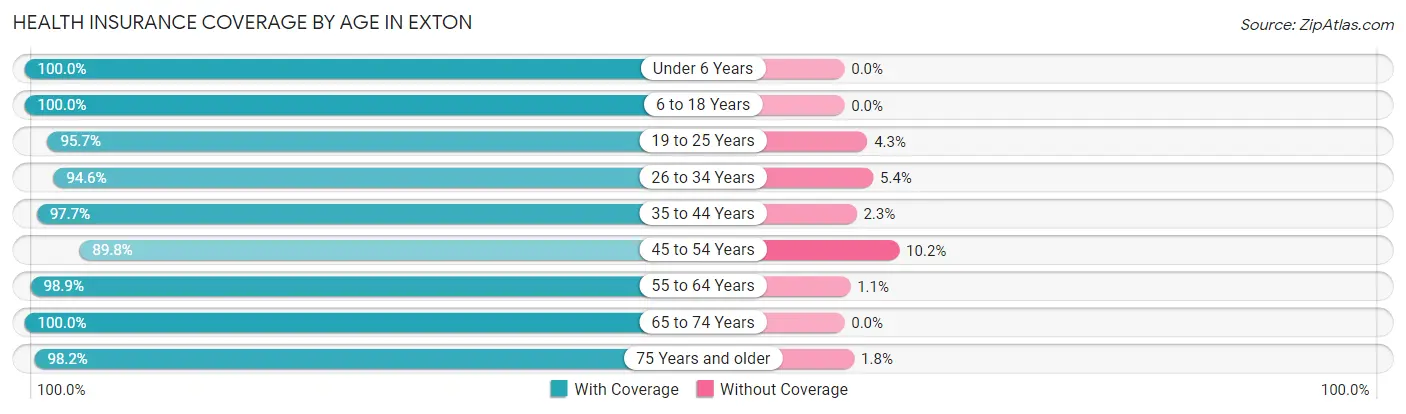
| Age Bracket | With Coverage | Without Coverage |
| Under 6 Years | 798 (100.0%) | 0 (0.0%) |
| 6 to 18 Years | 647 (100.0%) | 0 (0.0%) |
| 19 to 25 Years | 448 (95.7%) | 20 (4.3%) |
| 26 to 34 Years | 1,392 (94.6%) | 79 (5.4%) |
| 35 to 44 Years | 948 (97.7%) | 22 (2.3%) |
| 45 to 54 Years | 702 (89.8%) | 80 (10.2%) |
| 55 to 64 Years | 449 (98.9%) | 5 (1.1%) |
| 65 to 74 Years | 403 (100.0%) | 0 (0.0%) |
| 75 Years and older | 267 (98.2%) | 5 (1.8%) |
| Total | 6,054 (96.6%) | 211 (3.4%) |
Health Insurance Coverage by Citizenship Status in Exton
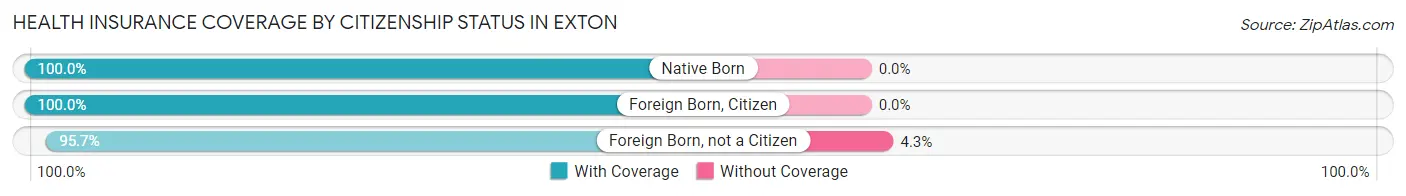
| Citizenship Status | With Coverage | Without Coverage |
| Native Born | 798 (100.0%) | 0 (0.0%) |
| Foreign Born, Citizen | 647 (100.0%) | 0 (0.0%) |
| Foreign Born, not a Citizen | 448 (95.7%) | 20 (4.3%) |
Health Insurance Coverage by Household Income in Exton
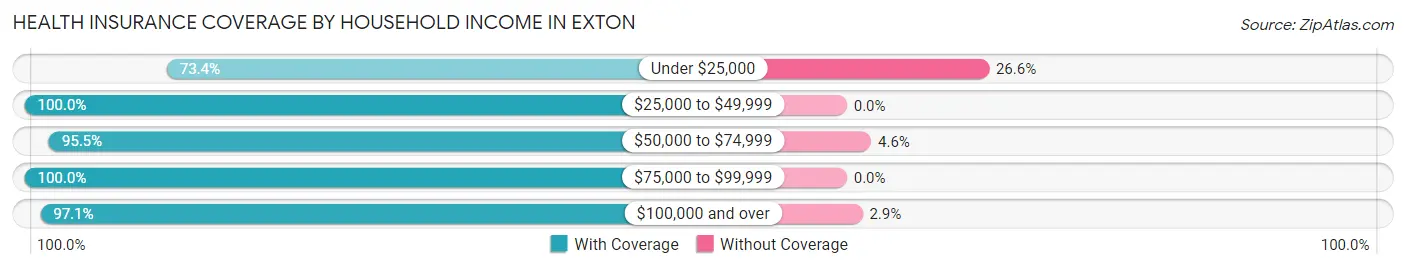
| Household Income | With Coverage | Without Coverage |
| Under $25,000 | 179 (73.4%) | 65 (26.6%) |
| $25,000 to $49,999 | 198 (100.0%) | 0 (0.0%) |
| $50,000 to $74,999 | 336 (95.5%) | 16 (4.5%) |
| $75,000 to $99,999 | 1,042 (100.0%) | 0 (0.0%) |
| $100,000 and over | 4,297 (97.1%) | 130 (2.9%) |
Public vs Private Health Insurance Coverage by Age in Exton
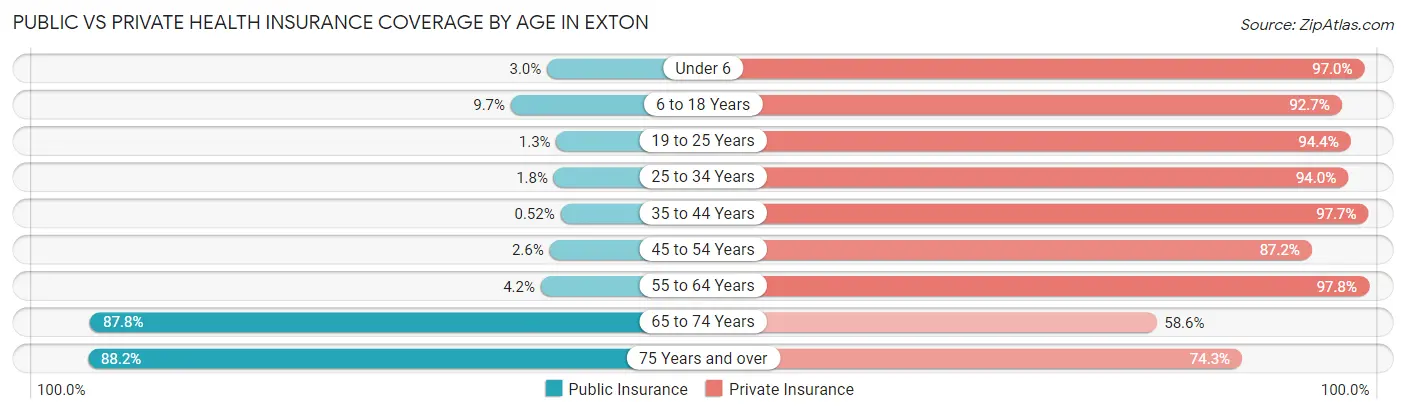
| Age Bracket | Public Insurance | Private Insurance |
| Under 6 | 24 (3.0%) | 774 (97.0%) |
| 6 to 18 Years | 63 (9.7%) | 600 (92.7%) |
| 19 to 25 Years | 6 (1.3%) | 442 (94.4%) |
| 25 to 34 Years | 26 (1.8%) | 1,382 (94.0%) |
| 35 to 44 Years | 5 (0.5%) | 948 (97.7%) |
| 45 to 54 Years | 20 (2.6%) | 682 (87.2%) |
| 55 to 64 Years | 19 (4.2%) | 444 (97.8%) |
| 65 to 74 Years | 354 (87.8%) | 236 (58.6%) |
| 75 Years and over | 240 (88.2%) | 202 (74.3%) |
| Total | 757 (12.1%) | 5,710 (91.1%) |
Disability Status by Sex by Age in Exton
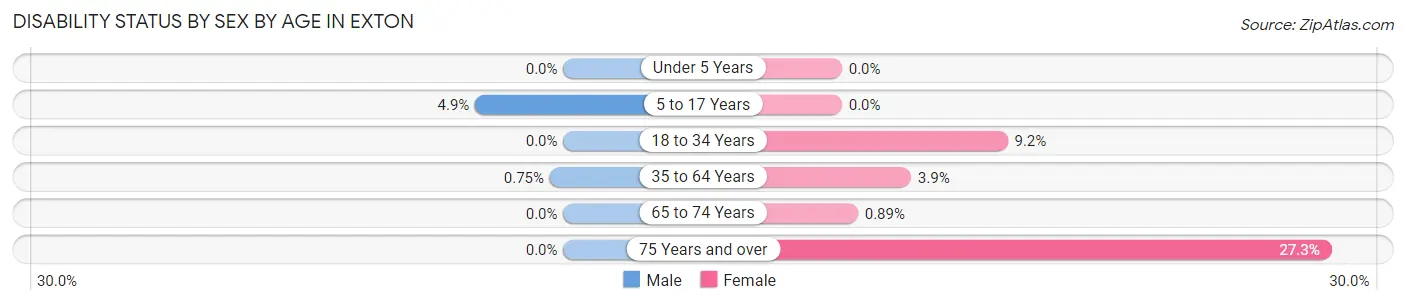
| Age Bracket | Male | Female |
| Under 5 Years | 0 (0.0%) | 0 (0.0%) |
| 5 to 17 Years | 19 (4.9%) | 0 (0.0%) |
| 18 to 34 Years | 0 (0.0%) | 100 (9.2%) |
| 35 to 64 Years | 9 (0.7%) | 39 (3.8%) |
| 65 to 74 Years | 0 (0.0%) | 2 (0.9%) |
| 75 Years and over | 0 (0.0%) | 48 (27.3%) |
Disability Class by Sex by Age in Exton
Disability Class: Hearing Difficulty
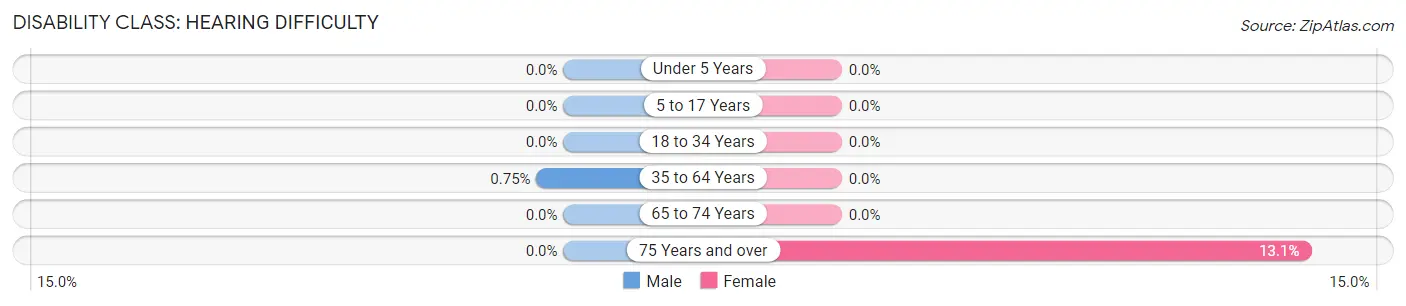
| Age Bracket | Male | Female |
| Under 5 Years | 0 (0.0%) | 0 (0.0%) |
| 5 to 17 Years | 0 (0.0%) | 0 (0.0%) |
| 18 to 34 Years | 0 (0.0%) | 0 (0.0%) |
| 35 to 64 Years | 9 (0.7%) | 0 (0.0%) |
| 65 to 74 Years | 0 (0.0%) | 0 (0.0%) |
| 75 Years and over | 0 (0.0%) | 23 (13.1%) |
Disability Class: Vision Difficulty
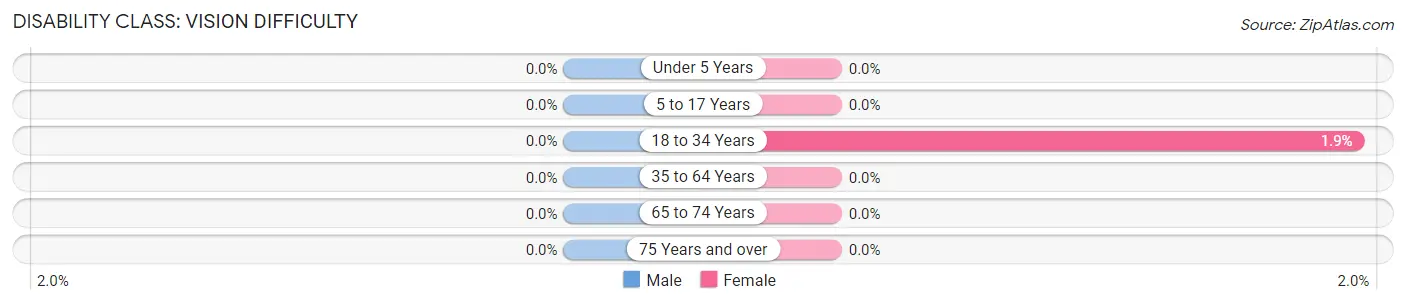
| Age Bracket | Male | Female |
| Under 5 Years | 0 (0.0%) | 0 (0.0%) |
| 5 to 17 Years | 0 (0.0%) | 0 (0.0%) |
| 18 to 34 Years | 0 (0.0%) | 21 (1.9%) |
| 35 to 64 Years | 0 (0.0%) | 0 (0.0%) |
| 65 to 74 Years | 0 (0.0%) | 0 (0.0%) |
| 75 Years and over | 0 (0.0%) | 0 (0.0%) |
Disability Class: Cognitive Difficulty
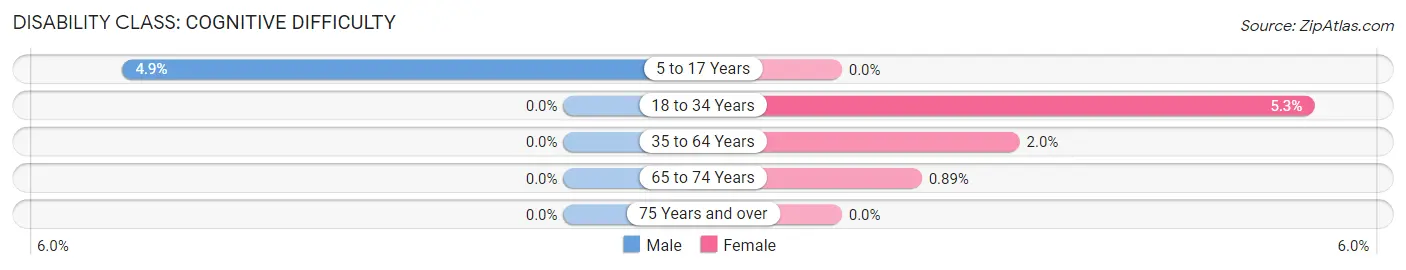
| Age Bracket | Male | Female |
| 5 to 17 Years | 19 (4.9%) | 0 (0.0%) |
| 18 to 34 Years | 0 (0.0%) | 57 (5.3%) |
| 35 to 64 Years | 0 (0.0%) | 20 (2.0%) |
| 65 to 74 Years | 0 (0.0%) | 2 (0.9%) |
| 75 Years and over | 0 (0.0%) | 0 (0.0%) |
Disability Class: Ambulatory Difficulty
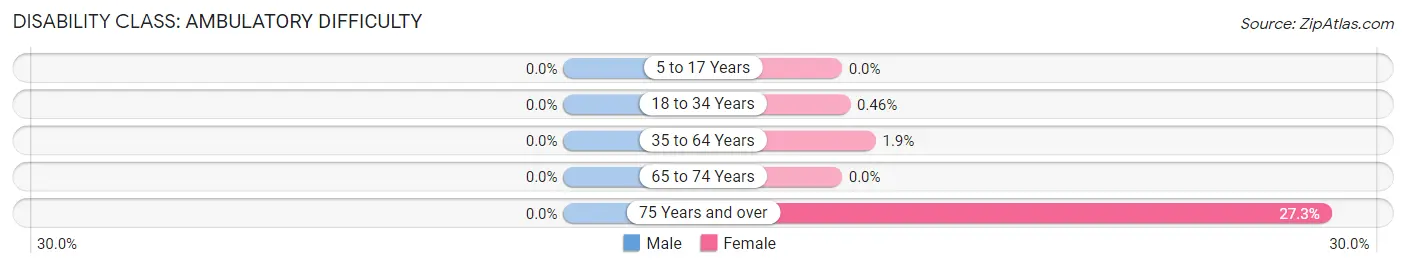
| Age Bracket | Male | Female |
| 5 to 17 Years | 0 (0.0%) | 0 (0.0%) |
| 18 to 34 Years | 0 (0.0%) | 5 (0.5%) |
| 35 to 64 Years | 0 (0.0%) | 19 (1.9%) |
| 65 to 74 Years | 0 (0.0%) | 0 (0.0%) |
| 75 Years and over | 0 (0.0%) | 48 (27.3%) |
Disability Class: Self-Care Difficulty
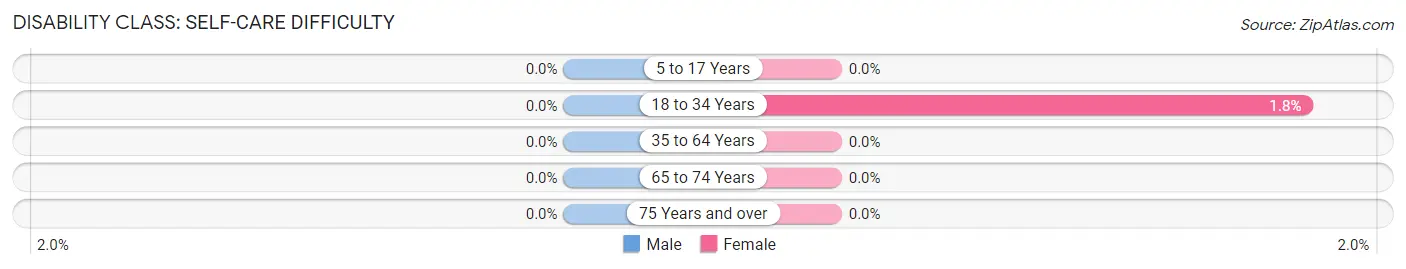
| Age Bracket | Male | Female |
| 5 to 17 Years | 0 (0.0%) | 0 (0.0%) |
| 18 to 34 Years | 0 (0.0%) | 19 (1.8%) |
| 35 to 64 Years | 0 (0.0%) | 0 (0.0%) |
| 65 to 74 Years | 0 (0.0%) | 0 (0.0%) |
| 75 Years and over | 0 (0.0%) | 0 (0.0%) |
Technology Access in Exton
Computing Device Access in Exton
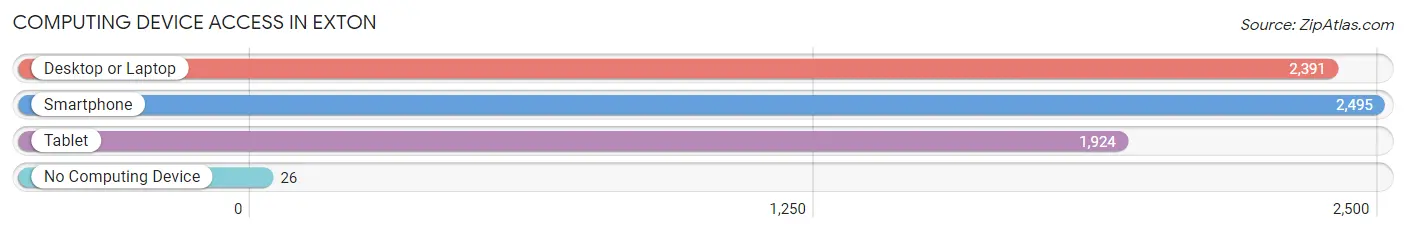
| Device Type | # Households | % Households |
| Desktop or Laptop | 2,391 | 92.7% |
| Smartphone | 2,495 | 96.7% |
| Tablet | 1,924 | 74.6% |
| No Computing Device | 26 | 1.0% |
| Total | 2,579 | 100.0% |
Internet Access in Exton
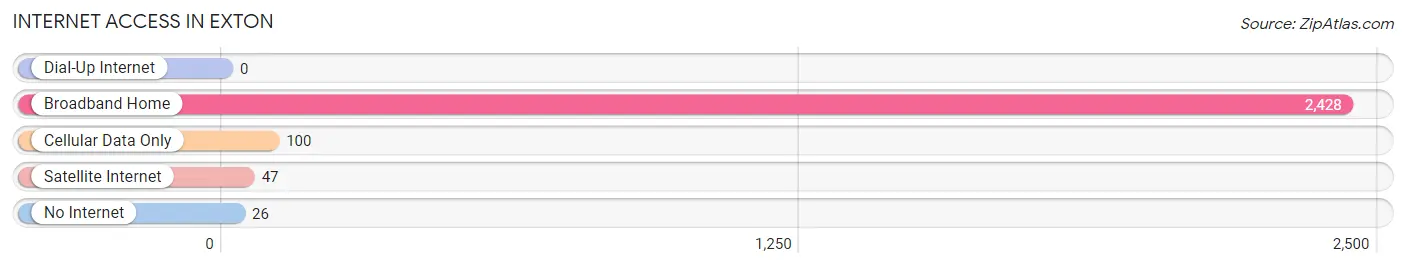
| Internet Type | # Households | % Households |
| Dial-Up Internet | 0 | 0.0% |
| Broadband Home | 2,428 | 94.2% |
| Cellular Data Only | 100 | 3.9% |
| Satellite Internet | 47 | 1.8% |
| No Internet | 26 | 1.0% |
| Total | 2,579 | 100.0% |
Exton Summary
Exton, Pennsylvania is a census-designated place located in West Whiteland Township, Chester County, Pennsylvania. It is located about 25 miles west of Philadelphia and is part of the Greater Philadelphia metropolitan area. As of the 2010 census, the population of Exton was 4,842.
History
The area that is now Exton was originally inhabited by the Lenape Native Americans. The first European settlers arrived in the area in the late 17th century. The area was originally known as Whiteland Township, and was part of Chester County. In 1836, the area was renamed West Whiteland Township.
The name Exton was first used in 1854, when the Pennsylvania Railroad opened a station in the area. The station was named after a nearby estate owned by the family of William Exton. The area around the station became known as Exton, and the name was officially adopted in 1891.
Geography
Exton is located at 40°3'25"N 75°35'45"W (40.056944, -75.595833). It is situated in the southeastern corner of West Whiteland Township, in Chester County, Pennsylvania. It is bordered to the north by Downingtown, to the east by Lionville, to the south by Uwchlan Township, and to the west by West Whiteland Township.
The area is mostly flat, with some rolling hills. Exton is located in the Piedmont region of Pennsylvania, and is part of the Brandywine Valley. The area is drained by the Brandywine Creek and its tributaries.
Economy
Exton is home to a number of businesses and industries. The largest employer in the area is the Exton Square Mall, which is home to over 100 stores and restaurants. Other major employers include QVC, Siemens, and the Chester County Hospital.
Exton is also home to a number of technology companies, including SAP America, Oracle, and Microsoft. The area is also home to a number of biotech and pharmaceutical companies, including GlaxoSmithKline, Merck, and Wyeth.
Demographics
As of the 2010 census, there were 4,842 people, 1,945 households, and 1,323 families living in Exton. The population density was 1,845.3 people per square mile (711.7/km2). The racial makeup of the area was 87.2% White, 5.2% African American, 0.2% Native American, 4.7% Asian, 0.1% Pacific Islander, 0.7% from other races, and 1.9% from two or more races. Hispanic or Latino of any race were 2.7% of the population.
The median income for a household in Exton was $76,945, and the median income for a family was $93,945. Males had a median income of $63,945 versus $45,945 for females. The per capita income for the area was $37,945. About 2.2% of families and 3.3% of the population were below the poverty line, including 4.2% of those under age 18 and 2.2% of those age 65 or over.
Common Questions
What is Per Capita Income in Exton?
Per Capita income in Exton is $64,679.
What is the Median Family Income in Exton?
Median Family Income in Exton is $132,431.
What is the Median Household income in Exton?
Median Household Income in Exton is $120,489.
What is Income or Wage Gap in Exton?
Income or Wage Gap in Exton is 49.6%.
Women in Exton earn 50.4 cents for every dollar earned by a man.
What is Inequality or Gini Index in Exton?
Inequality or Gini Index in Exton is 0.41.
What is the Total Population of Exton?
Total Population of Exton is 6,272.
What is the Total Male Population of Exton?
Total Male Population of Exton is 3,007.
What is the Total Female Population of Exton?
Total Female Population of Exton is 3,265.
What is the Ratio of Males per 100 Females in Exton?
There are 92.10 Males per 100 Females in Exton.
What is the Ratio of Females per 100 Males in Exton?
There are 108.58 Females per 100 Males in Exton.
What is the Median Population Age in Exton?
Median Population Age in Exton is 34.0 Years.
What is the Average Family Size in Exton
Average Family Size in Exton is 3.0 People.
What is the Average Household Size in Exton
Average Household Size in Exton is 2.4 People.
How Large is the Labor Force in Exton?
There are 3,512 People in the Labor Forcein in Exton.
What is the Percentage of People in the Labor Force in Exton?
70.1% of People are in the Labor Force in Exton.
What is the Unemployment Rate in Exton?
Unemployment Rate in Exton is 1.3%.