Zip Codes with the Highest Percentage of Population Employed in Life, Physical & Social Science in Pittsburgh, PA

RELATED REPORTS & OPTIONS

Life, Physical & Social Science
Population
Families and Households
Female Fertility
Female Fertility (Unmarried)
Race (Community Size)
Race (Percentage)
Ancestry (Community Size)
AfghanAfricanAlbanianAlsatianAmericanApacheArabArgentineanArmenianAustralianAustrianBahamianBarbadianBasqueBelgianBhutaneseBlackfeetBolivianBrazilianBritishBritish West IndianBulgarianBurmeseCajunCambodianCanadianCape VerdeanCarpatho RusynCelticCentral AmericanCentral American IndianCherokeeChickasawChileanChippewaChoctawColombianComancheCosta RicanCreekCroatianCubanCypriotCzechCzechoslovakianDanishDelawareDominicanDutchEastern EuropeanEcuadorianEgyptianEnglishEthiopianEuropeanFilipinoFinnishFrenchFrench American IndianFrench CanadianGermanGhanaianGreekGuamanian / ChamorroGuatemalanGuyaneseHaitianHonduranHungarianIndian (Asian)IndonesianIranianIraqiIrishIroquoisIsraeliItalianJamaicanJapaneseJordanianKenyanKoreanLaotianLatvianLebaneseLiberianLithuanianLumbeeLuxembourgerMacedonianMalaysianMalteseMexicanMexican American IndianMongolianMoroccanNative HawaiianNavajoNew ZealanderNicaraguanNigerianNorthern EuropeanNorwegianPakistaniPalestinianPanamanianParaguayanPennsylvania GermanPeruvianPolishPortuguesePuerto RicanRomanianRussianSalvadoranSamoanScandinavianScotch-IrishScottishSeminoleSerbianSiouxSlavicSlovakSloveneSouth AfricanSouth AmericanSouth American IndianSoviet UnionSpaniardSpanishSri LankanSubsaharan AfricanSudaneseSwedishSwissSyrianThaiTrinidadian and TobagonianTurkishU.S. Virgin IslanderUgandanUkrainianUruguayanVenezuelanVietnameseWelshWest IndianYugoslavian
Ancestry (Percentage)
AfghanAfricanAlbanianAlsatianAmericanApacheArabArgentineanArmenianAustralianAustrianBahamianBarbadianBasqueBelgianBhutaneseBlackfeetBolivianBrazilianBritishBritish West IndianBulgarianBurmeseCajunCambodianCanadianCape VerdeanCarpatho RusynCelticCentral AmericanCentral American IndianCherokeeChickasawChileanChippewaChoctawColombianComancheCosta RicanCreekCroatianCubanCypriotCzechCzechoslovakianDanishDelawareDominicanDutchEastern EuropeanEcuadorianEgyptianEnglishEthiopianEuropeanFilipinoFinnishFrenchFrench American IndianFrench CanadianGermanGhanaianGreekGuamanian / ChamorroGuatemalanGuyaneseHaitianHonduranHungarianIndian (Asian)IndonesianIranianIraqiIrishIroquoisIsraeliItalianJamaicanJapaneseJordanianKenyanKoreanLaotianLatvianLebaneseLiberianLithuanianLumbeeLuxembourgerMacedonianMalaysianMalteseMexicanMexican American IndianMongolianMoroccanNative HawaiianNavajoNew ZealanderNicaraguanNigerianNorthern EuropeanNorwegianPakistaniPalestinianPanamanianParaguayanPennsylvania GermanPeruvianPolishPortuguesePuerto RicanRomanianRussianSalvadoranSamoanScandinavianScotch-IrishScottishSeminoleSerbianSiouxSlavicSlovakSloveneSouth AfricanSouth AmericanSouth American IndianSoviet UnionSpaniardSpanishSri LankanSubsaharan AfricanSudaneseSwedishSwissSyrianThaiTrinidadian and TobagonianTurkishU.S. Virgin IslanderUgandanUkrainianUruguayanVenezuelanVietnameseWelshWest IndianYugoslavian
Immigrant Origin (Total)
AfghanistanAfricaAlbaniaArgentinaAsiaAustraliaAustriaBahamasBangladeshBelarusBelgiumBoliviaBosnia and HerzegovinaBrazilBulgariaBurma / MyanmarCambodiaCameroonCanadaCaribbeanCentral AmericaChileChinaColombiaCongoCosta RicaCroatiaCubaCzechoslovakiaDenmarkDominican RepublicEastern AfricaEastern AsiaEastern EuropeEcuadorEgyptEl SalvadorEnglandEritreaEthiopiaEuropeFranceGermanyGhanaGreeceGuatemalaGuyanaHaitiHondurasHong KongHungaryIndiaIndonesiaIranIraqIrelandIsraelItalyJamaicaJapanJordanKazakhstanKenyaKoreaKuwaitLatin AmericaLatviaLebanonLiberiaLithuaniaMalaysiaMexicoMiddle AfricaMoldovaMoroccoNepalNetherlandsNigeriaNorthern AfricaNorthern EuropeNorwayOceaniaPakistanPanamaPeruPhilippinesPolandPortugalRomaniaRussiaSaudi ArabiaScotlandSerbiaSingaporeSouth AfricaSouth AmericaSouth Central AsiaSouth Eastern AsiaSouthern EuropeSpainSri LankaSudanSwedenSwitzerlandSyriaTaiwanThailandTrinidad and TobagoTurkeyUgandaUkraineUzbekistanVenezuelaVietnamWestern AfricaWestern AsiaWestern EuropeZaire
Immigrant Origin (Percentage)
AfghanistanAfricaAlbaniaArgentinaAsiaAustraliaAustriaBahamasBangladeshBelarusBelgiumBoliviaBosnia and HerzegovinaBrazilBulgariaBurma / MyanmarCambodiaCameroonCanadaCaribbeanCentral AmericaChileChinaColombiaCongoCosta RicaCroatiaCubaCzechoslovakiaDenmarkDominican RepublicEastern AfricaEastern AsiaEastern EuropeEcuadorEgyptEl SalvadorEnglandEritreaEthiopiaEuropeFranceGermanyGhanaGreeceGuatemalaGuyanaHaitiHondurasHong KongHungaryIndiaIndonesiaIranIraqIrelandIsraelItalyJamaicaJapanJordanKazakhstanKenyaKoreaKuwaitLatin AmericaLatviaLebanonLiberiaLithuaniaMalaysiaMexicoMiddle AfricaMoldovaMoroccoNepalNetherlandsNigeriaNorthern AfricaNorthern EuropeNorwayOceaniaPakistanPanamaPeruPhilippinesPolandPortugalRomaniaRussiaSaudi ArabiaScotlandSerbiaSingaporeSouth AfricaSouth AmericaSouth Central AsiaSouth Eastern AsiaSouthern EuropeSpainSri LankaSudanSwedenSwitzerlandSyriaTaiwanThailandTrinidad and TobagoTurkeyUgandaUkraineUzbekistanVenezuelaVietnamWestern AfricaWestern AsiaWestern EuropeZaire
Income
Income (Families)
Income (Households)
Poverty
Poverty (Families)
Unemployment
Employment Occupations
Employment Industries
Employer Class
Commute Time
Commute Means
School Enrollment
Education by Degree Field
Occupancy
Finances
Physical Characteristics
Pittsburgh
Compare Zip Codes
Comparison Subject

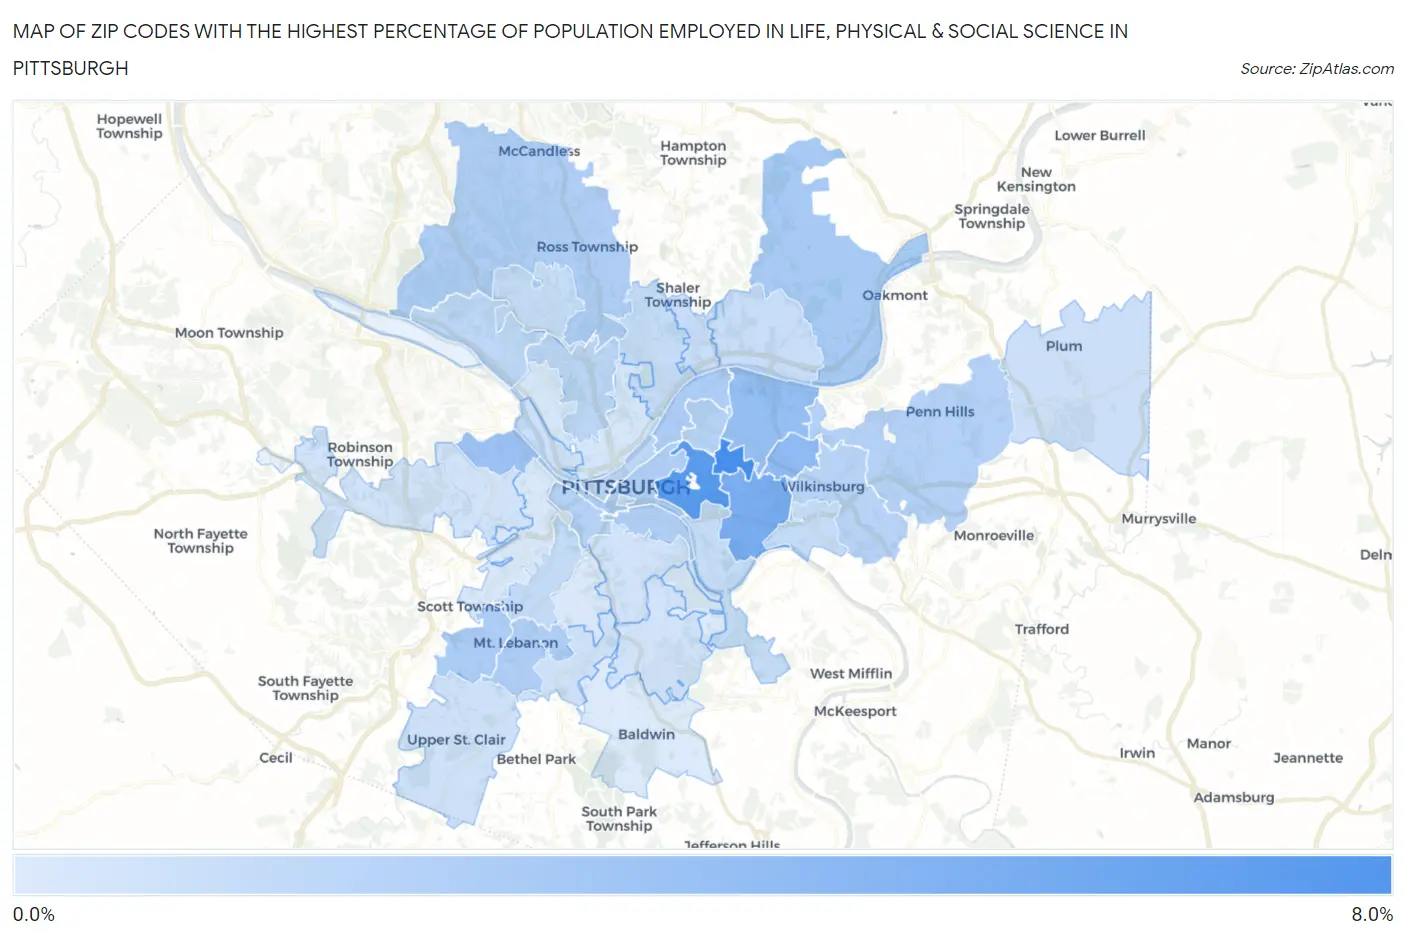
Map of Zip Codes with the Highest Percentage of Population Employed in Life, Physical & Social Science in Pittsburgh

0.0%
8.0%
Zip Codes with the Highest Percentage of Population Employed in Life, Physical & Social Science in Pittsburgh Map

Zip Codes with the Highest Percentage of Population Employed in Life, Physical & Social Science in Pittsburgh, PA

Zip Code % Employed vs State vs National
1.152326.3%1.2%(+5.08)#201.1%(+5.21)#503
2.152135.7%1.2%(+4.45)#261.1%(+4.58)#594
3.152174.3%1.2%(+3.07)#471.1%(+3.20)#1,006
4.152083.5%1.2%(+2.28)#711.1%(+2.41)#1,427
5.152063.2%1.2%(+1.95)#831.1%(+2.09)#1,684
6.152043.0%1.2%(+1.73)#971.1%(+1.86)#1,931
7.152382.4%1.2%(+1.22)#1331.1%(+1.35)#2,669
8.152432.3%1.2%(+1.10)#1431.1%(+1.23)#2,907
9.152012.3%1.2%(+1.03)#1481.1%(+1.17)#3,047
10.152192.3%1.2%(+1.03)#1501.1%(+1.16)#3,064
11.152282.2%1.2%(+1.01)#1541.1%(+1.15)#3,098
12.152372.2%1.2%(+0.999)#1561.1%(+1.13)#3,129
13.152032.2%1.2%(+0.975)#1581.1%(+1.11)#3,184
14.152352.0%1.2%(+0.768)#1931.1%(+0.900)#3,714
15.152241.9%1.2%(+0.706)#2001.1%(+0.837)#3,895
16.152111.9%1.2%(+0.697)#2011.1%(+0.829)#3,914
17.152211.9%1.2%(+0.639)#2081.1%(+0.771)#4,105
18.152141.7%1.2%(+0.497)#2281.1%(+0.628)#4,636
19.152221.7%1.2%(+0.435)#2431.1%(+0.566)#4,910
20.152021.6%1.2%(+0.406)#2531.1%(+0.537)#5,038
21.152161.4%1.2%(+0.146)#3321.1%(+0.277)#6,366
22.152291.4%1.2%(+0.135)#3351.1%(+0.267)#6,435
23.152091.3%1.2%(+0.116)#3371.1%(+0.247)#6,549
24.152181.3%1.2%(+0.103)#3411.1%(+0.235)#6,626
25.152071.3%1.2%(+0.065)#3601.1%(+0.197)#6,883
26.152231.3%1.2%(+0.029)#3721.1%(+0.161)#7,121
27.152821.2%1.2%(-0.010)#3841.1%(+0.122)#7,394
28.152151.2%1.2%(-0.018)#3901.1%(+0.114)#7,455
29.152391.1%1.2%(-0.126)#4421.1%(+0.006)#8,249
30.152331.1%1.2%(-0.171)#4561.1%(-0.040)#8,616
31.152340.98%1.2%(-0.238)#4861.1%(-0.107)#9,189
32.152410.95%1.2%(-0.268)#5041.1%(-0.137)#9,458
33.152270.88%1.2%(-0.340)#5381.1%(-0.209)#10,127
34.152100.87%1.2%(-0.349)#5431.1%(-0.217)#10,213
35.152050.85%1.2%(-0.377)#5531.1%(-0.246)#10,528
36.152120.75%1.2%(-0.477)#6041.1%(-0.346)#11,562
37.152200.65%1.2%(-0.569)#6601.1%(-0.437)#12,616
38.152260.56%1.2%(-0.662)#7221.1%(-0.530)#13,767
39.152360.44%1.2%(-0.779)#7921.1%(-0.647)#15,207

Common Questions

What are the Top 10 Zip Codes with the Highest Percentage of Population Employed in Life, Physical & Social Science in Pittsburgh, PA?
Top 10 Zip Codes with the Highest Percentage of Population Employed in Life, Physical & Social Science in Pittsburgh, PA are:
#1
6.3%
#2
5.7%
#3
4.3%
#4
3.5%
#5
3.2%
#6
3.0%
#7
2.4%
#8
2.3%
#9
2.3%
#10
2.3%
What zip code has the Highest Percentage of Population Employed in Life, Physical & Social Science in Pittsburgh, PA?
15232 has the Highest Percentage of Population Employed in Life, Physical & Social Science in Pittsburgh, PA with 6.3%.
What is the Percentage of Population Employed in Life, Physical & Social Science in Pittsburgh, PA?
Percentage of Population Employed in Life, Physical & Social Science in Pittsburgh is 2.4%.
What is the Percentage of Population Employed in Life, Physical & Social Science in Pennsylvania?
Percentage of Population Employed in Life, Physical & Social Science in Pennsylvania is 1.2%.
What is the Percentage of Population Employed in Life, Physical & Social Science in the United States?
Percentage of Population Employed in Life, Physical & Social Science in the United States is 1.1%.