Penn Wynne, PA Map & Demographics
Penn Wynne Map
Penn Wynne Overview
$69,887
PER CAPITA INCOME
$199,769
AVG FAMILY INCOME
$142,005
AVG HOUSEHOLD INCOME
39.2%
WAGE / INCOME GAP [ % ]
60.8¢/ $1
WAGE / INCOME GAP [ $ ]
0.45
INEQUALITY / GINI INDEX
6,127
TOTAL POPULATION
2,791
MALE POPULATION
3,336
FEMALE POPULATION
83.66
MALES / 100 FEMALES
119.53
FEMALES / 100 MALES
47.1
MEDIAN AGE
3.1
AVG FAMILY SIZE
2.5
AVG HOUSEHOLD SIZE
2,961
LABOR FORCE [ PEOPLE ]
61.7%
PERCENT IN LABOR FORCE
5.6%
UNEMPLOYMENT RATE
Income in Penn Wynne
Income Overview in Penn Wynne
Per Capita Income in Penn Wynne is $69,887, while median incomes of families and households are $199,769 and $142,005 respectively.
| Characteristic | Number | Measure |
| Per Capita Income | 6,127 | $69,887 |
| Median Family Income | 1,597 | $199,769 |
| Mean Family Income | 1,597 | $228,387 |
| Median Household Income | 2,385 | $142,005 |
| Mean Household Income | 2,385 | $182,154 |
| Income Deficit | 1,597 | $0 |
| Wage / Income Gap (%) | 6,127 | 39.19% |
| Wage / Income Gap ($) | 6,127 | 60.81¢ per $1 |
| Gini / Inequality Index | 6,127 | 0.45 |
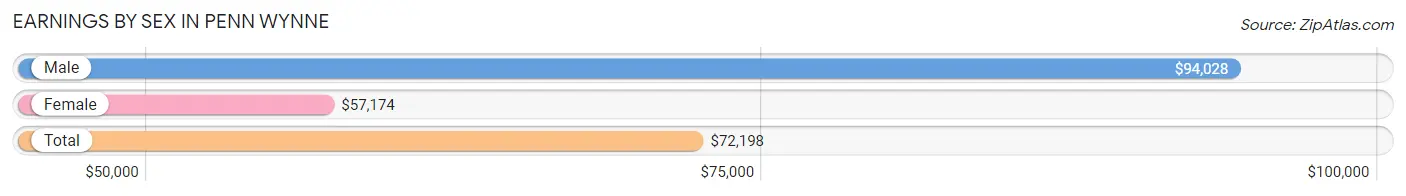
Earnings by Sex in Penn Wynne
Average Earnings in Penn Wynne are $72,198, $94,028 for men and $57,174 for women, a difference of 39.2%.
| Sex | Number | Average Earnings |
| Male | 1,523 (49.2%) | $94,028 |
| Female | 1,574 (50.8%) | $57,174 |
| Total | 3,097 (100.0%) | $72,198 |
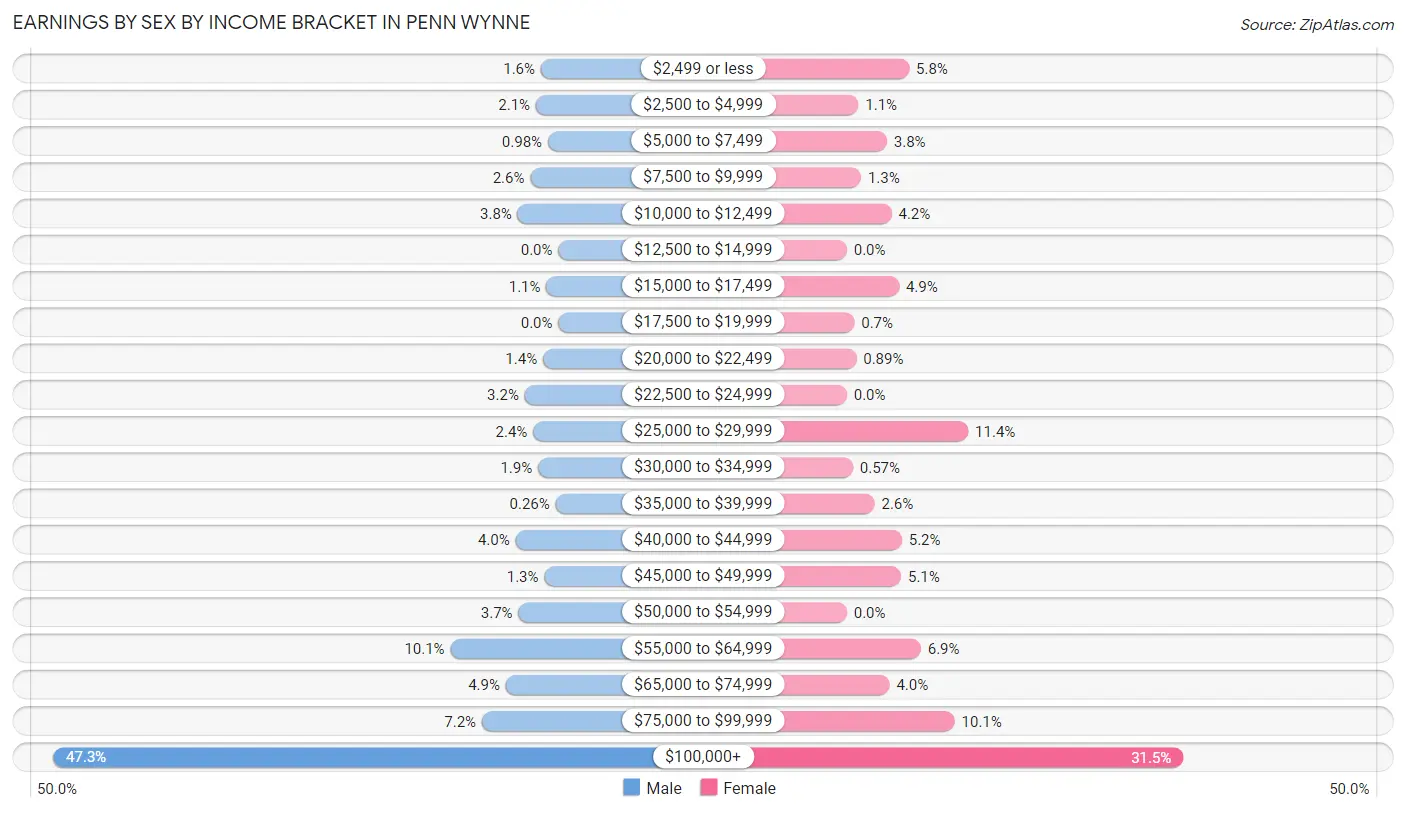
Earnings by Sex by Income Bracket in Penn Wynne
The most common earnings brackets in Penn Wynne are $100,000+ for men (721 | 47.3%) and $100,000+ for women (496 | 31.5%).
| Income | Male | Female |
| $2,499 or less | 25 (1.6%) | 92 (5.8%) |
| $2,500 to $4,999 | 32 (2.1%) | 17 (1.1%) |
| $5,000 to $7,499 | 15 (1.0%) | 59 (3.7%) |
| $7,500 to $9,999 | 40 (2.6%) | 21 (1.3%) |
| $10,000 to $12,499 | 58 (3.8%) | 66 (4.2%) |
| $12,500 to $14,999 | 0 (0.0%) | 0 (0.0%) |
| $15,000 to $17,499 | 17 (1.1%) | 77 (4.9%) |
| $17,500 to $19,999 | 0 (0.0%) | 11 (0.7%) |
| $20,000 to $22,499 | 22 (1.4%) | 14 (0.9%) |
| $22,500 to $24,999 | 48 (3.2%) | 0 (0.0%) |
| $25,000 to $29,999 | 36 (2.4%) | 179 (11.4%) |
| $30,000 to $34,999 | 29 (1.9%) | 9 (0.6%) |
| $35,000 to $39,999 | 4 (0.3%) | 41 (2.6%) |
| $40,000 to $44,999 | 61 (4.0%) | 81 (5.1%) |
| $45,000 to $49,999 | 20 (1.3%) | 80 (5.1%) |
| $50,000 to $54,999 | 57 (3.7%) | 0 (0.0%) |
| $55,000 to $64,999 | 154 (10.1%) | 109 (6.9%) |
| $65,000 to $74,999 | 75 (4.9%) | 63 (4.0%) |
| $75,000 to $99,999 | 109 (7.2%) | 159 (10.1%) |
| $100,000+ | 721 (47.3%) | 496 (31.5%) |
| Total | 1,523 (100.0%) | 1,574 (100.0%) |
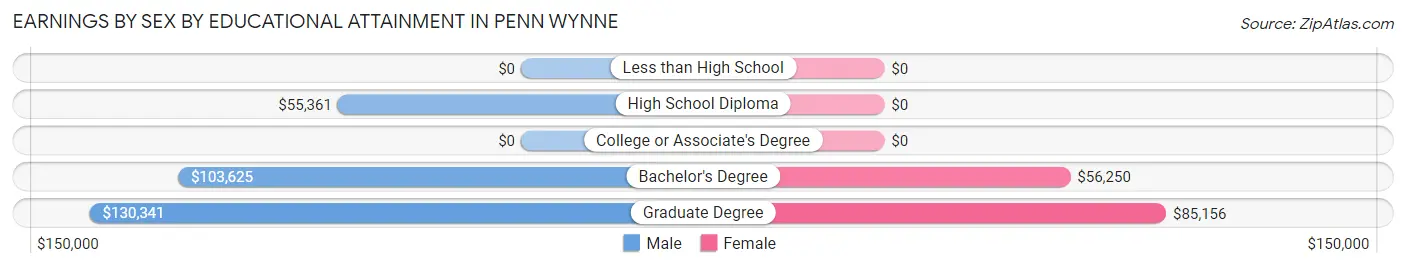
Earnings by Sex by Educational Attainment in Penn Wynne
Average earnings in Penn Wynne are $100,536 for men and $61,023 for women, a difference of 39.3%. Men with an educational attainment of graduate degree enjoy the highest average annual earnings of $130,341, while those with high school diploma education earn the least with $55,361. Women with an educational attainment of graduate degree earn the most with the average annual earnings of $85,156, while those with bachelor's degree education have the smallest earnings of $56,250.
| Educational Attainment | Male Income | Female Income |
| Less than High School | - | - |
| High School Diploma | $55,361 | $0 |
| College or Associate's Degree | - | - |
| Bachelor's Degree | $103,625 | $56,250 |
| Graduate Degree | $130,341 | $85,156 |
| Total | $100,536 | $61,023 |
Family Income in Penn Wynne
Family Income Brackets in Penn Wynne
According to the Penn Wynne family income data, there are 795 families falling into the $200,000+ income range, which is the most common income bracket and makes up 49.8% of all families. Conversely, the $35,000 to $49,999 income bracket is the least frequent group with only 29 families (1.8%) belonging to this category.
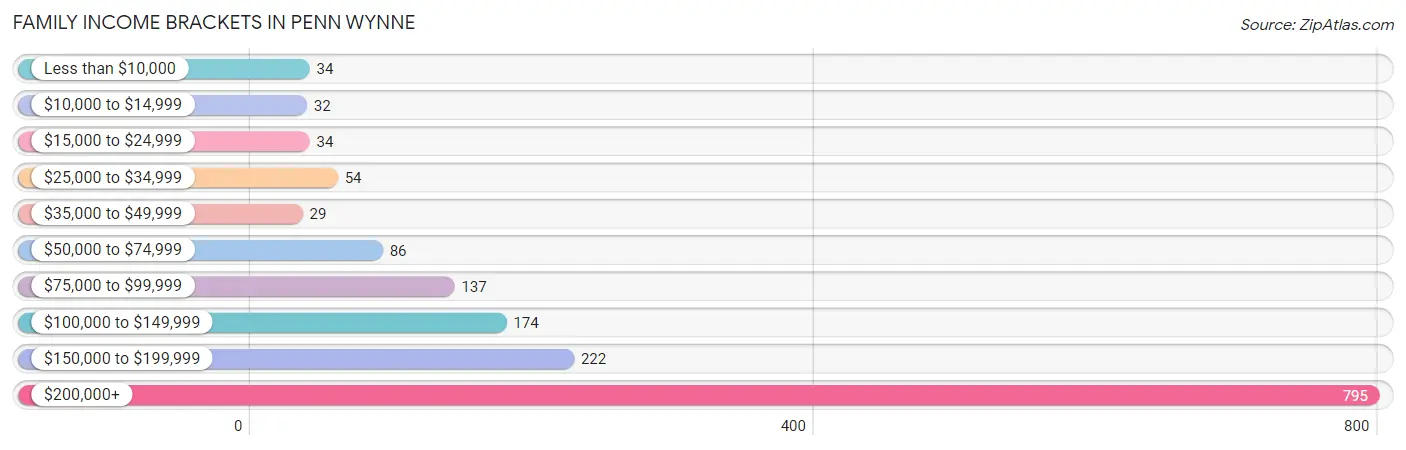
| Income Bracket | # Families | % Families |
| Less than $10,000 | 34 | 2.1% |
| $10,000 to $14,999 | 32 | 2.0% |
| $15,000 to $24,999 | 34 | 2.1% |
| $25,000 to $34,999 | 54 | 3.4% |
| $35,000 to $49,999 | 29 | 1.8% |
| $50,000 to $74,999 | 86 | 5.4% |
| $75,000 to $99,999 | 137 | 8.6% |
| $100,000 to $149,999 | 174 | 10.9% |
| $150,000 to $199,999 | 222 | 13.9% |
| $200,000+ | 795 | 49.8% |
Family Income by Famaliy Size in Penn Wynne
6-person families (23 | 1.4%) account for the highest median family income in Penn Wynne with $250,001 per family, while 2-person families (735 | 46.0%) have the highest median income of $74,075 per family member.
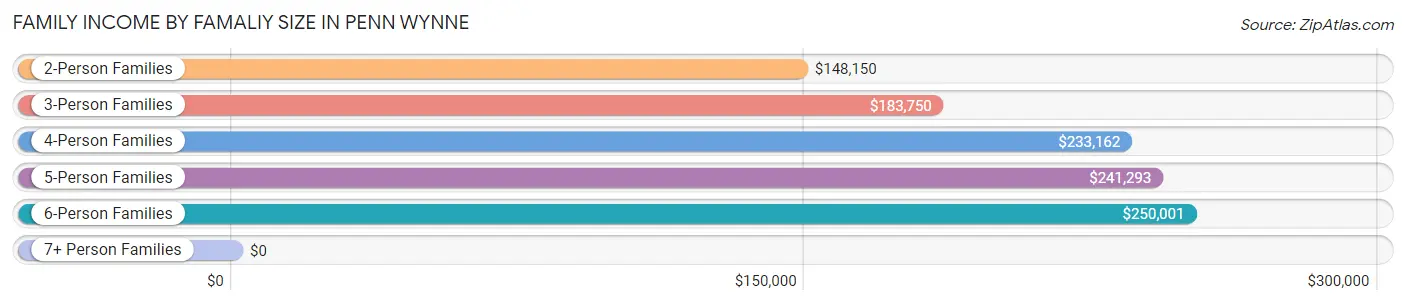
| Income Bracket | # Families | Median Income |
| 2-Person Families | 735 (46.0%) | $148,150 |
| 3-Person Families | 339 (21.2%) | $183,750 |
| 4-Person Families | 349 (21.8%) | $233,162 |
| 5-Person Families | 108 (6.8%) | $241,293 |
| 6-Person Families | 23 (1.4%) | $250,001 |
| 7+ Person Families | 43 (2.7%) | $0 |
| Total | 1,597 (100.0%) | $199,769 |
Family Income by Number of Earners in Penn Wynne
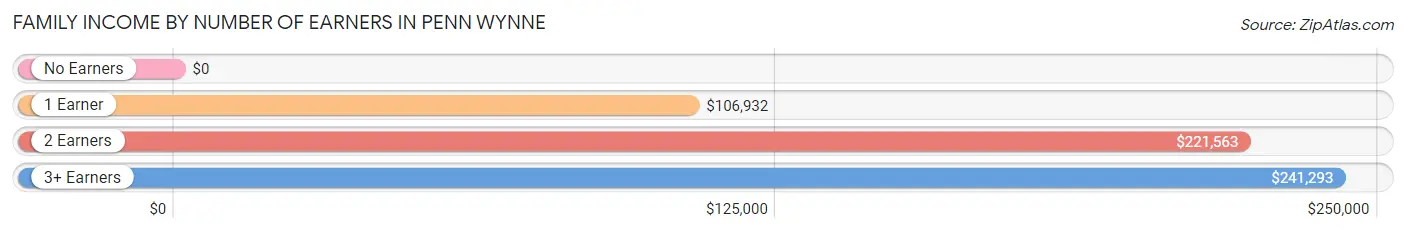
| Number of Earners | # Families | Median Income |
| No Earners | 212 (13.3%) | $0 |
| 1 Earner | 339 (21.2%) | $106,932 |
| 2 Earners | 804 (50.3%) | $221,563 |
| 3+ Earners | 242 (15.1%) | $241,293 |
| Total | 1,597 (100.0%) | $199,769 |
Household Income in Penn Wynne
Household Income Brackets in Penn Wynne
With 844 households falling in the category, the $200,000+ income range is the most frequent in Penn Wynne, accounting for 35.4% of all households. In contrast, only 55 households (2.3%) fall into the $10,000 to $14,999 income bracket, making it the least populous group.
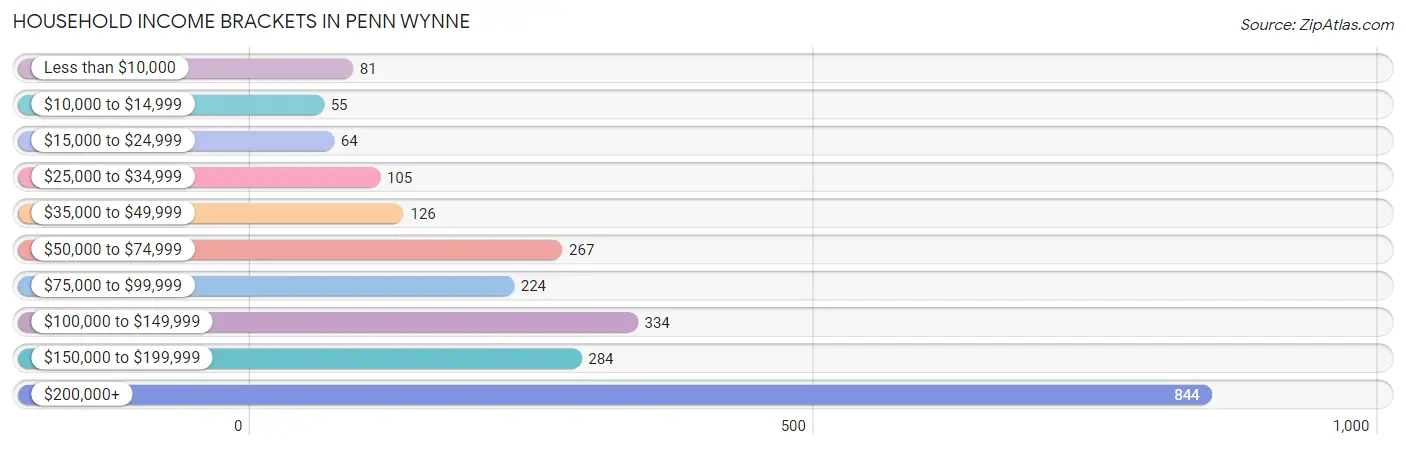
| Income Bracket | # Households | % Households |
| Less than $10,000 | 81 | 3.4% |
| $10,000 to $14,999 | 55 | 2.3% |
| $15,000 to $24,999 | 64 | 2.7% |
| $25,000 to $34,999 | 105 | 4.4% |
| $35,000 to $49,999 | 126 | 5.3% |
| $50,000 to $74,999 | 267 | 11.2% |
| $75,000 to $99,999 | 224 | 9.4% |
| $100,000 to $149,999 | 334 | 14.0% |
| $150,000 to $199,999 | 284 | 11.9% |
| $200,000+ | 844 | 35.4% |
Household Income by Householder Age in Penn Wynne
The median household income in Penn Wynne is $142,005, with the highest median household income of $231,250 found in the 25 to 44 years age bracket for the primary householder. A total of 588 households (24.6%) fall into this category.
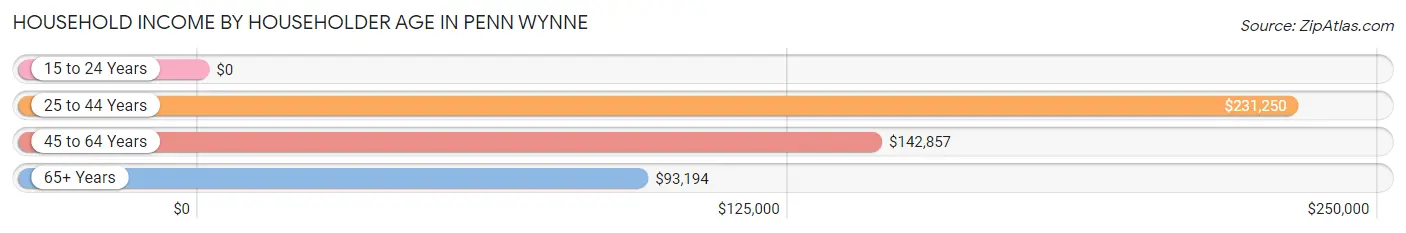
| Income Bracket | # Households | Median Income |
| 15 to 24 Years | 0 (0.0%) | $0 |
| 25 to 44 Years | 588 (24.6%) | $231,250 |
| 45 to 64 Years | 852 (35.7%) | $142,857 |
| 65+ Years | 945 (39.6%) | $93,194 |
| Total | 2,385 (100.0%) | $142,005 |
Poverty in Penn Wynne
Income Below Poverty by Sex and Age in Penn Wynne
With 6.1% poverty level for males and 7.6% for females among the residents of Penn Wynne, 75 year old and over males and 35 to 44 year old females are the most vulnerable to poverty, with 40 males (13.4%) and 66 females (15.1%) in their respective age groups living below the poverty level.
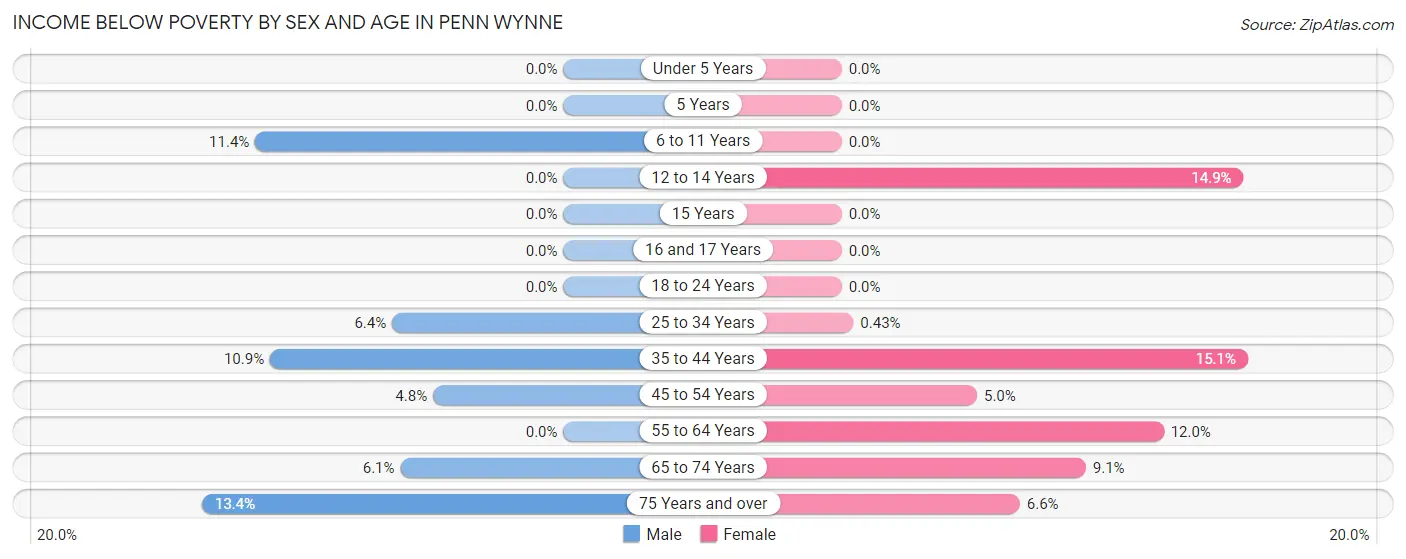
| Age Bracket | Male | Female |
| Under 5 Years | 0 (0.0%) | 0 (0.0%) |
| 5 Years | 0 (0.0%) | 0 (0.0%) |
| 6 to 11 Years | 35 (11.4%) | 0 (0.0%) |
| 12 to 14 Years | 0 (0.0%) | 24 (14.9%) |
| 15 Years | 0 (0.0%) | 0 (0.0%) |
| 16 and 17 Years | 0 (0.0%) | 0 (0.0%) |
| 18 to 24 Years | 0 (0.0%) | 0 (0.0%) |
| 25 to 34 Years | 15 (6.4%) | 1 (0.4%) |
| 35 to 44 Years | 43 (10.9%) | 66 (15.1%) |
| 45 to 54 Years | 17 (4.8%) | 14 (5.0%) |
| 55 to 64 Years | 0 (0.0%) | 70 (11.9%) |
| 65 to 74 Years | 15 (6.0%) | 30 (9.1%) |
| 75 Years and over | 40 (13.4%) | 37 (6.6%) |
| Total | 165 (6.1%) | 242 (7.6%) |
Income Above Poverty by Sex and Age in Penn Wynne
According to the poverty statistics in Penn Wynne, males aged under 5 years and females aged under 5 years are the age groups that are most secure financially, with 100.0% of males and 100.0% of females in these age groups living above the poverty line.
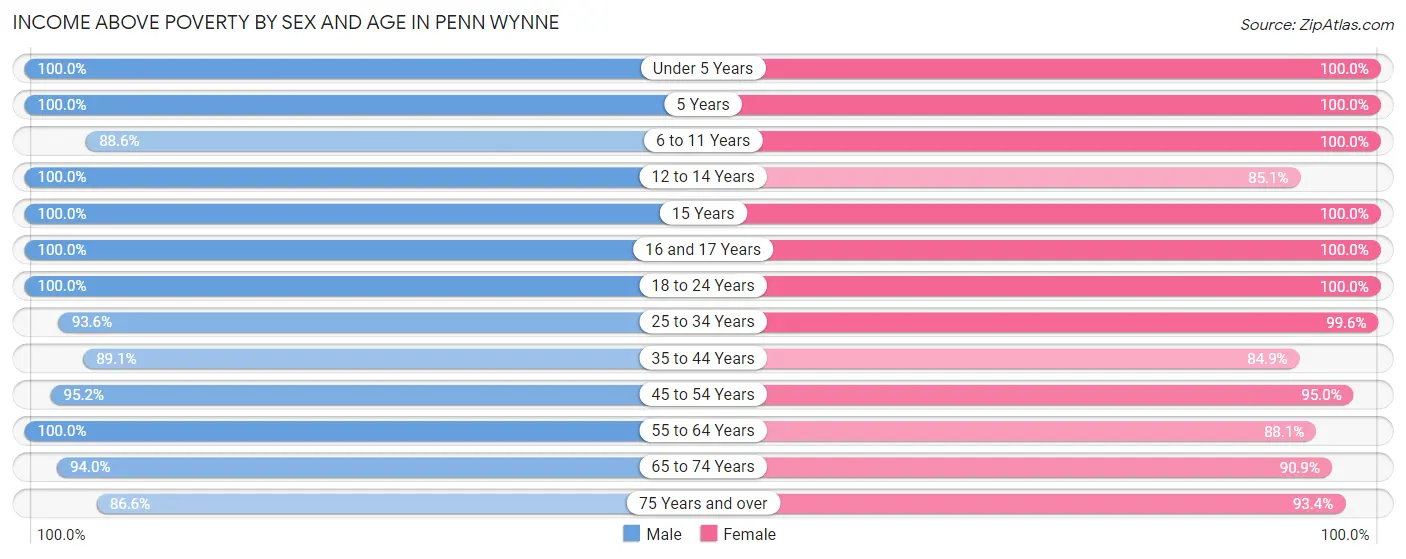
| Age Bracket | Male | Female |
| Under 5 Years | 184 (100.0%) | 197 (100.0%) |
| 5 Years | 29 (100.0%) | 49 (100.0%) |
| 6 to 11 Years | 271 (88.6%) | 176 (100.0%) |
| 12 to 14 Years | 143 (100.0%) | 137 (85.1%) |
| 15 Years | 8 (100.0%) | 44 (100.0%) |
| 16 and 17 Years | 58 (100.0%) | 65 (100.0%) |
| 18 to 24 Years | 86 (100.0%) | 82 (100.0%) |
| 25 to 34 Years | 221 (93.6%) | 232 (99.6%) |
| 35 to 44 Years | 352 (89.1%) | 372 (84.9%) |
| 45 to 54 Years | 334 (95.2%) | 265 (95.0%) |
| 55 to 64 Years | 359 (100.0%) | 516 (88.0%) |
| 65 to 74 Years | 233 (94.0%) | 301 (90.9%) |
| 75 Years and over | 258 (86.6%) | 523 (93.4%) |
| Total | 2,536 (93.9%) | 2,959 (92.4%) |
Income Below Poverty Among Married-Couple Families in Penn Wynne
The poverty statistics for married-couple families in Penn Wynne show that 4.6% or 66 of the total 1,423 families live below the poverty line. Families with no children have the highest poverty rate of 5.9%, comprising of 45 families. On the other hand, families with 3 or 4 children have the lowest poverty rate of 0.0%, which includes 0 families.
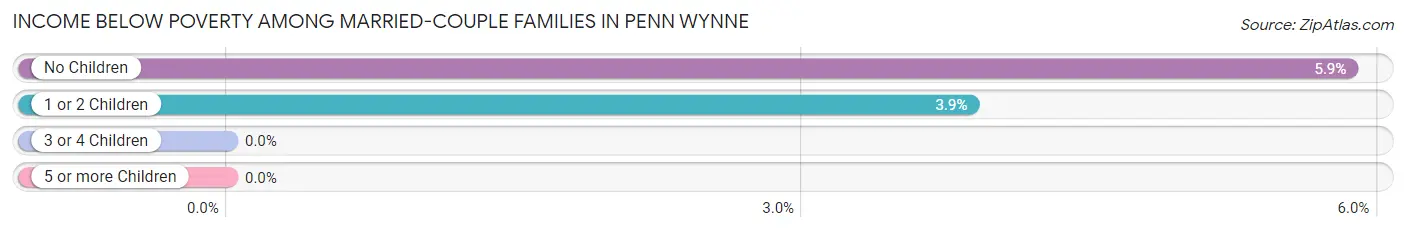
| Children | Above Poverty | Below Poverty |
| No Children | 724 (94.2%) | 45 (5.9%) |
| 1 or 2 Children | 522 (96.1%) | 21 (3.9%) |
| 3 or 4 Children | 111 (100.0%) | 0 (0.0%) |
| 5 or more Children | 0 (0.0%) | 0 (0.0%) |
| Total | 1,357 (95.4%) | 66 (4.6%) |
Income Below Poverty Among Single-Parent Households in Penn Wynne
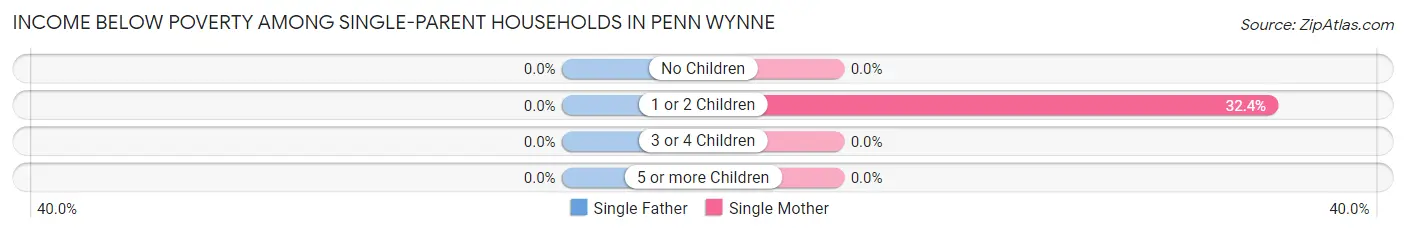
| Children | Single Father | Single Mother |
| No Children | 0 (0.0%) | 0 (0.0%) |
| 1 or 2 Children | 0 (0.0%) | 33 (32.4%) |
| 3 or 4 Children | 0 (0.0%) | 0 (0.0%) |
| 5 or more Children | 0 (0.0%) | 0 (0.0%) |
| Total | 0 (0.0%) | 33 (20.5%) |
Income Below Poverty Among Married-Couple vs Single-Parent Households in Penn Wynne
The poverty data for Penn Wynne shows that 66 of the married-couple family households (4.6%) and 33 of the single-parent households (19.0%) are living below the poverty level. Within the married-couple family households, those with no children have the highest poverty rate, with 45 households (5.9%) falling below the poverty line. Among the single-parent households, those with 1 or 2 children have the highest poverty rate, with 33 household (30.6%) living below poverty.
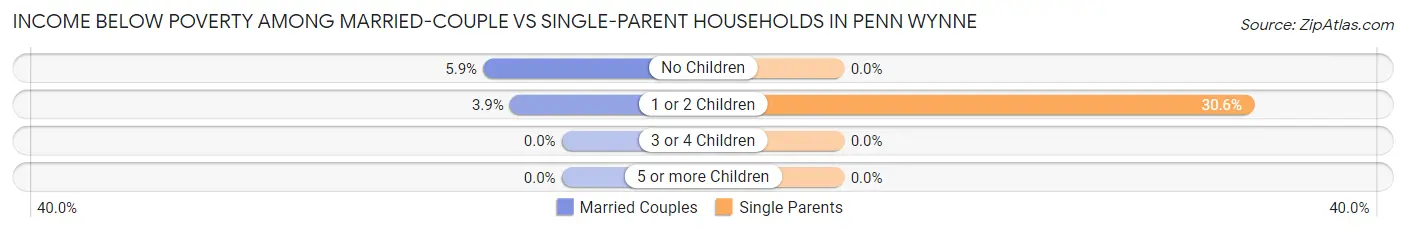
| Children | Married-Couple Families | Single-Parent Households |
| No Children | 45 (5.9%) | 0 (0.0%) |
| 1 or 2 Children | 21 (3.9%) | 33 (30.6%) |
| 3 or 4 Children | 0 (0.0%) | 0 (0.0%) |
| 5 or more Children | 0 (0.0%) | 0 (0.0%) |
| Total | 66 (4.6%) | 33 (19.0%) |
Race in Penn Wynne
The most populous races in Penn Wynne are White / Caucasian (4,525 | 73.9%), Asian (725 | 11.8%), and Black / African American (528 | 8.6%).
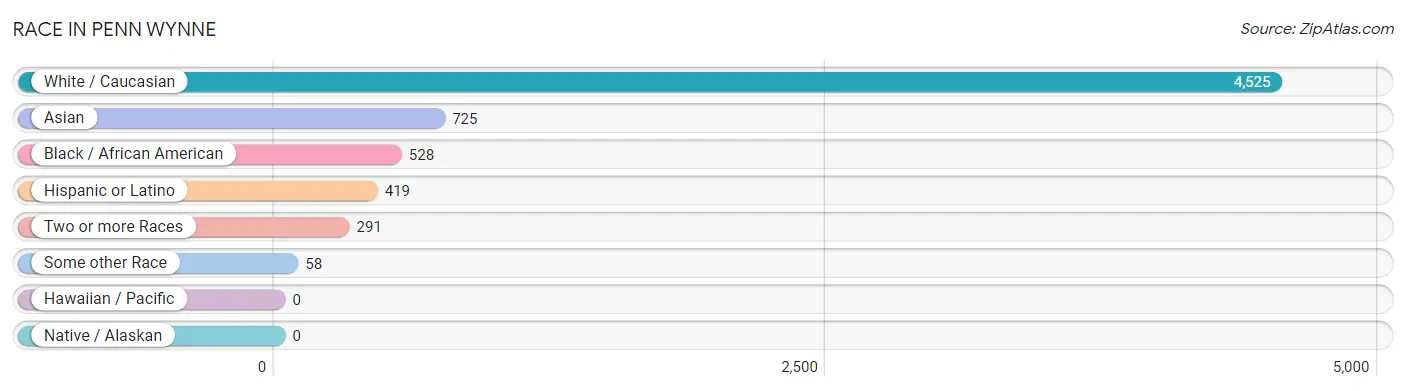
| Race | # Population | % Population |
| Asian | 725 | 11.8% |
| Black / African American | 528 | 8.6% |
| Hawaiian / Pacific | 0 | 0.0% |
| Hispanic or Latino | 419 | 6.8% |
| Native / Alaskan | 0 | 0.0% |
| White / Caucasian | 4,525 | 73.9% |
| Two or more Races | 291 | 4.8% |
| Some other Race | 58 | 0.9% |
| Total | 6,127 | 100.0% |
Ancestry in Penn Wynne
The most populous ancestries reported in Penn Wynne are German (903 | 14.7%), Irish (826 | 13.5%), English (653 | 10.7%), Russian (563 | 9.2%), and Italian (462 | 7.5%), together accounting for 55.6% of all Penn Wynne residents.
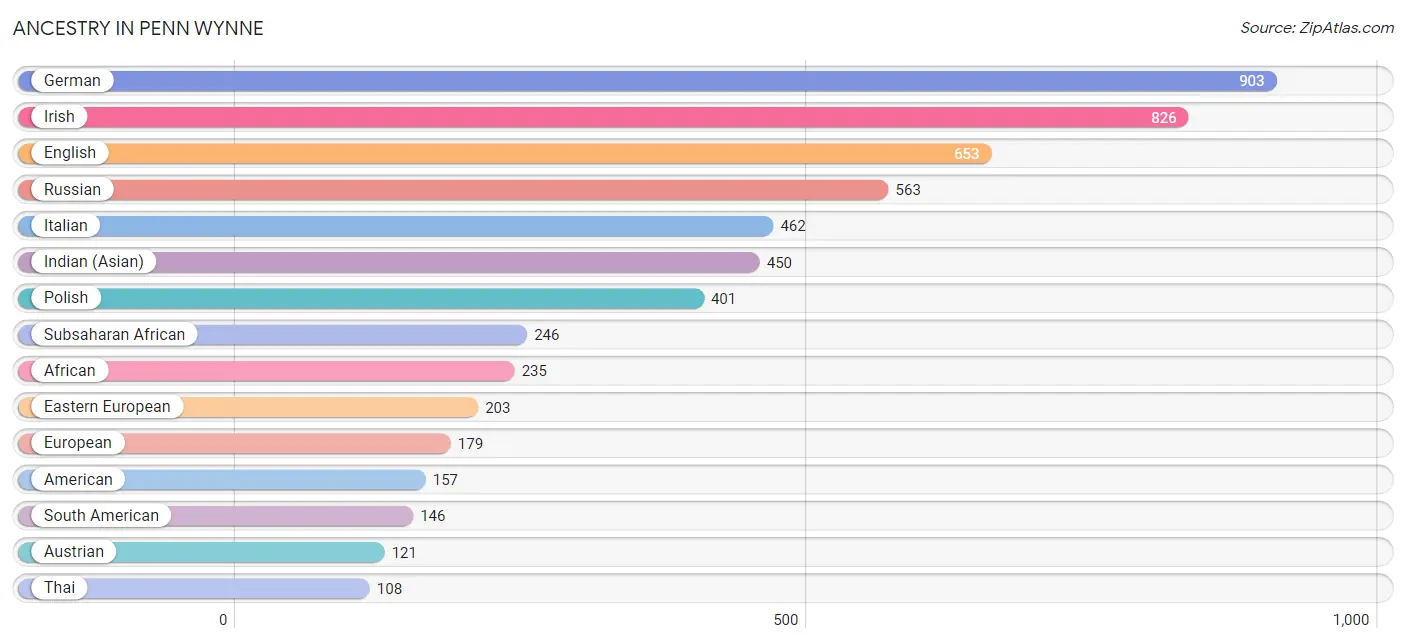
| Ancestry | # Population | % Population |
| African | 235 | 3.8% |
| American | 157 | 2.6% |
| Arab | 22 | 0.4% |
| Armenian | 12 | 0.2% |
| Australian | 12 | 0.2% |
| Austrian | 121 | 2.0% |
| Bahamian | 78 | 1.3% |
| Belgian | 10 | 0.2% |
| British | 86 | 1.4% |
| Bulgarian | 9 | 0.2% |
| Burmese | 93 | 1.5% |
| Central American | 87 | 1.4% |
| Costa Rican | 67 | 1.1% |
| Cuban | 33 | 0.5% |
| Dutch | 40 | 0.6% |
| Eastern European | 203 | 3.3% |
| Ecuadorian | 28 | 0.5% |
| English | 653 | 10.7% |
| European | 179 | 2.9% |
| French | 18 | 0.3% |
| German | 903 | 14.7% |
| Greek | 30 | 0.5% |
| Guatemalan | 20 | 0.3% |
| Hungarian | 91 | 1.5% |
| Indian (Asian) | 450 | 7.3% |
| Irish | 826 | 13.5% |
| Israeli | 12 | 0.2% |
| Italian | 462 | 7.5% |
| Jamaican | 10 | 0.2% |
| Korean | 24 | 0.4% |
| Lebanese | 11 | 0.2% |
| Lithuanian | 54 | 0.9% |
| Northern European | 8 | 0.1% |
| Norwegian | 8 | 0.1% |
| Peruvian | 58 | 0.9% |
| Polish | 401 | 6.5% |
| Puerto Rican | 17 | 0.3% |
| Romanian | 21 | 0.3% |
| Russian | 563 | 9.2% |
| Scottish | 12 | 0.2% |
| Slovak | 3 | 0.1% |
| Slovene | 24 | 0.4% |
| South African | 11 | 0.2% |
| South American | 146 | 2.4% |
| Soviet Union | 11 | 0.2% |
| Spanish | 40 | 0.6% |
| Sri Lankan | 91 | 1.5% |
| Subsaharan African | 246 | 4.0% |
| Thai | 108 | 1.8% |
| Turkish | 6 | 0.1% |
| Ukrainian | 36 | 0.6% |
| Venezuelan | 60 | 1.0% | View All 52 Rows |
Immigrants in Penn Wynne
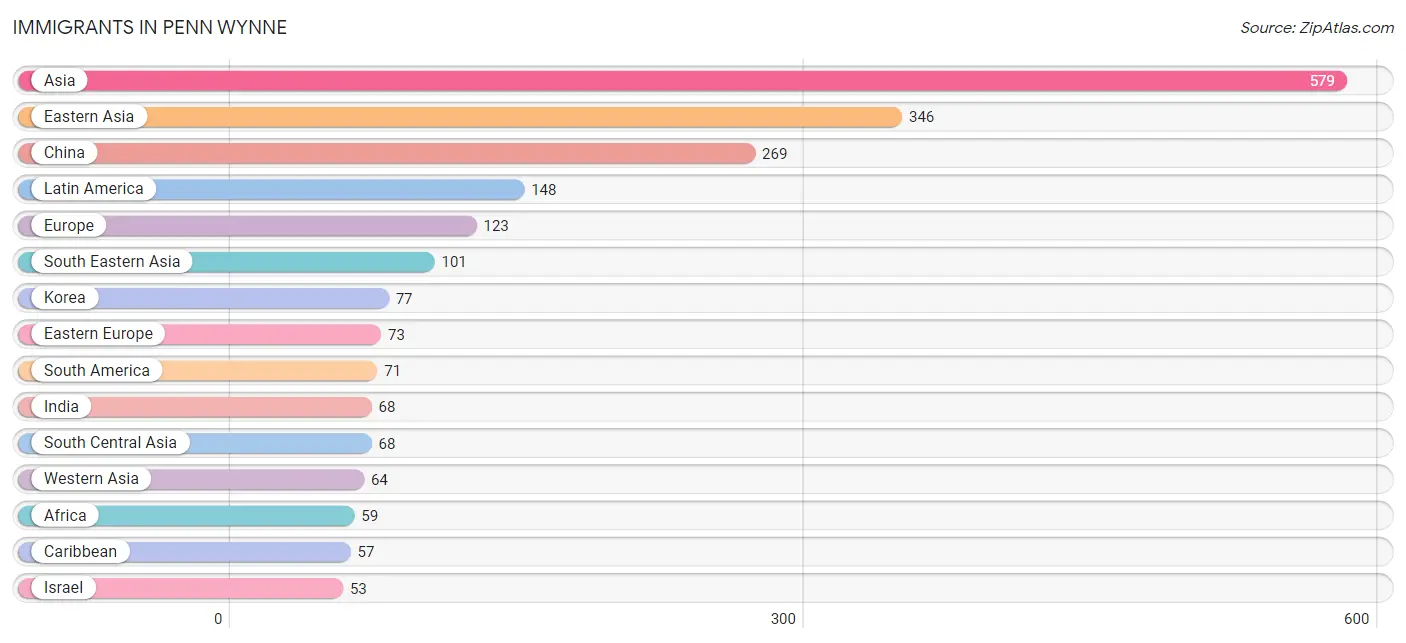
The most numerous immigrant groups reported in Penn Wynne came from Asia (579 | 9.5%), Eastern Asia (346 | 5.7%), China (269 | 4.4%), Latin America (148 | 2.4%), and Europe (123 | 2.0%), together accounting for 23.9% of all Penn Wynne residents.
| Immigration Origin | # Population | % Population |
| Africa | 59 | 1.0% |
| Asia | 579 | 9.5% |
| Bahamas | 32 | 0.5% |
| Bulgaria | 4 | 0.1% |
| Canada | 16 | 0.3% |
| Caribbean | 57 | 0.9% |
| Central America | 20 | 0.3% |
| China | 269 | 4.4% |
| Cuba | 25 | 0.4% |
| Eastern Asia | 346 | 5.7% |
| Eastern Europe | 73 | 1.2% |
| Ecuador | 28 | 0.5% |
| England | 9 | 0.2% |
| Europe | 123 | 2.0% |
| France | 5 | 0.1% |
| Germany | 17 | 0.3% |
| Guatemala | 20 | 0.3% |
| India | 68 | 1.1% |
| Israel | 53 | 0.9% |
| Italy | 18 | 0.3% |
| Korea | 77 | 1.3% |
| Latin America | 148 | 2.4% |
| Lebanon | 11 | 0.2% |
| Malaysia | 23 | 0.4% |
| Northern Europe | 10 | 0.2% |
| Peru | 23 | 0.4% |
| Philippines | 9 | 0.2% |
| Poland | 25 | 0.4% |
| Russia | 20 | 0.3% |
| Singapore | 19 | 0.3% |
| South Africa | 47 | 0.8% |
| South America | 71 | 1.2% |
| South Central Asia | 68 | 1.1% |
| South Eastern Asia | 101 | 1.7% |
| Southern Europe | 18 | 0.3% |
| Taiwan | 18 | 0.3% |
| Venezuela | 20 | 0.3% |
| Vietnam | 50 | 0.8% |
| Western Africa | 12 | 0.2% |
| Western Asia | 64 | 1.0% |
| Western Europe | 22 | 0.4% | View All 41 Rows |
Sex and Age in Penn Wynne
Sex and Age in Penn Wynne
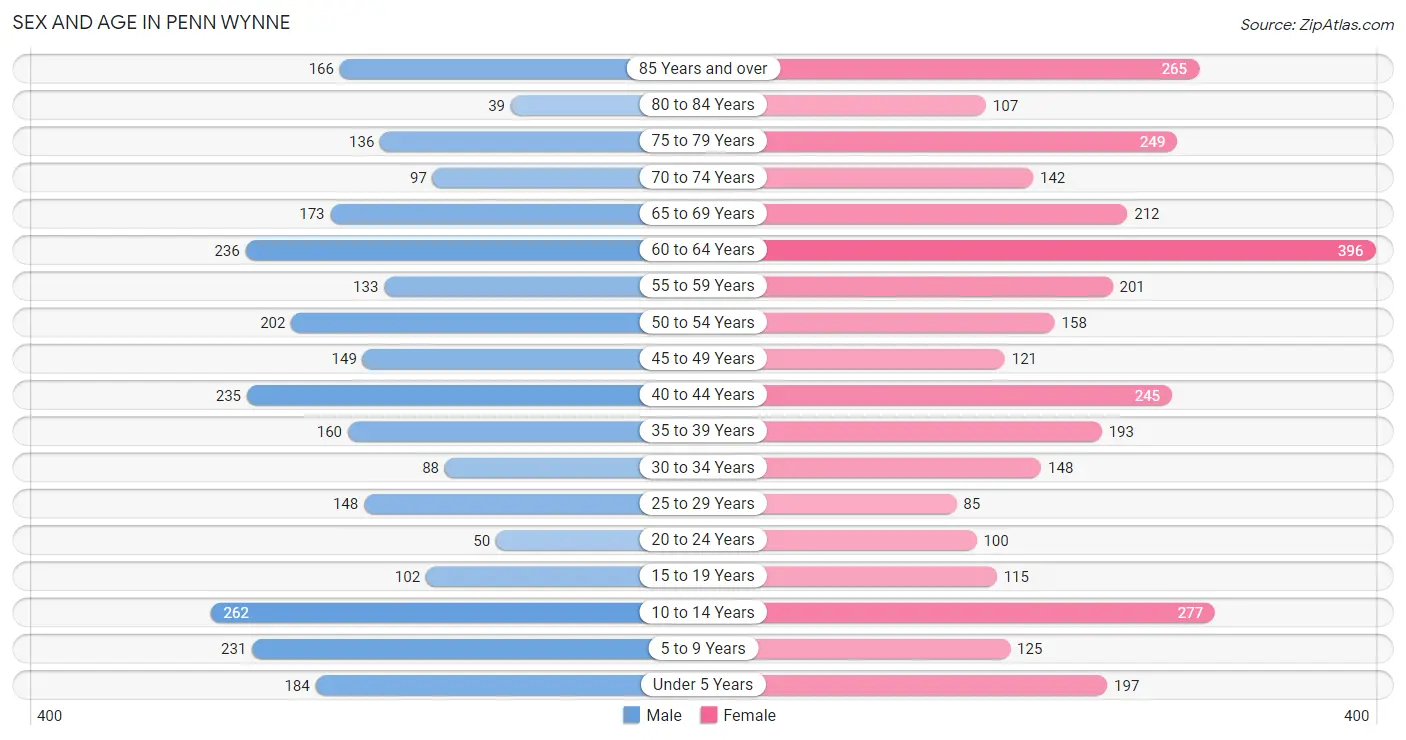
The most populous age groups in Penn Wynne are 10 to 14 Years (262 | 9.4%) for men and 60 to 64 Years (396 | 11.9%) for women.
| Age Bracket | Male | Female |
| Under 5 Years | 184 (6.6%) | 197 (5.9%) |
| 5 to 9 Years | 231 (8.3%) | 125 (3.7%) |
| 10 to 14 Years | 262 (9.4%) | 277 (8.3%) |
| 15 to 19 Years | 102 (3.6%) | 115 (3.5%) |
| 20 to 24 Years | 50 (1.8%) | 100 (3.0%) |
| 25 to 29 Years | 148 (5.3%) | 85 (2.5%) |
| 30 to 34 Years | 88 (3.2%) | 148 (4.4%) |
| 35 to 39 Years | 160 (5.7%) | 193 (5.8%) |
| 40 to 44 Years | 235 (8.4%) | 245 (7.3%) |
| 45 to 49 Years | 149 (5.3%) | 121 (3.6%) |
| 50 to 54 Years | 202 (7.2%) | 158 (4.7%) |
| 55 to 59 Years | 133 (4.8%) | 201 (6.0%) |
| 60 to 64 Years | 236 (8.5%) | 396 (11.9%) |
| 65 to 69 Years | 173 (6.2%) | 212 (6.4%) |
| 70 to 74 Years | 97 (3.5%) | 142 (4.3%) |
| 75 to 79 Years | 136 (4.9%) | 249 (7.5%) |
| 80 to 84 Years | 39 (1.4%) | 107 (3.2%) |
| 85 Years and over | 166 (5.9%) | 265 (7.9%) |
| Total | 2,791 (100.0%) | 3,336 (100.0%) |
Families and Households in Penn Wynne
Median Family Size in Penn Wynne
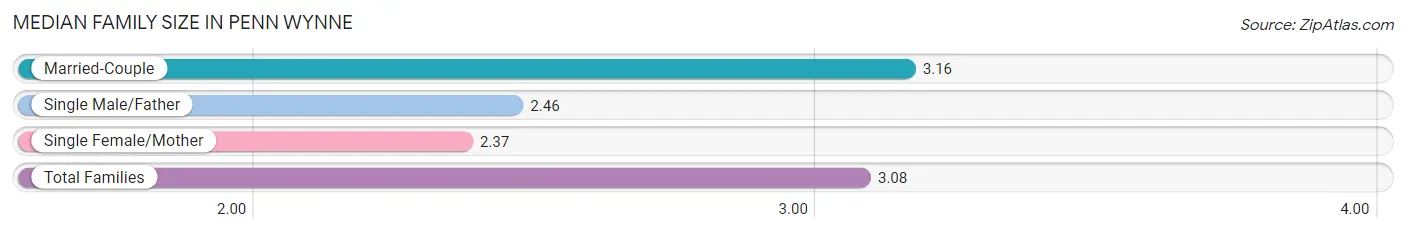
The median family size in Penn Wynne is 3.08 persons per family, with married-couple families (1,423 | 89.1%) accounting for the largest median family size of 3.16 persons per family. On the other hand, single female/mother families (161 | 10.1%) represent the smallest median family size with 2.37 persons per family.
| Family Type | # Families | Family Size |
| Married-Couple | 1,423 (89.1%) | 3.16 |
| Single Male/Father | 13 (0.8%) | 2.46 |
| Single Female/Mother | 161 (10.1%) | 2.37 |
| Total Families | 1,597 (100.0%) | 3.08 |
Median Household Size in Penn Wynne
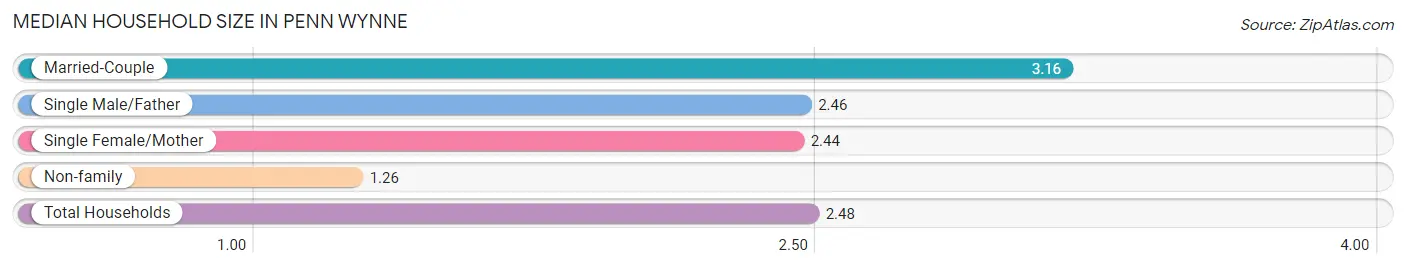
The median household size in Penn Wynne is 2.48 persons per household, with married-couple households (1,423 | 59.7%) accounting for the largest median household size of 3.16 persons per household. non-family households (788 | 33.0%) represent the smallest median household size with 1.26 persons per household.
| Household Type | # Households | Household Size |
| Married-Couple | 1,423 (59.7%) | 3.16 |
| Single Male/Father | 13 (0.5%) | 2.46 |
| Single Female/Mother | 161 (6.8%) | 2.44 |
| Non-family | 788 (33.0%) | 1.26 |
| Total Households | 2,385 (100.0%) | 2.48 |
Household Size by Marriage Status in Penn Wynne
Out of a total of 2,385 households in Penn Wynne, 1,597 (67.0%) are family households, while 788 (33.0%) are nonfamily households. The most numerous type of family households are 2-person households, comprising 724, and the most common type of nonfamily households are 1-person households, comprising 635.
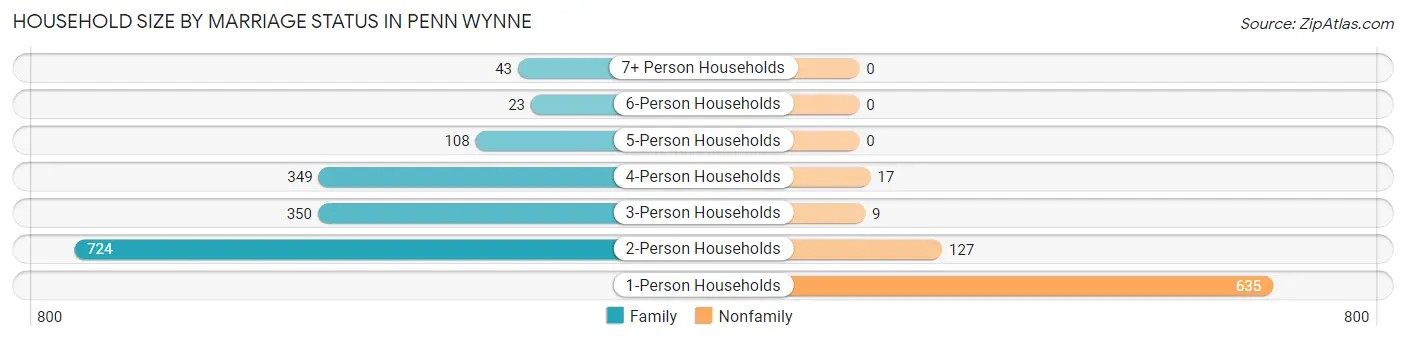
| Household Size | Family Households | Nonfamily Households |
| 1-Person Households | - | 635 (26.6%) |
| 2-Person Households | 724 (30.4%) | 127 (5.3%) |
| 3-Person Households | 350 (14.7%) | 9 (0.4%) |
| 4-Person Households | 349 (14.6%) | 17 (0.7%) |
| 5-Person Households | 108 (4.5%) | 0 (0.0%) |
| 6-Person Households | 23 (1.0%) | 0 (0.0%) |
| 7+ Person Households | 43 (1.8%) | 0 (0.0%) |
| Total | 1,597 (67.0%) | 788 (33.0%) |
Female Fertility in Penn Wynne
Fertility by Age in Penn Wynne
Average fertility rate in Penn Wynne is 91.0 births per 1,000 women. Women in the age bracket of 20 to 34 years have the highest fertility rate with 201.0 births per 1,000 women. Women in the age bracket of 20 to 34 years acount for 72.0% of all women with births.
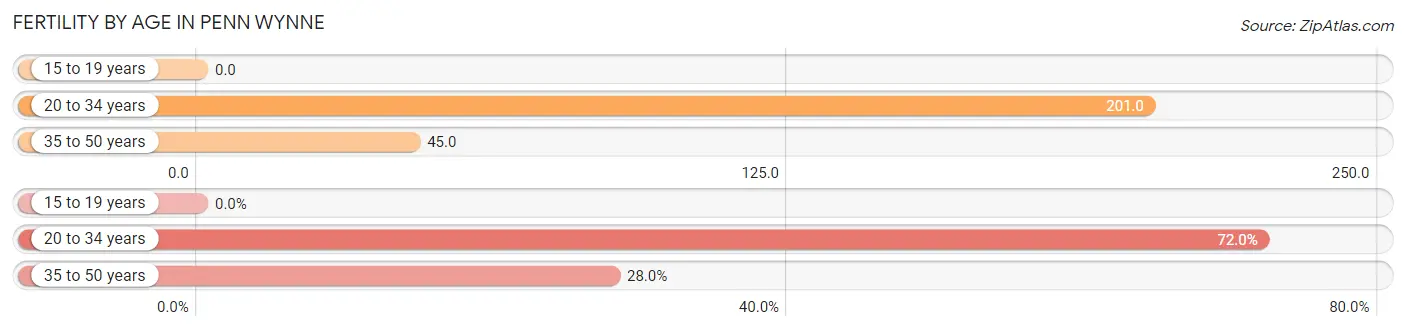
| Age Bracket | Women with Births | Births / 1,000 Women |
| 15 to 19 years | 0 (0.0%) | 0.0 |
| 20 to 34 years | 67 (72.0%) | 201.0 |
| 35 to 50 years | 26 (28.0%) | 45.0 |
| Total | 93 (100.0%) | 91.0 |
Fertility by Age by Marriage Status in Penn Wynne
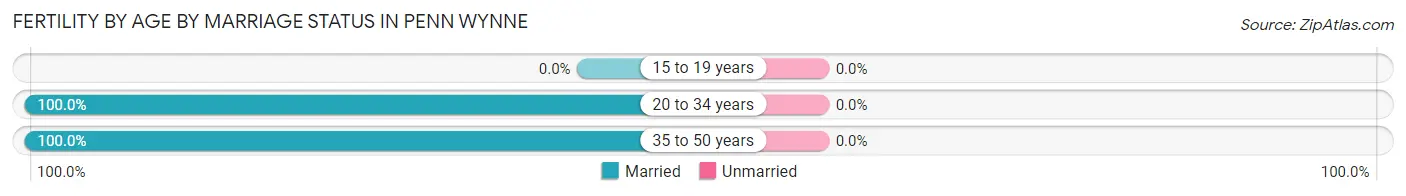
| Age Bracket | Married | Unmarried |
| 15 to 19 years | 0 (0.0%) | 0 (0.0%) |
| 20 to 34 years | 67 (100.0%) | 0 (0.0%) |
| 35 to 50 years | 26 (100.0%) | 0 (0.0%) |
| Total | 93 (100.0%) | 0 (0.0%) |
Fertility by Education in Penn Wynne
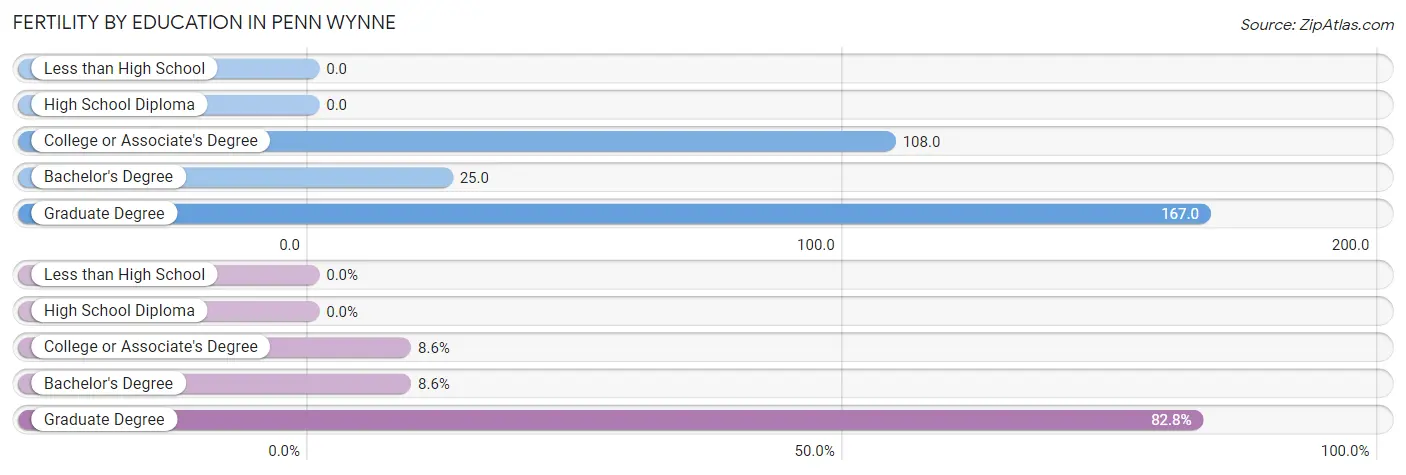
| Educational Attainment | Women with Births | Births / 1,000 Women |
| Less than High School | 0 (0.0%) | 0.0 |
| High School Diploma | 0 (0.0%) | 0.0 |
| College or Associate's Degree | 8 (8.6%) | 108.0 |
| Bachelor's Degree | 8 (8.6%) | 25.0 |
| Graduate Degree | 77 (82.8%) | 167.0 |
| Total | 93 (100.0%) | 91.0 |
Fertility by Education by Marriage Status in Penn Wynne
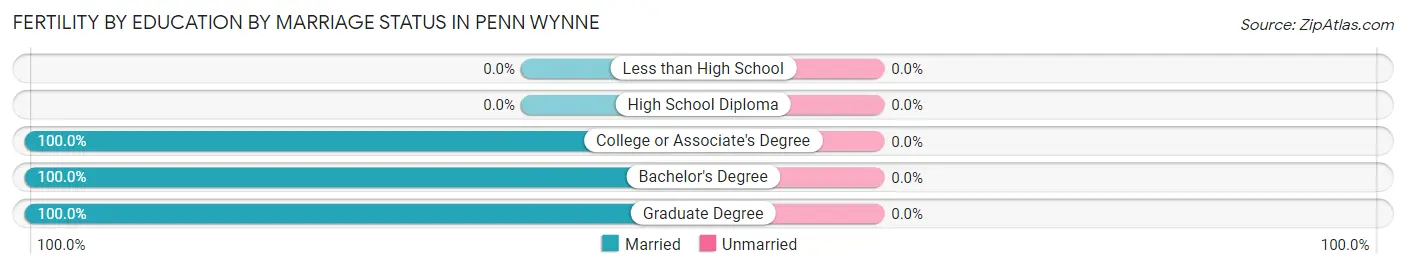
| Educational Attainment | Married | Unmarried |
| Less than High School | 0 (0.0%) | 0 (0.0%) |
| High School Diploma | 0 (0.0%) | 0 (0.0%) |
| College or Associate's Degree | 8 (100.0%) | 0 (0.0%) |
| Bachelor's Degree | 8 (100.0%) | 0 (0.0%) |
| Graduate Degree | 77 (100.0%) | 0 (0.0%) |
| Total | 93 (100.0%) | 0 (0.0%) |
Employment Characteristics in Penn Wynne
Employment by Class of Employer in Penn Wynne
Among the 2,754 employed individuals in Penn Wynne, private company employees (1,502 | 54.5%), not-for-profit organizations (568 | 20.6%), and local government employees (171 | 6.2%) make up the most common classes of employment.
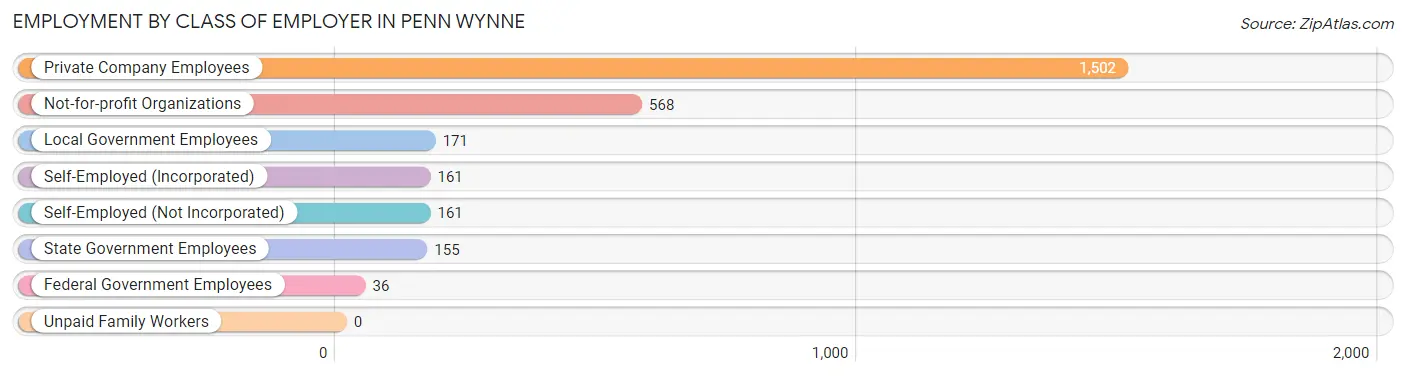
| Employer Class | # Employees | % Employees |
| Private Company Employees | 1,502 | 54.5% |
| Self-Employed (Incorporated) | 161 | 5.9% |
| Self-Employed (Not Incorporated) | 161 | 5.9% |
| Not-for-profit Organizations | 568 | 20.6% |
| Local Government Employees | 171 | 6.2% |
| State Government Employees | 155 | 5.6% |
| Federal Government Employees | 36 | 1.3% |
| Unpaid Family Workers | 0 | 0.0% |
| Total | 2,754 | 100.0% |
Employment Status by Age in Penn Wynne
According to the labor force statistics for Penn Wynne, out of the total population over 16 years of age (4,799), 61.7% or 2,961 individuals are in the labor force, with 5.6% or 166 of them unemployed. The age group with the highest labor force participation rate is 45 to 54 years, with 92.2% or 581 individuals in the labor force. Within the labor force, the 16 to 19 years age range has the highest percentage of unemployed individuals, with 25.0% or 10 of them being unemployed.
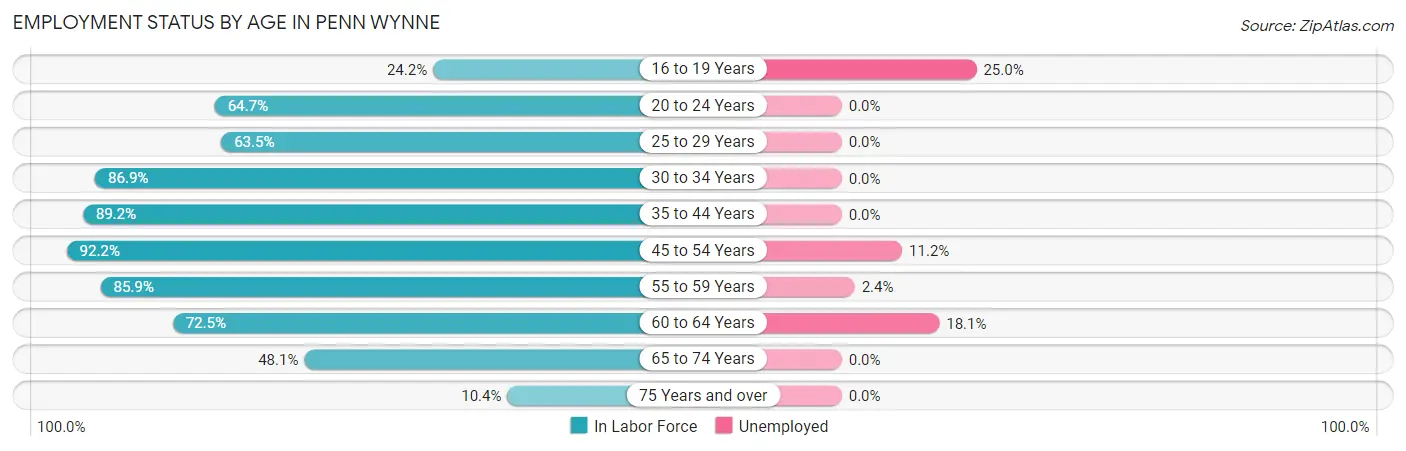
| Age Bracket | In Labor Force | Unemployed |
| 16 to 19 Years | 40 (24.2%) | 10 (25.0%) |
| 20 to 24 Years | 97 (64.7%) | 0 (0.0%) |
| 25 to 29 Years | 148 (63.5%) | 0 (0.0%) |
| 30 to 34 Years | 205 (86.9%) | 0 (0.0%) |
| 35 to 44 Years | 743 (89.2%) | 0 (0.0%) |
| 45 to 54 Years | 581 (92.2%) | 65 (11.2%) |
| 55 to 59 Years | 287 (85.9%) | 7 (2.4%) |
| 60 to 64 Years | 458 (72.5%) | 83 (18.1%) |
| 65 to 74 Years | 300 (48.1%) | 0 (0.0%) |
| 75 Years and over | 100 (10.4%) | 0 (0.0%) |
| Total | 2,961 (61.7%) | 166 (5.6%) |
Employment Status by Educational Attainment in Penn Wynne
According to labor force statistics for Penn Wynne, 83.6% of individuals (2,423) out of the total population between 25 and 64 years of age (2,898) are in the labor force, with 6.4% or 155 of them being unemployed. The group with the highest labor force participation rate are those with the educational attainment of bachelor's degree or higher, with 91.1% or 1,981 individuals in the labor force. Within the labor force, individuals with high school diploma education have the highest percentage of unemployment, with 49.1% or 83 of them being unemployed.
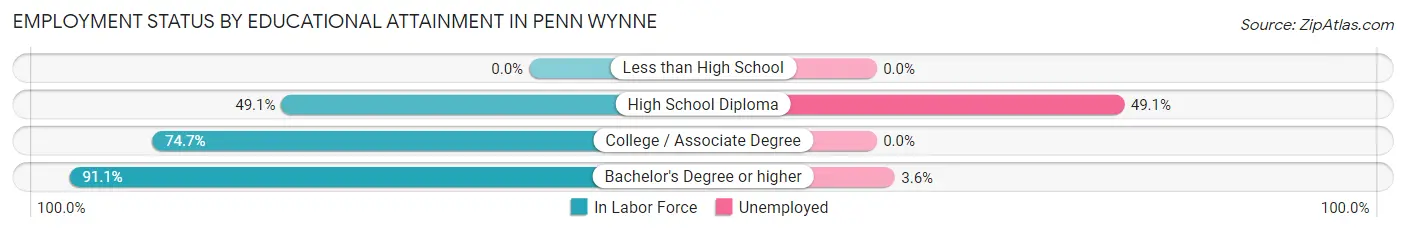
| Educational Attainment | In Labor Force | Unemployed |
| Less than High School | 0 (0.0%) | 0 (0.0%) |
| High School Diploma | 169 (49.1%) | 169 (49.1%) |
| College / Associate Degree | 272 (74.7%) | 0 (0.0%) |
| Bachelor's Degree or higher | 1,981 (91.1%) | 78 (3.6%) |
| Total | 2,423 (83.6%) | 185 (6.4%) |
Employment Occupations by Sex in Penn Wynne
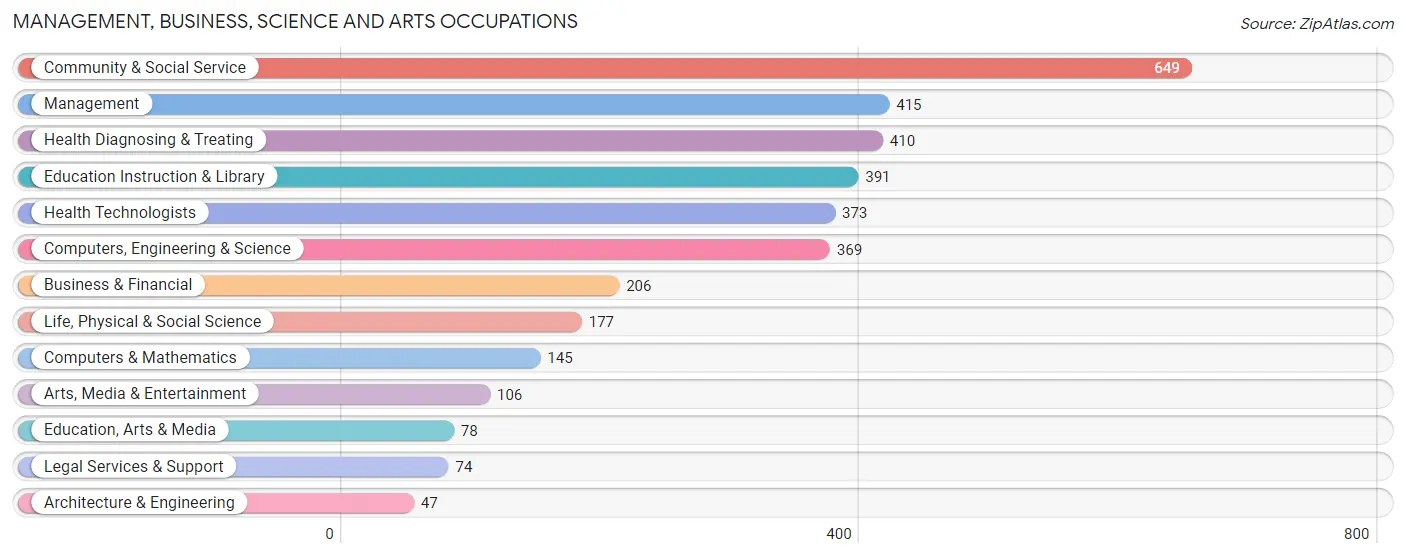
Management, Business, Science and Arts Occupations
The most common Management, Business, Science and Arts occupations in Penn Wynne are Community & Social Service (649 | 23.2%), Management (415 | 14.8%), Health Diagnosing & Treating (410 | 14.7%), Education Instruction & Library (391 | 14.0%), and Health Technologists (373 | 13.4%).
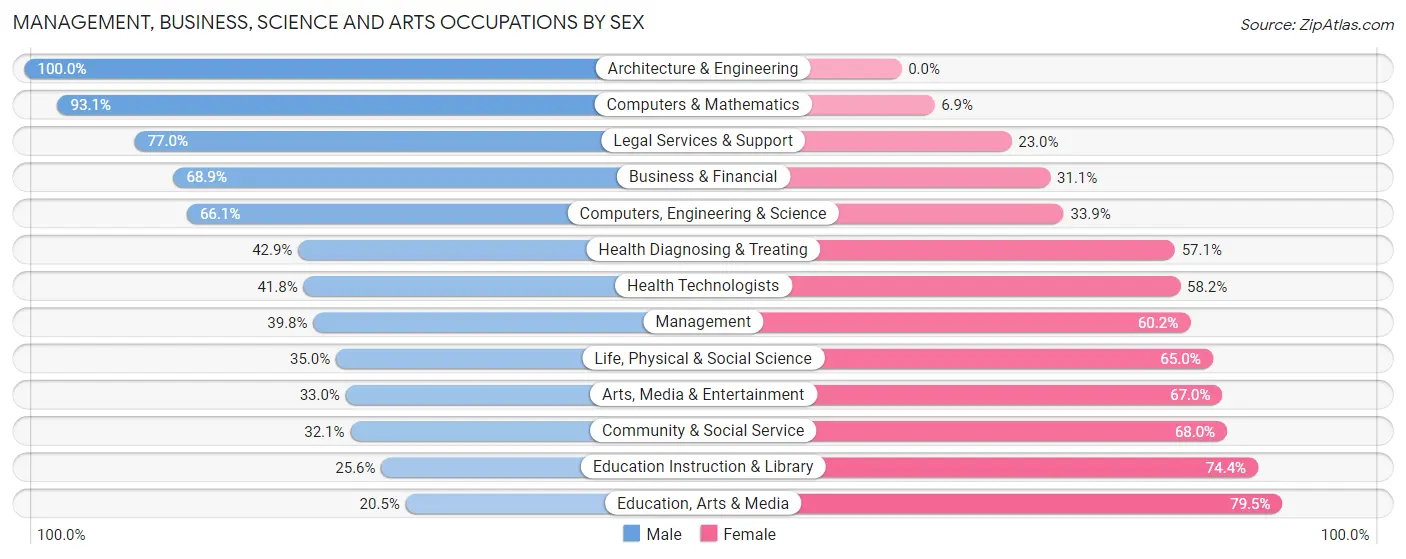
Management, Business, Science and Arts Occupations by Sex
Within the Management, Business, Science and Arts occupations in Penn Wynne, the most male-oriented occupations are Architecture & Engineering (100.0%), Computers & Mathematics (93.1%), and Legal Services & Support (77.0%), while the most female-oriented occupations are Education, Arts & Media (79.5%), Education Instruction & Library (74.4%), and Community & Social Service (67.9%).
| Occupation | Male | Female |
| Management | 165 (39.8%) | 250 (60.2%) |
| Business & Financial | 142 (68.9%) | 64 (31.1%) |
| Computers, Engineering & Science | 244 (66.1%) | 125 (33.9%) |
| Computers & Mathematics | 135 (93.1%) | 10 (6.9%) |
| Architecture & Engineering | 47 (100.0%) | 0 (0.0%) |
| Life, Physical & Social Science | 62 (35.0%) | 115 (65.0%) |
| Community & Social Service | 208 (32.1%) | 441 (67.9%) |
| Education, Arts & Media | 16 (20.5%) | 62 (79.5%) |
| Legal Services & Support | 57 (77.0%) | 17 (23.0%) |
| Education Instruction & Library | 100 (25.6%) | 291 (74.4%) |
| Arts, Media & Entertainment | 35 (33.0%) | 71 (67.0%) |
| Health Diagnosing & Treating | 176 (42.9%) | 234 (57.1%) |
| Health Technologists | 156 (41.8%) | 217 (58.2%) |
| Total (Category) | 935 (45.6%) | 1,114 (54.4%) |
| Total (Overall) | 1,325 (47.4%) | 1,469 (52.6%) |
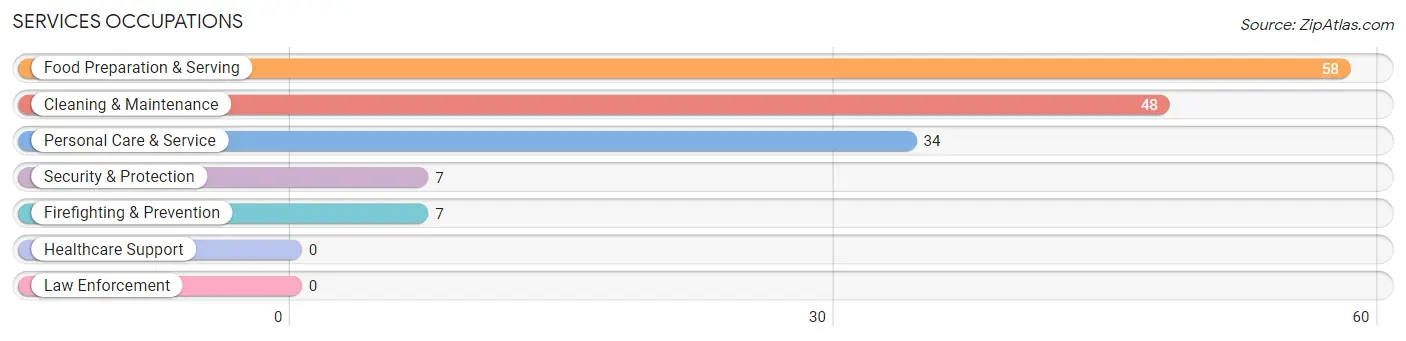
Services Occupations
The most common Services occupations in Penn Wynne are Food Preparation & Serving (58 | 2.1%), Cleaning & Maintenance (48 | 1.7%), Personal Care & Service (34 | 1.2%), Security & Protection (7 | 0.3%), and Firefighting & Prevention (7 | 0.3%).
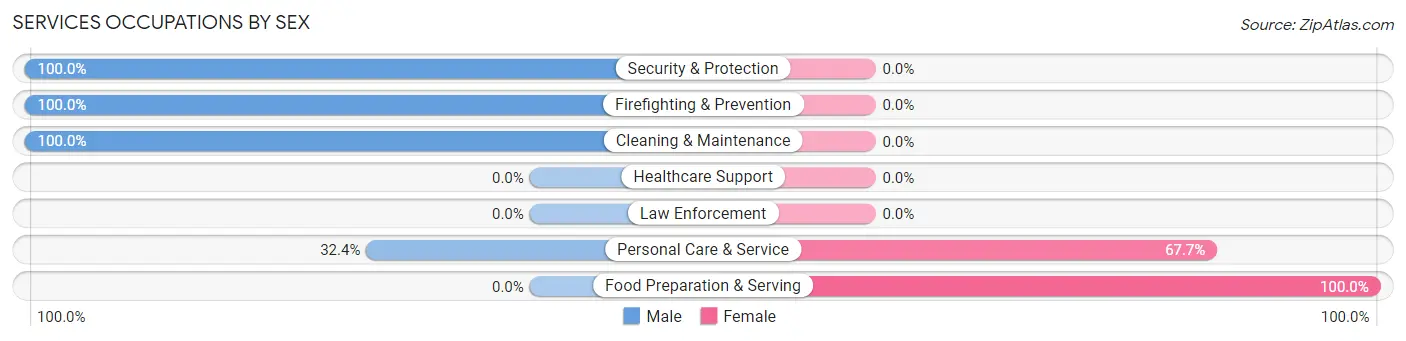
Services Occupations by Sex
Within the Services occupations in Penn Wynne, the most male-oriented occupations are Security & Protection (100.0%), Firefighting & Prevention (100.0%), and Cleaning & Maintenance (100.0%), while the most female-oriented occupations are Food Preparation & Serving (100.0%), and Personal Care & Service (67.6%).
| Occupation | Male | Female |
| Healthcare Support | 0 (0.0%) | 0 (0.0%) |
| Security & Protection | 7 (100.0%) | 0 (0.0%) |
| Firefighting & Prevention | 7 (100.0%) | 0 (0.0%) |
| Law Enforcement | 0 (0.0%) | 0 (0.0%) |
| Food Preparation & Serving | 0 (0.0%) | 58 (100.0%) |
| Cleaning & Maintenance | 48 (100.0%) | 0 (0.0%) |
| Personal Care & Service | 11 (32.4%) | 23 (67.6%) |
| Total (Category) | 66 (44.9%) | 81 (55.1%) |
| Total (Overall) | 1,325 (47.4%) | 1,469 (52.6%) |
Sales and Office Occupations
The most common Sales and Office occupations in Penn Wynne are Sales & Related (253 | 9.1%), and Office & Administration (183 | 6.6%).

Sales and Office Occupations by Sex

| Occupation | Male | Female |
| Sales & Related | 161 (63.6%) | 92 (36.4%) |
| Office & Administration | 48 (26.2%) | 135 (73.8%) |
| Total (Category) | 209 (47.9%) | 227 (52.1%) |
| Total (Overall) | 1,325 (47.4%) | 1,469 (52.6%) |
Natural Resources, Construction and Maintenance Occupations
The most common Natural Resources, Construction and Maintenance occupations in Penn Wynne are , and Construction & Extraction (21 | 0.7%).

Natural Resources, Construction and Maintenance Occupations by Sex

| Occupation | Male | Female |
| Farming, Fishing & Forestry | 0 (0.0%) | 0 (0.0%) |
| Construction & Extraction | 21 (100.0%) | 0 (0.0%) |
| Installation, Maintenance & Repair | 0 (0.0%) | 0 (0.0%) |
| Total (Category) | 21 (100.0%) | 0 (0.0%) |
| Total (Overall) | 1,325 (47.4%) | 1,469 (52.6%) |
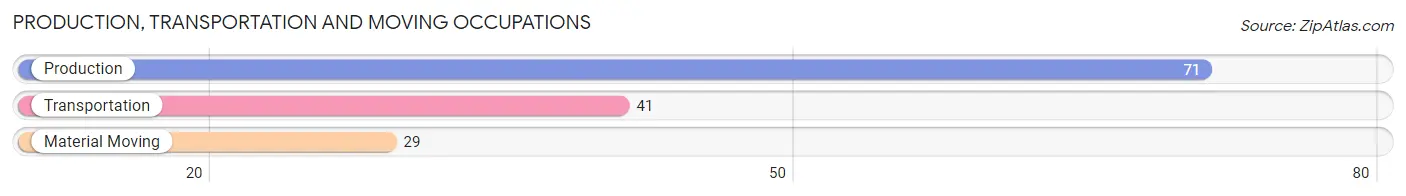
Production, Transportation and Moving Occupations
The most common Production, Transportation and Moving occupations in Penn Wynne are Production (71 | 2.5%), Transportation (41 | 1.5%), and Material Moving (29 | 1.0%).
Production, Transportation and Moving Occupations by Sex
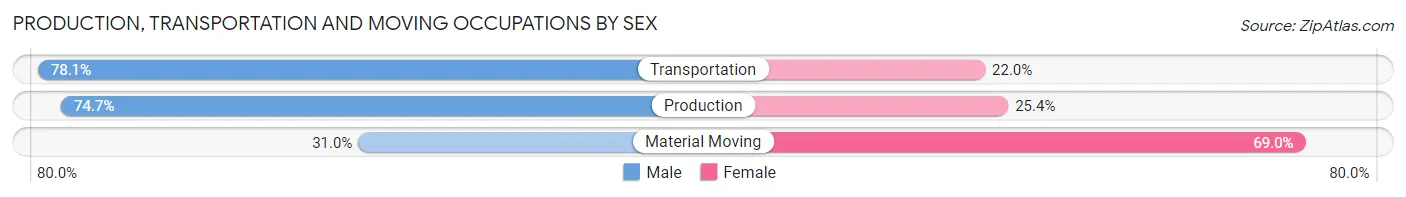
| Occupation | Male | Female |
| Production | 53 (74.7%) | 18 (25.4%) |
| Transportation | 32 (78.0%) | 9 (22.0%) |
| Material Moving | 9 (31.0%) | 20 (69.0%) |
| Total (Category) | 94 (66.7%) | 47 (33.3%) |
| Total (Overall) | 1,325 (47.4%) | 1,469 (52.6%) |
Employment Industries by Sex in Penn Wynne
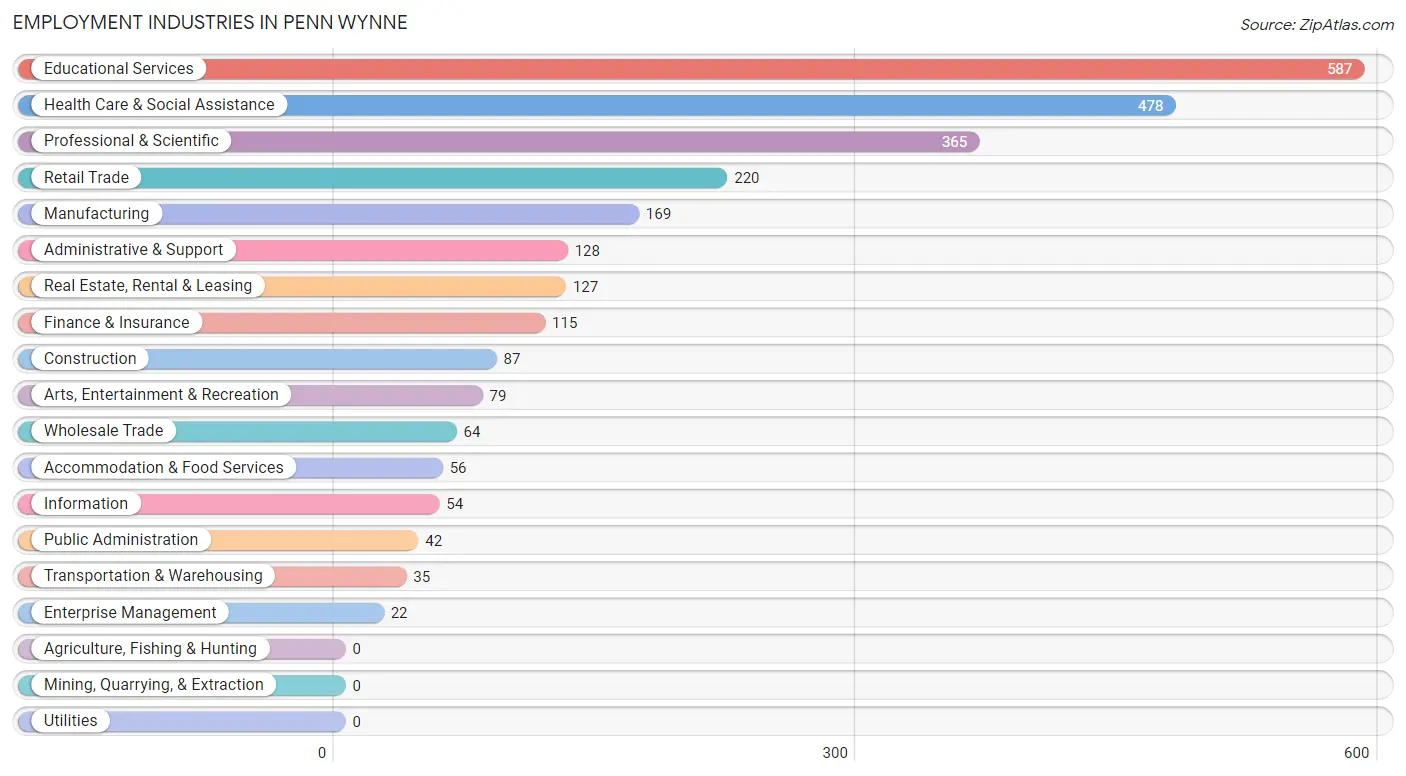
Employment Industries in Penn Wynne
The major employment industries in Penn Wynne include Educational Services (587 | 21.0%), Health Care & Social Assistance (478 | 17.1%), Professional & Scientific (365 | 13.1%), Retail Trade (220 | 7.9%), and Manufacturing (169 | 6.0%).
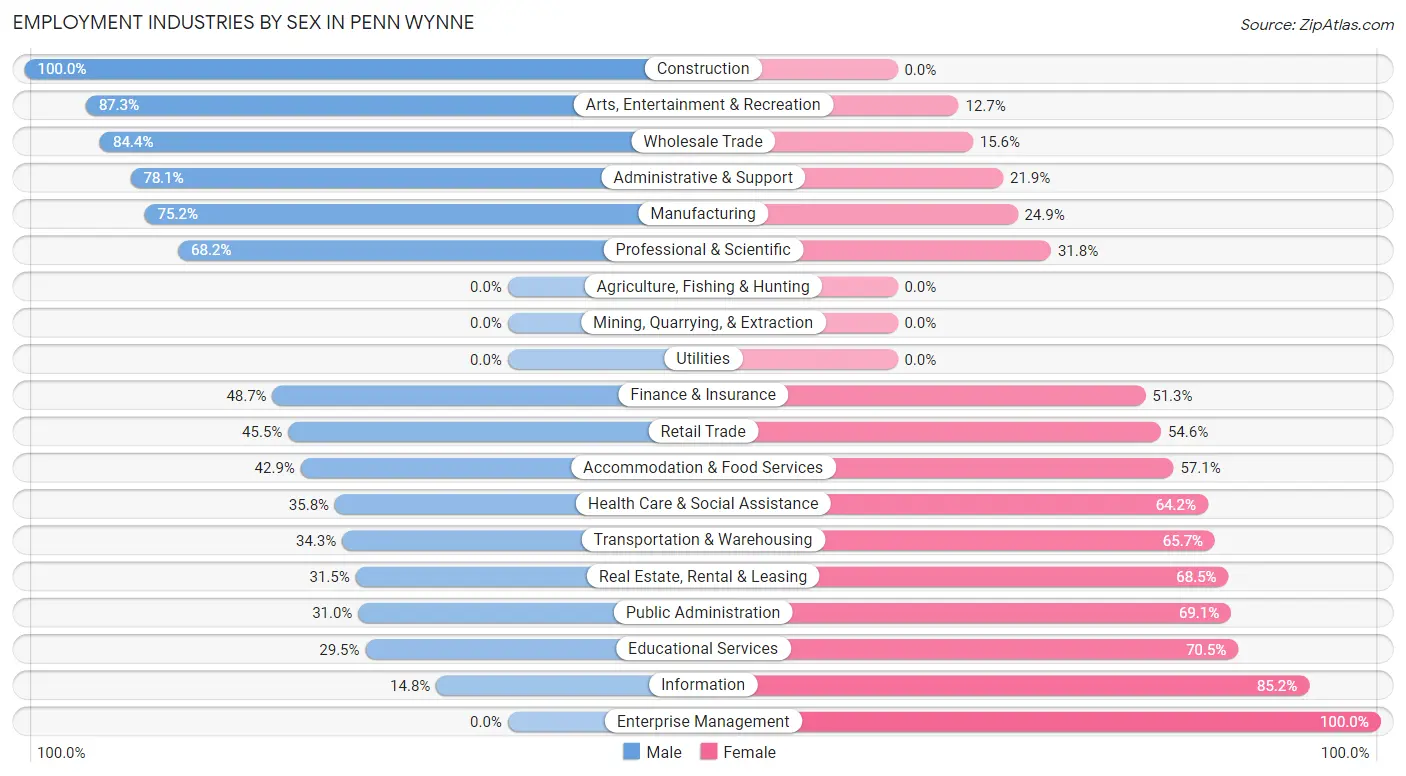
Employment Industries by Sex in Penn Wynne
The Penn Wynne industries that see more men than women are Construction (100.0%), Arts, Entertainment & Recreation (87.3%), and Wholesale Trade (84.4%), whereas the industries that tend to have a higher number of women are Enterprise Management (100.0%), Information (85.2%), and Educational Services (70.5%).
| Industry | Male | Female |
| Agriculture, Fishing & Hunting | 0 (0.0%) | 0 (0.0%) |
| Mining, Quarrying, & Extraction | 0 (0.0%) | 0 (0.0%) |
| Construction | 87 (100.0%) | 0 (0.0%) |
| Manufacturing | 127 (75.1%) | 42 (24.8%) |
| Wholesale Trade | 54 (84.4%) | 10 (15.6%) |
| Retail Trade | 100 (45.5%) | 120 (54.5%) |
| Transportation & Warehousing | 12 (34.3%) | 23 (65.7%) |
| Utilities | 0 (0.0%) | 0 (0.0%) |
| Information | 8 (14.8%) | 46 (85.2%) |
| Finance & Insurance | 56 (48.7%) | 59 (51.3%) |
| Real Estate, Rental & Leasing | 40 (31.5%) | 87 (68.5%) |
| Professional & Scientific | 249 (68.2%) | 116 (31.8%) |
| Enterprise Management | 0 (0.0%) | 22 (100.0%) |
| Administrative & Support | 100 (78.1%) | 28 (21.9%) |
| Educational Services | 173 (29.5%) | 414 (70.5%) |
| Health Care & Social Assistance | 171 (35.8%) | 307 (64.2%) |
| Arts, Entertainment & Recreation | 69 (87.3%) | 10 (12.7%) |
| Accommodation & Food Services | 24 (42.9%) | 32 (57.1%) |
| Public Administration | 13 (30.9%) | 29 (69.1%) |
| Total | 1,325 (47.4%) | 1,469 (52.6%) |
Education in Penn Wynne
School Enrollment in Penn Wynne
The most common levels of schooling among the 1,516 students in Penn Wynne are middle school (432 | 28.5%), elementary school (323 | 21.3%), and graduate / professional (217 | 14.3%).
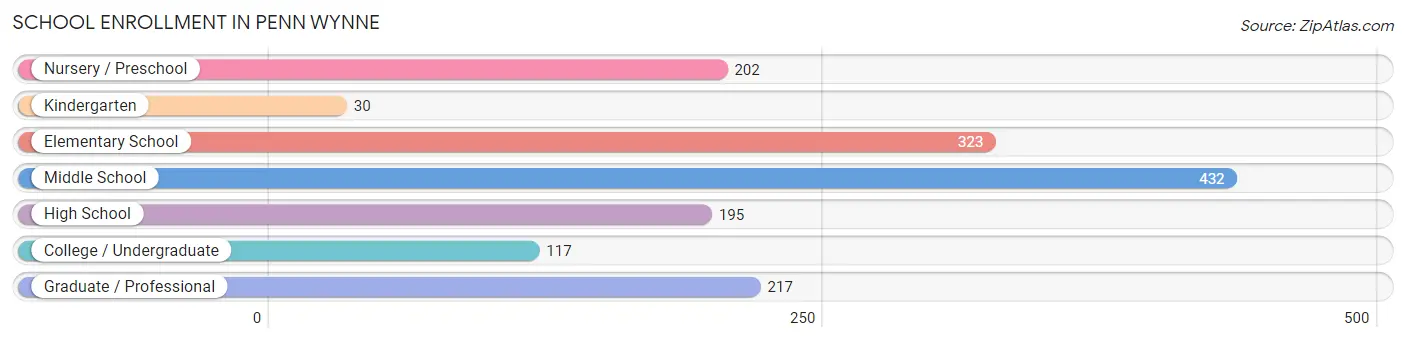
| School Level | # Students | % Students |
| Nursery / Preschool | 202 | 13.3% |
| Kindergarten | 30 | 2.0% |
| Elementary School | 323 | 21.3% |
| Middle School | 432 | 28.5% |
| High School | 195 | 12.9% |
| College / Undergraduate | 117 | 7.7% |
| Graduate / Professional | 217 | 14.3% |
| Total | 1,516 | 100.0% |
School Enrollment by Age by Funding Source in Penn Wynne
Out of a total of 1,516 students who are enrolled in schools in Penn Wynne, 432 (28.5%) attend a private institution, while the remaining 1,084 (71.5%) are enrolled in public schools. The age group of 3 to 4 year olds has the highest likelihood of being enrolled in private schools, with 125 (91.2% in the age bracket) enrolled. Conversely, the age group of 15 to 17 year olds has the lowest likelihood of being enrolled in a private school, with 166 (94.9% in the age bracket) attending a public institution.
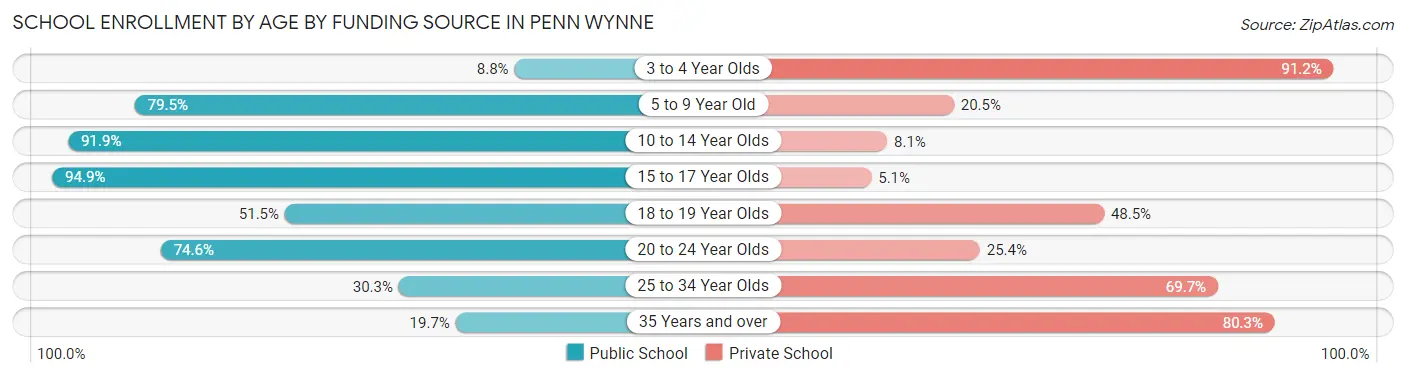
| Age Bracket | Public School | Private School |
| 3 to 4 Year Olds | 12 (8.8%) | 125 (91.2%) |
| 5 to 9 Year Old | 283 (79.5%) | 73 (20.5%) |
| 10 to 14 Year Olds | 466 (91.9%) | 41 (8.1%) |
| 15 to 17 Year Olds | 166 (94.9%) | 9 (5.1%) |
| 18 to 19 Year Olds | 17 (51.5%) | 16 (48.5%) |
| 20 to 24 Year Olds | 103 (74.6%) | 35 (25.4%) |
| 25 to 34 Year Olds | 10 (30.3%) | 23 (69.7%) |
| 35 Years and over | 27 (19.7%) | 110 (80.3%) |
| Total | 1,084 (71.5%) | 432 (28.5%) |
Educational Attainment by Field of Study in Penn Wynne
Business (511 | 14.8%), education (337 | 9.8%), bio, nature & agricultural (308 | 8.9%), science & technology (286 | 8.3%), and liberal arts & history (278 | 8.1%) are the most common fields of study among 3,453 individuals in Penn Wynne who have obtained a bachelor's degree or higher.
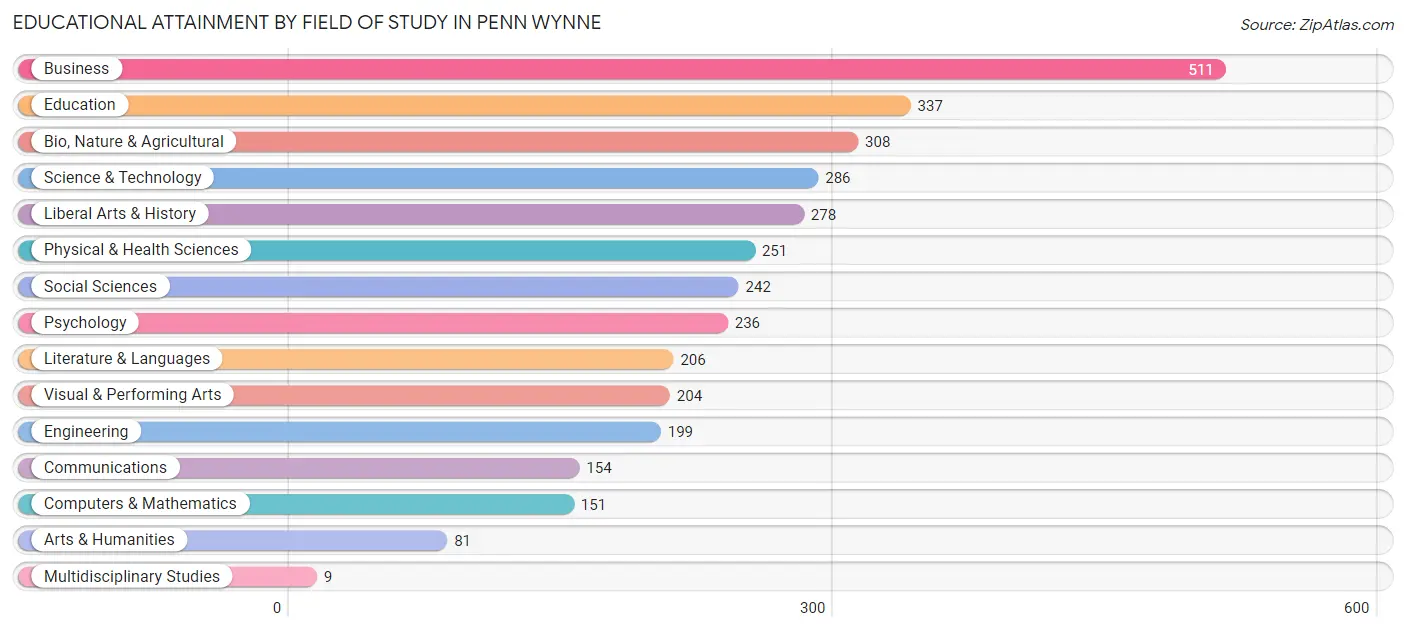
| Field of Study | # Graduates | % Graduates |
| Computers & Mathematics | 151 | 4.4% |
| Bio, Nature & Agricultural | 308 | 8.9% |
| Physical & Health Sciences | 251 | 7.3% |
| Psychology | 236 | 6.8% |
| Social Sciences | 242 | 7.0% |
| Engineering | 199 | 5.8% |
| Multidisciplinary Studies | 9 | 0.3% |
| Science & Technology | 286 | 8.3% |
| Business | 511 | 14.8% |
| Education | 337 | 9.8% |
| Literature & Languages | 206 | 6.0% |
| Liberal Arts & History | 278 | 8.1% |
| Visual & Performing Arts | 204 | 5.9% |
| Communications | 154 | 4.5% |
| Arts & Humanities | 81 | 2.4% |
| Total | 3,453 | 100.0% |
Transportation & Commute in Penn Wynne
Vehicle Availability by Sex in Penn Wynne
The most prevalent vehicle ownership categories in Penn Wynne are males with 2 vehicles (686, accounting for 52.8%) and females with 2 vehicles (534, making up 47.4%).
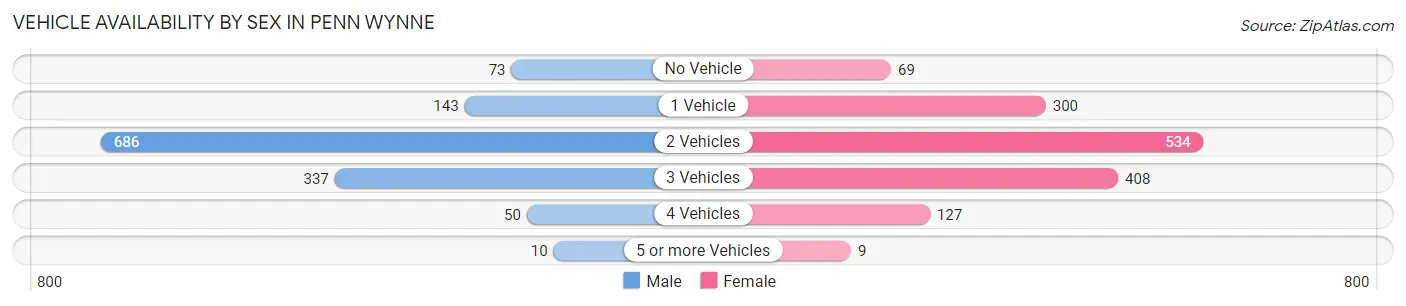
| Vehicles Available | Male | Female |
| No Vehicle | 73 (5.6%) | 69 (4.8%) |
| 1 Vehicle | 143 (11.0%) | 300 (20.7%) |
| 2 Vehicles | 686 (52.8%) | 534 (36.9%) |
| 3 Vehicles | 337 (25.9%) | 408 (28.2%) |
| 4 Vehicles | 50 (3.8%) | 127 (8.8%) |
| 5 or more Vehicles | 10 (0.8%) | 9 (0.6%) |
| Total | 1,299 (100.0%) | 1,447 (100.0%) |
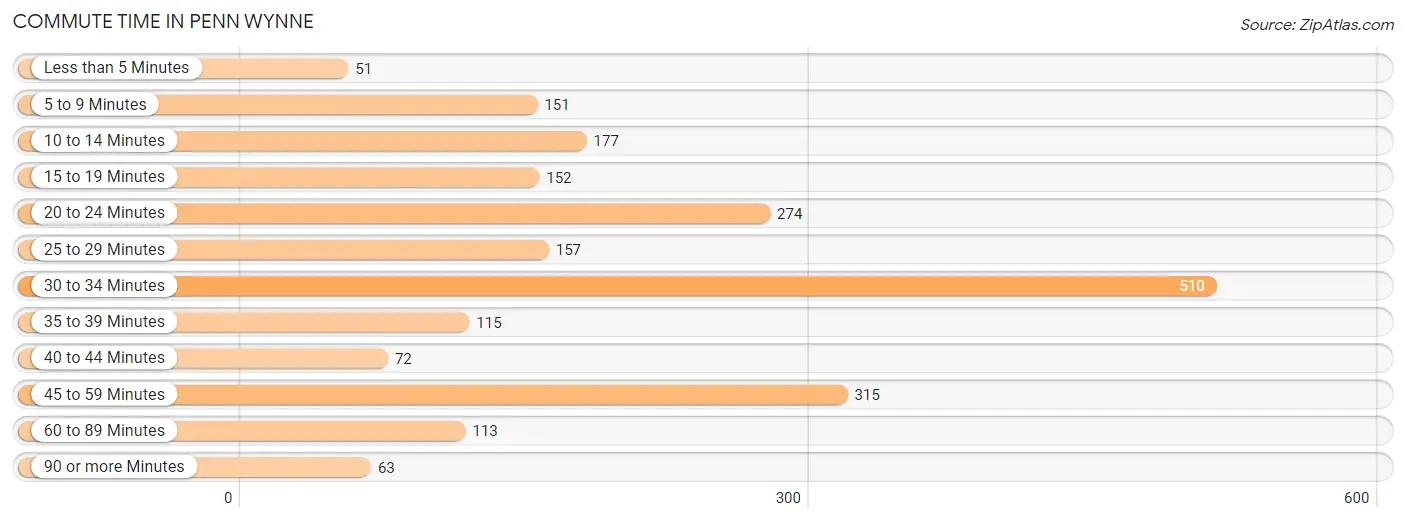
Commute Time in Penn Wynne
The most frequently occuring commute durations in Penn Wynne are 30 to 34 minutes (510 commuters, 23.7%), 45 to 59 minutes (315 commuters, 14.6%), and 20 to 24 minutes (274 commuters, 12.7%).
| Commute Time | # Commuters | % Commuters |
| Less than 5 Minutes | 51 | 2.4% |
| 5 to 9 Minutes | 151 | 7.0% |
| 10 to 14 Minutes | 177 | 8.2% |
| 15 to 19 Minutes | 152 | 7.1% |
| 20 to 24 Minutes | 274 | 12.7% |
| 25 to 29 Minutes | 157 | 7.3% |
| 30 to 34 Minutes | 510 | 23.7% |
| 35 to 39 Minutes | 115 | 5.3% |
| 40 to 44 Minutes | 72 | 3.4% |
| 45 to 59 Minutes | 315 | 14.6% |
| 60 to 89 Minutes | 113 | 5.3% |
| 90 or more Minutes | 63 | 2.9% |
Commute Time by Sex in Penn Wynne
The most common commute times in Penn Wynne are 30 to 34 minutes (254 commuters, 26.7%) for males and 30 to 34 minutes (256 commuters, 21.4%) for females.
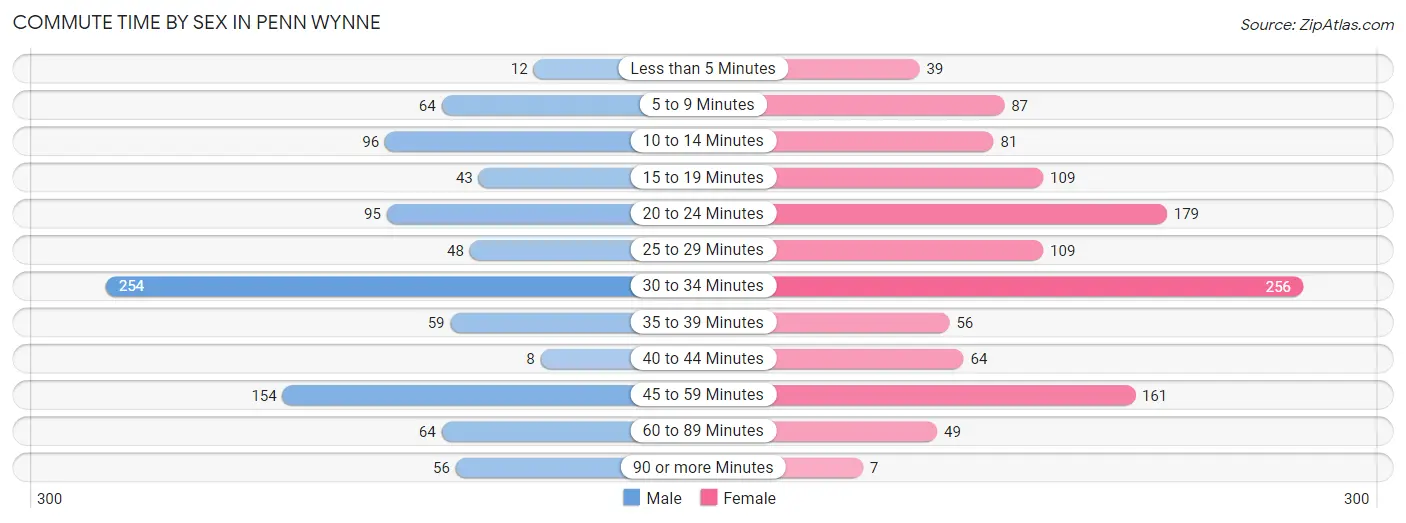
| Commute Time | Male | Female |
| Less than 5 Minutes | 12 (1.3%) | 39 (3.3%) |
| 5 to 9 Minutes | 64 (6.7%) | 87 (7.3%) |
| 10 to 14 Minutes | 96 (10.1%) | 81 (6.8%) |
| 15 to 19 Minutes | 43 (4.5%) | 109 (9.1%) |
| 20 to 24 Minutes | 95 (10.0%) | 179 (14.9%) |
| 25 to 29 Minutes | 48 (5.0%) | 109 (9.1%) |
| 30 to 34 Minutes | 254 (26.7%) | 256 (21.4%) |
| 35 to 39 Minutes | 59 (6.2%) | 56 (4.7%) |
| 40 to 44 Minutes | 8 (0.8%) | 64 (5.3%) |
| 45 to 59 Minutes | 154 (16.2%) | 161 (13.5%) |
| 60 to 89 Minutes | 64 (6.7%) | 49 (4.1%) |
| 90 or more Minutes | 56 (5.9%) | 7 (0.6%) |
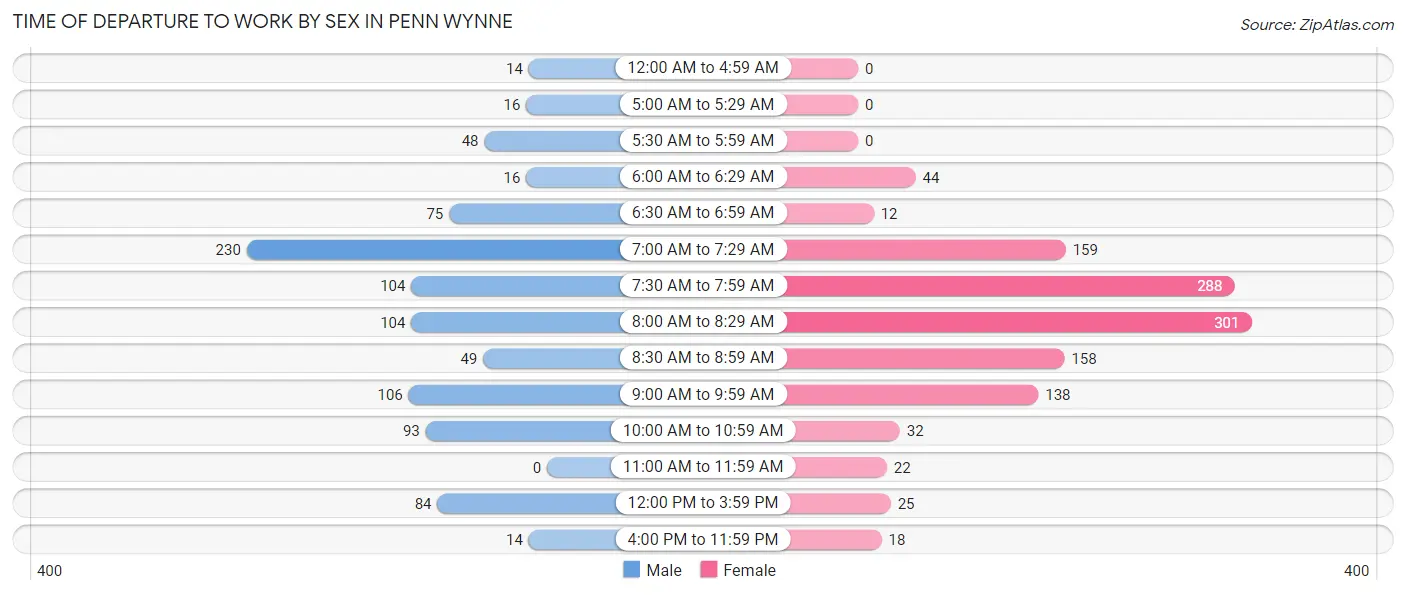
Time of Departure to Work by Sex in Penn Wynne
The most frequent times of departure to work in Penn Wynne are 7:00 AM to 7:29 AM (230, 24.1%) for males and 8:00 AM to 8:29 AM (301, 25.2%) for females.
| Time of Departure | Male | Female |
| 12:00 AM to 4:59 AM | 14 (1.5%) | 0 (0.0%) |
| 5:00 AM to 5:29 AM | 16 (1.7%) | 0 (0.0%) |
| 5:30 AM to 5:59 AM | 48 (5.0%) | 0 (0.0%) |
| 6:00 AM to 6:29 AM | 16 (1.7%) | 44 (3.7%) |
| 6:30 AM to 6:59 AM | 75 (7.9%) | 12 (1.0%) |
| 7:00 AM to 7:29 AM | 230 (24.1%) | 159 (13.3%) |
| 7:30 AM to 7:59 AM | 104 (10.9%) | 288 (24.1%) |
| 8:00 AM to 8:29 AM | 104 (10.9%) | 301 (25.2%) |
| 8:30 AM to 8:59 AM | 49 (5.1%) | 158 (13.2%) |
| 9:00 AM to 9:59 AM | 106 (11.1%) | 138 (11.5%) |
| 10:00 AM to 10:59 AM | 93 (9.8%) | 32 (2.7%) |
| 11:00 AM to 11:59 AM | 0 (0.0%) | 22 (1.8%) |
| 12:00 PM to 3:59 PM | 84 (8.8%) | 25 (2.1%) |
| 4:00 PM to 11:59 PM | 14 (1.5%) | 18 (1.5%) |
| Total | 953 (100.0%) | 1,197 (100.0%) |
Housing Occupancy in Penn Wynne
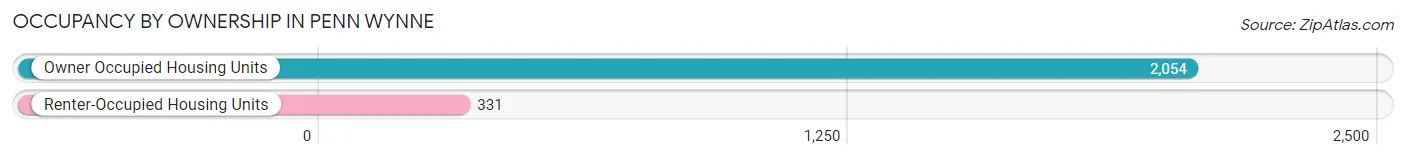
Occupancy by Ownership in Penn Wynne
Of the total 2,385 dwellings in Penn Wynne, owner-occupied units account for 2,054 (86.1%), while renter-occupied units make up 331 (13.9%).
| Occupancy | # Housing Units | % Housing Units |
| Owner Occupied Housing Units | 2,054 | 86.1% |
| Renter-Occupied Housing Units | 331 | 13.9% |
| Total Occupied Housing Units | 2,385 | 100.0% |
Occupancy by Household Size in Penn Wynne
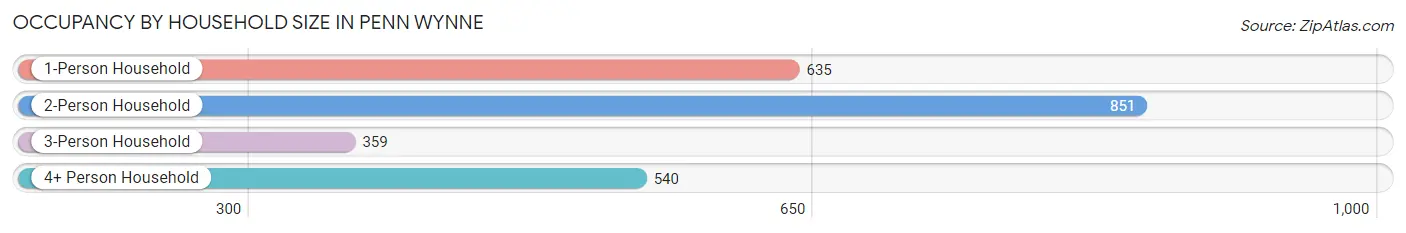
| Household Size | # Housing Units | % Housing Units |
| 1-Person Household | 635 | 26.6% |
| 2-Person Household | 851 | 35.7% |
| 3-Person Household | 359 | 15.0% |
| 4+ Person Household | 540 | 22.6% |
| Total Housing Units | 2,385 | 100.0% |
Occupancy by Ownership by Household Size in Penn Wynne
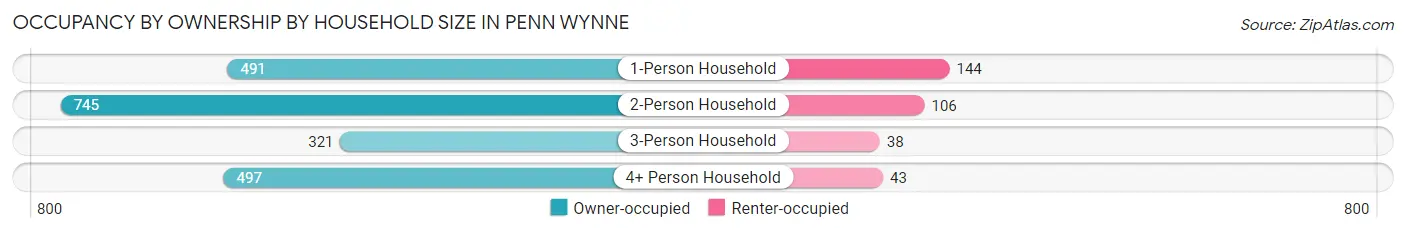
| Household Size | Owner-occupied | Renter-occupied |
| 1-Person Household | 491 (77.3%) | 144 (22.7%) |
| 2-Person Household | 745 (87.5%) | 106 (12.5%) |
| 3-Person Household | 321 (89.4%) | 38 (10.6%) |
| 4+ Person Household | 497 (92.0%) | 43 (8.0%) |
| Total Housing Units | 2,054 (86.1%) | 331 (13.9%) |
Occupancy by Educational Attainment in Penn Wynne
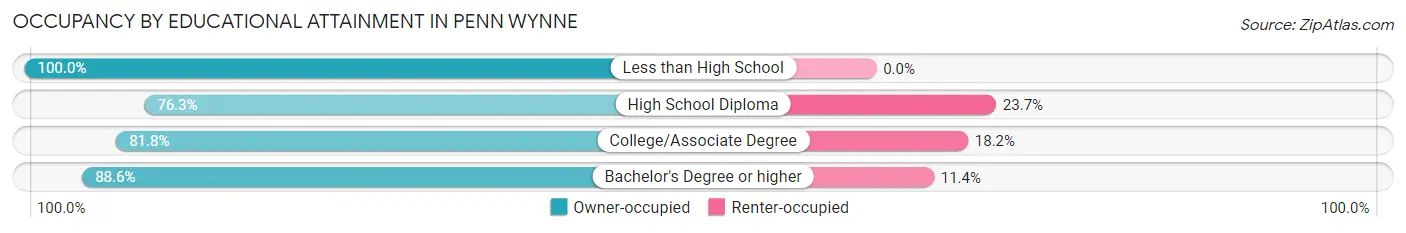
| Household Size | Owner-occupied | Renter-occupied |
| Less than High School | 8 (100.0%) | 0 (0.0%) |
| High School Diploma | 257 (76.3%) | 80 (23.7%) |
| College/Associate Degree | 216 (81.8%) | 48 (18.2%) |
| Bachelor's Degree or higher | 1,573 (88.6%) | 203 (11.4%) |
Occupancy by Age of Householder in Penn Wynne
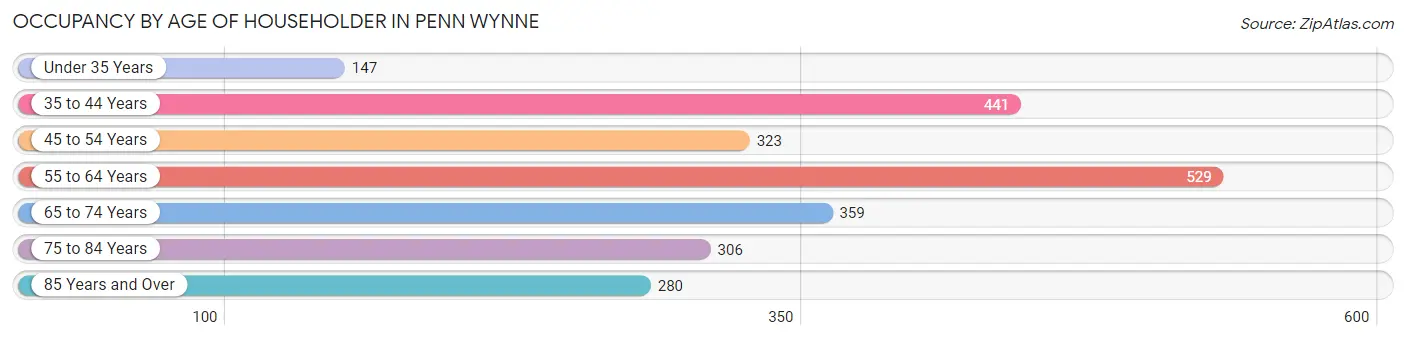
| Age Bracket | # Households | % Households |
| Under 35 Years | 147 | 6.2% |
| 35 to 44 Years | 441 | 18.5% |
| 45 to 54 Years | 323 | 13.5% |
| 55 to 64 Years | 529 | 22.2% |
| 65 to 74 Years | 359 | 15.0% |
| 75 to 84 Years | 306 | 12.8% |
| 85 Years and Over | 280 | 11.7% |
| Total | 2,385 | 100.0% |
Housing Finances in Penn Wynne
Median Income by Occupancy in Penn Wynne
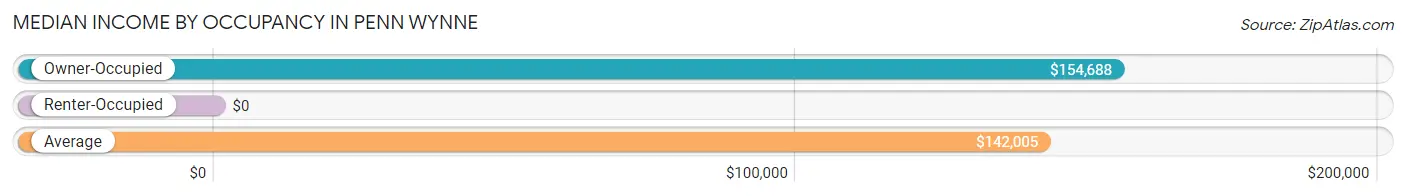
| Occupancy Type | # Households | Median Income |
| Owner-Occupied | 2,054 (86.1%) | $154,688 |
| Renter-Occupied | 331 (13.9%) | $0 |
| Average | 2,385 (100.0%) | $142,005 |
Occupancy by Householder Income Bracket in Penn Wynne
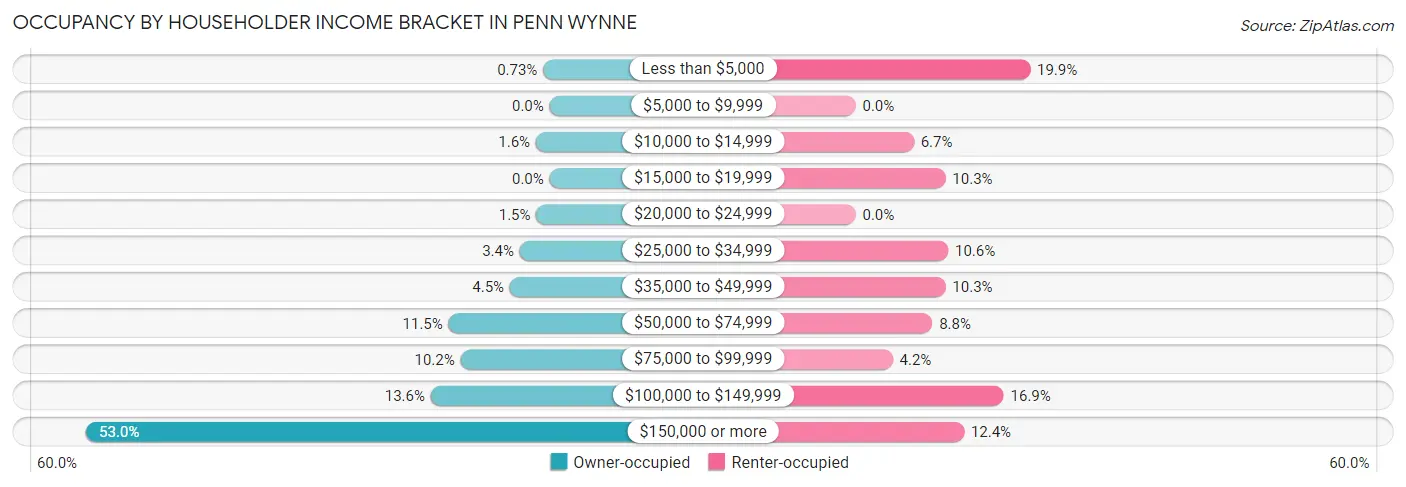
| Income Bracket | Owner-occupied | Renter-occupied |
| Less than $5,000 | 15 (0.7%) | 66 (19.9%) |
| $5,000 to $9,999 | 0 (0.0%) | 0 (0.0%) |
| $10,000 to $14,999 | 32 (1.6%) | 22 (6.7%) |
| $15,000 to $19,999 | 0 (0.0%) | 34 (10.3%) |
| $20,000 to $24,999 | 31 (1.5%) | 0 (0.0%) |
| $25,000 to $34,999 | 70 (3.4%) | 35 (10.6%) |
| $35,000 to $49,999 | 93 (4.5%) | 34 (10.3%) |
| $50,000 to $74,999 | 237 (11.5%) | 29 (8.8%) |
| $75,000 to $99,999 | 209 (10.2%) | 14 (4.2%) |
| $100,000 to $149,999 | 279 (13.6%) | 56 (16.9%) |
| $150,000 or more | 1,088 (53.0%) | 41 (12.4%) |
| Total | 2,054 (100.0%) | 331 (100.0%) |
Monthly Housing Cost Tiers in Penn Wynne
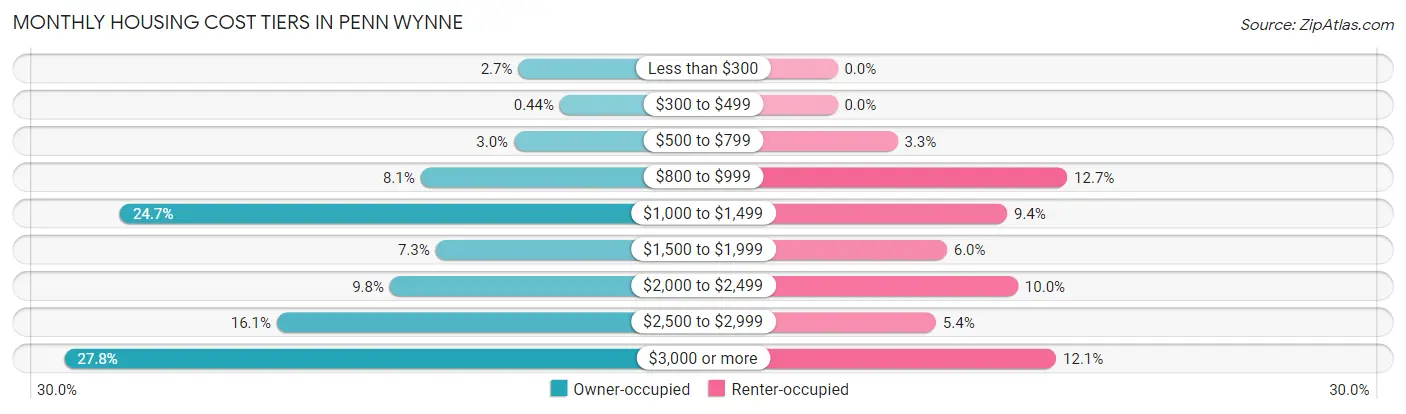
| Monthly Cost | Owner-occupied | Renter-occupied |
| Less than $300 | 56 (2.7%) | 0 (0.0%) |
| $300 to $499 | 9 (0.4%) | 0 (0.0%) |
| $500 to $799 | 61 (3.0%) | 11 (3.3%) |
| $800 to $999 | 167 (8.1%) | 42 (12.7%) |
| $1,000 to $1,499 | 508 (24.7%) | 31 (9.4%) |
| $1,500 to $1,999 | 150 (7.3%) | 20 (6.0%) |
| $2,000 to $2,499 | 202 (9.8%) | 33 (10.0%) |
| $2,500 to $2,999 | 330 (16.1%) | 18 (5.4%) |
| $3,000 or more | 571 (27.8%) | 40 (12.1%) |
| Total | 2,054 (100.0%) | 331 (100.0%) |
Physical Housing Characteristics in Penn Wynne
Housing Structures in Penn Wynne
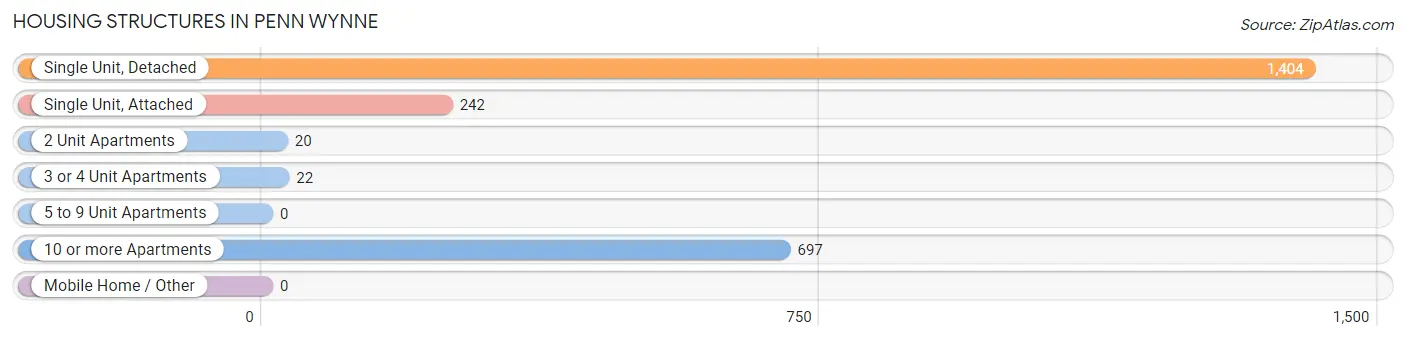
| Structure Type | # Housing Units | % Housing Units |
| Single Unit, Detached | 1,404 | 58.9% |
| Single Unit, Attached | 242 | 10.2% |
| 2 Unit Apartments | 20 | 0.8% |
| 3 or 4 Unit Apartments | 22 | 0.9% |
| 5 to 9 Unit Apartments | 0 | 0.0% |
| 10 or more Apartments | 697 | 29.2% |
| Mobile Home / Other | 0 | 0.0% |
| Total | 2,385 | 100.0% |
Housing Structures by Occupancy in Penn Wynne
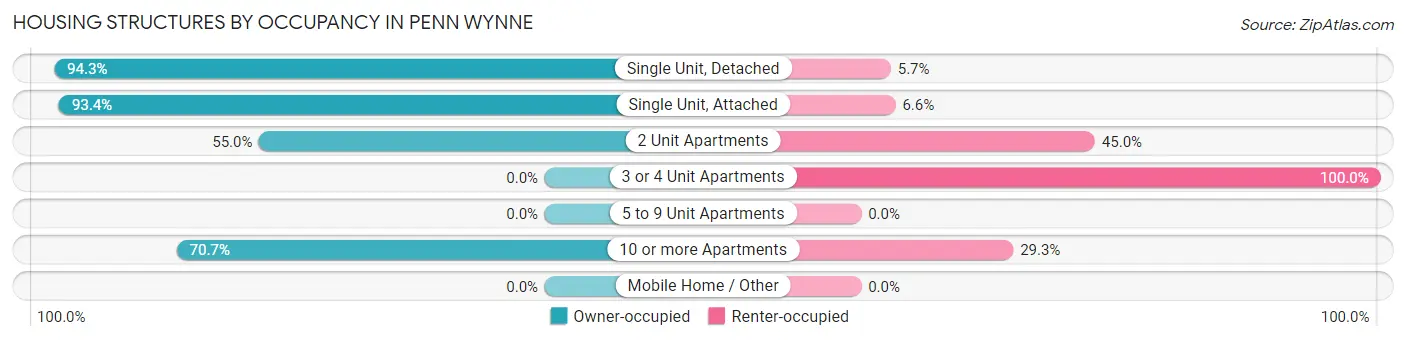
| Structure Type | Owner-occupied | Renter-occupied |
| Single Unit, Detached | 1,324 (94.3%) | 80 (5.7%) |
| Single Unit, Attached | 226 (93.4%) | 16 (6.6%) |
| 2 Unit Apartments | 11 (55.0%) | 9 (45.0%) |
| 3 or 4 Unit Apartments | 0 (0.0%) | 22 (100.0%) |
| 5 to 9 Unit Apartments | 0 (0.0%) | 0 (0.0%) |
| 10 or more Apartments | 493 (70.7%) | 204 (29.3%) |
| Mobile Home / Other | 0 (0.0%) | 0 (0.0%) |
| Total | 2,054 (86.1%) | 331 (13.9%) |
Housing Structures by Number of Rooms in Penn Wynne
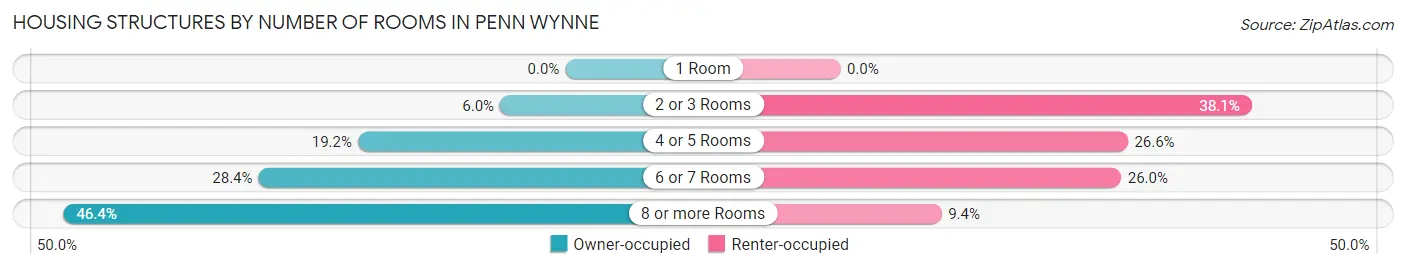
| Number of Rooms | Owner-occupied | Renter-occupied |
| 1 Room | 0 (0.0%) | 0 (0.0%) |
| 2 or 3 Rooms | 124 (6.0%) | 126 (38.1%) |
| 4 or 5 Rooms | 394 (19.2%) | 88 (26.6%) |
| 6 or 7 Rooms | 583 (28.4%) | 86 (26.0%) |
| 8 or more Rooms | 953 (46.4%) | 31 (9.4%) |
| Total | 2,054 (100.0%) | 331 (100.0%) |
Housing Structure by Heating Type in Penn Wynne
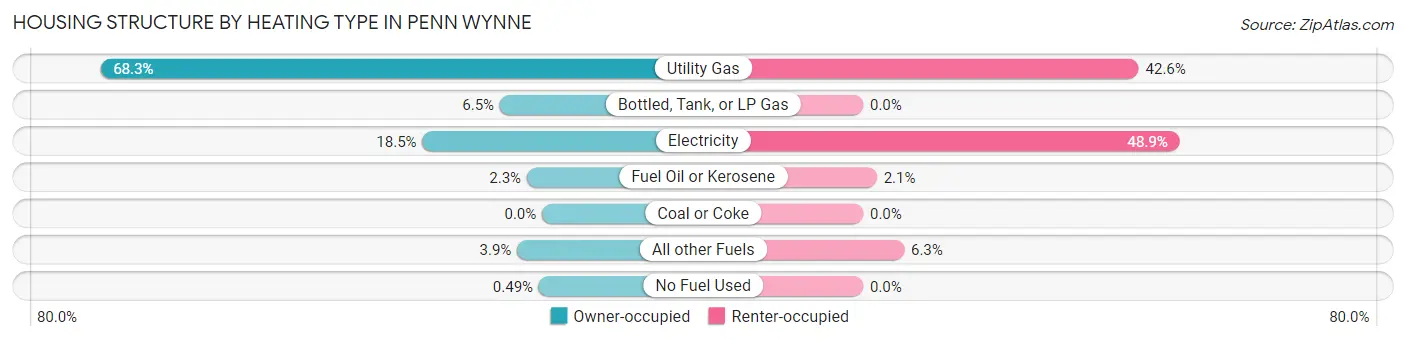
| Heating Type | Owner-occupied | Renter-occupied |
| Utility Gas | 1,403 (68.3%) | 141 (42.6%) |
| Bottled, Tank, or LP Gas | 134 (6.5%) | 0 (0.0%) |
| Electricity | 380 (18.5%) | 162 (48.9%) |
| Fuel Oil or Kerosene | 48 (2.3%) | 7 (2.1%) |
| Coal or Coke | 0 (0.0%) | 0 (0.0%) |
| All other Fuels | 79 (3.8%) | 21 (6.3%) |
| No Fuel Used | 10 (0.5%) | 0 (0.0%) |
| Total | 2,054 (100.0%) | 331 (100.0%) |
Household Vehicle Usage in Penn Wynne
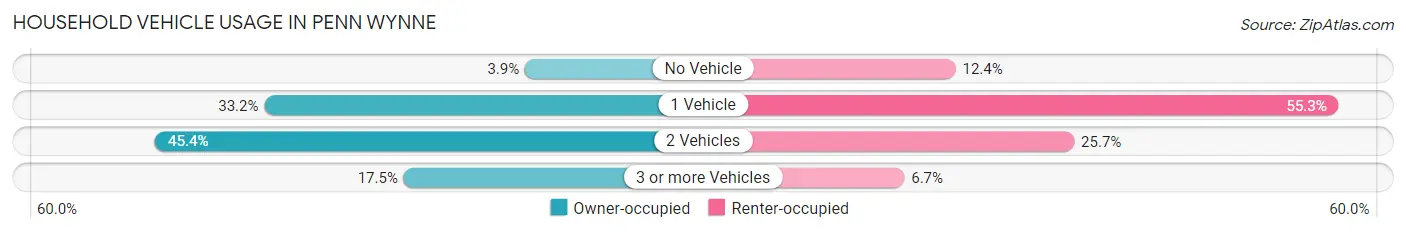
| Vehicles per Household | Owner-occupied | Renter-occupied |
| No Vehicle | 81 (3.9%) | 41 (12.4%) |
| 1 Vehicle | 681 (33.2%) | 183 (55.3%) |
| 2 Vehicles | 932 (45.4%) | 85 (25.7%) |
| 3 or more Vehicles | 360 (17.5%) | 22 (6.7%) |
| Total | 2,054 (100.0%) | 331 (100.0%) |
Real Estate & Mortgages in Penn Wynne
Real Estate and Mortgage Overview in Penn Wynne
| Characteristic | Without Mortgage | With Mortgage |
| Housing Units | 771 | 1,283 |
| Median Property Value | $277,800 | $578,000 |
| Median Household Income | $96,477 | $809 |
| Monthly Housing Costs | $1,127 | $571 |
| Real Estate Taxes | $3,430 | $0 |
Property Value by Mortgage Status in Penn Wynne
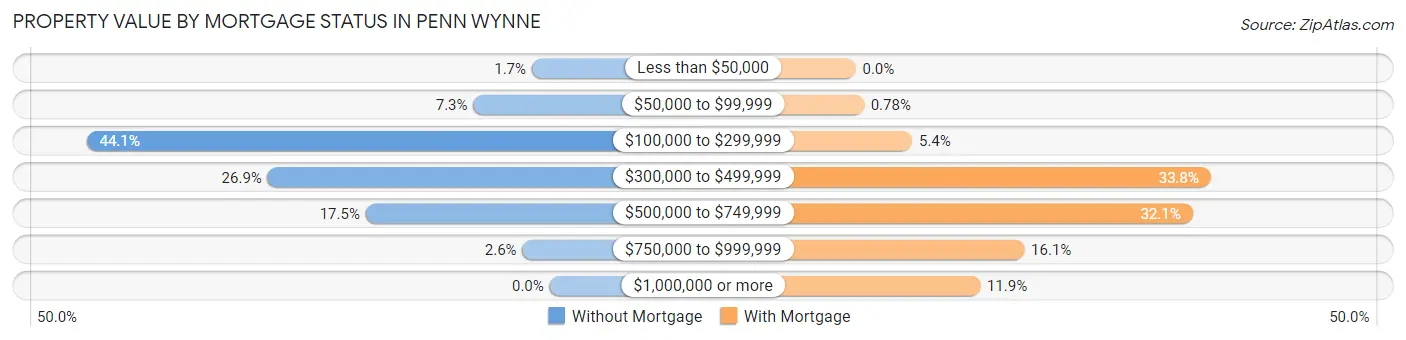
| Property Value | Without Mortgage | With Mortgage |
| Less than $50,000 | 13 (1.7%) | 0 (0.0%) |
| $50,000 to $99,999 | 56 (7.3%) | 10 (0.8%) |
| $100,000 to $299,999 | 340 (44.1%) | 69 (5.4%) |
| $300,000 to $499,999 | 207 (26.9%) | 434 (33.8%) |
| $500,000 to $749,999 | 135 (17.5%) | 412 (32.1%) |
| $750,000 to $999,999 | 20 (2.6%) | 206 (16.1%) |
| $1,000,000 or more | 0 (0.0%) | 152 (11.8%) |
| Total | 771 (100.0%) | 1,283 (100.0%) |
Household Income by Mortgage Status in Penn Wynne
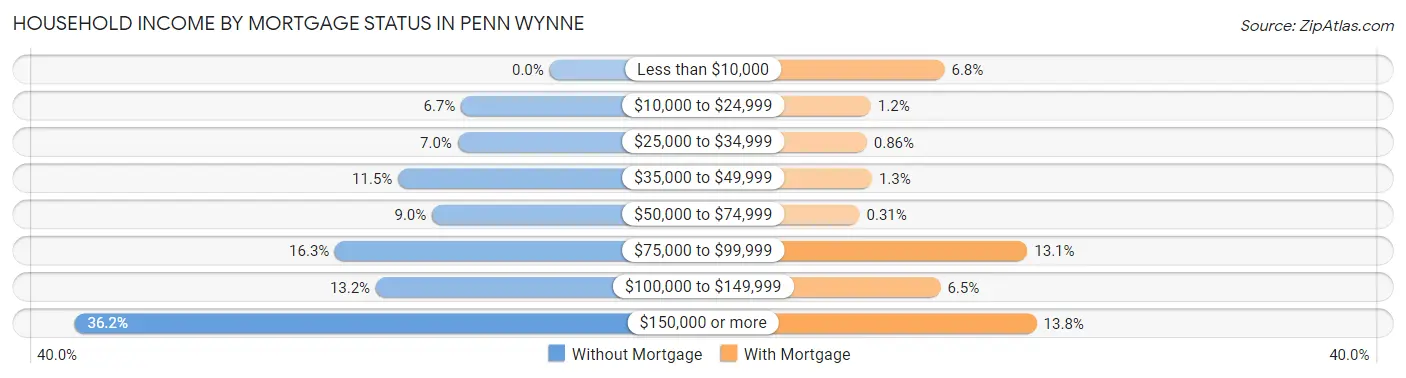
| Household Income | Without Mortgage | With Mortgage |
| Less than $10,000 | 0 (0.0%) | 87 (6.8%) |
| $10,000 to $24,999 | 52 (6.7%) | 15 (1.2%) |
| $25,000 to $34,999 | 54 (7.0%) | 11 (0.9%) |
| $35,000 to $49,999 | 89 (11.5%) | 16 (1.3%) |
| $50,000 to $74,999 | 69 (8.9%) | 4 (0.3%) |
| $75,000 to $99,999 | 126 (16.3%) | 168 (13.1%) |
| $100,000 to $149,999 | 102 (13.2%) | 83 (6.5%) |
| $150,000 or more | 279 (36.2%) | 177 (13.8%) |
| Total | 771 (100.0%) | 1,283 (100.0%) |
Property Value to Household Income Ratio in Penn Wynne
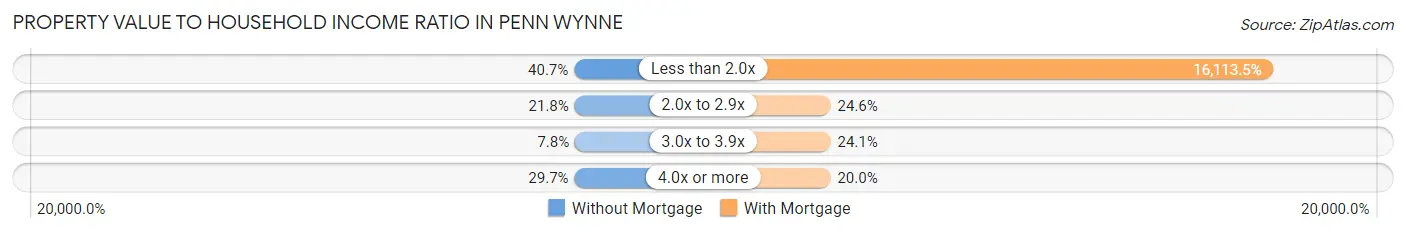
| Value-to-Income Ratio | Without Mortgage | With Mortgage |
| Less than 2.0x | 314 (40.7%) | 206,736 (16,113.5%) |
| 2.0x to 2.9x | 168 (21.8%) | 315 (24.5%) |
| 3.0x to 3.9x | 60 (7.8%) | 309 (24.1%) |
| 4.0x or more | 229 (29.7%) | 256 (20.0%) |
| Total | 771 (100.0%) | 1,283 (100.0%) |
Real Estate Taxes by Mortgage Status in Penn Wynne
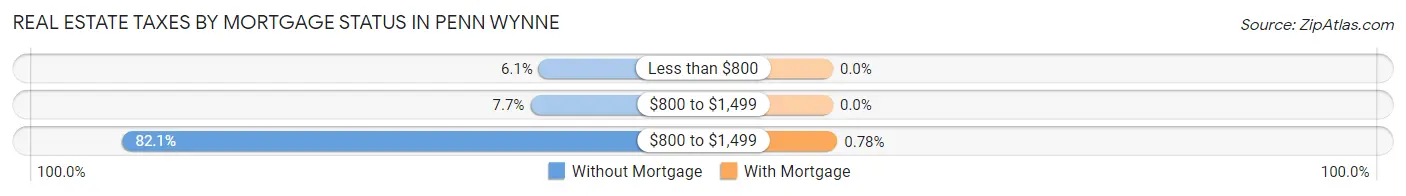
| Property Taxes | Without Mortgage | With Mortgage |
| Less than $800 | 47 (6.1%) | 0 (0.0%) |
| $800 to $1,499 | 59 (7.6%) | 0 (0.0%) |
| $800 to $1,499 | 633 (82.1%) | 10 (0.8%) |
| Total | 771 (100.0%) | 1,283 (100.0%) |
Health & Disability in Penn Wynne
Health Insurance Coverage by Age in Penn Wynne
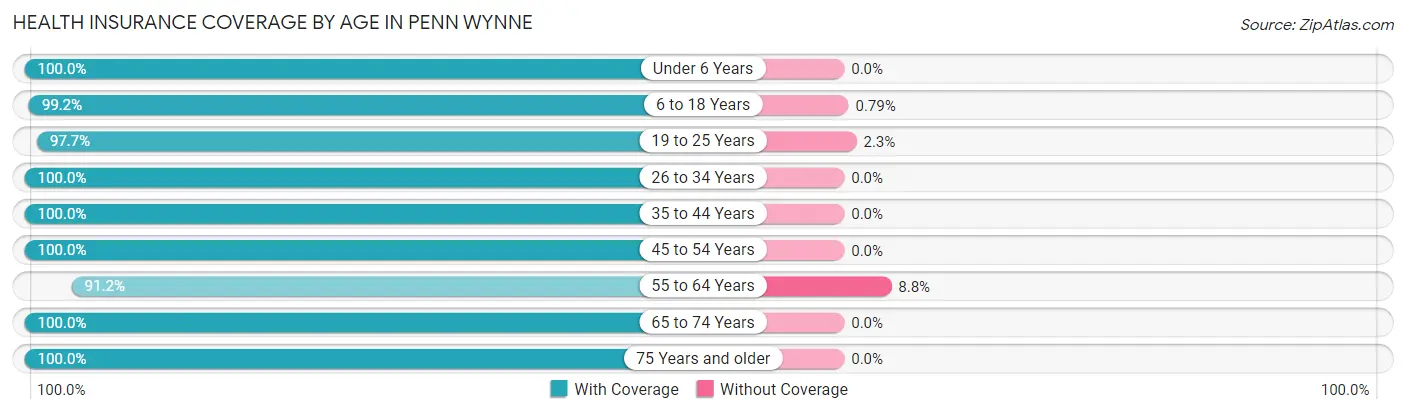
| Age Bracket | With Coverage | Without Coverage |
| Under 6 Years | 459 (100.0%) | 0 (0.0%) |
| 6 to 18 Years | 1,007 (99.2%) | 8 (0.8%) |
| 19 to 25 Years | 257 (97.7%) | 6 (2.3%) |
| 26 to 34 Years | 375 (100.0%) | 0 (0.0%) |
| 35 to 44 Years | 833 (100.0%) | 0 (0.0%) |
| 45 to 54 Years | 630 (100.0%) | 0 (0.0%) |
| 55 to 64 Years | 862 (91.2%) | 83 (8.8%) |
| 65 to 74 Years | 579 (100.0%) | 0 (0.0%) |
| 75 Years and older | 858 (100.0%) | 0 (0.0%) |
| Total | 5,860 (98.4%) | 97 (1.6%) |
Health Insurance Coverage by Citizenship Status in Penn Wynne

| Citizenship Status | With Coverage | Without Coverage |
| Native Born | 459 (100.0%) | 0 (0.0%) |
| Foreign Born, Citizen | 1,007 (99.2%) | 8 (0.8%) |
| Foreign Born, not a Citizen | 257 (97.7%) | 6 (2.3%) |
Health Insurance Coverage by Household Income in Penn Wynne
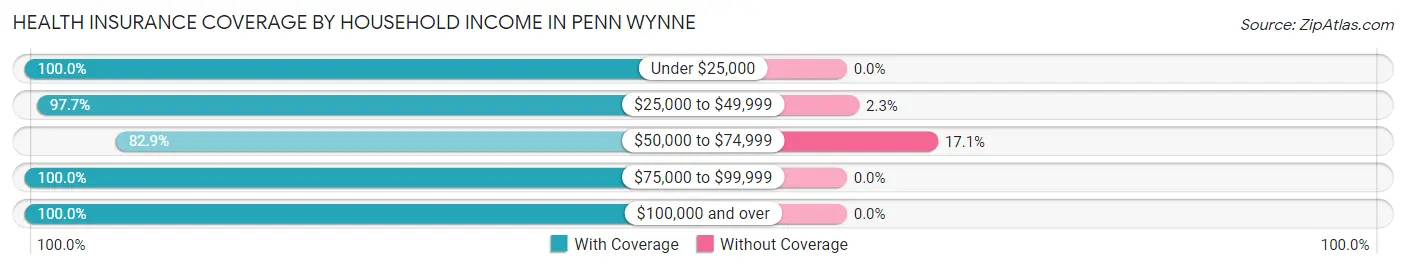
| Household Income | With Coverage | Without Coverage |
| Under $25,000 | 343 (100.0%) | 0 (0.0%) |
| $25,000 to $49,999 | 340 (97.7%) | 8 (2.3%) |
| $50,000 to $74,999 | 403 (82.9%) | 83 (17.1%) |
| $75,000 to $99,999 | 432 (100.0%) | 0 (0.0%) |
| $100,000 and over | 4,311 (100.0%) | 0 (0.0%) |
Public vs Private Health Insurance Coverage by Age in Penn Wynne
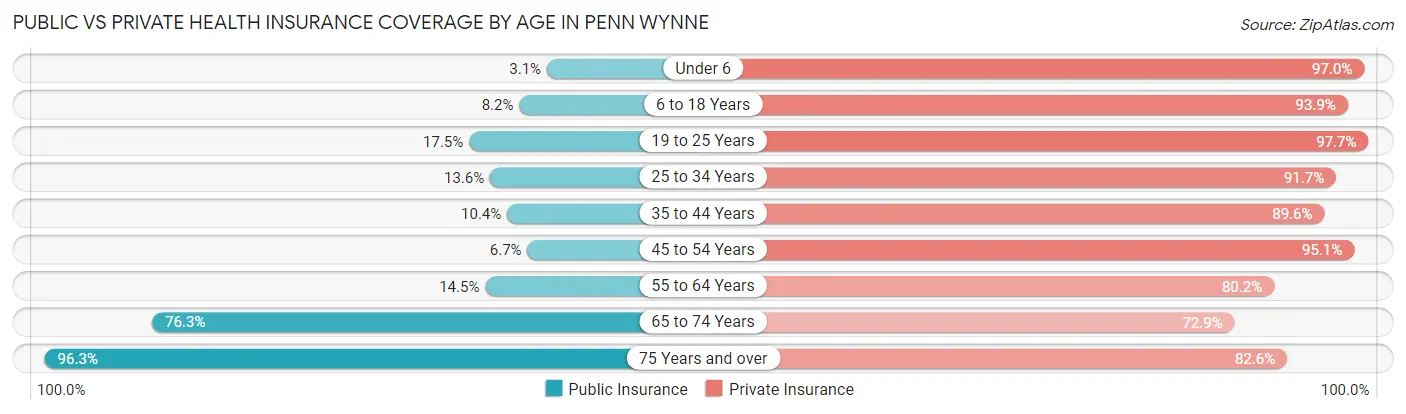
| Age Bracket | Public Insurance | Private Insurance |
| Under 6 | 14 (3.0%) | 445 (97.0%) |
| 6 to 18 Years | 83 (8.2%) | 953 (93.9%) |
| 19 to 25 Years | 46 (17.5%) | 257 (97.7%) |
| 25 to 34 Years | 51 (13.6%) | 344 (91.7%) |
| 35 to 44 Years | 87 (10.4%) | 746 (89.6%) |
| 45 to 54 Years | 42 (6.7%) | 599 (95.1%) |
| 55 to 64 Years | 137 (14.5%) | 758 (80.2%) |
| 65 to 74 Years | 442 (76.3%) | 422 (72.9%) |
| 75 Years and over | 826 (96.3%) | 709 (82.6%) |
| Total | 1,728 (29.0%) | 5,233 (87.8%) |
Disability Status by Sex by Age in Penn Wynne
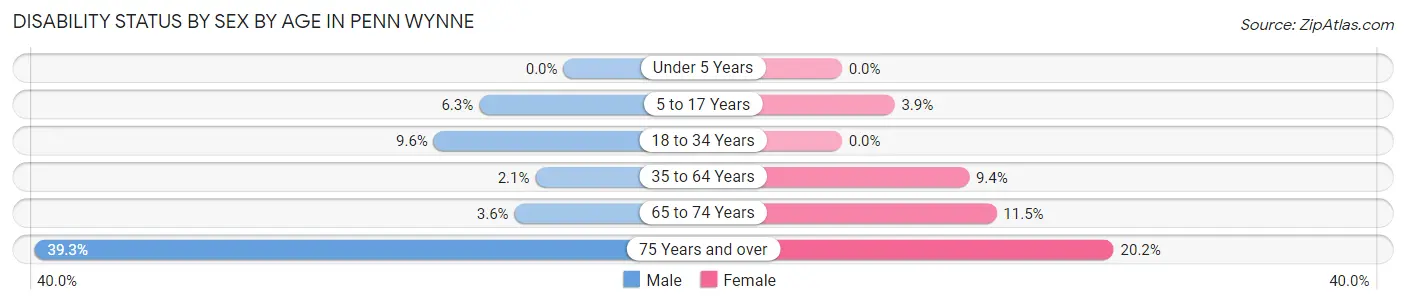
| Age Bracket | Male | Female |
| Under 5 Years | 0 (0.0%) | 0 (0.0%) |
| 5 to 17 Years | 35 (6.3%) | 20 (3.9%) |
| 18 to 34 Years | 31 (9.6%) | 0 (0.0%) |
| 35 to 64 Years | 23 (2.1%) | 123 (9.4%) |
| 65 to 74 Years | 9 (3.6%) | 38 (11.5%) |
| 75 Years and over | 117 (39.3%) | 113 (20.2%) |
Disability Class by Sex by Age in Penn Wynne
Disability Class: Hearing Difficulty
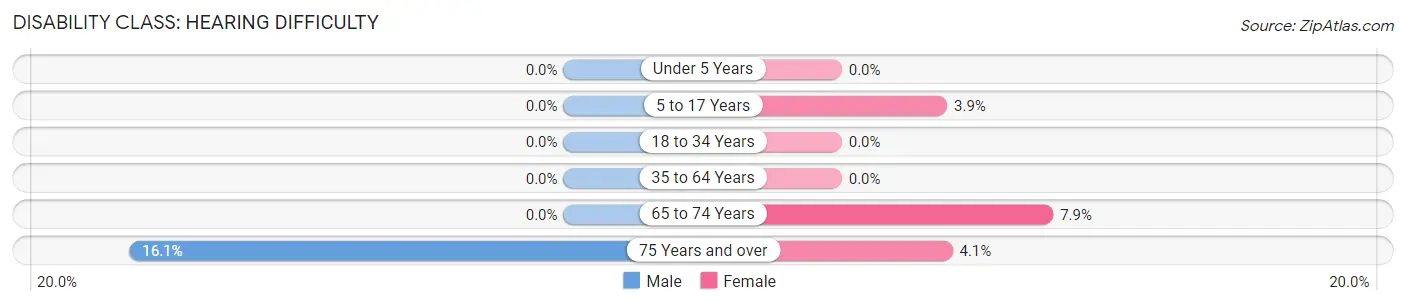
| Age Bracket | Male | Female |
| Under 5 Years | 0 (0.0%) | 0 (0.0%) |
| 5 to 17 Years | 0 (0.0%) | 20 (3.9%) |
| 18 to 34 Years | 0 (0.0%) | 0 (0.0%) |
| 35 to 64 Years | 0 (0.0%) | 0 (0.0%) |
| 65 to 74 Years | 0 (0.0%) | 26 (7.9%) |
| 75 Years and over | 48 (16.1%) | 23 (4.1%) |
Disability Class: Vision Difficulty
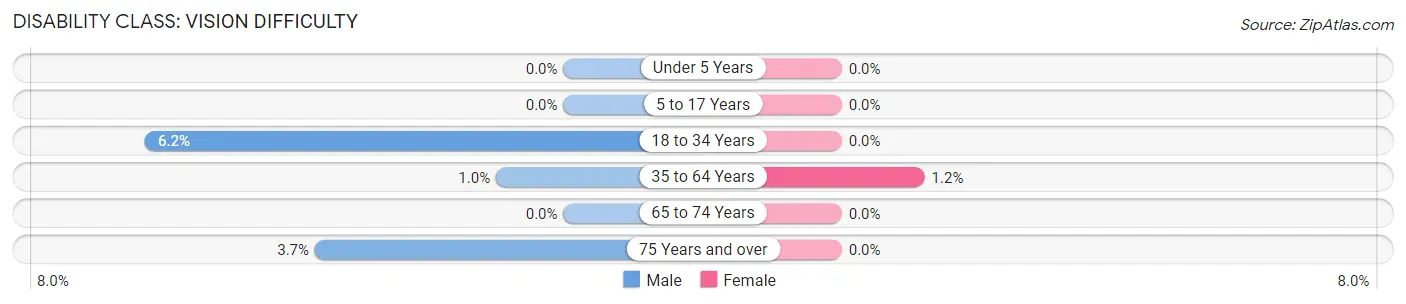
| Age Bracket | Male | Female |
| Under 5 Years | 0 (0.0%) | 0 (0.0%) |
| 5 to 17 Years | 0 (0.0%) | 0 (0.0%) |
| 18 to 34 Years | 20 (6.2%) | 0 (0.0%) |
| 35 to 64 Years | 11 (1.0%) | 16 (1.2%) |
| 65 to 74 Years | 0 (0.0%) | 0 (0.0%) |
| 75 Years and over | 11 (3.7%) | 0 (0.0%) |
Disability Class: Cognitive Difficulty
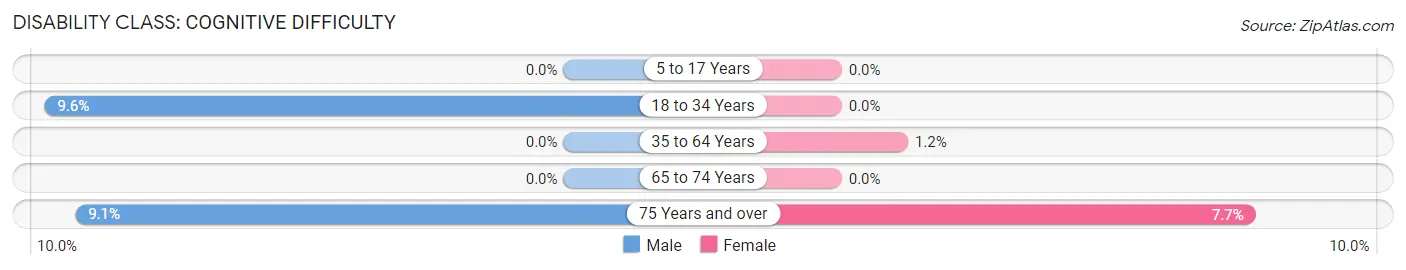
| Age Bracket | Male | Female |
| 5 to 17 Years | 0 (0.0%) | 0 (0.0%) |
| 18 to 34 Years | 31 (9.6%) | 0 (0.0%) |
| 35 to 64 Years | 0 (0.0%) | 16 (1.2%) |
| 65 to 74 Years | 0 (0.0%) | 0 (0.0%) |
| 75 Years and over | 27 (9.1%) | 43 (7.7%) |
Disability Class: Ambulatory Difficulty
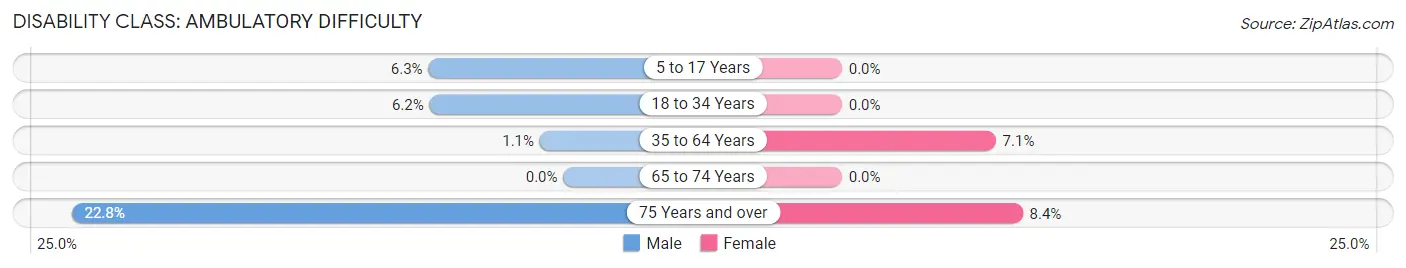
| Age Bracket | Male | Female |
| 5 to 17 Years | 35 (6.3%) | 0 (0.0%) |
| 18 to 34 Years | 20 (6.2%) | 0 (0.0%) |
| 35 to 64 Years | 12 (1.1%) | 93 (7.1%) |
| 65 to 74 Years | 0 (0.0%) | 0 (0.0%) |
| 75 Years and over | 68 (22.8%) | 47 (8.4%) |
Disability Class: Self-Care Difficulty
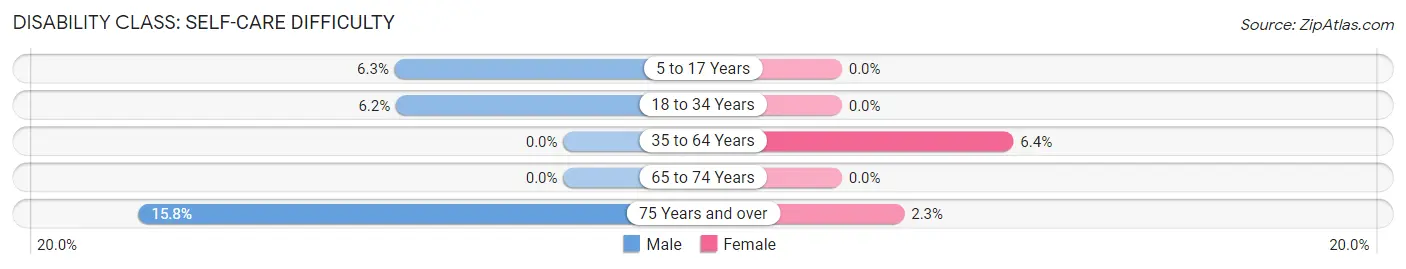
| Age Bracket | Male | Female |
| 5 to 17 Years | 35 (6.3%) | 0 (0.0%) |
| 18 to 34 Years | 20 (6.2%) | 0 (0.0%) |
| 35 to 64 Years | 0 (0.0%) | 83 (6.4%) |
| 65 to 74 Years | 0 (0.0%) | 0 (0.0%) |
| 75 Years and over | 47 (15.8%) | 13 (2.3%) |
Technology Access in Penn Wynne
Computing Device Access in Penn Wynne
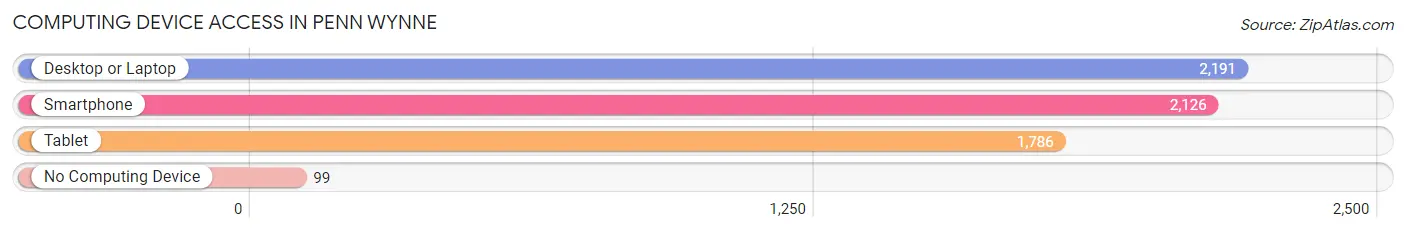
| Device Type | # Households | % Households |
| Desktop or Laptop | 2,191 | 91.9% |
| Smartphone | 2,126 | 89.1% |
| Tablet | 1,786 | 74.9% |
| No Computing Device | 99 | 4.2% |
| Total | 2,385 | 100.0% |
Internet Access in Penn Wynne
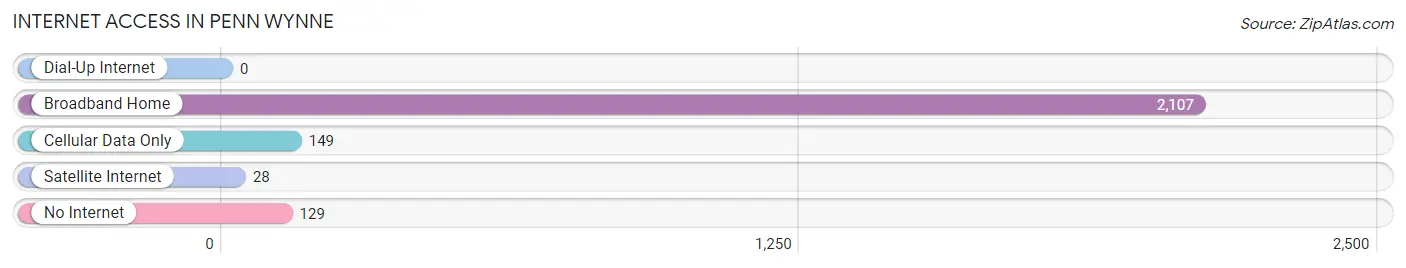
| Internet Type | # Households | % Households |
| Dial-Up Internet | 0 | 0.0% |
| Broadband Home | 2,107 | 88.3% |
| Cellular Data Only | 149 | 6.2% |
| Satellite Internet | 28 | 1.2% |
| No Internet | 129 | 5.4% |
| Total | 2,385 | 100.0% |
Penn Wynne Summary
PENNSYLVANIA WYNNE HISTORY
Penn Wynne is a small, unincorporated community located in Lower Merion Township, Montgomery County, Pennsylvania. It is situated along the border of Philadelphia and Montgomery County, and is part of the Philadelphia metropolitan area. Penn Wynne was originally part of the Welsh Tract, a large tract of land purchased by Welsh Quakers in 1684. The Welsh Tract was divided into several smaller tracts, and Penn Wynne was part of the tract known as “Wynnefield”. The name “Penn Wynne” is derived from the Welsh words “pen” and “wynne”, which mean “head of the field”.
The first settlers of Penn Wynne were Welsh Quakers who arrived in the area in the late 17th century. The Quakers built a meeting house in 1702, which is still standing today. The meeting house was used for religious services, as well as for political and social gatherings. The Quakers also established a school in the area, which was the first school in Lower Merion Township.
In the late 19th century, Penn Wynne began to develop as a residential community. The area was served by the Pennsylvania Railroad, which provided easy access to Philadelphia. The railroad also allowed for the development of a small commercial district along Lancaster Avenue. The commercial district included a post office, a grocery store, a drug store, and a few other businesses.
In the early 20th century, Penn Wynne experienced a period of rapid growth. The population increased from 1,000 in 1900 to over 5,000 by the 1950s. During this time, the area was served by several trolley lines, which connected Penn Wynne to Philadelphia and other nearby communities.
In the late 20th century, Penn Wynne began to decline. The trolley lines were replaced by buses, and the commercial district along Lancaster Avenue began to decline. The population of Penn Wynne decreased to around 4,000 by the year 2000.
GEOGRAPHY
Penn Wynne is located in Lower Merion Township, Montgomery County, Pennsylvania. It is situated along the border of Philadelphia and Montgomery County, and is part of the Philadelphia metropolitan area. Penn Wynne is bordered by the communities of Wynnewood, Overbrook, and Merion Station.
Penn Wynne is located in the southeastern part of Lower Merion Township. It is situated on a plateau that is approximately 200 feet above sea level. The area is characterized by rolling hills and valleys, and is dotted with small streams and creeks. The Penn Wynne area is also home to several parks and recreational areas, including Penn Wynne Park, Penn Wynne Woods, and Penn Wynne Nature Preserve.
ECONOMY
Penn Wynne is an unincorporated community, and does not have its own local government or economy. The area is primarily residential, and most of the residents are employed in nearby Philadelphia or Montgomery County. The commercial district along Lancaster Avenue has declined in recent years, and most of the businesses have closed.
DEMOGRAPHICS
As of the 2010 census, the population of Penn Wynne was 4,072. The racial makeup of the area was 79.3% White, 11.2% African American, 0.2% Native American, 4.2% Asian, and 5.1% from other races. The median household income was $76,945, and the median family income was $90,945. The per capita income was $37,945.
The population of Penn Wynne is primarily white and middle-class. The area is home to a diverse mix of people, including families, young professionals, and retirees. The area is also home to a large Jewish population, and there are several synagogues in the area.
Common Questions
What is Per Capita Income in Penn Wynne?
Per Capita income in Penn Wynne is $69,887.
What is the Median Family Income in Penn Wynne?
Median Family Income in Penn Wynne is $199,769.
What is the Median Household income in Penn Wynne?
Median Household Income in Penn Wynne is $142,005.
What is Income or Wage Gap in Penn Wynne?
Income or Wage Gap in Penn Wynne is 39.2%.
Women in Penn Wynne earn 60.8 cents for every dollar earned by a man.
What is Inequality or Gini Index in Penn Wynne?
Inequality or Gini Index in Penn Wynne is 0.45.
What is the Total Population of Penn Wynne?
Total Population of Penn Wynne is 6,127.
What is the Total Male Population of Penn Wynne?
Total Male Population of Penn Wynne is 2,791.
What is the Total Female Population of Penn Wynne?
Total Female Population of Penn Wynne is 3,336.
What is the Ratio of Males per 100 Females in Penn Wynne?
There are 83.66 Males per 100 Females in Penn Wynne.
What is the Ratio of Females per 100 Males in Penn Wynne?
There are 119.53 Females per 100 Males in Penn Wynne.
What is the Median Population Age in Penn Wynne?
Median Population Age in Penn Wynne is 47.1 Years.
What is the Average Family Size in Penn Wynne
Average Family Size in Penn Wynne is 3.1 People.
What is the Average Household Size in Penn Wynne
Average Household Size in Penn Wynne is 2.5 People.
How Large is the Labor Force in Penn Wynne?
There are 2,961 People in the Labor Forcein in Penn Wynne.
What is the Percentage of People in the Labor Force in Penn Wynne?
61.7% of People are in the Labor Force in Penn Wynne.
What is the Unemployment Rate in Penn Wynne?
Unemployment Rate in Penn Wynne is 5.6%.