Port Royal borough, PA Map & Demographics
Port Royal borough Overview
$34,130
PER CAPITA INCOME
$85,893
AVG FAMILY INCOME
$60,625
AVG HOUSEHOLD INCOME
45.6%
WAGE / INCOME GAP [ % ]
54.4¢/ $1
WAGE / INCOME GAP [ $ ]
0.38
INEQUALITY / GINI INDEX
729
TOTAL POPULATION
328
MALE POPULATION
401
FEMALE POPULATION
81.80
MALES / 100 FEMALES
122.26
FEMALES / 100 MALES
44.3
MEDIAN AGE
3.0
AVG FAMILY SIZE
2.3
AVG HOUSEHOLD SIZE
427
LABOR FORCE [ PEOPLE ]
67.6%
PERCENT IN LABOR FORCE
1.4%
UNEMPLOYMENT RATE
Income in Port Royal borough
Income Overview in Port Royal borough
Per Capita Income in Port Royal borough is $34,130, while median incomes of families and households are $85,893 and $60,625 respectively.
| Characteristic | Number | Measure |
| Per Capita Income | 729 | $34,130 |
| Median Family Income | 173 | $85,893 |
| Mean Family Income | 173 | $94,209 |
| Median Household Income | 312 | $60,625 |
| Mean Household Income | 312 | $75,278 |
| Income Deficit | 173 | $0 |
| Wage / Income Gap (%) | 729 | 45.65% |
| Wage / Income Gap ($) | 729 | 54.35¢ per $1 |
| Gini / Inequality Index | 729 | 0.38 |
Earnings by Sex in Port Royal borough
Average Earnings in Port Royal borough are $41,094, $58,393 for men and $31,739 for women, a difference of 45.7%.
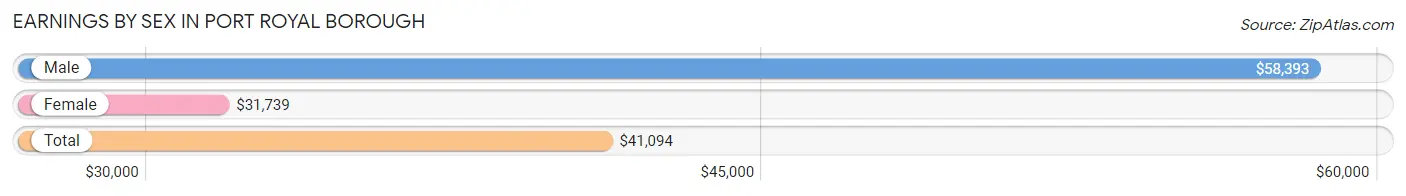
| Sex | Number | Average Earnings |
| Male | 201 (46.4%) | $58,393 |
| Female | 232 (53.6%) | $31,739 |
| Total | 433 (100.0%) | $41,094 |
Earnings by Sex by Income Bracket in Port Royal borough
The most common earnings brackets in Port Royal borough are $75,000 to $99,999 for men (44 | 21.9%) and $65,000 to $74,999 for women (30 | 12.9%).
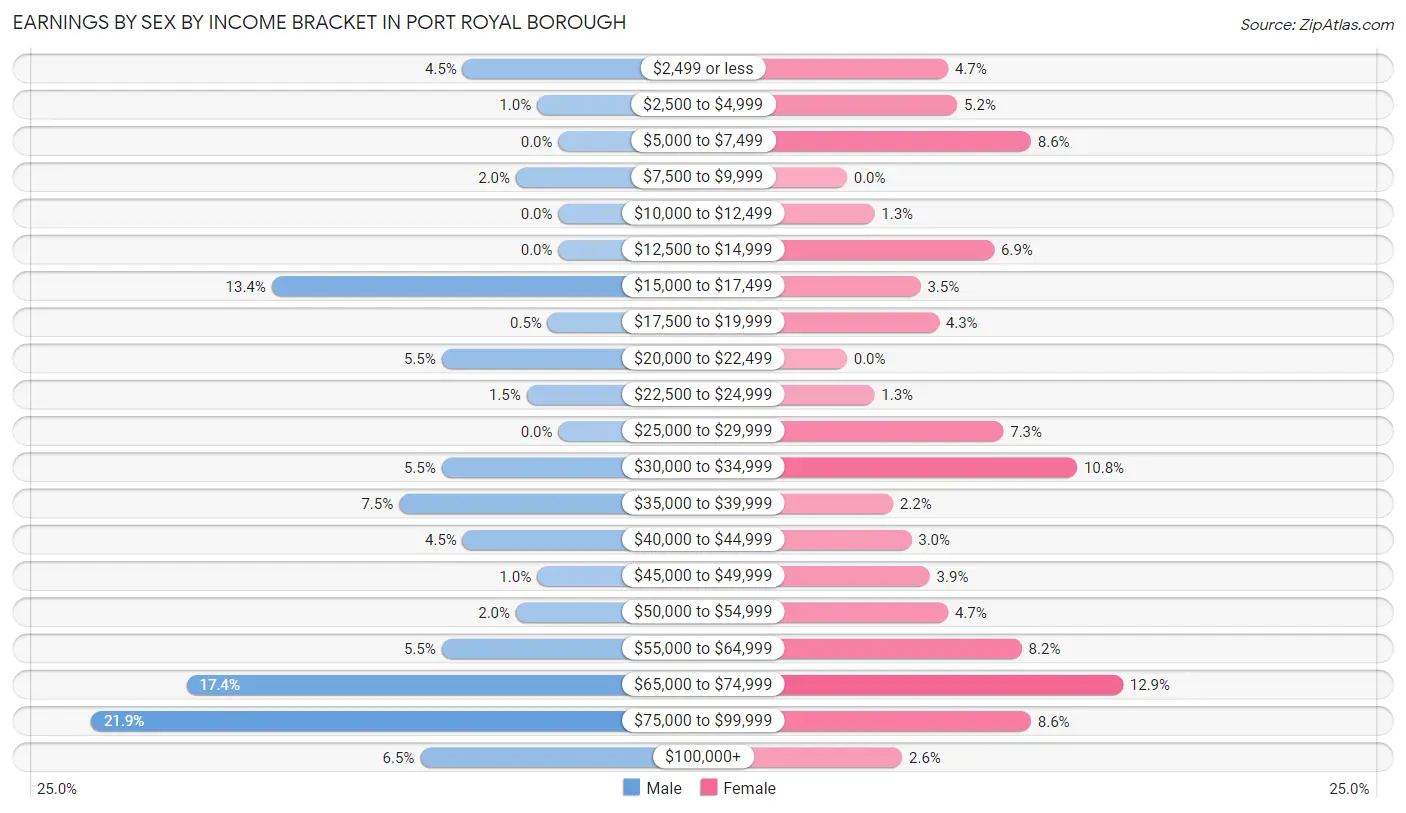
| Income | Male | Female |
| $2,499 or less | 9 (4.5%) | 11 (4.7%) |
| $2,500 to $4,999 | 2 (1.0%) | 12 (5.2%) |
| $5,000 to $7,499 | 0 (0.0%) | 20 (8.6%) |
| $7,500 to $9,999 | 4 (2.0%) | 0 (0.0%) |
| $10,000 to $12,499 | 0 (0.0%) | 3 (1.3%) |
| $12,500 to $14,999 | 0 (0.0%) | 16 (6.9%) |
| $15,000 to $17,499 | 27 (13.4%) | 8 (3.5%) |
| $17,500 to $19,999 | 1 (0.5%) | 10 (4.3%) |
| $20,000 to $22,499 | 11 (5.5%) | 0 (0.0%) |
| $22,500 to $24,999 | 3 (1.5%) | 3 (1.3%) |
| $25,000 to $29,999 | 0 (0.0%) | 17 (7.3%) |
| $30,000 to $34,999 | 11 (5.5%) | 25 (10.8%) |
| $35,000 to $39,999 | 15 (7.5%) | 5 (2.2%) |
| $40,000 to $44,999 | 9 (4.5%) | 7 (3.0%) |
| $45,000 to $49,999 | 2 (1.0%) | 9 (3.9%) |
| $50,000 to $54,999 | 4 (2.0%) | 11 (4.7%) |
| $55,000 to $64,999 | 11 (5.5%) | 19 (8.2%) |
| $65,000 to $74,999 | 35 (17.4%) | 30 (12.9%) |
| $75,000 to $99,999 | 44 (21.9%) | 20 (8.6%) |
| $100,000+ | 13 (6.5%) | 6 (2.6%) |
| Total | 201 (100.0%) | 232 (100.0%) |
Earnings by Sex by Educational Attainment in Port Royal borough
Average earnings in Port Royal borough are $66,413 for men and $41,250 for women, a difference of 37.9%. Men with an educational attainment of college or associate's degree enjoy the highest average annual earnings of $75,750, while those with high school diploma education earn the least with $59,375. Women with an educational attainment of graduate degree earn the most with the average annual earnings of $80,391, while those with college or associate's degree education have the smallest earnings of $30,536.
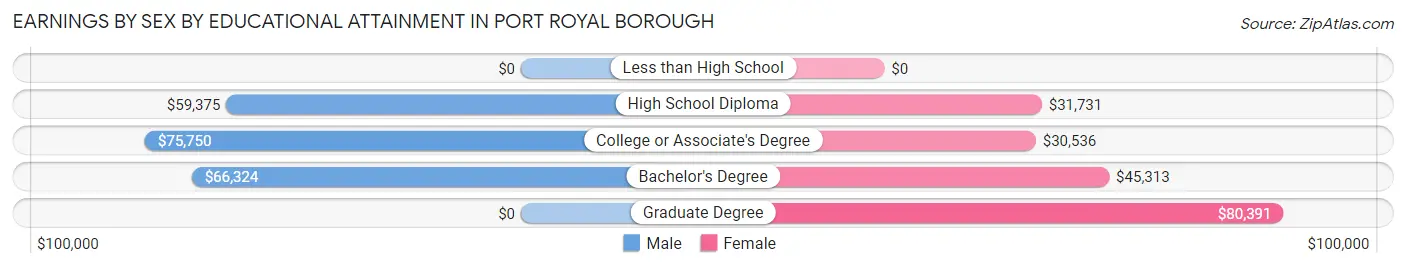
| Educational Attainment | Male Income | Female Income |
| Less than High School | - | - |
| High School Diploma | $59,375 | $31,731 |
| College or Associate's Degree | $75,750 | $30,536 |
| Bachelor's Degree | $66,324 | $45,313 |
| Graduate Degree | - | - |
| Total | $66,413 | $41,250 |
Family Income in Port Royal borough
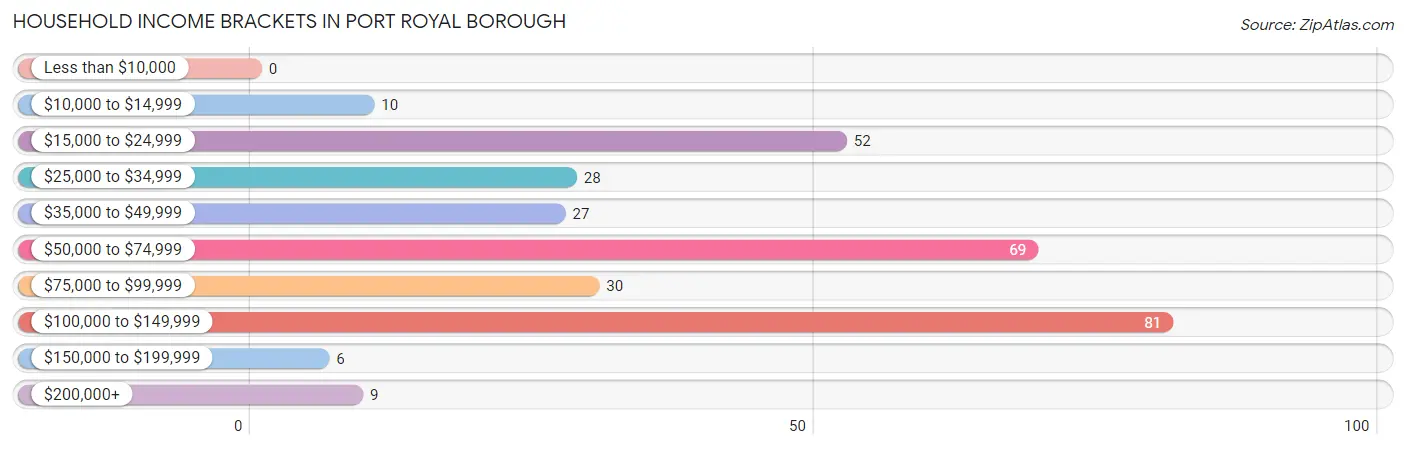
Family Income Brackets in Port Royal borough
According to the Port Royal borough family income data, there are 54 families falling into the $100,000 to $149,999 income range, which is the most common income bracket and makes up 31.2% of all families.
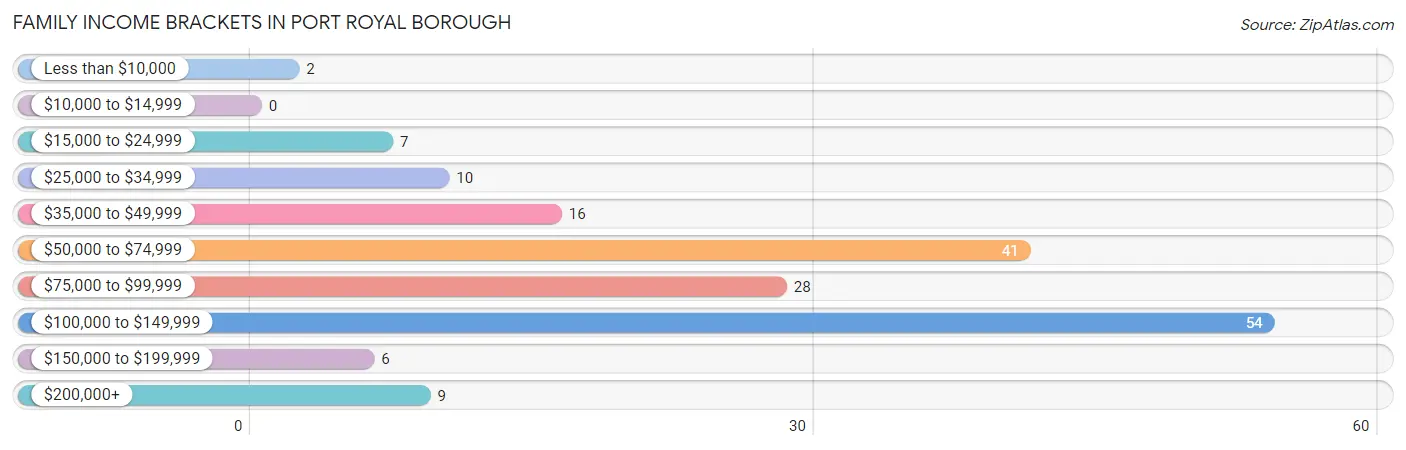
| Income Bracket | # Families | % Families |
| Less than $10,000 | 2 | 1.2% |
| $10,000 to $14,999 | 0 | 0.0% |
| $15,000 to $24,999 | 7 | 4.0% |
| $25,000 to $34,999 | 10 | 5.8% |
| $35,000 to $49,999 | 16 | 9.2% |
| $50,000 to $74,999 | 41 | 23.7% |
| $75,000 to $99,999 | 28 | 16.2% |
| $100,000 to $149,999 | 54 | 31.2% |
| $150,000 to $199,999 | 6 | 3.5% |
| $200,000+ | 9 | 5.2% |
Family Income by Famaliy Size in Port Royal borough
4-person families (31 | 17.9%) account for the highest median family income in Port Royal borough with $146,172 per family, while 4-person families (31 | 17.9%) have the highest median income of $36,543 per family member.
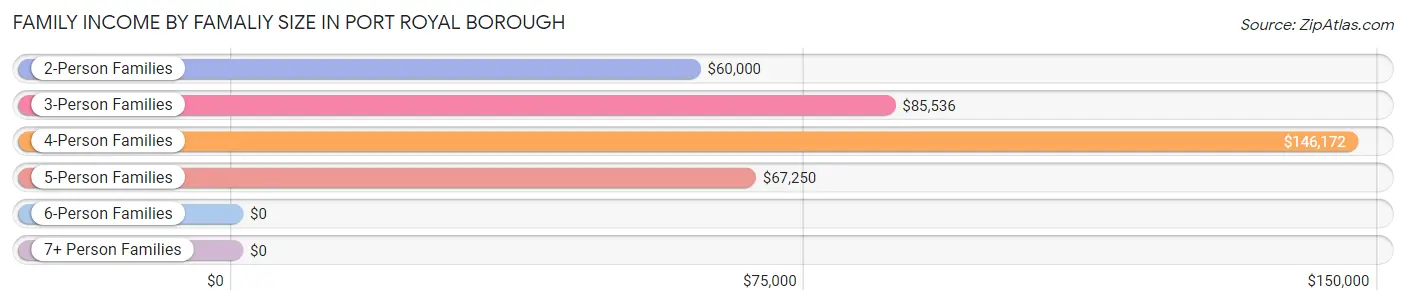
| Income Bracket | # Families | Median Income |
| 2-Person Families | 86 (49.7%) | $60,000 |
| 3-Person Families | 35 (20.2%) | $85,536 |
| 4-Person Families | 31 (17.9%) | $146,172 |
| 5-Person Families | 11 (6.4%) | $67,250 |
| 6-Person Families | 9 (5.2%) | $0 |
| 7+ Person Families | 1 (0.6%) | $0 |
| Total | 173 (100.0%) | $85,893 |
Family Income by Number of Earners in Port Royal borough
The median family income in Port Royal borough is $85,893, with families comprising 2 earners (89) having the highest median family income of $108,125, while families with no earners (29) have the lowest median family income of $34,375, accounting for 51.4% and 16.8% of families, respectively.
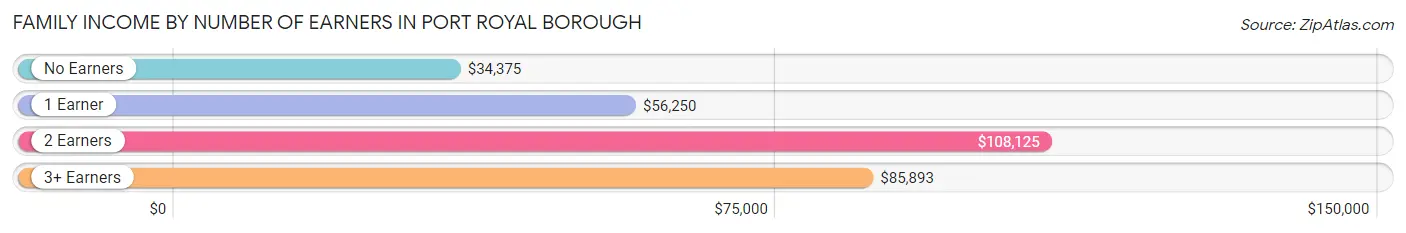
| Number of Earners | # Families | Median Income |
| No Earners | 29 (16.8%) | $34,375 |
| 1 Earner | 30 (17.3%) | $56,250 |
| 2 Earners | 89 (51.4%) | $108,125 |
| 3+ Earners | 25 (14.4%) | $85,893 |
| Total | 173 (100.0%) | $85,893 |
Household Income in Port Royal borough
Household Income Brackets in Port Royal borough
With 81 households falling in the category, the $100,000 to $149,999 income range is the most frequent in Port Royal borough, accounting for 26.0% of all households.
| Income Bracket | # Households | % Households |
| Less than $10,000 | 0 | 0.0% |
| $10,000 to $14,999 | 10 | 3.2% |
| $15,000 to $24,999 | 52 | 16.7% |
| $25,000 to $34,999 | 28 | 9.0% |
| $35,000 to $49,999 | 27 | 8.7% |
| $50,000 to $74,999 | 69 | 22.1% |
| $75,000 to $99,999 | 30 | 9.6% |
| $100,000 to $149,999 | 81 | 26.0% |
| $150,000 to $199,999 | 6 | 1.9% |
| $200,000+ | 9 | 2.9% |
Household Income by Householder Age in Port Royal borough
The median household income in Port Royal borough is $60,625, with the highest median household income of $103,550 found in the 15 to 24 years age bracket for the primary householder. A total of 29 households (9.3%) fall into this category. Meanwhile, the 65+ years age bracket for the primary householder has the lowest median household income of $32,917, with 111 households (35.6%) in this group.
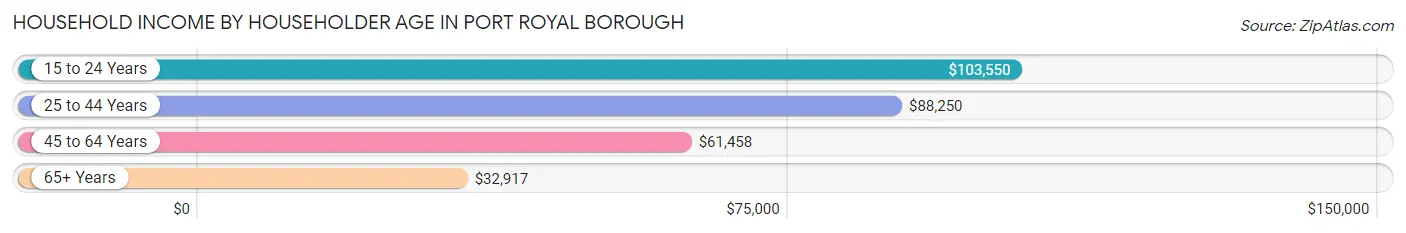
| Income Bracket | # Households | Median Income |
| 15 to 24 Years | 29 (9.3%) | $103,550 |
| 25 to 44 Years | 67 (21.5%) | $88,250 |
| 45 to 64 Years | 105 (33.7%) | $61,458 |
| 65+ Years | 111 (35.6%) | $32,917 |
| Total | 312 (100.0%) | $60,625 |
Poverty in Port Royal borough
Income Below Poverty by Sex and Age in Port Royal borough
With 5.5% poverty level for males and 7.8% for females among the residents of Port Royal borough, 6 to 11 year old males and 18 to 24 year old females are the most vulnerable to poverty, with 4 males (33.3%) and 12 females (22.6%) in their respective age groups living below the poverty level.
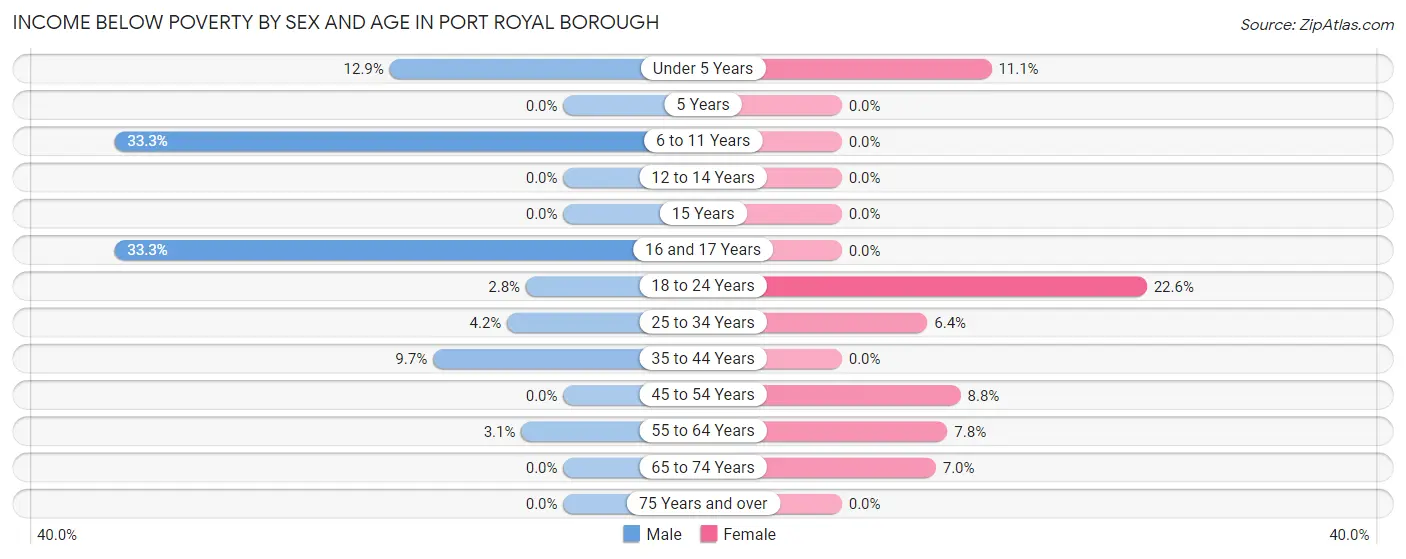
| Age Bracket | Male | Female |
| Under 5 Years | 4 (12.9%) | 2 (11.1%) |
| 5 Years | 0 (0.0%) | 0 (0.0%) |
| 6 to 11 Years | 4 (33.3%) | 0 (0.0%) |
| 12 to 14 Years | 0 (0.0%) | 0 (0.0%) |
| 15 Years | 0 (0.0%) | 0 (0.0%) |
| 16 and 17 Years | 3 (33.3%) | 0 (0.0%) |
| 18 to 24 Years | 1 (2.8%) | 12 (22.6%) |
| 25 to 34 Years | 2 (4.2%) | 4 (6.4%) |
| 35 to 44 Years | 3 (9.7%) | 0 (0.0%) |
| 45 to 54 Years | 0 (0.0%) | 6 (8.8%) |
| 55 to 64 Years | 1 (3.1%) | 4 (7.8%) |
| 65 to 74 Years | 0 (0.0%) | 3 (7.0%) |
| 75 Years and over | 0 (0.0%) | 0 (0.0%) |
| Total | 18 (5.5%) | 31 (7.8%) |
Income Above Poverty by Sex and Age in Port Royal borough
According to the poverty statistics in Port Royal borough, males aged 5 years and females aged 5 years are the age groups that are most secure financially, with 100.0% of males and 100.0% of females in these age groups living above the poverty line.
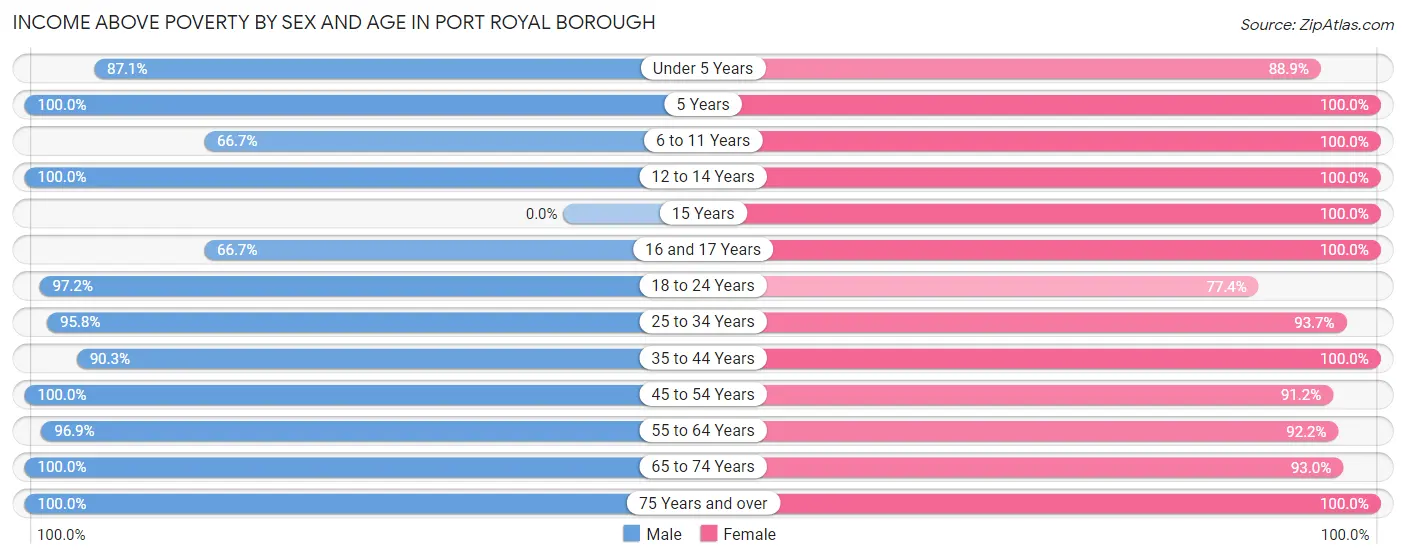
| Age Bracket | Male | Female |
| Under 5 Years | 27 (87.1%) | 16 (88.9%) |
| 5 Years | 3 (100.0%) | 1 (100.0%) |
| 6 to 11 Years | 8 (66.7%) | 8 (100.0%) |
| 12 to 14 Years | 4 (100.0%) | 10 (100.0%) |
| 15 Years | 0 (0.0%) | 7 (100.0%) |
| 16 and 17 Years | 6 (66.7%) | 9 (100.0%) |
| 18 to 24 Years | 35 (97.2%) | 41 (77.4%) |
| 25 to 34 Years | 46 (95.8%) | 59 (93.6%) |
| 35 to 44 Years | 28 (90.3%) | 20 (100.0%) |
| 45 to 54 Years | 45 (100.0%) | 62 (91.2%) |
| 55 to 64 Years | 31 (96.9%) | 47 (92.2%) |
| 65 to 74 Years | 45 (100.0%) | 40 (93.0%) |
| 75 Years and over | 31 (100.0%) | 48 (100.0%) |
| Total | 309 (94.5%) | 368 (92.2%) |
Income Below Poverty Among Married-Couple Families in Port Royal borough
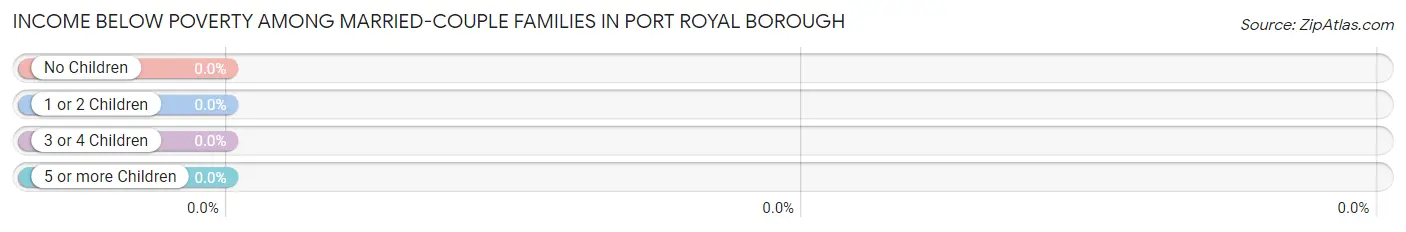
| Children | Above Poverty | Below Poverty |
| No Children | 95 (100.0%) | 0 (0.0%) |
| 1 or 2 Children | 39 (100.0%) | 0 (0.0%) |
| 3 or 4 Children | 8 (100.0%) | 0 (0.0%) |
| 5 or more Children | 0 (0.0%) | 0 (0.0%) |
| Total | 142 (100.0%) | 0 (0.0%) |
Income Below Poverty Among Single-Parent Households in Port Royal borough
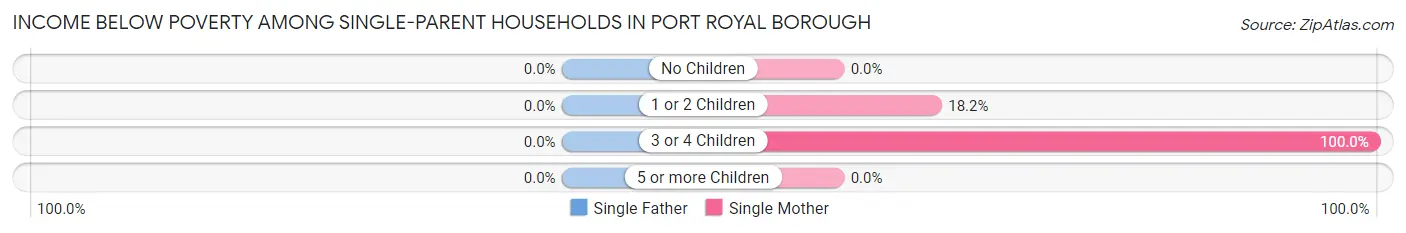
| Children | Single Father | Single Mother |
| No Children | 0 (0.0%) | 0 (0.0%) |
| 1 or 2 Children | 0 (0.0%) | 2 (18.2%) |
| 3 or 4 Children | 0 (0.0%) | 1 (100.0%) |
| 5 or more Children | 0 (0.0%) | 0 (0.0%) |
| Total | 0 (0.0%) | 3 (15.0%) |
Income Below Poverty Among Married-Couple vs Single-Parent Households in Port Royal borough
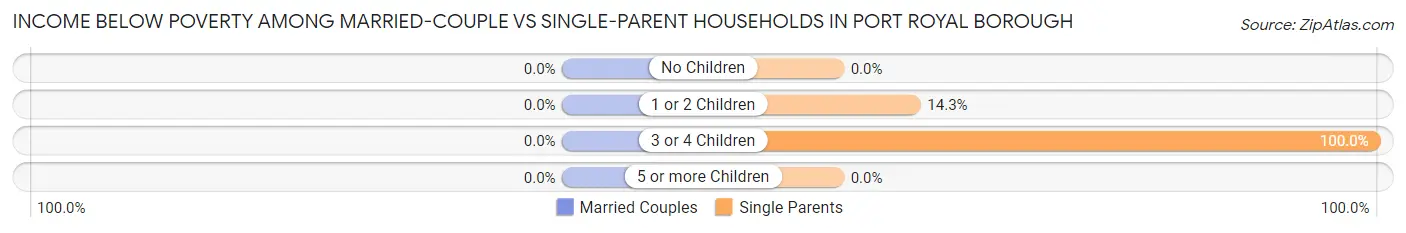
| Children | Married-Couple Families | Single-Parent Households |
| No Children | 0 (0.0%) | 0 (0.0%) |
| 1 or 2 Children | 0 (0.0%) | 2 (14.3%) |
| 3 or 4 Children | 0 (0.0%) | 1 (100.0%) |
| 5 or more Children | 0 (0.0%) | 0 (0.0%) |
| Total | 0 (0.0%) | 3 (9.7%) |
Race in Port Royal borough
The most populous races in Port Royal borough are White / Caucasian (676 | 92.7%), Hispanic or Latino (49 | 6.7%), and Two or more Races (39 | 5.3%).
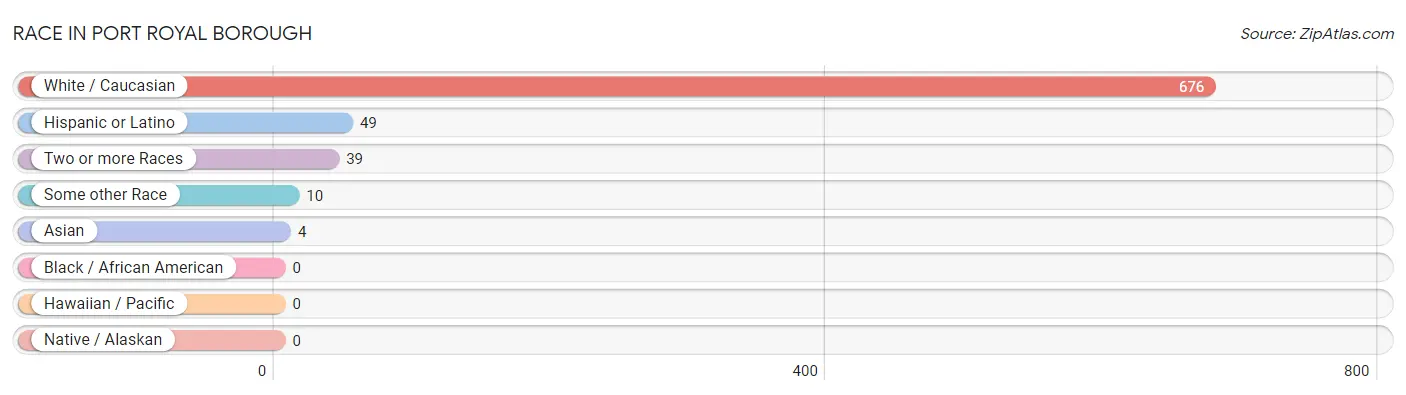
| Race | # Population | % Population |
| Asian | 4 | 0.5% |
| Black / African American | 0 | 0.0% |
| Hawaiian / Pacific | 0 | 0.0% |
| Hispanic or Latino | 49 | 6.7% |
| Native / Alaskan | 0 | 0.0% |
| White / Caucasian | 676 | 92.7% |
| Two or more Races | 39 | 5.3% |
| Some other Race | 10 | 1.4% |
| Total | 729 | 100.0% |
Ancestry in Port Royal borough
The most populous ancestries reported in Port Royal borough are German (307 | 42.1%), Irish (139 | 19.1%), American (75 | 10.3%), Italian (63 | 8.6%), and English (32 | 4.4%), together accounting for 84.5% of all Port Royal borough residents.
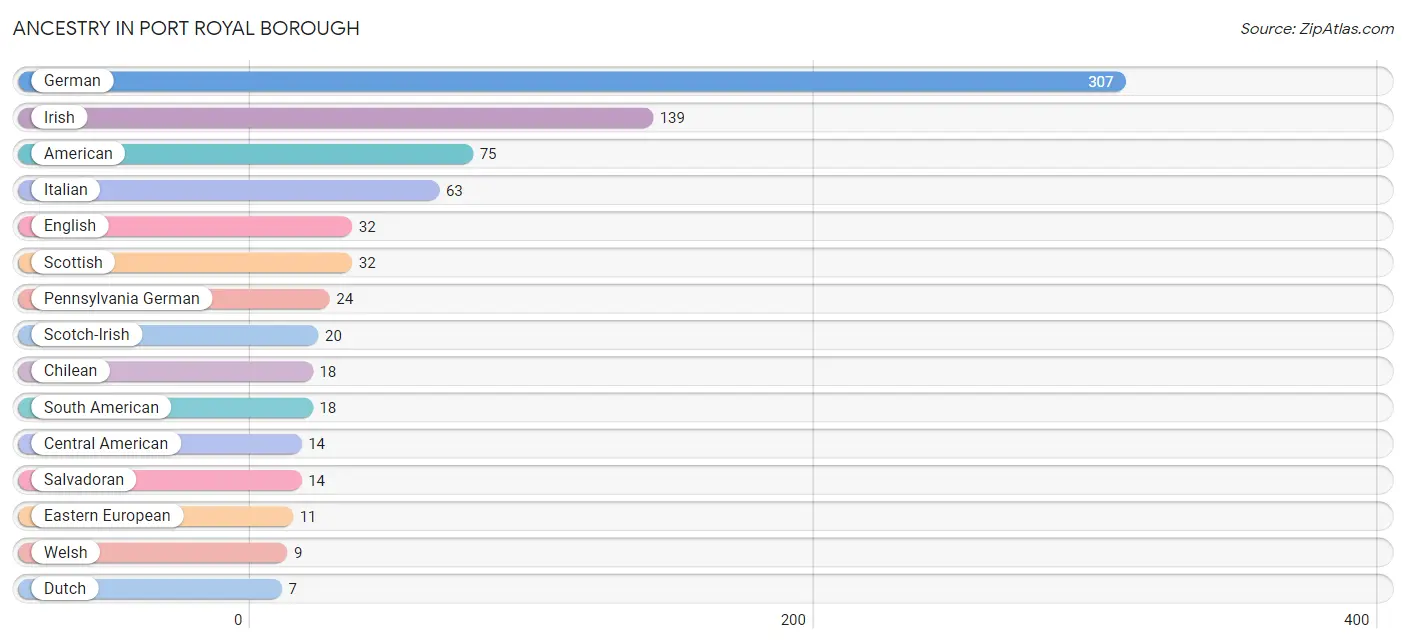
| Ancestry | # Population | % Population |
| American | 75 | 10.3% |
| Central American | 14 | 1.9% |
| Chilean | 18 | 2.5% |
| Dutch | 7 | 1.0% |
| Eastern European | 11 | 1.5% |
| English | 32 | 4.4% |
| French | 4 | 0.5% |
| French Canadian | 2 | 0.3% |
| German | 307 | 42.1% |
| Irish | 139 | 19.1% |
| Italian | 63 | 8.6% |
| Mexican | 7 | 1.0% |
| Pakistani | 4 | 0.5% |
| Pennsylvania German | 24 | 3.3% |
| Puerto Rican | 3 | 0.4% |
| Salvadoran | 14 | 1.9% |
| Scandinavian | 3 | 0.4% |
| Scotch-Irish | 20 | 2.7% |
| Scottish | 32 | 4.4% |
| Slovak | 1 | 0.1% |
| South American | 18 | 2.5% |
| Swiss | 2 | 0.3% |
| Welsh | 9 | 1.2% | View All 23 Rows |
Immigrants in Port Royal borough
The most numerous immigrant groups reported in Port Royal borough came from Latin America (39 | 5.3%), Central America (21 | 2.9%), Chile (18 | 2.5%), South America (18 | 2.5%), and El Salvador (14 | 1.9%), together accounting for 15.1% of all Port Royal borough residents.
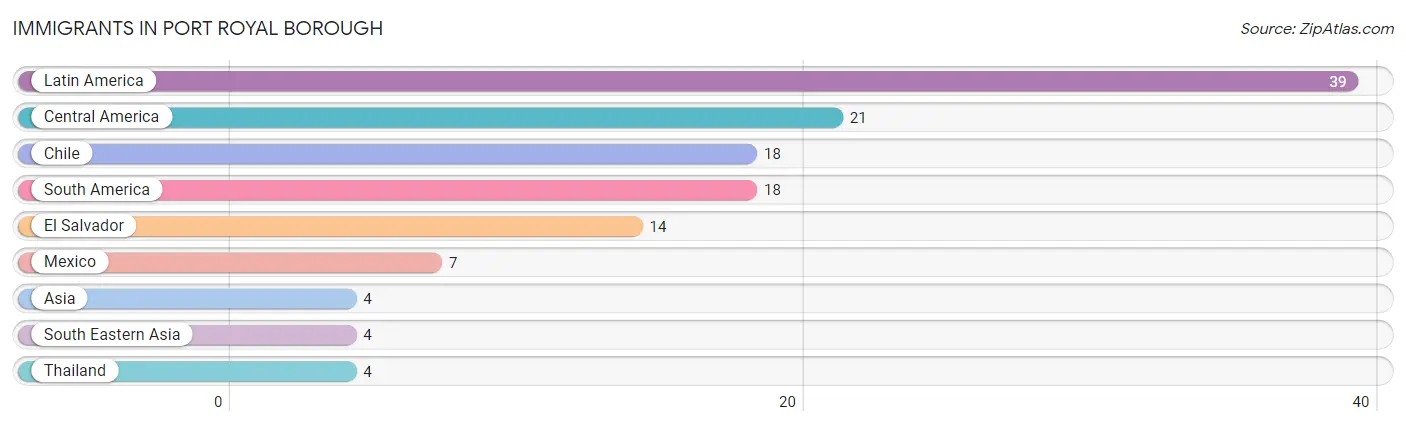
| Immigration Origin | # Population | % Population |
| Asia | 4 | 0.5% |
| Central America | 21 | 2.9% |
| Chile | 18 | 2.5% |
| El Salvador | 14 | 1.9% |
| Latin America | 39 | 5.3% |
| Mexico | 7 | 1.0% |
| South America | 18 | 2.5% |
| South Eastern Asia | 4 | 0.5% |
| Thailand | 4 | 0.5% | View All 9 Rows |
Sex and Age in Port Royal borough
Sex and Age in Port Royal borough
The most populous age groups in Port Royal borough are 20 to 24 Years (32 | 9.8%) for men and 30 to 34 Years (52 | 13.0%) for women.
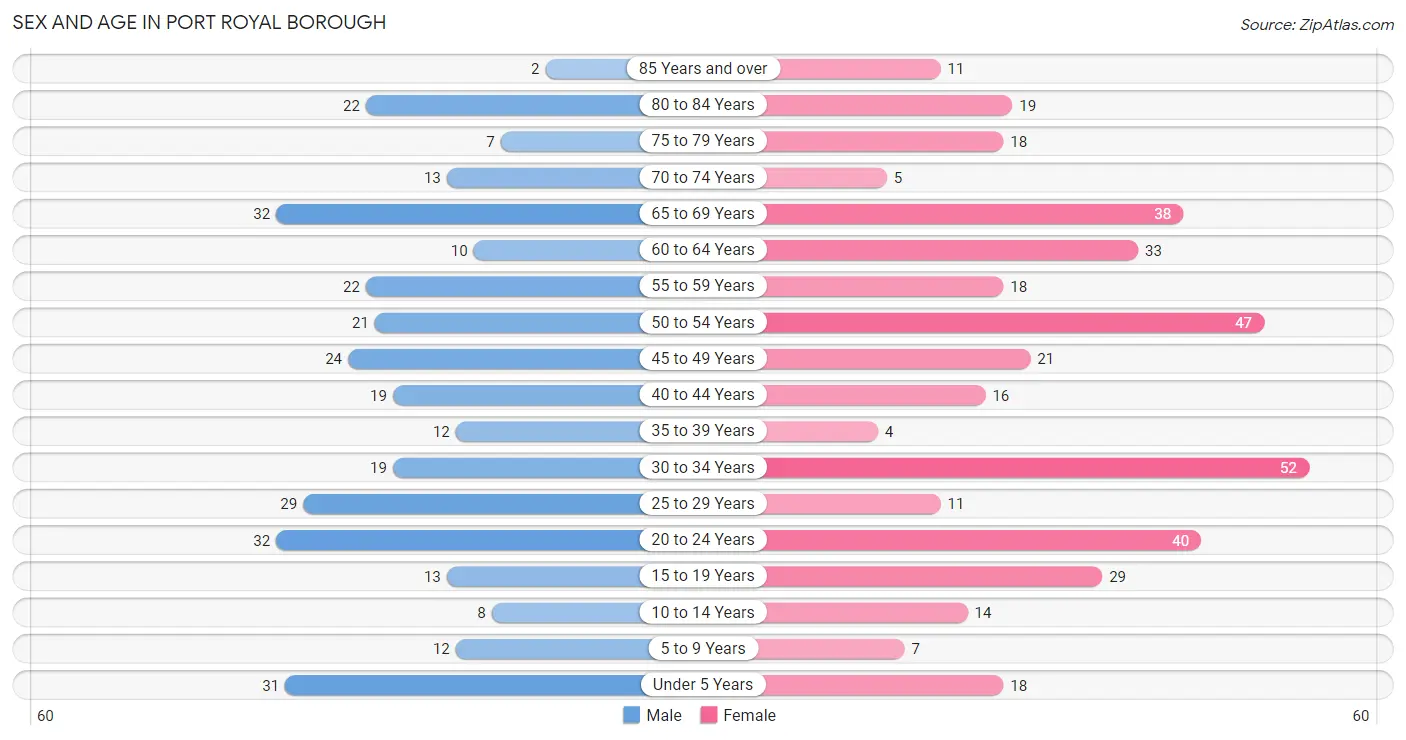
| Age Bracket | Male | Female |
| Under 5 Years | 31 (9.5%) | 18 (4.5%) |
| 5 to 9 Years | 12 (3.7%) | 7 (1.8%) |
| 10 to 14 Years | 8 (2.4%) | 14 (3.5%) |
| 15 to 19 Years | 13 (4.0%) | 29 (7.2%) |
| 20 to 24 Years | 32 (9.8%) | 40 (10.0%) |
| 25 to 29 Years | 29 (8.8%) | 11 (2.7%) |
| 30 to 34 Years | 19 (5.8%) | 52 (13.0%) |
| 35 to 39 Years | 12 (3.7%) | 4 (1.0%) |
| 40 to 44 Years | 19 (5.8%) | 16 (4.0%) |
| 45 to 49 Years | 24 (7.3%) | 21 (5.2%) |
| 50 to 54 Years | 21 (6.4%) | 47 (11.7%) |
| 55 to 59 Years | 22 (6.7%) | 18 (4.5%) |
| 60 to 64 Years | 10 (3.0%) | 33 (8.2%) |
| 65 to 69 Years | 32 (9.8%) | 38 (9.5%) |
| 70 to 74 Years | 13 (4.0%) | 5 (1.3%) |
| 75 to 79 Years | 7 (2.1%) | 18 (4.5%) |
| 80 to 84 Years | 22 (6.7%) | 19 (4.7%) |
| 85 Years and over | 2 (0.6%) | 11 (2.7%) |
| Total | 328 (100.0%) | 401 (100.0%) |
Families and Households in Port Royal borough
Median Family Size in Port Royal borough
The median family size in Port Royal borough is 3.05 persons per family, with single female/mother families (20 | 11.6%) accounting for the largest median family size of 4.25 persons per family. On the other hand, single male/father families (11 | 6.4%) represent the smallest median family size with 2.00 persons per family.
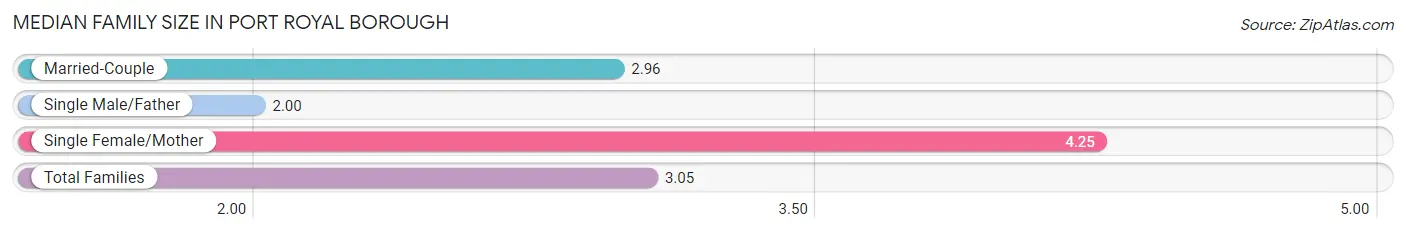
| Family Type | # Families | Family Size |
| Married-Couple | 142 (82.1%) | 2.96 |
| Single Male/Father | 11 (6.4%) | 2.00 |
| Single Female/Mother | 20 (11.6%) | 4.25 |
| Total Families | 173 (100.0%) | 3.05 |
Median Household Size in Port Royal borough
The median household size in Port Royal borough is 2.34 persons per household, with single female/mother households (20 | 6.4%) accounting for the largest median household size of 4.3 persons per household. non-family households (139 | 44.6%) represent the smallest median household size with 1.30 persons per household.
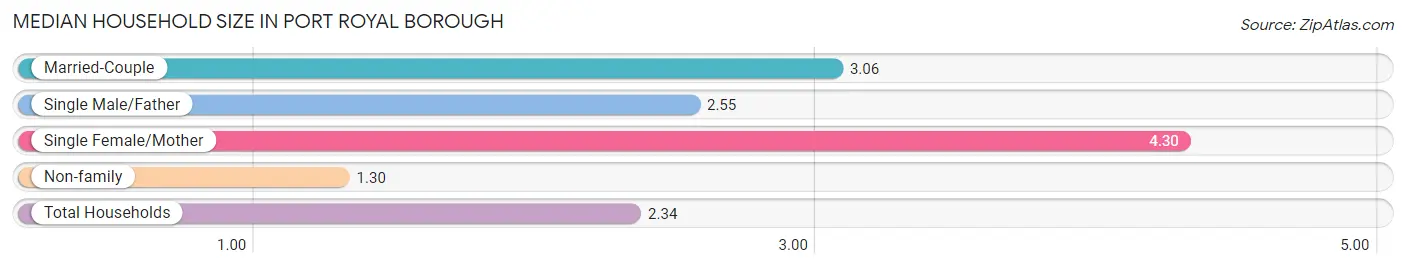
| Household Type | # Households | Household Size |
| Married-Couple | 142 (45.5%) | 3.06 |
| Single Male/Father | 11 (3.5%) | 2.55 |
| Single Female/Mother | 20 (6.4%) | 4.30 |
| Non-family | 139 (44.6%) | 1.30 |
| Total Households | 312 (100.0%) | 2.34 |
Household Size by Marriage Status in Port Royal borough
Out of a total of 312 households in Port Royal borough, 173 (55.4%) are family households, while 139 (44.6%) are nonfamily households. The most numerous type of family households are 2-person households, comprising 80, and the most common type of nonfamily households are 1-person households, comprising 106.
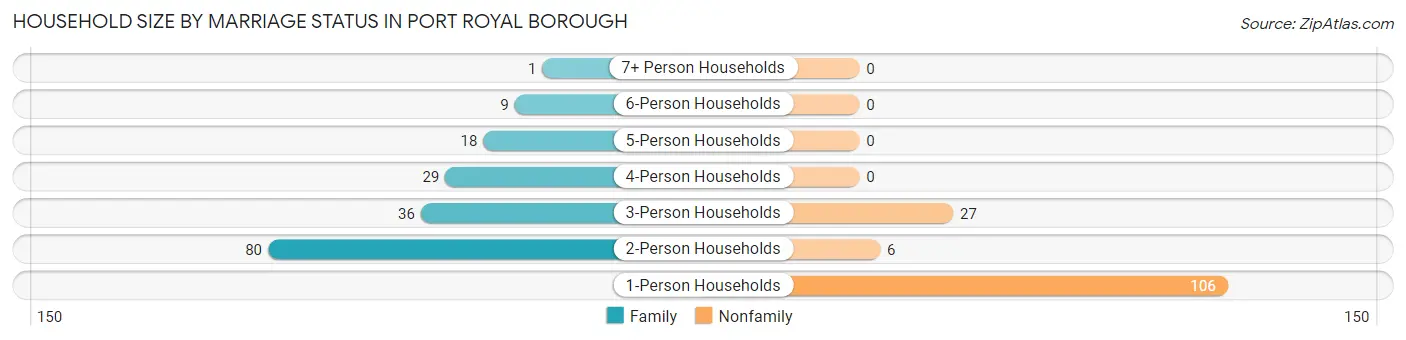
| Household Size | Family Households | Nonfamily Households |
| 1-Person Households | - | 106 (34.0%) |
| 2-Person Households | 80 (25.6%) | 6 (1.9%) |
| 3-Person Households | 36 (11.5%) | 27 (8.6%) |
| 4-Person Households | 29 (9.3%) | 0 (0.0%) |
| 5-Person Households | 18 (5.8%) | 0 (0.0%) |
| 6-Person Households | 9 (2.9%) | 0 (0.0%) |
| 7+ Person Households | 1 (0.3%) | 0 (0.0%) |
| Total | 173 (55.4%) | 139 (44.6%) |
Female Fertility in Port Royal borough
Fertility by Age in Port Royal borough
Average fertility rate in Port Royal borough is 98.0 births per 1,000 women. Women in the age bracket of 20 to 34 years have the highest fertility rate with 165.0 births per 1,000 women. Women in the age bracket of 20 to 34 years acount for 100.0% of all women with births.
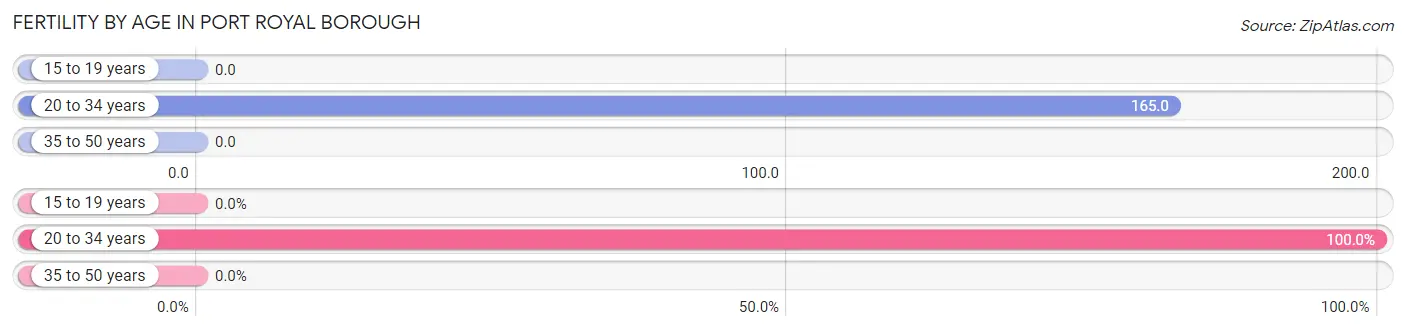
| Age Bracket | Women with Births | Births / 1,000 Women |
| 15 to 19 years | 0 (0.0%) | 0.0 |
| 20 to 34 years | 17 (100.0%) | 165.0 |
| 35 to 50 years | 0 (0.0%) | 0.0 |
| Total | 17 (100.0%) | 98.0 |
Fertility by Age by Marriage Status in Port Royal borough
41.2% of women with births (17) in Port Royal borough are married. The highest percentage of unmarried women with births falls into 20 to 34 years age bracket with 58.8% of them unmarried at the time of birth, while the lowest percentage of unmarried women with births belong to 20 to 34 years age bracket with 58.8% of them unmarried.
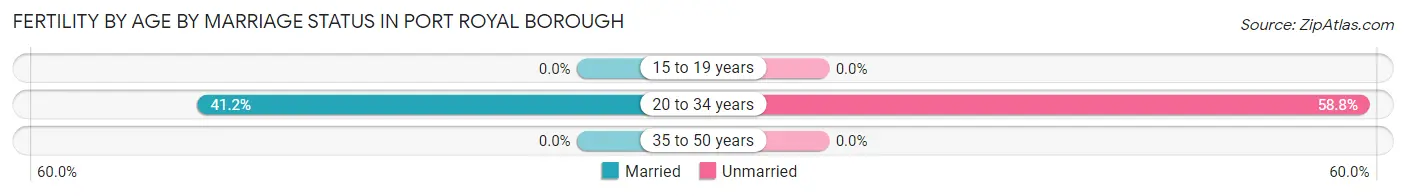
| Age Bracket | Married | Unmarried |
| 15 to 19 years | 0 (0.0%) | 0 (0.0%) |
| 20 to 34 years | 7 (41.2%) | 10 (58.8%) |
| 35 to 50 years | 0 (0.0%) | 0 (0.0%) |
| Total | 7 (41.2%) | 10 (58.8%) |
Fertility by Education in Port Royal borough
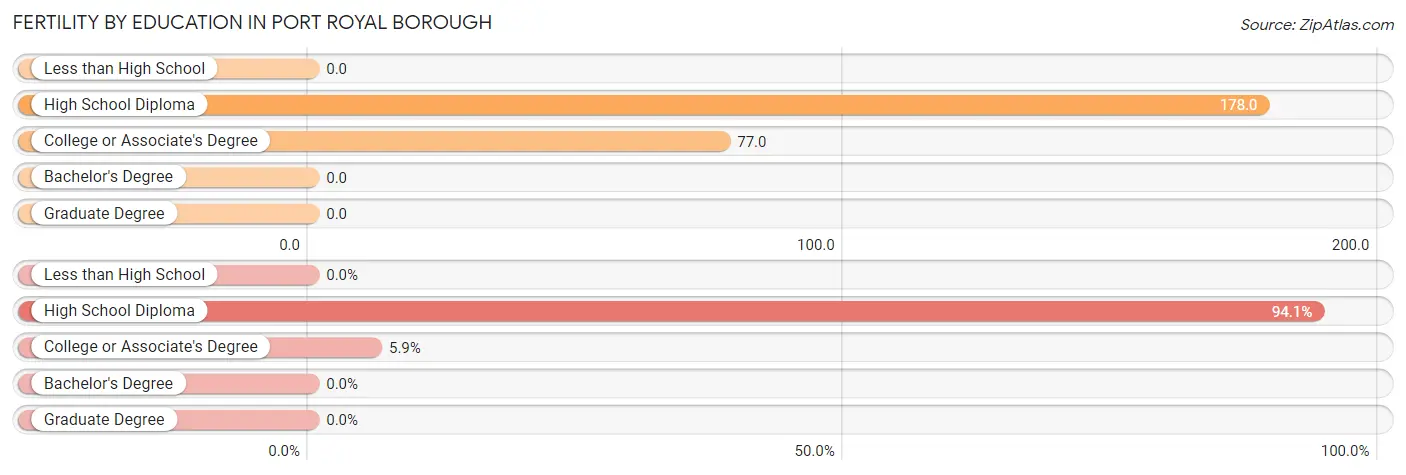
| Educational Attainment | Women with Births | Births / 1,000 Women |
| Less than High School | 0 (0.0%) | 0.0 |
| High School Diploma | 16 (94.1%) | 178.0 |
| College or Associate's Degree | 1 (5.9%) | 77.0 |
| Bachelor's Degree | 0 (0.0%) | 0.0 |
| Graduate Degree | 0 (0.0%) | 0.0 |
| Total | 17 (100.0%) | 98.0 |
Fertility by Education by Marriage Status in Port Royal borough
58.8% of women with births in Port Royal borough are unmarried. Women with the educational attainment of college or associate's degree are most likely to be married with 100.0% of them married at childbirth, while women with the educational attainment of high school diploma are least likely to be married with 62.5% of them unmarried at childbirth.
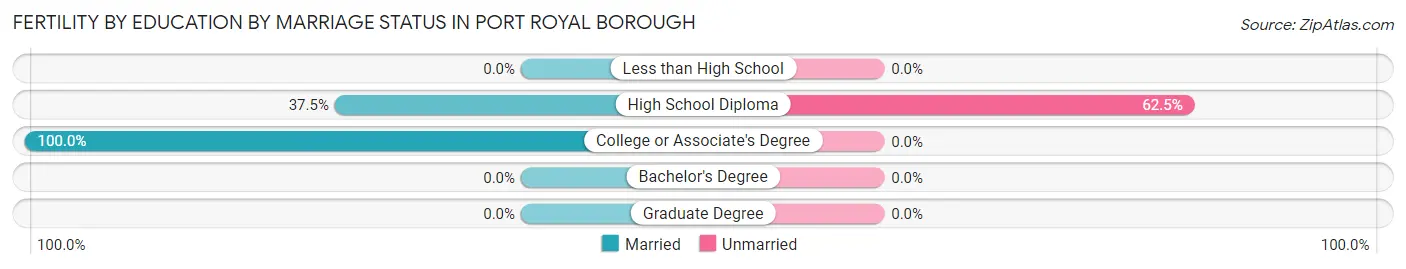
| Educational Attainment | Married | Unmarried |
| Less than High School | 0 (0.0%) | 0 (0.0%) |
| High School Diploma | 6 (37.5%) | 10 (62.5%) |
| College or Associate's Degree | 1 (100.0%) | 0 (0.0%) |
| Bachelor's Degree | 0 (0.0%) | 0 (0.0%) |
| Graduate Degree | 0 (0.0%) | 0 (0.0%) |
| Total | 7 (41.2%) | 10 (58.8%) |
Employment Characteristics in Port Royal borough
Employment by Class of Employer in Port Royal borough
Among the 421 employed individuals in Port Royal borough, private company employees (352 | 83.6%), state government employees (28 | 6.7%), and self-employed (not incorporated) (17 | 4.0%) make up the most common classes of employment.
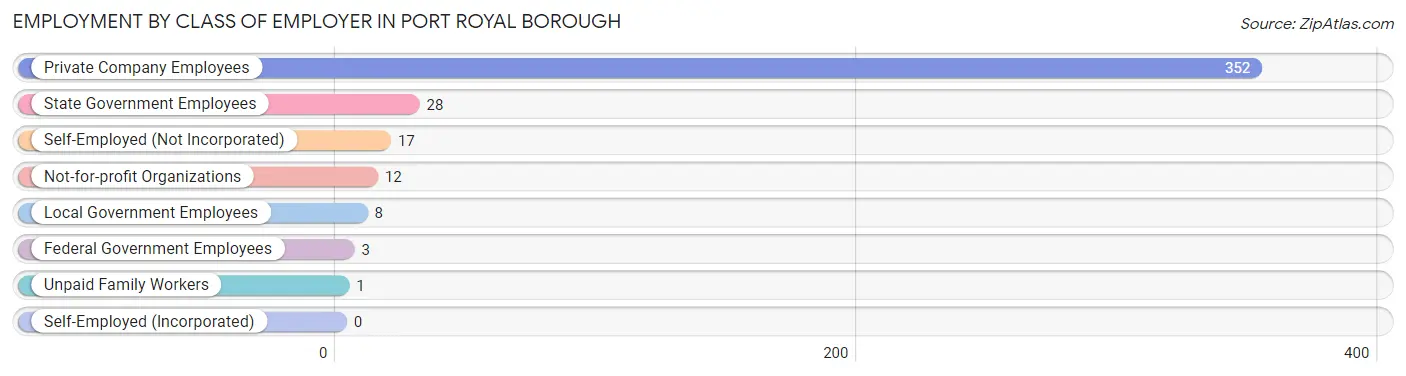
| Employer Class | # Employees | % Employees |
| Private Company Employees | 352 | 83.6% |
| Self-Employed (Incorporated) | 0 | 0.0% |
| Self-Employed (Not Incorporated) | 17 | 4.0% |
| Not-for-profit Organizations | 12 | 2.9% |
| Local Government Employees | 8 | 1.9% |
| State Government Employees | 28 | 6.7% |
| Federal Government Employees | 3 | 0.7% |
| Unpaid Family Workers | 1 | 0.2% |
| Total | 421 | 100.0% |
Employment Status by Age in Port Royal borough
According to the labor force statistics for Port Royal borough, out of the total population over 16 years of age (632), 67.6% or 427 individuals are in the labor force, with 1.4% or 6 of them unemployed. The age group with the highest labor force participation rate is 30 to 34 years, with 95.8% or 68 individuals in the labor force. Within the labor force, the 60 to 64 years age range has the highest percentage of unemployed individuals, with 8.3% or 2 of them being unemployed.
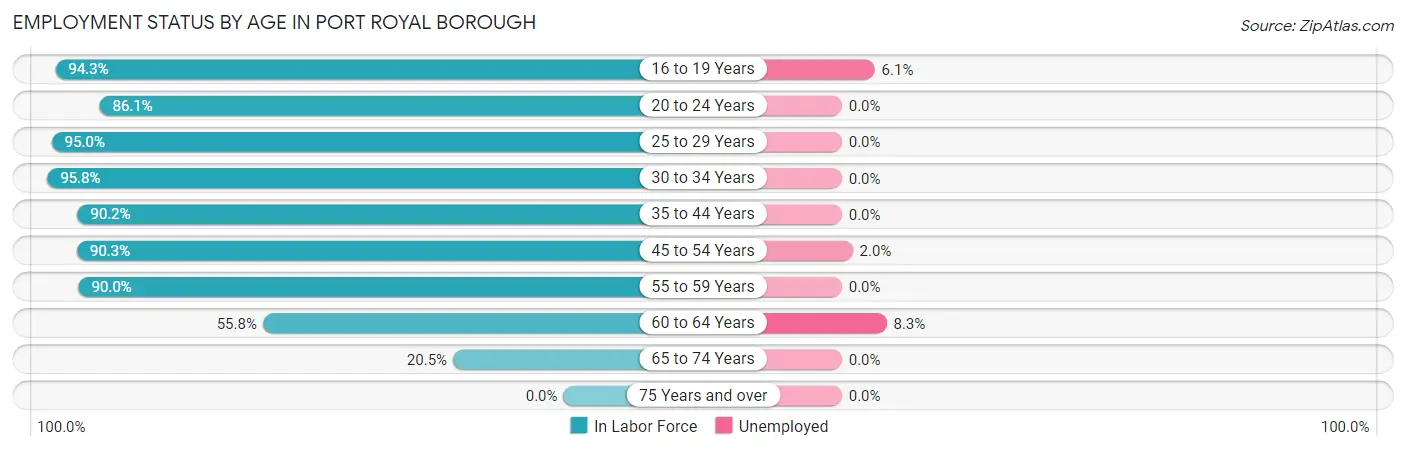
| Age Bracket | In Labor Force | Unemployed |
| 16 to 19 Years | 33 (94.3%) | 2 (6.1%) |
| 20 to 24 Years | 62 (86.1%) | 0 (0.0%) |
| 25 to 29 Years | 38 (95.0%) | 0 (0.0%) |
| 30 to 34 Years | 68 (95.8%) | 0 (0.0%) |
| 35 to 44 Years | 46 (90.2%) | 0 (0.0%) |
| 45 to 54 Years | 102 (90.3%) | 2 (2.0%) |
| 55 to 59 Years | 36 (90.0%) | 0 (0.0%) |
| 60 to 64 Years | 24 (55.8%) | 2 (8.3%) |
| 65 to 74 Years | 18 (20.5%) | 0 (0.0%) |
| 75 Years and over | 0 (0.0%) | 0 (0.0%) |
| Total | 427 (67.6%) | 6 (1.4%) |
Employment Status by Educational Attainment in Port Royal borough
According to labor force statistics for Port Royal borough, 87.7% of individuals (314) out of the total population between 25 and 64 years of age (358) are in the labor force, with 1.3% or 4 of them being unemployed. The group with the highest labor force participation rate are those with the educational attainment of bachelor's degree or higher, with 95.8% or 68 individuals in the labor force. Within the labor force, individuals with less than high school education have the highest percentage of unemployment, with 5.7% or 2 of them being unemployed.
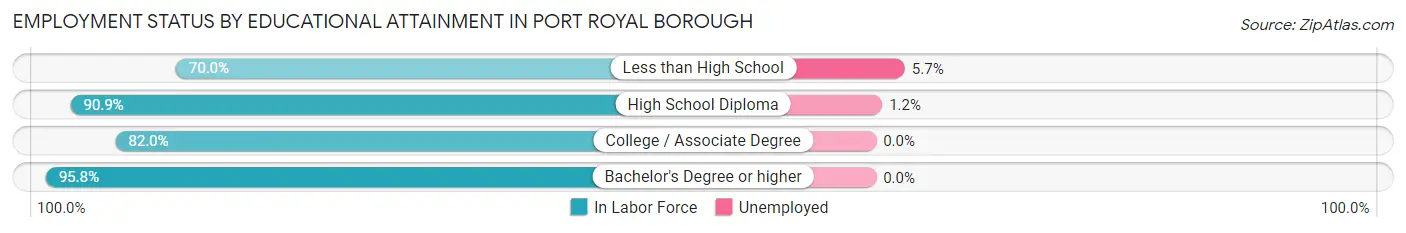
| Educational Attainment | In Labor Force | Unemployed |
| Less than High School | 35 (70.0%) | 3 (5.7%) |
| High School Diploma | 170 (90.9%) | 2 (1.2%) |
| College / Associate Degree | 41 (82.0%) | 0 (0.0%) |
| Bachelor's Degree or higher | 68 (95.8%) | 0 (0.0%) |
| Total | 314 (87.7%) | 5 (1.3%) |
Employment Occupations by Sex in Port Royal borough
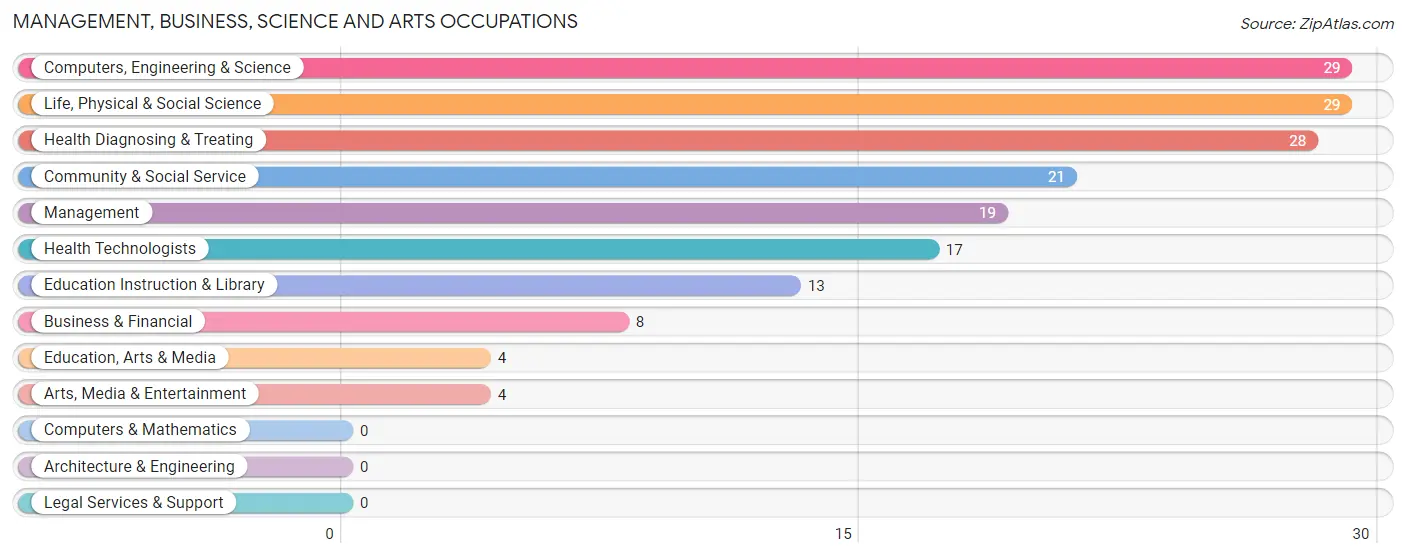
Management, Business, Science and Arts Occupations
The most common Management, Business, Science and Arts occupations in Port Royal borough are Computers, Engineering & Science (29 | 6.9%), Life, Physical & Social Science (29 | 6.9%), Health Diagnosing & Treating (28 | 6.7%), Community & Social Service (21 | 5.0%), and Management (19 | 4.5%).
Management, Business, Science and Arts Occupations by Sex
Within the Management, Business, Science and Arts occupations in Port Royal borough, the most male-oriented occupations are Arts, Media & Entertainment (75.0%), Management (73.7%), and Computers, Engineering & Science (72.4%), while the most female-oriented occupations are Education, Arts & Media (100.0%), Education Instruction & Library (100.0%), and Health Diagnosing & Treating (100.0%).
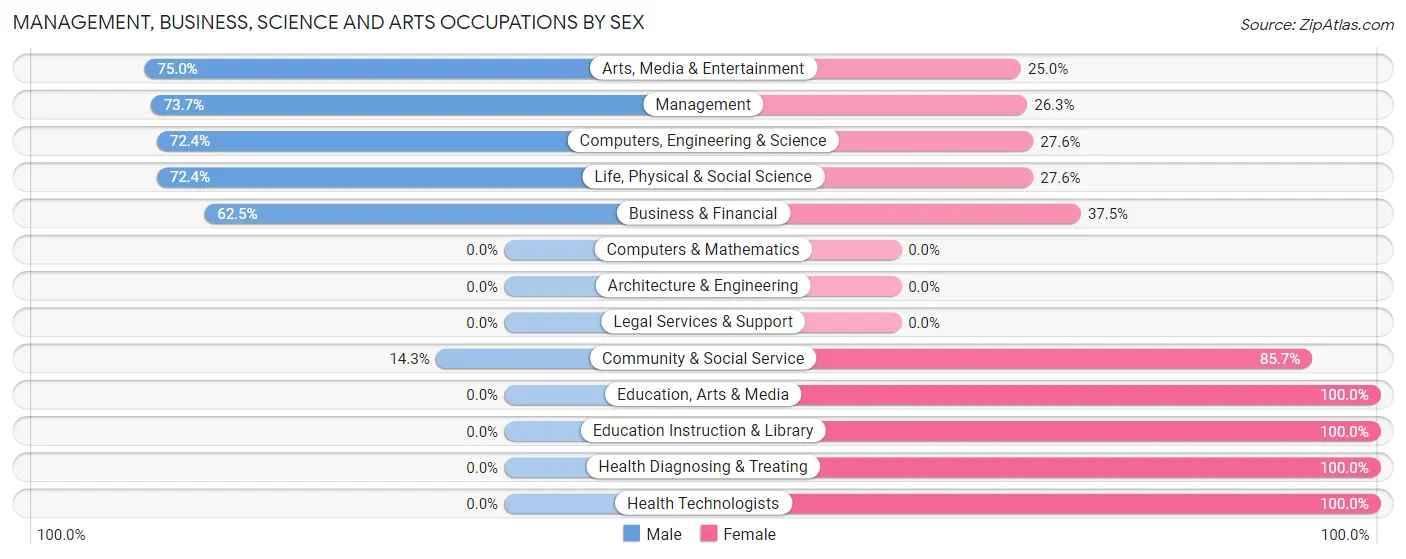
| Occupation | Male | Female |
| Management | 14 (73.7%) | 5 (26.3%) |
| Business & Financial | 5 (62.5%) | 3 (37.5%) |
| Computers, Engineering & Science | 21 (72.4%) | 8 (27.6%) |
| Computers & Mathematics | 0 (0.0%) | 0 (0.0%) |
| Architecture & Engineering | 0 (0.0%) | 0 (0.0%) |
| Life, Physical & Social Science | 21 (72.4%) | 8 (27.6%) |
| Community & Social Service | 3 (14.3%) | 18 (85.7%) |
| Education, Arts & Media | 0 (0.0%) | 4 (100.0%) |
| Legal Services & Support | 0 (0.0%) | 0 (0.0%) |
| Education Instruction & Library | 0 (0.0%) | 13 (100.0%) |
| Arts, Media & Entertainment | 3 (75.0%) | 1 (25.0%) |
| Health Diagnosing & Treating | 0 (0.0%) | 28 (100.0%) |
| Health Technologists | 0 (0.0%) | 17 (100.0%) |
| Total (Category) | 43 (40.9%) | 62 (59.1%) |
| Total (Overall) | 195 (46.3%) | 226 (53.7%) |
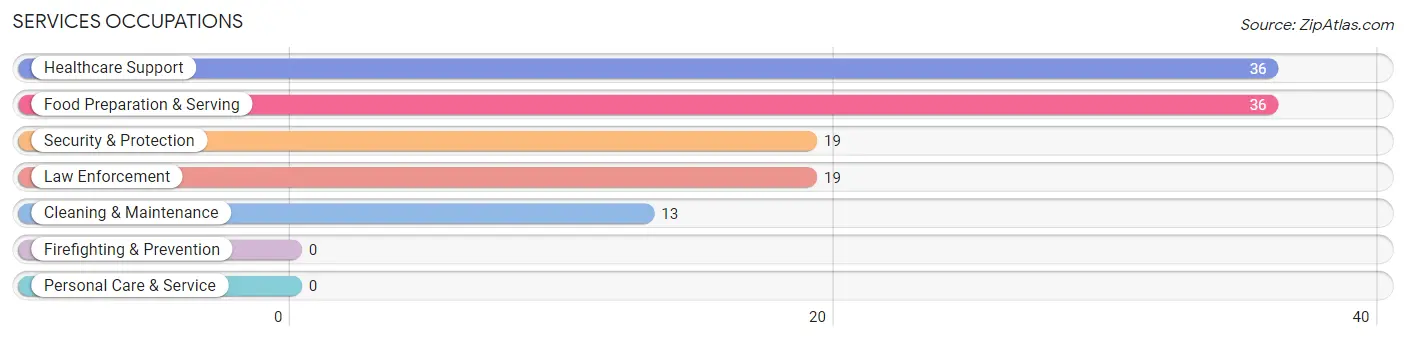
Services Occupations
The most common Services occupations in Port Royal borough are Healthcare Support (36 | 8.6%), Food Preparation & Serving (36 | 8.6%), Security & Protection (19 | 4.5%), Law Enforcement (19 | 4.5%), and Cleaning & Maintenance (13 | 3.1%).
Services Occupations by Sex
Within the Services occupations in Port Royal borough, the most male-oriented occupations are Cleaning & Maintenance (100.0%), Security & Protection (84.2%), and Law Enforcement (84.2%), while the most female-oriented occupations are Healthcare Support (97.2%), Food Preparation & Serving (69.4%), and Security & Protection (15.8%).
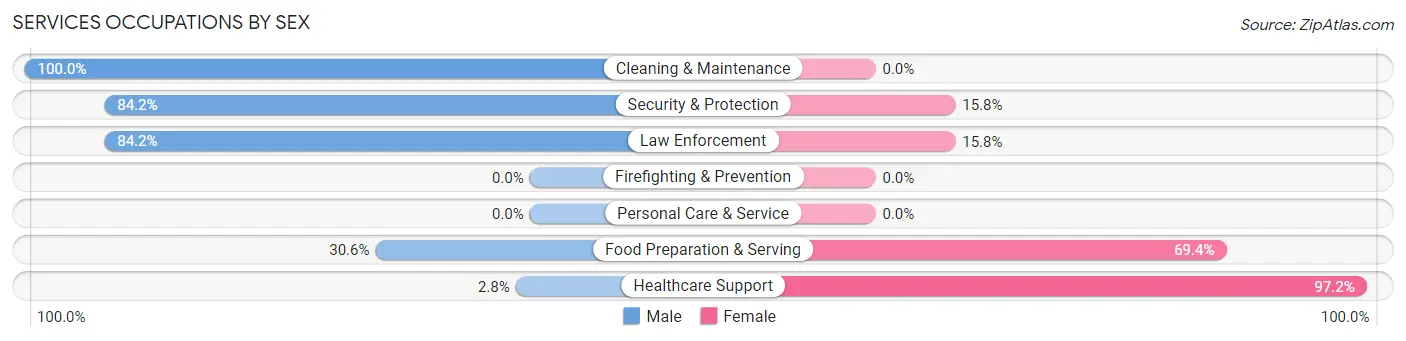
| Occupation | Male | Female |
| Healthcare Support | 1 (2.8%) | 35 (97.2%) |
| Security & Protection | 16 (84.2%) | 3 (15.8%) |
| Firefighting & Prevention | 0 (0.0%) | 0 (0.0%) |
| Law Enforcement | 16 (84.2%) | 3 (15.8%) |
| Food Preparation & Serving | 11 (30.6%) | 25 (69.4%) |
| Cleaning & Maintenance | 13 (100.0%) | 0 (0.0%) |
| Personal Care & Service | 0 (0.0%) | 0 (0.0%) |
| Total (Category) | 41 (39.4%) | 63 (60.6%) |
| Total (Overall) | 195 (46.3%) | 226 (53.7%) |
Sales and Office Occupations
The most common Sales and Office occupations in Port Royal borough are Sales & Related (64 | 15.2%), and Office & Administration (28 | 6.7%).
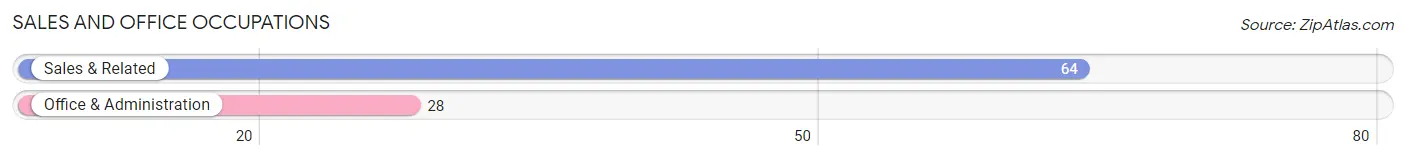
Sales and Office Occupations by Sex
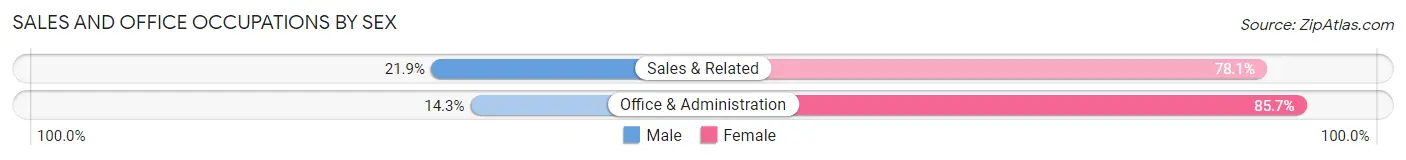
| Occupation | Male | Female |
| Sales & Related | 14 (21.9%) | 50 (78.1%) |
| Office & Administration | 4 (14.3%) | 24 (85.7%) |
| Total (Category) | 18 (19.6%) | 74 (80.4%) |
| Total (Overall) | 195 (46.3%) | 226 (53.7%) |
Natural Resources, Construction and Maintenance Occupations
The most common Natural Resources, Construction and Maintenance occupations in Port Royal borough are Farming, Fishing & Forestry (27 | 6.4%), Construction & Extraction (24 | 5.7%), and Installation, Maintenance & Repair (10 | 2.4%).
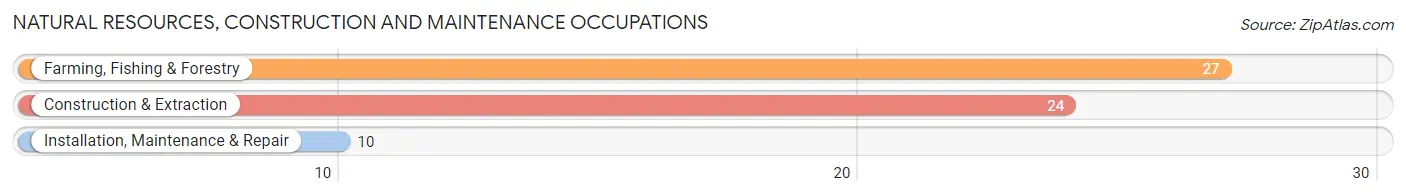
Natural Resources, Construction and Maintenance Occupations by Sex

| Occupation | Male | Female |
| Farming, Fishing & Forestry | 27 (100.0%) | 0 (0.0%) |
| Construction & Extraction | 22 (91.7%) | 2 (8.3%) |
| Installation, Maintenance & Repair | 10 (100.0%) | 0 (0.0%) |
| Total (Category) | 59 (96.7%) | 2 (3.3%) |
| Total (Overall) | 195 (46.3%) | 226 (53.7%) |
Production, Transportation and Moving Occupations
The most common Production, Transportation and Moving occupations in Port Royal borough are Production (33 | 7.8%), Transportation (17 | 4.0%), and Material Moving (9 | 2.1%).
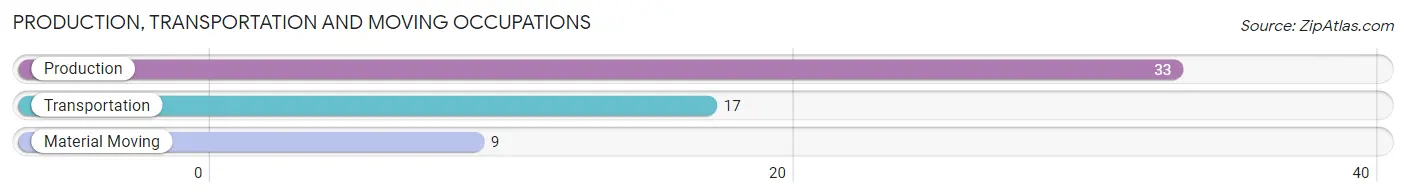
Production, Transportation and Moving Occupations by Sex
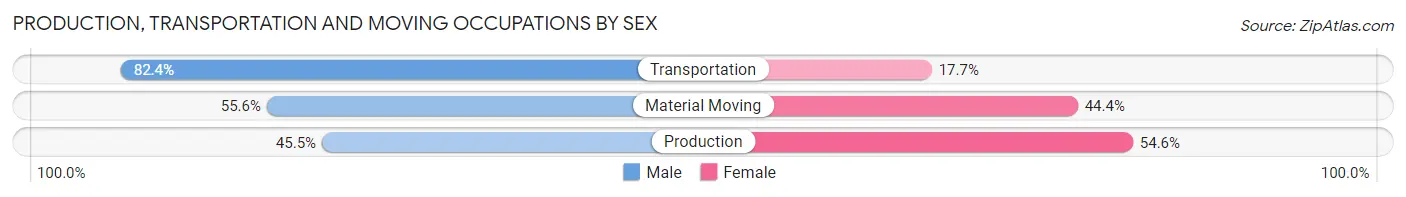
| Occupation | Male | Female |
| Production | 15 (45.5%) | 18 (54.5%) |
| Transportation | 14 (82.4%) | 3 (17.6%) |
| Material Moving | 5 (55.6%) | 4 (44.4%) |
| Total (Category) | 34 (57.6%) | 25 (42.4%) |
| Total (Overall) | 195 (46.3%) | 226 (53.7%) |
Employment Industries by Sex in Port Royal borough
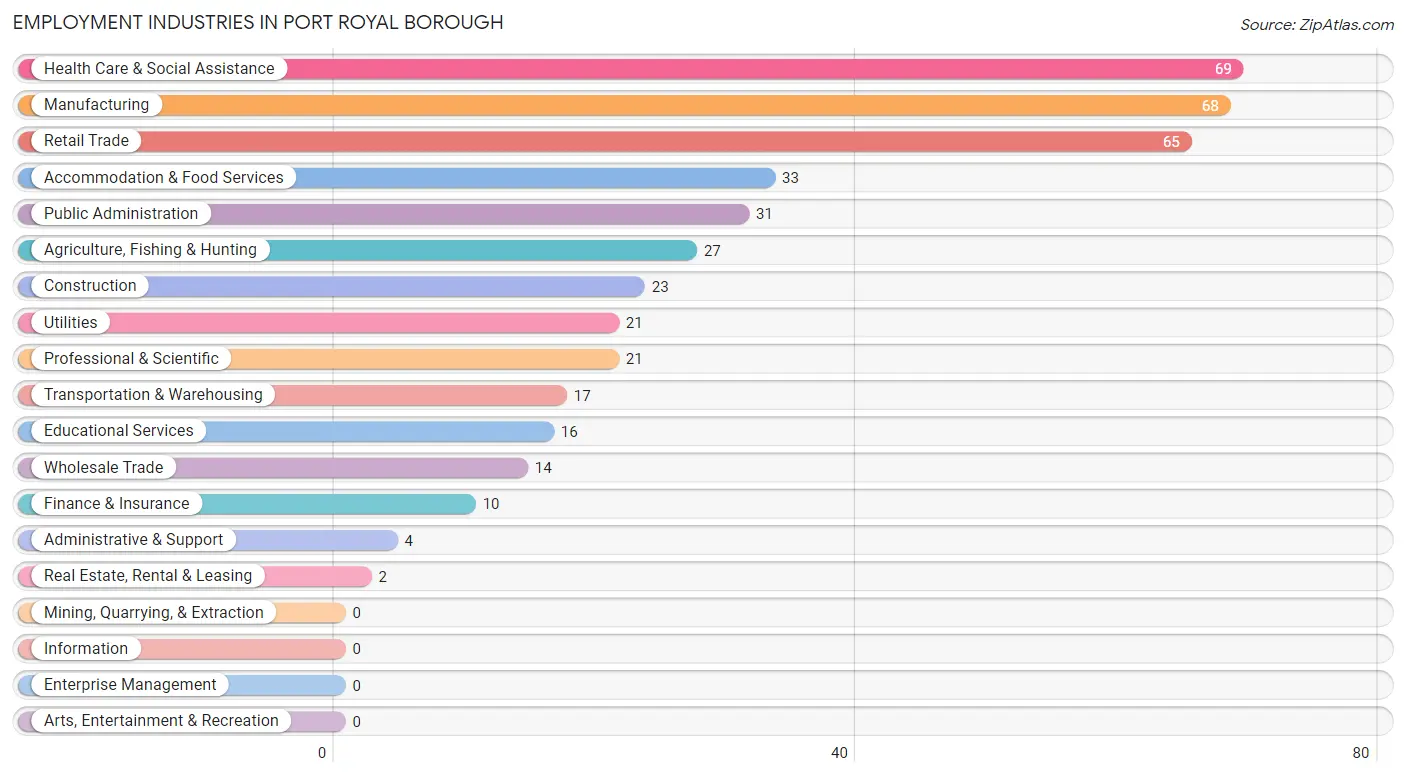
Employment Industries in Port Royal borough
The major employment industries in Port Royal borough include Health Care & Social Assistance (69 | 16.4%), Manufacturing (68 | 16.2%), Retail Trade (65 | 15.4%), Accommodation & Food Services (33 | 7.8%), and Public Administration (31 | 7.4%).
Employment Industries by Sex in Port Royal borough
The Port Royal borough industries that see more men than women are Agriculture, Fishing & Hunting (100.0%), Utilities (100.0%), and Real Estate, Rental & Leasing (100.0%), whereas the industries that tend to have a higher number of women are Finance & Insurance (100.0%), Educational Services (100.0%), and Health Care & Social Assistance (98.6%).
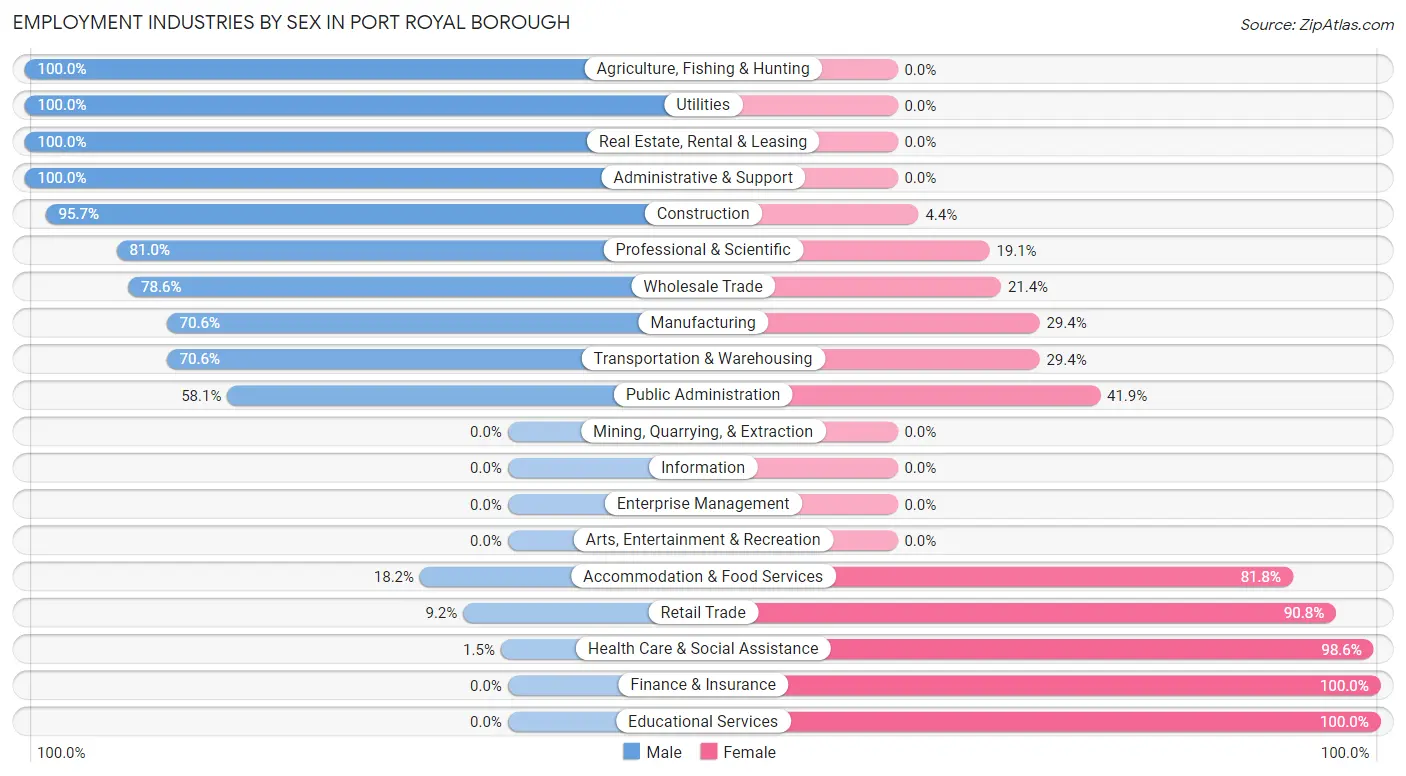
| Industry | Male | Female |
| Agriculture, Fishing & Hunting | 27 (100.0%) | 0 (0.0%) |
| Mining, Quarrying, & Extraction | 0 (0.0%) | 0 (0.0%) |
| Construction | 22 (95.7%) | 1 (4.3%) |
| Manufacturing | 48 (70.6%) | 20 (29.4%) |
| Wholesale Trade | 11 (78.6%) | 3 (21.4%) |
| Retail Trade | 6 (9.2%) | 59 (90.8%) |
| Transportation & Warehousing | 12 (70.6%) | 5 (29.4%) |
| Utilities | 21 (100.0%) | 0 (0.0%) |
| Information | 0 (0.0%) | 0 (0.0%) |
| Finance & Insurance | 0 (0.0%) | 10 (100.0%) |
| Real Estate, Rental & Leasing | 2 (100.0%) | 0 (0.0%) |
| Professional & Scientific | 17 (80.9%) | 4 (19.1%) |
| Enterprise Management | 0 (0.0%) | 0 (0.0%) |
| Administrative & Support | 4 (100.0%) | 0 (0.0%) |
| Educational Services | 0 (0.0%) | 16 (100.0%) |
| Health Care & Social Assistance | 1 (1.5%) | 68 (98.6%) |
| Arts, Entertainment & Recreation | 0 (0.0%) | 0 (0.0%) |
| Accommodation & Food Services | 6 (18.2%) | 27 (81.8%) |
| Public Administration | 18 (58.1%) | 13 (41.9%) |
| Total | 195 (46.3%) | 226 (53.7%) |
Education in Port Royal borough
School Enrollment in Port Royal borough
The most common levels of schooling among the 91 students in Port Royal borough are high school (38 | 41.8%), elementary school (17 | 18.7%), and middle school (16 | 17.6%).
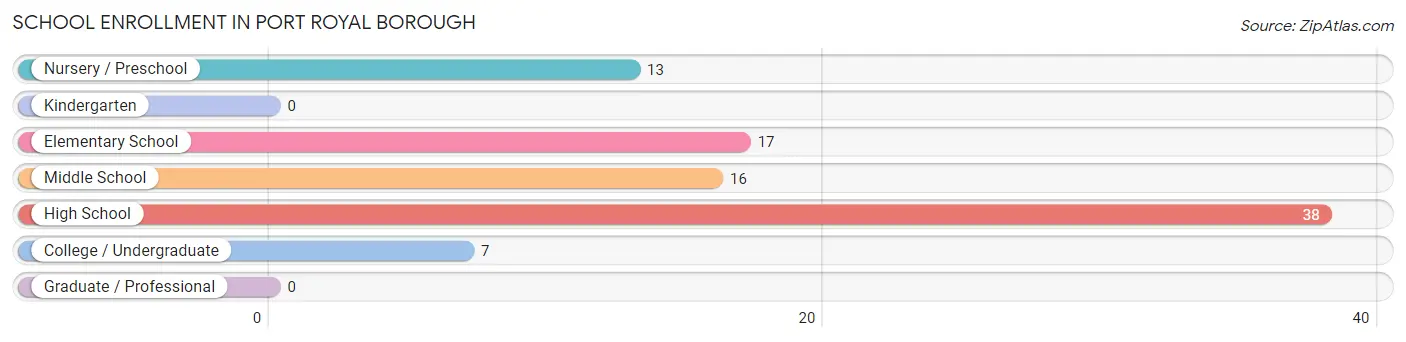
| School Level | # Students | % Students |
| Nursery / Preschool | 13 | 14.3% |
| Kindergarten | 0 | 0.0% |
| Elementary School | 17 | 18.7% |
| Middle School | 16 | 17.6% |
| High School | 38 | 41.8% |
| College / Undergraduate | 7 | 7.7% |
| Graduate / Professional | 0 | 0.0% |
| Total | 91 | 100.0% |
School Enrollment by Age by Funding Source in Port Royal borough
Out of a total of 91 students who are enrolled in schools in Port Royal borough, 7 (7.7%) attend a private institution, while the remaining 84 (92.3%) are enrolled in public schools. The age group of 18 to 19 year olds has the highest likelihood of being enrolled in private schools, with 3 (100.0% in the age bracket) enrolled. Conversely, the age group of 3 to 4 year olds has the lowest likelihood of being enrolled in a private school, with 12 (100.0% in the age bracket) attending a public institution.
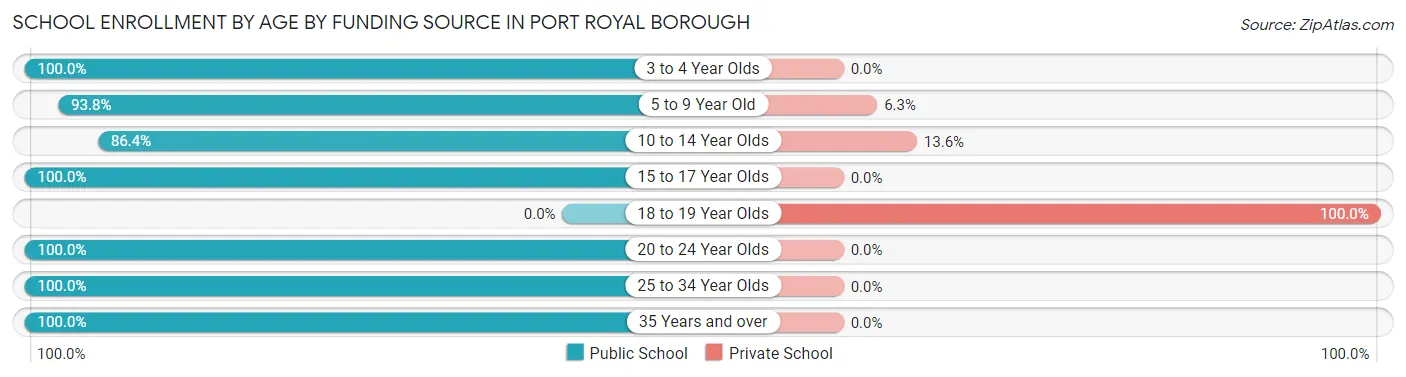
| Age Bracket | Public School | Private School |
| 3 to 4 Year Olds | 12 (100.0%) | 0 (0.0%) |
| 5 to 9 Year Old | 15 (93.8%) | 1 (6.2%) |
| 10 to 14 Year Olds | 19 (86.4%) | 3 (13.6%) |
| 15 to 17 Year Olds | 25 (100.0%) | 0 (0.0%) |
| 18 to 19 Year Olds | 0 (0.0%) | 3 (100.0%) |
| 20 to 24 Year Olds | 9 (100.0%) | 0 (0.0%) |
| 25 to 34 Year Olds | 2 (100.0%) | 0 (0.0%) |
| 35 Years and over | 2 (100.0%) | 0 (0.0%) |
| Total | 84 (92.3%) | 7 (7.7%) |
Educational Attainment by Field of Study in Port Royal borough
Science & technology (22 | 25.9%), physical & health sciences (16 | 18.8%), education (12 | 14.1%), business (11 | 12.9%), and arts & humanities (9 | 10.6%) are the most common fields of study among 85 individuals in Port Royal borough who have obtained a bachelor's degree or higher.
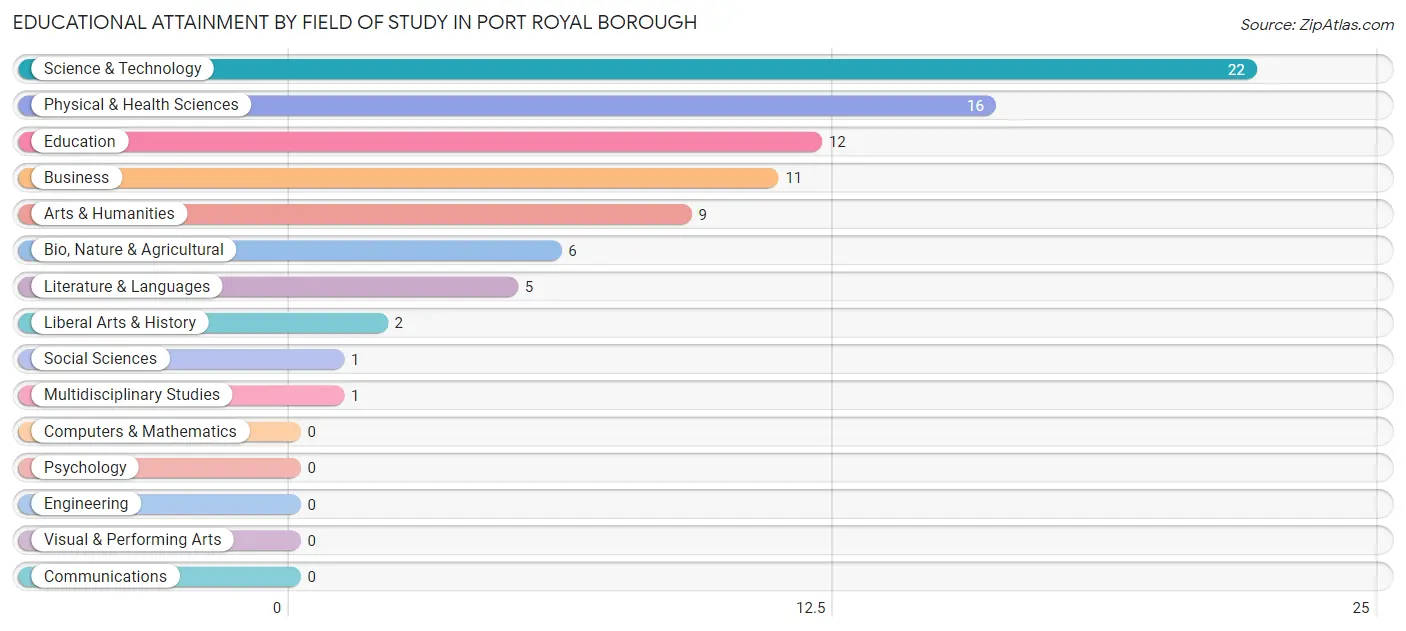
| Field of Study | # Graduates | % Graduates |
| Computers & Mathematics | 0 | 0.0% |
| Bio, Nature & Agricultural | 6 | 7.1% |
| Physical & Health Sciences | 16 | 18.8% |
| Psychology | 0 | 0.0% |
| Social Sciences | 1 | 1.2% |
| Engineering | 0 | 0.0% |
| Multidisciplinary Studies | 1 | 1.2% |
| Science & Technology | 22 | 25.9% |
| Business | 11 | 12.9% |
| Education | 12 | 14.1% |
| Literature & Languages | 5 | 5.9% |
| Liberal Arts & History | 2 | 2.4% |
| Visual & Performing Arts | 0 | 0.0% |
| Communications | 0 | 0.0% |
| Arts & Humanities | 9 | 10.6% |
| Total | 85 | 100.0% |
Transportation & Commute in Port Royal borough
Vehicle Availability by Sex in Port Royal borough
The most prevalent vehicle ownership categories in Port Royal borough are males with 2 vehicles (88, accounting for 45.1%) and females with 2 vehicles (79, making up 38.9%).
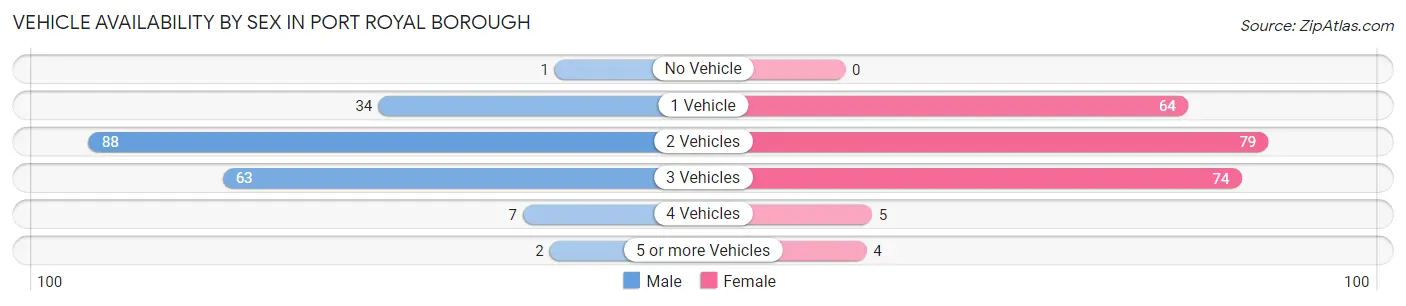
| Vehicles Available | Male | Female |
| No Vehicle | 1 (0.5%) | 0 (0.0%) |
| 1 Vehicle | 34 (17.4%) | 64 (28.3%) |
| 2 Vehicles | 88 (45.1%) | 79 (35.0%) |
| 3 Vehicles | 63 (32.3%) | 74 (32.7%) |
| 4 Vehicles | 7 (3.6%) | 5 (2.2%) |
| 5 or more Vehicles | 2 (1.0%) | 4 (1.8%) |
| Total | 195 (100.0%) | 226 (100.0%) |
Commute Time in Port Royal borough
The most frequently occuring commute durations in Port Royal borough are 5 to 9 minutes (94 commuters, 23.7%), 20 to 24 minutes (50 commuters, 12.6%), and 30 to 34 minutes (49 commuters, 12.4%).
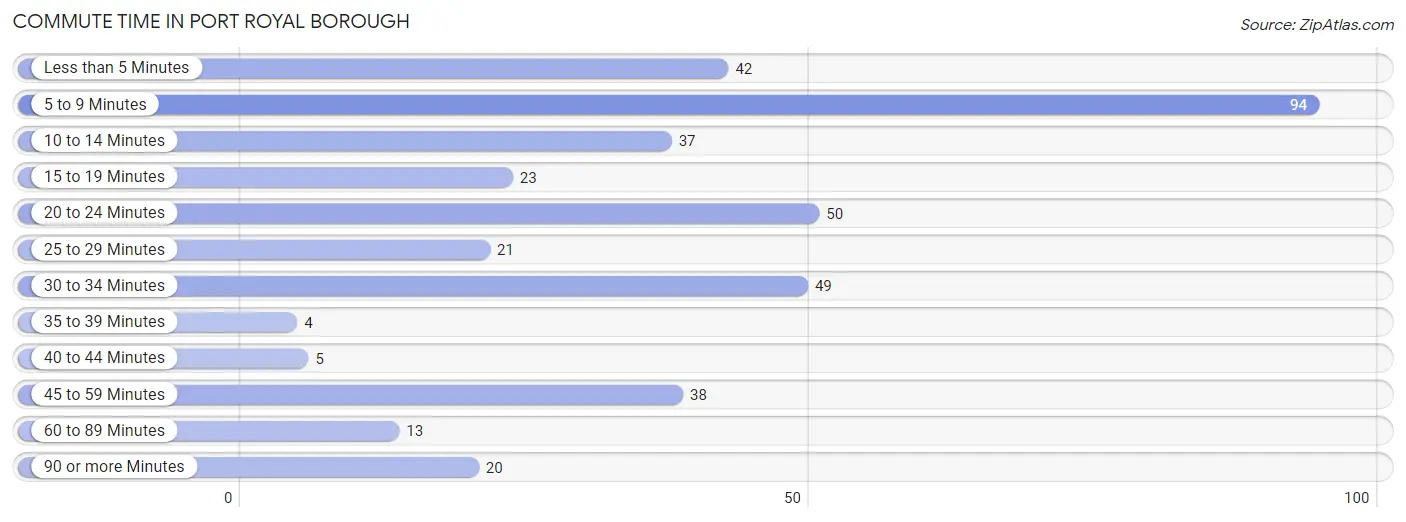
| Commute Time | # Commuters | % Commuters |
| Less than 5 Minutes | 42 | 10.6% |
| 5 to 9 Minutes | 94 | 23.7% |
| 10 to 14 Minutes | 37 | 9.3% |
| 15 to 19 Minutes | 23 | 5.8% |
| 20 to 24 Minutes | 50 | 12.6% |
| 25 to 29 Minutes | 21 | 5.3% |
| 30 to 34 Minutes | 49 | 12.4% |
| 35 to 39 Minutes | 4 | 1.0% |
| 40 to 44 Minutes | 5 | 1.3% |
| 45 to 59 Minutes | 38 | 9.6% |
| 60 to 89 Minutes | 13 | 3.3% |
| 90 or more Minutes | 20 | 5.1% |
Commute Time by Sex in Port Royal borough
The most common commute times in Port Royal borough are 30 to 34 minutes (37 commuters, 19.8%) for males and 5 to 9 minutes (66 commuters, 31.6%) for females.
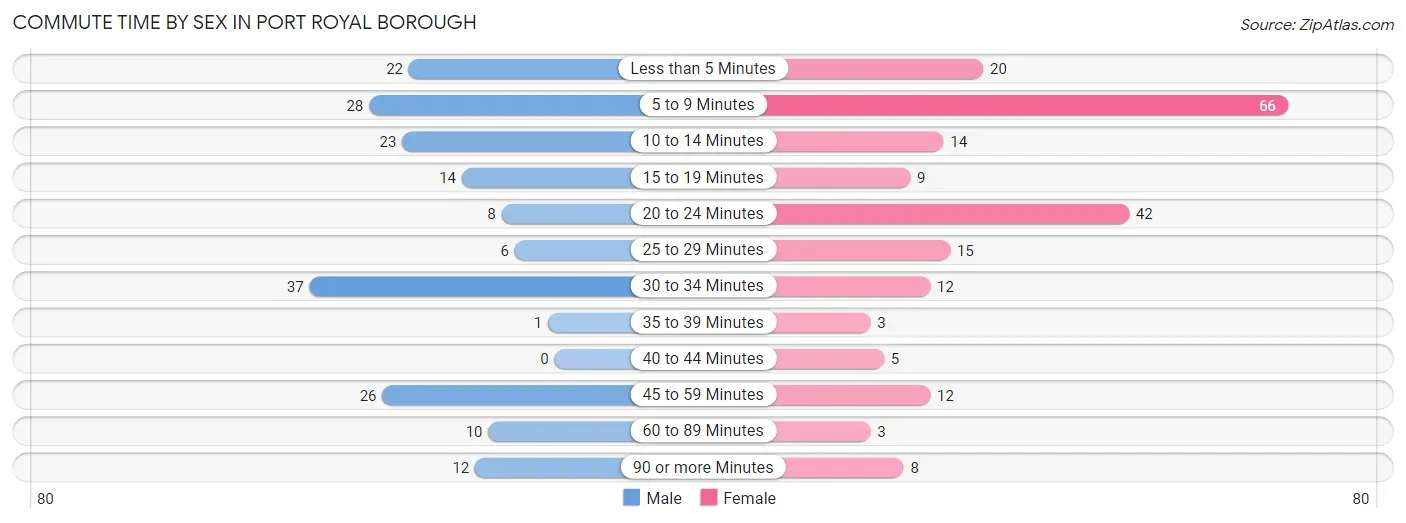
| Commute Time | Male | Female |
| Less than 5 Minutes | 22 (11.8%) | 20 (9.6%) |
| 5 to 9 Minutes | 28 (15.0%) | 66 (31.6%) |
| 10 to 14 Minutes | 23 (12.3%) | 14 (6.7%) |
| 15 to 19 Minutes | 14 (7.5%) | 9 (4.3%) |
| 20 to 24 Minutes | 8 (4.3%) | 42 (20.1%) |
| 25 to 29 Minutes | 6 (3.2%) | 15 (7.2%) |
| 30 to 34 Minutes | 37 (19.8%) | 12 (5.7%) |
| 35 to 39 Minutes | 1 (0.5%) | 3 (1.4%) |
| 40 to 44 Minutes | 0 (0.0%) | 5 (2.4%) |
| 45 to 59 Minutes | 26 (13.9%) | 12 (5.7%) |
| 60 to 89 Minutes | 10 (5.3%) | 3 (1.4%) |
| 90 or more Minutes | 12 (6.4%) | 8 (3.8%) |
Time of Departure to Work by Sex in Port Royal borough
The most frequent times of departure to work in Port Royal borough are 12:00 AM to 4:59 AM (49, 26.2%) for males and 10:00 AM to 10:59 AM (30, 14.3%) for females.
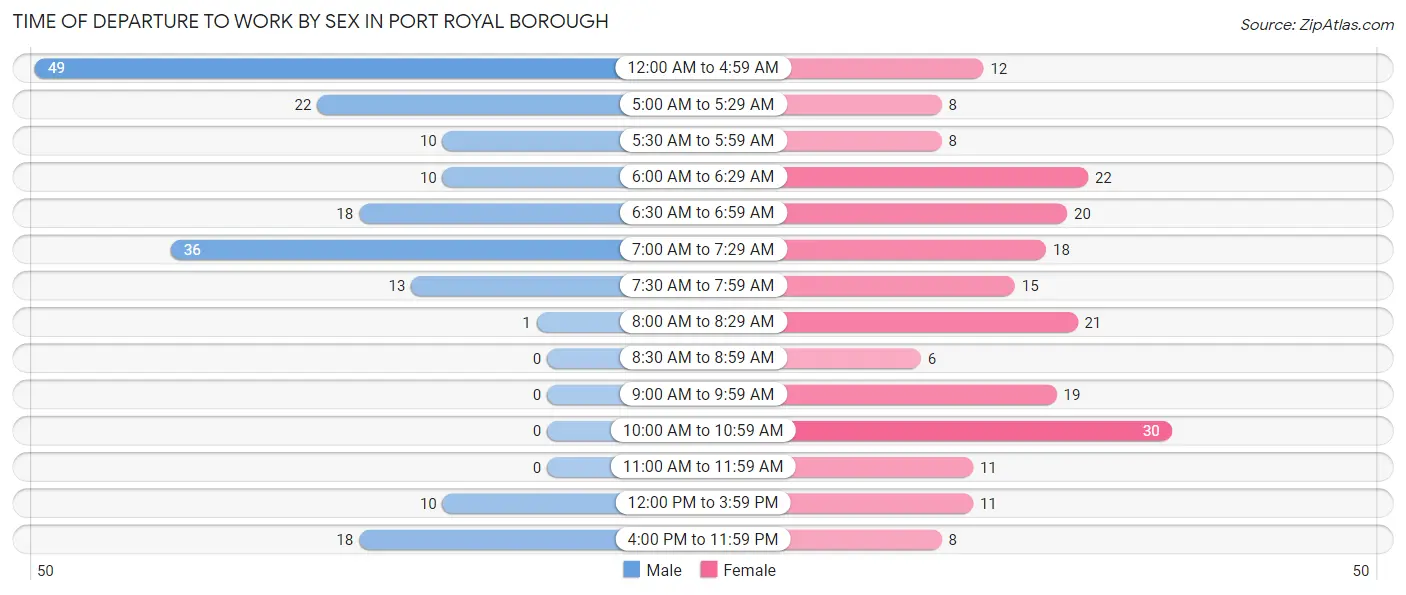
| Time of Departure | Male | Female |
| 12:00 AM to 4:59 AM | 49 (26.2%) | 12 (5.7%) |
| 5:00 AM to 5:29 AM | 22 (11.8%) | 8 (3.8%) |
| 5:30 AM to 5:59 AM | 10 (5.3%) | 8 (3.8%) |
| 6:00 AM to 6:29 AM | 10 (5.3%) | 22 (10.5%) |
| 6:30 AM to 6:59 AM | 18 (9.6%) | 20 (9.6%) |
| 7:00 AM to 7:29 AM | 36 (19.3%) | 18 (8.6%) |
| 7:30 AM to 7:59 AM | 13 (7.0%) | 15 (7.2%) |
| 8:00 AM to 8:29 AM | 1 (0.5%) | 21 (10.1%) |
| 8:30 AM to 8:59 AM | 0 (0.0%) | 6 (2.9%) |
| 9:00 AM to 9:59 AM | 0 (0.0%) | 19 (9.1%) |
| 10:00 AM to 10:59 AM | 0 (0.0%) | 30 (14.3%) |
| 11:00 AM to 11:59 AM | 0 (0.0%) | 11 (5.3%) |
| 12:00 PM to 3:59 PM | 10 (5.3%) | 11 (5.3%) |
| 4:00 PM to 11:59 PM | 18 (9.6%) | 8 (3.8%) |
| Total | 187 (100.0%) | 209 (100.0%) |
Housing Occupancy in Port Royal borough
Occupancy by Ownership in Port Royal borough
Of the total 312 dwellings in Port Royal borough, owner-occupied units account for 178 (57.1%), while renter-occupied units make up 134 (42.9%).
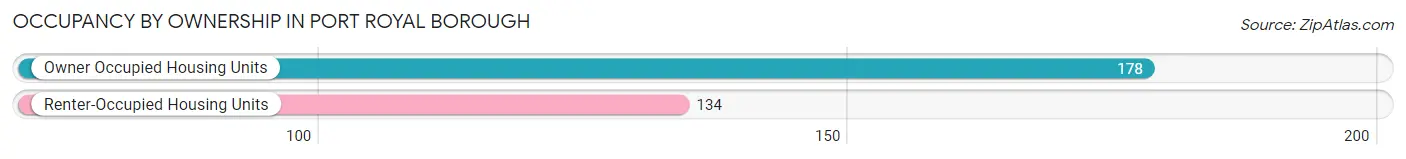
| Occupancy | # Housing Units | % Housing Units |
| Owner Occupied Housing Units | 178 | 57.1% |
| Renter-Occupied Housing Units | 134 | 42.9% |
| Total Occupied Housing Units | 312 | 100.0% |
Occupancy by Household Size in Port Royal borough
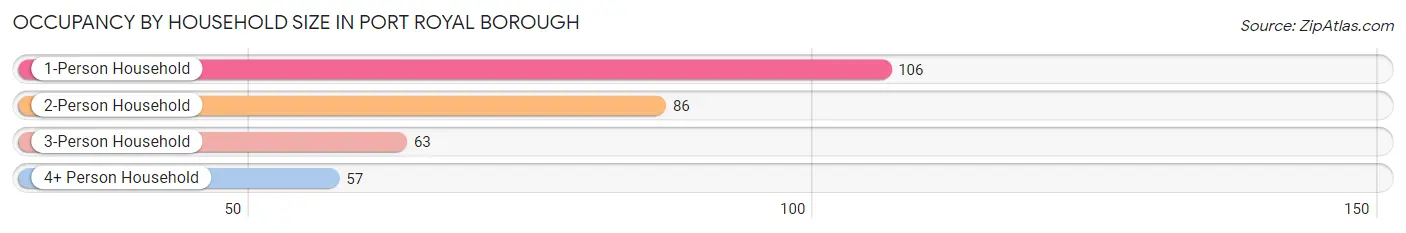
| Household Size | # Housing Units | % Housing Units |
| 1-Person Household | 106 | 34.0% |
| 2-Person Household | 86 | 27.6% |
| 3-Person Household | 63 | 20.2% |
| 4+ Person Household | 57 | 18.3% |
| Total Housing Units | 312 | 100.0% |
Occupancy by Ownership by Household Size in Port Royal borough
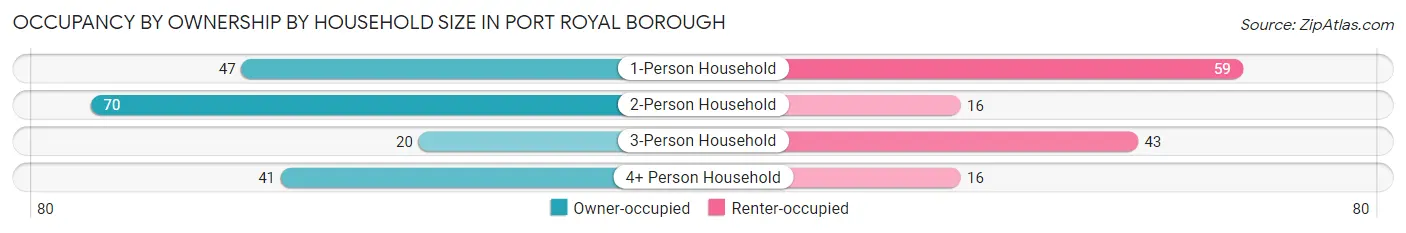
| Household Size | Owner-occupied | Renter-occupied |
| 1-Person Household | 47 (44.3%) | 59 (55.7%) |
| 2-Person Household | 70 (81.4%) | 16 (18.6%) |
| 3-Person Household | 20 (31.8%) | 43 (68.2%) |
| 4+ Person Household | 41 (71.9%) | 16 (28.1%) |
| Total Housing Units | 178 (57.1%) | 134 (42.9%) |
Occupancy by Educational Attainment in Port Royal borough
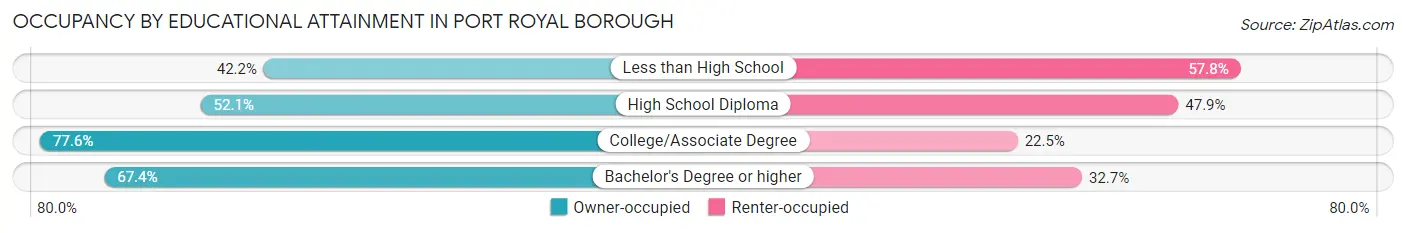
| Household Size | Owner-occupied | Renter-occupied |
| Less than High School | 19 (42.2%) | 26 (57.8%) |
| High School Diploma | 88 (52.1%) | 81 (47.9%) |
| College/Associate Degree | 38 (77.5%) | 11 (22.5%) |
| Bachelor's Degree or higher | 33 (67.3%) | 16 (32.7%) |
Occupancy by Age of Householder in Port Royal borough
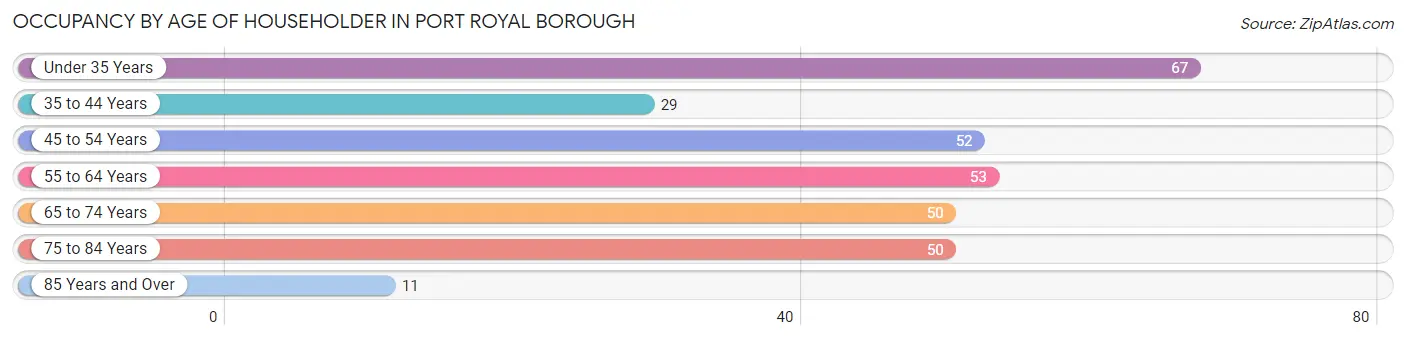
| Age Bracket | # Households | % Households |
| Under 35 Years | 67 | 21.5% |
| 35 to 44 Years | 29 | 9.3% |
| 45 to 54 Years | 52 | 16.7% |
| 55 to 64 Years | 53 | 17.0% |
| 65 to 74 Years | 50 | 16.0% |
| 75 to 84 Years | 50 | 16.0% |
| 85 Years and Over | 11 | 3.5% |
| Total | 312 | 100.0% |
Housing Finances in Port Royal borough
Median Income by Occupancy in Port Royal borough
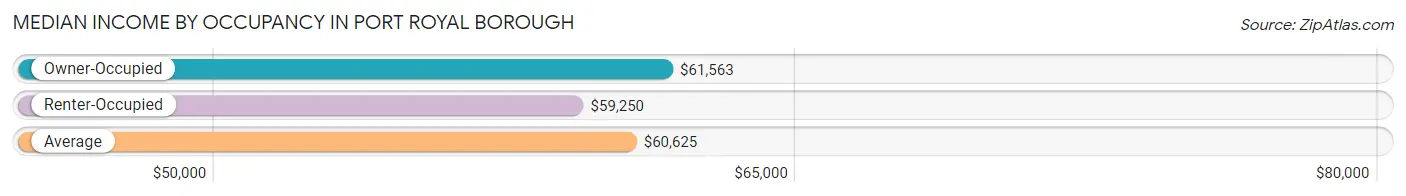
| Occupancy Type | # Households | Median Income |
| Owner-Occupied | 178 (57.1%) | $61,563 |
| Renter-Occupied | 134 (42.9%) | $59,250 |
| Average | 312 (100.0%) | $60,625 |
Occupancy by Householder Income Bracket in Port Royal borough
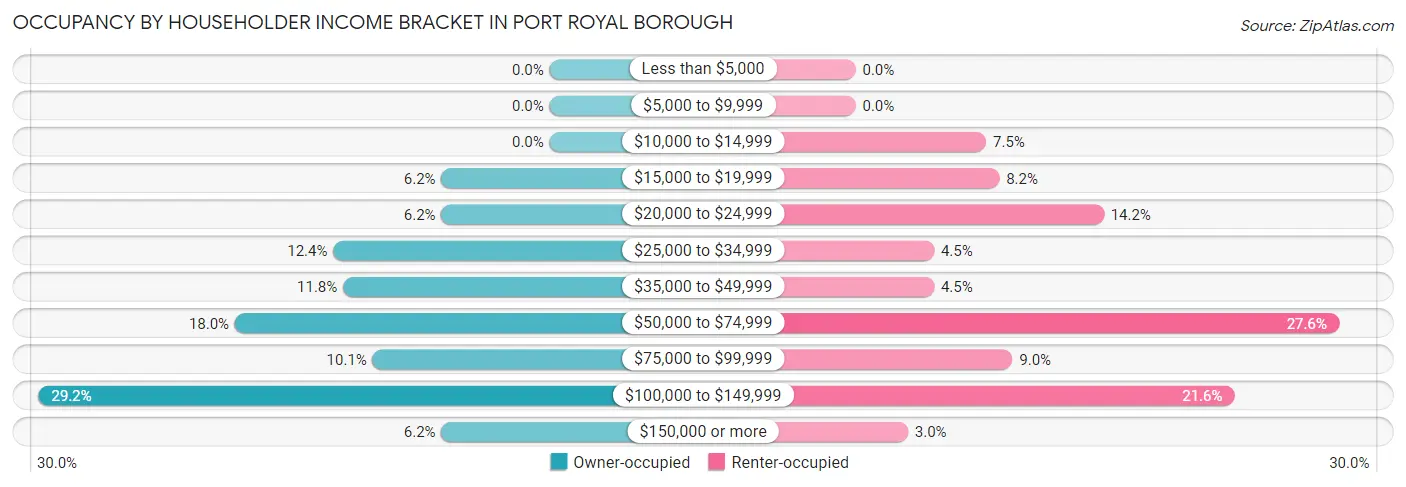
| Income Bracket | Owner-occupied | Renter-occupied |
| Less than $5,000 | 0 (0.0%) | 0 (0.0%) |
| $5,000 to $9,999 | 0 (0.0%) | 0 (0.0%) |
| $10,000 to $14,999 | 0 (0.0%) | 10 (7.5%) |
| $15,000 to $19,999 | 11 (6.2%) | 11 (8.2%) |
| $20,000 to $24,999 | 11 (6.2%) | 19 (14.2%) |
| $25,000 to $34,999 | 22 (12.4%) | 6 (4.5%) |
| $35,000 to $49,999 | 21 (11.8%) | 6 (4.5%) |
| $50,000 to $74,999 | 32 (18.0%) | 37 (27.6%) |
| $75,000 to $99,999 | 18 (10.1%) | 12 (9.0%) |
| $100,000 to $149,999 | 52 (29.2%) | 29 (21.6%) |
| $150,000 or more | 11 (6.2%) | 4 (3.0%) |
| Total | 178 (100.0%) | 134 (100.0%) |
Monthly Housing Cost Tiers in Port Royal borough
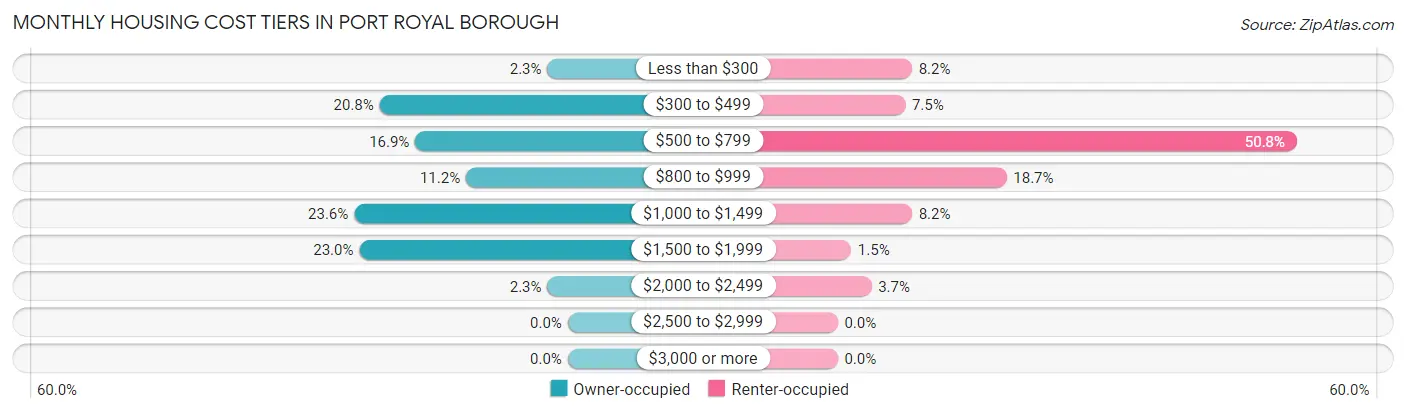
| Monthly Cost | Owner-occupied | Renter-occupied |
| Less than $300 | 4 (2.2%) | 11 (8.2%) |
| $300 to $499 | 37 (20.8%) | 10 (7.5%) |
| $500 to $799 | 30 (16.9%) | 68 (50.7%) |
| $800 to $999 | 20 (11.2%) | 25 (18.7%) |
| $1,000 to $1,499 | 42 (23.6%) | 11 (8.2%) |
| $1,500 to $1,999 | 41 (23.0%) | 2 (1.5%) |
| $2,000 to $2,499 | 4 (2.2%) | 5 (3.7%) |
| $2,500 to $2,999 | 0 (0.0%) | 0 (0.0%) |
| $3,000 or more | 0 (0.0%) | 0 (0.0%) |
| Total | 178 (100.0%) | 134 (100.0%) |
Physical Housing Characteristics in Port Royal borough
Housing Structures in Port Royal borough
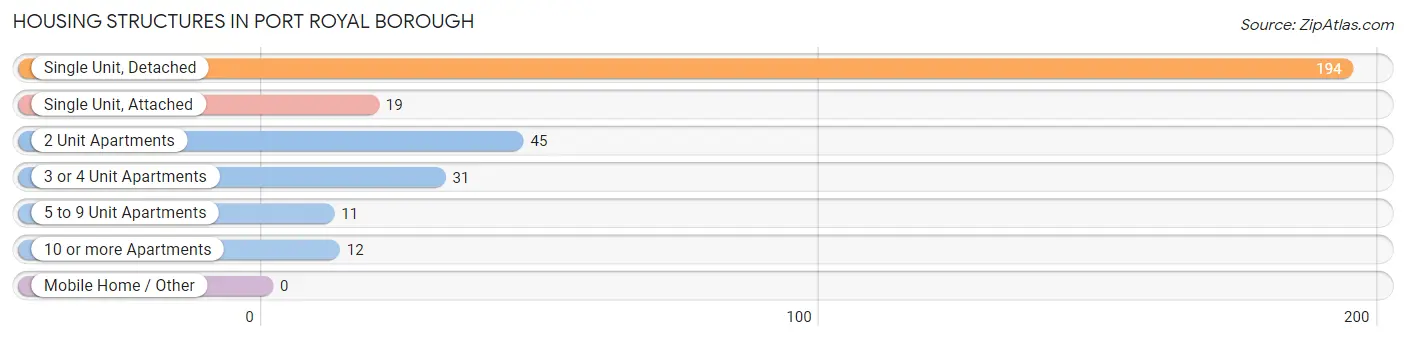
| Structure Type | # Housing Units | % Housing Units |
| Single Unit, Detached | 194 | 62.2% |
| Single Unit, Attached | 19 | 6.1% |
| 2 Unit Apartments | 45 | 14.4% |
| 3 or 4 Unit Apartments | 31 | 9.9% |
| 5 to 9 Unit Apartments | 11 | 3.5% |
| 10 or more Apartments | 12 | 3.8% |
| Mobile Home / Other | 0 | 0.0% |
| Total | 312 | 100.0% |
Housing Structures by Occupancy in Port Royal borough
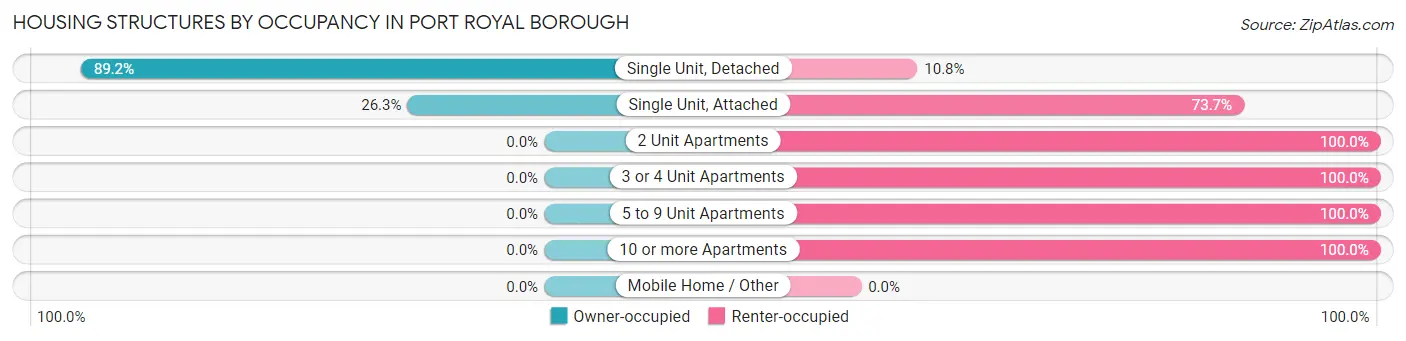
| Structure Type | Owner-occupied | Renter-occupied |
| Single Unit, Detached | 173 (89.2%) | 21 (10.8%) |
| Single Unit, Attached | 5 (26.3%) | 14 (73.7%) |
| 2 Unit Apartments | 0 (0.0%) | 45 (100.0%) |
| 3 or 4 Unit Apartments | 0 (0.0%) | 31 (100.0%) |
| 5 to 9 Unit Apartments | 0 (0.0%) | 11 (100.0%) |
| 10 or more Apartments | 0 (0.0%) | 12 (100.0%) |
| Mobile Home / Other | 0 (0.0%) | 0 (0.0%) |
| Total | 178 (57.1%) | 134 (42.9%) |
Housing Structures by Number of Rooms in Port Royal borough
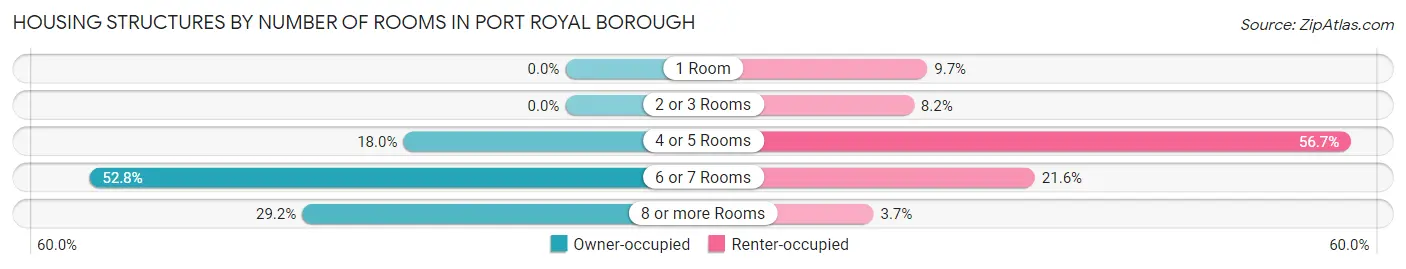
| Number of Rooms | Owner-occupied | Renter-occupied |
| 1 Room | 0 (0.0%) | 13 (9.7%) |
| 2 or 3 Rooms | 0 (0.0%) | 11 (8.2%) |
| 4 or 5 Rooms | 32 (18.0%) | 76 (56.7%) |
| 6 or 7 Rooms | 94 (52.8%) | 29 (21.6%) |
| 8 or more Rooms | 52 (29.2%) | 5 (3.7%) |
| Total | 178 (100.0%) | 134 (100.0%) |
Housing Structure by Heating Type in Port Royal borough
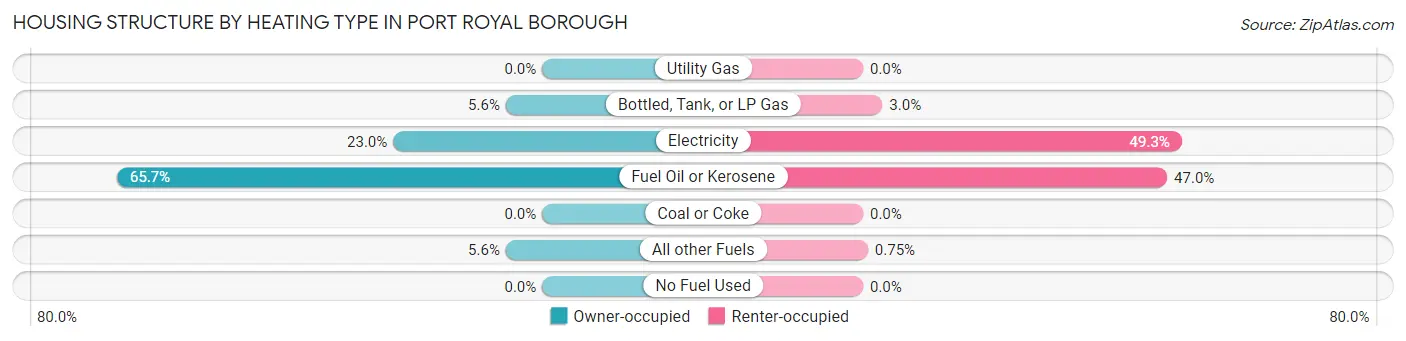
| Heating Type | Owner-occupied | Renter-occupied |
| Utility Gas | 0 (0.0%) | 0 (0.0%) |
| Bottled, Tank, or LP Gas | 10 (5.6%) | 4 (3.0%) |
| Electricity | 41 (23.0%) | 66 (49.2%) |
| Fuel Oil or Kerosene | 117 (65.7%) | 63 (47.0%) |
| Coal or Coke | 0 (0.0%) | 0 (0.0%) |
| All other Fuels | 10 (5.6%) | 1 (0.7%) |
| No Fuel Used | 0 (0.0%) | 0 (0.0%) |
| Total | 178 (100.0%) | 134 (100.0%) |
Household Vehicle Usage in Port Royal borough
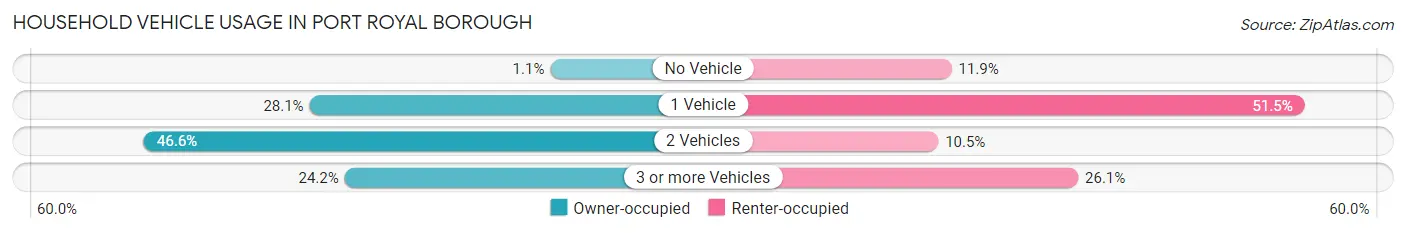
| Vehicles per Household | Owner-occupied | Renter-occupied |
| No Vehicle | 2 (1.1%) | 16 (11.9%) |
| 1 Vehicle | 50 (28.1%) | 69 (51.5%) |
| 2 Vehicles | 83 (46.6%) | 14 (10.4%) |
| 3 or more Vehicles | 43 (24.2%) | 35 (26.1%) |
| Total | 178 (100.0%) | 134 (100.0%) |
Real Estate & Mortgages in Port Royal borough
Real Estate and Mortgage Overview in Port Royal borough
| Characteristic | Without Mortgage | With Mortgage |
| Housing Units | 79 | 99 |
| Median Property Value | $145,200 | $143,800 |
| Median Household Income | $40,625 | $2 |
| Monthly Housing Costs | $493 | $0 |
| Real Estate Taxes | $1,306 | $0 |
Property Value by Mortgage Status in Port Royal borough
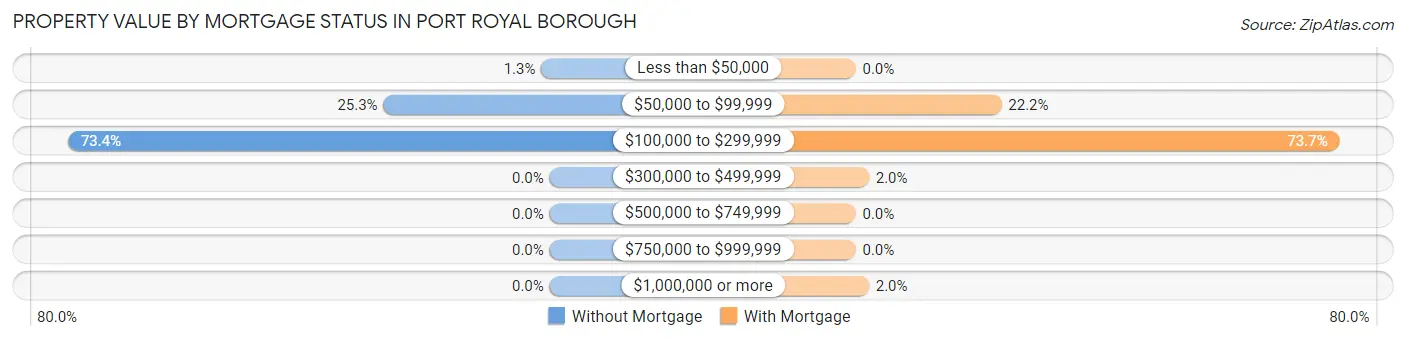
| Property Value | Without Mortgage | With Mortgage |
| Less than $50,000 | 1 (1.3%) | 0 (0.0%) |
| $50,000 to $99,999 | 20 (25.3%) | 22 (22.2%) |
| $100,000 to $299,999 | 58 (73.4%) | 73 (73.7%) |
| $300,000 to $499,999 | 0 (0.0%) | 2 (2.0%) |
| $500,000 to $749,999 | 0 (0.0%) | 0 (0.0%) |
| $750,000 to $999,999 | 0 (0.0%) | 0 (0.0%) |
| $1,000,000 or more | 0 (0.0%) | 2 (2.0%) |
| Total | 79 (100.0%) | 99 (100.0%) |
Household Income by Mortgage Status in Port Royal borough
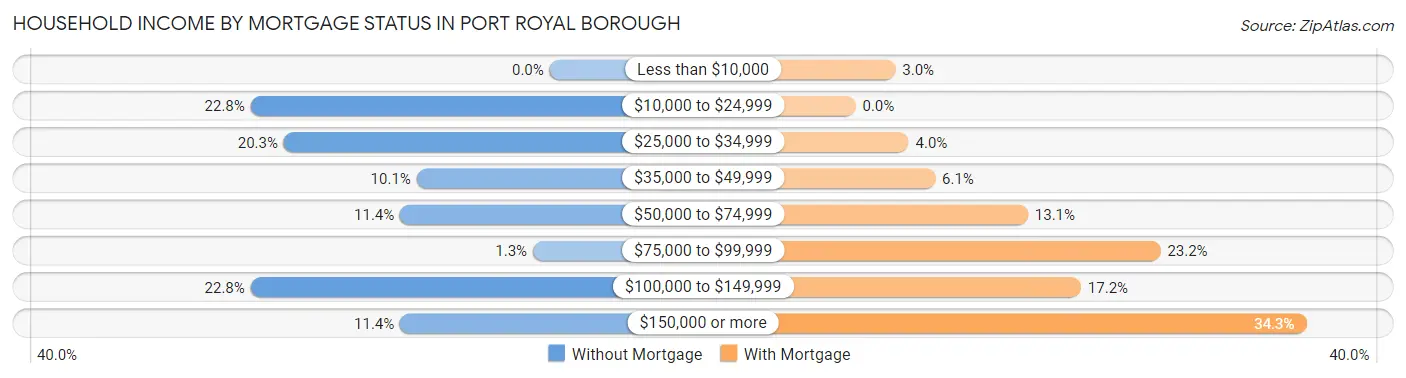
| Household Income | Without Mortgage | With Mortgage |
| Less than $10,000 | 0 (0.0%) | 3 (3.0%) |
| $10,000 to $24,999 | 18 (22.8%) | 0 (0.0%) |
| $25,000 to $34,999 | 16 (20.3%) | 4 (4.0%) |
| $35,000 to $49,999 | 8 (10.1%) | 6 (6.1%) |
| $50,000 to $74,999 | 9 (11.4%) | 13 (13.1%) |
| $75,000 to $99,999 | 1 (1.3%) | 23 (23.2%) |
| $100,000 to $149,999 | 18 (22.8%) | 17 (17.2%) |
| $150,000 or more | 9 (11.4%) | 34 (34.3%) |
| Total | 79 (100.0%) | 99 (100.0%) |
Property Value to Household Income Ratio in Port Royal borough
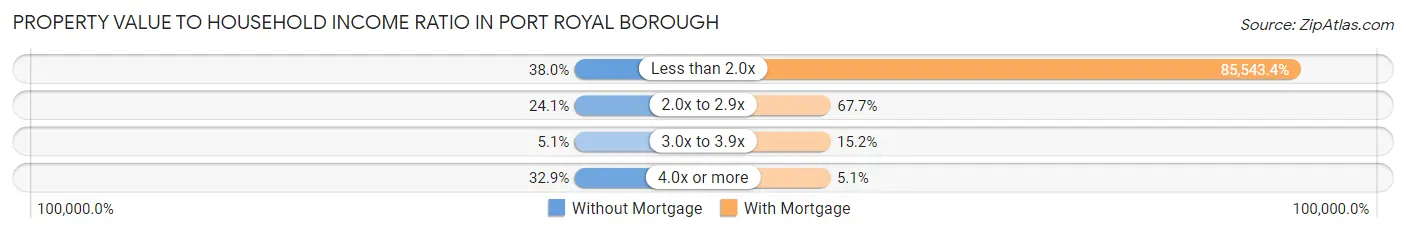
| Value-to-Income Ratio | Without Mortgage | With Mortgage |
| Less than 2.0x | 30 (38.0%) | 84,688 (85,543.4%) |
| 2.0x to 2.9x | 19 (24.0%) | 67 (67.7%) |
| 3.0x to 3.9x | 4 (5.1%) | 15 (15.1%) |
| 4.0x or more | 26 (32.9%) | 5 (5.1%) |
| Total | 79 (100.0%) | 99 (100.0%) |
Real Estate Taxes by Mortgage Status in Port Royal borough
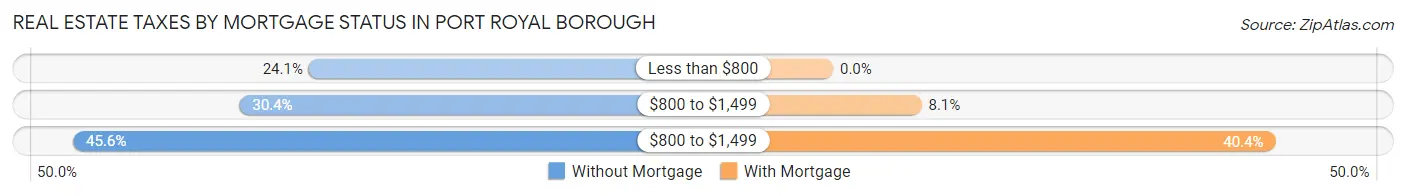
| Property Taxes | Without Mortgage | With Mortgage |
| Less than $800 | 19 (24.0%) | 0 (0.0%) |
| $800 to $1,499 | 24 (30.4%) | 8 (8.1%) |
| $800 to $1,499 | 36 (45.6%) | 40 (40.4%) |
| Total | 79 (100.0%) | 99 (100.0%) |
Health & Disability in Port Royal borough
Health Insurance Coverage by Age in Port Royal borough
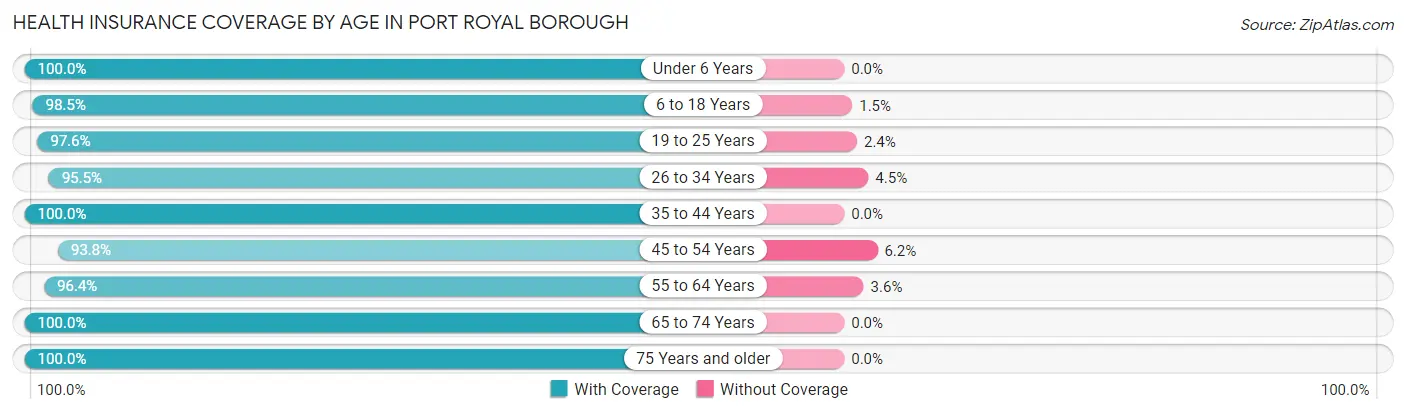
| Age Bracket | With Coverage | Without Coverage |
| Under 6 Years | 53 (100.0%) | 0 (0.0%) |
| 6 to 18 Years | 66 (98.5%) | 1 (1.5%) |
| 19 to 25 Years | 82 (97.6%) | 2 (2.4%) |
| 26 to 34 Years | 106 (95.5%) | 5 (4.5%) |
| 35 to 44 Years | 51 (100.0%) | 0 (0.0%) |
| 45 to 54 Years | 106 (93.8%) | 7 (6.2%) |
| 55 to 64 Years | 80 (96.4%) | 3 (3.6%) |
| 65 to 74 Years | 88 (100.0%) | 0 (0.0%) |
| 75 Years and older | 79 (100.0%) | 0 (0.0%) |
| Total | 711 (97.5%) | 18 (2.5%) |
Health Insurance Coverage by Citizenship Status in Port Royal borough

| Citizenship Status | With Coverage | Without Coverage |
| Native Born | 53 (100.0%) | 0 (0.0%) |
| Foreign Born, Citizen | 66 (98.5%) | 1 (1.5%) |
| Foreign Born, not a Citizen | 82 (97.6%) | 2 (2.4%) |
Health Insurance Coverage by Household Income in Port Royal borough
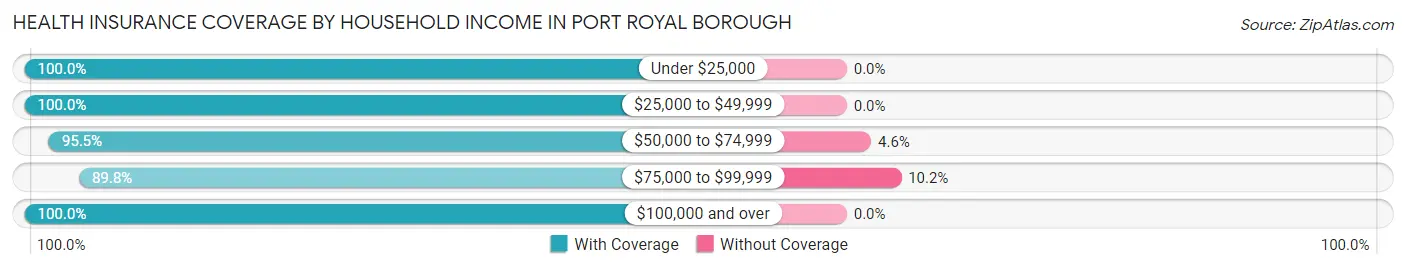
| Household Income | With Coverage | Without Coverage |
| Under $25,000 | 86 (100.0%) | 0 (0.0%) |
| $25,000 to $49,999 | 92 (100.0%) | 0 (0.0%) |
| $50,000 to $74,999 | 147 (95.5%) | 7 (4.5%) |
| $75,000 to $99,999 | 97 (89.8%) | 11 (10.2%) |
| $100,000 and over | 289 (100.0%) | 0 (0.0%) |
Public vs Private Health Insurance Coverage by Age in Port Royal borough
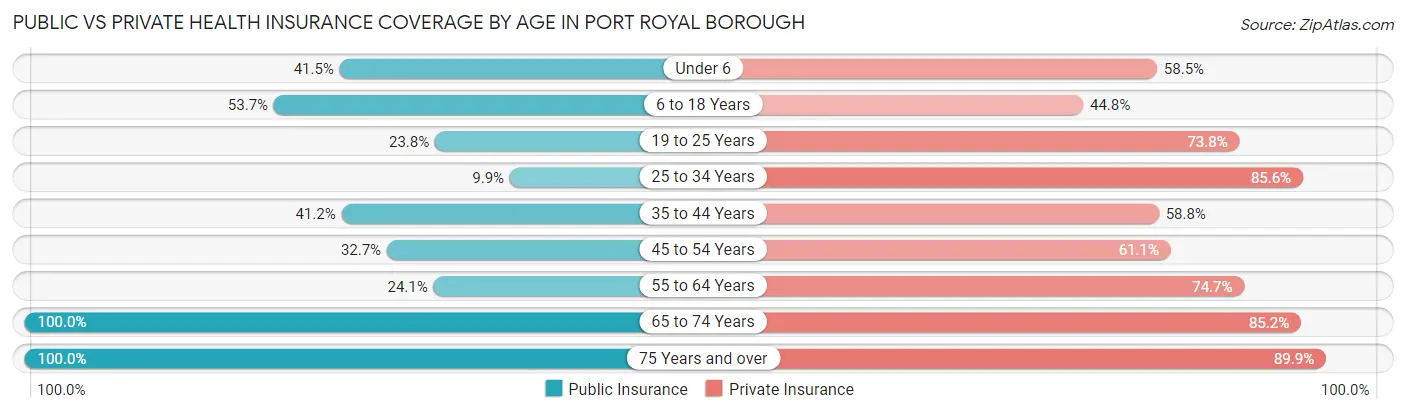
| Age Bracket | Public Insurance | Private Insurance |
| Under 6 | 22 (41.5%) | 31 (58.5%) |
| 6 to 18 Years | 36 (53.7%) | 30 (44.8%) |
| 19 to 25 Years | 20 (23.8%) | 62 (73.8%) |
| 25 to 34 Years | 11 (9.9%) | 95 (85.6%) |
| 35 to 44 Years | 21 (41.2%) | 30 (58.8%) |
| 45 to 54 Years | 37 (32.7%) | 69 (61.1%) |
| 55 to 64 Years | 20 (24.1%) | 62 (74.7%) |
| 65 to 74 Years | 88 (100.0%) | 75 (85.2%) |
| 75 Years and over | 79 (100.0%) | 71 (89.9%) |
| Total | 334 (45.8%) | 525 (72.0%) |
Disability Status by Sex by Age in Port Royal borough
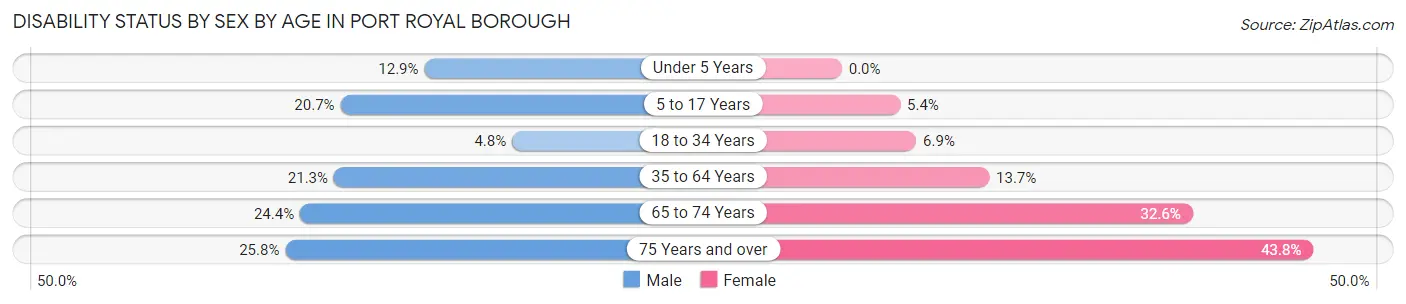
| Age Bracket | Male | Female |
| Under 5 Years | 4 (12.9%) | 0 (0.0%) |
| 5 to 17 Years | 6 (20.7%) | 2 (5.4%) |
| 18 to 34 Years | 4 (4.8%) | 8 (6.9%) |
| 35 to 64 Years | 23 (21.3%) | 19 (13.7%) |
| 65 to 74 Years | 11 (24.4%) | 14 (32.6%) |
| 75 Years and over | 8 (25.8%) | 21 (43.8%) |
Disability Class by Sex by Age in Port Royal borough
Disability Class: Hearing Difficulty
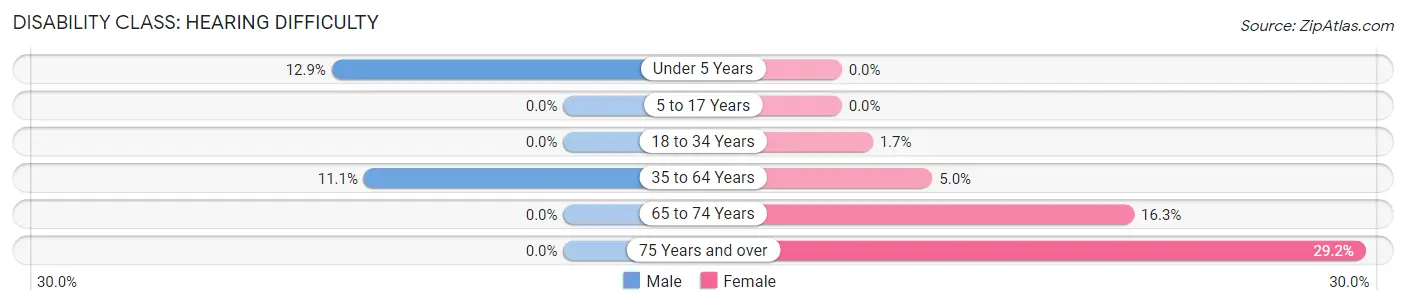
| Age Bracket | Male | Female |
| Under 5 Years | 4 (12.9%) | 0 (0.0%) |
| 5 to 17 Years | 0 (0.0%) | 0 (0.0%) |
| 18 to 34 Years | 0 (0.0%) | 2 (1.7%) |
| 35 to 64 Years | 12 (11.1%) | 7 (5.0%) |
| 65 to 74 Years | 0 (0.0%) | 7 (16.3%) |
| 75 Years and over | 0 (0.0%) | 14 (29.2%) |
Disability Class: Vision Difficulty
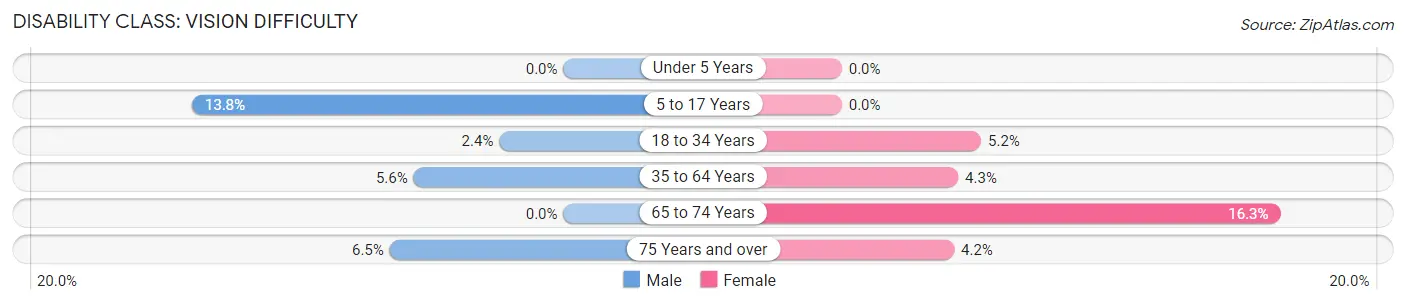
| Age Bracket | Male | Female |
| Under 5 Years | 0 (0.0%) | 0 (0.0%) |
| 5 to 17 Years | 4 (13.8%) | 0 (0.0%) |
| 18 to 34 Years | 2 (2.4%) | 6 (5.2%) |
| 35 to 64 Years | 6 (5.6%) | 6 (4.3%) |
| 65 to 74 Years | 0 (0.0%) | 7 (16.3%) |
| 75 Years and over | 2 (6.5%) | 2 (4.2%) |
Disability Class: Cognitive Difficulty
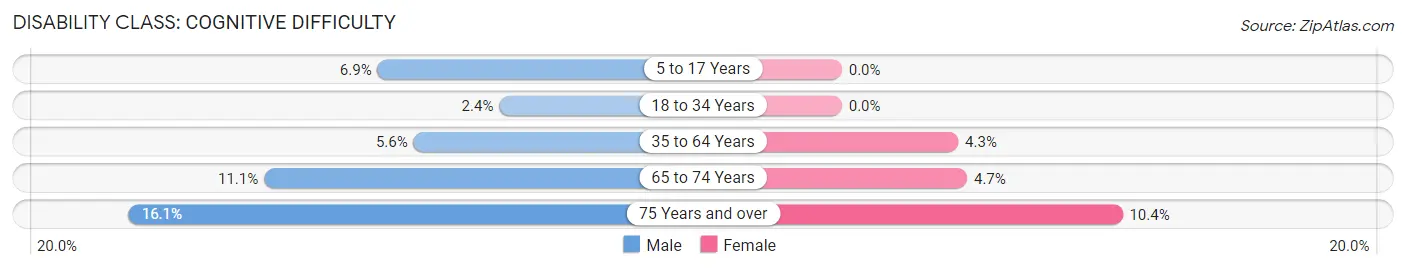
| Age Bracket | Male | Female |
| 5 to 17 Years | 2 (6.9%) | 0 (0.0%) |
| 18 to 34 Years | 2 (2.4%) | 0 (0.0%) |
| 35 to 64 Years | 6 (5.6%) | 6 (4.3%) |
| 65 to 74 Years | 5 (11.1%) | 2 (4.6%) |
| 75 Years and over | 5 (16.1%) | 5 (10.4%) |
Disability Class: Ambulatory Difficulty
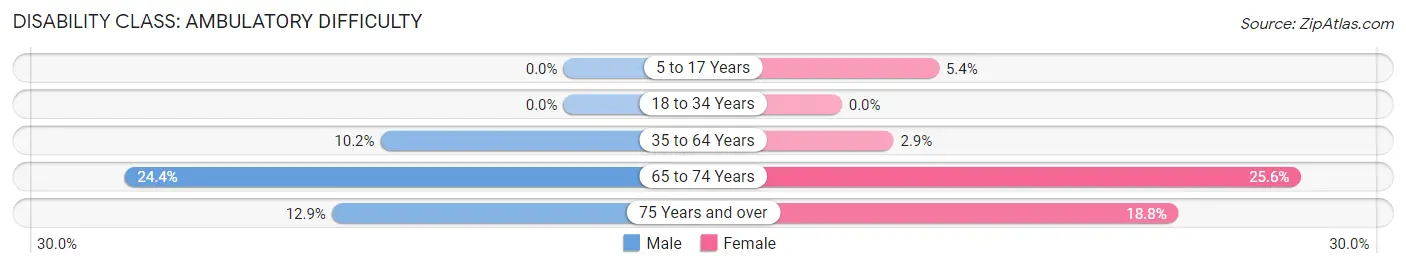
| Age Bracket | Male | Female |
| 5 to 17 Years | 0 (0.0%) | 2 (5.4%) |
| 18 to 34 Years | 0 (0.0%) | 0 (0.0%) |
| 35 to 64 Years | 11 (10.2%) | 4 (2.9%) |
| 65 to 74 Years | 11 (24.4%) | 11 (25.6%) |
| 75 Years and over | 4 (12.9%) | 9 (18.8%) |
Disability Class: Self-Care Difficulty
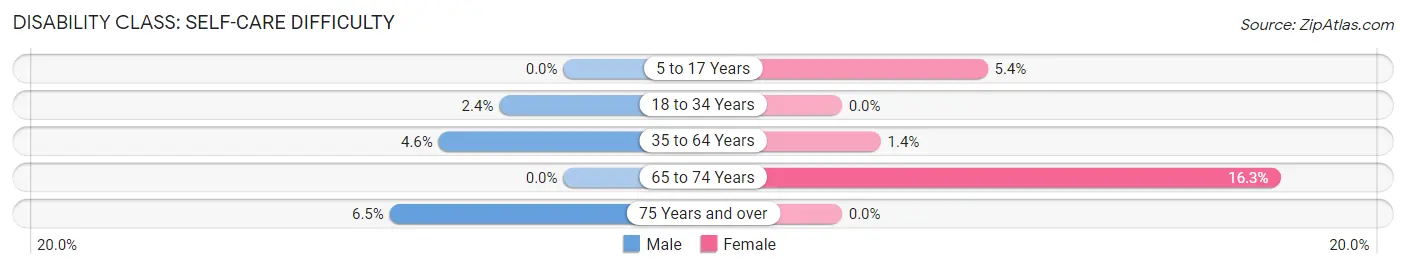
| Age Bracket | Male | Female |
| 5 to 17 Years | 0 (0.0%) | 2 (5.4%) |
| 18 to 34 Years | 2 (2.4%) | 0 (0.0%) |
| 35 to 64 Years | 5 (4.6%) | 2 (1.4%) |
| 65 to 74 Years | 0 (0.0%) | 7 (16.3%) |
| 75 Years and over | 2 (6.5%) | 0 (0.0%) |
Technology Access in Port Royal borough
Computing Device Access in Port Royal borough
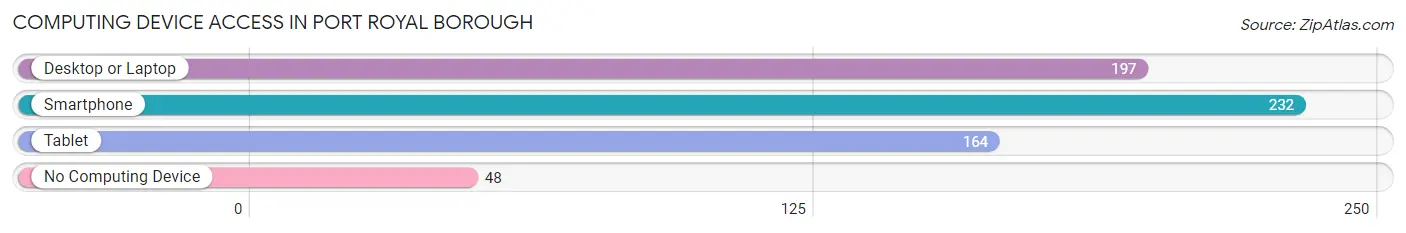
| Device Type | # Households | % Households |
| Desktop or Laptop | 197 | 63.1% |
| Smartphone | 232 | 74.4% |
| Tablet | 164 | 52.6% |
| No Computing Device | 48 | 15.4% |
| Total | 312 | 100.0% |
Internet Access in Port Royal borough
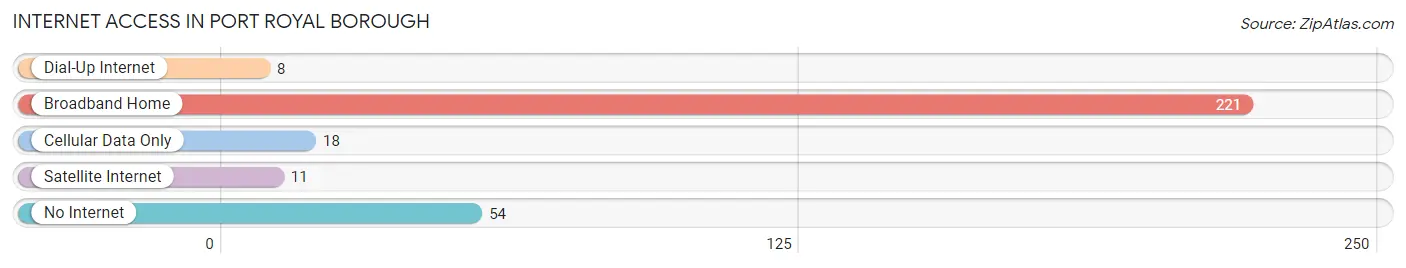
| Internet Type | # Households | % Households |
| Dial-Up Internet | 8 | 2.6% |
| Broadband Home | 221 | 70.8% |
| Cellular Data Only | 18 | 5.8% |
| Satellite Internet | 11 | 3.5% |
| No Internet | 54 | 17.3% |
| Total | 312 | 100.0% |
Port Royal borough Summary
Introduction
Port Royal Borough is a small borough located in Juniata County, Pennsylvania. It is situated along the Juniata River and is part of the Harrisburg-Carlisle Metropolitan Statistical Area. The borough has a population of 1,845 as of the 2010 census. The borough is known for its historic buildings, quaint downtown, and its proximity to the Susquehanna River.
History
Port Royal Borough was founded in 1820 by a group of settlers from the nearby town of Mifflintown. The settlers were looking for a place to build a port on the Juniata River, and they chose the site of present-day Port Royal. The town was named after the British naval port of Port Royal, Jamaica. The town was incorporated in 1832 and was the first borough in Juniata County.
The town grew quickly and by the mid-1800s, it was a bustling port town with a population of over 1,000. The town was home to a variety of businesses, including a flour mill, a sawmill, a tannery, and a distillery. The town was also home to a number of churches, including the First Presbyterian Church, which was founded in 1837.
The town was also home to a number of industries, including a paper mill, a brickyard, and a foundry. The town was also home to a number of schools, including the Port Royal Academy, which was founded in 1845.
The town continued to grow and prosper until the mid-1900s, when the paper mill and other industries began to decline. The town’s population began to decline as well, and by the 2000 census, the population had dropped to 1,845.
Geography
Port Royal Borough is located in Juniata County, Pennsylvania. It is situated along the Juniata River and is part of the Harrisburg-Carlisle Metropolitan Statistical Area. The borough has a total area of 0.7 square miles, all of which is land.
The borough is located in a rural area and is surrounded by farmland. The borough is located near the Susquehanna River, which is a popular destination for fishing and boating. The borough is also located near the Appalachian Trail, which is a popular hiking destination.
Economy
The economy of Port Royal Borough is largely based on agriculture and tourism. The borough is home to a number of farms, which produce a variety of crops, including corn, soybeans, and hay. The borough is also home to a number of tourist attractions, including the historic downtown area, the Susquehanna River, and the Appalachian Trail.
The borough is also home to a number of businesses, including restaurants, retail stores, and professional services. The borough is also home to a number of manufacturing companies, including a paper mill and a foundry.
Demographics
As of the 2010 census, the population of Port Royal Borough was 1,845. The racial makeup of the borough was 97.3% White, 0.7% African American, 0.2% Native American, 0.2% Asian, 0.2% from other races, and 1.6% from two or more races. Hispanic or Latino of any race were 0.7% of the population.
The median household income in the borough was $41,250, and the median family income was $48,750. The per capita income in the borough was $20,945. About 8.3% of families and 10.2% of the population were below the poverty line, including 14.3% of those under age 18 and 8.2% of those age 65 or over.
Conclusion
Port Royal Borough is a small borough located in Juniata County, Pennsylvania. It is situated along the Juniata River and is part of the Harrisburg-Carlisle Metropolitan Statistical Area. The borough has a population of 1,845 as of the 2010 census. The borough is known for its historic buildings, quaint downtown, and its proximity to the Susquehanna River. The economy of the borough is largely based on agriculture and tourism, and the borough is home to a number of businesses, including restaurants, retail stores, and professional services. The racial makeup of the borough is 97.3% White, 0.7% African American, 0.2% Native American, 0.2% Asian, 0.2% from other races, and 1.6% from two or more races. The median household income in the borough was $41,250, and the median family income was $48,750.
Common Questions
What is Per Capita Income in Port Royal borough?
Per Capita income in Port Royal borough is $34,130.
What is the Median Family Income in Port Royal borough?
Median Family Income in Port Royal borough is $85,893.
What is the Median Household income in Port Royal borough?
Median Household Income in Port Royal borough is $60,625.
What is Income or Wage Gap in Port Royal borough?
Income or Wage Gap in Port Royal borough is 45.6%.
Women in Port Royal borough earn 54.4 cents for every dollar earned by a man.
What is Inequality or Gini Index in Port Royal borough?
Inequality or Gini Index in Port Royal borough is 0.38.
What is the Total Population of Port Royal borough?
Total Population of Port Royal borough is 729.
What is the Total Male Population of Port Royal borough?
Total Male Population of Port Royal borough is 328.
What is the Total Female Population of Port Royal borough?
Total Female Population of Port Royal borough is 401.
What is the Ratio of Males per 100 Females in Port Royal borough?
There are 81.80 Males per 100 Females in Port Royal borough.
What is the Ratio of Females per 100 Males in Port Royal borough?
There are 122.26 Females per 100 Males in Port Royal borough.
What is the Median Population Age in Port Royal borough?
Median Population Age in Port Royal borough is 44.3 Years.
What is the Average Family Size in Port Royal borough
Average Family Size in Port Royal borough is 3.0 People.
What is the Average Household Size in Port Royal borough
Average Household Size in Port Royal borough is 2.3 People.
How Large is the Labor Force in Port Royal borough?
There are 427 People in the Labor Forcein in Port Royal borough.
What is the Percentage of People in the Labor Force in Port Royal borough?
67.6% of People are in the Labor Force in Port Royal borough.
What is the Unemployment Rate in Port Royal borough?
Unemployment Rate in Port Royal borough is 1.4%.