Grill, PA Map & Demographics
Grill Map
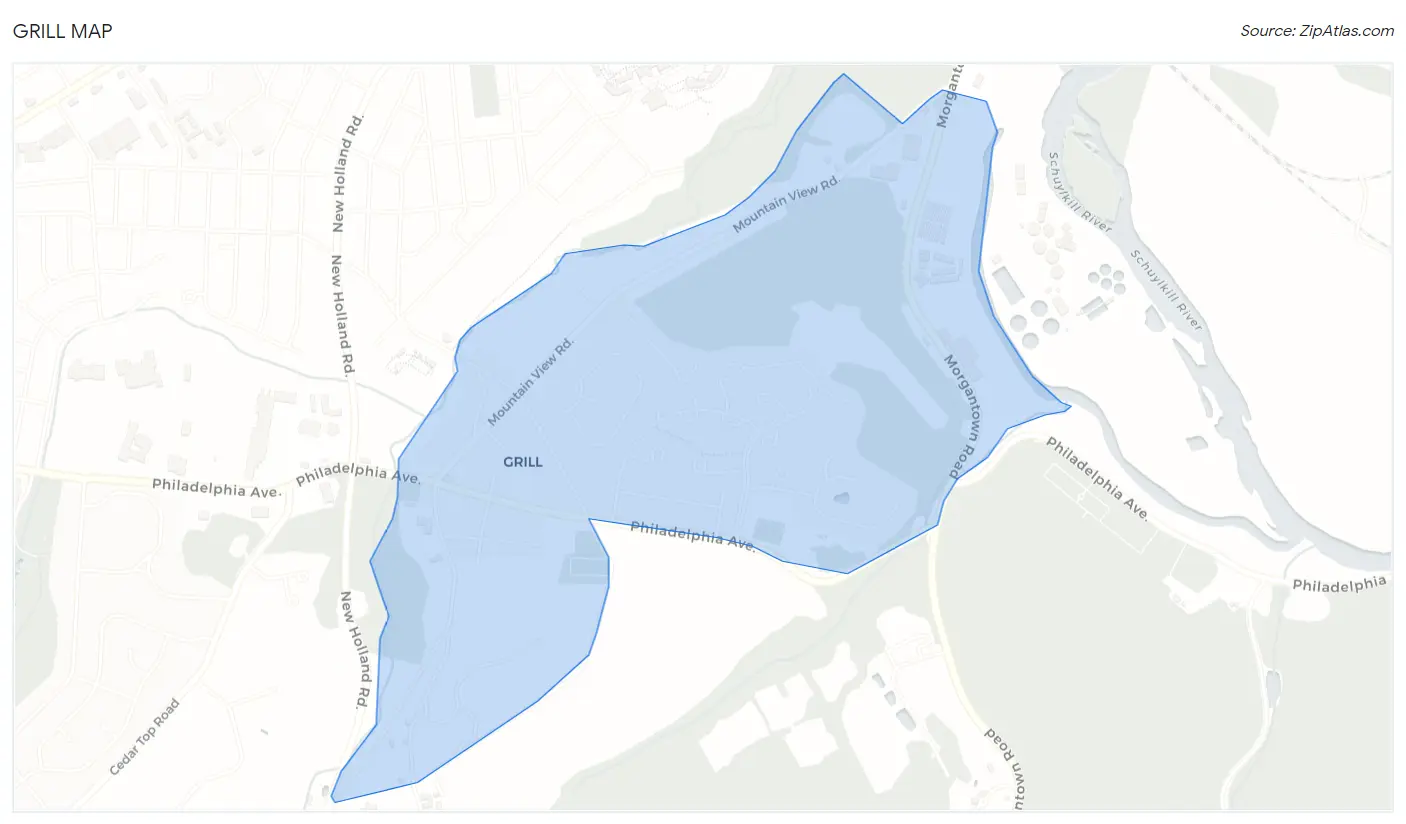
Grill Overview
$44,670
PER CAPITA INCOME
$134,435
AVG FAMILY INCOME
$133,891
AVG HOUSEHOLD INCOME
18.0%
WAGE / INCOME GAP [ % ]
82.0¢/ $1
WAGE / INCOME GAP [ $ ]
0.28
INEQUALITY / GINI INDEX
2,015
TOTAL POPULATION
926
MALE POPULATION
1,089
FEMALE POPULATION
85.03
MALES / 100 FEMALES
117.60
FEMALES / 100 MALES
37.7
MEDIAN AGE
3.4
AVG FAMILY SIZE
3.2
AVG HOUSEHOLD SIZE
1,231
LABOR FORCE [ PEOPLE ]
73.1%
PERCENT IN LABOR FORCE
0.3%
UNEMPLOYMENT RATE
Income in Grill
Income Overview in Grill
Per Capita Income in Grill is $44,670, while median incomes of families and households are $134,435 and $133,891 respectively.
| Characteristic | Number | Measure |
| Per Capita Income | 2,015 | $44,670 |
| Median Family Income | 560 | $134,435 |
| Mean Family Income | 560 | $136,147 |
| Median Household Income | 621 | $133,891 |
| Mean Household Income | 621 | $135,960 |
| Income Deficit | 560 | $0 |
| Wage / Income Gap (%) | 2,015 | 17.97% |
| Wage / Income Gap ($) | 2,015 | 82.03¢ per $1 |
| Gini / Inequality Index | 2,015 | 0.28 |
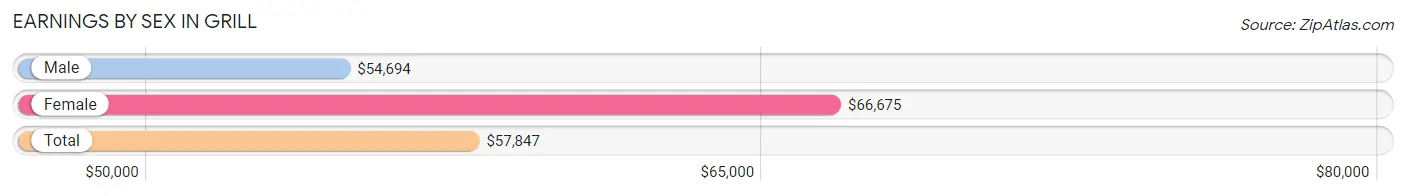
Earnings by Sex in Grill
Average Earnings in Grill are $57,847, $54,694 for men and $66,675 for women, a difference of 18.0%.
| Sex | Number | Average Earnings |
| Male | 532 (42.3%) | $54,694 |
| Female | 725 (57.7%) | $66,675 |
| Total | 1,257 (100.0%) | $57,847 |
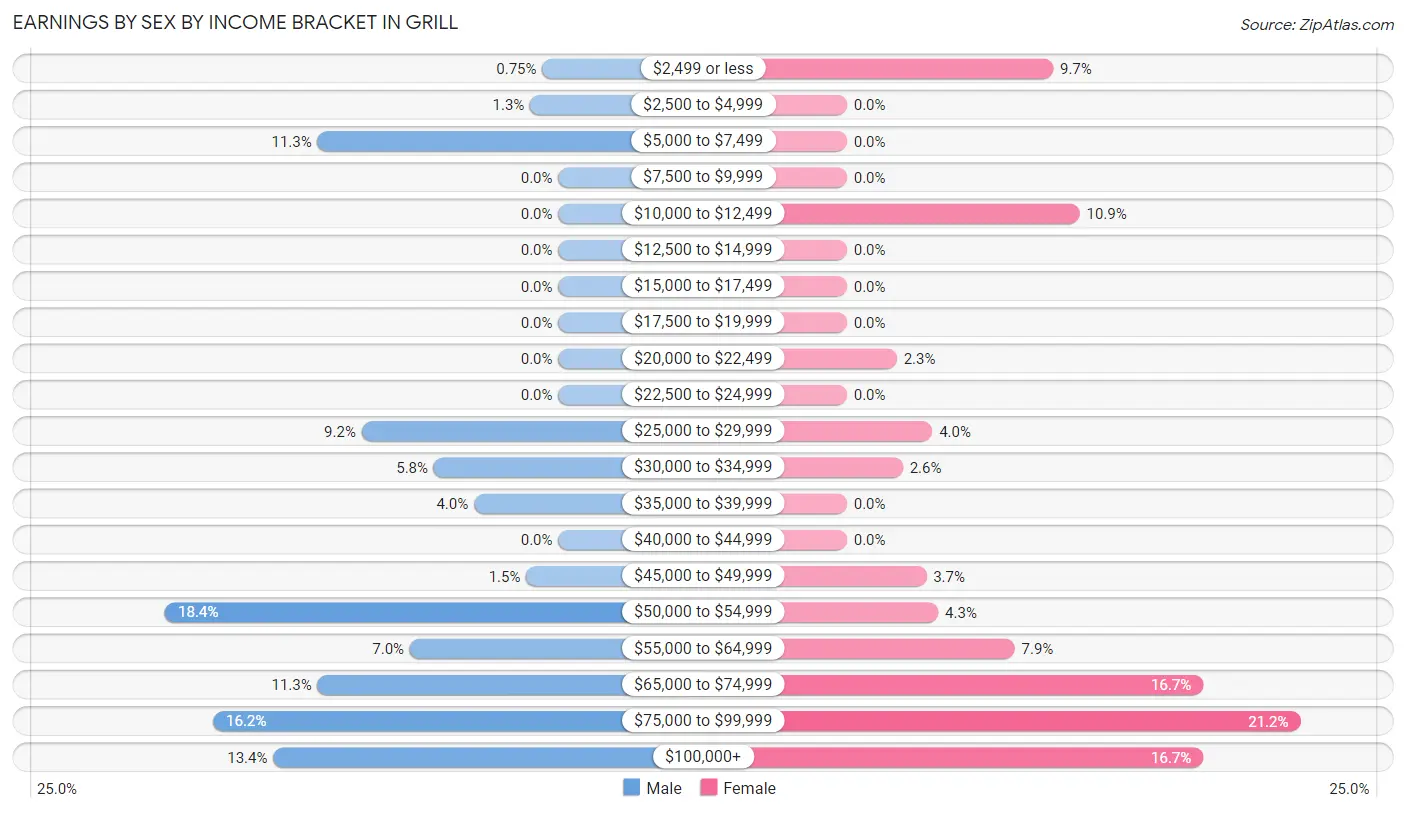
Earnings by Sex by Income Bracket in Grill
The most common earnings brackets in Grill are $50,000 to $54,999 for men (98 | 18.4%) and $75,000 to $99,999 for women (154 | 21.2%).
| Income | Male | Female |
| $2,499 or less | 4 (0.7%) | 70 (9.7%) |
| $2,500 to $4,999 | 7 (1.3%) | 0 (0.0%) |
| $5,000 to $7,499 | 60 (11.3%) | 0 (0.0%) |
| $7,500 to $9,999 | 0 (0.0%) | 0 (0.0%) |
| $10,000 to $12,499 | 0 (0.0%) | 79 (10.9%) |
| $12,500 to $14,999 | 0 (0.0%) | 0 (0.0%) |
| $15,000 to $17,499 | 0 (0.0%) | 0 (0.0%) |
| $17,500 to $19,999 | 0 (0.0%) | 0 (0.0%) |
| $20,000 to $22,499 | 0 (0.0%) | 17 (2.3%) |
| $22,500 to $24,999 | 0 (0.0%) | 0 (0.0%) |
| $25,000 to $29,999 | 49 (9.2%) | 29 (4.0%) |
| $30,000 to $34,999 | 31 (5.8%) | 19 (2.6%) |
| $35,000 to $39,999 | 21 (4.0%) | 0 (0.0%) |
| $40,000 to $44,999 | 0 (0.0%) | 0 (0.0%) |
| $45,000 to $49,999 | 8 (1.5%) | 27 (3.7%) |
| $50,000 to $54,999 | 98 (18.4%) | 31 (4.3%) |
| $55,000 to $64,999 | 37 (7.0%) | 57 (7.9%) |
| $65,000 to $74,999 | 60 (11.3%) | 121 (16.7%) |
| $75,000 to $99,999 | 86 (16.2%) | 154 (21.2%) |
| $100,000+ | 71 (13.4%) | 121 (16.7%) |
| Total | 532 (100.0%) | 725 (100.0%) |
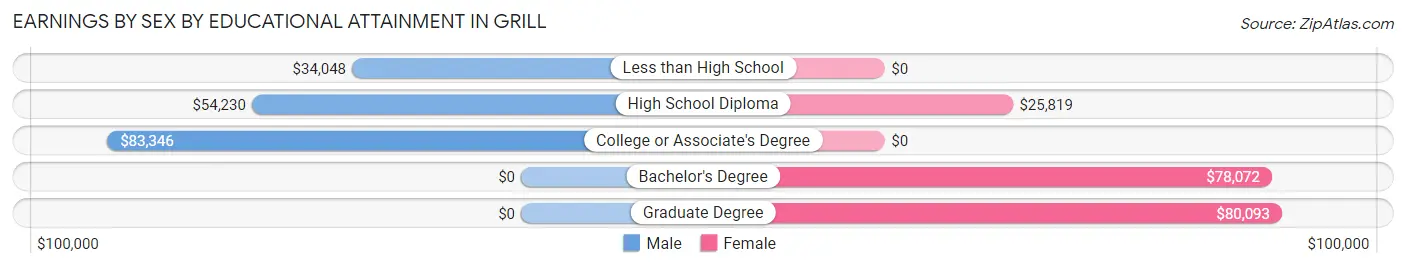
Earnings by Sex by Educational Attainment in Grill
Average earnings in Grill are $57,639 for men and $77,903 for women, a difference of 26.0%. Men with an educational attainment of college or associate's degree enjoy the highest average annual earnings of $83,346, while those with less than high school education earn the least with $34,048. Women with an educational attainment of graduate degree earn the most with the average annual earnings of $80,093, while those with high school diploma education have the smallest earnings of $25,819.
| Educational Attainment | Male Income | Female Income |
| Less than High School | $34,048 | $0 |
| High School Diploma | $54,230 | $25,819 |
| College or Associate's Degree | $83,346 | $0 |
| Bachelor's Degree | - | - |
| Graduate Degree | - | - |
| Total | $57,639 | $77,903 |
Family Income in Grill
Family Income Brackets in Grill
According to the Grill family income data, there are 158 families falling into the $100,000 to $149,999 income range, which is the most common income bracket and makes up 28.2% of all families.
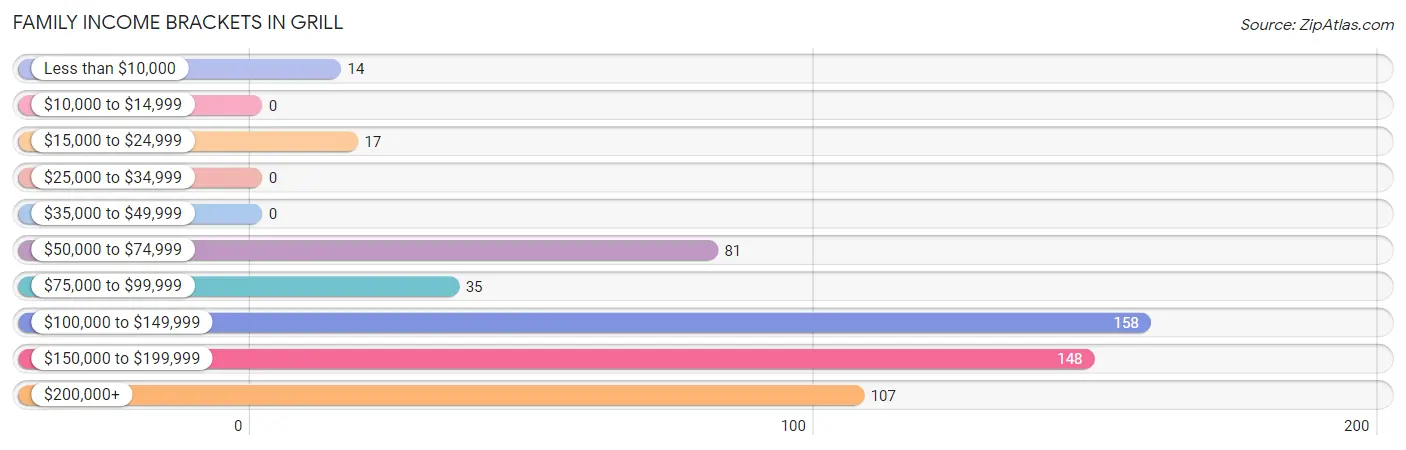
| Income Bracket | # Families | % Families |
| Less than $10,000 | 14 | 2.5% |
| $10,000 to $14,999 | 0 | 0.0% |
| $15,000 to $24,999 | 17 | 3.0% |
| $25,000 to $34,999 | 0 | 0.0% |
| $35,000 to $49,999 | 0 | 0.0% |
| $50,000 to $74,999 | 81 | 14.5% |
| $75,000 to $99,999 | 35 | 6.3% |
| $100,000 to $149,999 | 158 | 28.2% |
| $150,000 to $199,999 | 148 | 26.4% |
| $200,000+ | 107 | 19.1% |
Family Income by Famaliy Size in Grill
3-person families (256 | 45.7%) account for the highest median family income in Grill with $161,056 per family, while 3-person families (256 | 45.7%) have the highest median income of $53,685 per family member.
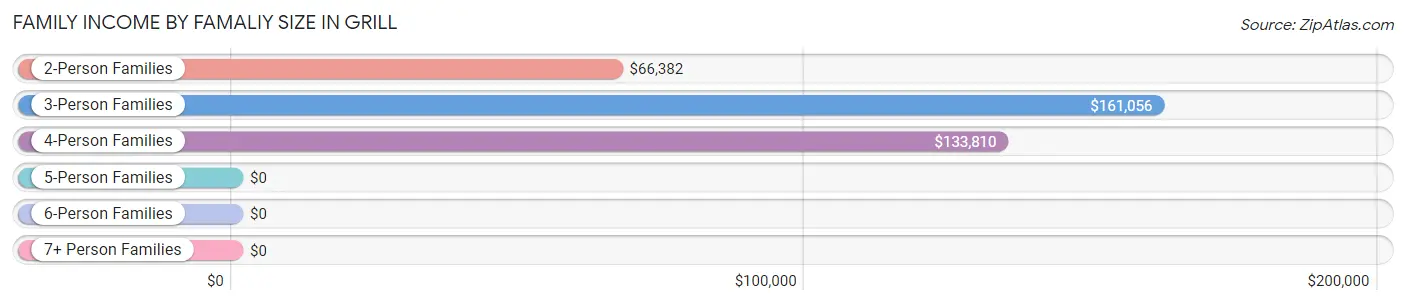
| Income Bracket | # Families | Median Income |
| 2-Person Families | 143 (25.5%) | $66,382 |
| 3-Person Families | 256 (45.7%) | $161,056 |
| 4-Person Families | 81 (14.5%) | $133,810 |
| 5-Person Families | 60 (10.7%) | $0 |
| 6-Person Families | 20 (3.6%) | $0 |
| 7+ Person Families | 0 (0.0%) | $0 |
| Total | 560 (100.0%) | $134,435 |
Family Income by Number of Earners in Grill
The median family income in Grill is $134,435, with families comprising 3+ earners (162) having the highest median family income of $161,162, while families with no earners (51) have the lowest median family income of $51,797, accounting for 28.9% and 9.1% of families, respectively.
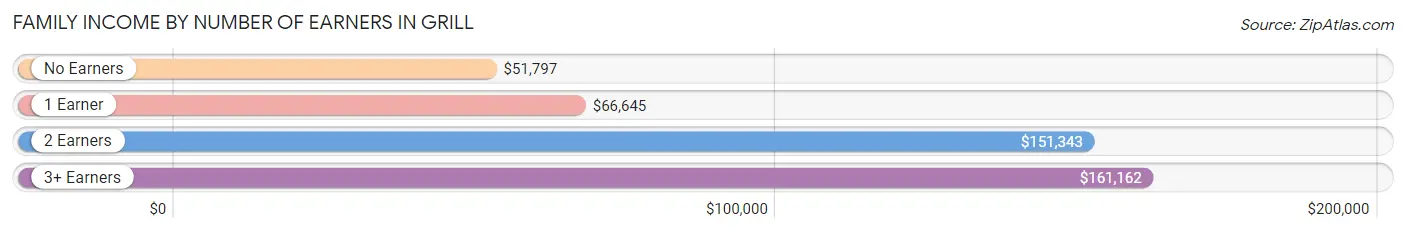
| Number of Earners | # Families | Median Income |
| No Earners | 51 (9.1%) | $51,797 |
| 1 Earner | 123 (22.0%) | $66,645 |
| 2 Earners | 224 (40.0%) | $151,343 |
| 3+ Earners | 162 (28.9%) | $161,162 |
| Total | 560 (100.0%) | $134,435 |
Household Income in Grill
Household Income Brackets in Grill
With 158 households falling in the category, the $100,000 to $149,999 income range is the most frequent in Grill, accounting for 25.4% of all households.
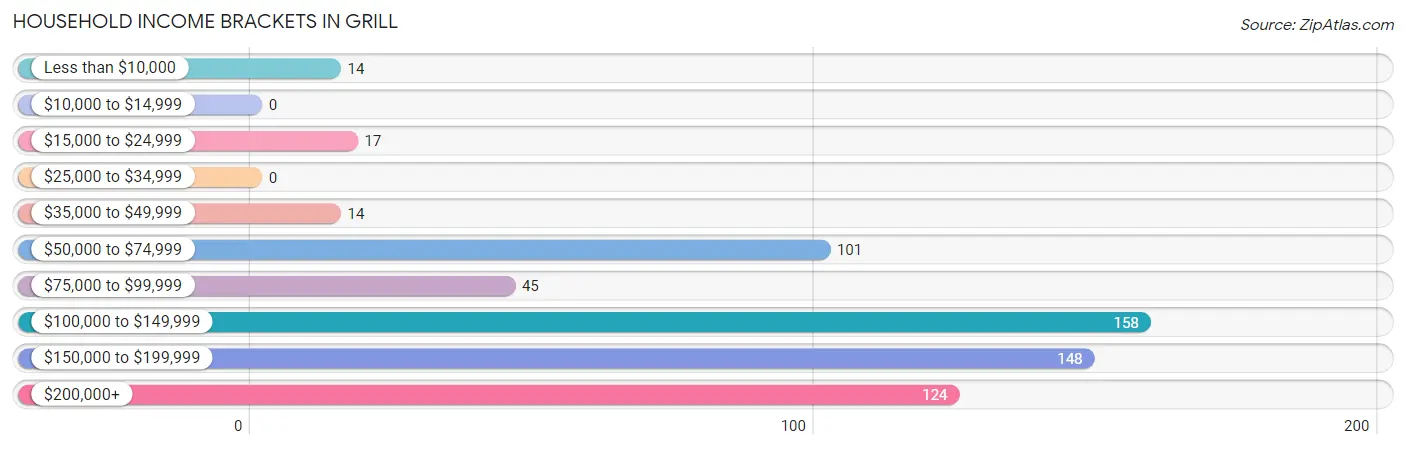
| Income Bracket | # Households | % Households |
| Less than $10,000 | 14 | 2.3% |
| $10,000 to $14,999 | 0 | 0.0% |
| $15,000 to $24,999 | 17 | 2.7% |
| $25,000 to $34,999 | 0 | 0.0% |
| $35,000 to $49,999 | 14 | 2.3% |
| $50,000 to $74,999 | 101 | 16.3% |
| $75,000 to $99,999 | 45 | 7.2% |
| $100,000 to $149,999 | 158 | 25.4% |
| $150,000 to $199,999 | 148 | 23.8% |
| $200,000+ | 124 | 20.0% |
Household Income by Householder Age in Grill
The median household income in Grill is $133,891, with the highest median household income of $160,792 found in the 45 to 64 years age bracket for the primary householder. A total of 209 households (33.7%) fall into this category.
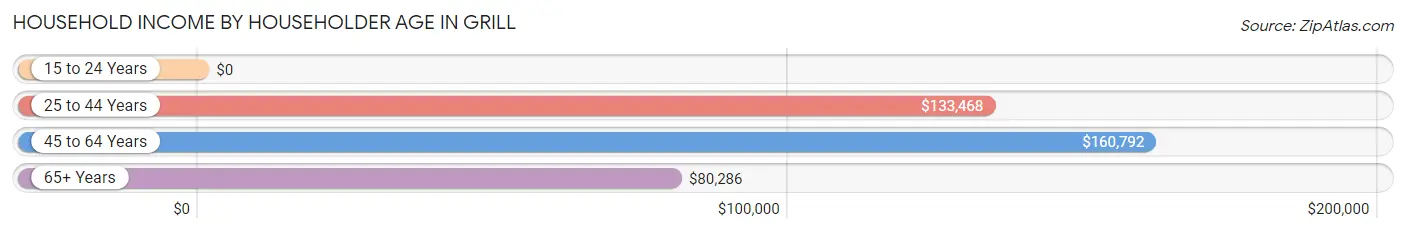
| Income Bracket | # Households | Median Income |
| 15 to 24 Years | 0 (0.0%) | $0 |
| 25 to 44 Years | 258 (41.5%) | $133,468 |
| 45 to 64 Years | 209 (33.7%) | $160,792 |
| 65+ Years | 154 (24.8%) | $80,286 |
| Total | 621 (100.0%) | $133,891 |
Poverty in Grill
Income Below Poverty by Sex and Age in Grill
With 2.5% poverty level for males and 1.5% for females among the residents of Grill, 75 year old and over males and 75 year old and over females are the most vulnerable to poverty, with 14 males (28.6%) and 16 females (31.4%) in their respective age groups living below the poverty level.
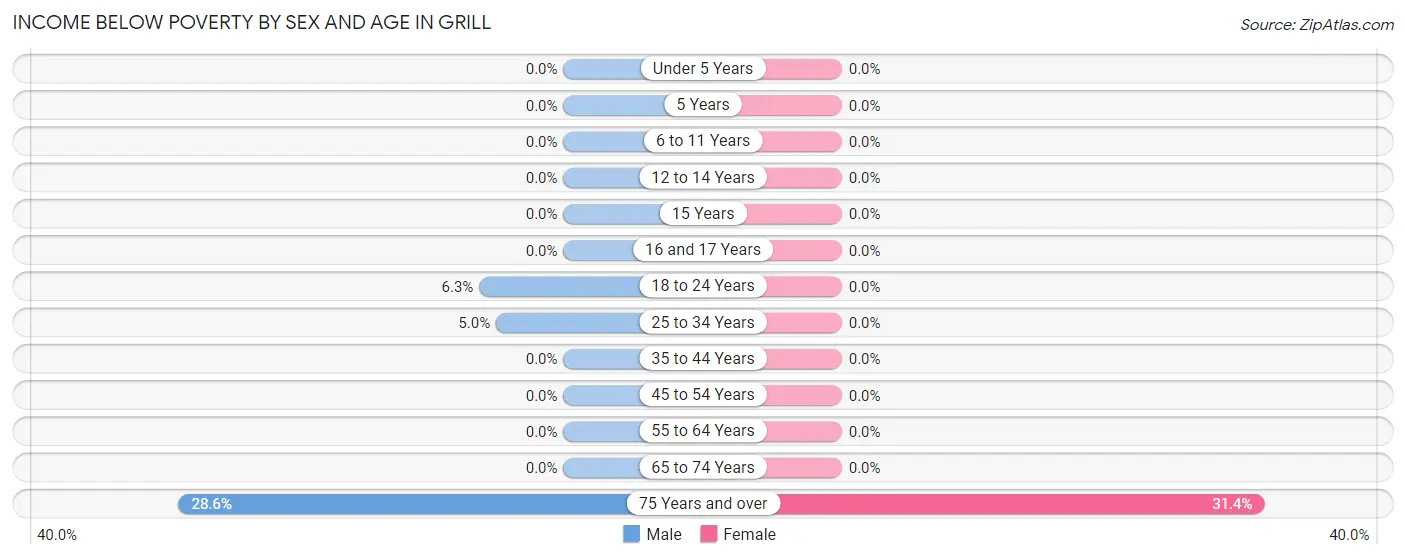
| Age Bracket | Male | Female |
| Under 5 Years | 0 (0.0%) | 0 (0.0%) |
| 5 Years | 0 (0.0%) | 0 (0.0%) |
| 6 to 11 Years | 0 (0.0%) | 0 (0.0%) |
| 12 to 14 Years | 0 (0.0%) | 0 (0.0%) |
| 15 Years | 0 (0.0%) | 0 (0.0%) |
| 16 and 17 Years | 0 (0.0%) | 0 (0.0%) |
| 18 to 24 Years | 4 (6.2%) | 0 (0.0%) |
| 25 to 34 Years | 5 (5.0%) | 0 (0.0%) |
| 35 to 44 Years | 0 (0.0%) | 0 (0.0%) |
| 45 to 54 Years | 0 (0.0%) | 0 (0.0%) |
| 55 to 64 Years | 0 (0.0%) | 0 (0.0%) |
| 65 to 74 Years | 0 (0.0%) | 0 (0.0%) |
| 75 Years and over | 14 (28.6%) | 16 (31.4%) |
| Total | 23 (2.5%) | 16 (1.5%) |
Income Above Poverty by Sex and Age in Grill
According to the poverty statistics in Grill, males aged under 5 years and females aged 6 to 11 years are the age groups that are most secure financially, with 100.0% of males and 100.0% of females in these age groups living above the poverty line.
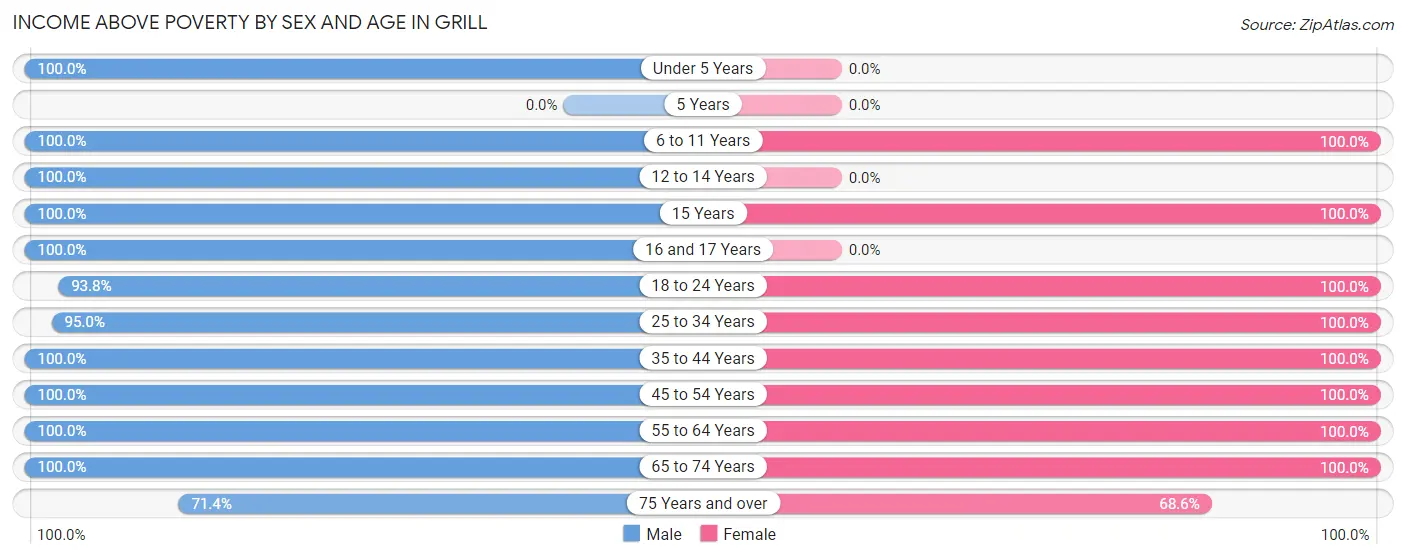
| Age Bracket | Male | Female |
| Under 5 Years | 116 (100.0%) | 0 (0.0%) |
| 5 Years | 0 (0.0%) | 0 (0.0%) |
| 6 to 11 Years | 39 (100.0%) | 17 (100.0%) |
| 12 to 14 Years | 62 (100.0%) | 0 (0.0%) |
| 15 Years | 66 (100.0%) | 31 (100.0%) |
| 16 and 17 Years | 25 (100.0%) | 0 (0.0%) |
| 18 to 24 Years | 60 (93.8%) | 258 (100.0%) |
| 25 to 34 Years | 95 (95.0%) | 108 (100.0%) |
| 35 to 44 Years | 144 (100.0%) | 186 (100.0%) |
| 45 to 54 Years | 167 (100.0%) | 227 (100.0%) |
| 55 to 64 Years | 19 (100.0%) | 51 (100.0%) |
| 65 to 74 Years | 75 (100.0%) | 160 (100.0%) |
| 75 Years and over | 35 (71.4%) | 35 (68.6%) |
| Total | 903 (97.5%) | 1,073 (98.5%) |
Income Below Poverty Among Married-Couple Families in Grill
The poverty statistics for married-couple families in Grill show that 3.0% or 14 of the total 464 families live below the poverty line. Families with no children have the highest poverty rate of 5.3%, comprising of 14 families. On the other hand, families with 1 or 2 children have the lowest poverty rate of 0.0%, which includes 0 families.
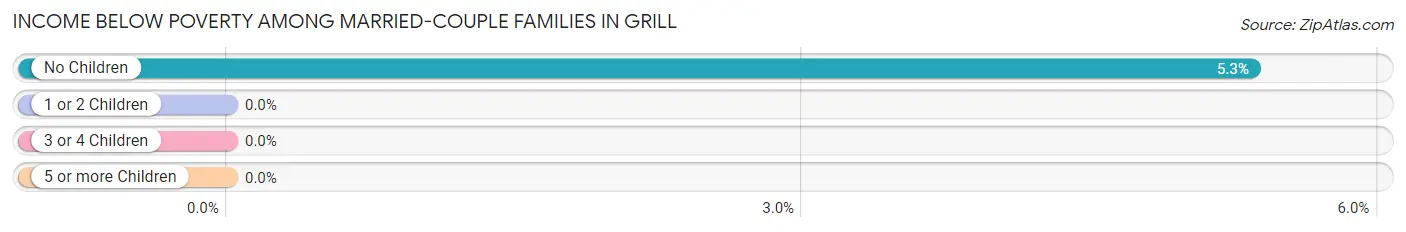
| Children | Above Poverty | Below Poverty |
| No Children | 248 (94.7%) | 14 (5.3%) |
| 1 or 2 Children | 202 (100.0%) | 0 (0.0%) |
| 3 or 4 Children | 0 (0.0%) | 0 (0.0%) |
| 5 or more Children | 0 (0.0%) | 0 (0.0%) |
| Total | 450 (97.0%) | 14 (3.0%) |
Income Below Poverty Among Single-Parent Households in Grill
| Children | Single Father | Single Mother |
| No Children | 0 (0.0%) | 0 (0.0%) |
| 1 or 2 Children | 0 (0.0%) | 0 (0.0%) |
| 3 or 4 Children | 0 (0.0%) | 0 (0.0%) |
| 5 or more Children | 0 (0.0%) | 0 (0.0%) |
| Total | 0 (0.0%) | 0 (0.0%) |
Income Below Poverty Among Married-Couple vs Single-Parent Households in Grill
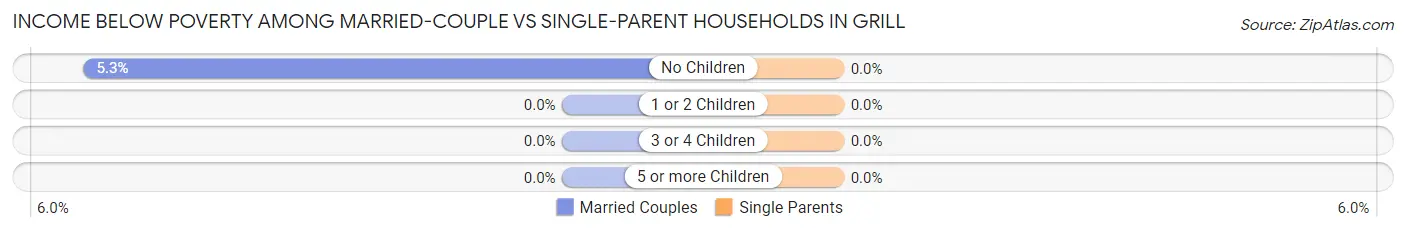
| Children | Married-Couple Families | Single-Parent Households |
| No Children | 14 (5.3%) | 0 (0.0%) |
| 1 or 2 Children | 0 (0.0%) | 0 (0.0%) |
| 3 or 4 Children | 0 (0.0%) | 0 (0.0%) |
| 5 or more Children | 0 (0.0%) | 0 (0.0%) |
| Total | 14 (3.0%) | 0 (0.0%) |
Race in Grill
The most populous races in Grill are White / Caucasian (1,693 | 84.0%), Hispanic or Latino (219 | 10.9%), and Two or more Races (138 | 6.9%).
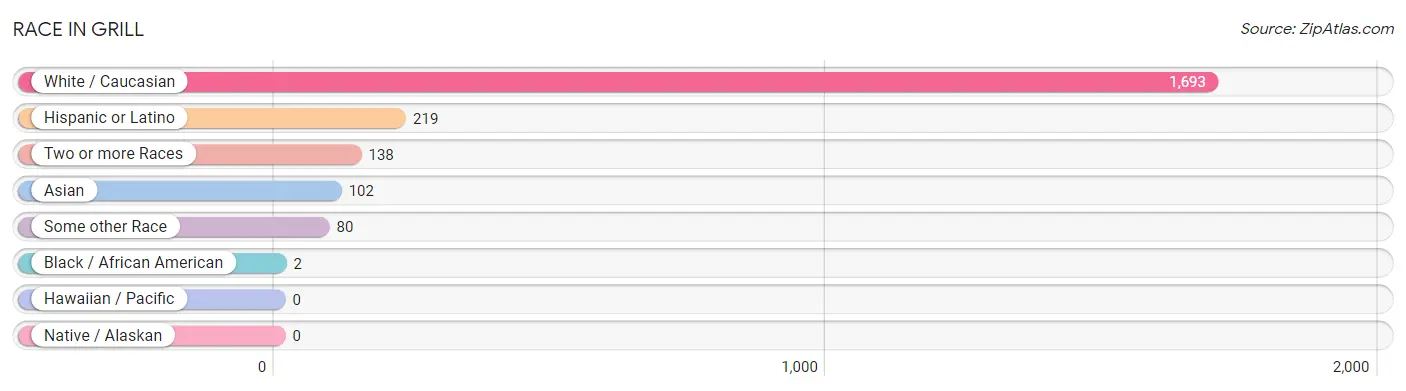
| Race | # Population | % Population |
| Asian | 102 | 5.1% |
| Black / African American | 2 | 0.1% |
| Hawaiian / Pacific | 0 | 0.0% |
| Hispanic or Latino | 219 | 10.9% |
| Native / Alaskan | 0 | 0.0% |
| White / Caucasian | 1,693 | 84.0% |
| Two or more Races | 138 | 6.9% |
| Some other Race | 80 | 4.0% |
| Total | 2,015 | 100.0% |
Ancestry in Grill
The most populous ancestries reported in Grill are German (613 | 30.4%), Irish (344 | 17.1%), Italian (232 | 11.5%), Swiss (186 | 9.2%), and Puerto Rican (135 | 6.7%), together accounting for 74.9% of all Grill residents.
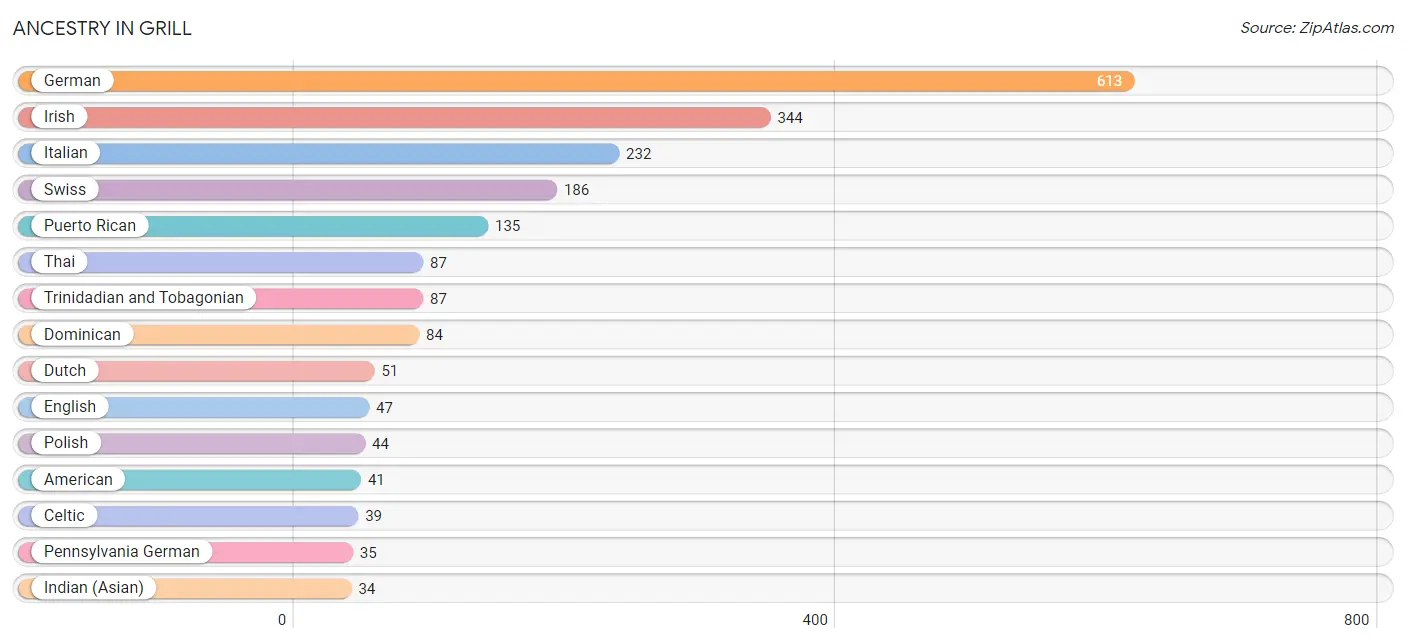
| Ancestry | # Population | % Population |
| American | 41 | 2.0% |
| Celtic | 39 | 1.9% |
| Dominican | 84 | 4.2% |
| Dutch | 51 | 2.5% |
| Eastern European | 7 | 0.4% |
| English | 47 | 2.3% |
| French | 16 | 0.8% |
| French Canadian | 15 | 0.7% |
| German | 613 | 30.4% |
| Indian (Asian) | 34 | 1.7% |
| Irish | 344 | 17.1% |
| Italian | 232 | 11.5% |
| Pennsylvania German | 35 | 1.7% |
| Polish | 44 | 2.2% |
| Puerto Rican | 135 | 6.7% |
| Slovak | 22 | 1.1% |
| Swiss | 186 | 9.2% |
| Thai | 87 | 4.3% |
| Trinidadian and Tobagonian | 87 | 4.3% |
| Ukrainian | 15 | 0.7% |
| Welsh | 16 | 0.8% | View All 21 Rows |
Immigrants in Grill
The most numerous immigrant groups reported in Grill came from Canada (68 | 3.4%), Caribbean (21 | 1.0%), Dominican Republic (21 | 1.0%), Latin America (21 | 1.0%), and Asia (17 | 0.8%), together accounting for 7.3% of all Grill residents.
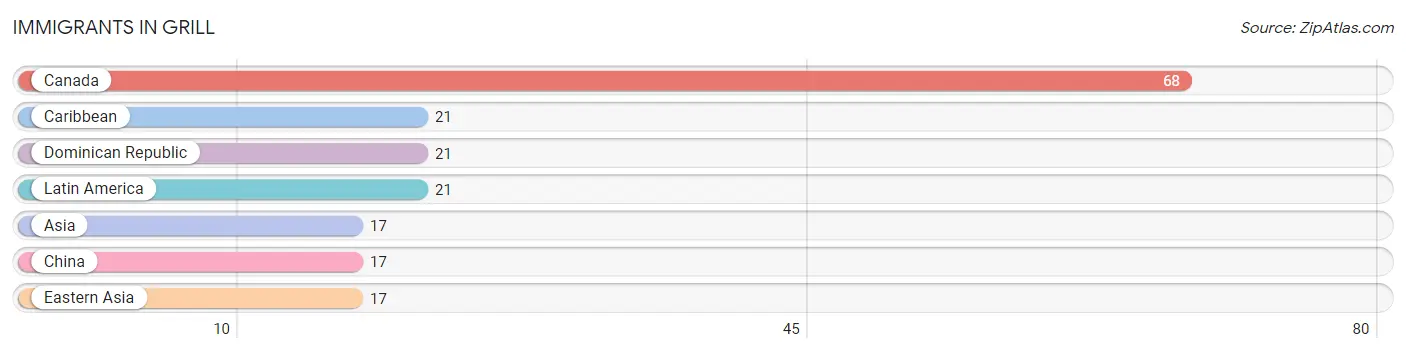
| Immigration Origin | # Population | % Population |
| Asia | 17 | 0.8% |
| Canada | 68 | 3.4% |
| Caribbean | 21 | 1.0% |
| China | 17 | 0.8% |
| Dominican Republic | 21 | 1.0% |
| Eastern Asia | 17 | 0.8% |
| Latin America | 21 | 1.0% | View All 7 Rows |
Sex and Age in Grill
Sex and Age in Grill
The most populous age groups in Grill are 15 to 19 Years (151 | 16.3%) for men and 20 to 24 Years (165 | 15.1%) for women.
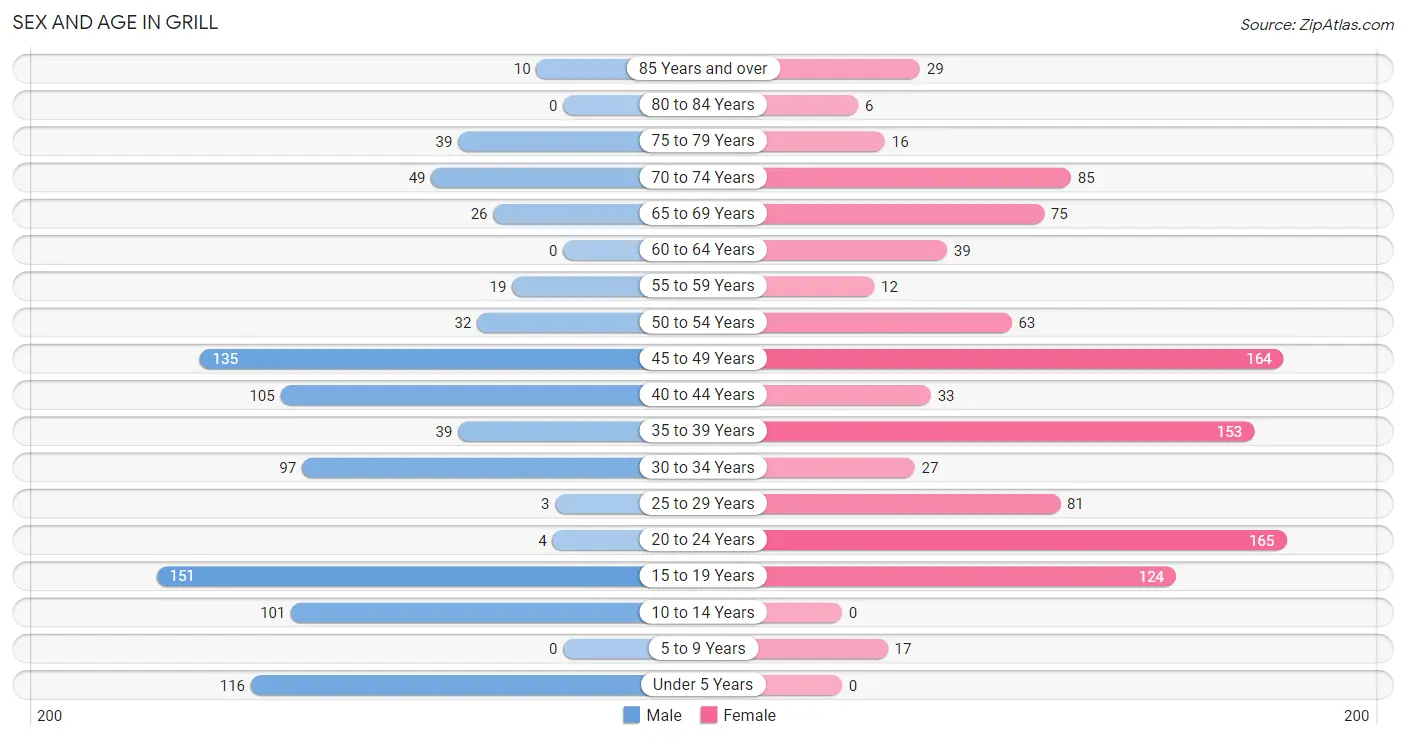
| Age Bracket | Male | Female |
| Under 5 Years | 116 (12.5%) | 0 (0.0%) |
| 5 to 9 Years | 0 (0.0%) | 17 (1.6%) |
| 10 to 14 Years | 101 (10.9%) | 0 (0.0%) |
| 15 to 19 Years | 151 (16.3%) | 124 (11.4%) |
| 20 to 24 Years | 4 (0.4%) | 165 (15.1%) |
| 25 to 29 Years | 3 (0.3%) | 81 (7.4%) |
| 30 to 34 Years | 97 (10.5%) | 27 (2.5%) |
| 35 to 39 Years | 39 (4.2%) | 153 (14.1%) |
| 40 to 44 Years | 105 (11.3%) | 33 (3.0%) |
| 45 to 49 Years | 135 (14.6%) | 164 (15.1%) |
| 50 to 54 Years | 32 (3.5%) | 63 (5.8%) |
| 55 to 59 Years | 19 (2.1%) | 12 (1.1%) |
| 60 to 64 Years | 0 (0.0%) | 39 (3.6%) |
| 65 to 69 Years | 26 (2.8%) | 75 (6.9%) |
| 70 to 74 Years | 49 (5.3%) | 85 (7.8%) |
| 75 to 79 Years | 39 (4.2%) | 16 (1.5%) |
| 80 to 84 Years | 0 (0.0%) | 6 (0.5%) |
| 85 Years and over | 10 (1.1%) | 29 (2.7%) |
| Total | 926 (100.0%) | 1,089 (100.0%) |
Families and Households in Grill
Median Family Size in Grill
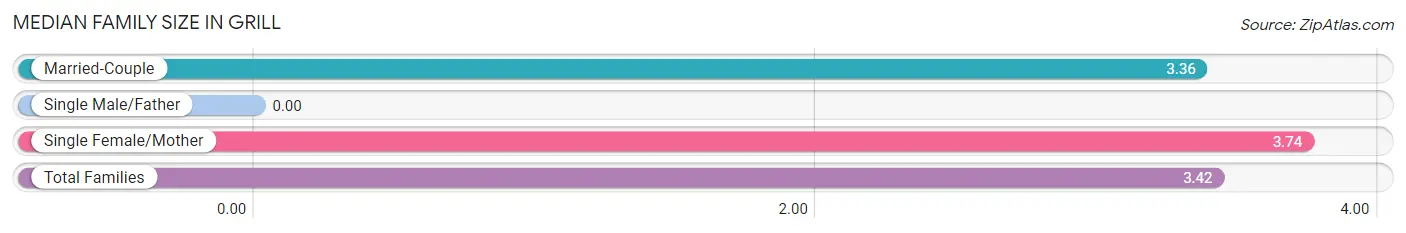
| Family Type | # Families | Family Size |
| Married-Couple | 464 (82.9%) | 3.36 |
| Single Male/Father | 0 (0.0%) | - |
| Single Female/Mother | 96 (17.1%) | 3.74 |
| Total Families | 560 (100.0%) | 3.42 |
Median Household Size in Grill
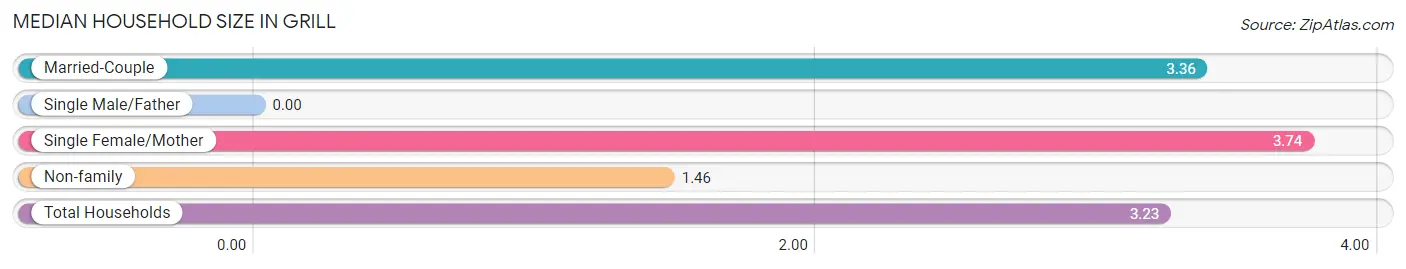
| Household Type | # Households | Household Size |
| Married-Couple | 464 (74.7%) | 3.36 |
| Single Male/Father | 0 (0.0%) | - |
| Single Female/Mother | 96 (15.5%) | 3.74 |
| Non-family | 61 (9.8%) | 1.46 |
| Total Households | 621 (100.0%) | 3.23 |
Household Size by Marriage Status in Grill
Out of a total of 621 households in Grill, 560 (90.2%) are family households, while 61 (9.8%) are nonfamily households. The most numerous type of family households are 3-person households, comprising 256, and the most common type of nonfamily households are 1-person households, comprising 34.
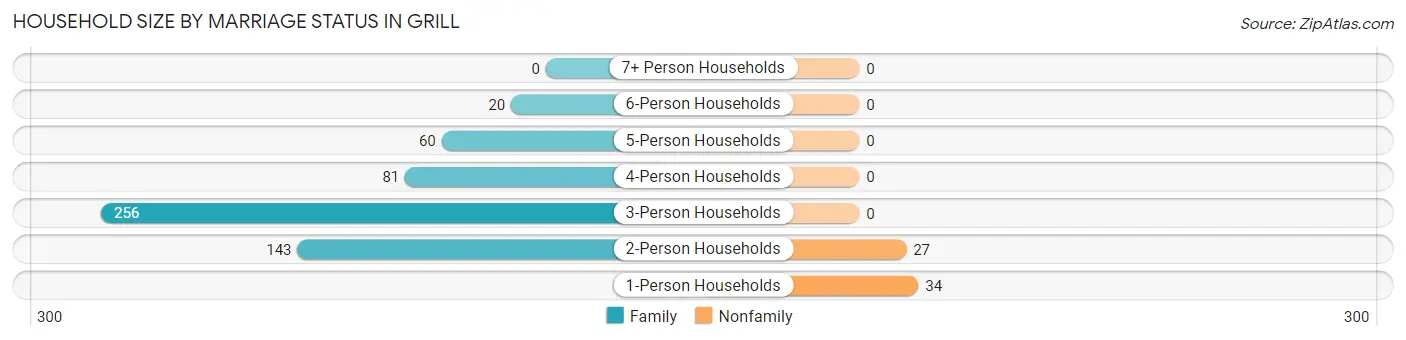
| Household Size | Family Households | Nonfamily Households |
| 1-Person Households | - | 34 (5.5%) |
| 2-Person Households | 143 (23.0%) | 27 (4.3%) |
| 3-Person Households | 256 (41.2%) | 0 (0.0%) |
| 4-Person Households | 81 (13.0%) | 0 (0.0%) |
| 5-Person Households | 60 (9.7%) | 0 (0.0%) |
| 6-Person Households | 20 (3.2%) | 0 (0.0%) |
| 7+ Person Households | 0 (0.0%) | 0 (0.0%) |
| Total | 560 (90.2%) | 61 (9.8%) |
Female Fertility in Grill
Fertility by Age in Grill
Average fertility rate in Grill is 114.0 births per 1,000 women. Women in the age bracket of 20 to 34 years have the highest fertility rate with 311.0 births per 1,000 women. Women in the age bracket of 20 to 34 years acount for 100.0% of all women with births.
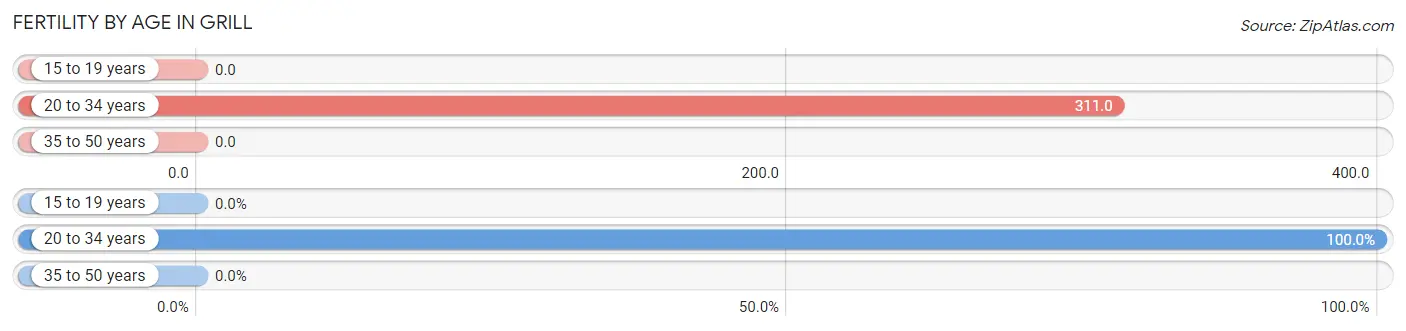
| Age Bracket | Women with Births | Births / 1,000 Women |
| 15 to 19 years | 0 (0.0%) | 0.0 |
| 20 to 34 years | 85 (100.0%) | 311.0 |
| 35 to 50 years | 0 (0.0%) | 0.0 |
| Total | 85 (100.0%) | 114.0 |
Fertility by Age by Marriage Status in Grill
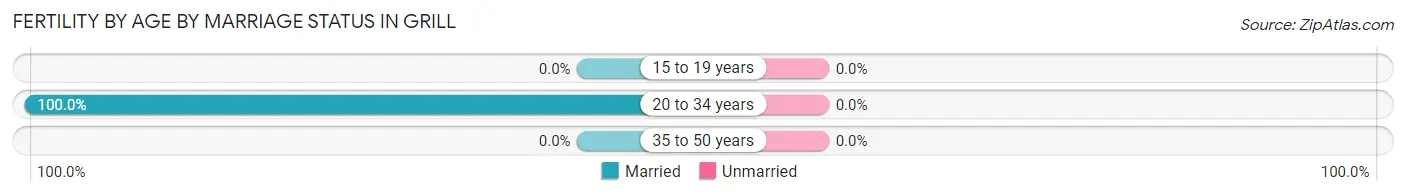
| Age Bracket | Married | Unmarried |
| 15 to 19 years | 0 (0.0%) | 0 (0.0%) |
| 20 to 34 years | 85 (100.0%) | 0 (0.0%) |
| 35 to 50 years | 0 (0.0%) | 0 (0.0%) |
| Total | 85 (100.0%) | 0 (0.0%) |
Fertility by Education in Grill
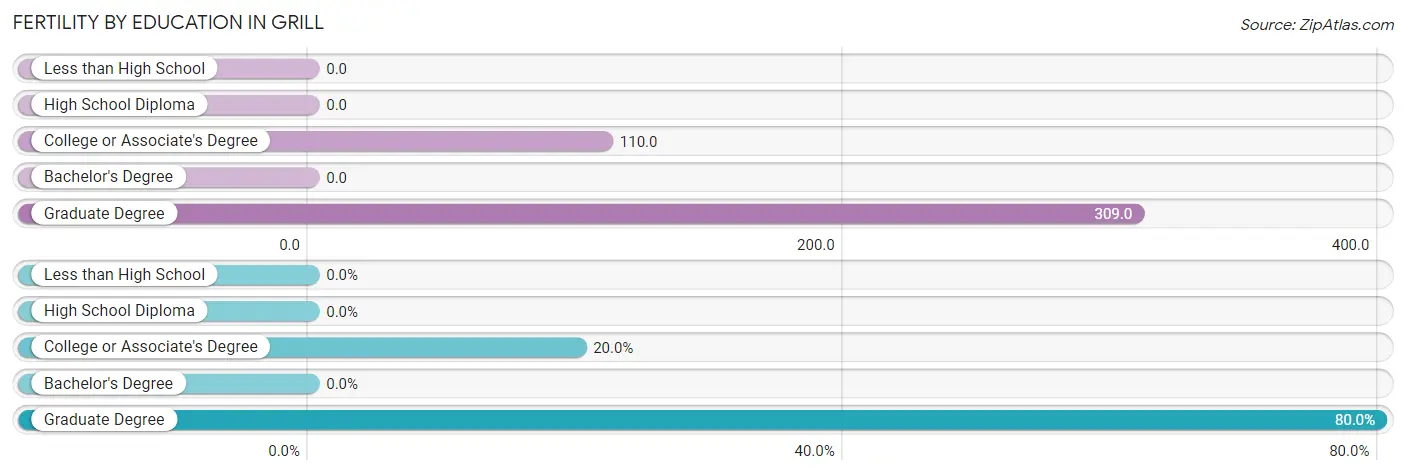
| Educational Attainment | Women with Births | Births / 1,000 Women |
| Less than High School | 0 (0.0%) | 0.0 |
| High School Diploma | 0 (0.0%) | 0.0 |
| College or Associate's Degree | 17 (20.0%) | 110.0 |
| Bachelor's Degree | 0 (0.0%) | 0.0 |
| Graduate Degree | 68 (80.0%) | 309.0 |
| Total | 85 (100.0%) | 114.0 |
Fertility by Education by Marriage Status in Grill
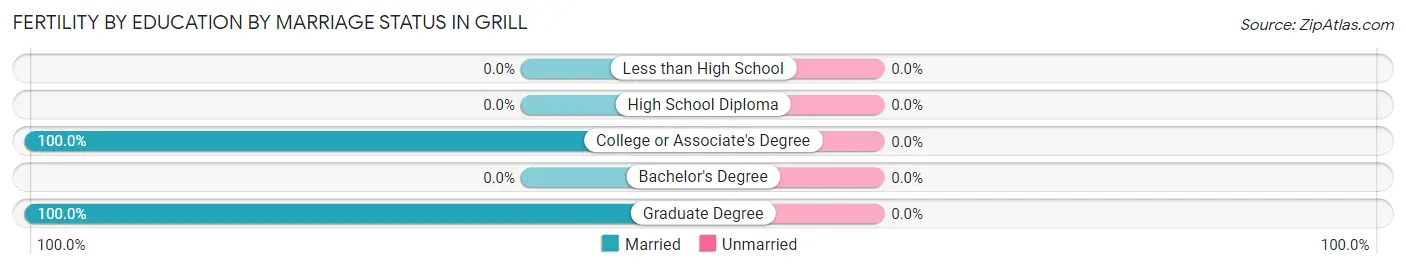
| Educational Attainment | Married | Unmarried |
| Less than High School | 0 (0.0%) | 0 (0.0%) |
| High School Diploma | 0 (0.0%) | 0 (0.0%) |
| College or Associate's Degree | 17 (100.0%) | 0 (0.0%) |
| Bachelor's Degree | 0 (0.0%) | 0 (0.0%) |
| Graduate Degree | 68 (100.0%) | 0 (0.0%) |
| Total | 85 (100.0%) | 0 (0.0%) |
Employment Characteristics in Grill
Employment by Class of Employer in Grill
Among the 1,153 employed individuals in Grill, private company employees (750 | 65.0%), not-for-profit organizations (199 | 17.3%), and local government employees (105 | 9.1%) make up the most common classes of employment.
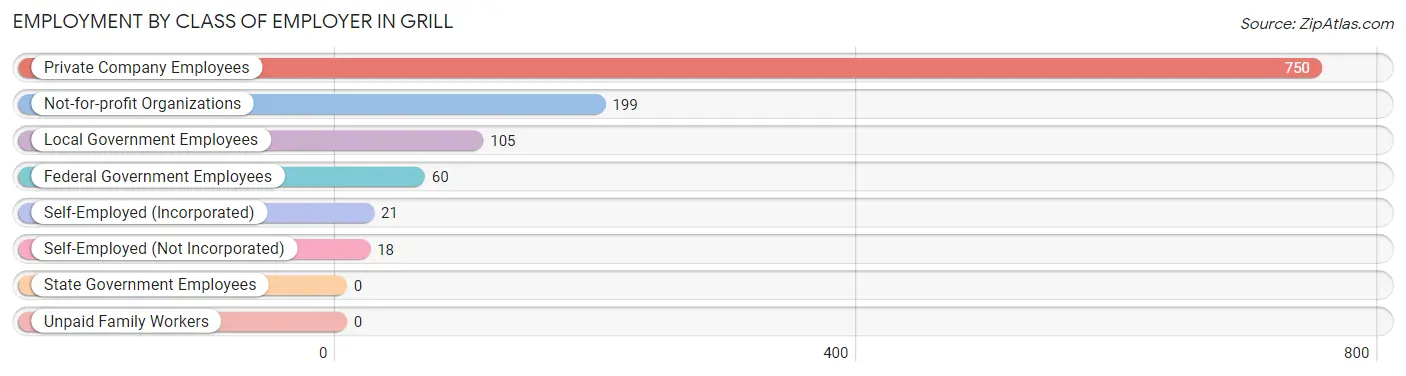
| Employer Class | # Employees | % Employees |
| Private Company Employees | 750 | 65.0% |
| Self-Employed (Incorporated) | 21 | 1.8% |
| Self-Employed (Not Incorporated) | 18 | 1.6% |
| Not-for-profit Organizations | 199 | 17.3% |
| Local Government Employees | 105 | 9.1% |
| State Government Employees | 0 | 0.0% |
| Federal Government Employees | 60 | 5.2% |
| Unpaid Family Workers | 0 | 0.0% |
| Total | 1,153 | 100.0% |
Employment Status by Age in Grill
According to the labor force statistics for Grill, out of the total population over 16 years of age (1,684), 73.1% or 1,231 individuals are in the labor force, with 0.3% or 4 of them unemployed. The age group with the highest labor force participation rate is 55 to 59 years, with 100.0% or 31 individuals in the labor force. Within the labor force, the 35 to 44 years age range has the highest percentage of unemployed individuals, with 1.3% or 4 of them being unemployed.
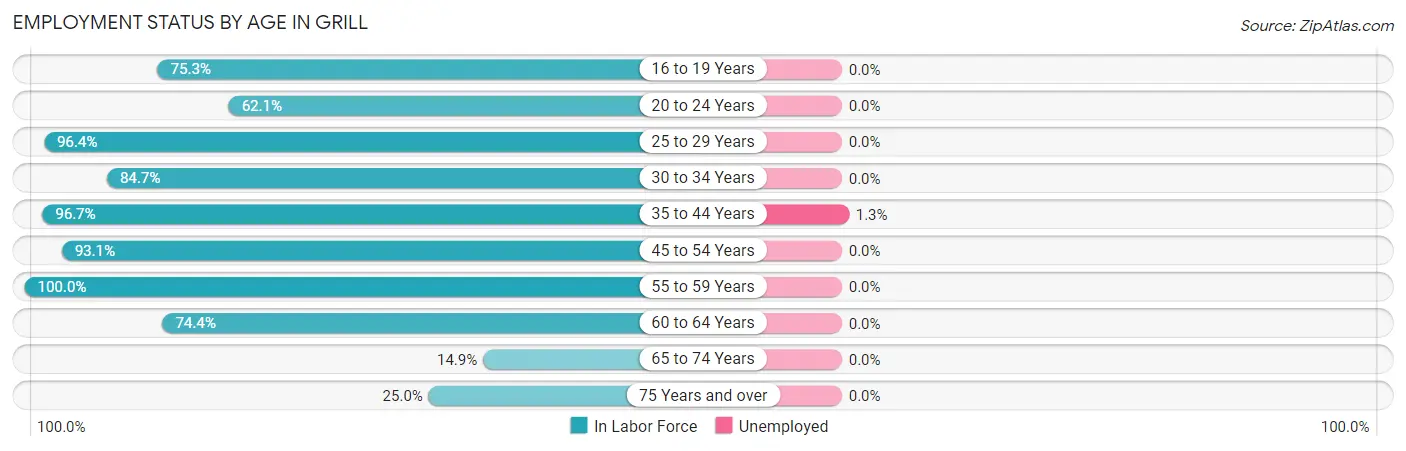
| Age Bracket | In Labor Force | Unemployed |
| 16 to 19 Years | 134 (75.3%) | 0 (0.0%) |
| 20 to 24 Years | 105 (62.1%) | 0 (0.0%) |
| 25 to 29 Years | 81 (96.4%) | 0 (0.0%) |
| 30 to 34 Years | 105 (84.7%) | 0 (0.0%) |
| 35 to 44 Years | 319 (96.7%) | 4 (1.3%) |
| 45 to 54 Years | 367 (93.1%) | 0 (0.0%) |
| 55 to 59 Years | 31 (100.0%) | 0 (0.0%) |
| 60 to 64 Years | 29 (74.4%) | 0 (0.0%) |
| 65 to 74 Years | 35 (14.9%) | 0 (0.0%) |
| 75 Years and over | 25 (25.0%) | 0 (0.0%) |
| Total | 1,231 (73.1%) | 4 (0.3%) |
Employment Status by Educational Attainment in Grill
According to labor force statistics for Grill, 93.0% of individuals (932) out of the total population between 25 and 64 years of age (1,002) are in the labor force, with 0.4% or 4 of them being unemployed. The group with the highest labor force participation rate are those with the educational attainment of bachelor's degree or higher, with 97.9% or 501 individuals in the labor force. Within the labor force, individuals with college / associate degree education have the highest percentage of unemployment, with 2.6% or 4 of them being unemployed.
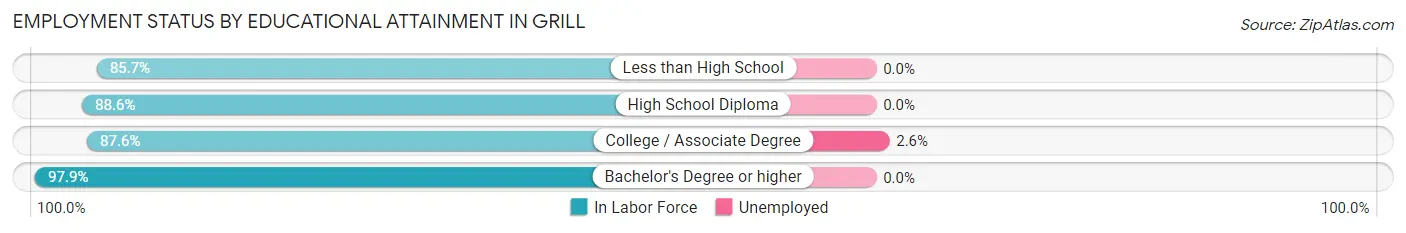
| Educational Attainment | In Labor Force | Unemployed |
| Less than High School | 42 (85.7%) | 0 (0.0%) |
| High School Diploma | 233 (88.6%) | 0 (0.0%) |
| College / Associate Degree | 156 (87.6%) | 5 (2.6%) |
| Bachelor's Degree or higher | 501 (97.9%) | 0 (0.0%) |
| Total | 932 (93.0%) | 4 (0.4%) |
Employment Occupations by Sex in Grill
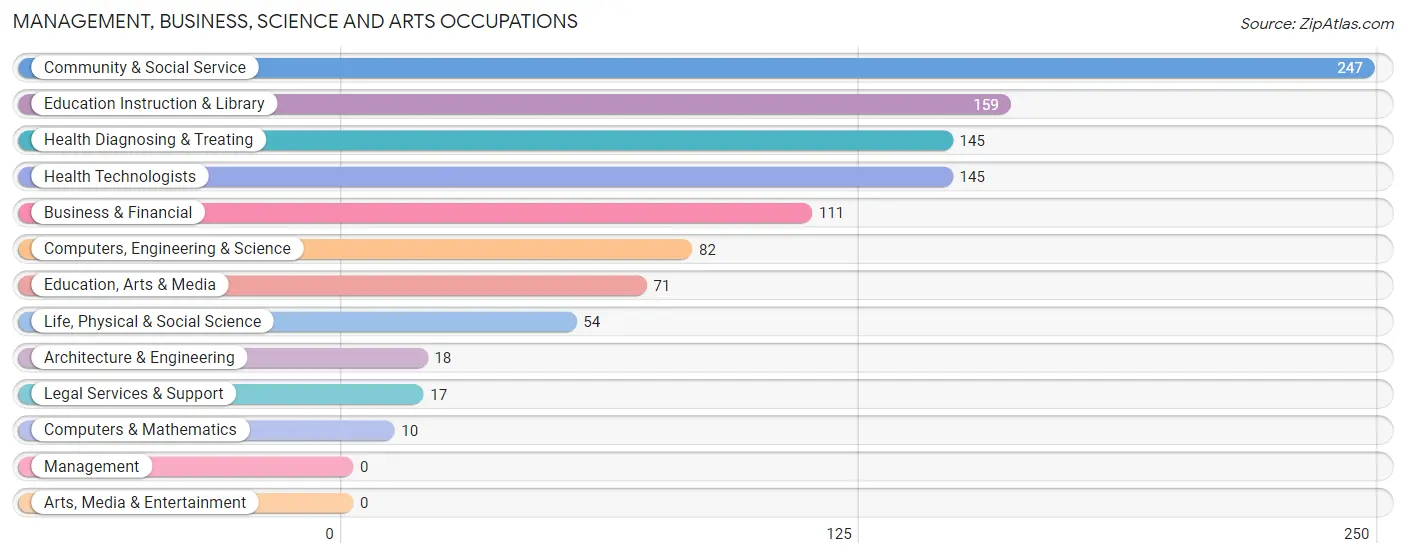
Management, Business, Science and Arts Occupations
The most common Management, Business, Science and Arts occupations in Grill are Community & Social Service (247 | 20.1%), Education Instruction & Library (159 | 13.0%), Health Diagnosing & Treating (145 | 11.8%), Health Technologists (145 | 11.8%), and Business & Financial (111 | 9.0%).
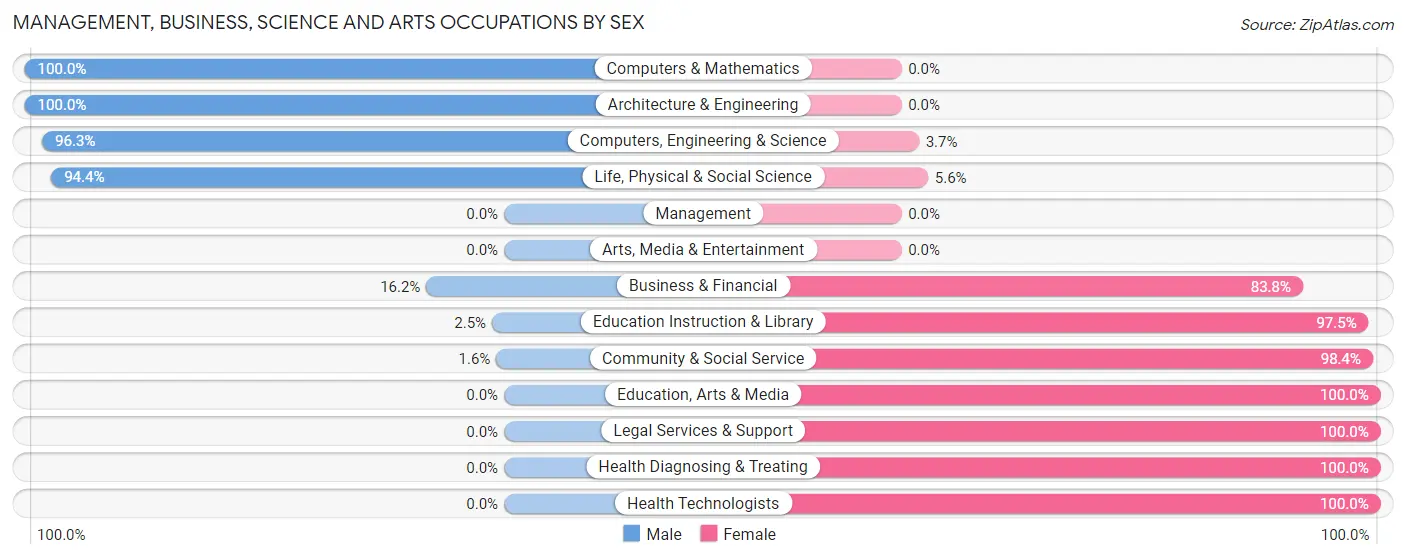
Management, Business, Science and Arts Occupations by Sex
Within the Management, Business, Science and Arts occupations in Grill, the most male-oriented occupations are Computers & Mathematics (100.0%), Architecture & Engineering (100.0%), and Computers, Engineering & Science (96.3%), while the most female-oriented occupations are Education, Arts & Media (100.0%), Legal Services & Support (100.0%), and Health Diagnosing & Treating (100.0%).
| Occupation | Male | Female |
| Management | 0 (0.0%) | 0 (0.0%) |
| Business & Financial | 18 (16.2%) | 93 (83.8%) |
| Computers, Engineering & Science | 79 (96.3%) | 3 (3.7%) |
| Computers & Mathematics | 10 (100.0%) | 0 (0.0%) |
| Architecture & Engineering | 18 (100.0%) | 0 (0.0%) |
| Life, Physical & Social Science | 51 (94.4%) | 3 (5.6%) |
| Community & Social Service | 4 (1.6%) | 243 (98.4%) |
| Education, Arts & Media | 0 (0.0%) | 71 (100.0%) |
| Legal Services & Support | 0 (0.0%) | 17 (100.0%) |
| Education Instruction & Library | 4 (2.5%) | 155 (97.5%) |
| Arts, Media & Entertainment | 0 (0.0%) | 0 (0.0%) |
| Health Diagnosing & Treating | 0 (0.0%) | 145 (100.0%) |
| Health Technologists | 0 (0.0%) | 145 (100.0%) |
| Total (Category) | 101 (17.3%) | 484 (82.7%) |
| Total (Overall) | 521 (42.5%) | 706 (57.5%) |
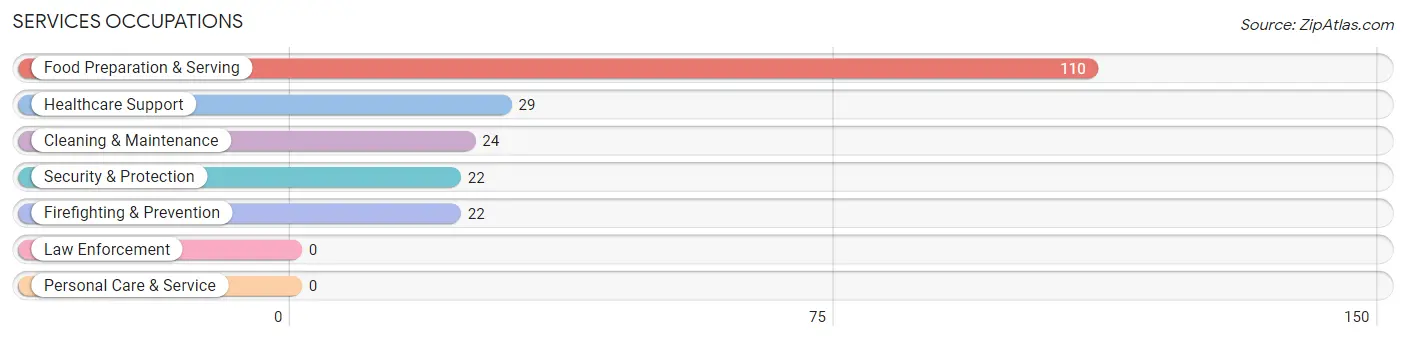
Services Occupations
The most common Services occupations in Grill are Food Preparation & Serving (110 | 9.0%), Healthcare Support (29 | 2.4%), Cleaning & Maintenance (24 | 2.0%), Security & Protection (22 | 1.8%), and Firefighting & Prevention (22 | 1.8%).
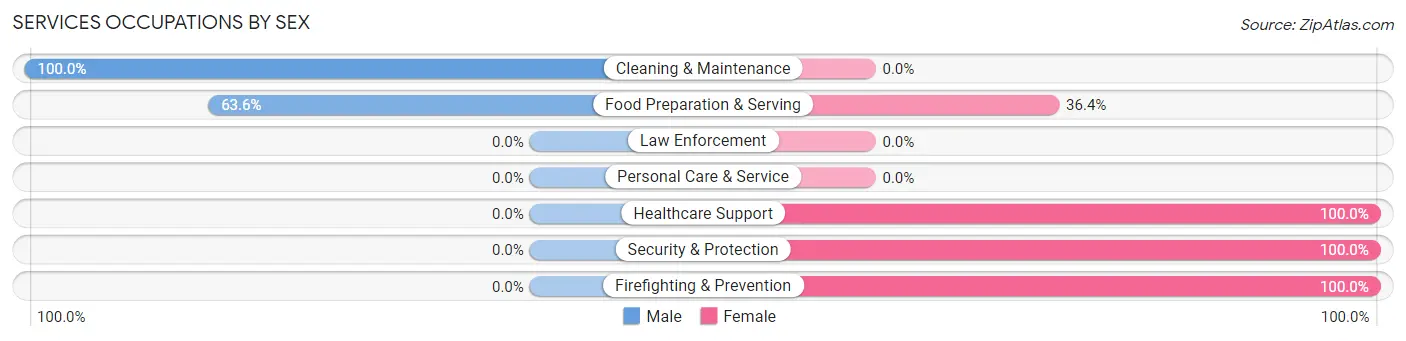
Services Occupations by Sex
Within the Services occupations in Grill, the most male-oriented occupations are Cleaning & Maintenance (100.0%), and Food Preparation & Serving (63.6%), while the most female-oriented occupations are Healthcare Support (100.0%), Security & Protection (100.0%), and Firefighting & Prevention (100.0%).
| Occupation | Male | Female |
| Healthcare Support | 0 (0.0%) | 29 (100.0%) |
| Security & Protection | 0 (0.0%) | 22 (100.0%) |
| Firefighting & Prevention | 0 (0.0%) | 22 (100.0%) |
| Law Enforcement | 0 (0.0%) | 0 (0.0%) |
| Food Preparation & Serving | 70 (63.6%) | 40 (36.4%) |
| Cleaning & Maintenance | 24 (100.0%) | 0 (0.0%) |
| Personal Care & Service | 0 (0.0%) | 0 (0.0%) |
| Total (Category) | 94 (50.8%) | 91 (49.2%) |
| Total (Overall) | 521 (42.5%) | 706 (57.5%) |
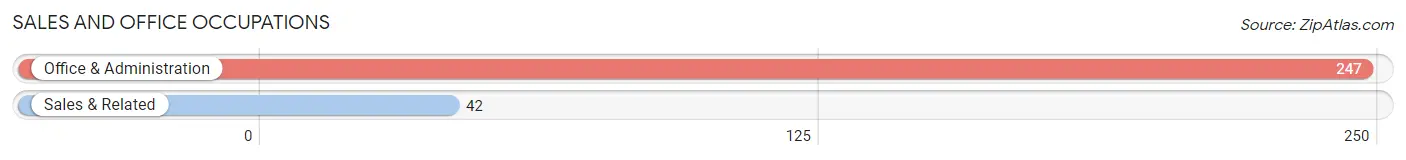
Sales and Office Occupations
The most common Sales and Office occupations in Grill are Office & Administration (247 | 20.1%), and Sales & Related (42 | 3.4%).
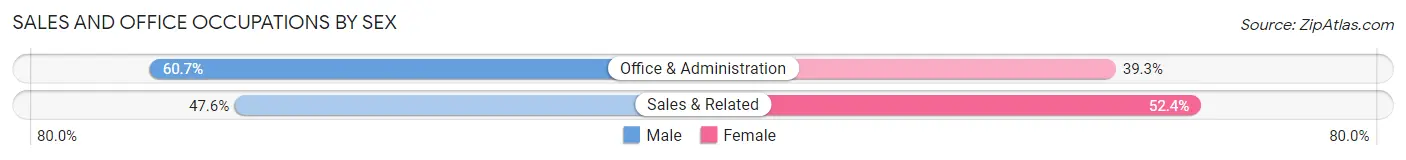
Sales and Office Occupations by Sex
| Occupation | Male | Female |
| Sales & Related | 20 (47.6%) | 22 (52.4%) |
| Office & Administration | 150 (60.7%) | 97 (39.3%) |
| Total (Category) | 170 (58.8%) | 119 (41.2%) |
| Total (Overall) | 521 (42.5%) | 706 (57.5%) |
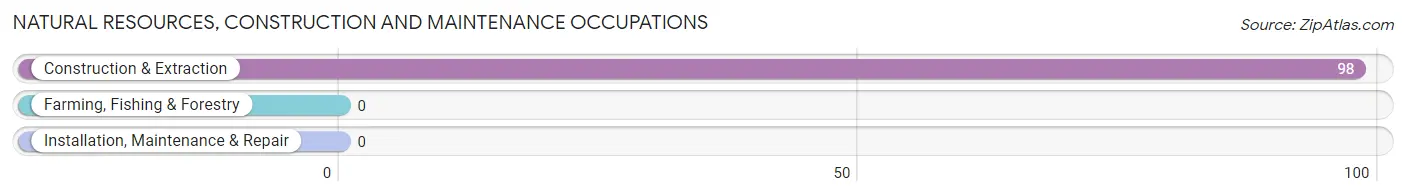
Natural Resources, Construction and Maintenance Occupations
The most common Natural Resources, Construction and Maintenance occupations in Grill are , and Construction & Extraction (98 | 8.0%).
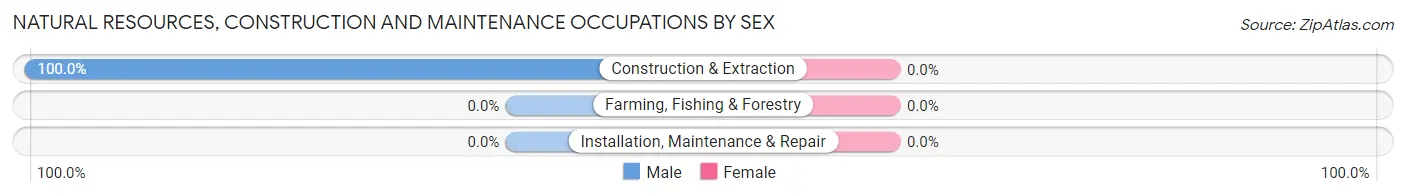
Natural Resources, Construction and Maintenance Occupations by Sex
| Occupation | Male | Female |
| Farming, Fishing & Forestry | 0 (0.0%) | 0 (0.0%) |
| Construction & Extraction | 98 (100.0%) | 0 (0.0%) |
| Installation, Maintenance & Repair | 0 (0.0%) | 0 (0.0%) |
| Total (Category) | 98 (100.0%) | 0 (0.0%) |
| Total (Overall) | 521 (42.5%) | 706 (57.5%) |
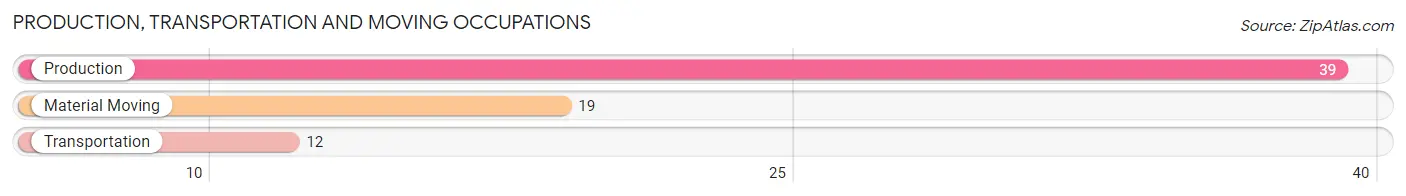
Production, Transportation and Moving Occupations
The most common Production, Transportation and Moving occupations in Grill are Production (39 | 3.2%), Material Moving (19 | 1.5%), and Transportation (12 | 1.0%).
Production, Transportation and Moving Occupations by Sex
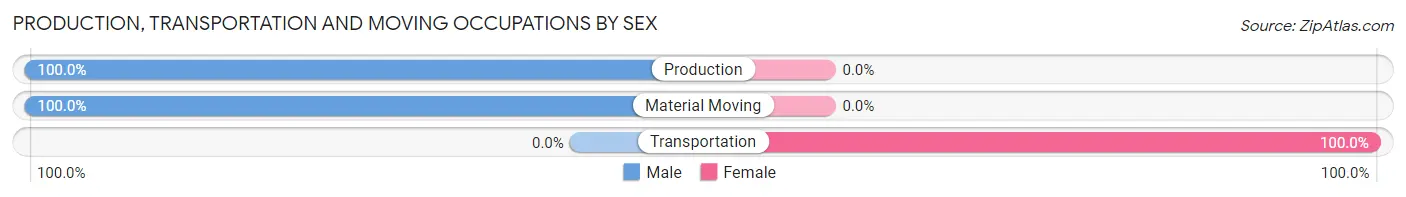
| Occupation | Male | Female |
| Production | 39 (100.0%) | 0 (0.0%) |
| Transportation | 0 (0.0%) | 12 (100.0%) |
| Material Moving | 19 (100.0%) | 0 (0.0%) |
| Total (Category) | 58 (82.9%) | 12 (17.1%) |
| Total (Overall) | 521 (42.5%) | 706 (57.5%) |
Employment Industries by Sex in Grill
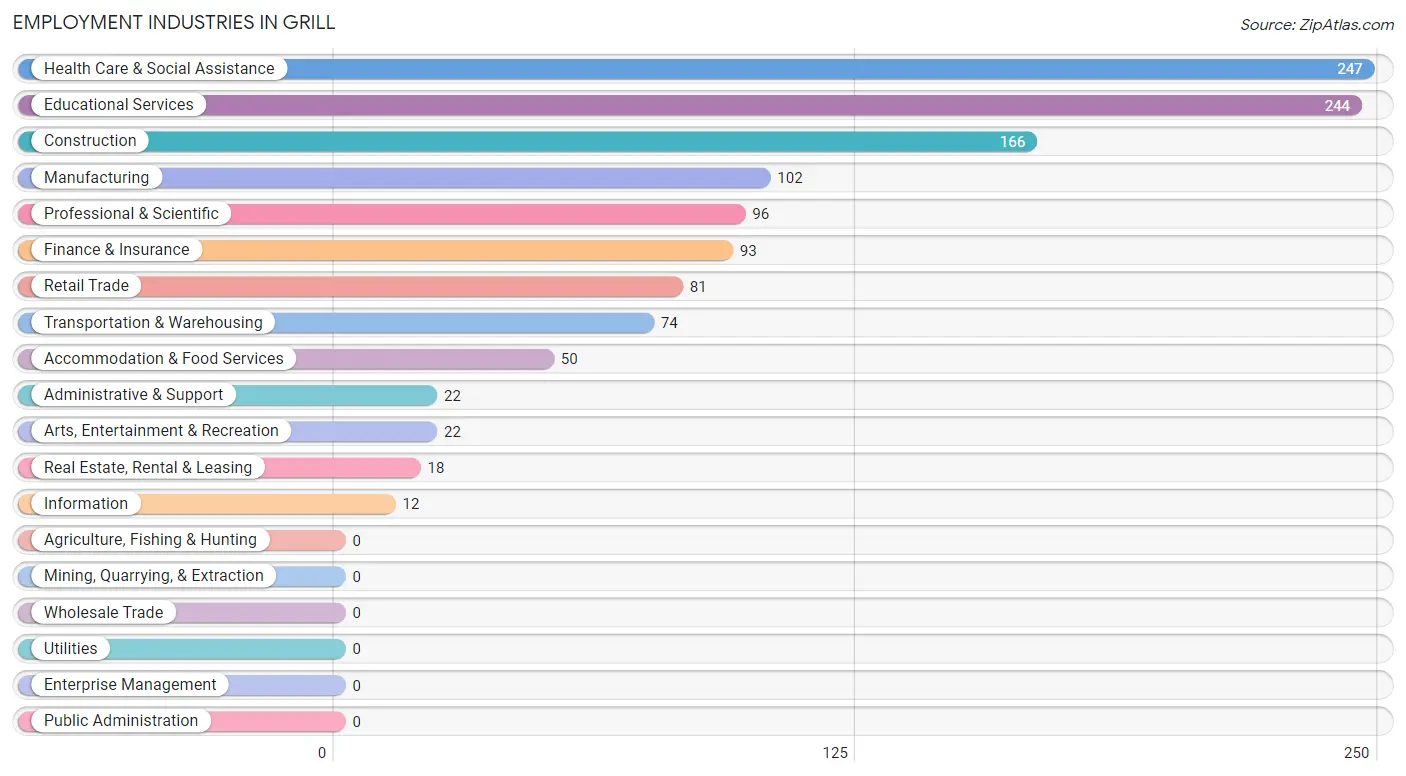
Employment Industries in Grill
The major employment industries in Grill include Health Care & Social Assistance (247 | 20.1%), Educational Services (244 | 19.9%), Construction (166 | 13.5%), Manufacturing (102 | 8.3%), and Professional & Scientific (96 | 7.8%).
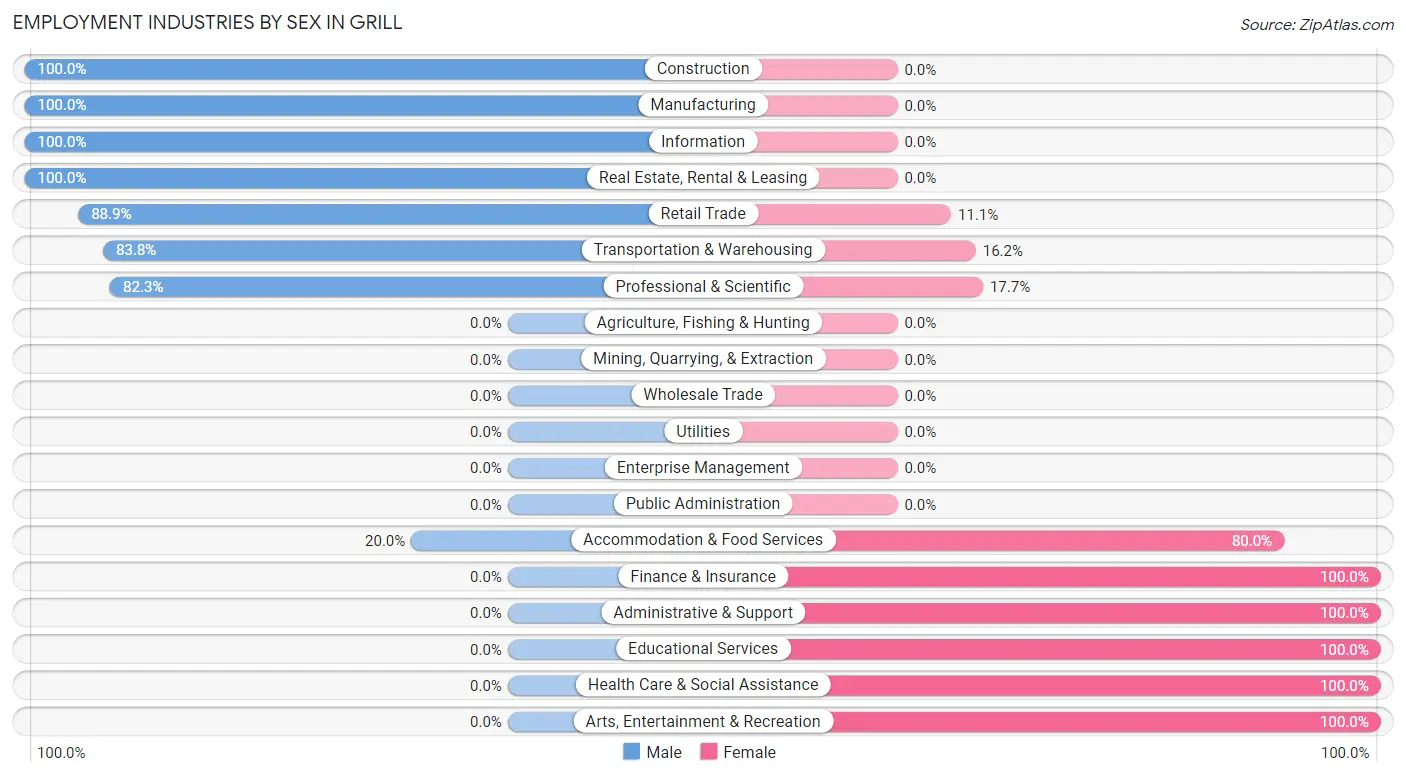
Employment Industries by Sex in Grill
The Grill industries that see more men than women are Construction (100.0%), Manufacturing (100.0%), and Information (100.0%), whereas the industries that tend to have a higher number of women are Finance & Insurance (100.0%), Administrative & Support (100.0%), and Educational Services (100.0%).
| Industry | Male | Female |
| Agriculture, Fishing & Hunting | 0 (0.0%) | 0 (0.0%) |
| Mining, Quarrying, & Extraction | 0 (0.0%) | 0 (0.0%) |
| Construction | 166 (100.0%) | 0 (0.0%) |
| Manufacturing | 102 (100.0%) | 0 (0.0%) |
| Wholesale Trade | 0 (0.0%) | 0 (0.0%) |
| Retail Trade | 72 (88.9%) | 9 (11.1%) |
| Transportation & Warehousing | 62 (83.8%) | 12 (16.2%) |
| Utilities | 0 (0.0%) | 0 (0.0%) |
| Information | 12 (100.0%) | 0 (0.0%) |
| Finance & Insurance | 0 (0.0%) | 93 (100.0%) |
| Real Estate, Rental & Leasing | 18 (100.0%) | 0 (0.0%) |
| Professional & Scientific | 79 (82.3%) | 17 (17.7%) |
| Enterprise Management | 0 (0.0%) | 0 (0.0%) |
| Administrative & Support | 0 (0.0%) | 22 (100.0%) |
| Educational Services | 0 (0.0%) | 244 (100.0%) |
| Health Care & Social Assistance | 0 (0.0%) | 247 (100.0%) |
| Arts, Entertainment & Recreation | 0 (0.0%) | 22 (100.0%) |
| Accommodation & Food Services | 10 (20.0%) | 40 (80.0%) |
| Public Administration | 0 (0.0%) | 0 (0.0%) |
| Total | 521 (42.5%) | 706 (57.5%) |
Education in Grill
School Enrollment in Grill
The most common levels of schooling among the 487 students in Grill are college / undergraduate (179 | 36.8%), high school (122 | 25.1%), and middle school (101 | 20.7%).
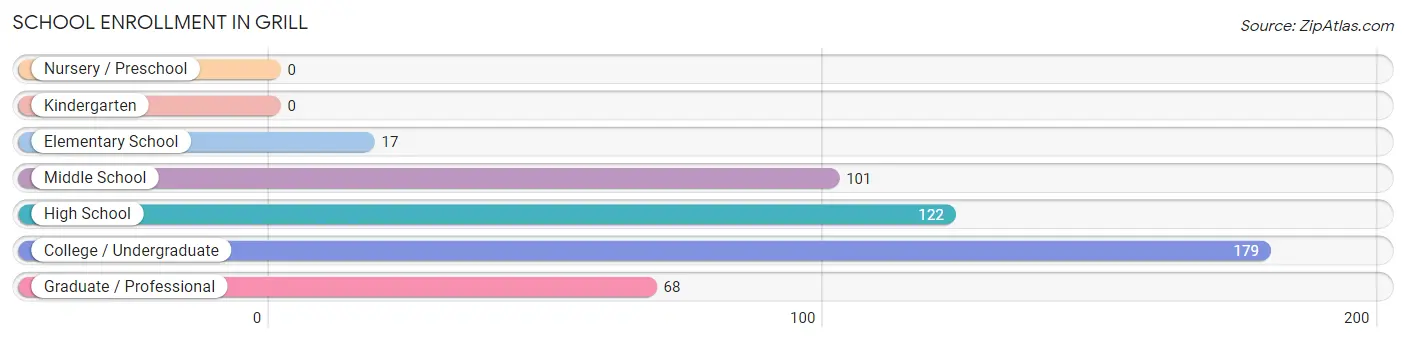
| School Level | # Students | % Students |
| Nursery / Preschool | 0 | 0.0% |
| Kindergarten | 0 | 0.0% |
| Elementary School | 17 | 3.5% |
| Middle School | 101 | 20.7% |
| High School | 122 | 25.1% |
| College / Undergraduate | 179 | 36.8% |
| Graduate / Professional | 68 | 14.0% |
| Total | 487 | 100.0% |
School Enrollment by Age by Funding Source in Grill
Out of a total of 487 students who are enrolled in schools in Grill, 19 (3.9%) attend a private institution, while the remaining 468 (96.1%) are enrolled in public schools. The age group of 18 to 19 year olds has the highest likelihood of being enrolled in private schools, with 19 (12.4% in the age bracket) enrolled. Conversely, the age group of 5 to 9 year old has the lowest likelihood of being enrolled in a private school, with 17 (100.0% in the age bracket) attending a public institution.
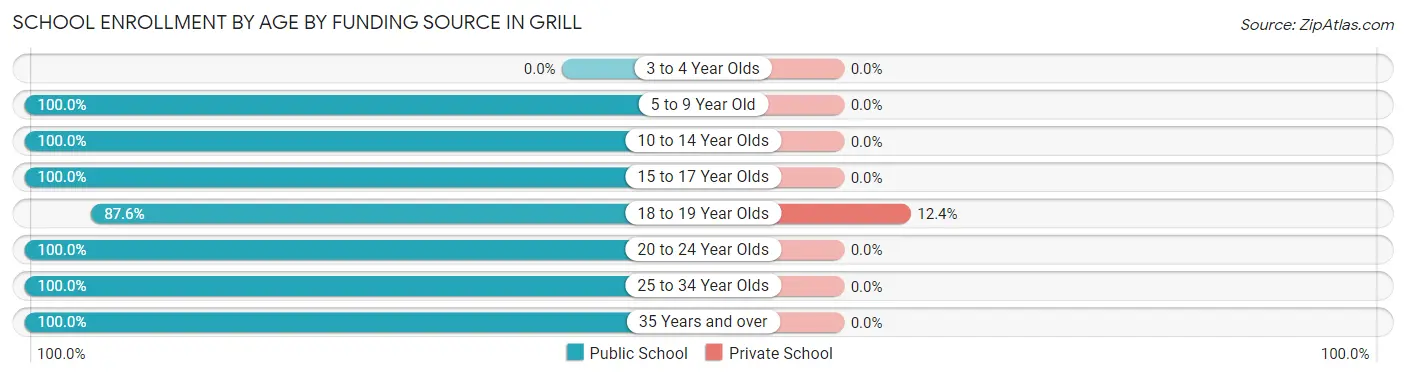
| Age Bracket | Public School | Private School |
| 3 to 4 Year Olds | 0 (0.0%) | 0 (0.0%) |
| 5 to 9 Year Old | 17 (100.0%) | 0 (0.0%) |
| 10 to 14 Year Olds | 101 (100.0%) | 0 (0.0%) |
| 15 to 17 Year Olds | 122 (100.0%) | 0 (0.0%) |
| 18 to 19 Year Olds | 134 (87.6%) | 19 (12.4%) |
| 20 to 24 Year Olds | 22 (100.0%) | 0 (0.0%) |
| 25 to 34 Year Olds | 68 (100.0%) | 0 (0.0%) |
| 35 Years and over | 4 (100.0%) | 0 (0.0%) |
| Total | 468 (96.1%) | 19 (3.9%) |
Educational Attainment by Field of Study in Grill
Business (164 | 26.8%), education (150 | 24.5%), science & technology (103 | 16.9%), arts & humanities (90 | 14.7%), and engineering (69 | 11.3%) are the most common fields of study among 611 individuals in Grill who have obtained a bachelor's degree or higher.
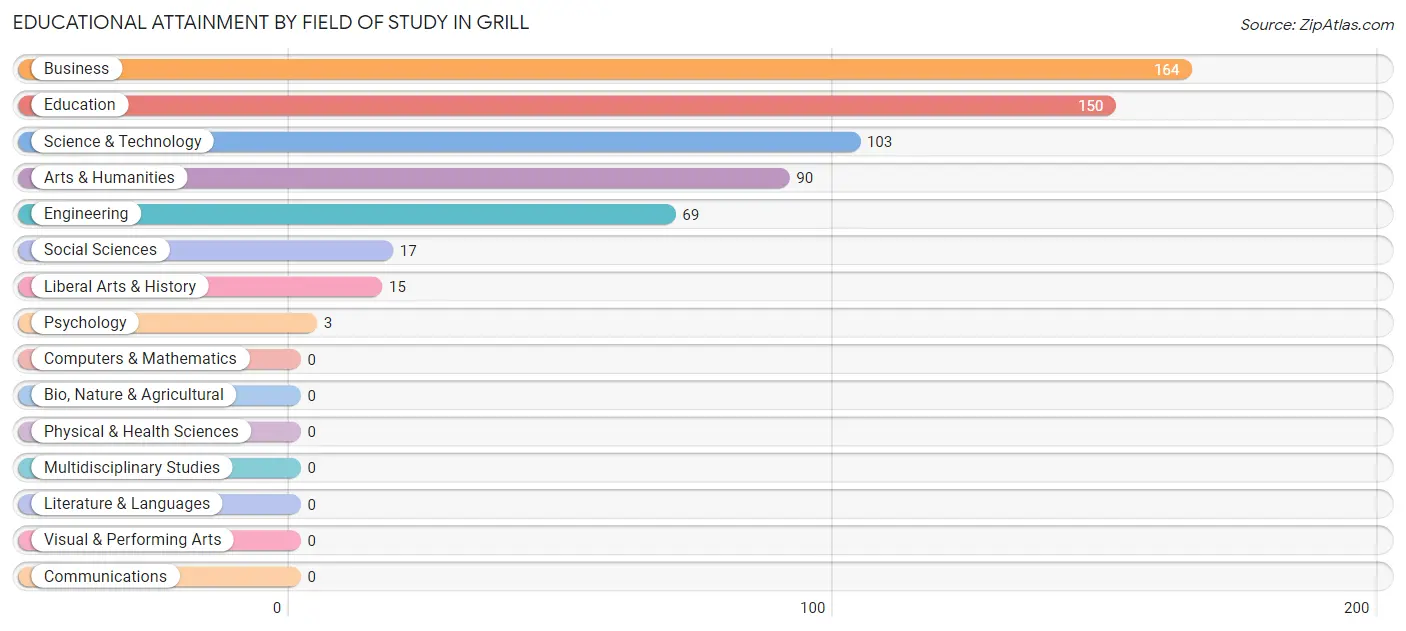
| Field of Study | # Graduates | % Graduates |
| Computers & Mathematics | 0 | 0.0% |
| Bio, Nature & Agricultural | 0 | 0.0% |
| Physical & Health Sciences | 0 | 0.0% |
| Psychology | 3 | 0.5% |
| Social Sciences | 17 | 2.8% |
| Engineering | 69 | 11.3% |
| Multidisciplinary Studies | 0 | 0.0% |
| Science & Technology | 103 | 16.9% |
| Business | 164 | 26.8% |
| Education | 150 | 24.5% |
| Literature & Languages | 0 | 0.0% |
| Liberal Arts & History | 15 | 2.5% |
| Visual & Performing Arts | 0 | 0.0% |
| Communications | 0 | 0.0% |
| Arts & Humanities | 90 | 14.7% |
| Total | 611 | 100.0% |
Transportation & Commute in Grill
Vehicle Availability by Sex in Grill
The most prevalent vehicle ownership categories in Grill are males with 3 vehicles (234, accounting for 51.4%) and females with 3 vehicles (144, making up 33.7%).
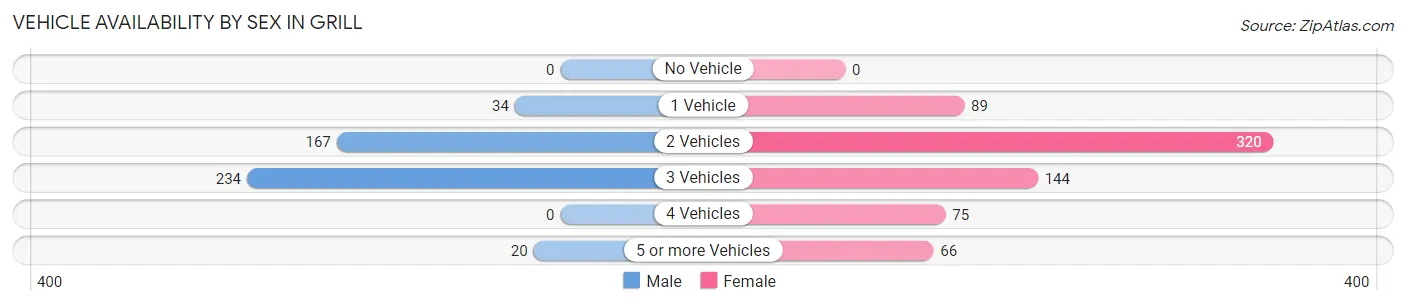
| Vehicles Available | Male | Female |
| No Vehicle | 0 (0.0%) | 0 (0.0%) |
| 1 Vehicle | 34 (7.5%) | 89 (12.8%) |
| 2 Vehicles | 167 (36.7%) | 320 (46.1%) |
| 3 Vehicles | 234 (51.4%) | 144 (20.7%) |
| 4 Vehicles | 0 (0.0%) | 75 (10.8%) |
| 5 or more Vehicles | 20 (4.4%) | 66 (9.5%) |
| Total | 455 (100.0%) | 694 (100.0%) |
Commute Time in Grill
The most frequently occuring commute durations in Grill are 10 to 14 minutes (325 commuters, 31.8%), 30 to 34 minutes (204 commuters, 20.0%), and 20 to 24 minutes (156 commuters, 15.3%).
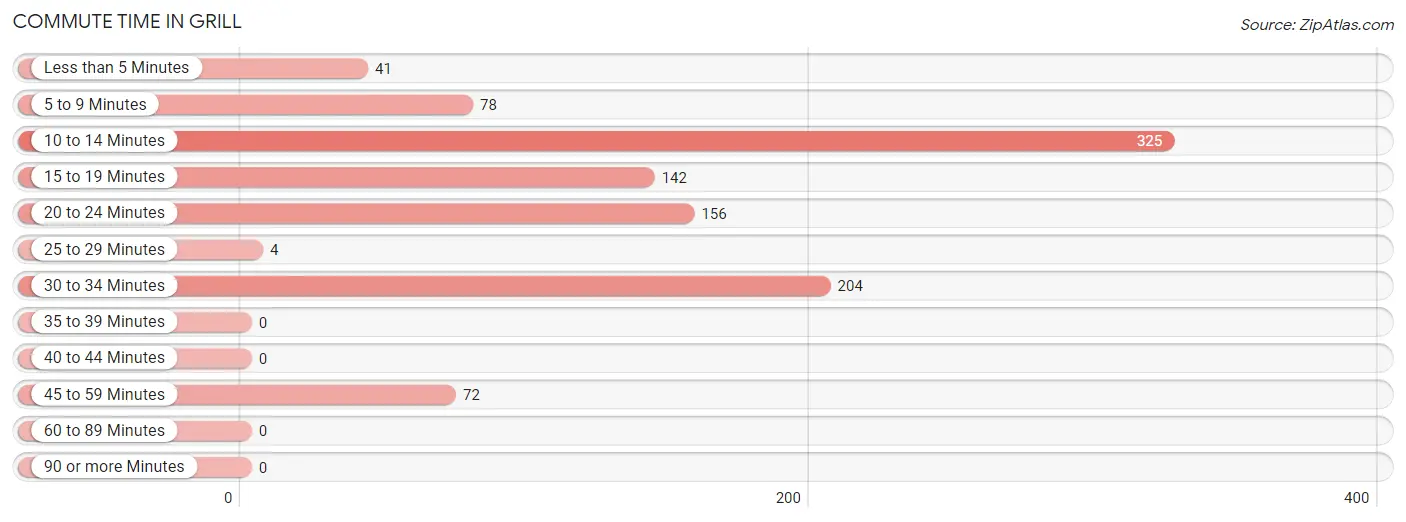
| Commute Time | # Commuters | % Commuters |
| Less than 5 Minutes | 41 | 4.0% |
| 5 to 9 Minutes | 78 | 7.6% |
| 10 to 14 Minutes | 325 | 31.8% |
| 15 to 19 Minutes | 142 | 13.9% |
| 20 to 24 Minutes | 156 | 15.3% |
| 25 to 29 Minutes | 4 | 0.4% |
| 30 to 34 Minutes | 204 | 20.0% |
| 35 to 39 Minutes | 0 | 0.0% |
| 40 to 44 Minutes | 0 | 0.0% |
| 45 to 59 Minutes | 72 | 7.0% |
| 60 to 89 Minutes | 0 | 0.0% |
| 90 or more Minutes | 0 | 0.0% |
Commute Time by Sex in Grill
The most common commute times in Grill are 30 to 34 minutes (99 commuters, 23.0%) for males and 10 to 14 minutes (297 commuters, 50.2%) for females.
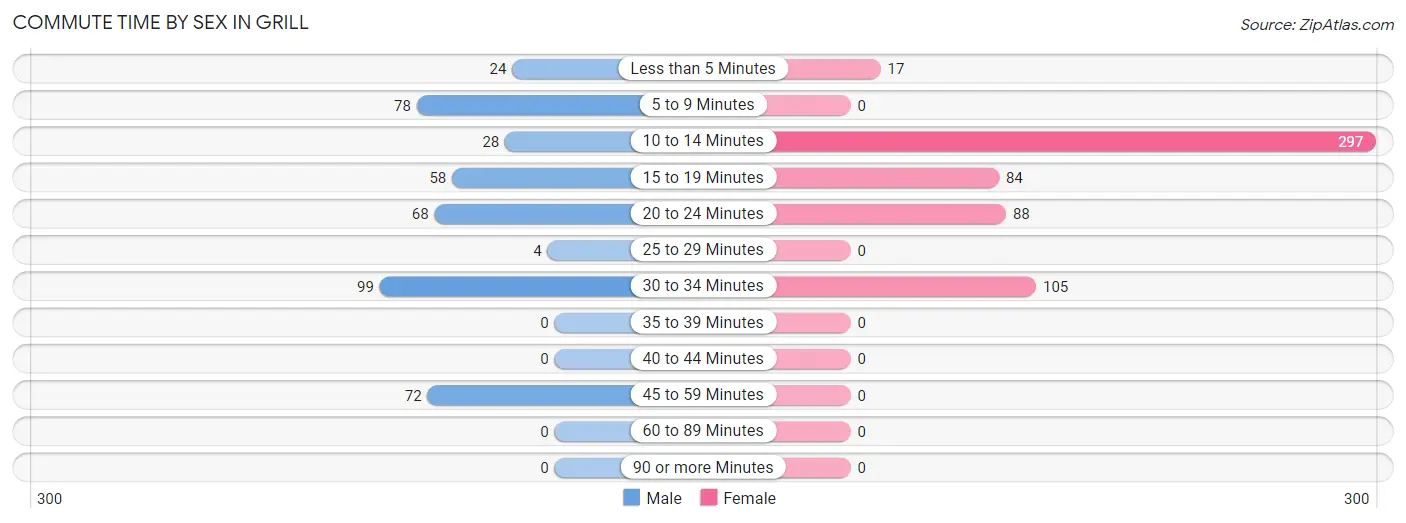
| Commute Time | Male | Female |
| Less than 5 Minutes | 24 (5.6%) | 17 (2.9%) |
| 5 to 9 Minutes | 78 (18.1%) | 0 (0.0%) |
| 10 to 14 Minutes | 28 (6.5%) | 297 (50.2%) |
| 15 to 19 Minutes | 58 (13.5%) | 84 (14.2%) |
| 20 to 24 Minutes | 68 (15.8%) | 88 (14.9%) |
| 25 to 29 Minutes | 4 (0.9%) | 0 (0.0%) |
| 30 to 34 Minutes | 99 (23.0%) | 105 (17.8%) |
| 35 to 39 Minutes | 0 (0.0%) | 0 (0.0%) |
| 40 to 44 Minutes | 0 (0.0%) | 0 (0.0%) |
| 45 to 59 Minutes | 72 (16.7%) | 0 (0.0%) |
| 60 to 89 Minutes | 0 (0.0%) | 0 (0.0%) |
| 90 or more Minutes | 0 (0.0%) | 0 (0.0%) |
Time of Departure to Work by Sex in Grill
The most frequent times of departure to work in Grill are 5:30 AM to 5:59 AM (128, 29.7%) for males and 7:30 AM to 7:59 AM (195, 33.0%) for females.
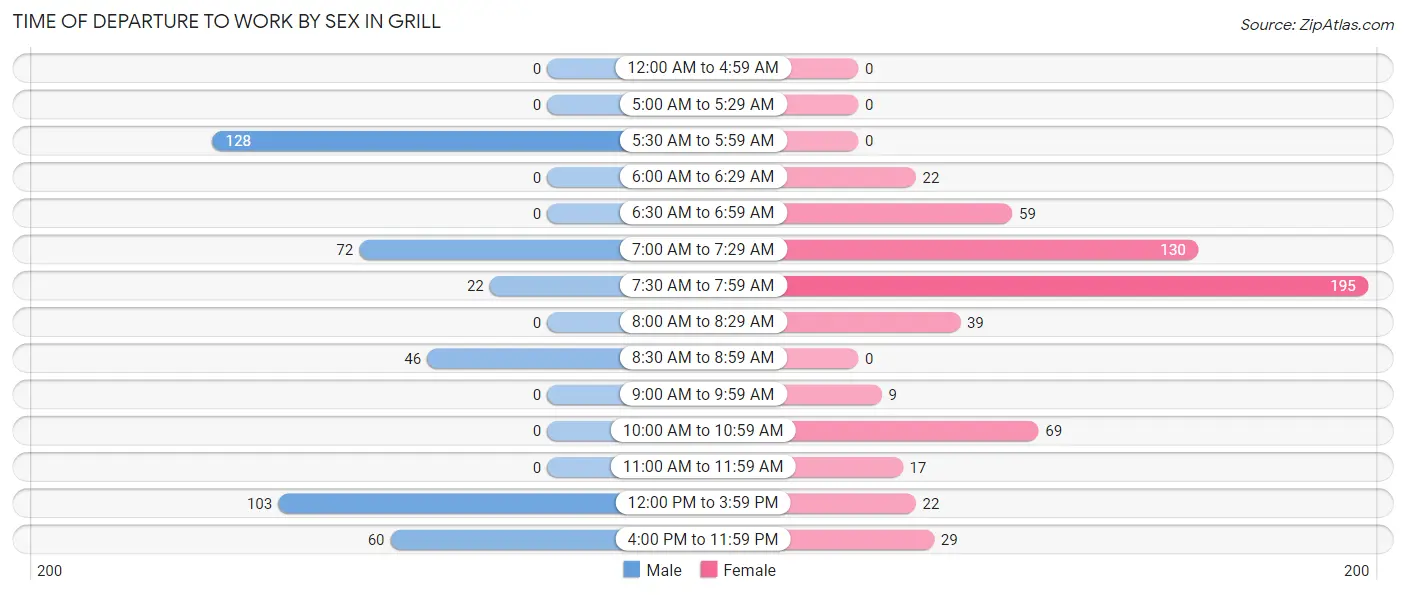
| Time of Departure | Male | Female |
| 12:00 AM to 4:59 AM | 0 (0.0%) | 0 (0.0%) |
| 5:00 AM to 5:29 AM | 0 (0.0%) | 0 (0.0%) |
| 5:30 AM to 5:59 AM | 128 (29.7%) | 0 (0.0%) |
| 6:00 AM to 6:29 AM | 0 (0.0%) | 22 (3.7%) |
| 6:30 AM to 6:59 AM | 0 (0.0%) | 59 (10.0%) |
| 7:00 AM to 7:29 AM | 72 (16.7%) | 130 (22.0%) |
| 7:30 AM to 7:59 AM | 22 (5.1%) | 195 (33.0%) |
| 8:00 AM to 8:29 AM | 0 (0.0%) | 39 (6.6%) |
| 8:30 AM to 8:59 AM | 46 (10.7%) | 0 (0.0%) |
| 9:00 AM to 9:59 AM | 0 (0.0%) | 9 (1.5%) |
| 10:00 AM to 10:59 AM | 0 (0.0%) | 69 (11.7%) |
| 11:00 AM to 11:59 AM | 0 (0.0%) | 17 (2.9%) |
| 12:00 PM to 3:59 PM | 103 (23.9%) | 22 (3.7%) |
| 4:00 PM to 11:59 PM | 60 (13.9%) | 29 (4.9%) |
| Total | 431 (100.0%) | 591 (100.0%) |
Housing Occupancy in Grill
Occupancy by Ownership in Grill
Of the total 621 dwellings in Grill, owner-occupied units account for 585 (94.2%), while renter-occupied units make up 36 (5.8%).
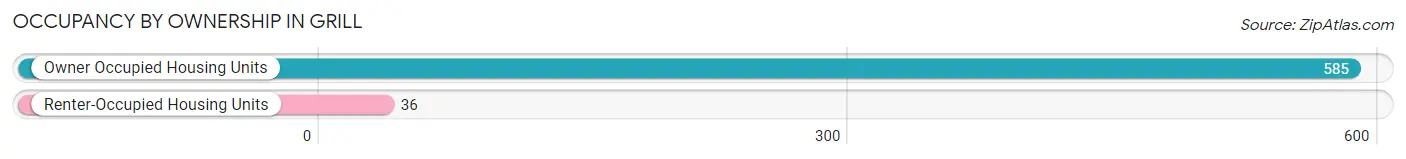
| Occupancy | # Housing Units | % Housing Units |
| Owner Occupied Housing Units | 585 | 94.2% |
| Renter-Occupied Housing Units | 36 | 5.8% |
| Total Occupied Housing Units | 621 | 100.0% |
Occupancy by Household Size in Grill
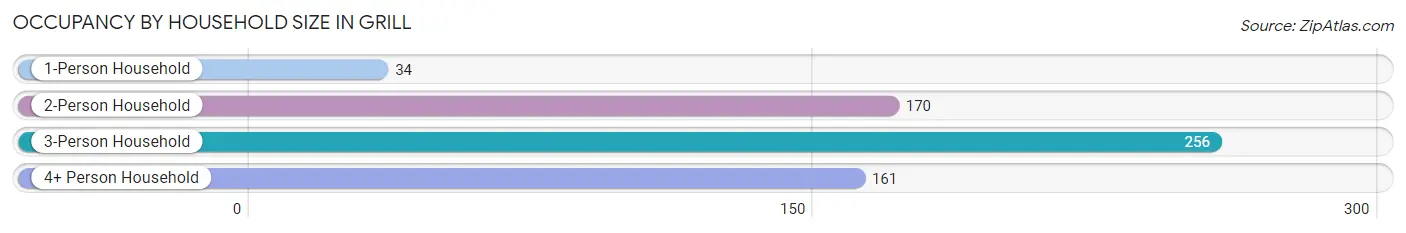
| Household Size | # Housing Units | % Housing Units |
| 1-Person Household | 34 | 5.5% |
| 2-Person Household | 170 | 27.4% |
| 3-Person Household | 256 | 41.2% |
| 4+ Person Household | 161 | 25.9% |
| Total Housing Units | 621 | 100.0% |
Occupancy by Ownership by Household Size in Grill
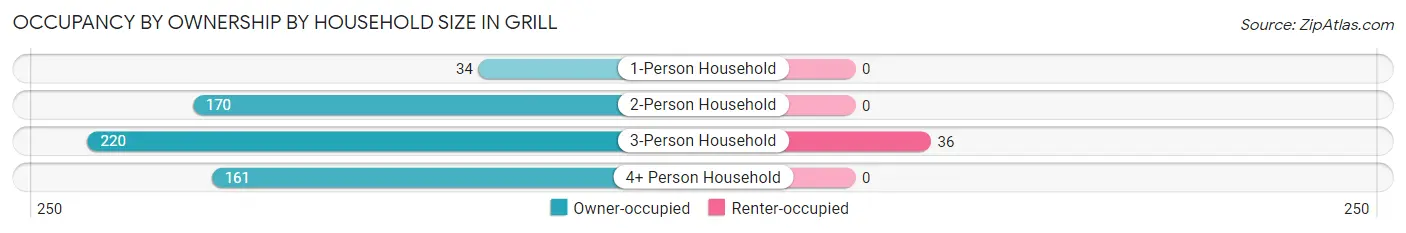
| Household Size | Owner-occupied | Renter-occupied |
| 1-Person Household | 34 (100.0%) | 0 (0.0%) |
| 2-Person Household | 170 (100.0%) | 0 (0.0%) |
| 3-Person Household | 220 (85.9%) | 36 (14.1%) |
| 4+ Person Household | 161 (100.0%) | 0 (0.0%) |
| Total Housing Units | 585 (94.2%) | 36 (5.8%) |
Occupancy by Educational Attainment in Grill
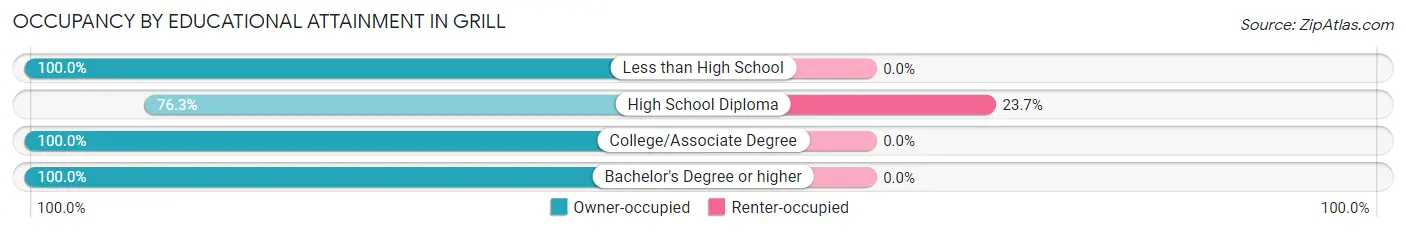
| Household Size | Owner-occupied | Renter-occupied |
| Less than High School | 23 (100.0%) | 0 (0.0%) |
| High School Diploma | 116 (76.3%) | 36 (23.7%) |
| College/Associate Degree | 131 (100.0%) | 0 (0.0%) |
| Bachelor's Degree or higher | 315 (100.0%) | 0 (0.0%) |
Occupancy by Age of Householder in Grill
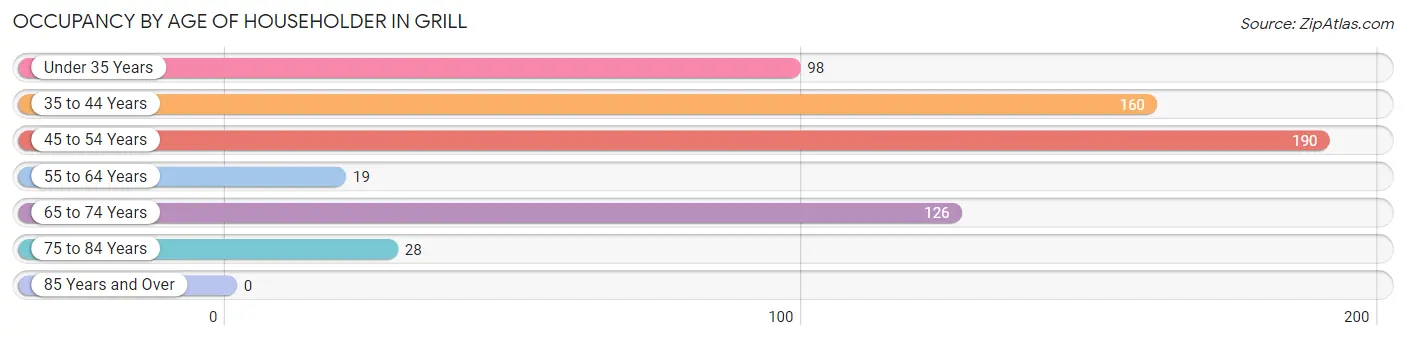
| Age Bracket | # Households | % Households |
| Under 35 Years | 98 | 15.8% |
| 35 to 44 Years | 160 | 25.8% |
| 45 to 54 Years | 190 | 30.6% |
| 55 to 64 Years | 19 | 3.1% |
| 65 to 74 Years | 126 | 20.3% |
| 75 to 84 Years | 28 | 4.5% |
| 85 Years and Over | 0 | 0.0% |
| Total | 621 | 100.0% |
Housing Finances in Grill
Median Income by Occupancy in Grill
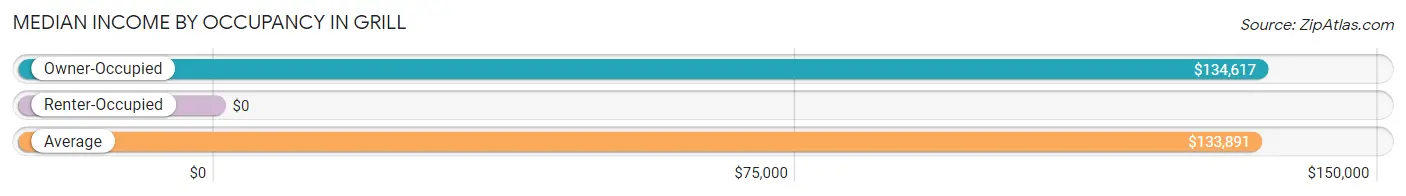
| Occupancy Type | # Households | Median Income |
| Owner-Occupied | 585 (94.2%) | $134,617 |
| Renter-Occupied | 36 (5.8%) | $0 |
| Average | 621 (100.0%) | $133,891 |
Occupancy by Householder Income Bracket in Grill
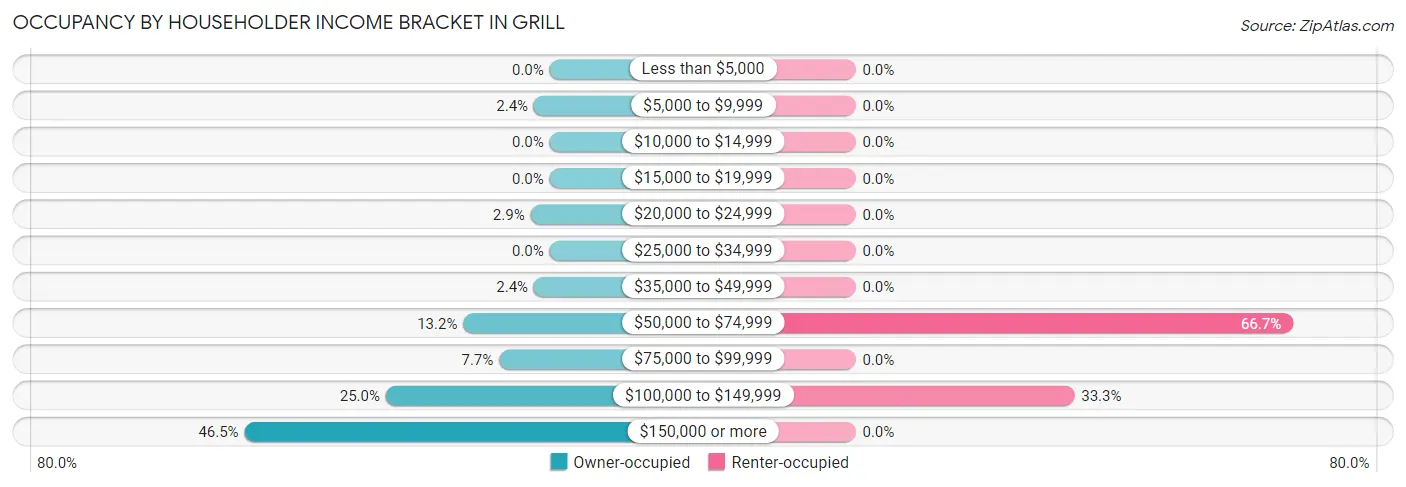
| Income Bracket | Owner-occupied | Renter-occupied |
| Less than $5,000 | 0 (0.0%) | 0 (0.0%) |
| $5,000 to $9,999 | 14 (2.4%) | 0 (0.0%) |
| $10,000 to $14,999 | 0 (0.0%) | 0 (0.0%) |
| $15,000 to $19,999 | 0 (0.0%) | 0 (0.0%) |
| $20,000 to $24,999 | 17 (2.9%) | 0 (0.0%) |
| $25,000 to $34,999 | 0 (0.0%) | 0 (0.0%) |
| $35,000 to $49,999 | 14 (2.4%) | 0 (0.0%) |
| $50,000 to $74,999 | 77 (13.2%) | 24 (66.7%) |
| $75,000 to $99,999 | 45 (7.7%) | 0 (0.0%) |
| $100,000 to $149,999 | 146 (25.0%) | 12 (33.3%) |
| $150,000 or more | 272 (46.5%) | 0 (0.0%) |
| Total | 585 (100.0%) | 36 (100.0%) |
Monthly Housing Cost Tiers in Grill
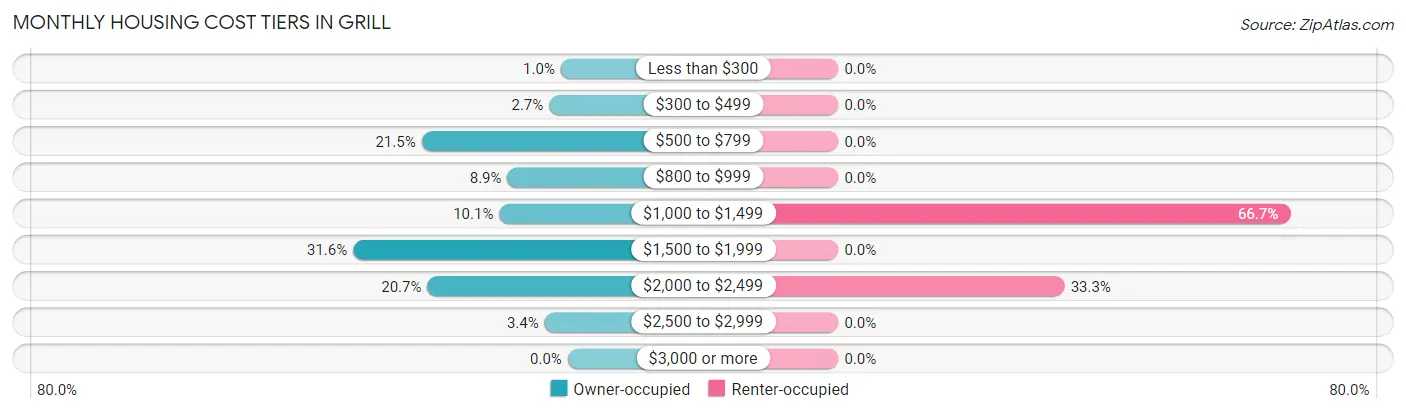
| Monthly Cost | Owner-occupied | Renter-occupied |
| Less than $300 | 6 (1.0%) | 0 (0.0%) |
| $300 to $499 | 16 (2.7%) | 0 (0.0%) |
| $500 to $799 | 126 (21.5%) | 0 (0.0%) |
| $800 to $999 | 52 (8.9%) | 0 (0.0%) |
| $1,000 to $1,499 | 59 (10.1%) | 24 (66.7%) |
| $1,500 to $1,999 | 185 (31.6%) | 0 (0.0%) |
| $2,000 to $2,499 | 121 (20.7%) | 12 (33.3%) |
| $2,500 to $2,999 | 20 (3.4%) | 0 (0.0%) |
| $3,000 or more | 0 (0.0%) | 0 (0.0%) |
| Total | 585 (100.0%) | 36 (100.0%) |
Physical Housing Characteristics in Grill
Housing Structures in Grill
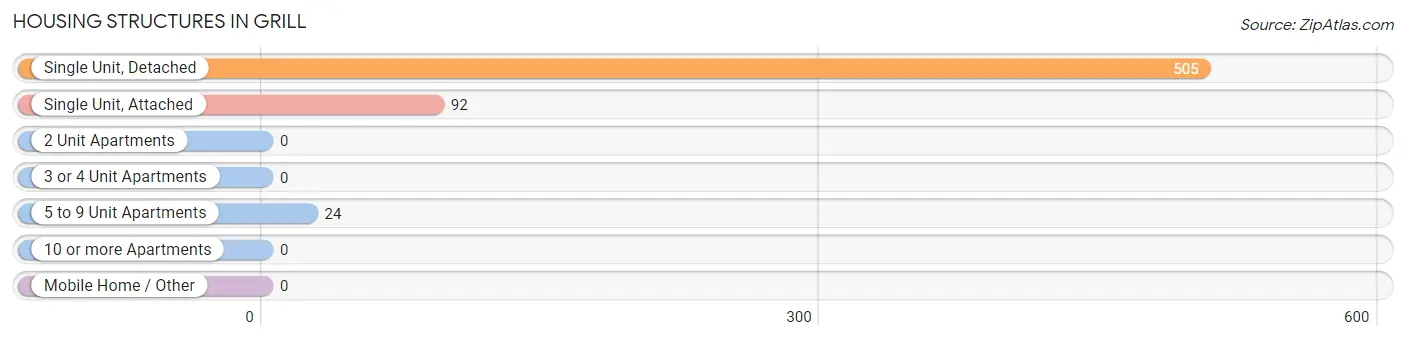
| Structure Type | # Housing Units | % Housing Units |
| Single Unit, Detached | 505 | 81.3% |
| Single Unit, Attached | 92 | 14.8% |
| 2 Unit Apartments | 0 | 0.0% |
| 3 or 4 Unit Apartments | 0 | 0.0% |
| 5 to 9 Unit Apartments | 24 | 3.9% |
| 10 or more Apartments | 0 | 0.0% |
| Mobile Home / Other | 0 | 0.0% |
| Total | 621 | 100.0% |
Housing Structures by Occupancy in Grill
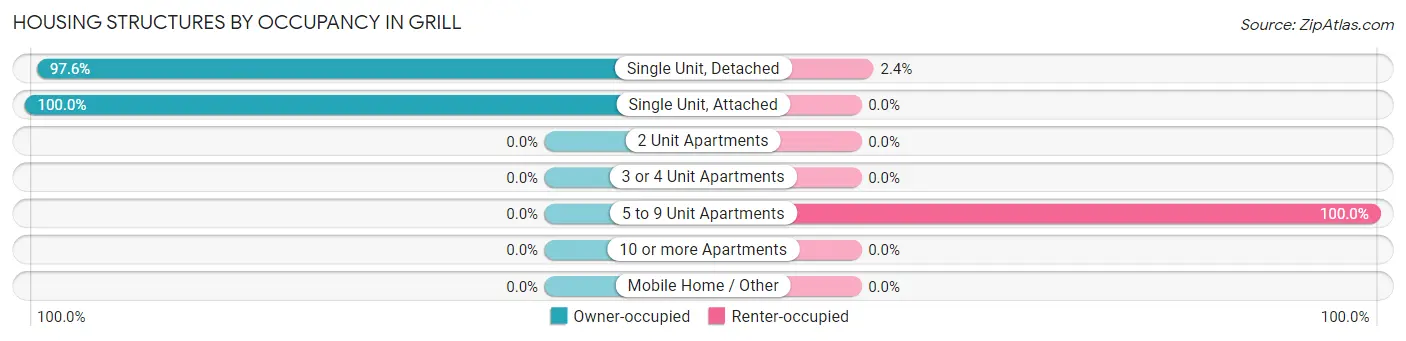
| Structure Type | Owner-occupied | Renter-occupied |
| Single Unit, Detached | 493 (97.6%) | 12 (2.4%) |
| Single Unit, Attached | 92 (100.0%) | 0 (0.0%) |
| 2 Unit Apartments | 0 (0.0%) | 0 (0.0%) |
| 3 or 4 Unit Apartments | 0 (0.0%) | 0 (0.0%) |
| 5 to 9 Unit Apartments | 0 (0.0%) | 24 (100.0%) |
| 10 or more Apartments | 0 (0.0%) | 0 (0.0%) |
| Mobile Home / Other | 0 (0.0%) | 0 (0.0%) |
| Total | 585 (94.2%) | 36 (5.8%) |
Housing Structures by Number of Rooms in Grill
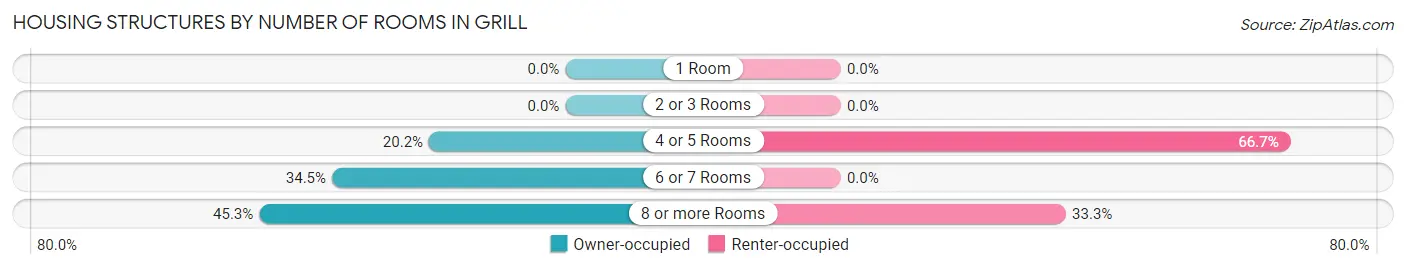
| Number of Rooms | Owner-occupied | Renter-occupied |
| 1 Room | 0 (0.0%) | 0 (0.0%) |
| 2 or 3 Rooms | 0 (0.0%) | 0 (0.0%) |
| 4 or 5 Rooms | 118 (20.2%) | 24 (66.7%) |
| 6 or 7 Rooms | 202 (34.5%) | 0 (0.0%) |
| 8 or more Rooms | 265 (45.3%) | 12 (33.3%) |
| Total | 585 (100.0%) | 36 (100.0%) |
Housing Structure by Heating Type in Grill
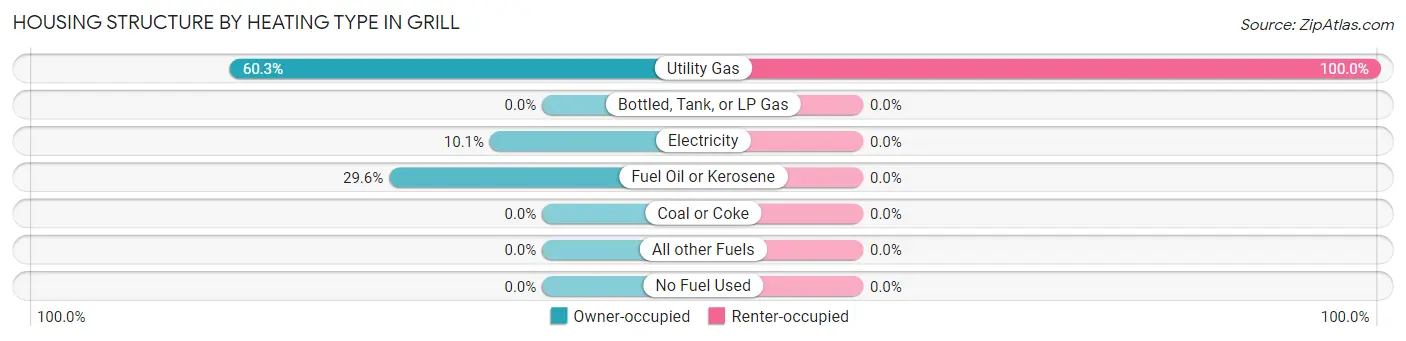
| Heating Type | Owner-occupied | Renter-occupied |
| Utility Gas | 353 (60.3%) | 36 (100.0%) |
| Bottled, Tank, or LP Gas | 0 (0.0%) | 0 (0.0%) |
| Electricity | 59 (10.1%) | 0 (0.0%) |
| Fuel Oil or Kerosene | 173 (29.6%) | 0 (0.0%) |
| Coal or Coke | 0 (0.0%) | 0 (0.0%) |
| All other Fuels | 0 (0.0%) | 0 (0.0%) |
| No Fuel Used | 0 (0.0%) | 0 (0.0%) |
| Total | 585 (100.0%) | 36 (100.0%) |
Household Vehicle Usage in Grill
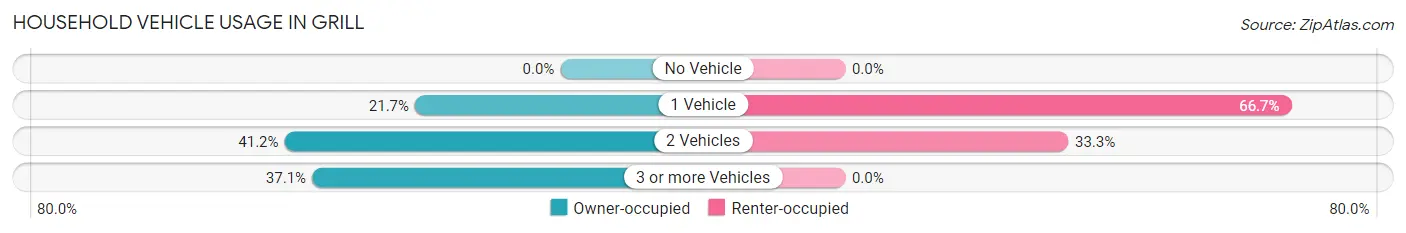
| Vehicles per Household | Owner-occupied | Renter-occupied |
| No Vehicle | 0 (0.0%) | 0 (0.0%) |
| 1 Vehicle | 127 (21.7%) | 24 (66.7%) |
| 2 Vehicles | 241 (41.2%) | 12 (33.3%) |
| 3 or more Vehicles | 217 (37.1%) | 0 (0.0%) |
| Total | 585 (100.0%) | 36 (100.0%) |
Real Estate & Mortgages in Grill
Real Estate and Mortgage Overview in Grill
| Characteristic | Without Mortgage | With Mortgage |
| Housing Units | 206 | 379 |
| Median Property Value | $316,700 | $248,600 |
| Median Household Income | $93,750 | $201 |
| Monthly Housing Costs | $594 | $0 |
| Real Estate Taxes | $3,368 | $11 |
Property Value by Mortgage Status in Grill
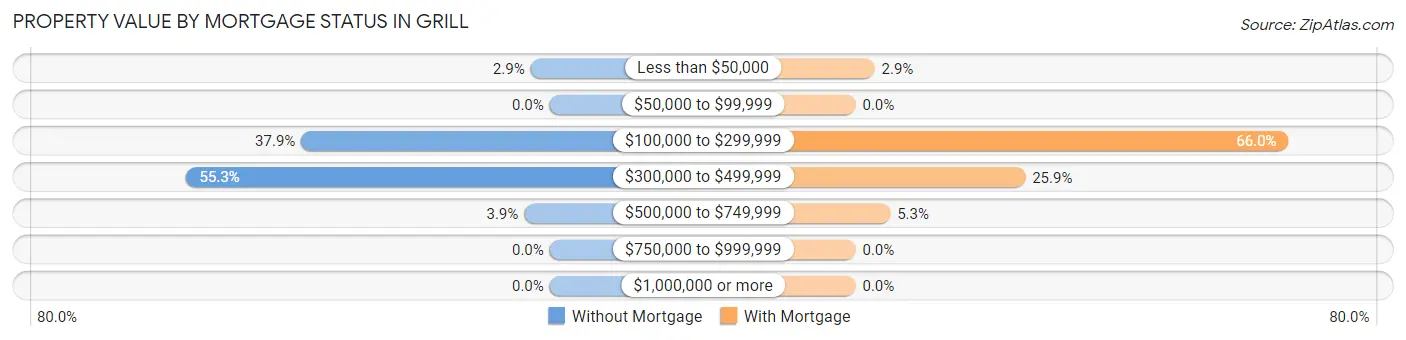
| Property Value | Without Mortgage | With Mortgage |
| Less than $50,000 | 6 (2.9%) | 11 (2.9%) |
| $50,000 to $99,999 | 0 (0.0%) | 0 (0.0%) |
| $100,000 to $299,999 | 78 (37.9%) | 250 (66.0%) |
| $300,000 to $499,999 | 114 (55.3%) | 98 (25.9%) |
| $500,000 to $749,999 | 8 (3.9%) | 20 (5.3%) |
| $750,000 to $999,999 | 0 (0.0%) | 0 (0.0%) |
| $1,000,000 or more | 0 (0.0%) | 0 (0.0%) |
| Total | 206 (100.0%) | 379 (100.0%) |
Household Income by Mortgage Status in Grill
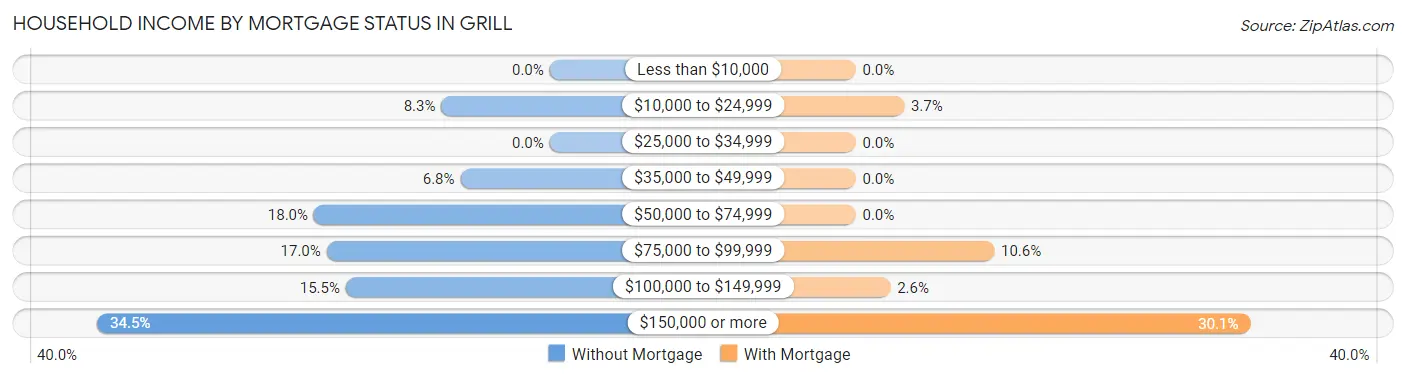
| Household Income | Without Mortgage | With Mortgage |
| Less than $10,000 | 0 (0.0%) | 0 (0.0%) |
| $10,000 to $24,999 | 17 (8.3%) | 14 (3.7%) |
| $25,000 to $34,999 | 0 (0.0%) | 0 (0.0%) |
| $35,000 to $49,999 | 14 (6.8%) | 0 (0.0%) |
| $50,000 to $74,999 | 37 (18.0%) | 0 (0.0%) |
| $75,000 to $99,999 | 35 (17.0%) | 40 (10.5%) |
| $100,000 to $149,999 | 32 (15.5%) | 10 (2.6%) |
| $150,000 or more | 71 (34.5%) | 114 (30.1%) |
| Total | 206 (100.0%) | 379 (100.0%) |
Property Value to Household Income Ratio in Grill
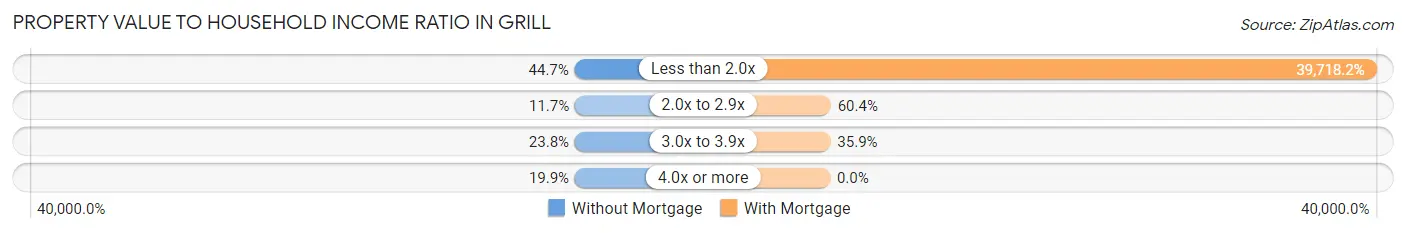
| Value-to-Income Ratio | Without Mortgage | With Mortgage |
| Less than 2.0x | 92 (44.7%) | 150,532 (39,718.2%) |
| 2.0x to 2.9x | 24 (11.7%) | 229 (60.4%) |
| 3.0x to 3.9x | 49 (23.8%) | 136 (35.9%) |
| 4.0x or more | 41 (19.9%) | 0 (0.0%) |
| Total | 206 (100.0%) | 379 (100.0%) |
Real Estate Taxes by Mortgage Status in Grill
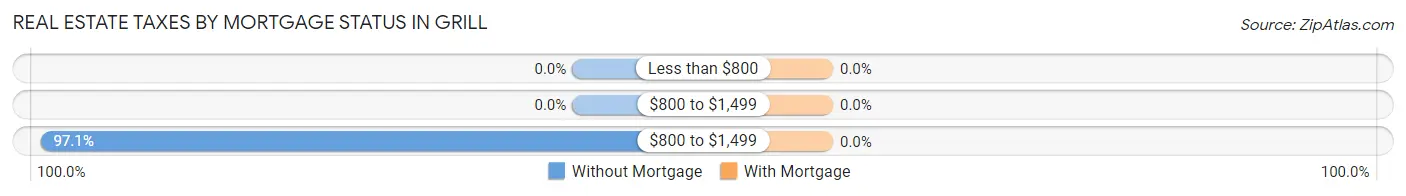
| Property Taxes | Without Mortgage | With Mortgage |
| Less than $800 | 0 (0.0%) | 0 (0.0%) |
| $800 to $1,499 | 0 (0.0%) | 0 (0.0%) |
| $800 to $1,499 | 200 (97.1%) | 0 (0.0%) |
| Total | 206 (100.0%) | 379 (100.0%) |
Health & Disability in Grill
Health Insurance Coverage by Age in Grill
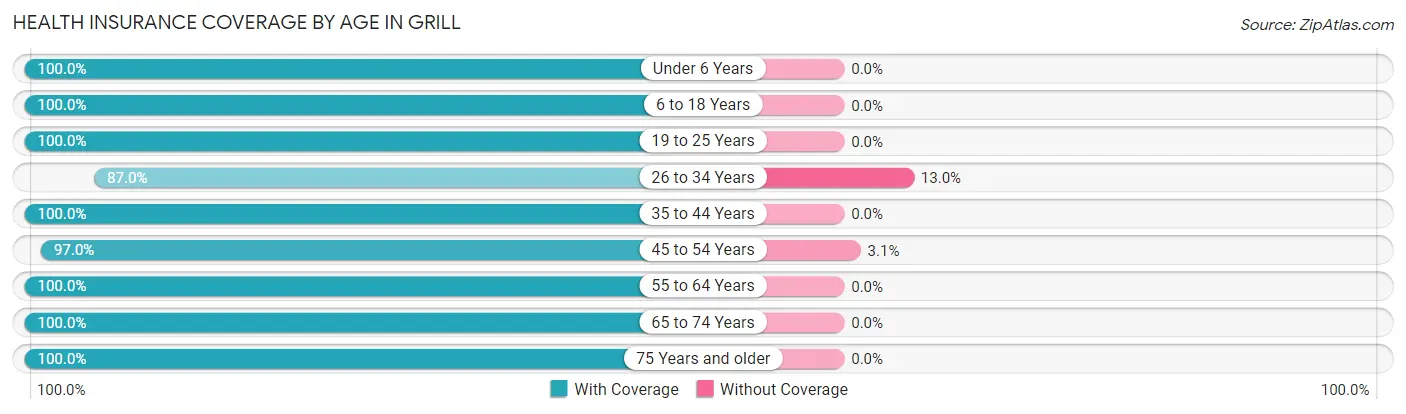
| Age Bracket | With Coverage | Without Coverage |
| Under 6 Years | 116 (100.0%) | 0 (0.0%) |
| 6 to 18 Years | 240 (100.0%) | 0 (0.0%) |
| 19 to 25 Years | 322 (100.0%) | 0 (0.0%) |
| 26 to 34 Years | 181 (87.0%) | 27 (13.0%) |
| 35 to 44 Years | 330 (100.0%) | 0 (0.0%) |
| 45 to 54 Years | 382 (97.0%) | 12 (3.0%) |
| 55 to 64 Years | 70 (100.0%) | 0 (0.0%) |
| 65 to 74 Years | 235 (100.0%) | 0 (0.0%) |
| 75 Years and older | 100 (100.0%) | 0 (0.0%) |
| Total | 1,976 (98.1%) | 39 (1.9%) |
Health Insurance Coverage by Citizenship Status in Grill

| Citizenship Status | With Coverage | Without Coverage |
| Native Born | 116 (100.0%) | 0 (0.0%) |
| Foreign Born, Citizen | 240 (100.0%) | 0 (0.0%) |
| Foreign Born, not a Citizen | 322 (100.0%) | 0 (0.0%) |
Health Insurance Coverage by Household Income in Grill
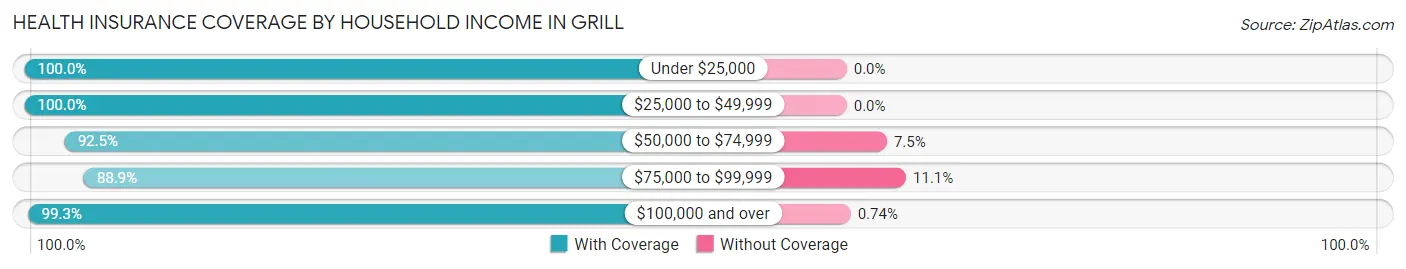
| Household Income | With Coverage | Without Coverage |
| Under $25,000 | 64 (100.0%) | 0 (0.0%) |
| $25,000 to $49,999 | 14 (100.0%) | 0 (0.0%) |
| $50,000 to $74,999 | 209 (92.5%) | 17 (7.5%) |
| $75,000 to $99,999 | 80 (88.9%) | 10 (11.1%) |
| $100,000 and over | 1,600 (99.3%) | 12 (0.7%) |
Public vs Private Health Insurance Coverage by Age in Grill
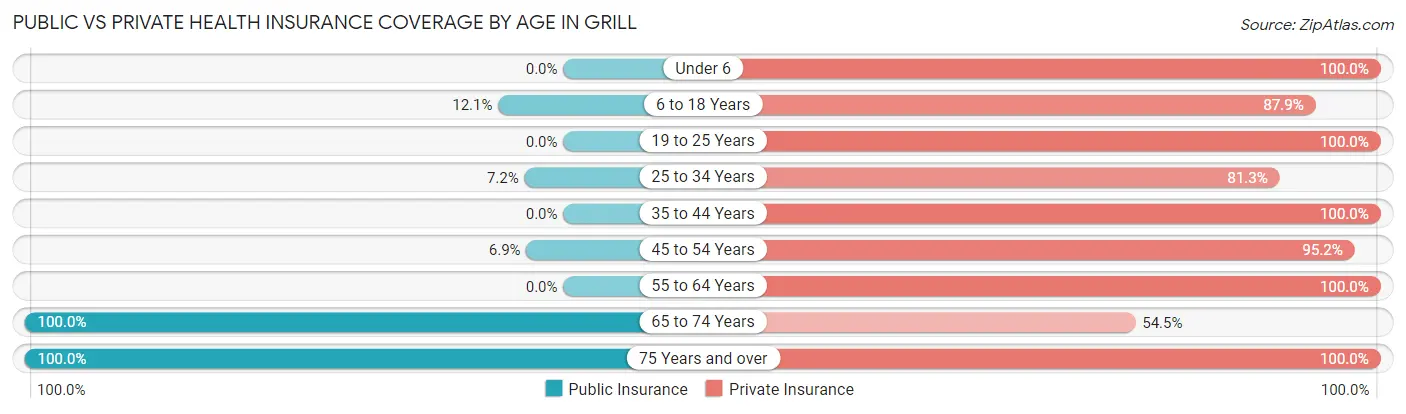
| Age Bracket | Public Insurance | Private Insurance |
| Under 6 | 0 (0.0%) | 116 (100.0%) |
| 6 to 18 Years | 29 (12.1%) | 211 (87.9%) |
| 19 to 25 Years | 0 (0.0%) | 322 (100.0%) |
| 25 to 34 Years | 15 (7.2%) | 169 (81.2%) |
| 35 to 44 Years | 0 (0.0%) | 330 (100.0%) |
| 45 to 54 Years | 27 (6.9%) | 375 (95.2%) |
| 55 to 64 Years | 0 (0.0%) | 70 (100.0%) |
| 65 to 74 Years | 235 (100.0%) | 128 (54.5%) |
| 75 Years and over | 100 (100.0%) | 100 (100.0%) |
| Total | 406 (20.2%) | 1,821 (90.4%) |
Disability Status by Sex by Age in Grill
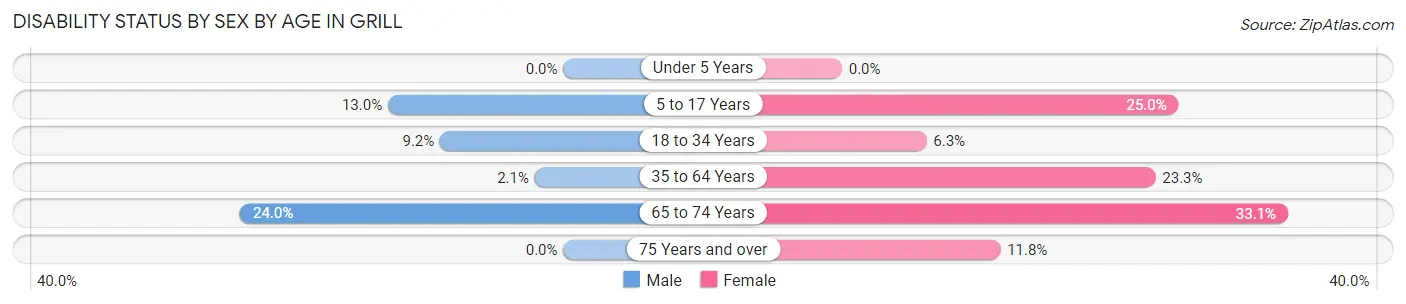
| Age Bracket | Male | Female |
| Under 5 Years | 0 (0.0%) | 0 (0.0%) |
| 5 to 17 Years | 25 (13.0%) | 12 (25.0%) |
| 18 to 34 Years | 15 (9.1%) | 23 (6.3%) |
| 35 to 64 Years | 7 (2.1%) | 108 (23.3%) |
| 65 to 74 Years | 18 (24.0%) | 53 (33.1%) |
| 75 Years and over | 0 (0.0%) | 6 (11.8%) |
Disability Class by Sex by Age in Grill
Disability Class: Hearing Difficulty
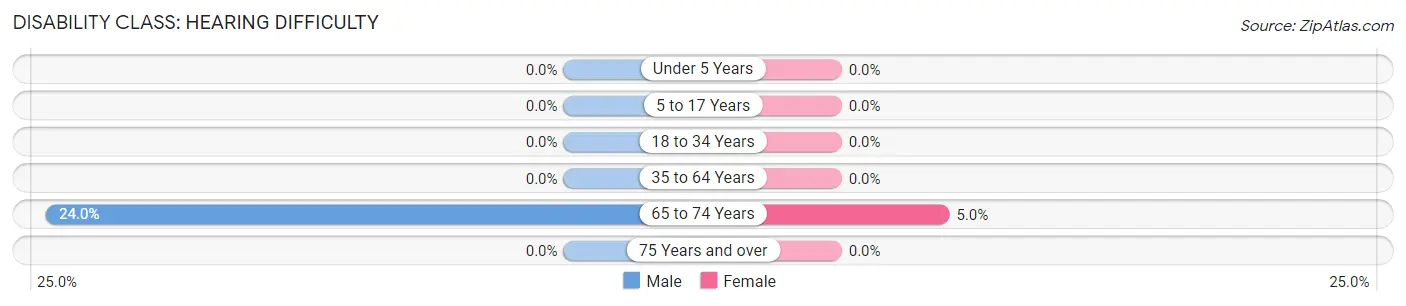
| Age Bracket | Male | Female |
| Under 5 Years | 0 (0.0%) | 0 (0.0%) |
| 5 to 17 Years | 0 (0.0%) | 0 (0.0%) |
| 18 to 34 Years | 0 (0.0%) | 0 (0.0%) |
| 35 to 64 Years | 0 (0.0%) | 0 (0.0%) |
| 65 to 74 Years | 18 (24.0%) | 8 (5.0%) |
| 75 Years and over | 0 (0.0%) | 0 (0.0%) |
Disability Class: Vision Difficulty
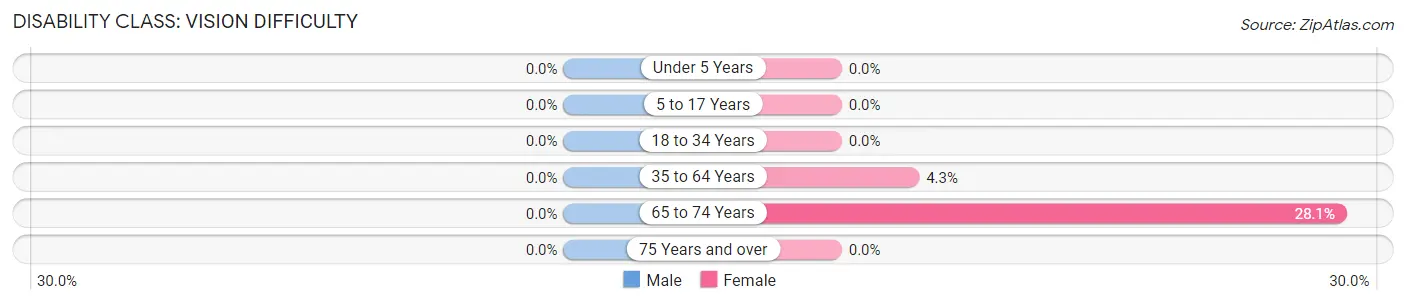
| Age Bracket | Male | Female |
| Under 5 Years | 0 (0.0%) | 0 (0.0%) |
| 5 to 17 Years | 0 (0.0%) | 0 (0.0%) |
| 18 to 34 Years | 0 (0.0%) | 0 (0.0%) |
| 35 to 64 Years | 0 (0.0%) | 20 (4.3%) |
| 65 to 74 Years | 0 (0.0%) | 45 (28.1%) |
| 75 Years and over | 0 (0.0%) | 0 (0.0%) |
Disability Class: Cognitive Difficulty
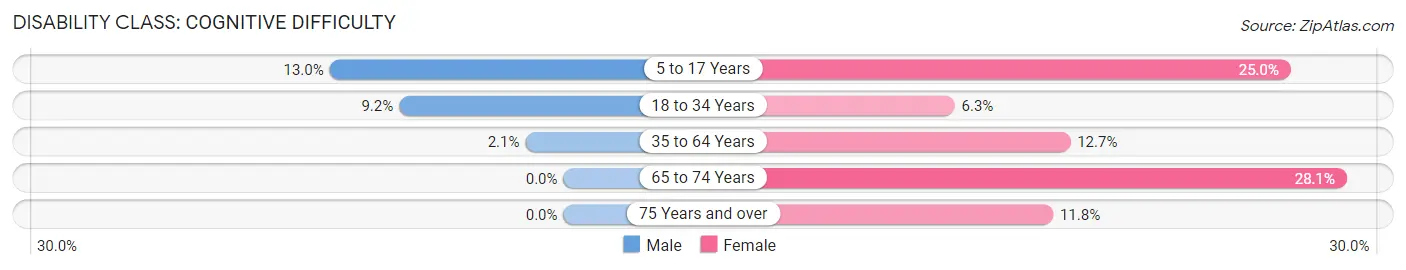
| Age Bracket | Male | Female |
| 5 to 17 Years | 25 (13.0%) | 12 (25.0%) |
| 18 to 34 Years | 15 (9.1%) | 23 (6.3%) |
| 35 to 64 Years | 7 (2.1%) | 59 (12.7%) |
| 65 to 74 Years | 0 (0.0%) | 45 (28.1%) |
| 75 Years and over | 0 (0.0%) | 6 (11.8%) |
Disability Class: Ambulatory Difficulty
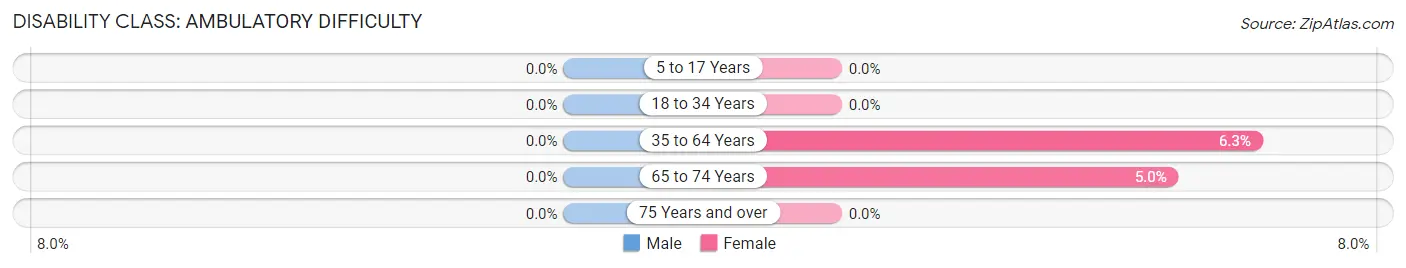
| Age Bracket | Male | Female |
| 5 to 17 Years | 0 (0.0%) | 0 (0.0%) |
| 18 to 34 Years | 0 (0.0%) | 0 (0.0%) |
| 35 to 64 Years | 0 (0.0%) | 29 (6.2%) |
| 65 to 74 Years | 0 (0.0%) | 8 (5.0%) |
| 75 Years and over | 0 (0.0%) | 0 (0.0%) |
Disability Class: Self-Care Difficulty
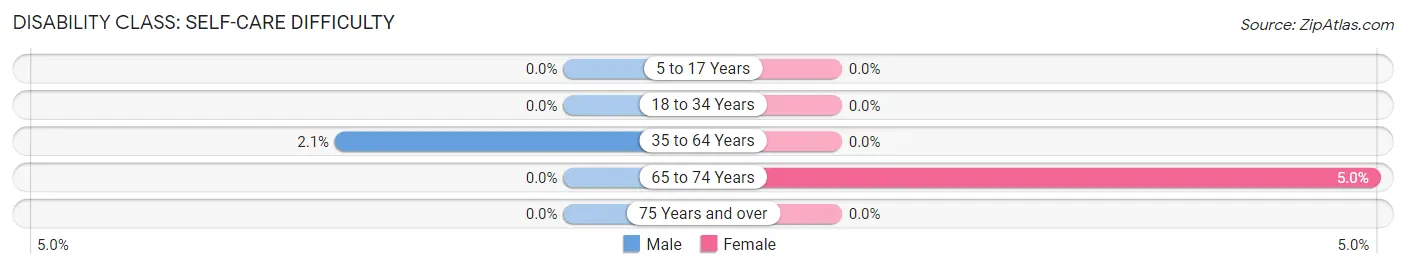
| Age Bracket | Male | Female |
| 5 to 17 Years | 0 (0.0%) | 0 (0.0%) |
| 18 to 34 Years | 0 (0.0%) | 0 (0.0%) |
| 35 to 64 Years | 7 (2.1%) | 0 (0.0%) |
| 65 to 74 Years | 0 (0.0%) | 8 (5.0%) |
| 75 Years and over | 0 (0.0%) | 0 (0.0%) |
Technology Access in Grill
Computing Device Access in Grill
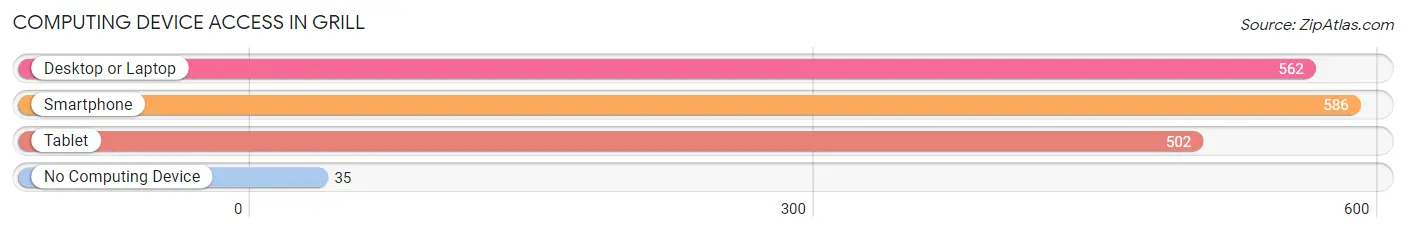
| Device Type | # Households | % Households |
| Desktop or Laptop | 562 | 90.5% |
| Smartphone | 586 | 94.4% |
| Tablet | 502 | 80.8% |
| No Computing Device | 35 | 5.6% |
| Total | 621 | 100.0% |
Internet Access in Grill
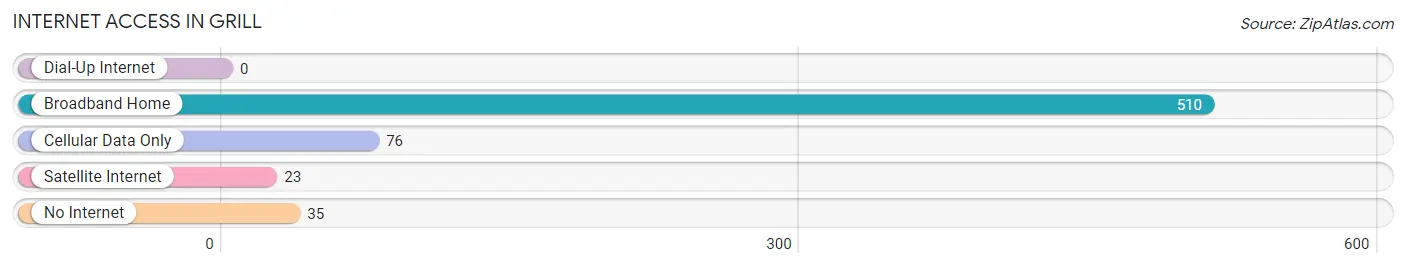
| Internet Type | # Households | % Households |
| Dial-Up Internet | 0 | 0.0% |
| Broadband Home | 510 | 82.1% |
| Cellular Data Only | 76 | 12.2% |
| Satellite Internet | 23 | 3.7% |
| No Internet | 35 | 5.6% |
| Total | 621 | 100.0% |
Grill Summary
Grill, Pennsylvania is a small borough located in the southwestern corner of Allegheny County, Pennsylvania. It is situated along the banks of the Monongahela River, approximately 20 miles south of Pittsburgh. The borough was founded in 1876 and is home to a population of approximately 1,000 people.
History
The area that is now Grill, Pennsylvania was originally inhabited by the Lenape Native Americans. The first European settlers arrived in the area in the late 1700s and early 1800s. The area was known as “Grill’s Landing” and was named after the first settler, John Grill. The area was primarily used for farming and the production of coal and iron ore.
In 1876, the area was officially incorporated as the Borough of Grill. The borough was named after the first settler, John Grill. The borough was primarily a farming community and the main industry was coal mining. The coal mines provided employment for many of the residents of Grill.
Geography
Grill, Pennsylvania is located in the southwestern corner of Allegheny County, Pennsylvania. It is situated along the banks of the Monongahela River, approximately 20 miles south of Pittsburgh. The borough is bordered by the boroughs of Elizabeth and West Elizabeth to the north, Forward Township to the east, and the boroughs of Clairton and Glassport to the south. The borough has a total area of 0.7 square miles, all of which is land.
Economy
The economy of Grill, Pennsylvania is primarily based on the production of coal and iron ore. The coal mines in the area provide employment for many of the residents of Grill. The borough also has a few small businesses, including a grocery store, a hardware store, and a few restaurants.
Demographics
As of the 2010 census, the population of Grill, Pennsylvania was 1,000 people. The racial makeup of the borough was 97.7% White, 0.7% African American, 0.2% Native American, 0.2% Asian, and 1.2% from two or more races. The median household income was $37,500 and the median family income was $45,000. The per capita income was $17,000.
Conclusion
Grill, Pennsylvania is a small borough located in the southwestern corner of Allegheny County, Pennsylvania. It is situated along the banks of the Monongahela River, approximately 20 miles south of Pittsburgh. The borough was founded in 1876 and is home to a population of approximately 1,000 people. The economy of Grill is primarily based on the production of coal and iron ore. The racial makeup of the borough is predominantly White, with a small percentage of African American, Native American, and Asian residents. The median household income is $37,500 and the median family income is $45,000.
Common Questions
What is Per Capita Income in Grill?
Per Capita income in Grill is $44,670.
What is the Median Family Income in Grill?
Median Family Income in Grill is $134,435.
What is the Median Household income in Grill?
Median Household Income in Grill is $133,891.
What is Income or Wage Gap in Grill?
Income or Wage Gap in Grill is 18.0%.
Women in Grill earn 82.0 cents for every dollar earned by a man.
What is Inequality or Gini Index in Grill?
Inequality or Gini Index in Grill is 0.28.
What is the Total Population of Grill?
Total Population of Grill is 2,015.
What is the Total Male Population of Grill?
Total Male Population of Grill is 926.
What is the Total Female Population of Grill?
Total Female Population of Grill is 1,089.
What is the Ratio of Males per 100 Females in Grill?
There are 85.03 Males per 100 Females in Grill.
What is the Ratio of Females per 100 Males in Grill?
There are 117.60 Females per 100 Males in Grill.
What is the Median Population Age in Grill?
Median Population Age in Grill is 37.7 Years.
What is the Average Family Size in Grill
Average Family Size in Grill is 3.4 People.
What is the Average Household Size in Grill
Average Household Size in Grill is 3.2 People.
How Large is the Labor Force in Grill?
There are 1,231 People in the Labor Forcein in Grill.
What is the Percentage of People in the Labor Force in Grill?
73.1% of People are in the Labor Force in Grill.
What is the Unemployment Rate in Grill?
Unemployment Rate in Grill is 0.3%.