Chesterbrook, PA Map & Demographics
Chesterbrook Map
Chesterbrook Overview
$66,253
PER CAPITA INCOME
$167,634
AVG FAMILY INCOME
$135,849
AVG HOUSEHOLD INCOME
43.9%
WAGE / INCOME GAP [ % ]
56.1¢/ $1
WAGE / INCOME GAP [ $ ]
0.40
INEQUALITY / GINI INDEX
5,428
TOTAL POPULATION
2,780
MALE POPULATION
2,648
FEMALE POPULATION
104.98
MALES / 100 FEMALES
95.25
FEMALES / 100 MALES
39.3
MEDIAN AGE
3.3
AVG FAMILY SIZE
2.4
AVG HOUSEHOLD SIZE
3,135
LABOR FORCE [ PEOPLE ]
72.5%
PERCENT IN LABOR FORCE
3.0%
UNEMPLOYMENT RATE
Income in Chesterbrook
Income Overview in Chesterbrook
Per Capita Income in Chesterbrook is $66,253, while median incomes of families and households are $167,634 and $135,849 respectively.
| Characteristic | Number | Measure |
| Per Capita Income | 5,428 | $66,253 |
| Median Family Income | 1,203 | $167,634 |
| Mean Family Income | 1,203 | $200,459 |
| Median Household Income | 2,295 | $135,849 |
| Mean Household Income | 2,295 | $152,881 |
| Income Deficit | 1,203 | $0 |
| Wage / Income Gap (%) | 5,428 | 43.93% |
| Wage / Income Gap ($) | 5,428 | 56.07¢ per $1 |
| Gini / Inequality Index | 5,428 | 0.40 |
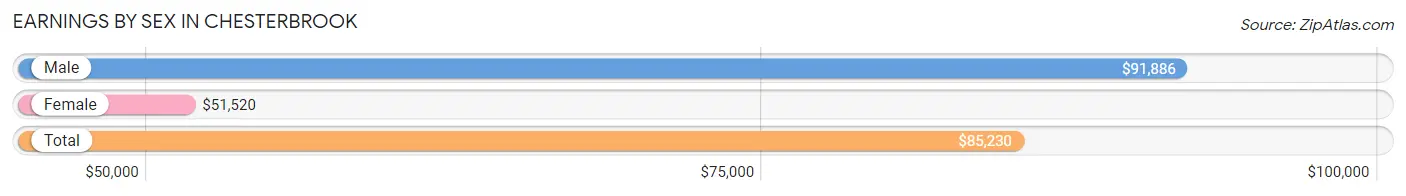
Earnings by Sex in Chesterbrook
Average Earnings in Chesterbrook are $85,230, $91,886 for men and $51,520 for women, a difference of 43.9%.
| Sex | Number | Average Earnings |
| Male | 1,870 (56.5%) | $91,886 |
| Female | 1,438 (43.5%) | $51,520 |
| Total | 3,308 (100.0%) | $85,230 |
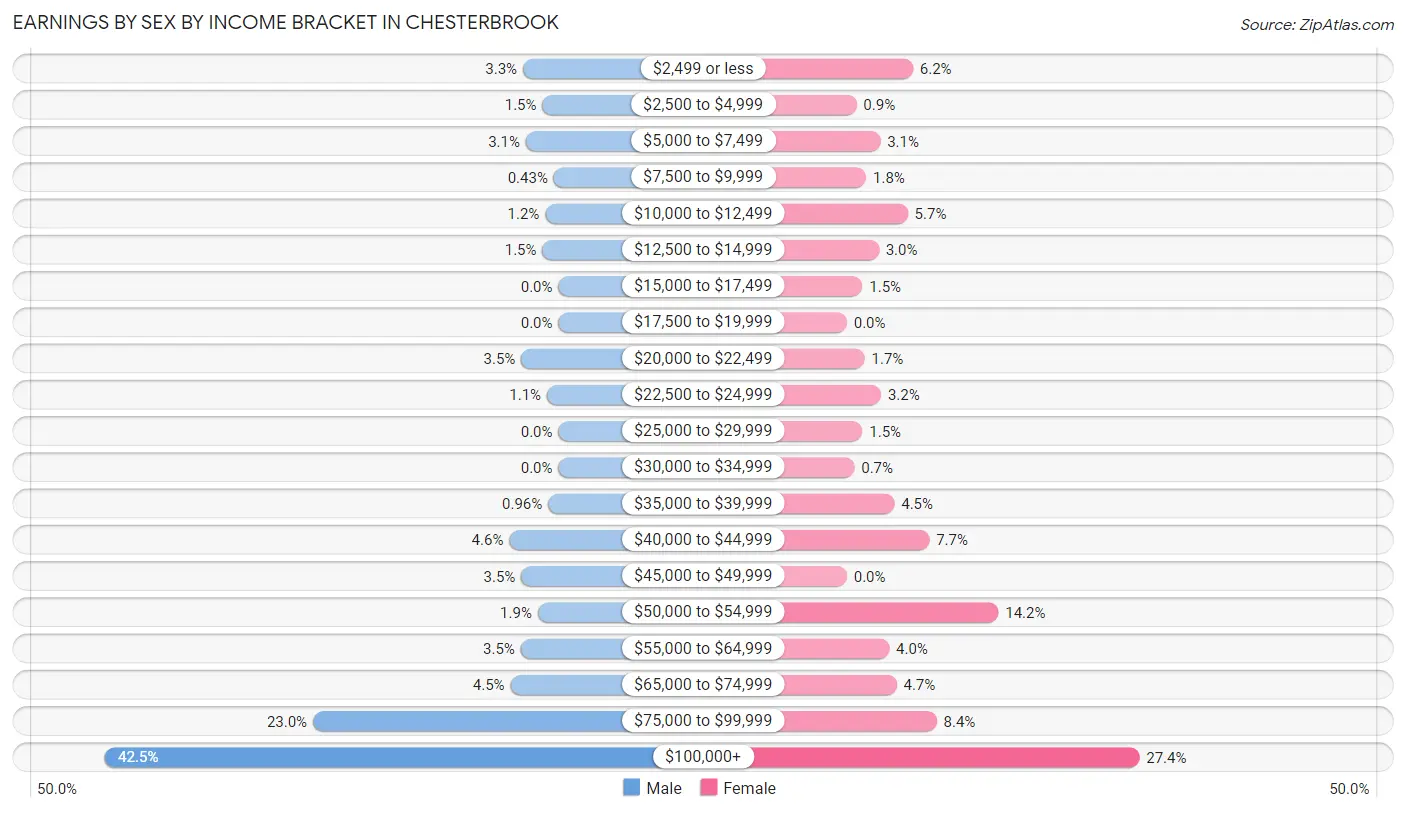
Earnings by Sex by Income Bracket in Chesterbrook
The most common earnings brackets in Chesterbrook are $100,000+ for men (794 | 42.5%) and $100,000+ for women (394 | 27.4%).
| Income | Male | Female |
| $2,499 or less | 62 (3.3%) | 89 (6.2%) |
| $2,500 to $4,999 | 28 (1.5%) | 13 (0.9%) |
| $5,000 to $7,499 | 57 (3.0%) | 45 (3.1%) |
| $7,500 to $9,999 | 8 (0.4%) | 26 (1.8%) |
| $10,000 to $12,499 | 23 (1.2%) | 82 (5.7%) |
| $12,500 to $14,999 | 28 (1.5%) | 43 (3.0%) |
| $15,000 to $17,499 | 0 (0.0%) | 21 (1.5%) |
| $17,500 to $19,999 | 0 (0.0%) | 0 (0.0%) |
| $20,000 to $22,499 | 65 (3.5%) | 24 (1.7%) |
| $22,500 to $24,999 | 20 (1.1%) | 46 (3.2%) |
| $25,000 to $29,999 | 0 (0.0%) | 21 (1.5%) |
| $30,000 to $34,999 | 0 (0.0%) | 10 (0.7%) |
| $35,000 to $39,999 | 18 (1.0%) | 64 (4.4%) |
| $40,000 to $44,999 | 86 (4.6%) | 111 (7.7%) |
| $45,000 to $49,999 | 65 (3.5%) | 0 (0.0%) |
| $50,000 to $54,999 | 36 (1.9%) | 204 (14.2%) |
| $55,000 to $64,999 | 66 (3.5%) | 57 (4.0%) |
| $65,000 to $74,999 | 84 (4.5%) | 67 (4.7%) |
| $75,000 to $99,999 | 430 (23.0%) | 121 (8.4%) |
| $100,000+ | 794 (42.5%) | 394 (27.4%) |
| Total | 1,870 (100.0%) | 1,438 (100.0%) |
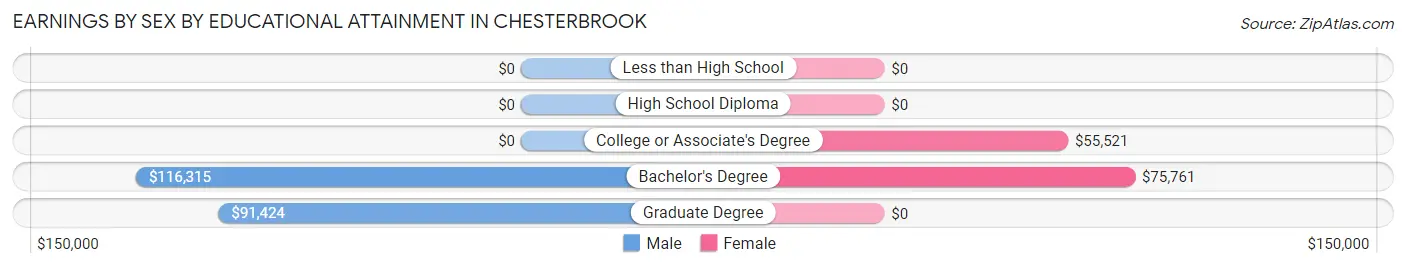
Earnings by Sex by Educational Attainment in Chesterbrook
Average earnings in Chesterbrook are $96,620 for men and $52,206 for women, a difference of 46.0%. Men with an educational attainment of bachelor's degree enjoy the highest average annual earnings of $116,315, while those with graduate degree education earn the least with $91,424. Women with an educational attainment of bachelor's degree earn the most with the average annual earnings of $75,761, while those with college or associate's degree education have the smallest earnings of $55,521.
| Educational Attainment | Male Income | Female Income |
| Less than High School | - | - |
| High School Diploma | - | - |
| College or Associate's Degree | - | - |
| Bachelor's Degree | $116,315 | $75,761 |
| Graduate Degree | $91,424 | $0 |
| Total | $96,620 | $52,206 |
Family Income in Chesterbrook
Family Income Brackets in Chesterbrook
According to the Chesterbrook family income data, there are 491 families falling into the $200,000+ income range, which is the most common income bracket and makes up 40.8% of all families.
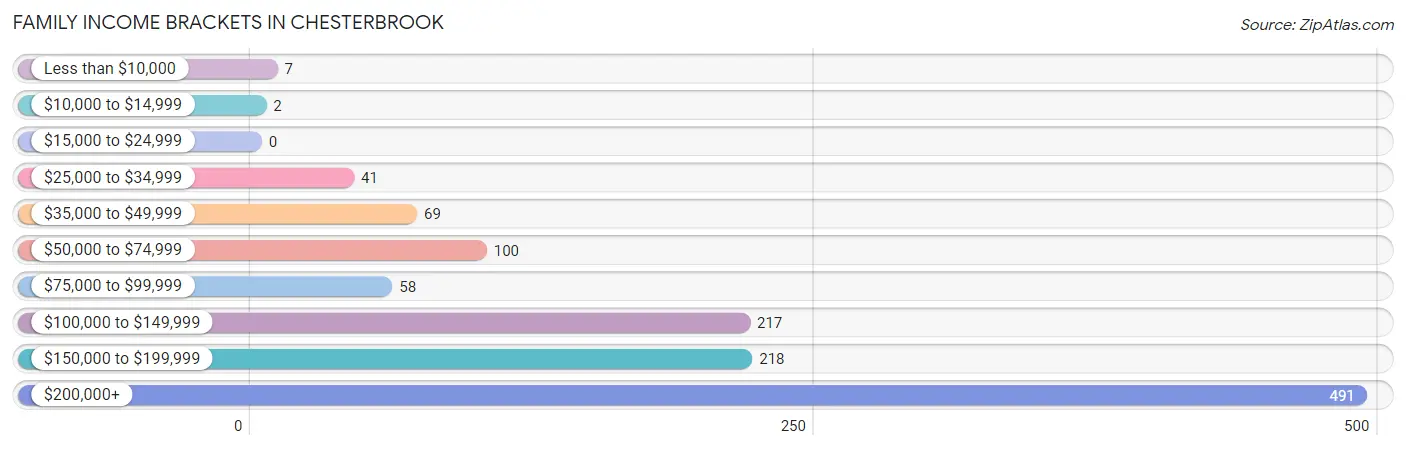
| Income Bracket | # Families | % Families |
| Less than $10,000 | 7 | 0.6% |
| $10,000 to $14,999 | 2 | 0.2% |
| $15,000 to $24,999 | 0 | 0.0% |
| $25,000 to $34,999 | 41 | 3.4% |
| $35,000 to $49,999 | 69 | 5.7% |
| $50,000 to $74,999 | 100 | 8.3% |
| $75,000 to $99,999 | 58 | 4.8% |
| $100,000 to $149,999 | 217 | 18.0% |
| $150,000 to $199,999 | 218 | 18.1% |
| $200,000+ | 491 | 40.8% |
Family Income by Famaliy Size in Chesterbrook
4-person families (436 | 36.2%) account for the highest median family income in Chesterbrook with $170,288 per family, while 2-person families (479 | 39.8%) have the highest median income of $74,812 per family member.
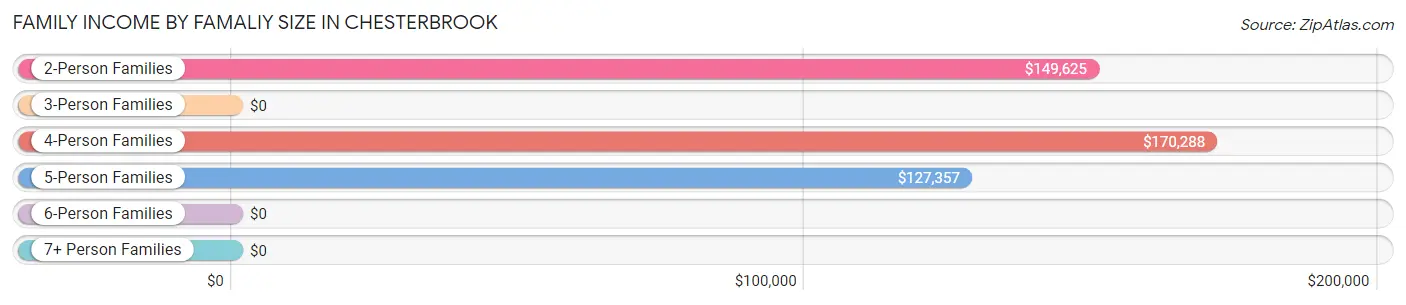
| Income Bracket | # Families | Median Income |
| 2-Person Families | 479 (39.8%) | $149,625 |
| 3-Person Families | 188 (15.6%) | $0 |
| 4-Person Families | 436 (36.2%) | $170,288 |
| 5-Person Families | 66 (5.5%) | $127,357 |
| 6-Person Families | 16 (1.3%) | $0 |
| 7+ Person Families | 18 (1.5%) | $0 |
| Total | 1,203 (100.0%) | $167,634 |
Family Income by Number of Earners in Chesterbrook
The median family income in Chesterbrook is $167,634, with families comprising 3+ earners (204) having the highest median family income of $250,001, while families with no earners (91) have the lowest median family income of $59,219, accounting for 17.0% and 7.6% of families, respectively.
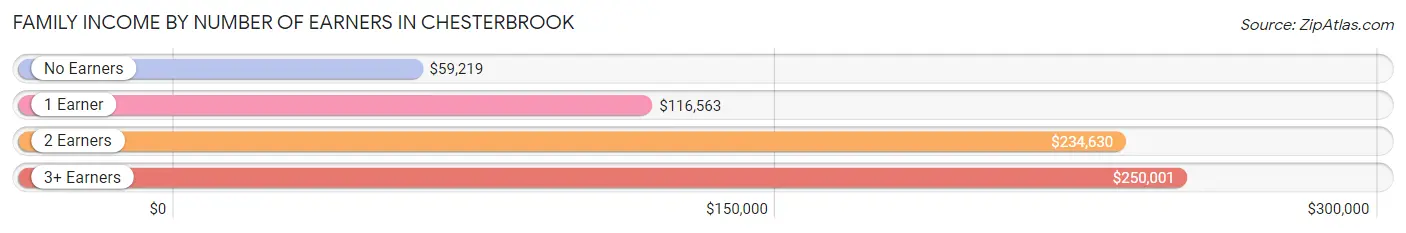
| Number of Earners | # Families | Median Income |
| No Earners | 91 (7.6%) | $59,219 |
| 1 Earner | 376 (31.3%) | $116,563 |
| 2 Earners | 532 (44.2%) | $234,630 |
| 3+ Earners | 204 (17.0%) | $250,001 |
| Total | 1,203 (100.0%) | $167,634 |
Household Income in Chesterbrook
Household Income Brackets in Chesterbrook
With 542 households falling in the category, the $200,000+ income range is the most frequent in Chesterbrook, accounting for 23.6% of all households. In contrast, only 25 households (1.1%) fall into the $10,000 to $14,999 income bracket, making it the least populous group.
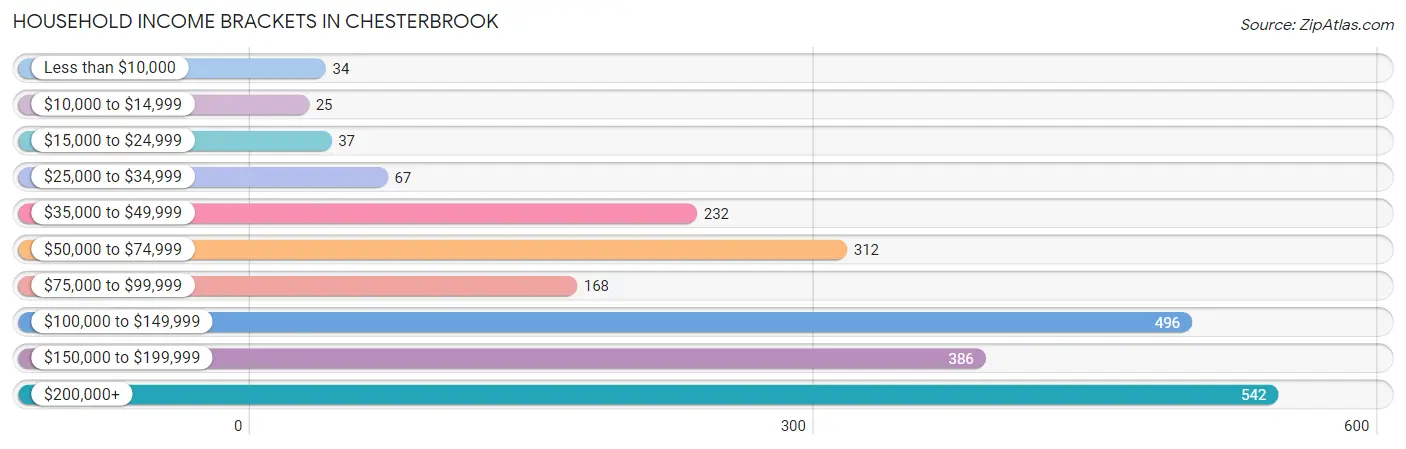
| Income Bracket | # Households | % Households |
| Less than $10,000 | 34 | 1.5% |
| $10,000 to $14,999 | 25 | 1.1% |
| $15,000 to $24,999 | 37 | 1.6% |
| $25,000 to $34,999 | 67 | 2.9% |
| $35,000 to $49,999 | 232 | 10.1% |
| $50,000 to $74,999 | 312 | 13.6% |
| $75,000 to $99,999 | 168 | 7.3% |
| $100,000 to $149,999 | 496 | 21.6% |
| $150,000 to $199,999 | 386 | 16.8% |
| $200,000+ | 542 | 23.6% |
Household Income by Householder Age in Chesterbrook
The median household income in Chesterbrook is $135,849, with the highest median household income of $164,286 found in the 45 to 64 years age bracket for the primary householder. A total of 826 households (36.0%) fall into this category. Meanwhile, the 15 to 24 years age bracket for the primary householder has the lowest median household income of $0, with 52 households (2.3%) in this group.
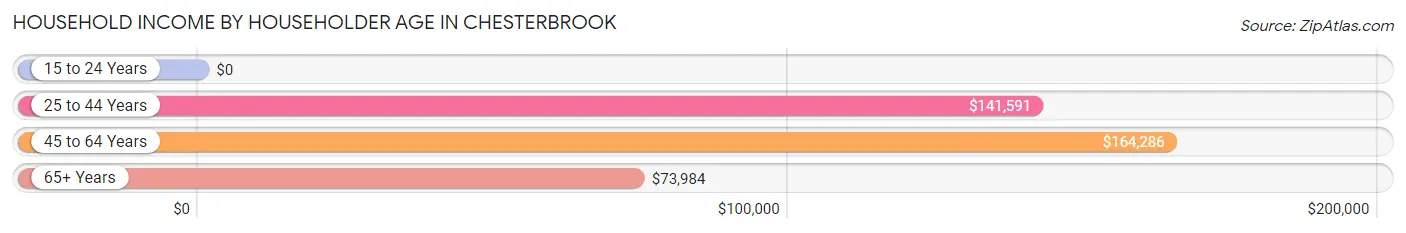
| Income Bracket | # Households | Median Income |
| 15 to 24 Years | 52 (2.3%) | $0 |
| 25 to 44 Years | 772 (33.6%) | $141,591 |
| 45 to 64 Years | 826 (36.0%) | $164,286 |
| 65+ Years | 645 (28.1%) | $73,984 |
| Total | 2,295 (100.0%) | $135,849 |
Poverty in Chesterbrook
Income Below Poverty by Sex and Age in Chesterbrook
With 2.7% poverty level for males and 0.4% for females among the residents of Chesterbrook, 18 to 24 year old males and 65 to 74 year old females are the most vulnerable to poverty, with 23 males (20.7%) and 10 females (2.8%) in their respective age groups living below the poverty level.
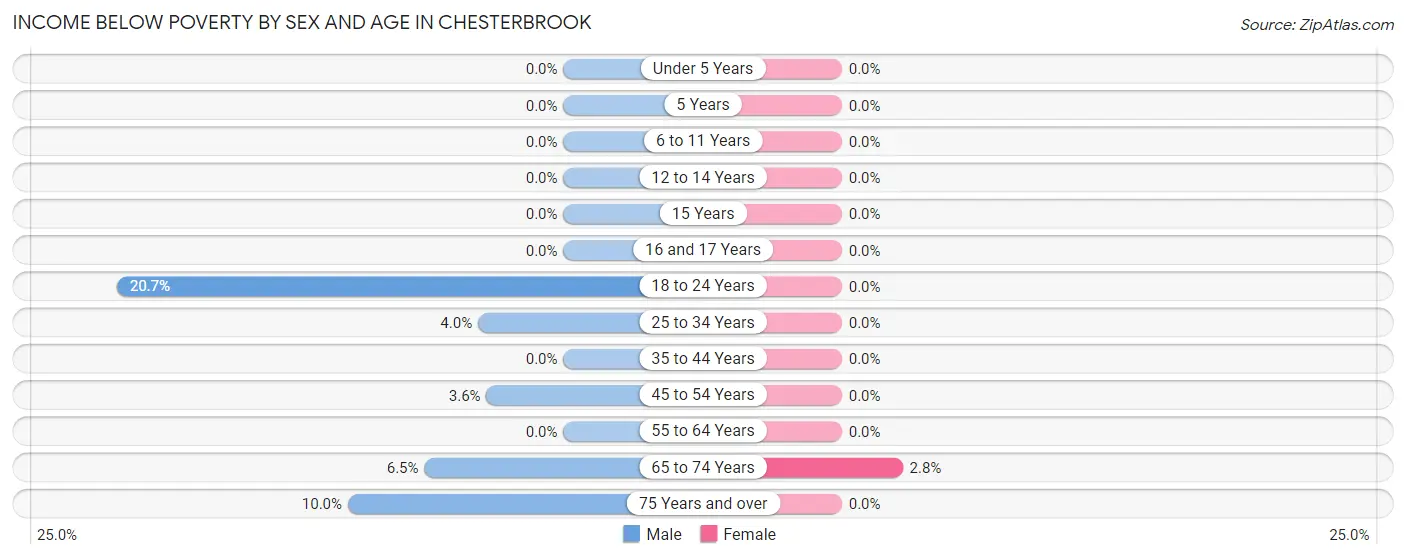
| Age Bracket | Male | Female |
| Under 5 Years | 0 (0.0%) | 0 (0.0%) |
| 5 Years | 0 (0.0%) | 0 (0.0%) |
| 6 to 11 Years | 0 (0.0%) | 0 (0.0%) |
| 12 to 14 Years | 0 (0.0%) | 0 (0.0%) |
| 15 Years | 0 (0.0%) | 0 (0.0%) |
| 16 and 17 Years | 0 (0.0%) | 0 (0.0%) |
| 18 to 24 Years | 23 (20.7%) | 0 (0.0%) |
| 25 to 34 Years | 17 (4.0%) | 0 (0.0%) |
| 35 to 44 Years | 0 (0.0%) | 0 (0.0%) |
| 45 to 54 Years | 9 (3.6%) | 0 (0.0%) |
| 55 to 64 Years | 0 (0.0%) | 0 (0.0%) |
| 65 to 74 Years | 18 (6.5%) | 10 (2.8%) |
| 75 Years and over | 7 (10.0%) | 0 (0.0%) |
| Total | 74 (2.7%) | 10 (0.4%) |
Income Above Poverty by Sex and Age in Chesterbrook
According to the poverty statistics in Chesterbrook, males aged under 5 years and females aged under 5 years are the age groups that are most secure financially, with 100.0% of males and 100.0% of females in these age groups living above the poverty line.
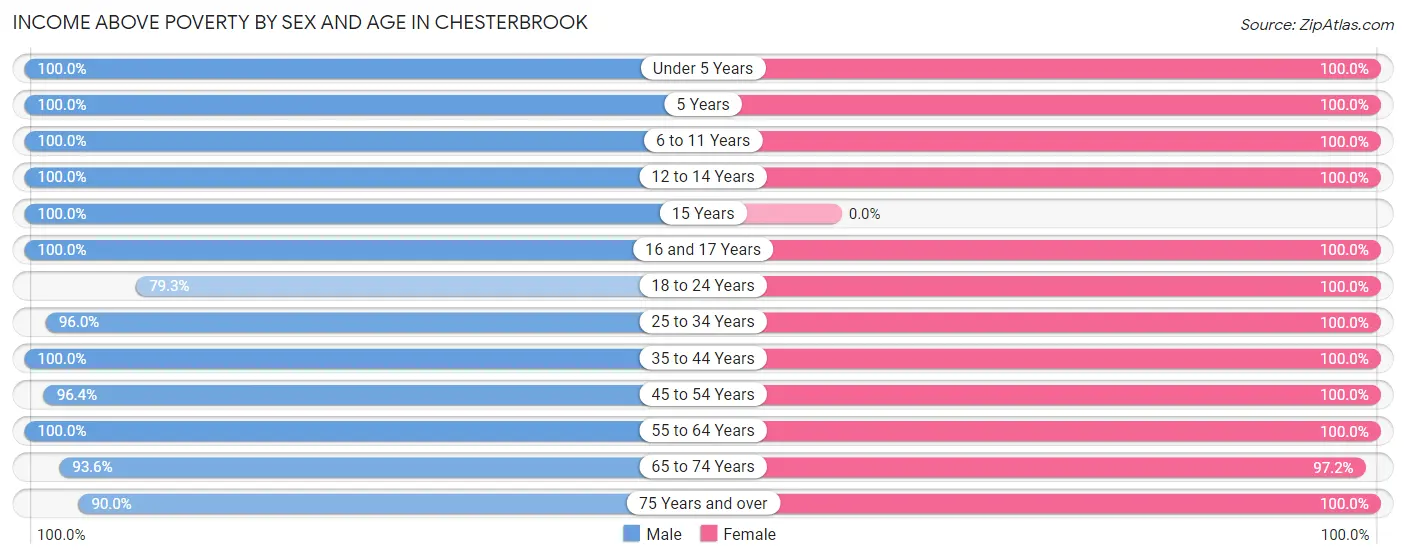
| Age Bracket | Male | Female |
| Under 5 Years | 251 (100.0%) | 135 (100.0%) |
| 5 Years | 8 (100.0%) | 33 (100.0%) |
| 6 to 11 Years | 208 (100.0%) | 108 (100.0%) |
| 12 to 14 Years | 144 (100.0%) | 175 (100.0%) |
| 15 Years | 42 (100.0%) | 0 (0.0%) |
| 16 and 17 Years | 31 (100.0%) | 55 (100.0%) |
| 18 to 24 Years | 88 (79.3%) | 115 (100.0%) |
| 25 to 34 Years | 412 (96.0%) | 432 (100.0%) |
| 35 to 44 Years | 588 (100.0%) | 322 (100.0%) |
| 45 to 54 Years | 243 (96.4%) | 267 (100.0%) |
| 55 to 64 Years | 367 (100.0%) | 441 (100.0%) |
| 65 to 74 Years | 261 (93.5%) | 345 (97.2%) |
| 75 Years and over | 63 (90.0%) | 210 (100.0%) |
| Total | 2,706 (97.3%) | 2,638 (99.6%) |
Income Below Poverty Among Married-Couple Families in Chesterbrook
The poverty statistics for married-couple families in Chesterbrook show that 0.6% or 7 of the total 1,113 families live below the poverty line. Families with no children have the highest poverty rate of 1.3%, comprising of 7 families. On the other hand, families with 1 or 2 children have the lowest poverty rate of 0.0%, which includes 0 families.
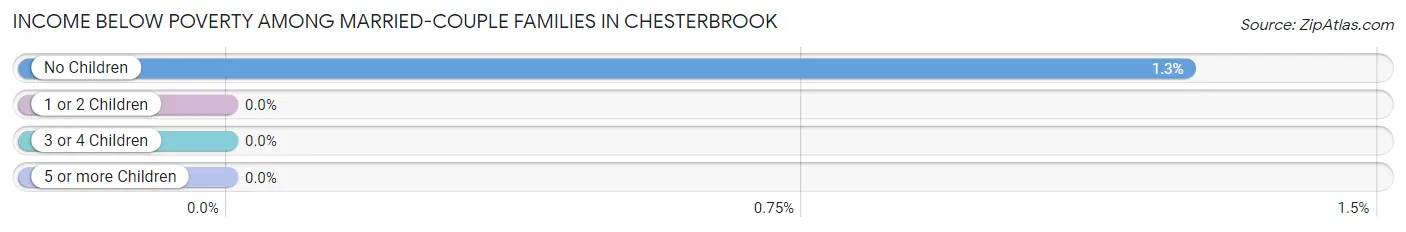
| Children | Above Poverty | Below Poverty |
| No Children | 554 (98.8%) | 7 (1.3%) |
| 1 or 2 Children | 483 (100.0%) | 0 (0.0%) |
| 3 or 4 Children | 51 (100.0%) | 0 (0.0%) |
| 5 or more Children | 18 (100.0%) | 0 (0.0%) |
| Total | 1,106 (99.4%) | 7 (0.6%) |
Income Below Poverty Among Single-Parent Households in Chesterbrook
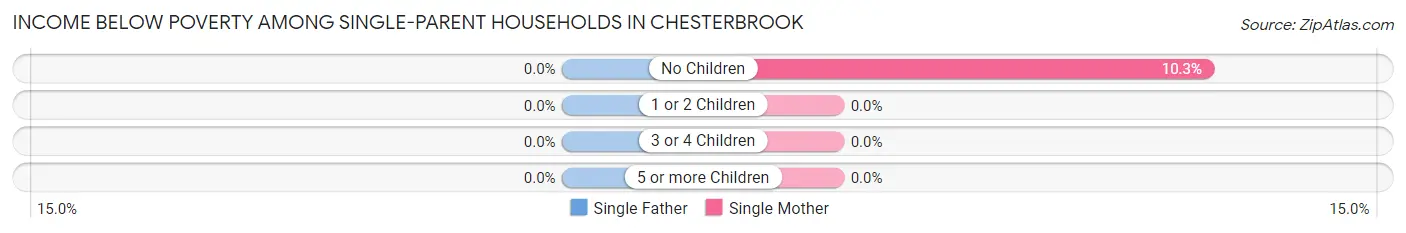
| Children | Single Father | Single Mother |
| No Children | 0 (0.0%) | 3 (10.3%) |
| 1 or 2 Children | 0 (0.0%) | 0 (0.0%) |
| 3 or 4 Children | 0 (0.0%) | 0 (0.0%) |
| 5 or more Children | 0 (0.0%) | 0 (0.0%) |
| Total | 0 (0.0%) | 3 (3.3%) |
Income Below Poverty Among Married-Couple vs Single-Parent Households in Chesterbrook
The poverty data for Chesterbrook shows that 7 of the married-couple family households (0.6%) and 3 of the single-parent households (3.3%) are living below the poverty level. Within the married-couple family households, those with no children have the highest poverty rate, with 7 households (1.3%) falling below the poverty line. Among the single-parent households, those with no children have the highest poverty rate, with 3 household (10.3%) living below poverty.
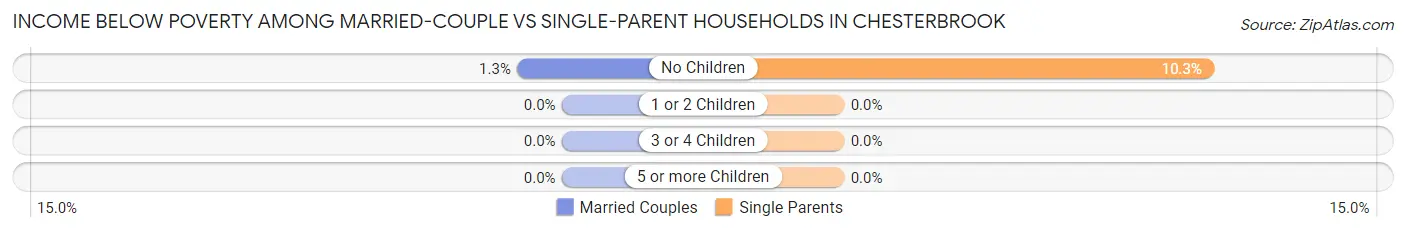
| Children | Married-Couple Families | Single-Parent Households |
| No Children | 7 (1.3%) | 3 (10.3%) |
| 1 or 2 Children | 0 (0.0%) | 0 (0.0%) |
| 3 or 4 Children | 0 (0.0%) | 0 (0.0%) |
| 5 or more Children | 0 (0.0%) | 0 (0.0%) |
| Total | 7 (0.6%) | 3 (3.3%) |
Race in Chesterbrook
The most populous races in Chesterbrook are White / Caucasian (3,159 | 58.2%), Asian (1,727 | 31.8%), and Black / African American (268 | 4.9%).
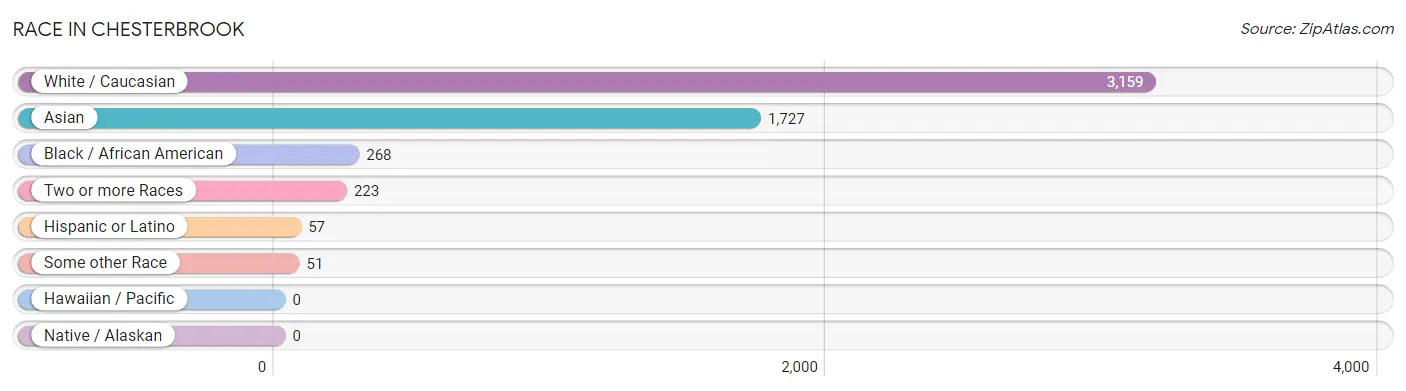
| Race | # Population | % Population |
| Asian | 1,727 | 31.8% |
| Black / African American | 268 | 4.9% |
| Hawaiian / Pacific | 0 | 0.0% |
| Hispanic or Latino | 57 | 1.1% |
| Native / Alaskan | 0 | 0.0% |
| White / Caucasian | 3,159 | 58.2% |
| Two or more Races | 223 | 4.1% |
| Some other Race | 51 | 0.9% |
| Total | 5,428 | 100.0% |
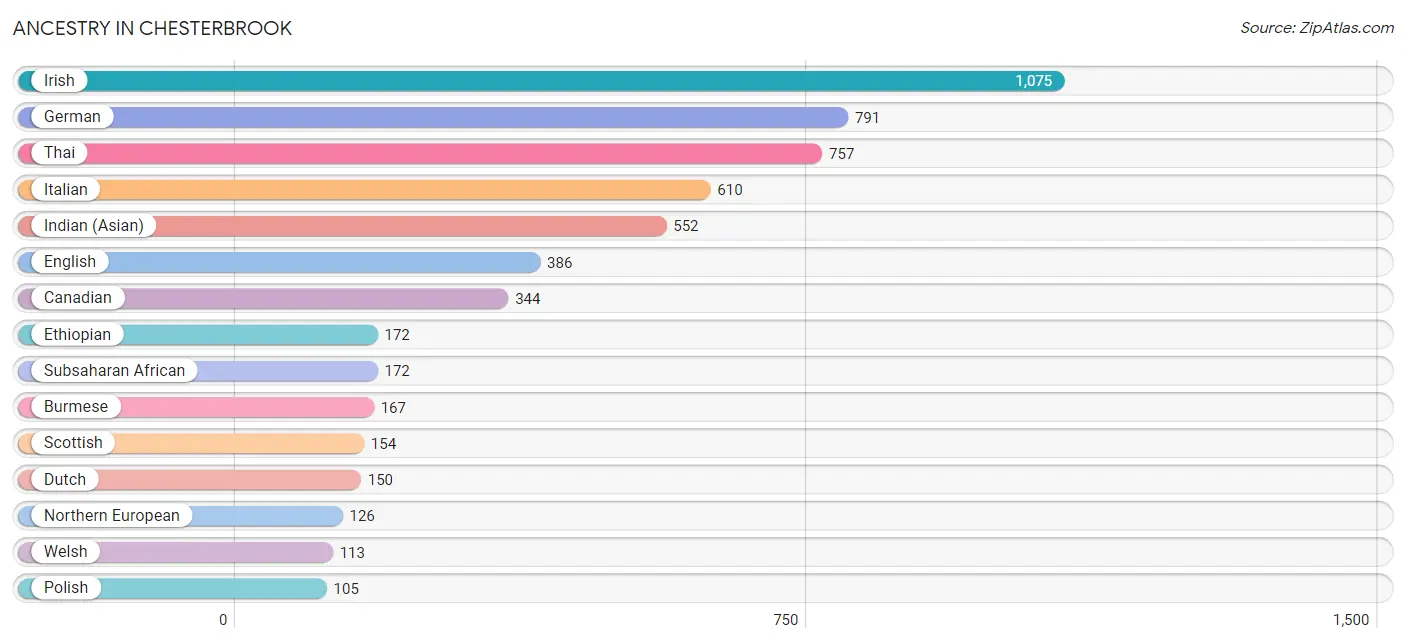
Ancestry in Chesterbrook
The most populous ancestries reported in Chesterbrook are Irish (1,075 | 19.8%), German (791 | 14.6%), Thai (757 | 14.0%), Italian (610 | 11.2%), and Indian (Asian) (552 | 10.2%), together accounting for 69.7% of all Chesterbrook residents.
| Ancestry | # Population | % Population |
| American | 72 | 1.3% |
| Bhutanese | 24 | 0.4% |
| Bulgarian | 20 | 0.4% |
| Burmese | 167 | 3.1% |
| Cambodian | 12 | 0.2% |
| Canadian | 344 | 6.3% |
| Colombian | 45 | 0.8% |
| Czechoslovakian | 33 | 0.6% |
| Dutch | 150 | 2.8% |
| Eastern European | 29 | 0.5% |
| Ecuadorian | 12 | 0.2% |
| English | 386 | 7.1% |
| Ethiopian | 172 | 3.2% |
| European | 22 | 0.4% |
| French | 38 | 0.7% |
| French Canadian | 85 | 1.6% |
| German | 791 | 14.6% |
| Guyanese | 43 | 0.8% |
| Hungarian | 46 | 0.9% |
| Indian (Asian) | 552 | 10.2% |
| Iranian | 38 | 0.7% |
| Irish | 1,075 | 19.8% |
| Italian | 610 | 11.2% |
| Jamaican | 83 | 1.5% |
| Japanese | 70 | 1.3% |
| Korean | 71 | 1.3% |
| Lithuanian | 56 | 1.0% |
| Malaysian | 10 | 0.2% |
| Northern European | 126 | 2.3% |
| Pakistani | 28 | 0.5% |
| Pennsylvania German | 16 | 0.3% |
| Polish | 105 | 1.9% |
| Russian | 77 | 1.4% |
| Scotch-Irish | 38 | 0.7% |
| Scottish | 154 | 2.8% |
| Slovak | 24 | 0.4% |
| South American | 57 | 1.1% |
| Soviet Union | 13 | 0.2% |
| Sri Lankan | 70 | 1.3% |
| Subsaharan African | 172 | 3.2% |
| Swiss | 29 | 0.5% |
| Thai | 757 | 14.0% |
| Ukrainian | 34 | 0.6% |
| Welsh | 113 | 2.1% | View All 44 Rows |
Immigrants in Chesterbrook
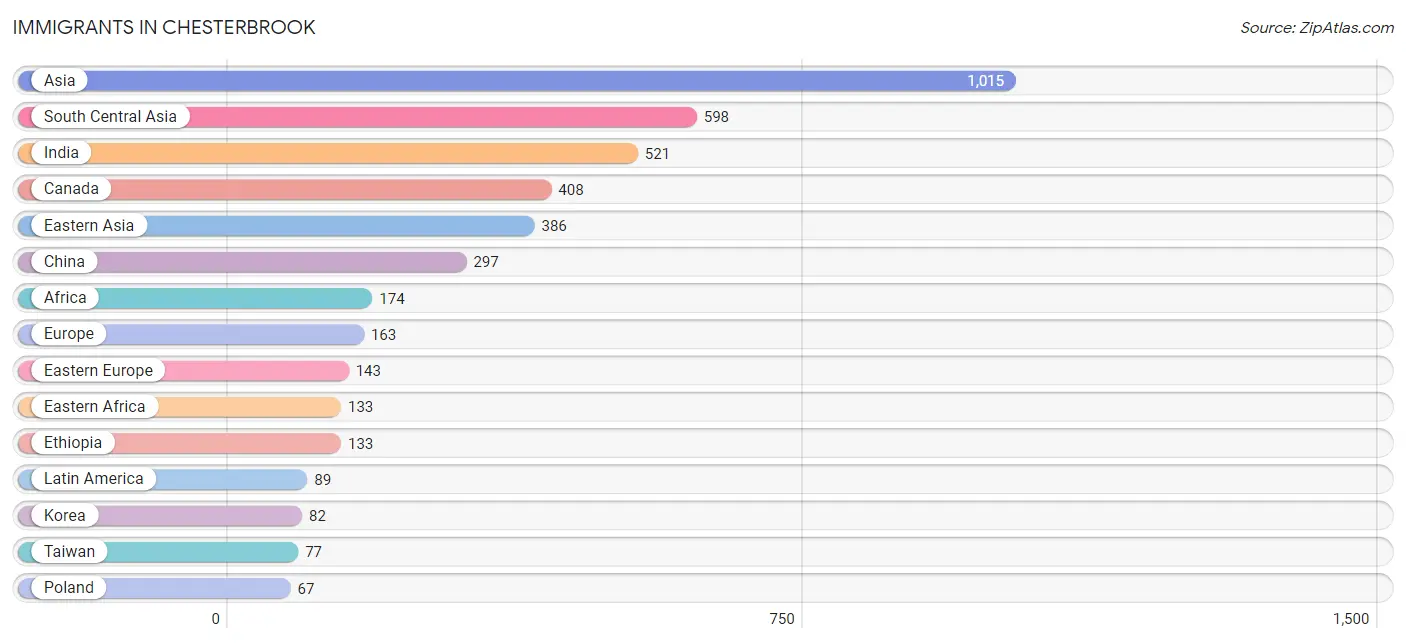
The most numerous immigrant groups reported in Chesterbrook came from Asia (1,015 | 18.7%), South Central Asia (598 | 11.0%), India (521 | 9.6%), Canada (408 | 7.5%), and Eastern Asia (386 | 7.1%), together accounting for 53.9% of all Chesterbrook residents.
| Immigration Origin | # Population | % Population |
| Africa | 174 | 3.2% |
| Asia | 1,015 | 18.7% |
| Australia | 15 | 0.3% |
| Bangladesh | 13 | 0.2% |
| Bulgaria | 20 | 0.4% |
| Cambodia | 16 | 0.3% |
| Canada | 408 | 7.5% |
| Caribbean | 24 | 0.4% |
| China | 297 | 5.5% |
| Colombia | 22 | 0.4% |
| Eastern Africa | 133 | 2.5% |
| Eastern Asia | 386 | 7.1% |
| Eastern Europe | 143 | 2.6% |
| Ethiopia | 133 | 2.5% |
| Europe | 163 | 3.0% |
| Germany | 5 | 0.1% |
| Guyana | 43 | 0.8% |
| Hungary | 7 | 0.1% |
| India | 521 | 9.6% |
| Iran | 38 | 0.7% |
| Jamaica | 24 | 0.4% |
| Japan | 7 | 0.1% |
| Korea | 82 | 1.5% |
| Latin America | 89 | 1.6% |
| Moldova | 13 | 0.2% |
| Northern Europe | 15 | 0.3% |
| Oceania | 15 | 0.3% |
| Pakistan | 26 | 0.5% |
| Poland | 67 | 1.2% |
| Russia | 36 | 0.7% |
| South America | 65 | 1.2% |
| South Central Asia | 598 | 11.0% |
| South Eastern Asia | 31 | 0.6% |
| Taiwan | 77 | 1.4% |
| Thailand | 15 | 0.3% |
| Western Europe | 5 | 0.1% | View All 36 Rows |
Sex and Age in Chesterbrook
Sex and Age in Chesterbrook
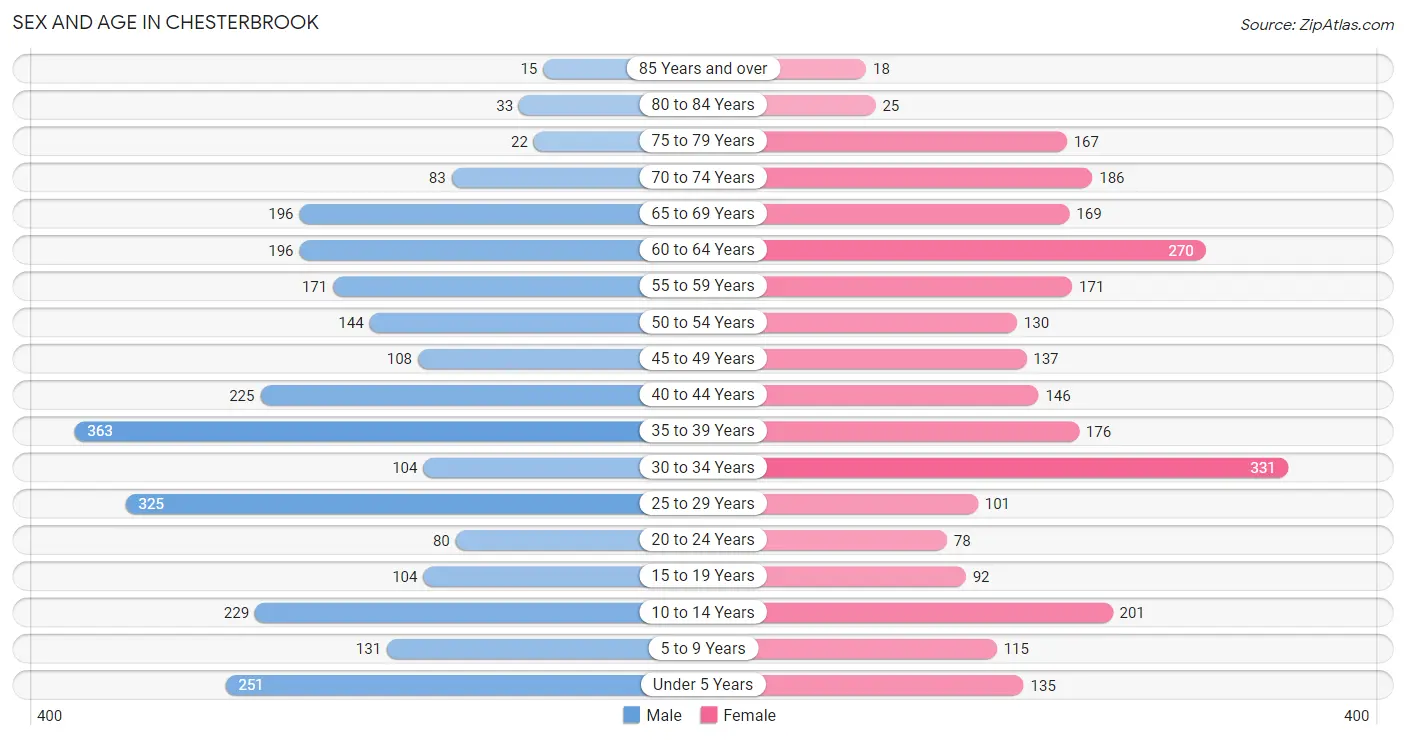
The most populous age groups in Chesterbrook are 35 to 39 Years (363 | 13.1%) for men and 30 to 34 Years (331 | 12.5%) for women.
| Age Bracket | Male | Female |
| Under 5 Years | 251 (9.0%) | 135 (5.1%) |
| 5 to 9 Years | 131 (4.7%) | 115 (4.3%) |
| 10 to 14 Years | 229 (8.2%) | 201 (7.6%) |
| 15 to 19 Years | 104 (3.7%) | 92 (3.5%) |
| 20 to 24 Years | 80 (2.9%) | 78 (2.9%) |
| 25 to 29 Years | 325 (11.7%) | 101 (3.8%) |
| 30 to 34 Years | 104 (3.7%) | 331 (12.5%) |
| 35 to 39 Years | 363 (13.1%) | 176 (6.7%) |
| 40 to 44 Years | 225 (8.1%) | 146 (5.5%) |
| 45 to 49 Years | 108 (3.9%) | 137 (5.2%) |
| 50 to 54 Years | 144 (5.2%) | 130 (4.9%) |
| 55 to 59 Years | 171 (6.1%) | 171 (6.5%) |
| 60 to 64 Years | 196 (7.0%) | 270 (10.2%) |
| 65 to 69 Years | 196 (7.0%) | 169 (6.4%) |
| 70 to 74 Years | 83 (3.0%) | 186 (7.0%) |
| 75 to 79 Years | 22 (0.8%) | 167 (6.3%) |
| 80 to 84 Years | 33 (1.2%) | 25 (0.9%) |
| 85 Years and over | 15 (0.5%) | 18 (0.7%) |
| Total | 2,780 (100.0%) | 2,648 (100.0%) |
Families and Households in Chesterbrook
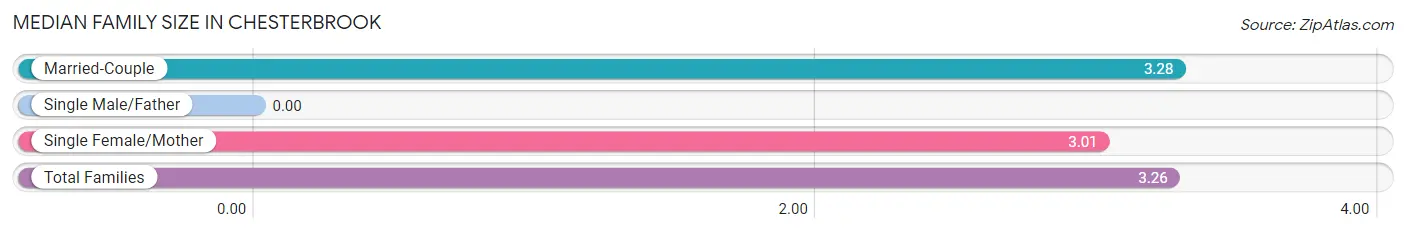
Median Family Size in Chesterbrook
| Family Type | # Families | Family Size |
| Married-Couple | 1,113 (92.5%) | 3.28 |
| Single Male/Father | 0 (0.0%) | - |
| Single Female/Mother | 90 (7.5%) | 3.01 |
| Total Families | 1,203 (100.0%) | 3.26 |
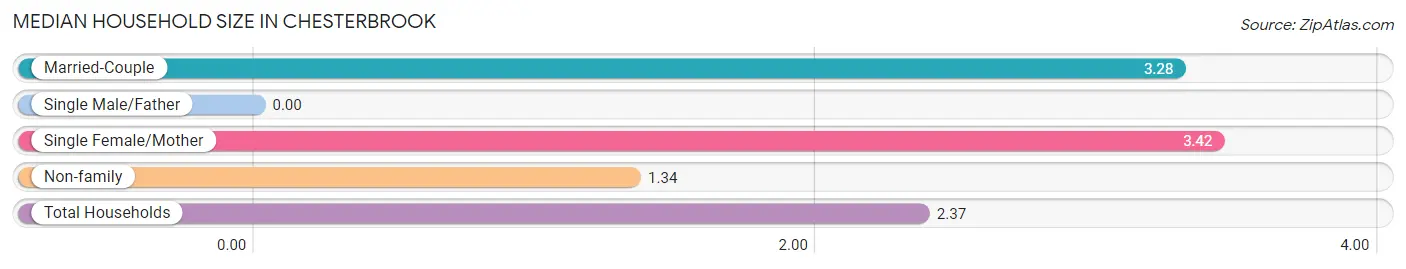
Median Household Size in Chesterbrook
| Household Type | # Households | Household Size |
| Married-Couple | 1,113 (48.5%) | 3.28 |
| Single Male/Father | 0 (0.0%) | - |
| Single Female/Mother | 90 (3.9%) | 3.42 |
| Non-family | 1,092 (47.6%) | 1.34 |
| Total Households | 2,295 (100.0%) | 2.37 |
Household Size by Marriage Status in Chesterbrook
Out of a total of 2,295 households in Chesterbrook, 1,203 (52.4%) are family households, while 1,092 (47.6%) are nonfamily households. The most numerous type of family households are 2-person households, comprising 479, and the most common type of nonfamily households are 1-person households, comprising 781.
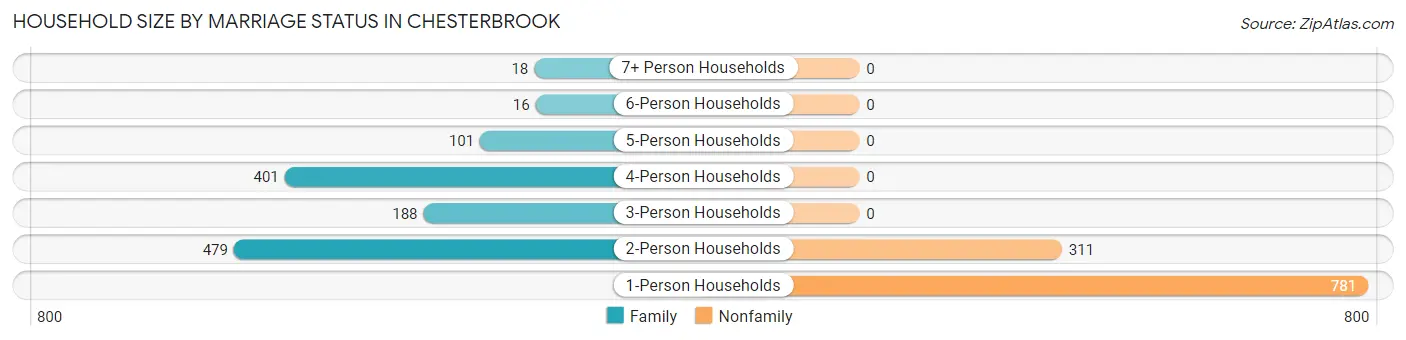
| Household Size | Family Households | Nonfamily Households |
| 1-Person Households | - | 781 (34.0%) |
| 2-Person Households | 479 (20.9%) | 311 (13.6%) |
| 3-Person Households | 188 (8.2%) | 0 (0.0%) |
| 4-Person Households | 401 (17.5%) | 0 (0.0%) |
| 5-Person Households | 101 (4.4%) | 0 (0.0%) |
| 6-Person Households | 16 (0.7%) | 0 (0.0%) |
| 7+ Person Households | 18 (0.8%) | 0 (0.0%) |
| Total | 1,203 (52.4%) | 1,092 (47.6%) |
Female Fertility in Chesterbrook
Fertility by Age in Chesterbrook
Average fertility rate in Chesterbrook is 129.0 births per 1,000 women. Women in the age bracket of 35 to 50 years have the highest fertility rate with 151.0 births per 1,000 women. Women in the age bracket of 35 to 50 years acount for 54.2% of all women with births.
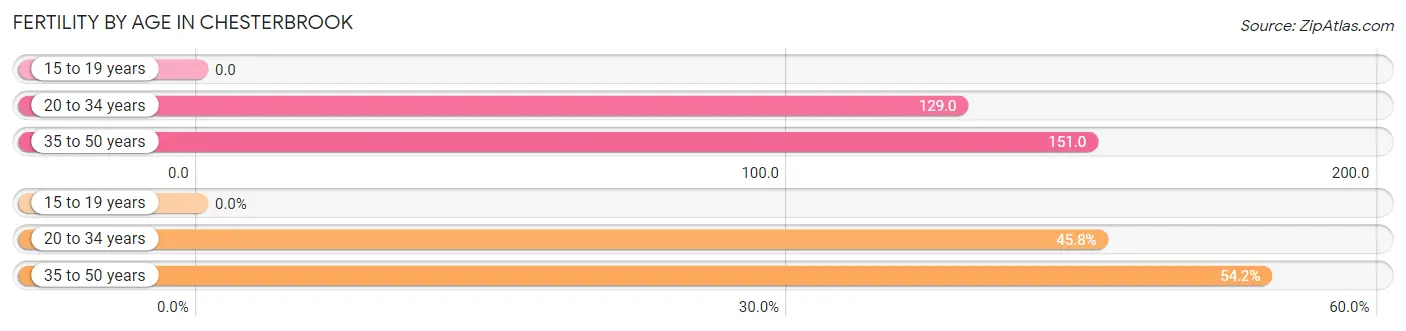
| Age Bracket | Women with Births | Births / 1,000 Women |
| 15 to 19 years | 0 (0.0%) | 0.0 |
| 20 to 34 years | 66 (45.8%) | 129.0 |
| 35 to 50 years | 78 (54.2%) | 151.0 |
| Total | 144 (100.0%) | 129.0 |
Fertility by Age by Marriage Status in Chesterbrook
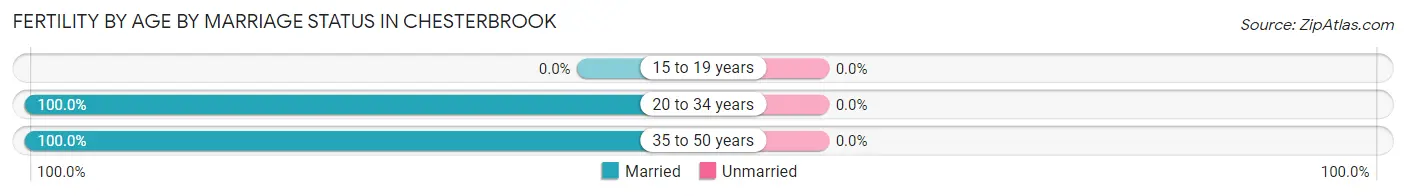
| Age Bracket | Married | Unmarried |
| 15 to 19 years | 0 (0.0%) | 0 (0.0%) |
| 20 to 34 years | 66 (100.0%) | 0 (0.0%) |
| 35 to 50 years | 78 (100.0%) | 0 (0.0%) |
| Total | 144 (100.0%) | 0 (0.0%) |
Fertility by Education in Chesterbrook
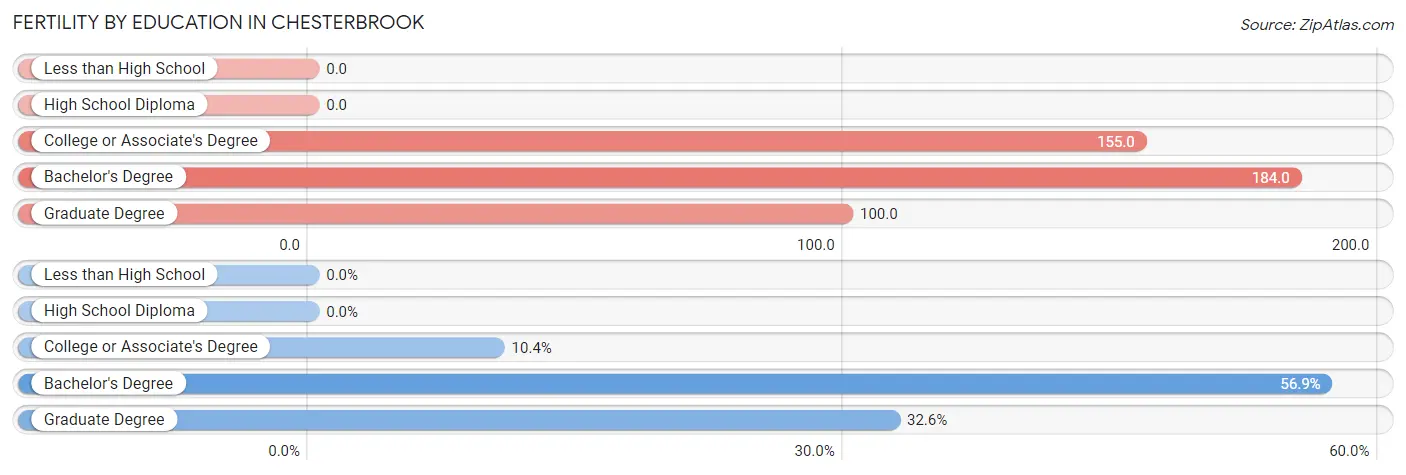
| Educational Attainment | Women with Births | Births / 1,000 Women |
| Less than High School | 0 (0.0%) | 0.0 |
| High School Diploma | 0 (0.0%) | 0.0 |
| College or Associate's Degree | 15 (10.4%) | 155.0 |
| Bachelor's Degree | 82 (56.9%) | 184.0 |
| Graduate Degree | 47 (32.6%) | 100.0 |
| Total | 144 (100.0%) | 129.0 |
Fertility by Education by Marriage Status in Chesterbrook
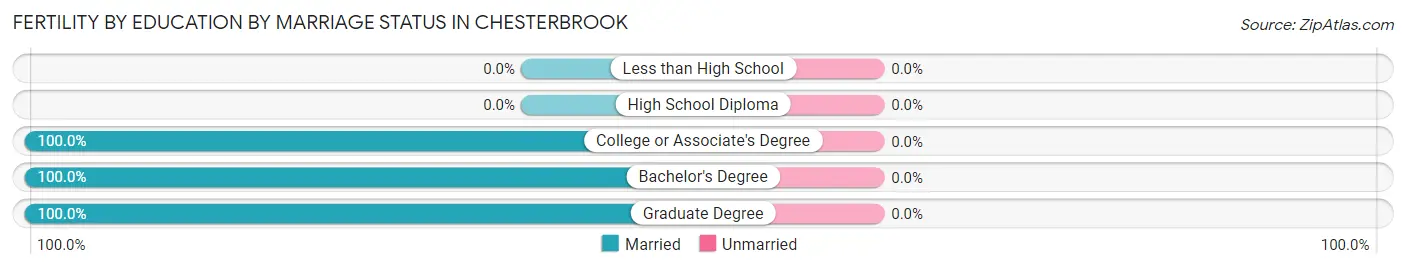
| Educational Attainment | Married | Unmarried |
| Less than High School | 0 (0.0%) | 0 (0.0%) |
| High School Diploma | 0 (0.0%) | 0 (0.0%) |
| College or Associate's Degree | 15 (100.0%) | 0 (0.0%) |
| Bachelor's Degree | 82 (100.0%) | 0 (0.0%) |
| Graduate Degree | 47 (100.0%) | 0 (0.0%) |
| Total | 144 (100.0%) | 0 (0.0%) |
Employment Characteristics in Chesterbrook
Employment by Class of Employer in Chesterbrook
Among the 3,024 employed individuals in Chesterbrook, private company employees (1,712 | 56.6%), not-for-profit organizations (628 | 20.8%), and self-employed (incorporated) (239 | 7.9%) make up the most common classes of employment.
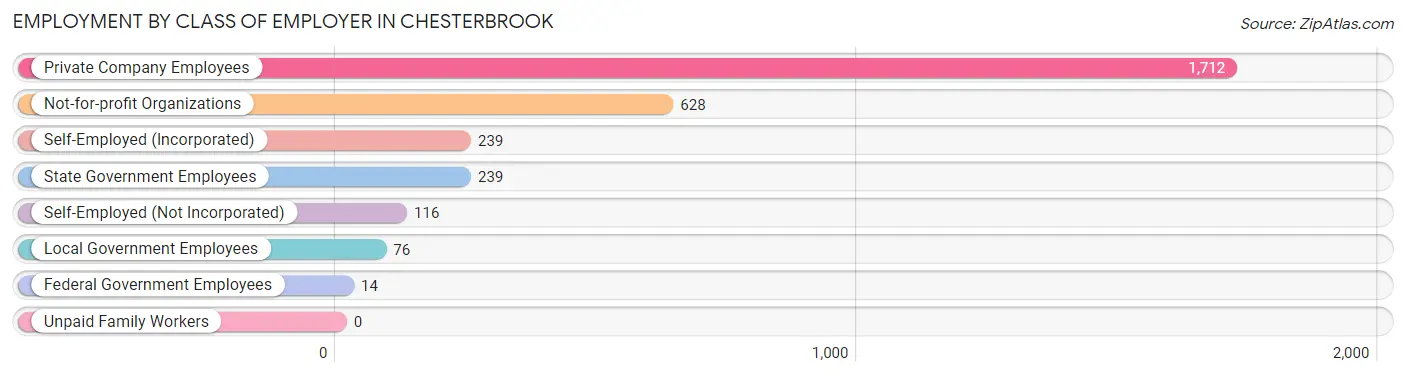
| Employer Class | # Employees | % Employees |
| Private Company Employees | 1,712 | 56.6% |
| Self-Employed (Incorporated) | 239 | 7.9% |
| Self-Employed (Not Incorporated) | 116 | 3.8% |
| Not-for-profit Organizations | 628 | 20.8% |
| Local Government Employees | 76 | 2.5% |
| State Government Employees | 239 | 7.9% |
| Federal Government Employees | 14 | 0.5% |
| Unpaid Family Workers | 0 | 0.0% |
| Total | 3,024 | 100.0% |
Employment Status by Age in Chesterbrook
According to the labor force statistics for Chesterbrook, out of the total population over 16 years of age (4,324), 72.5% or 3,135 individuals are in the labor force, with 3.0% or 94 of them unemployed. The age group with the highest labor force participation rate is 25 to 29 years, with 100.0% or 426 individuals in the labor force. Within the labor force, the 60 to 64 years age range has the highest percentage of unemployed individuals, with 13.0% or 47 of them being unemployed.
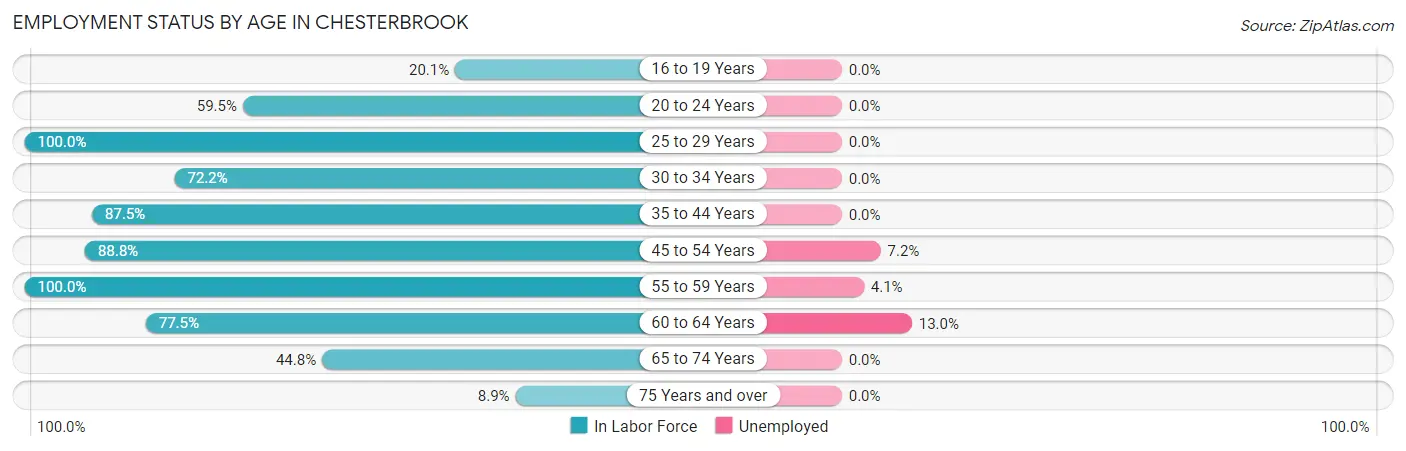
| Age Bracket | In Labor Force | Unemployed |
| 16 to 19 Years | 31 (20.1%) | 0 (0.0%) |
| 20 to 24 Years | 94 (59.5%) | 0 (0.0%) |
| 25 to 29 Years | 426 (100.0%) | 0 (0.0%) |
| 30 to 34 Years | 314 (72.2%) | 0 (0.0%) |
| 35 to 44 Years | 796 (87.5%) | 0 (0.0%) |
| 45 to 54 Years | 461 (88.8%) | 33 (7.2%) |
| 55 to 59 Years | 342 (100.0%) | 14 (4.1%) |
| 60 to 64 Years | 361 (77.5%) | 47 (13.0%) |
| 65 to 74 Years | 284 (44.8%) | 0 (0.0%) |
| 75 Years and over | 25 (8.9%) | 0 (0.0%) |
| Total | 3,135 (72.5%) | 94 (3.0%) |
Employment Status by Educational Attainment in Chesterbrook
According to labor force statistics for Chesterbrook, 87.2% of individuals (2,701) out of the total population between 25 and 64 years of age (3,098) are in the labor force, with 3.5% or 95 of them being unemployed. The group with the highest labor force participation rate are those with the educational attainment of bachelor's degree or higher, with 90.0% or 2,422 individuals in the labor force. Within the labor force, individuals with high school diploma education have the highest percentage of unemployment, with 54.8% or 17 of them being unemployed.
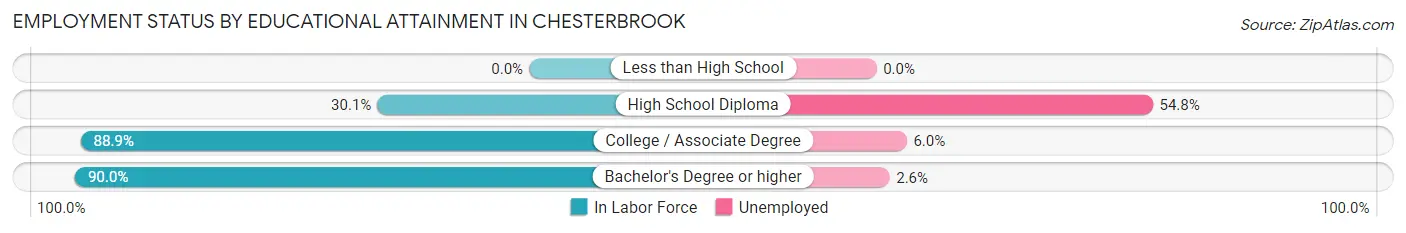
| Educational Attainment | In Labor Force | Unemployed |
| Less than High School | 0 (0.0%) | 0 (0.0%) |
| High School Diploma | 31 (30.1%) | 56 (54.8%) |
| College / Associate Degree | 248 (88.9%) | 17 (6.0%) |
| Bachelor's Degree or higher | 2,422 (90.0%) | 70 (2.6%) |
| Total | 2,701 (87.2%) | 108 (3.5%) |
Employment Occupations by Sex in Chesterbrook
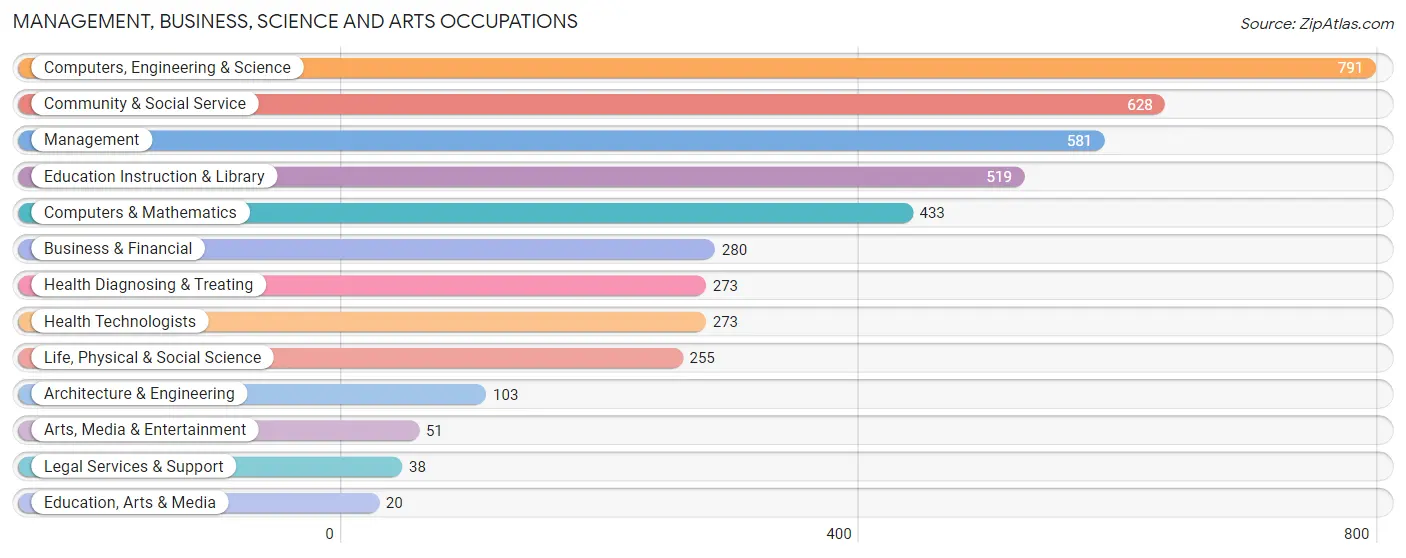
Management, Business, Science and Arts Occupations
The most common Management, Business, Science and Arts occupations in Chesterbrook are Computers, Engineering & Science (791 | 26.0%), Community & Social Service (628 | 20.7%), Management (581 | 19.1%), Education Instruction & Library (519 | 17.1%), and Computers & Mathematics (433 | 14.2%).
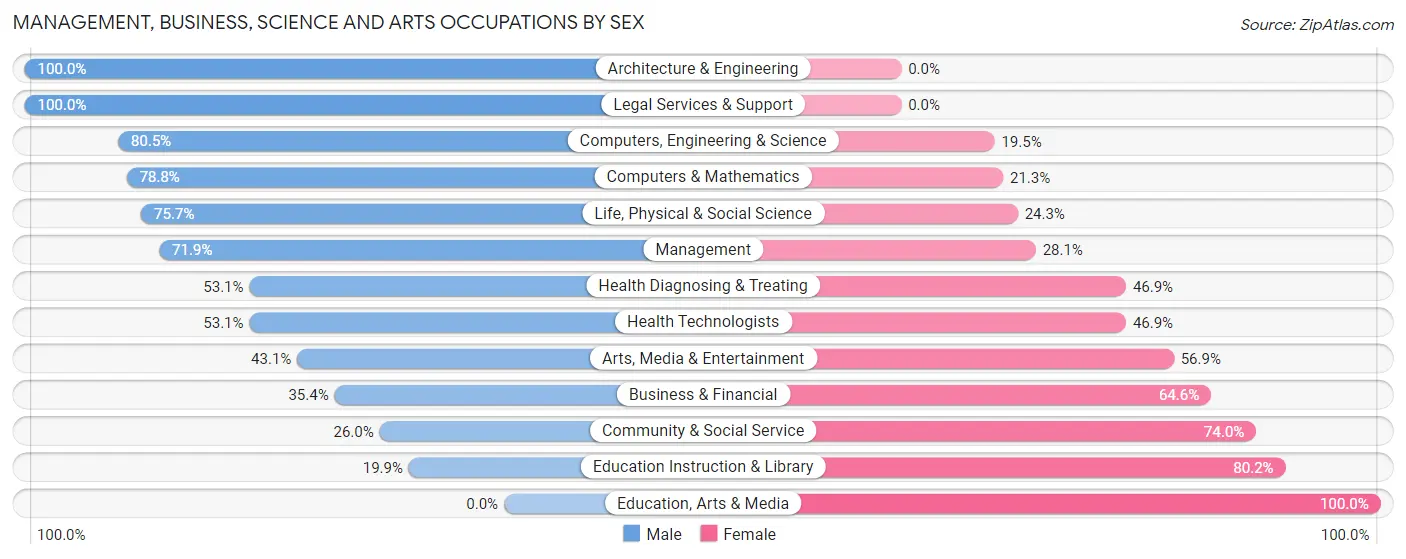
Management, Business, Science and Arts Occupations by Sex
Within the Management, Business, Science and Arts occupations in Chesterbrook, the most male-oriented occupations are Architecture & Engineering (100.0%), Legal Services & Support (100.0%), and Computers, Engineering & Science (80.5%), while the most female-oriented occupations are Education, Arts & Media (100.0%), Education Instruction & Library (80.1%), and Community & Social Service (74.0%).
| Occupation | Male | Female |
| Management | 418 (71.9%) | 163 (28.1%) |
| Business & Financial | 99 (35.4%) | 181 (64.6%) |
| Computers, Engineering & Science | 637 (80.5%) | 154 (19.5%) |
| Computers & Mathematics | 341 (78.7%) | 92 (21.2%) |
| Architecture & Engineering | 103 (100.0%) | 0 (0.0%) |
| Life, Physical & Social Science | 193 (75.7%) | 62 (24.3%) |
| Community & Social Service | 163 (26.0%) | 465 (74.0%) |
| Education, Arts & Media | 0 (0.0%) | 20 (100.0%) |
| Legal Services & Support | 38 (100.0%) | 0 (0.0%) |
| Education Instruction & Library | 103 (19.9%) | 416 (80.1%) |
| Arts, Media & Entertainment | 22 (43.1%) | 29 (56.9%) |
| Health Diagnosing & Treating | 145 (53.1%) | 128 (46.9%) |
| Health Technologists | 145 (53.1%) | 128 (46.9%) |
| Total (Category) | 1,462 (57.3%) | 1,091 (42.7%) |
| Total (Overall) | 1,794 (59.0%) | 1,246 (41.0%) |
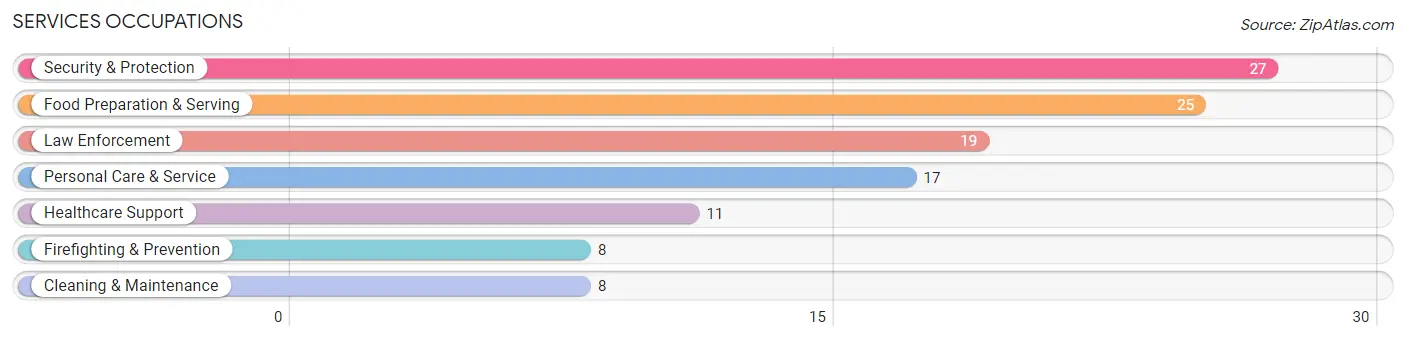
Services Occupations
The most common Services occupations in Chesterbrook are Security & Protection (27 | 0.9%), Food Preparation & Serving (25 | 0.8%), Law Enforcement (19 | 0.6%), Personal Care & Service (17 | 0.6%), and Healthcare Support (11 | 0.4%).
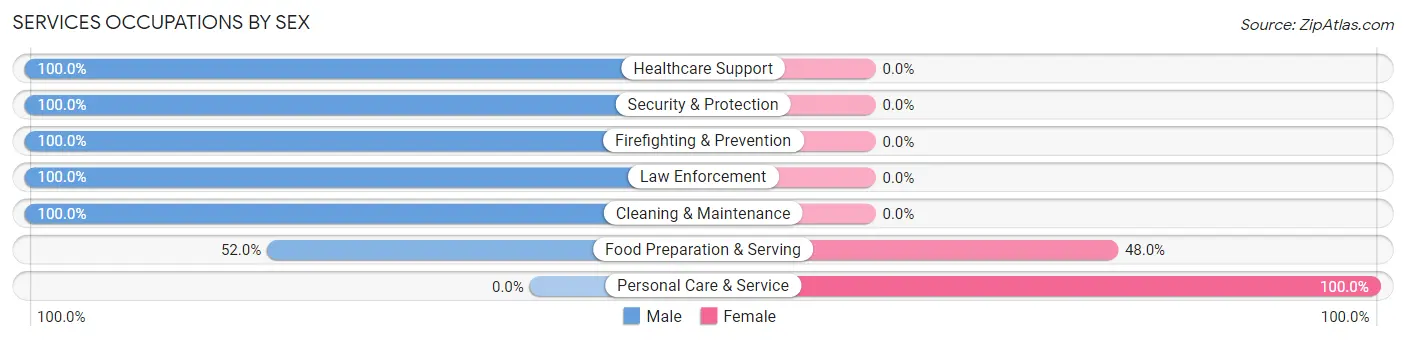
Services Occupations by Sex
Within the Services occupations in Chesterbrook, the most male-oriented occupations are Healthcare Support (100.0%), Security & Protection (100.0%), and Firefighting & Prevention (100.0%), while the most female-oriented occupations are Personal Care & Service (100.0%), and Food Preparation & Serving (48.0%).
| Occupation | Male | Female |
| Healthcare Support | 11 (100.0%) | 0 (0.0%) |
| Security & Protection | 27 (100.0%) | 0 (0.0%) |
| Firefighting & Prevention | 8 (100.0%) | 0 (0.0%) |
| Law Enforcement | 19 (100.0%) | 0 (0.0%) |
| Food Preparation & Serving | 13 (52.0%) | 12 (48.0%) |
| Cleaning & Maintenance | 8 (100.0%) | 0 (0.0%) |
| Personal Care & Service | 0 (0.0%) | 17 (100.0%) |
| Total (Category) | 59 (67.0%) | 29 (33.0%) |
| Total (Overall) | 1,794 (59.0%) | 1,246 (41.0%) |
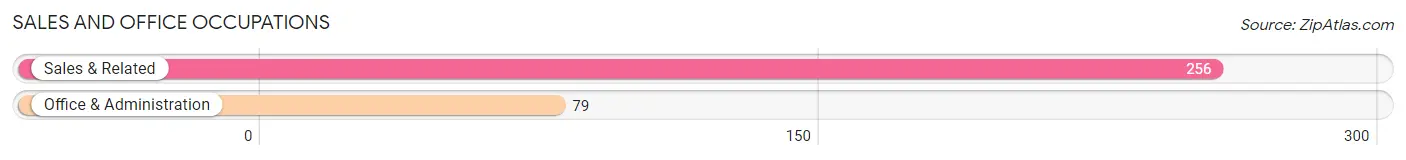
Sales and Office Occupations
The most common Sales and Office occupations in Chesterbrook are Sales & Related (256 | 8.4%), and Office & Administration (79 | 2.6%).
Sales and Office Occupations by Sex
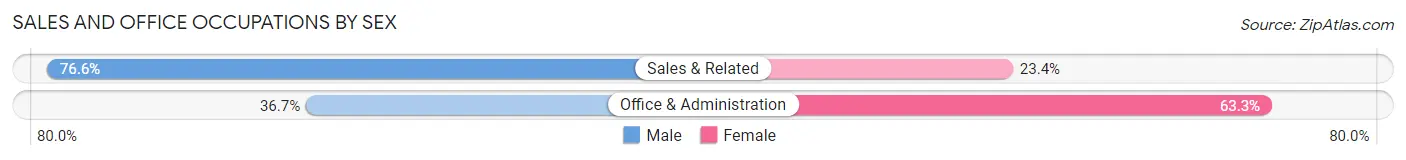
| Occupation | Male | Female |
| Sales & Related | 196 (76.6%) | 60 (23.4%) |
| Office & Administration | 29 (36.7%) | 50 (63.3%) |
| Total (Category) | 225 (67.2%) | 110 (32.8%) |
| Total (Overall) | 1,794 (59.0%) | 1,246 (41.0%) |
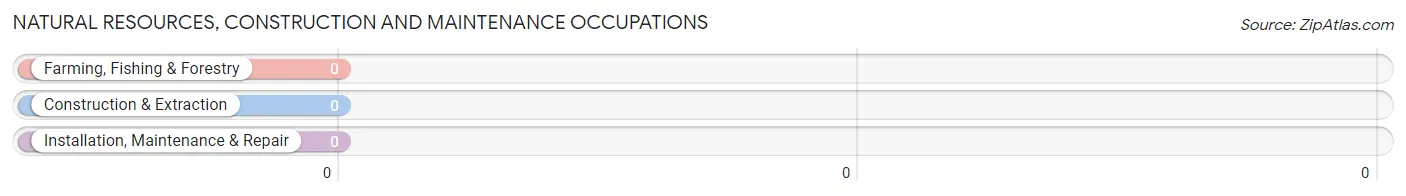
Natural Resources, Construction and Maintenance Occupations
Natural Resources, Construction and Maintenance Occupations by Sex
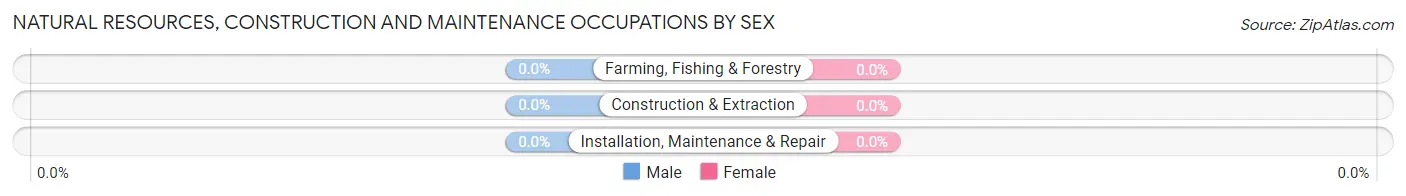
| Occupation | Male | Female |
| Farming, Fishing & Forestry | 0 (0.0%) | 0 (0.0%) |
| Construction & Extraction | 0 (0.0%) | 0 (0.0%) |
| Installation, Maintenance & Repair | 0 (0.0%) | 0 (0.0%) |
| Total (Category) | 0 (0.0%) | 0 (0.0%) |
| Total (Overall) | 1,794 (59.0%) | 1,246 (41.0%) |
Production, Transportation and Moving Occupations
The most common Production, Transportation and Moving occupations in Chesterbrook are Production (52 | 1.7%), and Transportation (12 | 0.4%).
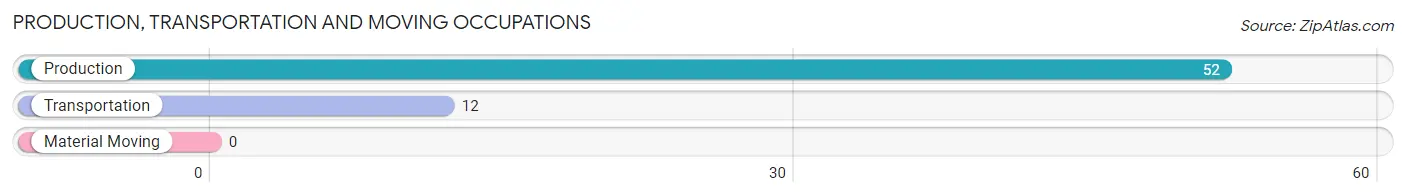
Production, Transportation and Moving Occupations by Sex
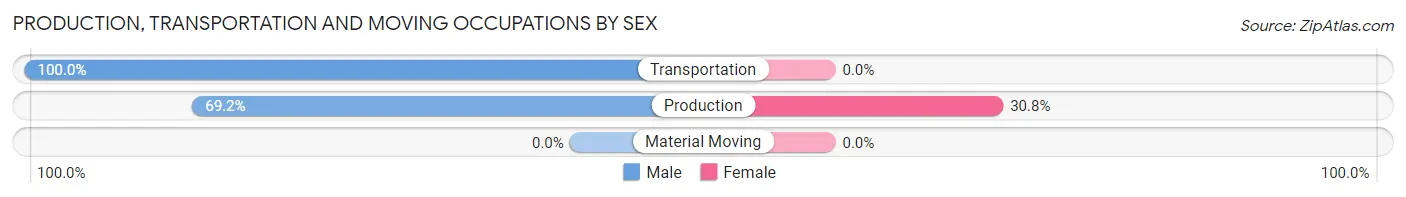
| Occupation | Male | Female |
| Production | 36 (69.2%) | 16 (30.8%) |
| Transportation | 12 (100.0%) | 0 (0.0%) |
| Material Moving | 0 (0.0%) | 0 (0.0%) |
| Total (Category) | 48 (75.0%) | 16 (25.0%) |
| Total (Overall) | 1,794 (59.0%) | 1,246 (41.0%) |
Employment Industries by Sex in Chesterbrook
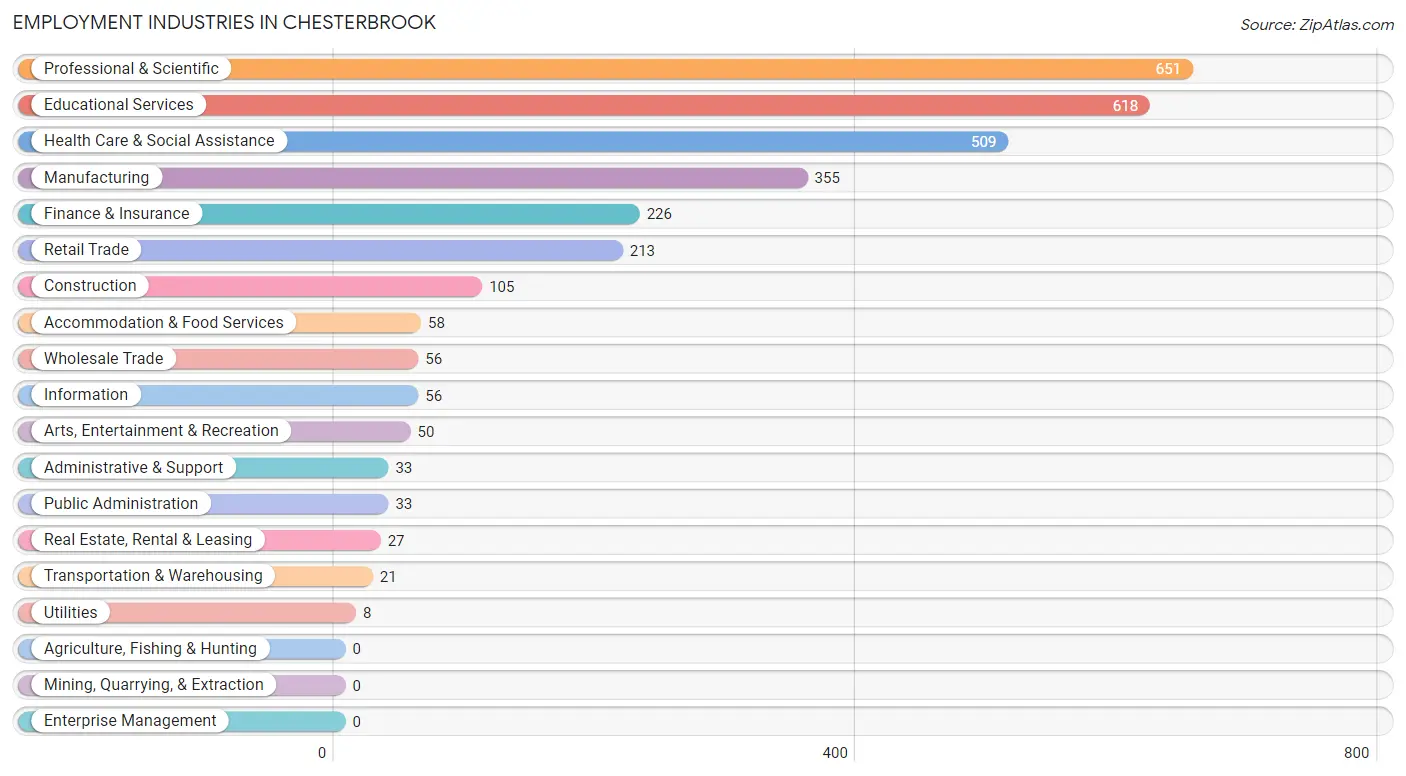
Employment Industries in Chesterbrook
The major employment industries in Chesterbrook include Professional & Scientific (651 | 21.4%), Educational Services (618 | 20.3%), Health Care & Social Assistance (509 | 16.7%), Manufacturing (355 | 11.7%), and Finance & Insurance (226 | 7.4%).
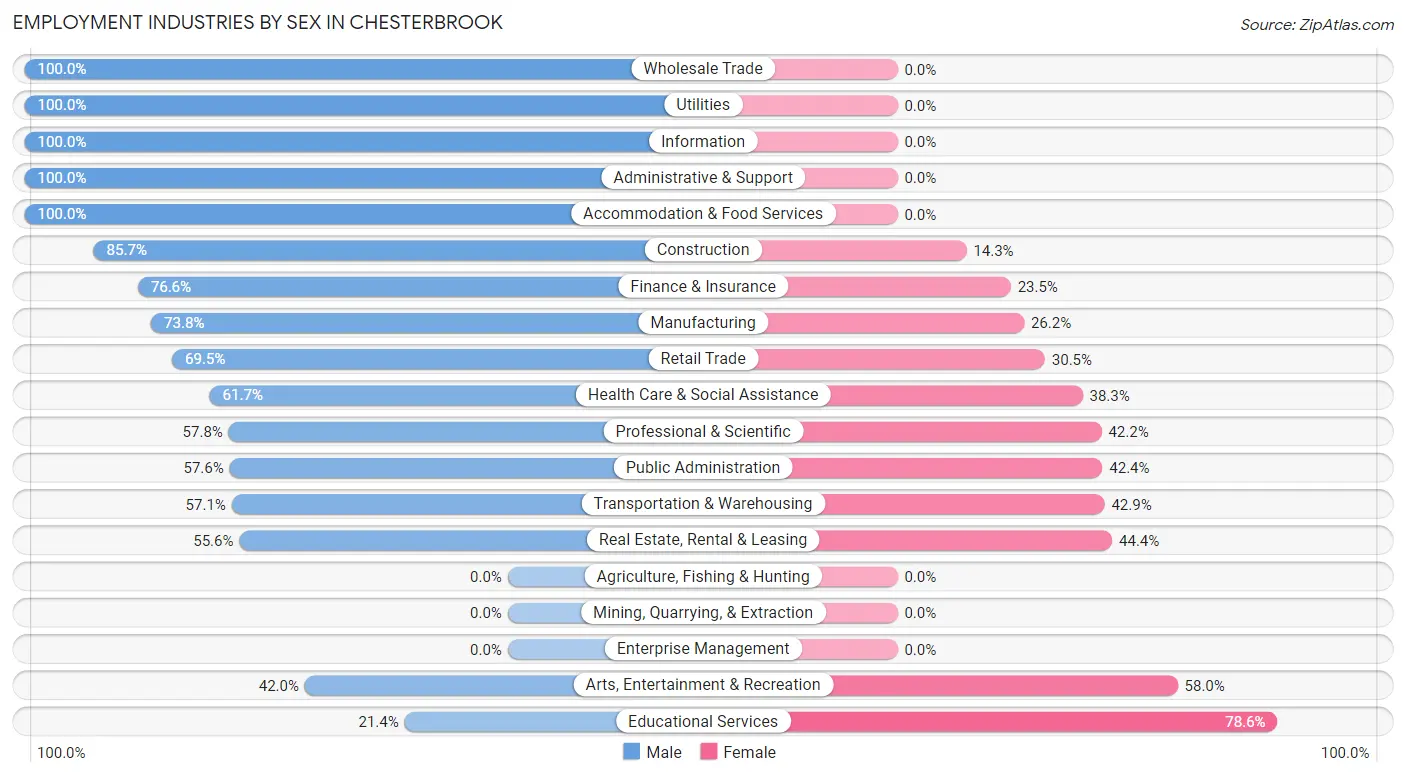
Employment Industries by Sex in Chesterbrook
The Chesterbrook industries that see more men than women are Wholesale Trade (100.0%), Utilities (100.0%), and Information (100.0%), whereas the industries that tend to have a higher number of women are Educational Services (78.6%), Arts, Entertainment & Recreation (58.0%), and Real Estate, Rental & Leasing (44.4%).
| Industry | Male | Female |
| Agriculture, Fishing & Hunting | 0 (0.0%) | 0 (0.0%) |
| Mining, Quarrying, & Extraction | 0 (0.0%) | 0 (0.0%) |
| Construction | 90 (85.7%) | 15 (14.3%) |
| Manufacturing | 262 (73.8%) | 93 (26.2%) |
| Wholesale Trade | 56 (100.0%) | 0 (0.0%) |
| Retail Trade | 148 (69.5%) | 65 (30.5%) |
| Transportation & Warehousing | 12 (57.1%) | 9 (42.9%) |
| Utilities | 8 (100.0%) | 0 (0.0%) |
| Information | 56 (100.0%) | 0 (0.0%) |
| Finance & Insurance | 173 (76.5%) | 53 (23.4%) |
| Real Estate, Rental & Leasing | 15 (55.6%) | 12 (44.4%) |
| Professional & Scientific | 376 (57.8%) | 275 (42.2%) |
| Enterprise Management | 0 (0.0%) | 0 (0.0%) |
| Administrative & Support | 33 (100.0%) | 0 (0.0%) |
| Educational Services | 132 (21.4%) | 486 (78.6%) |
| Health Care & Social Assistance | 314 (61.7%) | 195 (38.3%) |
| Arts, Entertainment & Recreation | 21 (42.0%) | 29 (58.0%) |
| Accommodation & Food Services | 58 (100.0%) | 0 (0.0%) |
| Public Administration | 19 (57.6%) | 14 (42.4%) |
| Total | 1,794 (59.0%) | 1,246 (41.0%) |
Education in Chesterbrook
School Enrollment in Chesterbrook
The most common levels of schooling among the 1,180 students in Chesterbrook are middle school (373 | 31.6%), high school (236 | 20.0%), and elementary school (186 | 15.8%).
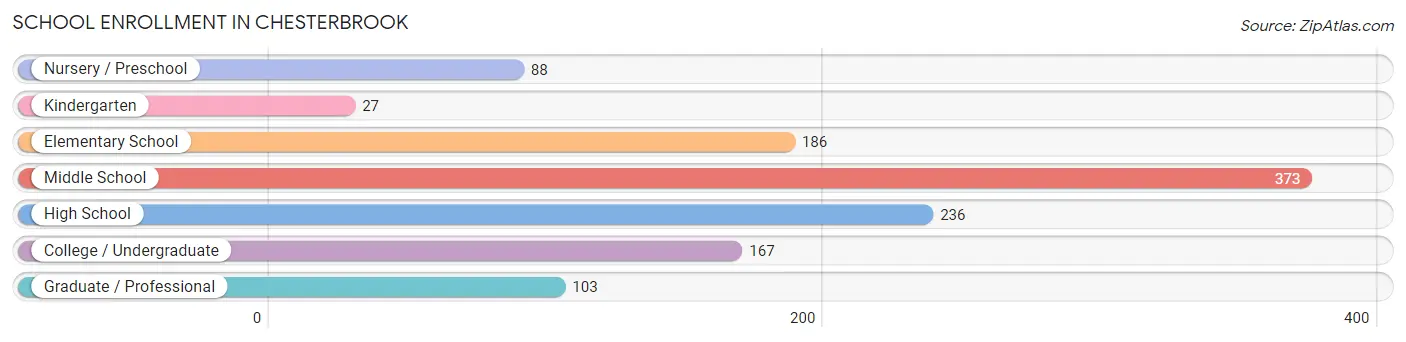
| School Level | # Students | % Students |
| Nursery / Preschool | 88 | 7.5% |
| Kindergarten | 27 | 2.3% |
| Elementary School | 186 | 15.8% |
| Middle School | 373 | 31.6% |
| High School | 236 | 20.0% |
| College / Undergraduate | 167 | 14.1% |
| Graduate / Professional | 103 | 8.7% |
| Total | 1,180 | 100.0% |
School Enrollment by Age by Funding Source in Chesterbrook
Out of a total of 1,180 students who are enrolled in schools in Chesterbrook, 211 (17.9%) attend a private institution, while the remaining 969 (82.1%) are enrolled in public schools. The age group of 25 to 34 year olds has the highest likelihood of being enrolled in private schools, with 51 (100.0% in the age bracket) enrolled. Conversely, the age group of 10 to 14 year olds has the lowest likelihood of being enrolled in a private school, with 430 (100.0% in the age bracket) attending a public institution.
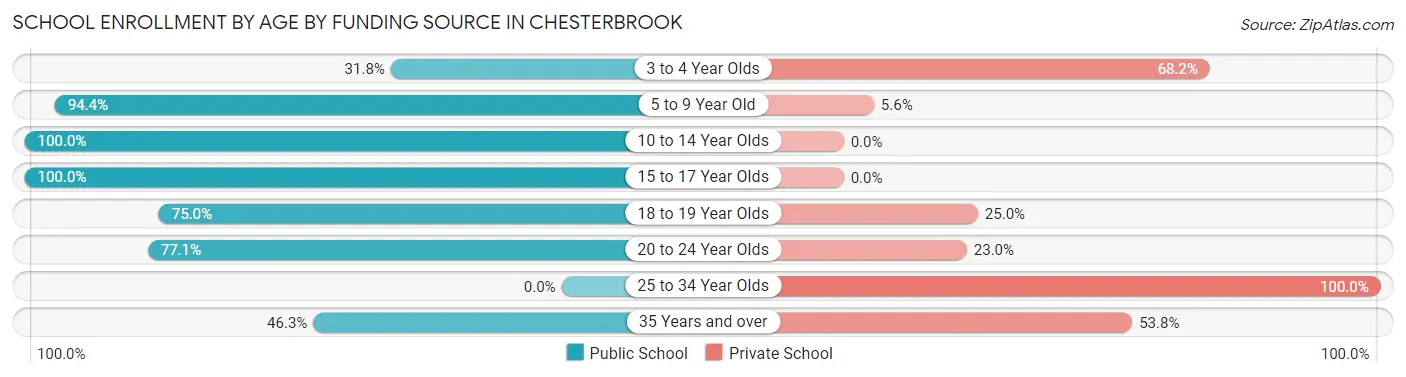
| Age Bracket | Public School | Private School |
| 3 to 4 Year Olds | 28 (31.8%) | 60 (68.2%) |
| 5 to 9 Year Old | 201 (94.4%) | 12 (5.6%) |
| 10 to 14 Year Olds | 430 (100.0%) | 0 (0.0%) |
| 15 to 17 Year Olds | 128 (100.0%) | 0 (0.0%) |
| 18 to 19 Year Olds | 51 (75.0%) | 17 (25.0%) |
| 20 to 24 Year Olds | 94 (77.0%) | 28 (23.0%) |
| 25 to 34 Year Olds | 0 (0.0%) | 51 (100.0%) |
| 35 Years and over | 37 (46.3%) | 43 (53.7%) |
| Total | 969 (82.1%) | 211 (17.9%) |
Educational Attainment by Field of Study in Chesterbrook
Business (671 | 18.3%), bio, nature & agricultural (577 | 15.8%), engineering (520 | 14.2%), computers & mathematics (354 | 9.7%), and social sciences (252 | 6.9%) are the most common fields of study among 3,661 individuals in Chesterbrook who have obtained a bachelor's degree or higher.
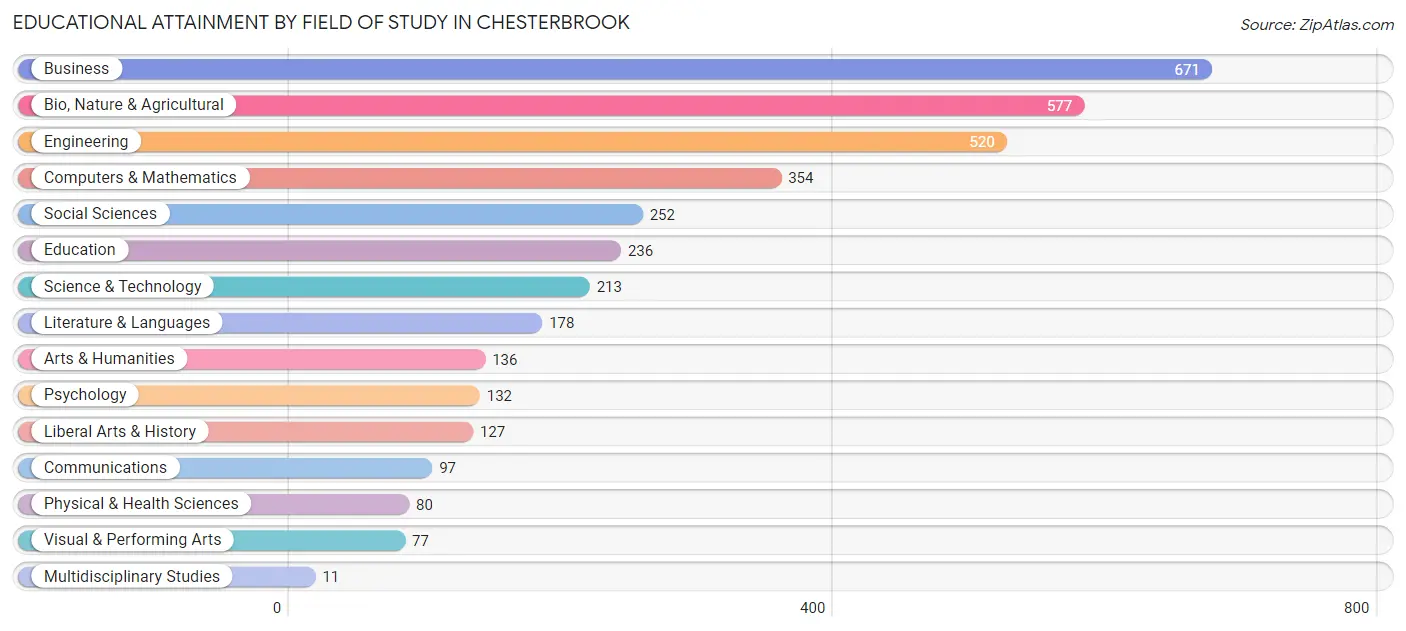
| Field of Study | # Graduates | % Graduates |
| Computers & Mathematics | 354 | 9.7% |
| Bio, Nature & Agricultural | 577 | 15.8% |
| Physical & Health Sciences | 80 | 2.2% |
| Psychology | 132 | 3.6% |
| Social Sciences | 252 | 6.9% |
| Engineering | 520 | 14.2% |
| Multidisciplinary Studies | 11 | 0.3% |
| Science & Technology | 213 | 5.8% |
| Business | 671 | 18.3% |
| Education | 236 | 6.5% |
| Literature & Languages | 178 | 4.9% |
| Liberal Arts & History | 127 | 3.5% |
| Visual & Performing Arts | 77 | 2.1% |
| Communications | 97 | 2.6% |
| Arts & Humanities | 136 | 3.7% |
| Total | 3,661 | 100.0% |
Transportation & Commute in Chesterbrook
Vehicle Availability by Sex in Chesterbrook
The most prevalent vehicle ownership categories in Chesterbrook are males with 2 vehicles (1,081, accounting for 60.3%) and females with 2 vehicles (725, making up 87.9%).
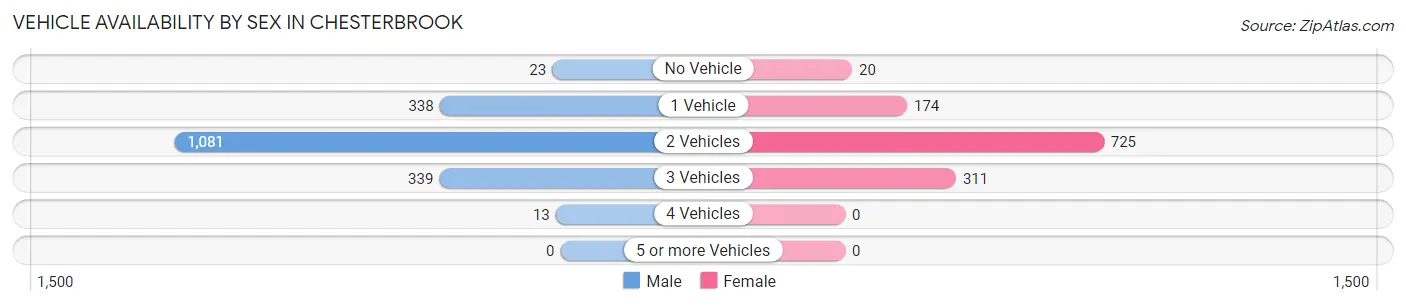
| Vehicles Available | Male | Female |
| No Vehicle | 23 (1.3%) | 20 (1.6%) |
| 1 Vehicle | 338 (18.8%) | 174 (14.1%) |
| 2 Vehicles | 1,081 (60.3%) | 725 (58.9%) |
| 3 Vehicles | 339 (18.9%) | 311 (25.3%) |
| 4 Vehicles | 13 (0.7%) | 0 (0.0%) |
| 5 or more Vehicles | 0 (0.0%) | 0 (0.0%) |
| Total | 1,794 (100.0%) | 1,230 (100.0%) |
Commute Time in Chesterbrook
The most frequently occuring commute durations in Chesterbrook are 30 to 34 minutes (544 commuters, 21.6%), 10 to 14 minutes (397 commuters, 15.7%), and 15 to 19 minutes (318 commuters, 12.6%).
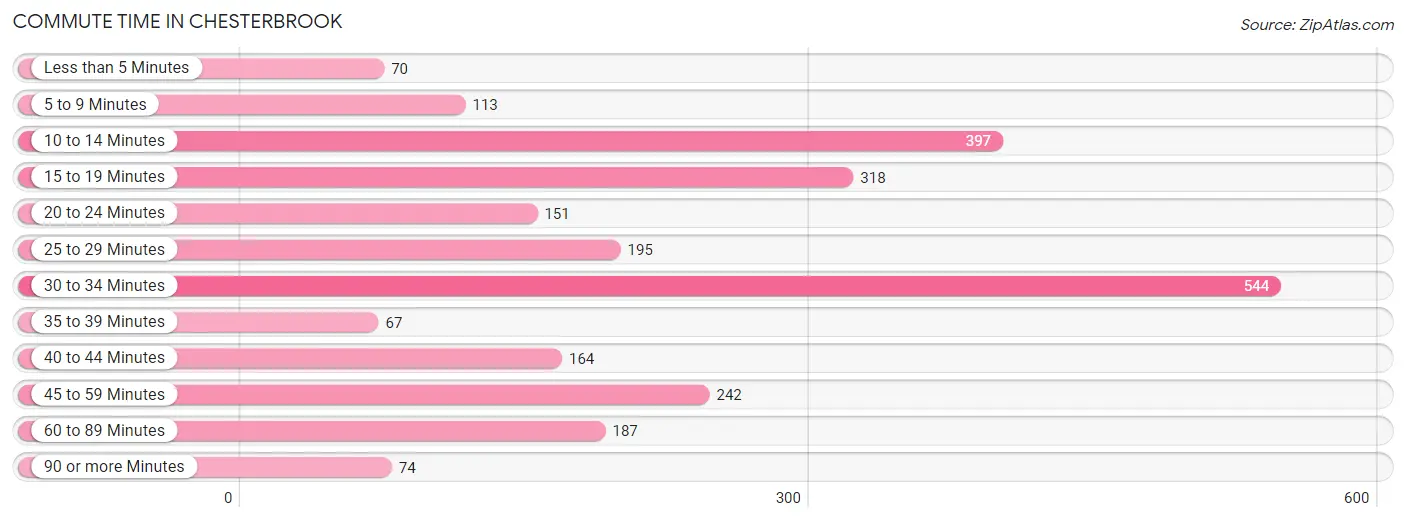
| Commute Time | # Commuters | % Commuters |
| Less than 5 Minutes | 70 | 2.8% |
| 5 to 9 Minutes | 113 | 4.5% |
| 10 to 14 Minutes | 397 | 15.7% |
| 15 to 19 Minutes | 318 | 12.6% |
| 20 to 24 Minutes | 151 | 6.0% |
| 25 to 29 Minutes | 195 | 7.7% |
| 30 to 34 Minutes | 544 | 21.6% |
| 35 to 39 Minutes | 67 | 2.7% |
| 40 to 44 Minutes | 164 | 6.5% |
| 45 to 59 Minutes | 242 | 9.6% |
| 60 to 89 Minutes | 187 | 7.4% |
| 90 or more Minutes | 74 | 2.9% |
Commute Time by Sex in Chesterbrook
The most common commute times in Chesterbrook are 10 to 14 minutes (267 commuters, 18.6%) for males and 30 to 34 minutes (399 commuters, 36.6%) for females.
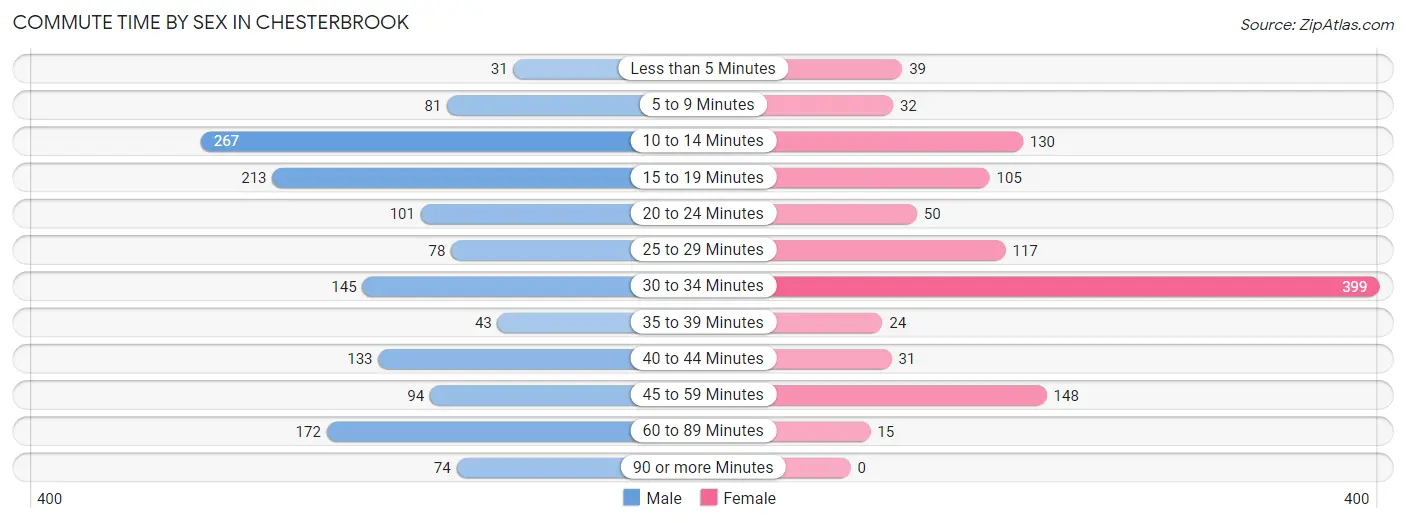
| Commute Time | Male | Female |
| Less than 5 Minutes | 31 (2.2%) | 39 (3.6%) |
| 5 to 9 Minutes | 81 (5.7%) | 32 (2.9%) |
| 10 to 14 Minutes | 267 (18.6%) | 130 (11.9%) |
| 15 to 19 Minutes | 213 (14.9%) | 105 (9.6%) |
| 20 to 24 Minutes | 101 (7.0%) | 50 (4.6%) |
| 25 to 29 Minutes | 78 (5.4%) | 117 (10.7%) |
| 30 to 34 Minutes | 145 (10.1%) | 399 (36.6%) |
| 35 to 39 Minutes | 43 (3.0%) | 24 (2.2%) |
| 40 to 44 Minutes | 133 (9.3%) | 31 (2.8%) |
| 45 to 59 Minutes | 94 (6.6%) | 148 (13.6%) |
| 60 to 89 Minutes | 172 (12.0%) | 15 (1.4%) |
| 90 or more Minutes | 74 (5.2%) | 0 (0.0%) |
Time of Departure to Work by Sex in Chesterbrook
The most frequent times of departure to work in Chesterbrook are 7:00 AM to 7:29 AM (323, 22.6%) for males and 7:00 AM to 7:29 AM (352, 32.3%) for females.
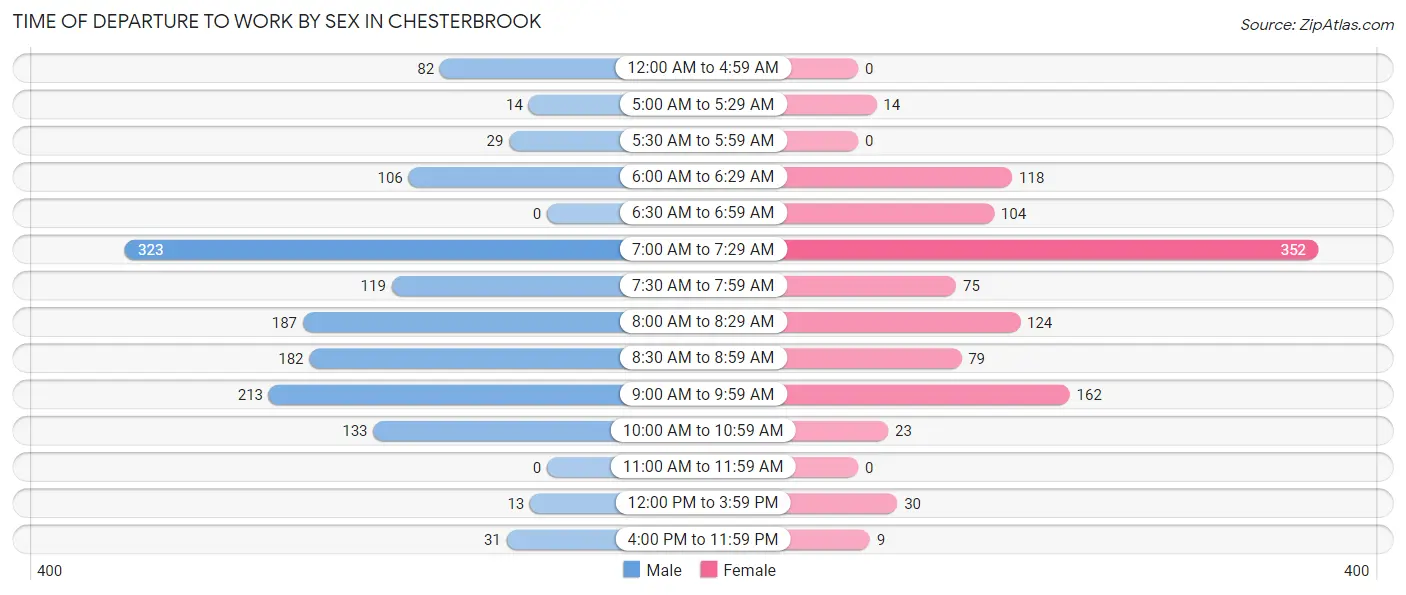
| Time of Departure | Male | Female |
| 12:00 AM to 4:59 AM | 82 (5.7%) | 0 (0.0%) |
| 5:00 AM to 5:29 AM | 14 (1.0%) | 14 (1.3%) |
| 5:30 AM to 5:59 AM | 29 (2.0%) | 0 (0.0%) |
| 6:00 AM to 6:29 AM | 106 (7.4%) | 118 (10.8%) |
| 6:30 AM to 6:59 AM | 0 (0.0%) | 104 (9.5%) |
| 7:00 AM to 7:29 AM | 323 (22.6%) | 352 (32.3%) |
| 7:30 AM to 7:59 AM | 119 (8.3%) | 75 (6.9%) |
| 8:00 AM to 8:29 AM | 187 (13.1%) | 124 (11.4%) |
| 8:30 AM to 8:59 AM | 182 (12.7%) | 79 (7.2%) |
| 9:00 AM to 9:59 AM | 213 (14.9%) | 162 (14.9%) |
| 10:00 AM to 10:59 AM | 133 (9.3%) | 23 (2.1%) |
| 11:00 AM to 11:59 AM | 0 (0.0%) | 0 (0.0%) |
| 12:00 PM to 3:59 PM | 13 (0.9%) | 30 (2.8%) |
| 4:00 PM to 11:59 PM | 31 (2.2%) | 9 (0.8%) |
| Total | 1,432 (100.0%) | 1,090 (100.0%) |
Housing Occupancy in Chesterbrook
Occupancy by Ownership in Chesterbrook
Of the total 2,295 dwellings in Chesterbrook, owner-occupied units account for 1,501 (65.4%), while renter-occupied units make up 794 (34.6%).
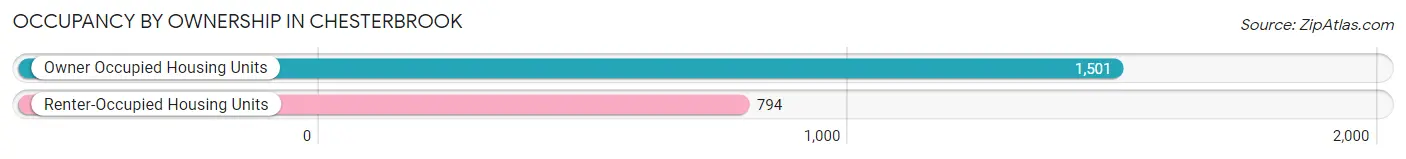
| Occupancy | # Housing Units | % Housing Units |
| Owner Occupied Housing Units | 1,501 | 65.4% |
| Renter-Occupied Housing Units | 794 | 34.6% |
| Total Occupied Housing Units | 2,295 | 100.0% |
Occupancy by Household Size in Chesterbrook
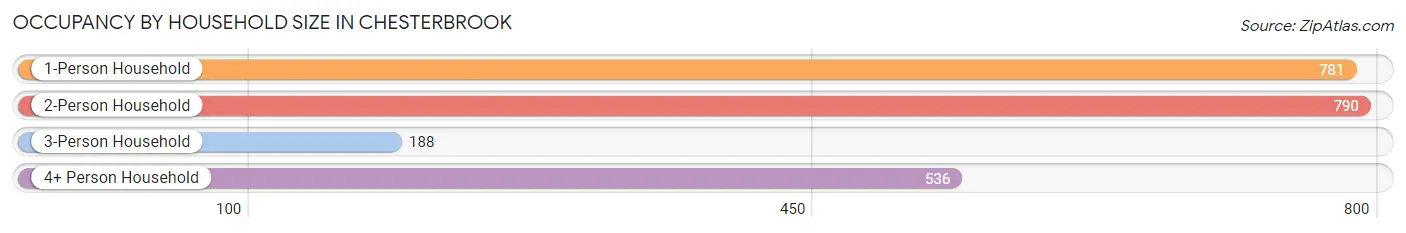
| Household Size | # Housing Units | % Housing Units |
| 1-Person Household | 781 | 34.0% |
| 2-Person Household | 790 | 34.4% |
| 3-Person Household | 188 | 8.2% |
| 4+ Person Household | 536 | 23.4% |
| Total Housing Units | 2,295 | 100.0% |
Occupancy by Ownership by Household Size in Chesterbrook
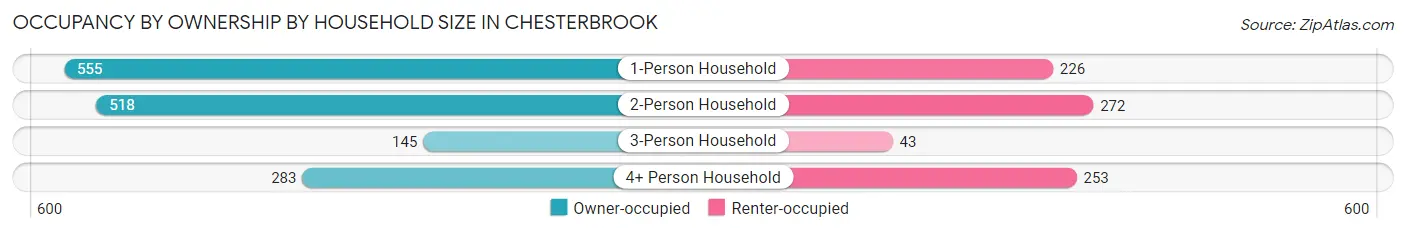
| Household Size | Owner-occupied | Renter-occupied |
| 1-Person Household | 555 (71.1%) | 226 (28.9%) |
| 2-Person Household | 518 (65.6%) | 272 (34.4%) |
| 3-Person Household | 145 (77.1%) | 43 (22.9%) |
| 4+ Person Household | 283 (52.8%) | 253 (47.2%) |
| Total Housing Units | 1,501 (65.4%) | 794 (34.6%) |
Occupancy by Educational Attainment in Chesterbrook
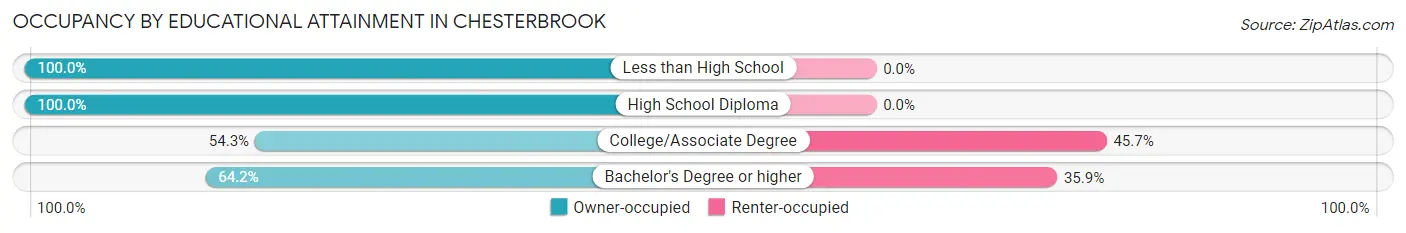
| Household Size | Owner-occupied | Renter-occupied |
| Less than High School | 14 (100.0%) | 0 (0.0%) |
| High School Diploma | 126 (100.0%) | 0 (0.0%) |
| College/Associate Degree | 119 (54.3%) | 100 (45.7%) |
| Bachelor's Degree or higher | 1,242 (64.1%) | 694 (35.8%) |
Occupancy by Age of Householder in Chesterbrook
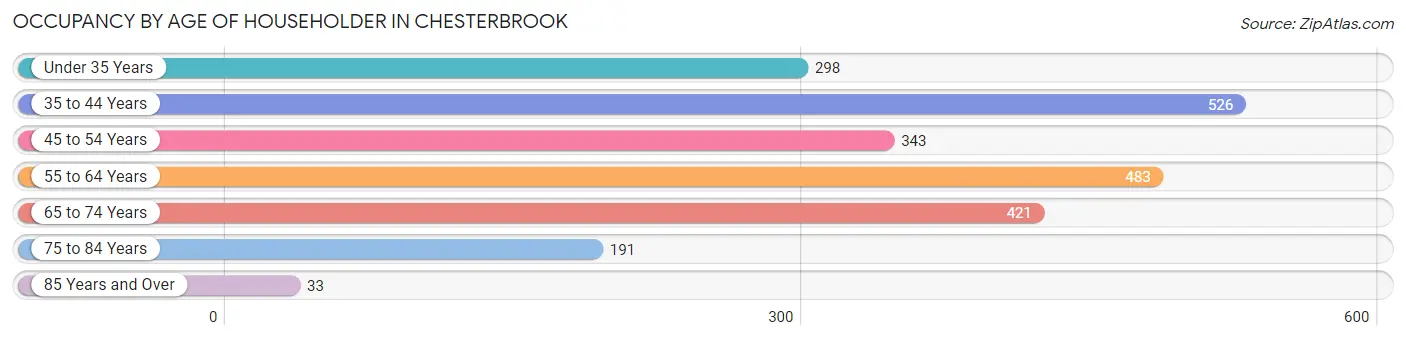
| Age Bracket | # Households | % Households |
| Under 35 Years | 298 | 13.0% |
| 35 to 44 Years | 526 | 22.9% |
| 45 to 54 Years | 343 | 14.9% |
| 55 to 64 Years | 483 | 21.0% |
| 65 to 74 Years | 421 | 18.3% |
| 75 to 84 Years | 191 | 8.3% |
| 85 Years and Over | 33 | 1.4% |
| Total | 2,295 | 100.0% |
Housing Finances in Chesterbrook
Median Income by Occupancy in Chesterbrook
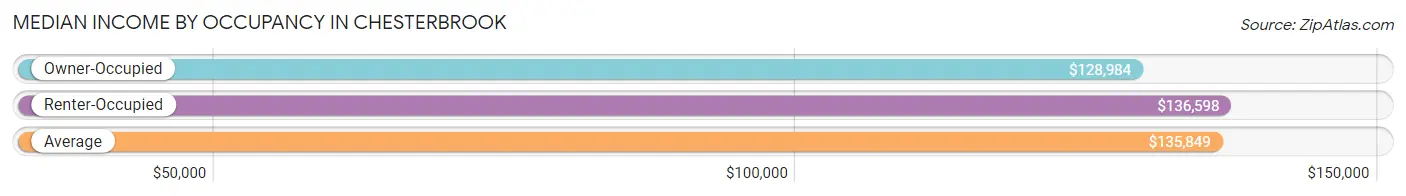
| Occupancy Type | # Households | Median Income |
| Owner-Occupied | 1,501 (65.4%) | $128,984 |
| Renter-Occupied | 794 (34.6%) | $136,598 |
| Average | 2,295 (100.0%) | $135,849 |
Occupancy by Householder Income Bracket in Chesterbrook
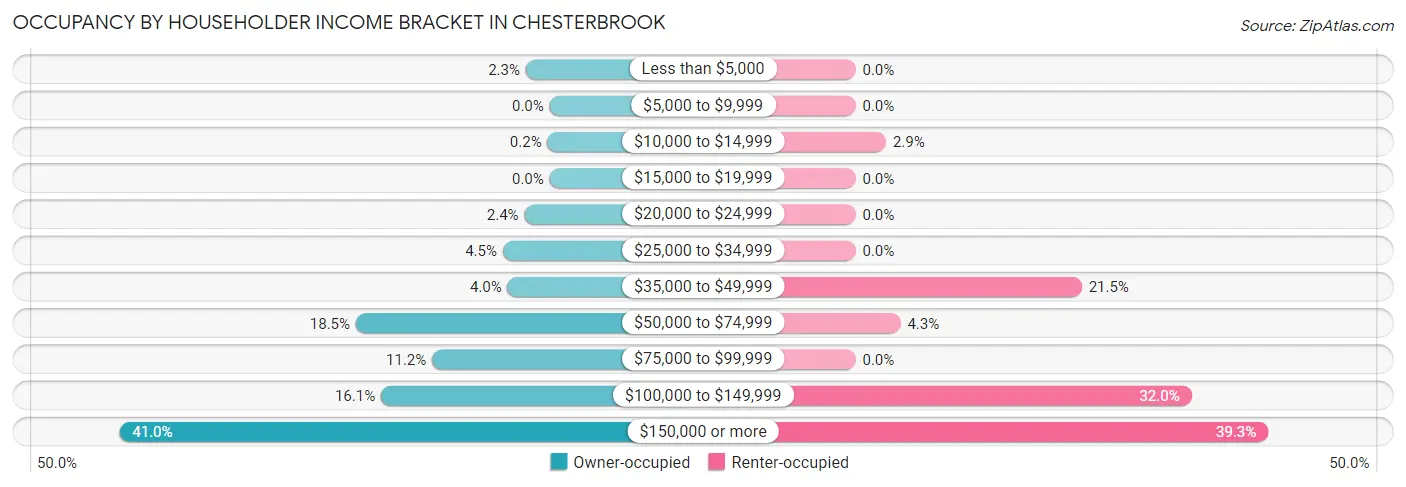
| Income Bracket | Owner-occupied | Renter-occupied |
| Less than $5,000 | 34 (2.3%) | 0 (0.0%) |
| $5,000 to $9,999 | 0 (0.0%) | 0 (0.0%) |
| $10,000 to $14,999 | 3 (0.2%) | 23 (2.9%) |
| $15,000 to $19,999 | 0 (0.0%) | 0 (0.0%) |
| $20,000 to $24,999 | 36 (2.4%) | 0 (0.0%) |
| $25,000 to $34,999 | 67 (4.5%) | 0 (0.0%) |
| $35,000 to $49,999 | 60 (4.0%) | 171 (21.5%) |
| $50,000 to $74,999 | 277 (18.4%) | 34 (4.3%) |
| $75,000 to $99,999 | 168 (11.2%) | 0 (0.0%) |
| $100,000 to $149,999 | 241 (16.1%) | 254 (32.0%) |
| $150,000 or more | 615 (41.0%) | 312 (39.3%) |
| Total | 1,501 (100.0%) | 794 (100.0%) |
Monthly Housing Cost Tiers in Chesterbrook
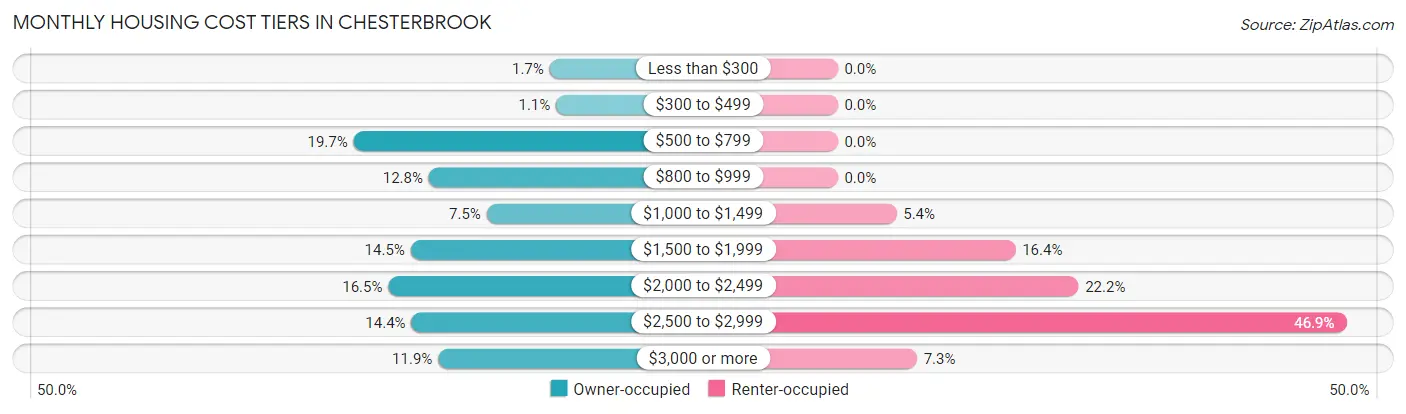
| Monthly Cost | Owner-occupied | Renter-occupied |
| Less than $300 | 25 (1.7%) | 0 (0.0%) |
| $300 to $499 | 16 (1.1%) | 0 (0.0%) |
| $500 to $799 | 296 (19.7%) | 0 (0.0%) |
| $800 to $999 | 192 (12.8%) | 0 (0.0%) |
| $1,000 to $1,499 | 112 (7.5%) | 43 (5.4%) |
| $1,500 to $1,999 | 217 (14.5%) | 130 (16.4%) |
| $2,000 to $2,499 | 248 (16.5%) | 176 (22.2%) |
| $2,500 to $2,999 | 216 (14.4%) | 372 (46.9%) |
| $3,000 or more | 179 (11.9%) | 58 (7.3%) |
| Total | 1,501 (100.0%) | 794 (100.0%) |
Physical Housing Characteristics in Chesterbrook
Housing Structures in Chesterbrook
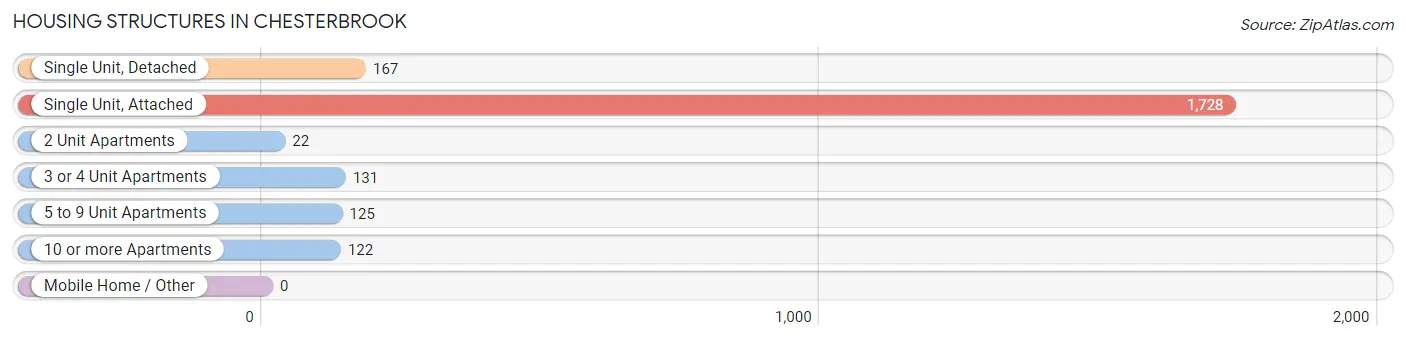
| Structure Type | # Housing Units | % Housing Units |
| Single Unit, Detached | 167 | 7.3% |
| Single Unit, Attached | 1,728 | 75.3% |
| 2 Unit Apartments | 22 | 1.0% |
| 3 or 4 Unit Apartments | 131 | 5.7% |
| 5 to 9 Unit Apartments | 125 | 5.4% |
| 10 or more Apartments | 122 | 5.3% |
| Mobile Home / Other | 0 | 0.0% |
| Total | 2,295 | 100.0% |
Housing Structures by Occupancy in Chesterbrook
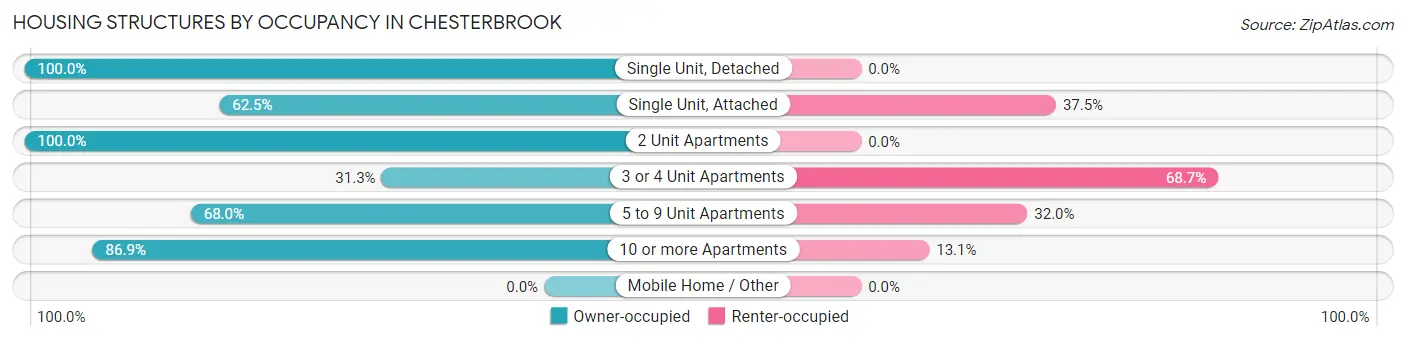
| Structure Type | Owner-occupied | Renter-occupied |
| Single Unit, Detached | 167 (100.0%) | 0 (0.0%) |
| Single Unit, Attached | 1,080 (62.5%) | 648 (37.5%) |
| 2 Unit Apartments | 22 (100.0%) | 0 (0.0%) |
| 3 or 4 Unit Apartments | 41 (31.3%) | 90 (68.7%) |
| 5 to 9 Unit Apartments | 85 (68.0%) | 40 (32.0%) |
| 10 or more Apartments | 106 (86.9%) | 16 (13.1%) |
| Mobile Home / Other | 0 (0.0%) | 0 (0.0%) |
| Total | 1,501 (65.4%) | 794 (34.6%) |
Housing Structures by Number of Rooms in Chesterbrook
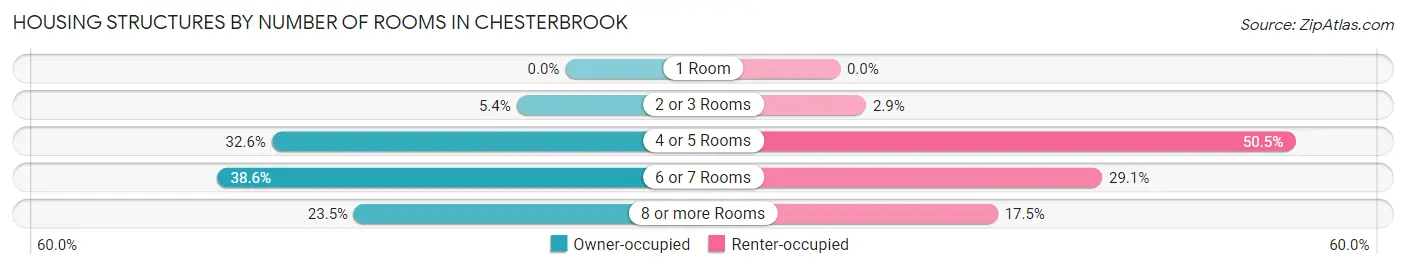
| Number of Rooms | Owner-occupied | Renter-occupied |
| 1 Room | 0 (0.0%) | 0 (0.0%) |
| 2 or 3 Rooms | 81 (5.4%) | 23 (2.9%) |
| 4 or 5 Rooms | 489 (32.6%) | 401 (50.5%) |
| 6 or 7 Rooms | 579 (38.6%) | 231 (29.1%) |
| 8 or more Rooms | 352 (23.4%) | 139 (17.5%) |
| Total | 1,501 (100.0%) | 794 (100.0%) |
Housing Structure by Heating Type in Chesterbrook
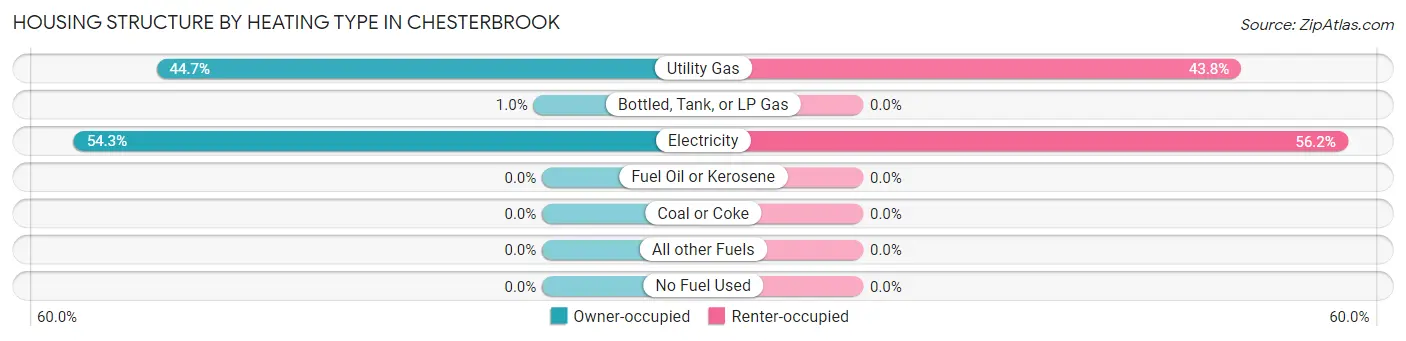
| Heating Type | Owner-occupied | Renter-occupied |
| Utility Gas | 671 (44.7%) | 348 (43.8%) |
| Bottled, Tank, or LP Gas | 15 (1.0%) | 0 (0.0%) |
| Electricity | 815 (54.3%) | 446 (56.2%) |
| Fuel Oil or Kerosene | 0 (0.0%) | 0 (0.0%) |
| Coal or Coke | 0 (0.0%) | 0 (0.0%) |
| All other Fuels | 0 (0.0%) | 0 (0.0%) |
| No Fuel Used | 0 (0.0%) | 0 (0.0%) |
| Total | 1,501 (100.0%) | 794 (100.0%) |
Household Vehicle Usage in Chesterbrook
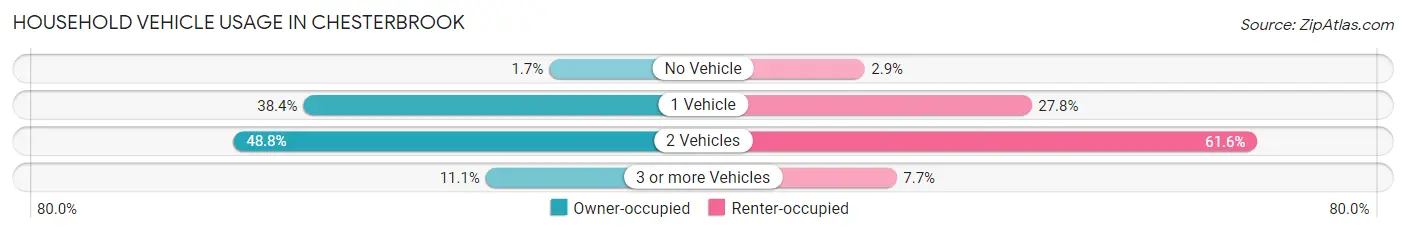
| Vehicles per Household | Owner-occupied | Renter-occupied |
| No Vehicle | 25 (1.7%) | 23 (2.9%) |
| 1 Vehicle | 576 (38.4%) | 221 (27.8%) |
| 2 Vehicles | 733 (48.8%) | 489 (61.6%) |
| 3 or more Vehicles | 167 (11.1%) | 61 (7.7%) |
| Total | 1,501 (100.0%) | 794 (100.0%) |
Real Estate & Mortgages in Chesterbrook
Real Estate and Mortgage Overview in Chesterbrook
| Characteristic | Without Mortgage | With Mortgage |
| Housing Units | 597 | 904 |
| Median Property Value | $359,200 | $422,700 |
| Median Household Income | $86,607 | $423 |
| Monthly Housing Costs | $756 | $179 |
| Real Estate Taxes | $3,997 | $0 |
Property Value by Mortgage Status in Chesterbrook
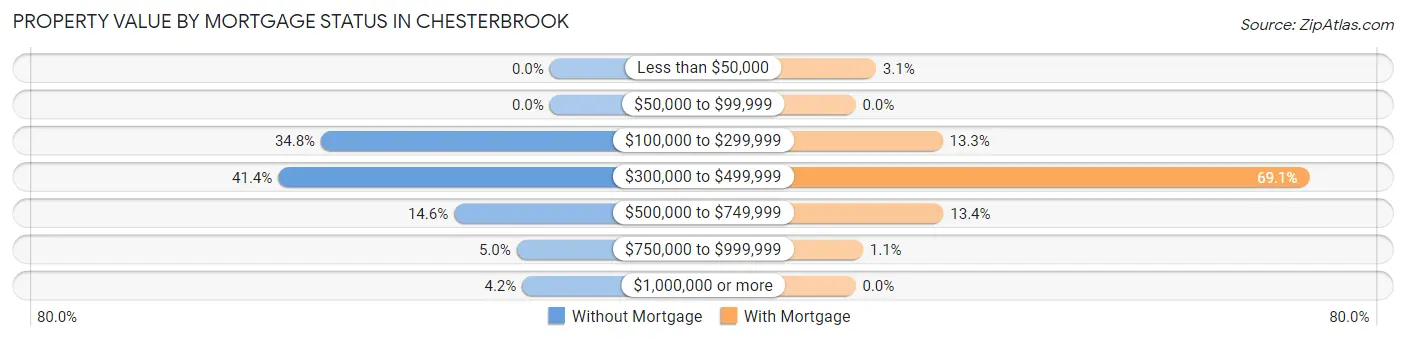
| Property Value | Without Mortgage | With Mortgage |
| Less than $50,000 | 0 (0.0%) | 28 (3.1%) |
| $50,000 to $99,999 | 0 (0.0%) | 0 (0.0%) |
| $100,000 to $299,999 | 208 (34.8%) | 120 (13.3%) |
| $300,000 to $499,999 | 247 (41.4%) | 625 (69.1%) |
| $500,000 to $749,999 | 87 (14.6%) | 121 (13.4%) |
| $750,000 to $999,999 | 30 (5.0%) | 10 (1.1%) |
| $1,000,000 or more | 25 (4.2%) | 0 (0.0%) |
| Total | 597 (100.0%) | 904 (100.0%) |
Household Income by Mortgage Status in Chesterbrook
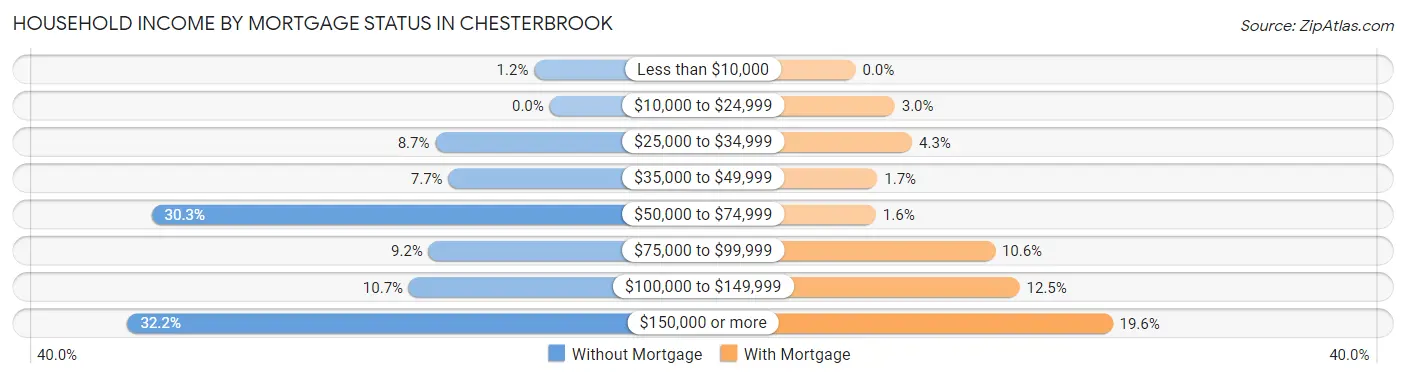
| Household Income | Without Mortgage | With Mortgage |
| Less than $10,000 | 7 (1.2%) | 0 (0.0%) |
| $10,000 to $24,999 | 0 (0.0%) | 27 (3.0%) |
| $25,000 to $34,999 | 52 (8.7%) | 39 (4.3%) |
| $35,000 to $49,999 | 46 (7.7%) | 15 (1.7%) |
| $50,000 to $74,999 | 181 (30.3%) | 14 (1.5%) |
| $75,000 to $99,999 | 55 (9.2%) | 96 (10.6%) |
| $100,000 to $149,999 | 64 (10.7%) | 113 (12.5%) |
| $150,000 or more | 192 (32.2%) | 177 (19.6%) |
| Total | 597 (100.0%) | 904 (100.0%) |
Property Value to Household Income Ratio in Chesterbrook
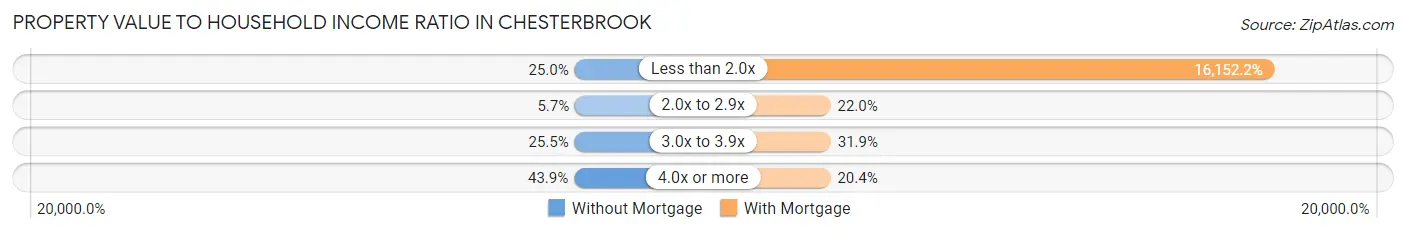
| Value-to-Income Ratio | Without Mortgage | With Mortgage |
| Less than 2.0x | 149 (25.0%) | 146,016 (16,152.2%) |
| 2.0x to 2.9x | 34 (5.7%) | 199 (22.0%) |
| 3.0x to 3.9x | 152 (25.5%) | 288 (31.9%) |
| 4.0x or more | 262 (43.9%) | 184 (20.3%) |
| Total | 597 (100.0%) | 904 (100.0%) |
Real Estate Taxes by Mortgage Status in Chesterbrook
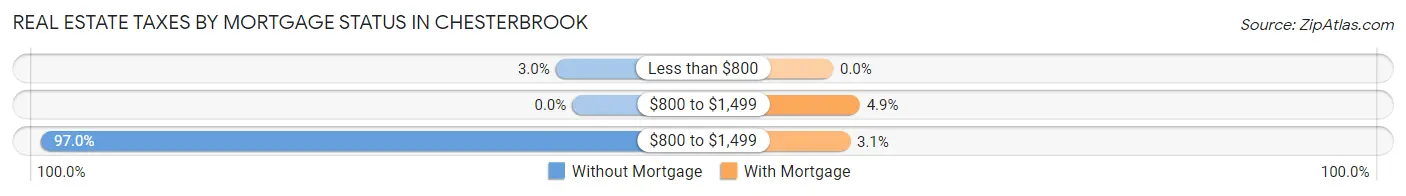
| Property Taxes | Without Mortgage | With Mortgage |
| Less than $800 | 18 (3.0%) | 0 (0.0%) |
| $800 to $1,499 | 0 (0.0%) | 44 (4.9%) |
| $800 to $1,499 | 579 (97.0%) | 28 (3.1%) |
| Total | 597 (100.0%) | 904 (100.0%) |
Health & Disability in Chesterbrook
Health Insurance Coverage by Age in Chesterbrook
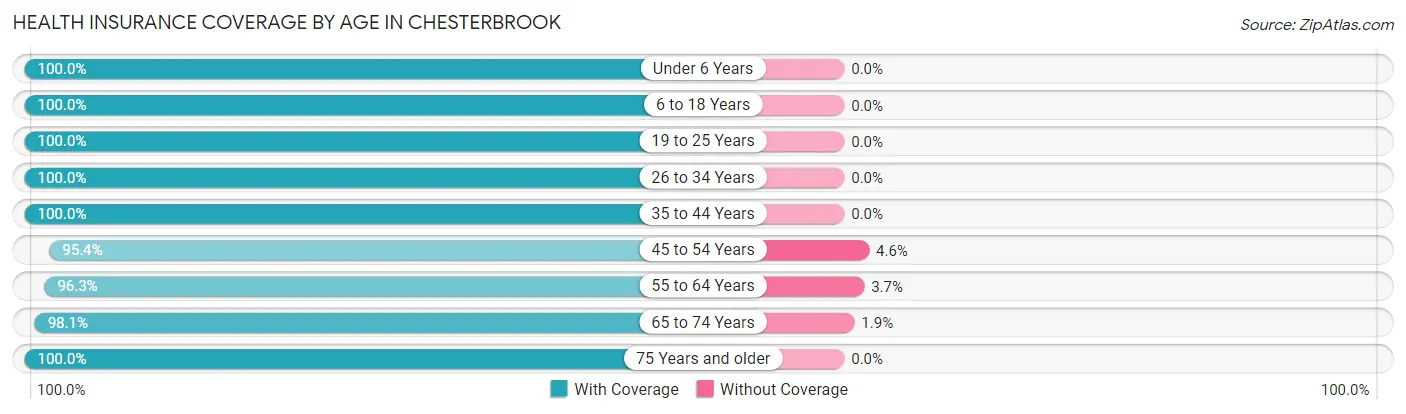
| Age Bracket | With Coverage | Without Coverage |
| Under 6 Years | 427 (100.0%) | 0 (0.0%) |
| 6 to 18 Years | 814 (100.0%) | 0 (0.0%) |
| 19 to 25 Years | 226 (100.0%) | 0 (0.0%) |
| 26 to 34 Years | 810 (100.0%) | 0 (0.0%) |
| 35 to 44 Years | 910 (100.0%) | 0 (0.0%) |
| 45 to 54 Years | 495 (95.4%) | 24 (4.6%) |
| 55 to 64 Years | 778 (96.3%) | 30 (3.7%) |
| 65 to 74 Years | 622 (98.1%) | 12 (1.9%) |
| 75 Years and older | 280 (100.0%) | 0 (0.0%) |
| Total | 5,362 (98.8%) | 66 (1.2%) |
Health Insurance Coverage by Citizenship Status in Chesterbrook
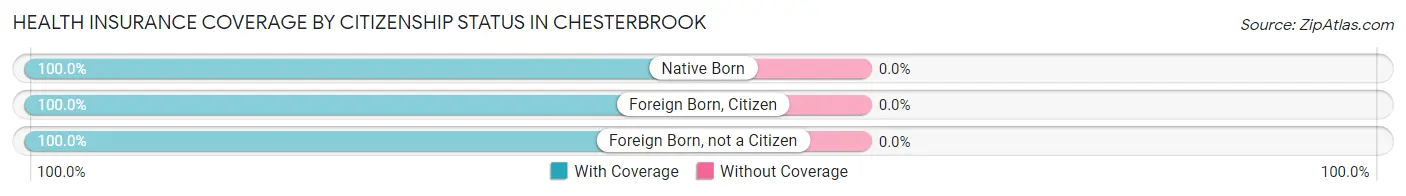
| Citizenship Status | With Coverage | Without Coverage |
| Native Born | 427 (100.0%) | 0 (0.0%) |
| Foreign Born, Citizen | 814 (100.0%) | 0 (0.0%) |
| Foreign Born, not a Citizen | 226 (100.0%) | 0 (0.0%) |
Health Insurance Coverage by Household Income in Chesterbrook
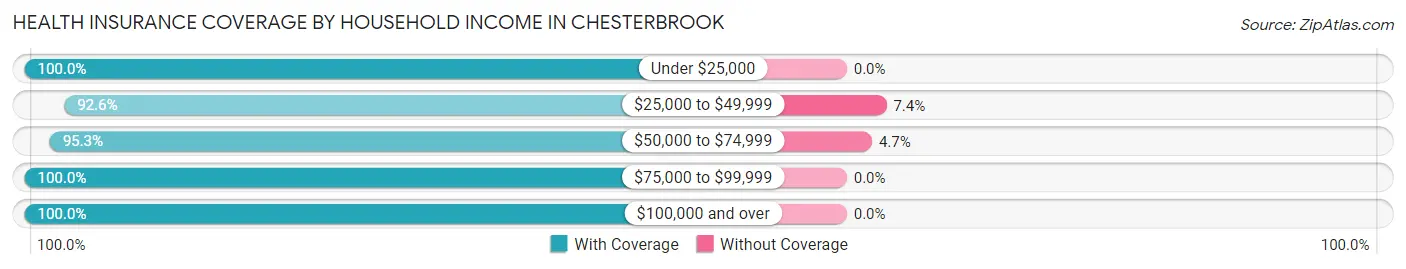
| Household Income | With Coverage | Without Coverage |
| Under $25,000 | 120 (100.0%) | 0 (0.0%) |
| $25,000 to $49,999 | 523 (92.6%) | 42 (7.4%) |
| $50,000 to $74,999 | 485 (95.3%) | 24 (4.7%) |
| $75,000 to $99,999 | 264 (100.0%) | 0 (0.0%) |
| $100,000 and over | 3,970 (100.0%) | 0 (0.0%) |
Public vs Private Health Insurance Coverage by Age in Chesterbrook
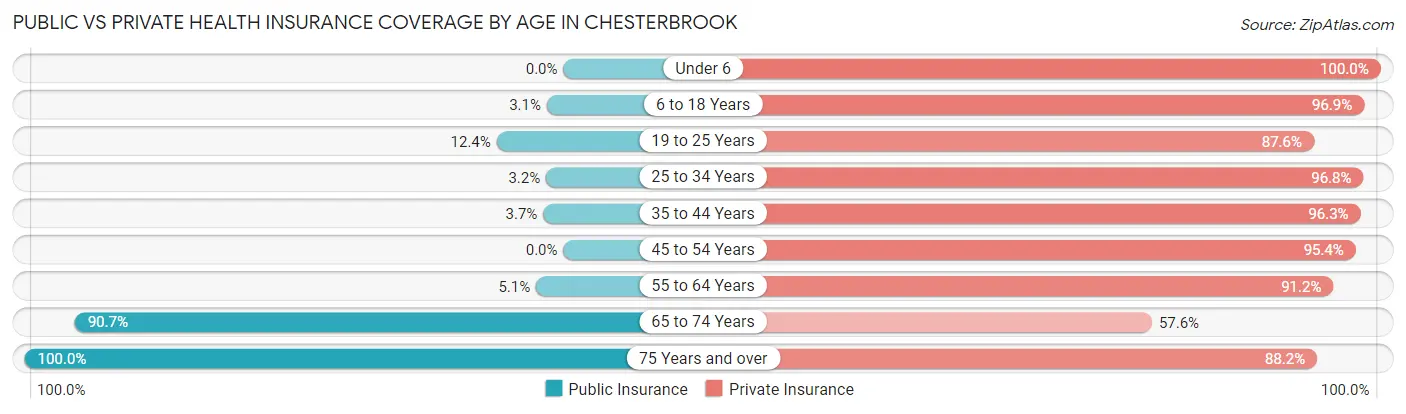
| Age Bracket | Public Insurance | Private Insurance |
| Under 6 | 0 (0.0%) | 427 (100.0%) |
| 6 to 18 Years | 25 (3.1%) | 789 (96.9%) |
| 19 to 25 Years | 28 (12.4%) | 198 (87.6%) |
| 25 to 34 Years | 26 (3.2%) | 784 (96.8%) |
| 35 to 44 Years | 34 (3.7%) | 876 (96.3%) |
| 45 to 54 Years | 0 (0.0%) | 495 (95.4%) |
| 55 to 64 Years | 41 (5.1%) | 737 (91.2%) |
| 65 to 74 Years | 575 (90.7%) | 365 (57.6%) |
| 75 Years and over | 280 (100.0%) | 247 (88.2%) |
| Total | 1,009 (18.6%) | 4,918 (90.6%) |
Disability Status by Sex by Age in Chesterbrook
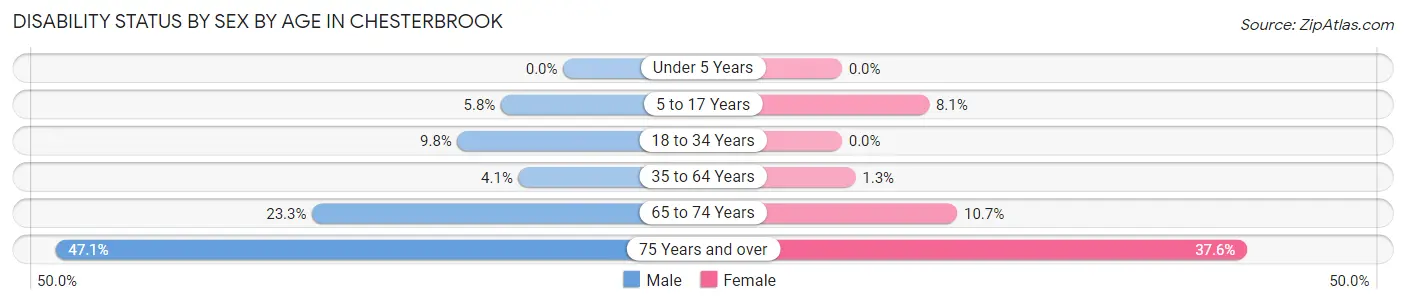
| Age Bracket | Male | Female |
| Under 5 Years | 0 (0.0%) | 0 (0.0%) |
| 5 to 17 Years | 25 (5.8%) | 30 (8.1%) |
| 18 to 34 Years | 53 (9.8%) | 0 (0.0%) |
| 35 to 64 Years | 50 (4.1%) | 13 (1.3%) |
| 65 to 74 Years | 65 (23.3%) | 38 (10.7%) |
| 75 Years and over | 33 (47.1%) | 79 (37.6%) |
Disability Class by Sex by Age in Chesterbrook
Disability Class: Hearing Difficulty
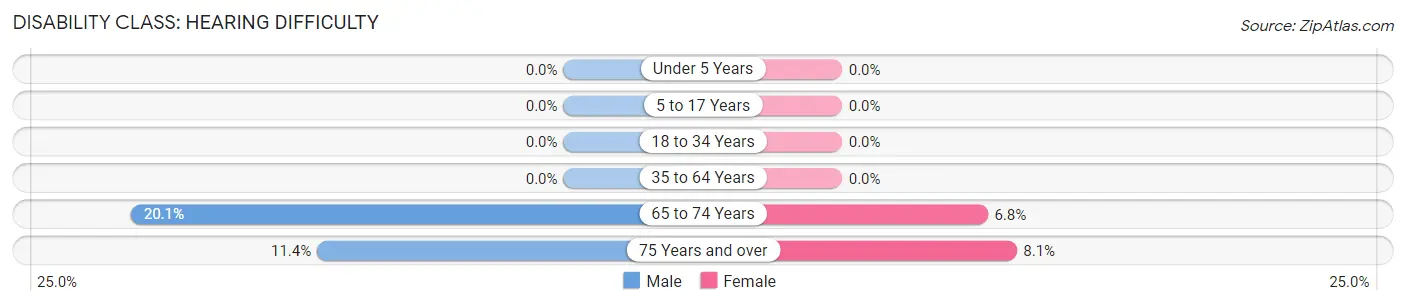
| Age Bracket | Male | Female |
| Under 5 Years | 0 (0.0%) | 0 (0.0%) |
| 5 to 17 Years | 0 (0.0%) | 0 (0.0%) |
| 18 to 34 Years | 0 (0.0%) | 0 (0.0%) |
| 35 to 64 Years | 0 (0.0%) | 0 (0.0%) |
| 65 to 74 Years | 56 (20.1%) | 24 (6.8%) |
| 75 Years and over | 8 (11.4%) | 17 (8.1%) |
Disability Class: Vision Difficulty
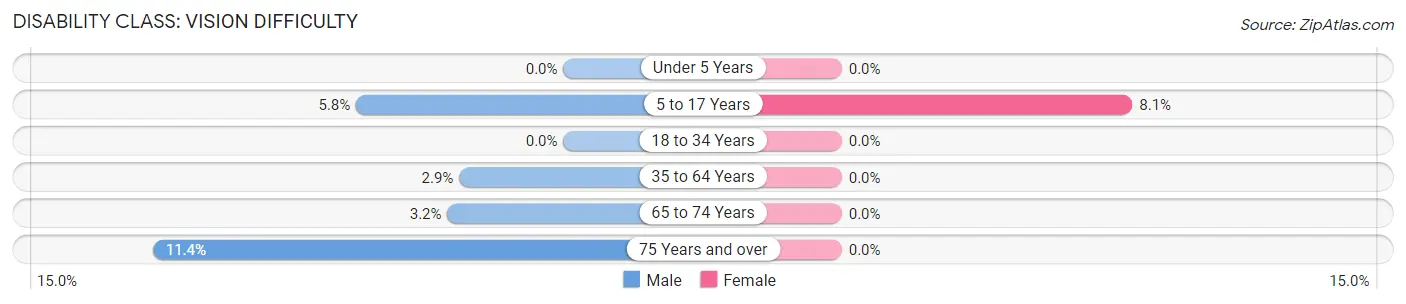
| Age Bracket | Male | Female |
| Under 5 Years | 0 (0.0%) | 0 (0.0%) |
| 5 to 17 Years | 25 (5.8%) | 30 (8.1%) |
| 18 to 34 Years | 0 (0.0%) | 0 (0.0%) |
| 35 to 64 Years | 35 (2.9%) | 0 (0.0%) |
| 65 to 74 Years | 9 (3.2%) | 0 (0.0%) |
| 75 Years and over | 8 (11.4%) | 0 (0.0%) |
Disability Class: Cognitive Difficulty
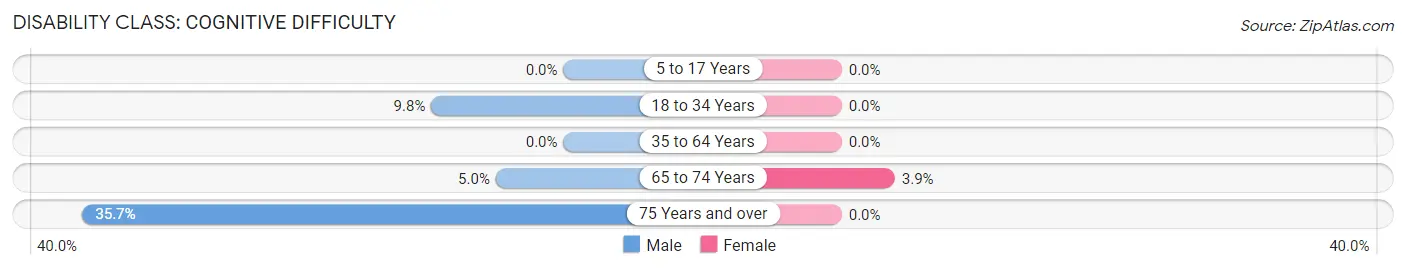
| Age Bracket | Male | Female |
| 5 to 17 Years | 0 (0.0%) | 0 (0.0%) |
| 18 to 34 Years | 53 (9.8%) | 0 (0.0%) |
| 35 to 64 Years | 0 (0.0%) | 0 (0.0%) |
| 65 to 74 Years | 14 (5.0%) | 14 (3.9%) |
| 75 Years and over | 25 (35.7%) | 0 (0.0%) |
Disability Class: Ambulatory Difficulty
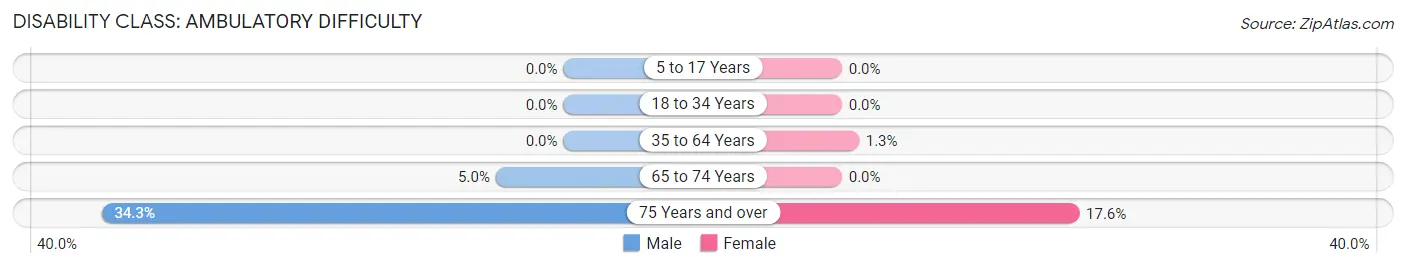
| Age Bracket | Male | Female |
| 5 to 17 Years | 0 (0.0%) | 0 (0.0%) |
| 18 to 34 Years | 0 (0.0%) | 0 (0.0%) |
| 35 to 64 Years | 0 (0.0%) | 13 (1.3%) |
| 65 to 74 Years | 14 (5.0%) | 0 (0.0%) |
| 75 Years and over | 24 (34.3%) | 37 (17.6%) |
Disability Class: Self-Care Difficulty
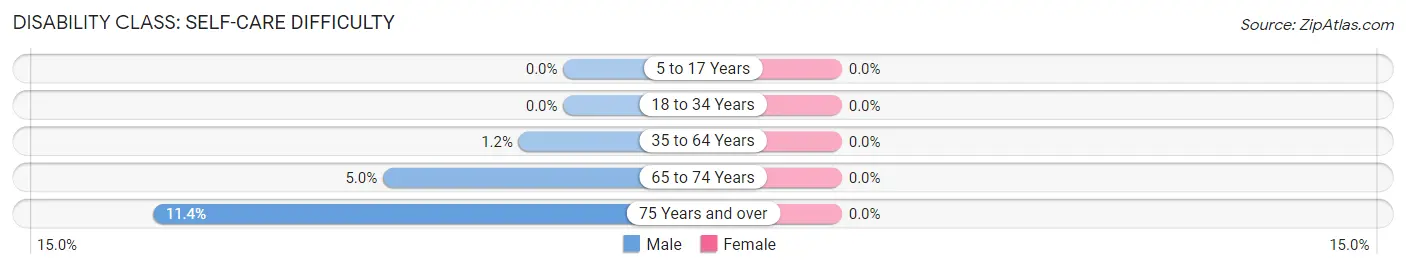
| Age Bracket | Male | Female |
| 5 to 17 Years | 0 (0.0%) | 0 (0.0%) |
| 18 to 34 Years | 0 (0.0%) | 0 (0.0%) |
| 35 to 64 Years | 15 (1.2%) | 0 (0.0%) |
| 65 to 74 Years | 14 (5.0%) | 0 (0.0%) |
| 75 Years and over | 8 (11.4%) | 0 (0.0%) |
Technology Access in Chesterbrook
Computing Device Access in Chesterbrook
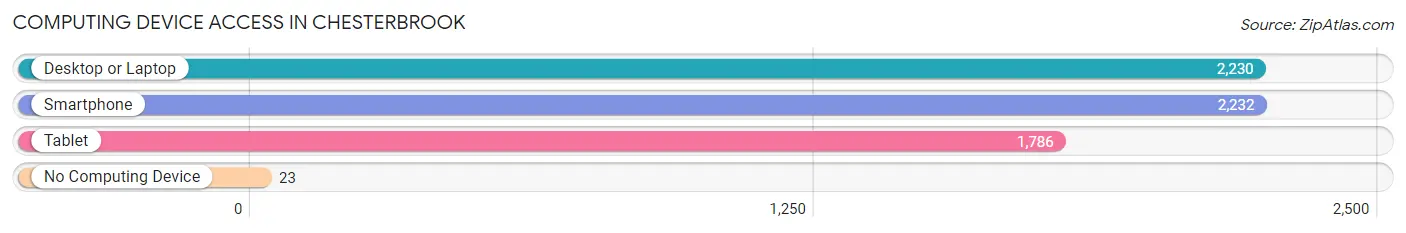
| Device Type | # Households | % Households |
| Desktop or Laptop | 2,230 | 97.2% |
| Smartphone | 2,232 | 97.3% |
| Tablet | 1,786 | 77.8% |
| No Computing Device | 23 | 1.0% |
| Total | 2,295 | 100.0% |
Internet Access in Chesterbrook
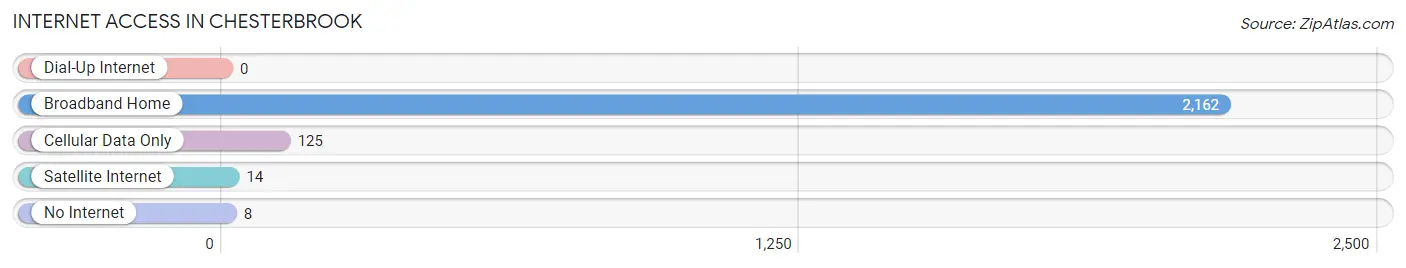
| Internet Type | # Households | % Households |
| Dial-Up Internet | 0 | 0.0% |
| Broadband Home | 2,162 | 94.2% |
| Cellular Data Only | 125 | 5.4% |
| Satellite Internet | 14 | 0.6% |
| No Internet | 8 | 0.4% |
| Total | 2,295 | 100.0% |
Chesterbrook Summary
Chesterbrook, Pennsylvania is a census-designated place located in the Tredyffrin Township of Chester County. It is a suburb of Philadelphia and is located approximately 20 miles west of the city. The population of Chesterbrook was 8,845 at the 2010 census.
History
Chesterbrook was originally part of the Welsh Tract, a large tract of land granted to Welsh Quakers in 1681 by William Penn. The area was known as “Chester” until the early 1900s when it was renamed “Chesterbrook” after the nearby Chester Creek. The area was largely rural until the 1950s when it began to be developed as a residential suburb of Philadelphia.
Geography
Chesterbrook is located at 40°3′17″N 75°25′45″W (40.054722, -75.429167). It is situated in the Tredyffrin Township of Chester County, Pennsylvania. The area is bordered by the Schuylkill River to the east, Valley Forge National Historical Park to the north, and the city of Philadelphia to the south and east.
The area is mostly flat with some rolling hills. The average elevation is approximately 200 feet above sea level. The climate is humid continental, with hot, humid summers and cold, snowy winters.
Economy
Chesterbrook is primarily a residential suburb of Philadelphia. The area is home to several large employers, including the Vanguard Group, GlaxoSmithKline, and the Chesterbrook Corporate Center. The area also has several small businesses, including restaurants, retail stores, and professional services.
Demographics
As of the 2010 census, the population of Chesterbrook was 8,845. The racial makeup of the area was 79.2% White, 8.2% African American, 0.2% Native American, 8.3% Asian, and 4.1% from other races. Hispanic or Latino of any race were 2.7% of the population.
The median household income in Chesterbrook was $90,945 in 2010. The per capita income was $45,945. About 3.2% of families and 4.3% of the population were below the poverty line, including 4.7% of those under age 18 and 4.2% of those age 65 or over.
The majority of the population is well-educated, with 87.2% of the population over the age of 25 having a bachelor’s degree or higher. The area is also home to several prestigious private schools, including the Agnes Irwin School and the Shipley School.
Common Questions
What is Per Capita Income in Chesterbrook?
Per Capita income in Chesterbrook is $66,253.
What is the Median Family Income in Chesterbrook?
Median Family Income in Chesterbrook is $167,634.
What is the Median Household income in Chesterbrook?
Median Household Income in Chesterbrook is $135,849.
What is Income or Wage Gap in Chesterbrook?
Income or Wage Gap in Chesterbrook is 43.9%.
Women in Chesterbrook earn 56.1 cents for every dollar earned by a man.
What is Inequality or Gini Index in Chesterbrook?
Inequality or Gini Index in Chesterbrook is 0.40.
What is the Total Population of Chesterbrook?
Total Population of Chesterbrook is 5,428.
What is the Total Male Population of Chesterbrook?
Total Male Population of Chesterbrook is 2,780.
What is the Total Female Population of Chesterbrook?
Total Female Population of Chesterbrook is 2,648.
What is the Ratio of Males per 100 Females in Chesterbrook?
There are 104.98 Males per 100 Females in Chesterbrook.
What is the Ratio of Females per 100 Males in Chesterbrook?
There are 95.25 Females per 100 Males in Chesterbrook.
What is the Median Population Age in Chesterbrook?
Median Population Age in Chesterbrook is 39.3 Years.
What is the Average Family Size in Chesterbrook
Average Family Size in Chesterbrook is 3.3 People.
What is the Average Household Size in Chesterbrook
Average Household Size in Chesterbrook is 2.4 People.
How Large is the Labor Force in Chesterbrook?
There are 3,135 People in the Labor Forcein in Chesterbrook.
What is the Percentage of People in the Labor Force in Chesterbrook?
72.5% of People are in the Labor Force in Chesterbrook.
What is the Unemployment Rate in Chesterbrook?
Unemployment Rate in Chesterbrook is 3.0%.