Hometown, PA Map & Demographics
Hometown Map
Hometown Overview
$47,342
PER CAPITA INCOME
$163,808
AVG FAMILY INCOME
4.0%
WAGE / INCOME GAP [ % ]
96.0¢/ $1
WAGE / INCOME GAP [ $ ]
0.34
INEQUALITY / GINI INDEX
1,660
TOTAL POPULATION
761
MALE POPULATION
899
FEMALE POPULATION
84.65
MALES / 100 FEMALES
118.13
FEMALES / 100 MALES
45.7
MEDIAN AGE
2.7
AVG FAMILY SIZE
2.4
AVG HOUSEHOLD SIZE
1,088
LABOR FORCE [ PEOPLE ]
74.3%
PERCENT IN LABOR FORCE
3.1%
UNEMPLOYMENT RATE
Income in Hometown
Income Overview in Hometown
| Characteristic | Number | Measure |
| Per Capita Income | 1,660 | $47,342 |
| Median Family Income | 563 | $163,808 |
| Mean Family Income | 563 | $137,091 |
| Median Household Income | 699 | $0 |
| Mean Household Income | 699 | $117,883 |
| Income Deficit | 563 | $0 |
| Wage / Income Gap (%) | 1,660 | 3.97% |
| Wage / Income Gap ($) | 1,660 | 96.03¢ per $1 |
| Gini / Inequality Index | 1,660 | 0.34 |
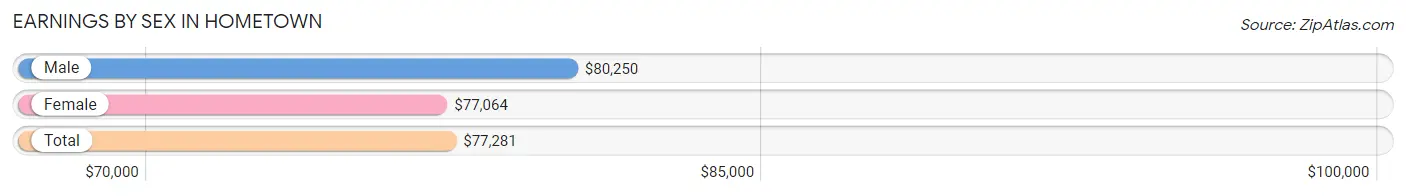
Earnings by Sex in Hometown
Average Earnings in Hometown are $77,281, $80,250 for men and $77,064 for women, a difference of 4.0%.
| Sex | Number | Average Earnings |
| Male | 509 (47.7%) | $80,250 |
| Female | 557 (52.2%) | $77,064 |
| Total | 1,066 (100.0%) | $77,281 |
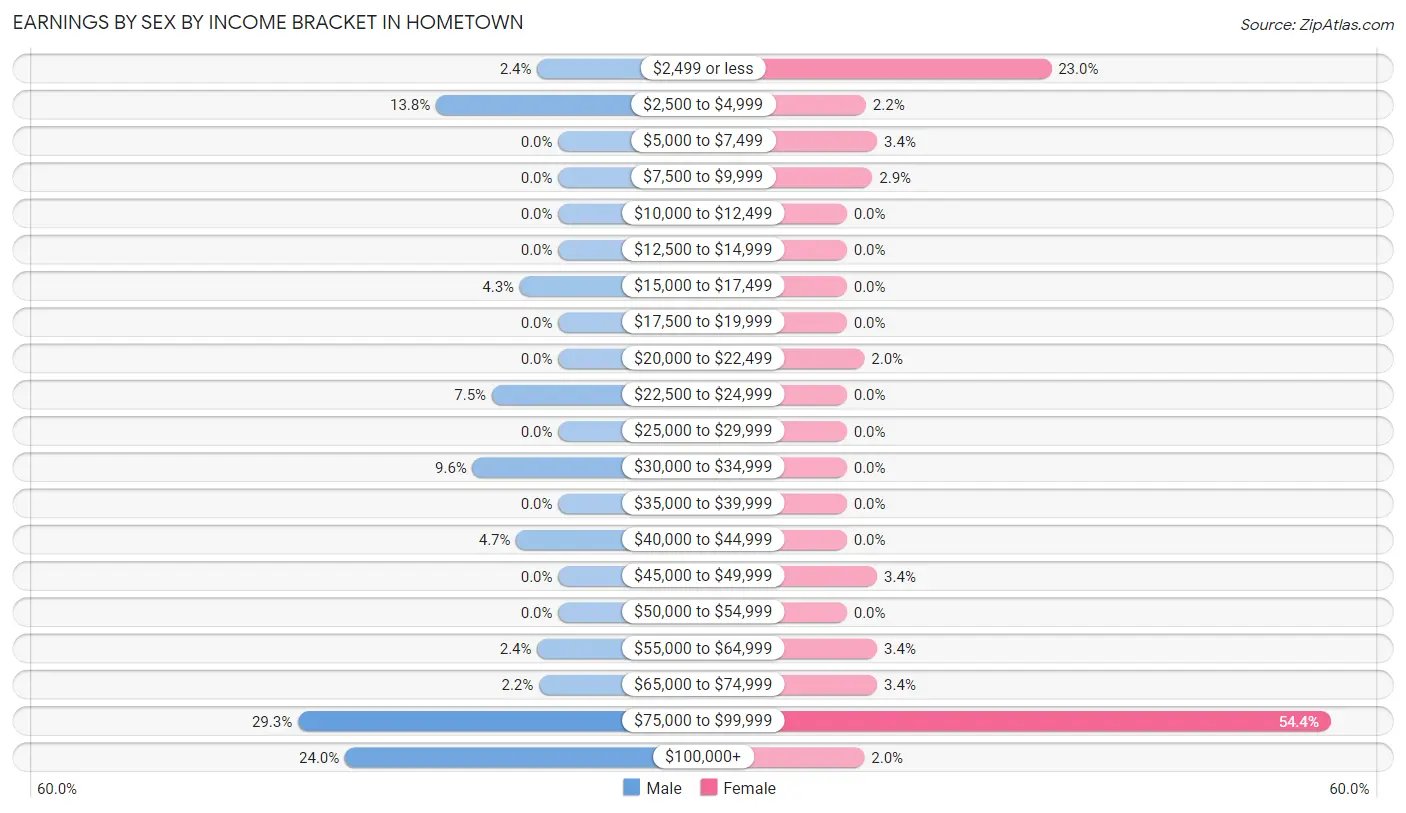
Earnings by Sex by Income Bracket in Hometown
The most common earnings brackets in Hometown are $75,000 to $99,999 for men (149 | 29.3%) and $75,000 to $99,999 for women (303 | 54.4%).
| Income | Male | Female |
| $2,499 or less | 12 (2.4%) | 128 (23.0%) |
| $2,500 to $4,999 | 70 (13.8%) | 12 (2.1%) |
| $5,000 to $7,499 | 0 (0.0%) | 19 (3.4%) |
| $7,500 to $9,999 | 0 (0.0%) | 16 (2.9%) |
| $10,000 to $12,499 | 0 (0.0%) | 0 (0.0%) |
| $12,500 to $14,999 | 0 (0.0%) | 0 (0.0%) |
| $15,000 to $17,499 | 22 (4.3%) | 0 (0.0%) |
| $17,500 to $19,999 | 0 (0.0%) | 0 (0.0%) |
| $20,000 to $22,499 | 0 (0.0%) | 11 (2.0%) |
| $22,500 to $24,999 | 38 (7.5%) | 0 (0.0%) |
| $25,000 to $29,999 | 0 (0.0%) | 0 (0.0%) |
| $30,000 to $34,999 | 49 (9.6%) | 0 (0.0%) |
| $35,000 to $39,999 | 0 (0.0%) | 0 (0.0%) |
| $40,000 to $44,999 | 24 (4.7%) | 0 (0.0%) |
| $45,000 to $49,999 | 0 (0.0%) | 19 (3.4%) |
| $50,000 to $54,999 | 0 (0.0%) | 0 (0.0%) |
| $55,000 to $64,999 | 12 (2.4%) | 19 (3.4%) |
| $65,000 to $74,999 | 11 (2.2%) | 19 (3.4%) |
| $75,000 to $99,999 | 149 (29.3%) | 303 (54.4%) |
| $100,000+ | 122 (24.0%) | 11 (2.0%) |
| Total | 509 (100.0%) | 557 (100.0%) |
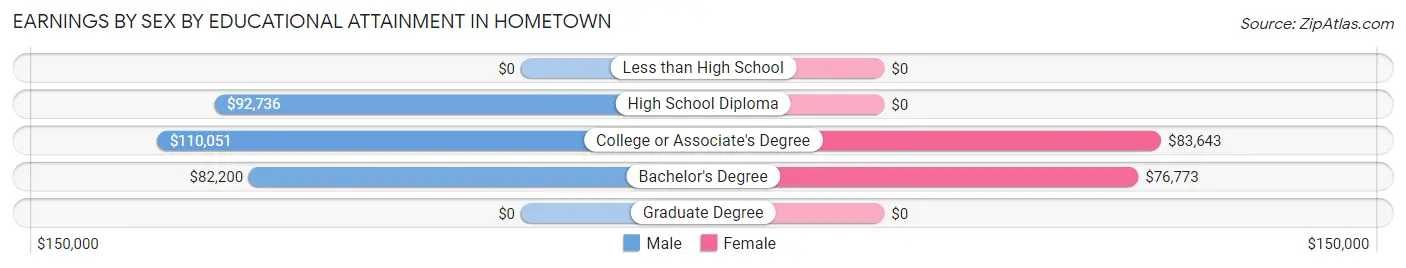
Earnings by Sex by Educational Attainment in Hometown
Average earnings in Hometown are $87,256 for men and $82,897 for women, a difference of 5.0%. Men with an educational attainment of college or associate's degree enjoy the highest average annual earnings of $110,051, while those with bachelor's degree education earn the least with $82,200. Women with an educational attainment of college or associate's degree earn the most with the average annual earnings of $83,643, while those with bachelor's degree education have the smallest earnings of $76,773.
| Educational Attainment | Male Income | Female Income |
| Less than High School | - | - |
| High School Diploma | $92,736 | $0 |
| College or Associate's Degree | $110,051 | $83,643 |
| Bachelor's Degree | $82,200 | $76,773 |
| Graduate Degree | - | - |
| Total | $87,256 | $82,897 |
Family Income in Hometown
Family Income Brackets in Hometown
According to the Hometown family income data, there are 232 families falling into the $150,000 to $199,999 income range, which is the most common income bracket and makes up 41.2% of all families.
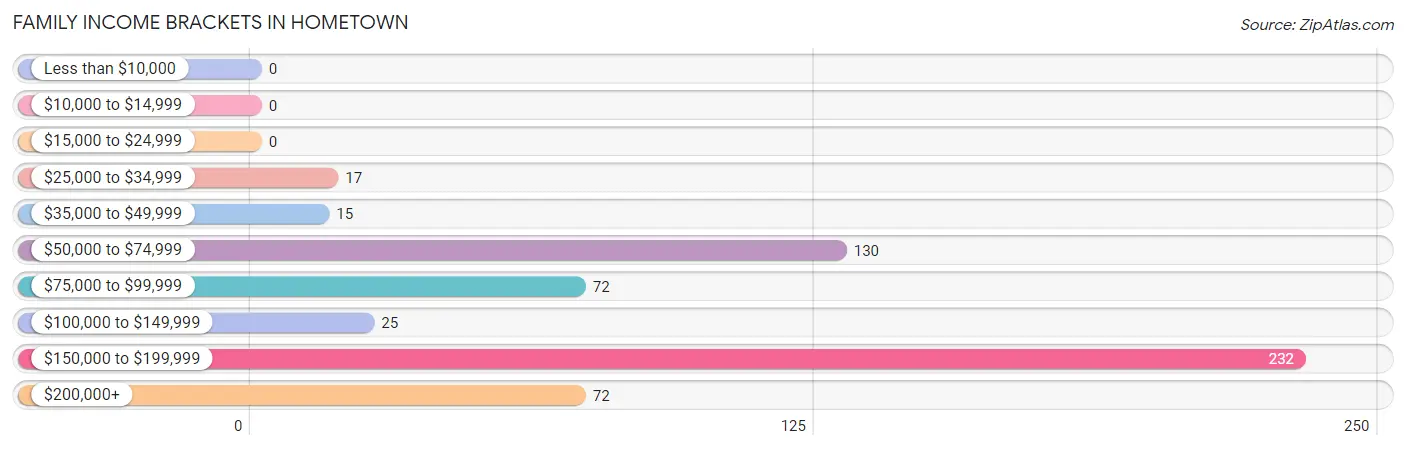
| Income Bracket | # Families | % Families |
| Less than $10,000 | 0 | 0.0% |
| $10,000 to $14,999 | 0 | 0.0% |
| $15,000 to $24,999 | 0 | 0.0% |
| $25,000 to $34,999 | 17 | 3.0% |
| $35,000 to $49,999 | 15 | 2.7% |
| $50,000 to $74,999 | 130 | 23.1% |
| $75,000 to $99,999 | 72 | 12.8% |
| $100,000 to $149,999 | 25 | 4.4% |
| $150,000 to $199,999 | 232 | 41.2% |
| $200,000+ | 72 | 12.8% |
Family Income by Famaliy Size in Hometown
3-person families (131 | 23.3%) account for the highest median family income in Hometown with $164,564 per family, while 3-person families (131 | 23.3%) have the highest median income of $54,855 per family member.
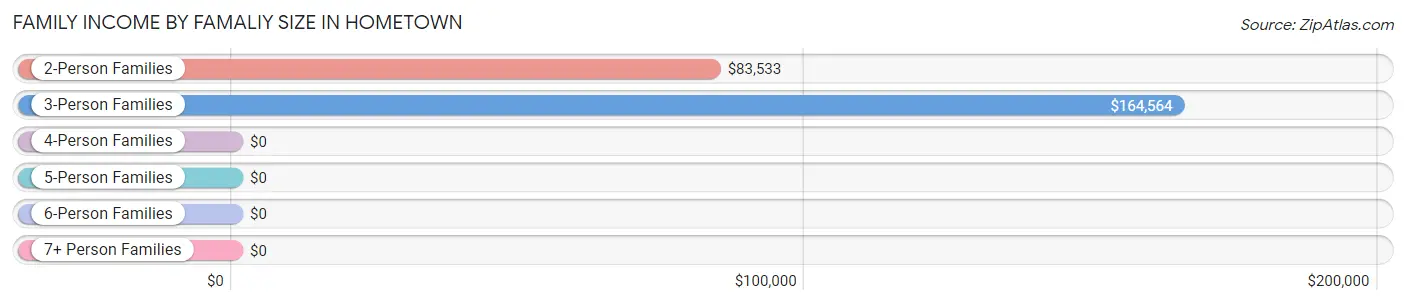
| Income Bracket | # Families | Median Income |
| 2-Person Families | 273 (48.5%) | $83,533 |
| 3-Person Families | 131 (23.3%) | $164,564 |
| 4-Person Families | 129 (22.9%) | $0 |
| 5-Person Families | 11 (1.9%) | $0 |
| 6-Person Families | 19 (3.4%) | $0 |
| 7+ Person Families | 0 (0.0%) | $0 |
| Total | 563 (100.0%) | $163,808 |
Family Income by Number of Earners in Hometown
The median family income in Hometown is $163,808, with families comprising 2 earners (209) having the highest median family income of $193,342, while families with no earners (107) have the lowest median family income of $70,341, accounting for 37.1% and 19.0% of families, respectively.
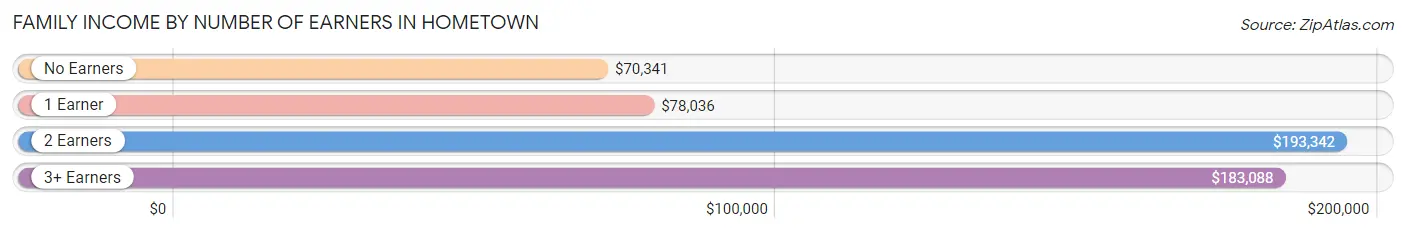
| Number of Earners | # Families | Median Income |
| No Earners | 107 (19.0%) | $70,341 |
| 1 Earner | 68 (12.1%) | $78,036 |
| 2 Earners | 209 (37.1%) | $193,342 |
| 3+ Earners | 179 (31.8%) | $183,088 |
| Total | 563 (100.0%) | $163,808 |
Household Income in Hometown
Household Income Brackets in Hometown
With 232 households falling in the category, the $150,000 to $199,999 income range is the most frequent in Hometown, accounting for 33.2% of all households.
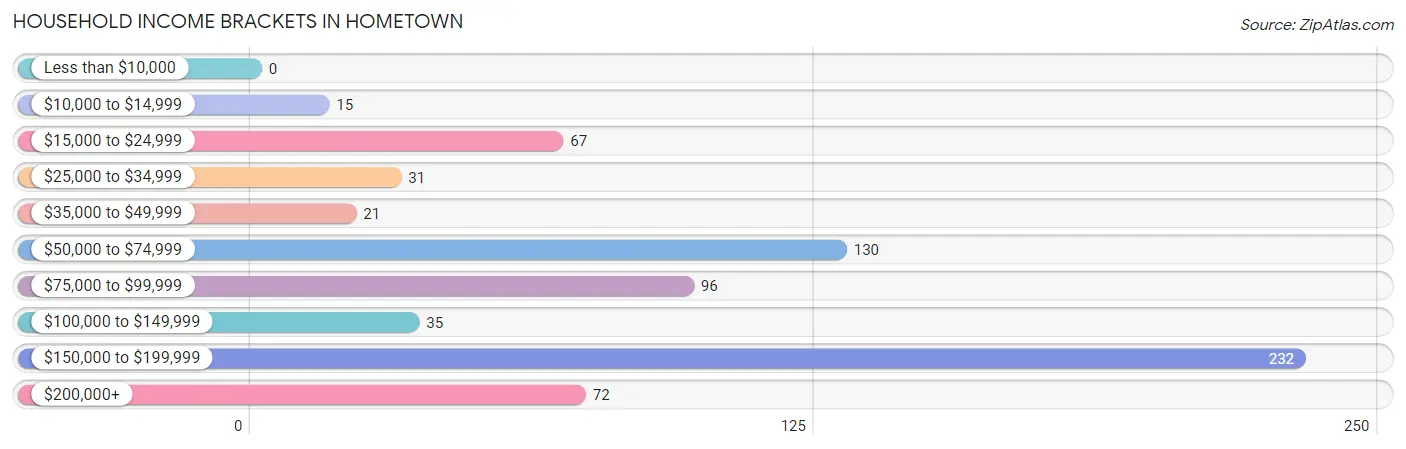
| Income Bracket | # Households | % Households |
| Less than $10,000 | 0 | 0.0% |
| $10,000 to $14,999 | 15 | 2.1% |
| $15,000 to $24,999 | 67 | 9.6% |
| $25,000 to $34,999 | 31 | 4.4% |
| $35,000 to $49,999 | 21 | 3.0% |
| $50,000 to $74,999 | 130 | 18.6% |
| $75,000 to $99,999 | 96 | 13.7% |
| $100,000 to $149,999 | 35 | 5.0% |
| $150,000 to $199,999 | 232 | 33.2% |
| $200,000+ | 72 | 10.3% |
Household Income by Householder Age in Hometown
The median household income in Hometown is $0, with the highest median household income of $183,130 found in the 45 to 64 years age bracket for the primary householder. A total of 319 households (45.6%) fall into this category.
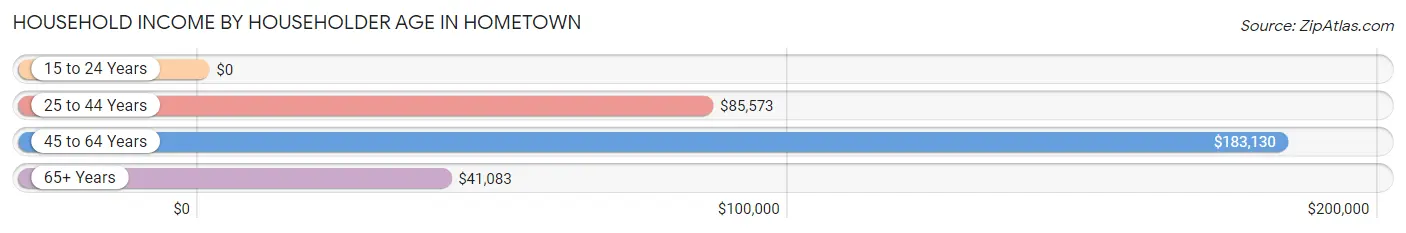
| Income Bracket | # Households | Median Income |
| 15 to 24 Years | 0 (0.0%) | $0 |
| 25 to 44 Years | 179 (25.6%) | $85,573 |
| 45 to 64 Years | 319 (45.6%) | $183,130 |
| 65+ Years | 201 (28.8%) | $41,083 |
| Total | 699 (100.0%) | $0 |
Poverty in Hometown
Income Below Poverty by Sex and Age in Hometown
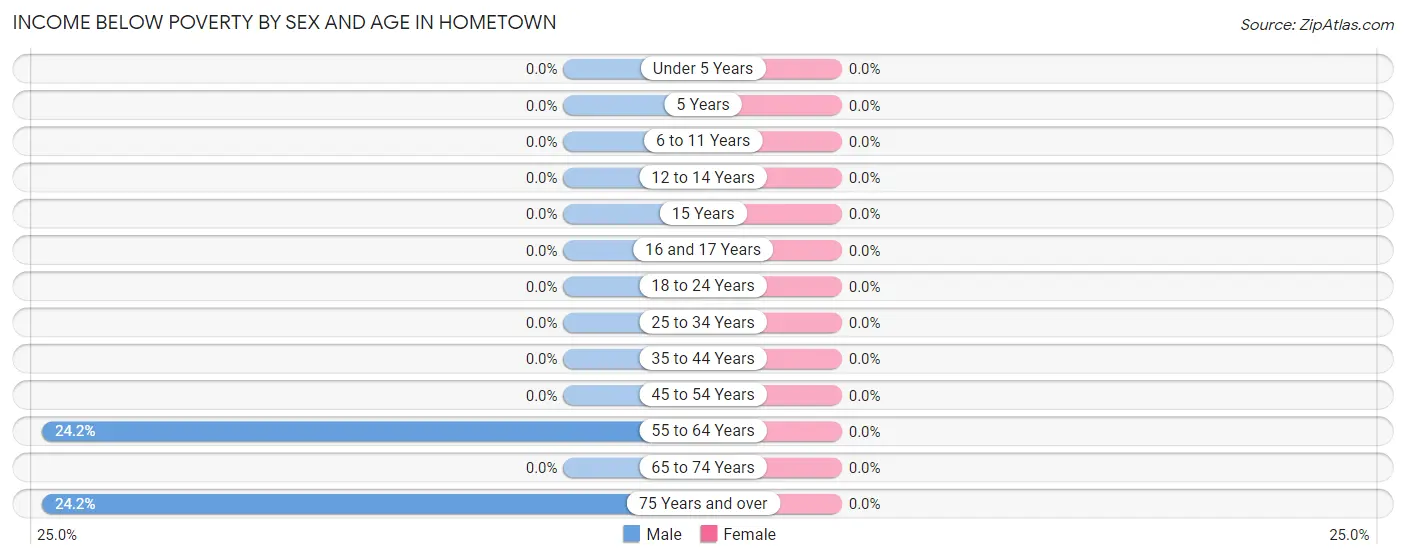
| Age Bracket | Male | Female |
| Under 5 Years | 0 (0.0%) | 0 (0.0%) |
| 5 Years | 0 (0.0%) | 0 (0.0%) |
| 6 to 11 Years | 0 (0.0%) | 0 (0.0%) |
| 12 to 14 Years | 0 (0.0%) | 0 (0.0%) |
| 15 Years | 0 (0.0%) | 0 (0.0%) |
| 16 and 17 Years | 0 (0.0%) | 0 (0.0%) |
| 18 to 24 Years | 0 (0.0%) | 0 (0.0%) |
| 25 to 34 Years | 0 (0.0%) | 0 (0.0%) |
| 35 to 44 Years | 0 (0.0%) | 0 (0.0%) |
| 45 to 54 Years | 0 (0.0%) | 0 (0.0%) |
| 55 to 64 Years | 15 (24.2%) | 0 (0.0%) |
| 65 to 74 Years | 0 (0.0%) | 0 (0.0%) |
| 75 Years and over | 15 (24.2%) | 0 (0.0%) |
| Total | 30 (3.9%) | 0 (0.0%) |
Income Above Poverty by Sex and Age in Hometown
According to the poverty statistics in Hometown, males aged under 5 years and females aged under 5 years are the age groups that are most secure financially, with 100.0% of males and 100.0% of females in these age groups living above the poverty line.
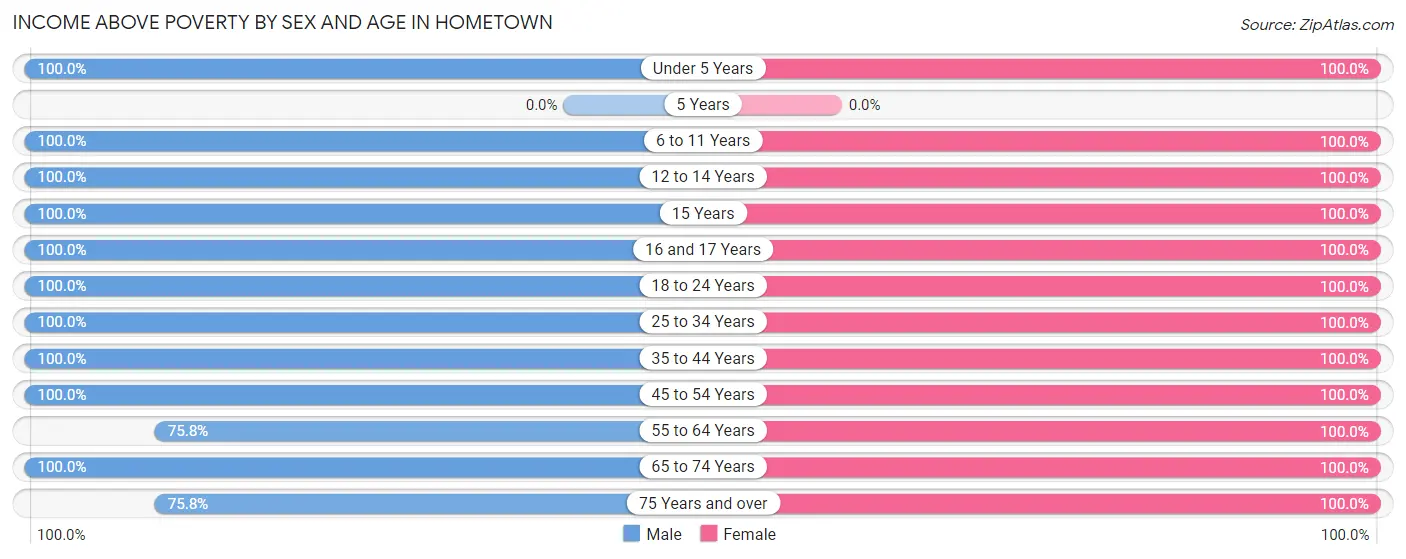
| Age Bracket | Male | Female |
| Under 5 Years | 11 (100.0%) | 9 (100.0%) |
| 5 Years | 0 (0.0%) | 0 (0.0%) |
| 6 to 11 Years | 22 (100.0%) | 39 (100.0%) |
| 12 to 14 Years | 25 (100.0%) | 39 (100.0%) |
| 15 Years | 19 (100.0%) | 31 (100.0%) |
| 16 and 17 Years | 19 (100.0%) | 74 (100.0%) |
| 18 to 24 Years | 119 (100.0%) | 81 (100.0%) |
| 25 to 34 Years | 24 (100.0%) | 89 (100.0%) |
| 35 to 44 Years | 95 (100.0%) | 61 (100.0%) |
| 45 to 54 Years | 257 (100.0%) | 259 (100.0%) |
| 55 to 64 Years | 47 (75.8%) | 50 (100.0%) |
| 65 to 74 Years | 46 (100.0%) | 47 (100.0%) |
| 75 Years and over | 47 (75.8%) | 120 (100.0%) |
| Total | 731 (96.1%) | 899 (100.0%) |
Income Below Poverty Among Married-Couple Families in Hometown
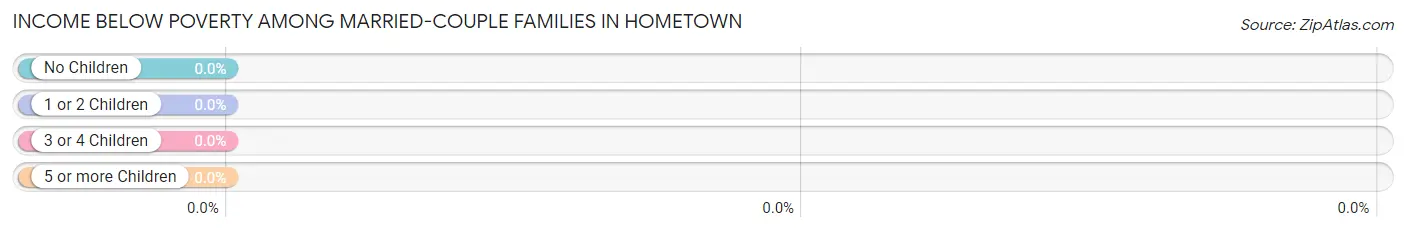
| Children | Above Poverty | Below Poverty |
| No Children | 314 (100.0%) | 0 (0.0%) |
| 1 or 2 Children | 102 (100.0%) | 0 (0.0%) |
| 3 or 4 Children | 30 (100.0%) | 0 (0.0%) |
| 5 or more Children | 0 (0.0%) | 0 (0.0%) |
| Total | 446 (100.0%) | 0 (0.0%) |
Income Below Poverty Among Single-Parent Households in Hometown
| Children | Single Father | Single Mother |
| No Children | 0 (0.0%) | 0 (0.0%) |
| 1 or 2 Children | 0 (0.0%) | 0 (0.0%) |
| 3 or 4 Children | 0 (0.0%) | 0 (0.0%) |
| 5 or more Children | 0 (0.0%) | 0 (0.0%) |
| Total | 0 (0.0%) | 0 (0.0%) |
Income Below Poverty Among Married-Couple vs Single-Parent Households in Hometown
| Children | Married-Couple Families | Single-Parent Households |
| No Children | 0 (0.0%) | 0 (0.0%) |
| 1 or 2 Children | 0 (0.0%) | 0 (0.0%) |
| 3 or 4 Children | 0 (0.0%) | 0 (0.0%) |
| 5 or more Children | 0 (0.0%) | 0 (0.0%) |
| Total | 0 (0.0%) | 0 (0.0%) |
Race in Hometown
The most populous races in Hometown are White / Caucasian (1,611 | 97.1%), and Two or more Races (49 | 2.9%).
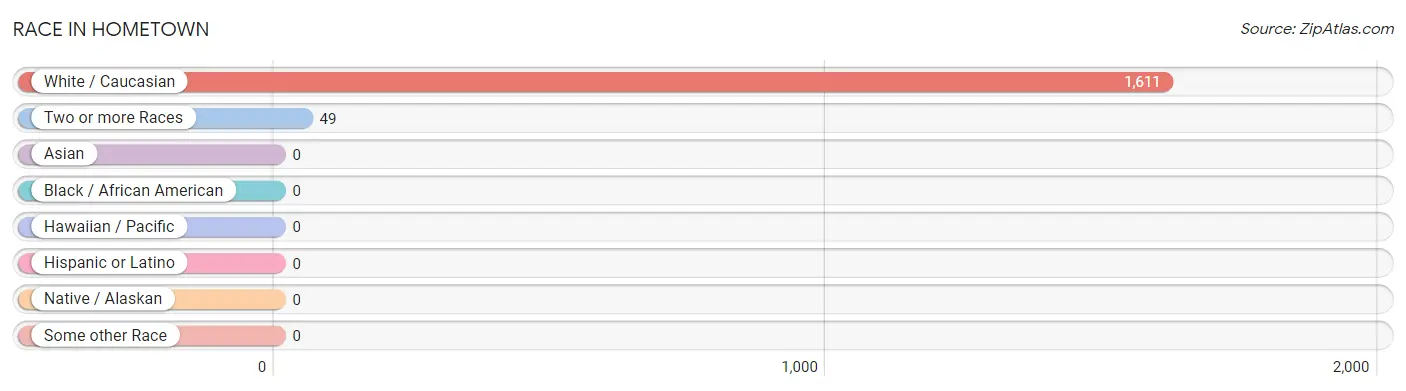
| Race | # Population | % Population |
| Asian | 0 | 0.0% |
| Black / African American | 0 | 0.0% |
| Hawaiian / Pacific | 0 | 0.0% |
| Hispanic or Latino | 0 | 0.0% |
| Native / Alaskan | 0 | 0.0% |
| White / Caucasian | 1,611 | 97.1% |
| Two or more Races | 49 | 2.9% |
| Some other Race | 0 | 0.0% |
| Total | 1,660 | 100.0% |
Ancestry in Hometown
The most populous ancestries reported in Hometown are Irish (607 | 36.6%), German (551 | 33.2%), Polish (266 | 16.0%), Italian (180 | 10.8%), and Slovak (120 | 7.2%), together accounting for 103.8% of all Hometown residents.
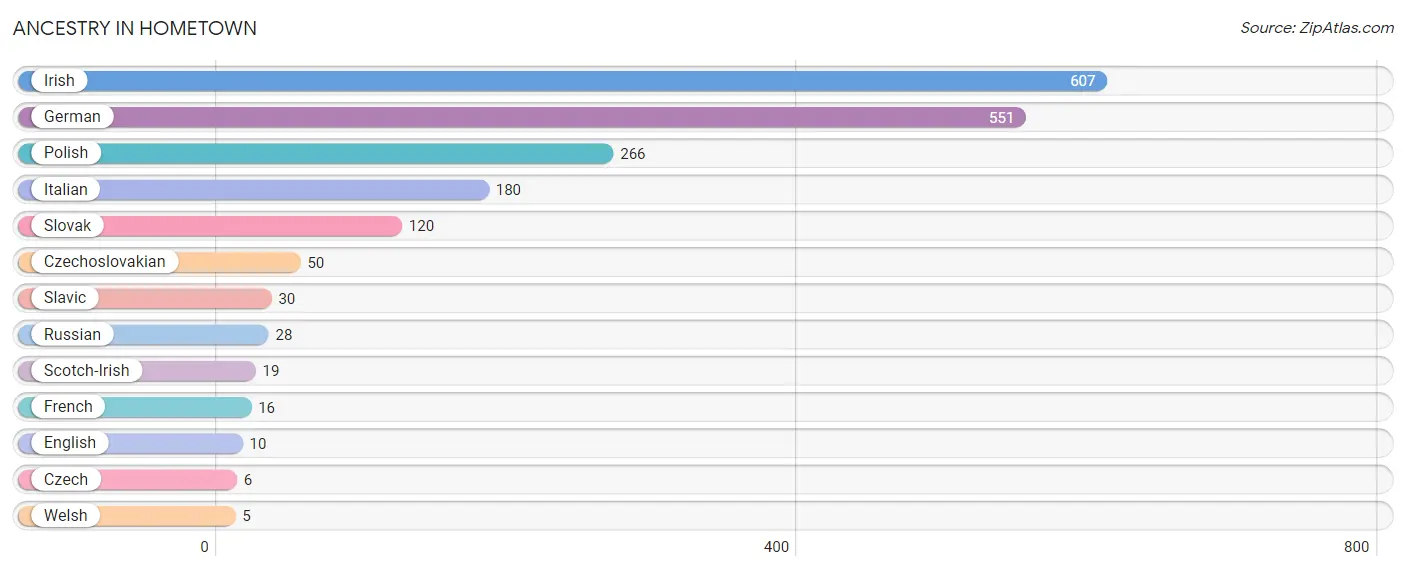
| Ancestry | # Population | % Population |
| Czech | 6 | 0.4% |
| Czechoslovakian | 50 | 3.0% |
| English | 10 | 0.6% |
| French | 16 | 1.0% |
| German | 551 | 33.2% |
| Irish | 607 | 36.6% |
| Italian | 180 | 10.8% |
| Polish | 266 | 16.0% |
| Russian | 28 | 1.7% |
| Scotch-Irish | 19 | 1.1% |
| Slavic | 30 | 1.8% |
| Slovak | 120 | 7.2% |
| Welsh | 5 | 0.3% | View All 13 Rows |
Immigrants in Hometown

| Immigration Origin | # Population | % Population | View All 0 Rows |
Sex and Age in Hometown
Sex and Age in Hometown
The most populous age groups in Hometown are 50 to 54 Years (163 | 21.4%) for men and 45 to 49 Years (243 | 27.0%) for women.
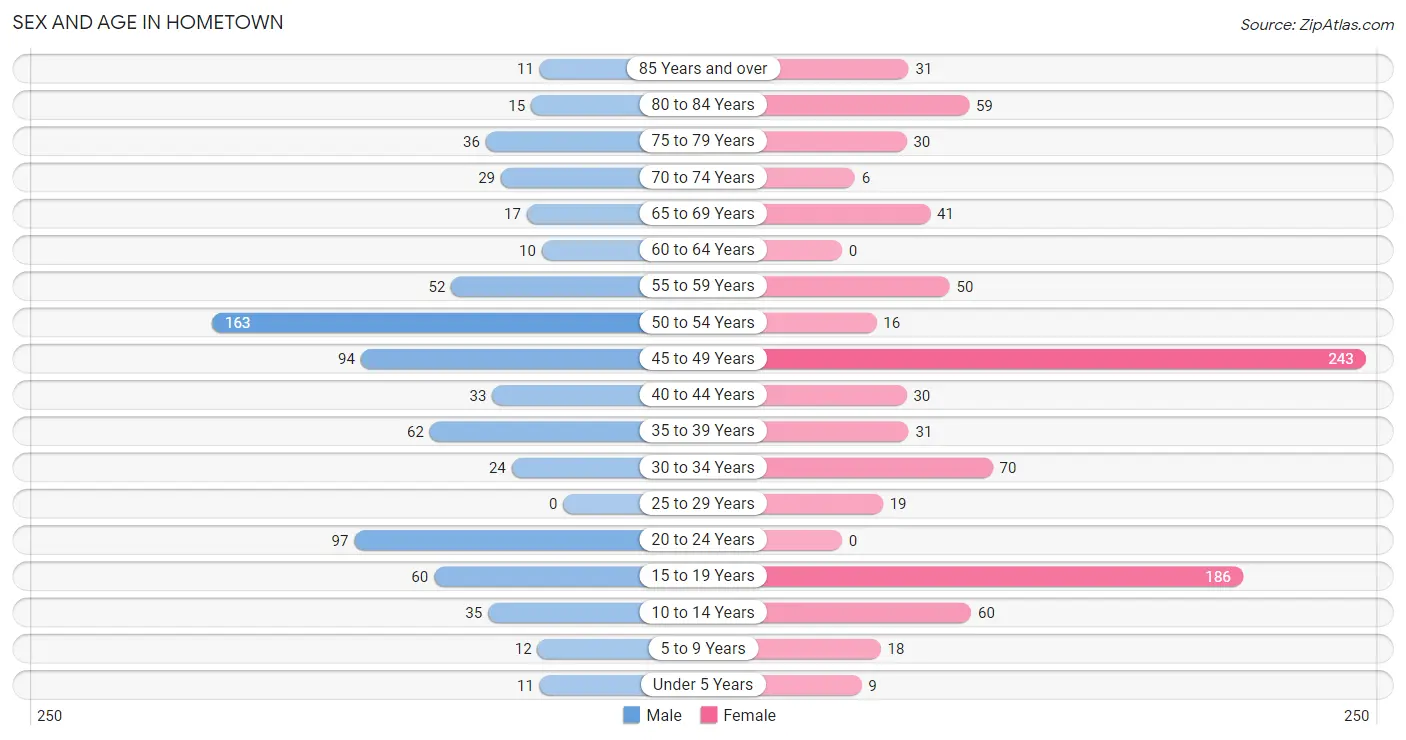
| Age Bracket | Male | Female |
| Under 5 Years | 11 (1.5%) | 9 (1.0%) |
| 5 to 9 Years | 12 (1.6%) | 18 (2.0%) |
| 10 to 14 Years | 35 (4.6%) | 60 (6.7%) |
| 15 to 19 Years | 60 (7.9%) | 186 (20.7%) |
| 20 to 24 Years | 97 (12.8%) | 0 (0.0%) |
| 25 to 29 Years | 0 (0.0%) | 19 (2.1%) |
| 30 to 34 Years | 24 (3.2%) | 70 (7.8%) |
| 35 to 39 Years | 62 (8.2%) | 31 (3.5%) |
| 40 to 44 Years | 33 (4.3%) | 30 (3.3%) |
| 45 to 49 Years | 94 (12.3%) | 243 (27.0%) |
| 50 to 54 Years | 163 (21.4%) | 16 (1.8%) |
| 55 to 59 Years | 52 (6.8%) | 50 (5.6%) |
| 60 to 64 Years | 10 (1.3%) | 0 (0.0%) |
| 65 to 69 Years | 17 (2.2%) | 41 (4.6%) |
| 70 to 74 Years | 29 (3.8%) | 6 (0.7%) |
| 75 to 79 Years | 36 (4.7%) | 30 (3.3%) |
| 80 to 84 Years | 15 (2.0%) | 59 (6.6%) |
| 85 Years and over | 11 (1.5%) | 31 (3.5%) |
| Total | 761 (100.0%) | 899 (100.0%) |
Families and Households in Hometown
Median Family Size in Hometown
The median family size in Hometown is 2.68 persons per family, with married-couple families (446 | 79.2%) accounting for the largest median family size of 2.85 persons per family. On the other hand, single female/mother families (91 | 16.2%) represent the smallest median family size with 2.00 persons per family.
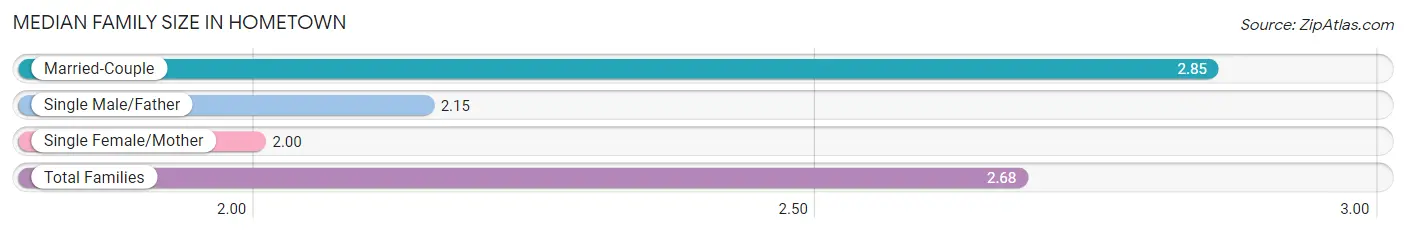
| Family Type | # Families | Family Size |
| Married-Couple | 446 (79.2%) | 2.85 |
| Single Male/Father | 26 (4.6%) | 2.15 |
| Single Female/Mother | 91 (16.2%) | 2.00 |
| Total Families | 563 (100.0%) | 2.68 |
Median Household Size in Hometown
The median household size in Hometown is 2.37 persons per household, with married-couple households (446 | 63.8%) accounting for the largest median household size of 2.85 persons per household. non-family households (136 | 19.5%) represent the smallest median household size with 1.11 persons per household.
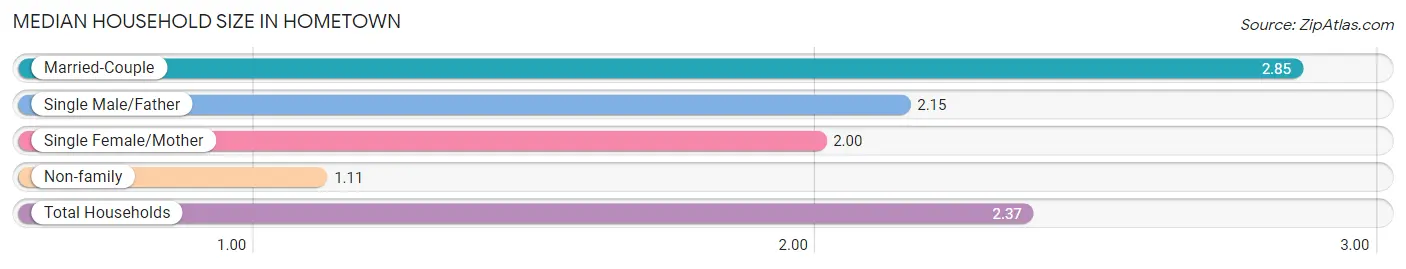
| Household Type | # Households | Household Size |
| Married-Couple | 446 (63.8%) | 2.85 |
| Single Male/Father | 26 (3.7%) | 2.15 |
| Single Female/Mother | 91 (13.0%) | 2.00 |
| Non-family | 136 (19.5%) | 1.11 |
| Total Households | 699 (100.0%) | 2.37 |
Household Size by Marriage Status in Hometown
Out of a total of 699 households in Hometown, 563 (80.5%) are family households, while 136 (19.5%) are nonfamily households. The most numerous type of family households are 2-person households, comprising 273, and the most common type of nonfamily households are 1-person households, comprising 121.
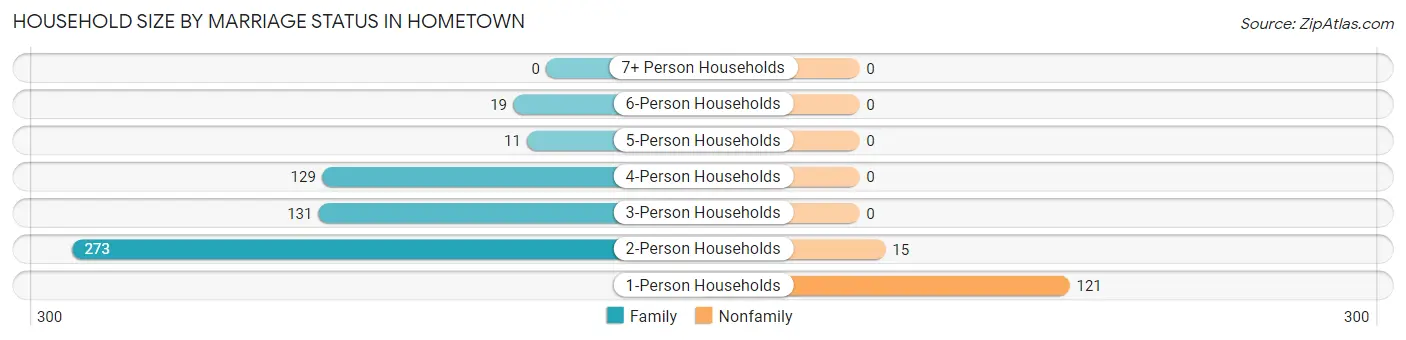
| Household Size | Family Households | Nonfamily Households |
| 1-Person Households | - | 121 (17.3%) |
| 2-Person Households | 273 (39.1%) | 15 (2.1%) |
| 3-Person Households | 131 (18.7%) | 0 (0.0%) |
| 4-Person Households | 129 (18.4%) | 0 (0.0%) |
| 5-Person Households | 11 (1.6%) | 0 (0.0%) |
| 6-Person Households | 19 (2.7%) | 0 (0.0%) |
| 7+ Person Households | 0 (0.0%) | 0 (0.0%) |
| Total | 563 (80.5%) | 136 (19.5%) |
Female Fertility in Hometown
Fertility by Age in Hometown
| Age Bracket | Women with Births | Births / 1,000 Women |
| 15 to 19 years | 0 (0.0%) | 0.0 |
| 20 to 34 years | 0 (0.0%) | 0.0 |
| 35 to 50 years | 0 (0.0%) | 0.0 |
| Total | 0 (0.0%) | 0.0 |
Fertility by Age by Marriage Status in Hometown
| Age Bracket | Married | Unmarried |
| 15 to 19 years | 0 (0.0%) | 0 (0.0%) |
| 20 to 34 years | 0 (0.0%) | 0 (0.0%) |
| 35 to 50 years | 0 (0.0%) | 0 (0.0%) |
| Total | 0 (0.0%) | 0 (0.0%) |
Fertility by Education in Hometown
| Educational Attainment | Women with Births | Births / 1,000 Women |
| Less than High School | 0 (0.0%) | 0.0 |
| High School Diploma | 0 (0.0%) | 0.0 |
| College or Associate's Degree | 0 (0.0%) | 0.0 |
| Bachelor's Degree | 0 (0.0%) | 0.0 |
| Graduate Degree | 0 (0.0%) | 0.0 |
| Total | 0 (0.0%) | 0.0 |
Fertility by Education by Marriage Status in Hometown
| Educational Attainment | Married | Unmarried |
| Less than High School | 0 (0.0%) | 0 (0.0%) |
| High School Diploma | 0 (0.0%) | 0 (0.0%) |
| College or Associate's Degree | 0 (0.0%) | 0 (0.0%) |
| Bachelor's Degree | 0 (0.0%) | 0 (0.0%) |
| Graduate Degree | 0 (0.0%) | 0 (0.0%) |
| Total | 0 (0.0%) | 0 (0.0%) |
Employment Characteristics in Hometown
Employment by Class of Employer in Hometown
Among the 973 employed individuals in Hometown, private company employees (557 | 57.3%), not-for-profit organizations (217 | 22.3%), and self-employed (not incorporated) (52 | 5.3%) make up the most common classes of employment.
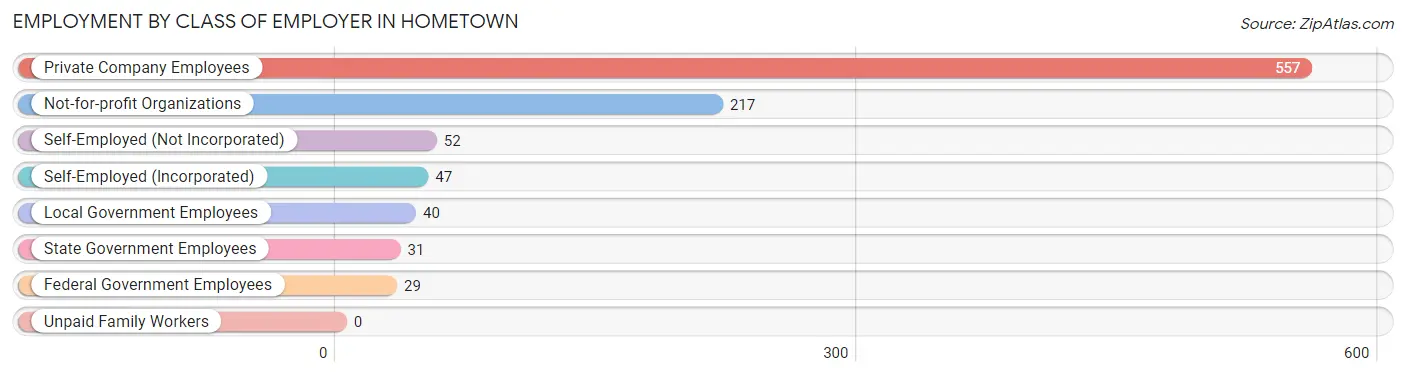
| Employer Class | # Employees | % Employees |
| Private Company Employees | 557 | 57.3% |
| Self-Employed (Incorporated) | 47 | 4.8% |
| Self-Employed (Not Incorporated) | 52 | 5.3% |
| Not-for-profit Organizations | 217 | 22.3% |
| Local Government Employees | 40 | 4.1% |
| State Government Employees | 31 | 3.2% |
| Federal Government Employees | 29 | 3.0% |
| Unpaid Family Workers | 0 | 0.0% |
| Total | 973 | 100.0% |
Employment Status by Age in Hometown
According to the labor force statistics for Hometown, out of the total population over 16 years of age (1,465), 74.3% or 1,088 individuals are in the labor force, with 3.1% or 34 of them unemployed. The age group with the highest labor force participation rate is 20 to 24 years, with 100.0% or 97 individuals in the labor force. Within the labor force, the 45 to 54 years age range has the highest percentage of unemployed individuals, with 6.6% or 34 of them being unemployed.
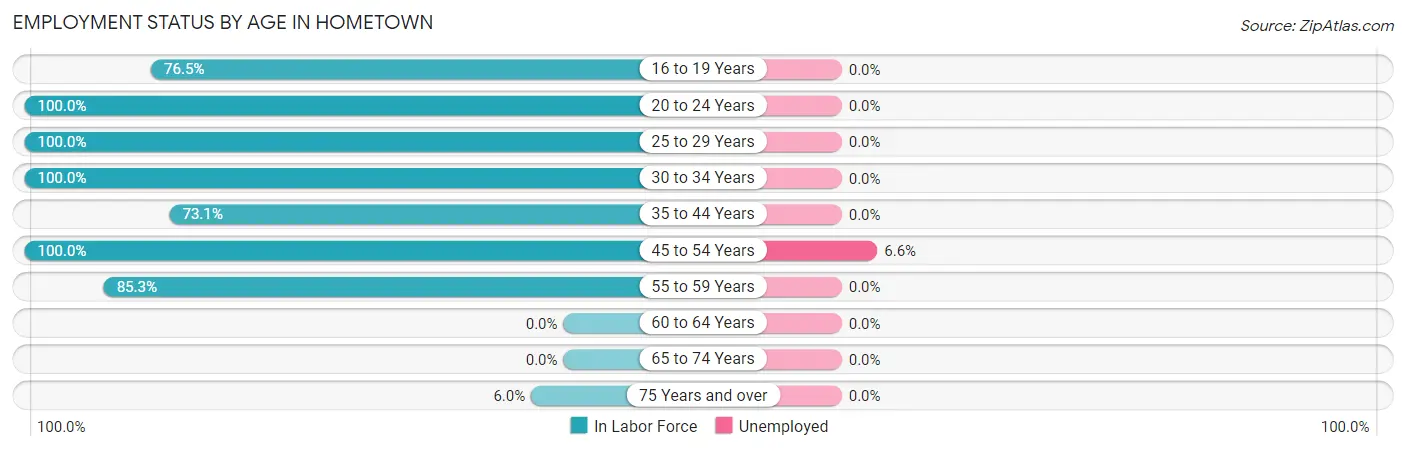
| Age Bracket | In Labor Force | Unemployed |
| 16 to 19 Years | 150 (76.5%) | 0 (0.0%) |
| 20 to 24 Years | 97 (100.0%) | 0 (0.0%) |
| 25 to 29 Years | 19 (100.0%) | 0 (0.0%) |
| 30 to 34 Years | 94 (100.0%) | 0 (0.0%) |
| 35 to 44 Years | 114 (73.1%) | 0 (0.0%) |
| 45 to 54 Years | 516 (100.0%) | 34 (6.6%) |
| 55 to 59 Years | 87 (85.3%) | 0 (0.0%) |
| 60 to 64 Years | 0 (0.0%) | 0 (0.0%) |
| 65 to 74 Years | 0 (0.0%) | 0 (0.0%) |
| 75 Years and over | 11 (6.0%) | 0 (0.0%) |
| Total | 1,088 (74.3%) | 34 (3.1%) |
Employment Status by Educational Attainment in Hometown
According to labor force statistics for Hometown, 92.5% of individuals (830) out of the total population between 25 and 64 years of age (897) are in the labor force, with 4.1% or 34 of them being unemployed. The group with the highest labor force participation rate are those with the educational attainment of less than high school, with 100.0% or 11 individuals in the labor force. Within the labor force, individuals with high school diploma education have the highest percentage of unemployment, with 19.1% or 34 of them being unemployed.
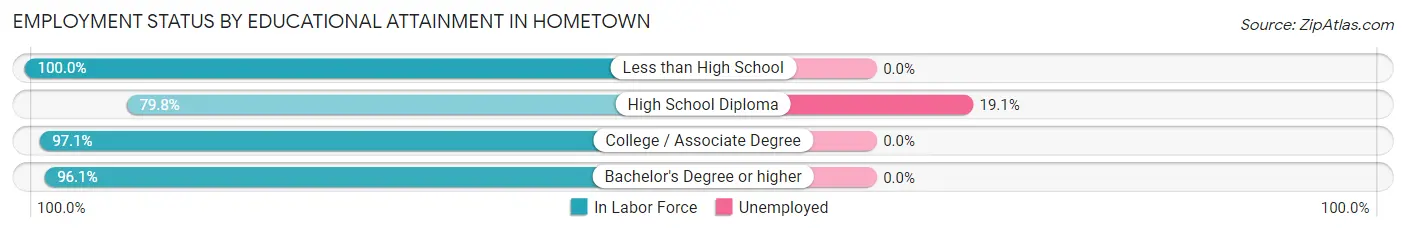
| Educational Attainment | In Labor Force | Unemployed |
| Less than High School | 11 (100.0%) | 0 (0.0%) |
| High School Diploma | 178 (79.8%) | 43 (19.1%) |
| College / Associate Degree | 397 (97.1%) | 0 (0.0%) |
| Bachelor's Degree or higher | 244 (96.1%) | 0 (0.0%) |
| Total | 830 (92.5%) | 37 (4.1%) |
Employment Occupations by Sex in Hometown
Management, Business, Science and Arts Occupations
The most common Management, Business, Science and Arts occupations in Hometown are Community & Social Service (206 | 19.5%), Health Diagnosing & Treating (181 | 17.2%), Arts, Media & Entertainment (111 | 10.5%), Management (101 | 9.6%), and Education Instruction & Library (95 | 9.0%).
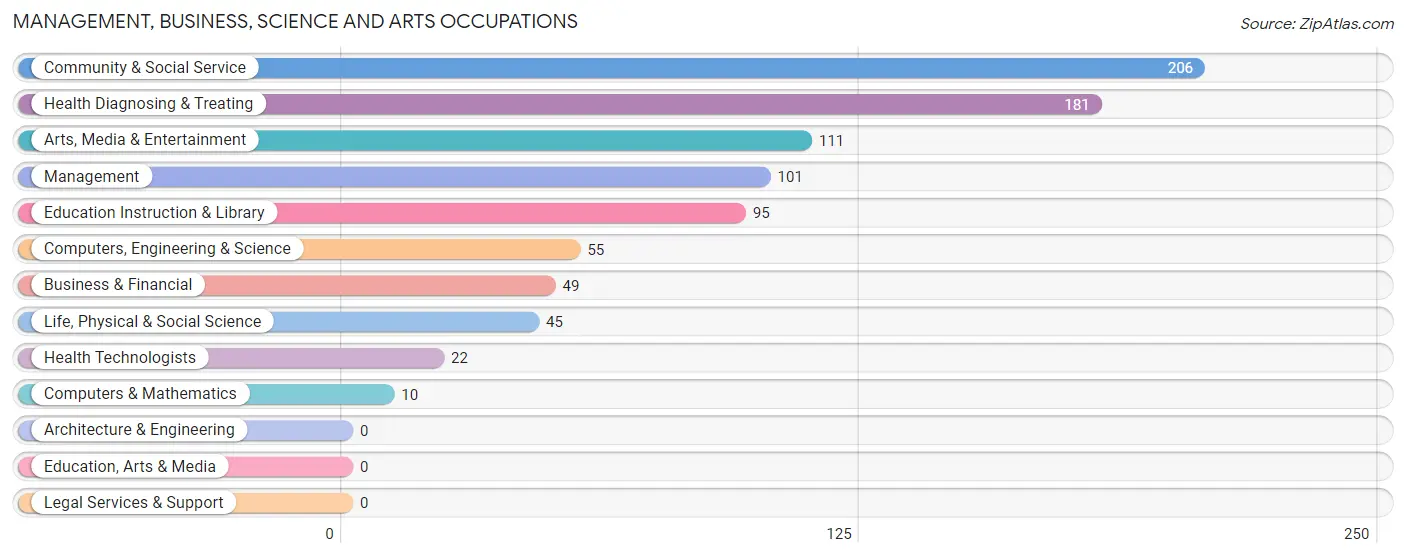
Management, Business, Science and Arts Occupations by Sex
Within the Management, Business, Science and Arts occupations in Hometown, the most male-oriented occupations are Computers, Engineering & Science (100.0%), Computers & Mathematics (100.0%), and Life, Physical & Social Science (100.0%), while the most female-oriented occupations are Health Diagnosing & Treating (93.9%), Education Instruction & Library (87.4%), and Community & Social Service (79.6%).
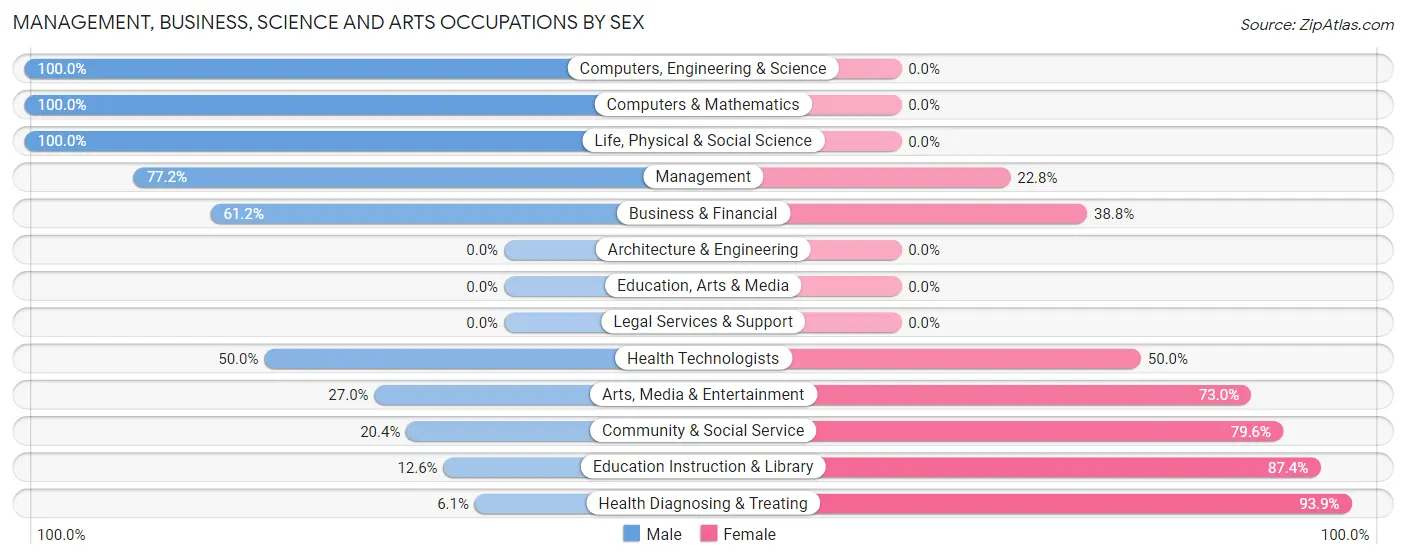
| Occupation | Male | Female |
| Management | 78 (77.2%) | 23 (22.8%) |
| Business & Financial | 30 (61.2%) | 19 (38.8%) |
| Computers, Engineering & Science | 55 (100.0%) | 0 (0.0%) |
| Computers & Mathematics | 10 (100.0%) | 0 (0.0%) |
| Architecture & Engineering | 0 (0.0%) | 0 (0.0%) |
| Life, Physical & Social Science | 45 (100.0%) | 0 (0.0%) |
| Community & Social Service | 42 (20.4%) | 164 (79.6%) |
| Education, Arts & Media | 0 (0.0%) | 0 (0.0%) |
| Legal Services & Support | 0 (0.0%) | 0 (0.0%) |
| Education Instruction & Library | 12 (12.6%) | 83 (87.4%) |
| Arts, Media & Entertainment | 30 (27.0%) | 81 (73.0%) |
| Health Diagnosing & Treating | 11 (6.1%) | 170 (93.9%) |
| Health Technologists | 11 (50.0%) | 11 (50.0%) |
| Total (Category) | 216 (36.5%) | 376 (63.5%) |
| Total (Overall) | 509 (48.3%) | 545 (51.7%) |
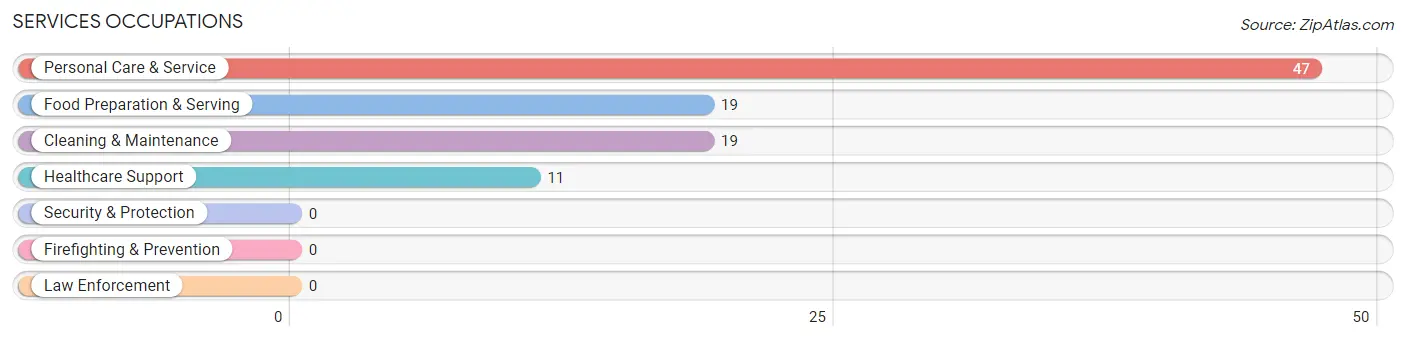
Services Occupations
The most common Services occupations in Hometown are Personal Care & Service (47 | 4.5%), Food Preparation & Serving (19 | 1.8%), Cleaning & Maintenance (19 | 1.8%), and Healthcare Support (11 | 1.0%).
Services Occupations by Sex
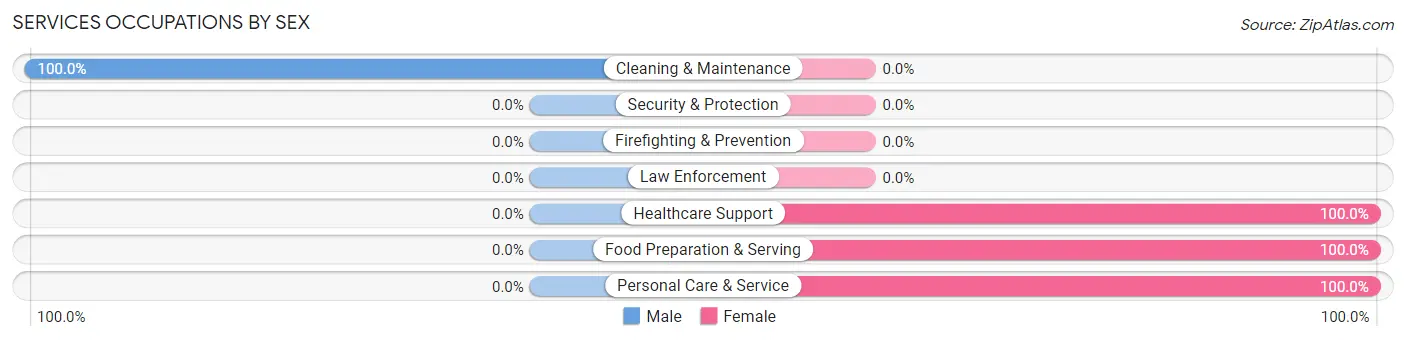
| Occupation | Male | Female |
| Healthcare Support | 0 (0.0%) | 11 (100.0%) |
| Security & Protection | 0 (0.0%) | 0 (0.0%) |
| Firefighting & Prevention | 0 (0.0%) | 0 (0.0%) |
| Law Enforcement | 0 (0.0%) | 0 (0.0%) |
| Food Preparation & Serving | 0 (0.0%) | 19 (100.0%) |
| Cleaning & Maintenance | 19 (100.0%) | 0 (0.0%) |
| Personal Care & Service | 0 (0.0%) | 47 (100.0%) |
| Total (Category) | 19 (19.8%) | 77 (80.2%) |
| Total (Overall) | 509 (48.3%) | 545 (51.7%) |
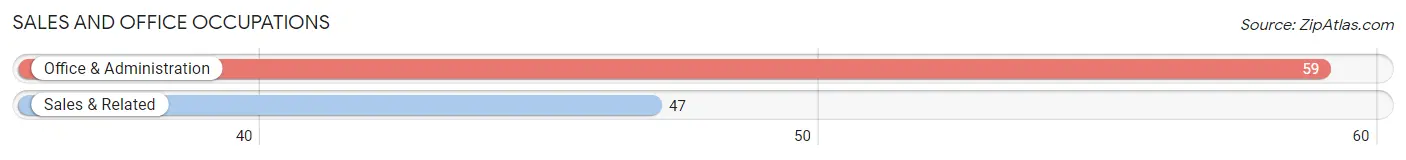
Sales and Office Occupations
The most common Sales and Office occupations in Hometown are Office & Administration (59 | 5.6%), and Sales & Related (47 | 4.5%).
Sales and Office Occupations by Sex
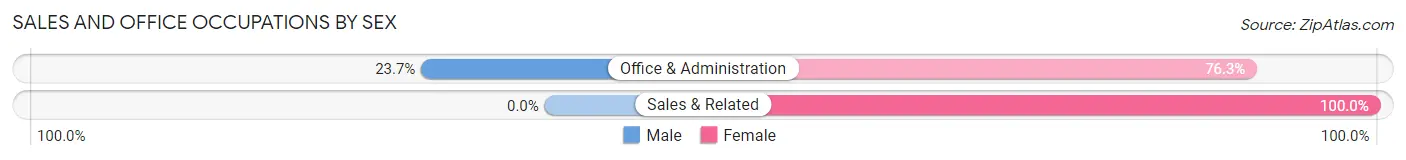
| Occupation | Male | Female |
| Sales & Related | 0 (0.0%) | 47 (100.0%) |
| Office & Administration | 14 (23.7%) | 45 (76.3%) |
| Total (Category) | 14 (13.2%) | 92 (86.8%) |
| Total (Overall) | 509 (48.3%) | 545 (51.7%) |
Natural Resources, Construction and Maintenance Occupations
The most common Natural Resources, Construction and Maintenance occupations in Hometown are , and Installation, Maintenance & Repair (11 | 1.0%).
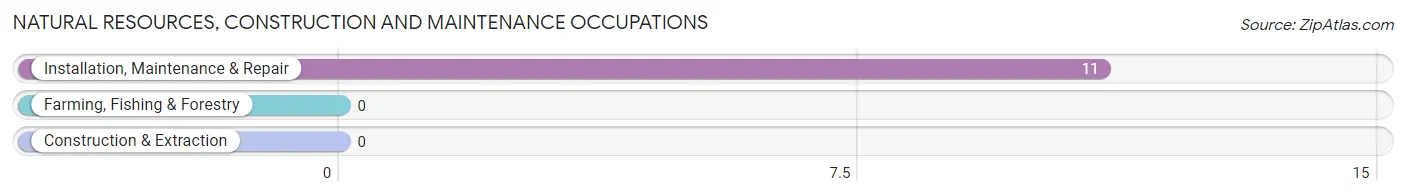
Natural Resources, Construction and Maintenance Occupations by Sex
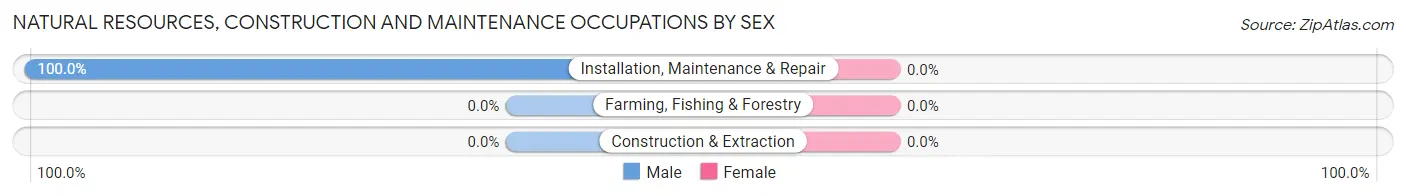
| Occupation | Male | Female |
| Farming, Fishing & Forestry | 0 (0.0%) | 0 (0.0%) |
| Construction & Extraction | 0 (0.0%) | 0 (0.0%) |
| Installation, Maintenance & Repair | 11 (100.0%) | 0 (0.0%) |
| Total (Category) | 11 (100.0%) | 0 (0.0%) |
| Total (Overall) | 509 (48.3%) | 545 (51.7%) |
Production, Transportation and Moving Occupations
The most common Production, Transportation and Moving occupations in Hometown are Transportation (177 | 16.8%), Production (50 | 4.7%), and Material Moving (22 | 2.1%).
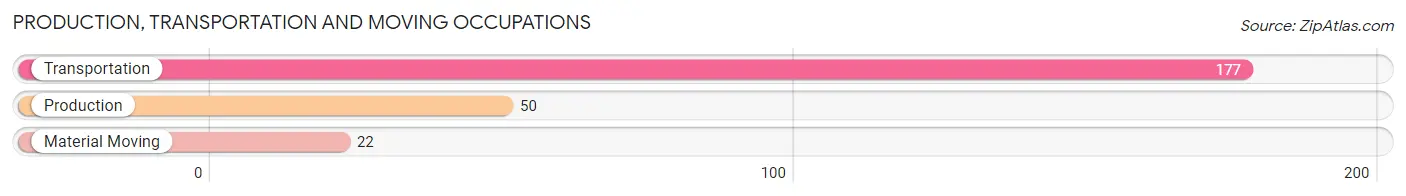
Production, Transportation and Moving Occupations by Sex
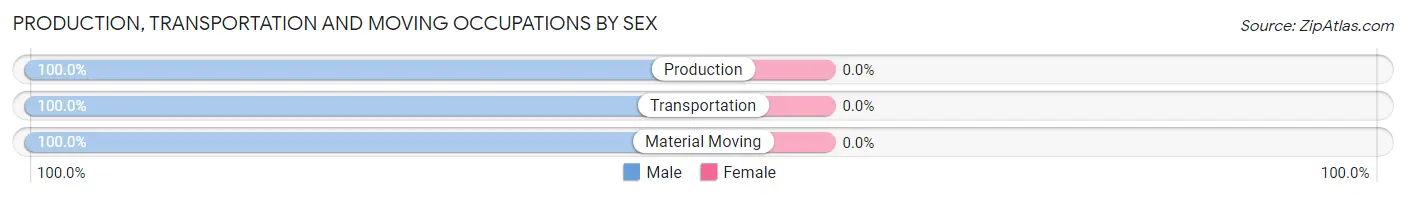
| Occupation | Male | Female |
| Production | 50 (100.0%) | 0 (0.0%) |
| Transportation | 177 (100.0%) | 0 (0.0%) |
| Material Moving | 22 (100.0%) | 0 (0.0%) |
| Total (Category) | 249 (100.0%) | 0 (0.0%) |
| Total (Overall) | 509 (48.3%) | 545 (51.7%) |
Employment Industries by Sex in Hometown
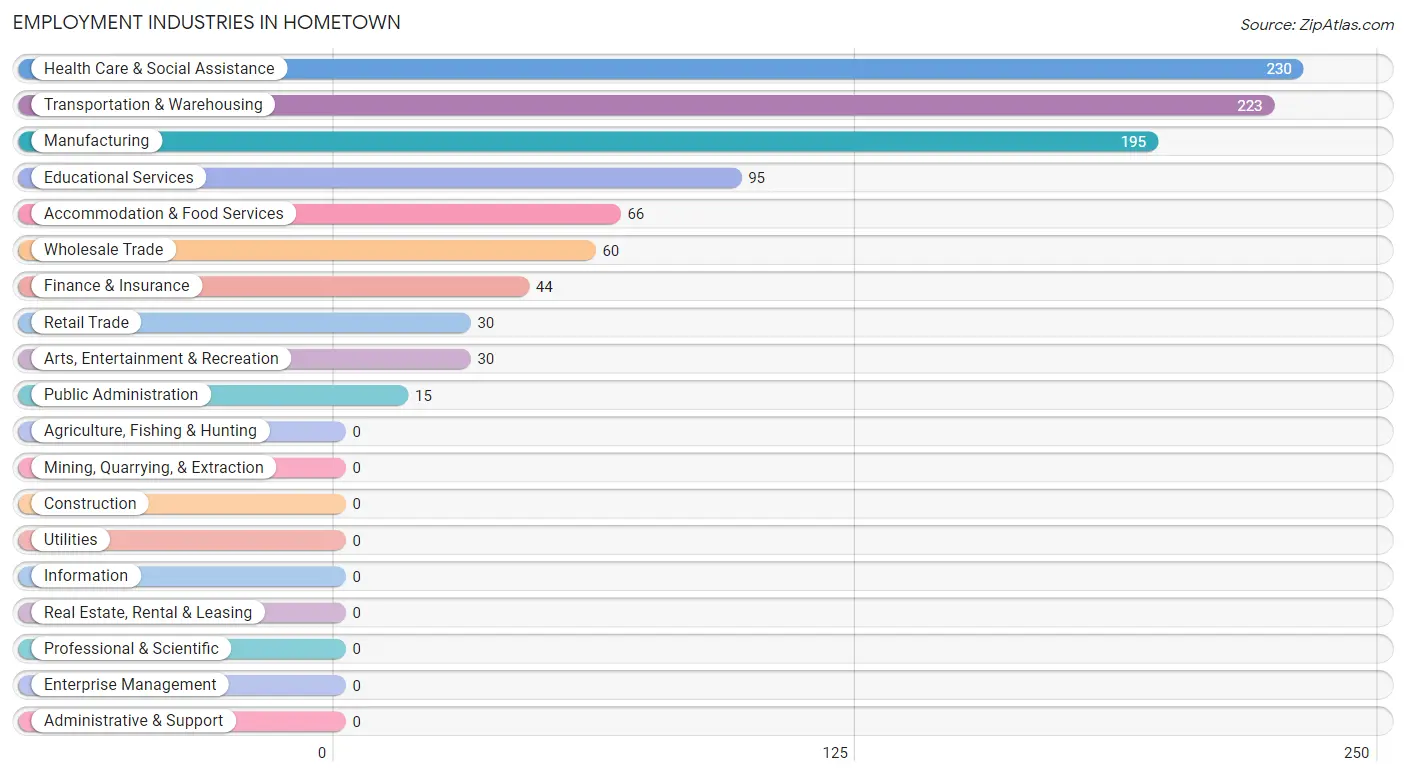
Employment Industries in Hometown
The major employment industries in Hometown include Health Care & Social Assistance (230 | 21.8%), Transportation & Warehousing (223 | 21.2%), Manufacturing (195 | 18.5%), Educational Services (95 | 9.0%), and Accommodation & Food Services (66 | 6.3%).
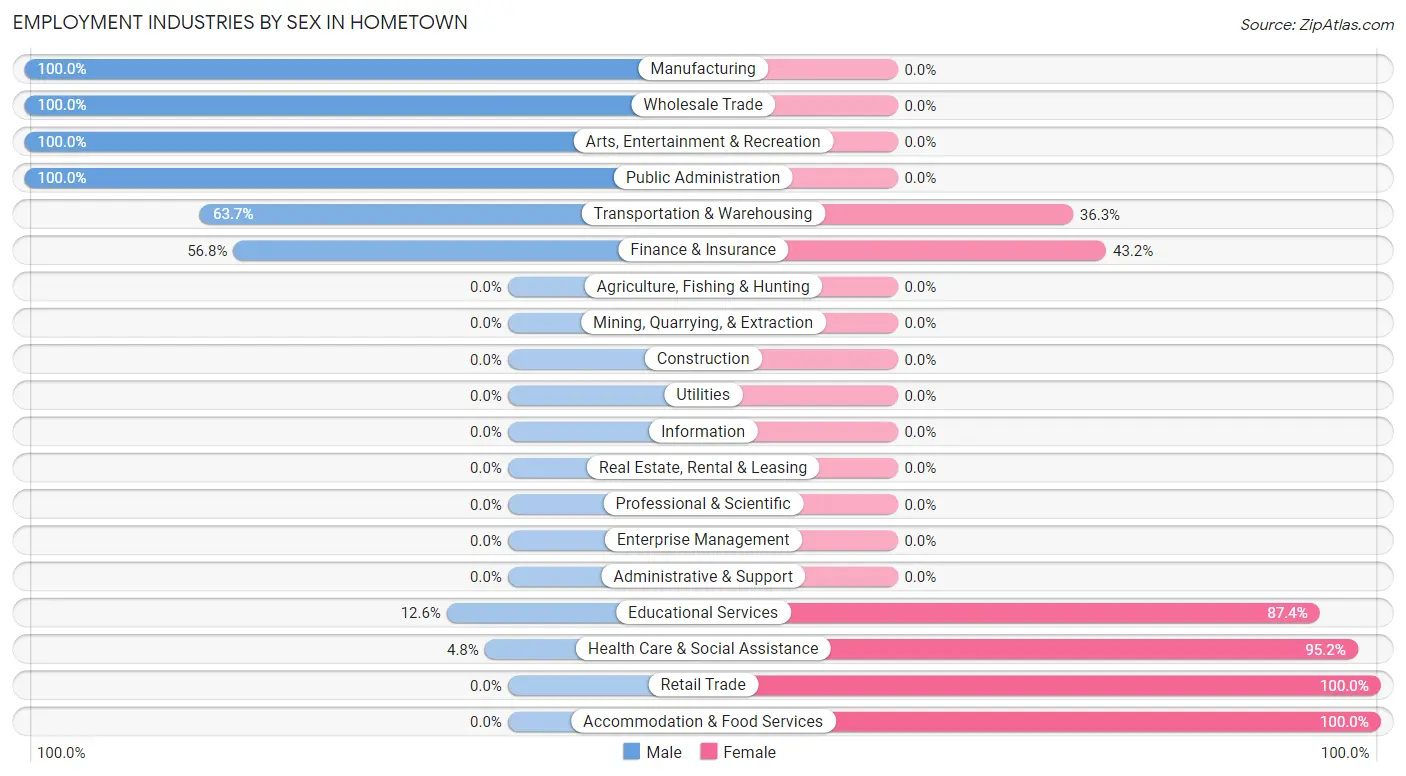
Employment Industries by Sex in Hometown
The Hometown industries that see more men than women are Manufacturing (100.0%), Wholesale Trade (100.0%), and Arts, Entertainment & Recreation (100.0%), whereas the industries that tend to have a higher number of women are Retail Trade (100.0%), Accommodation & Food Services (100.0%), and Health Care & Social Assistance (95.2%).
| Industry | Male | Female |
| Agriculture, Fishing & Hunting | 0 (0.0%) | 0 (0.0%) |
| Mining, Quarrying, & Extraction | 0 (0.0%) | 0 (0.0%) |
| Construction | 0 (0.0%) | 0 (0.0%) |
| Manufacturing | 195 (100.0%) | 0 (0.0%) |
| Wholesale Trade | 60 (100.0%) | 0 (0.0%) |
| Retail Trade | 0 (0.0%) | 30 (100.0%) |
| Transportation & Warehousing | 142 (63.7%) | 81 (36.3%) |
| Utilities | 0 (0.0%) | 0 (0.0%) |
| Information | 0 (0.0%) | 0 (0.0%) |
| Finance & Insurance | 25 (56.8%) | 19 (43.2%) |
| Real Estate, Rental & Leasing | 0 (0.0%) | 0 (0.0%) |
| Professional & Scientific | 0 (0.0%) | 0 (0.0%) |
| Enterprise Management | 0 (0.0%) | 0 (0.0%) |
| Administrative & Support | 0 (0.0%) | 0 (0.0%) |
| Educational Services | 12 (12.6%) | 83 (87.4%) |
| Health Care & Social Assistance | 11 (4.8%) | 219 (95.2%) |
| Arts, Entertainment & Recreation | 30 (100.0%) | 0 (0.0%) |
| Accommodation & Food Services | 0 (0.0%) | 66 (100.0%) |
| Public Administration | 15 (100.0%) | 0 (0.0%) |
| Total | 509 (48.3%) | 545 (51.7%) |
Education in Hometown
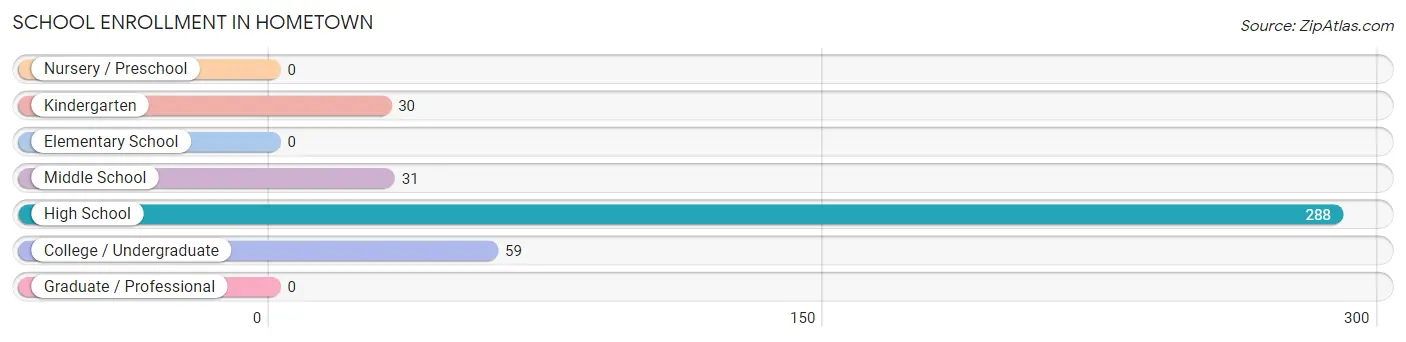
School Enrollment in Hometown
The most common levels of schooling among the 408 students in Hometown are high school (288 | 70.6%), college / undergraduate (59 | 14.5%), and middle school (31 | 7.6%).
| School Level | # Students | % Students |
| Nursery / Preschool | 0 | 0.0% |
| Kindergarten | 30 | 7.3% |
| Elementary School | 0 | 0.0% |
| Middle School | 31 | 7.6% |
| High School | 288 | 70.6% |
| College / Undergraduate | 59 | 14.5% |
| Graduate / Professional | 0 | 0.0% |
| Total | 408 | 100.0% |
School Enrollment by Age by Funding Source in Hometown
Out of a total of 408 students who are enrolled in schools in Hometown, 18 (4.4%) attend a private institution, while the remaining 390 (95.6%) are enrolled in public schools. The age group of 5 to 9 year old has the highest likelihood of being enrolled in private schools, with 18 (60.0% in the age bracket) enrolled. Conversely, the age group of 10 to 14 year olds has the lowest likelihood of being enrolled in a private school, with 95 (100.0% in the age bracket) attending a public institution.
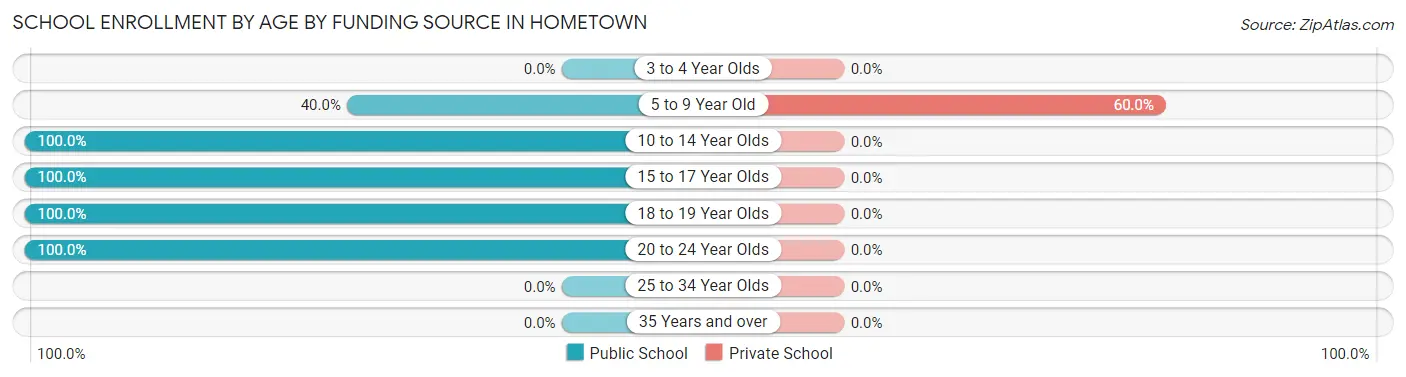
| Age Bracket | Public School | Private School |
| 3 to 4 Year Olds | 0 (0.0%) | 0 (0.0%) |
| 5 to 9 Year Old | 12 (40.0%) | 18 (60.0%) |
| 10 to 14 Year Olds | 95 (100.0%) | 0 (0.0%) |
| 15 to 17 Year Olds | 143 (100.0%) | 0 (0.0%) |
| 18 to 19 Year Olds | 81 (100.0%) | 0 (0.0%) |
| 20 to 24 Year Olds | 59 (100.0%) | 0 (0.0%) |
| 25 to 34 Year Olds | 0 (0.0%) | 0 (0.0%) |
| 35 Years and over | 0 (0.0%) | 0 (0.0%) |
| Total | 390 (95.6%) | 18 (4.4%) |
Educational Attainment by Field of Study in Hometown
Education (124 | 39.9%), engineering (45 | 14.5%), science & technology (43 | 13.8%), business (39 | 12.5%), and liberal arts & history (35 | 11.3%) are the most common fields of study among 311 individuals in Hometown who have obtained a bachelor's degree or higher.
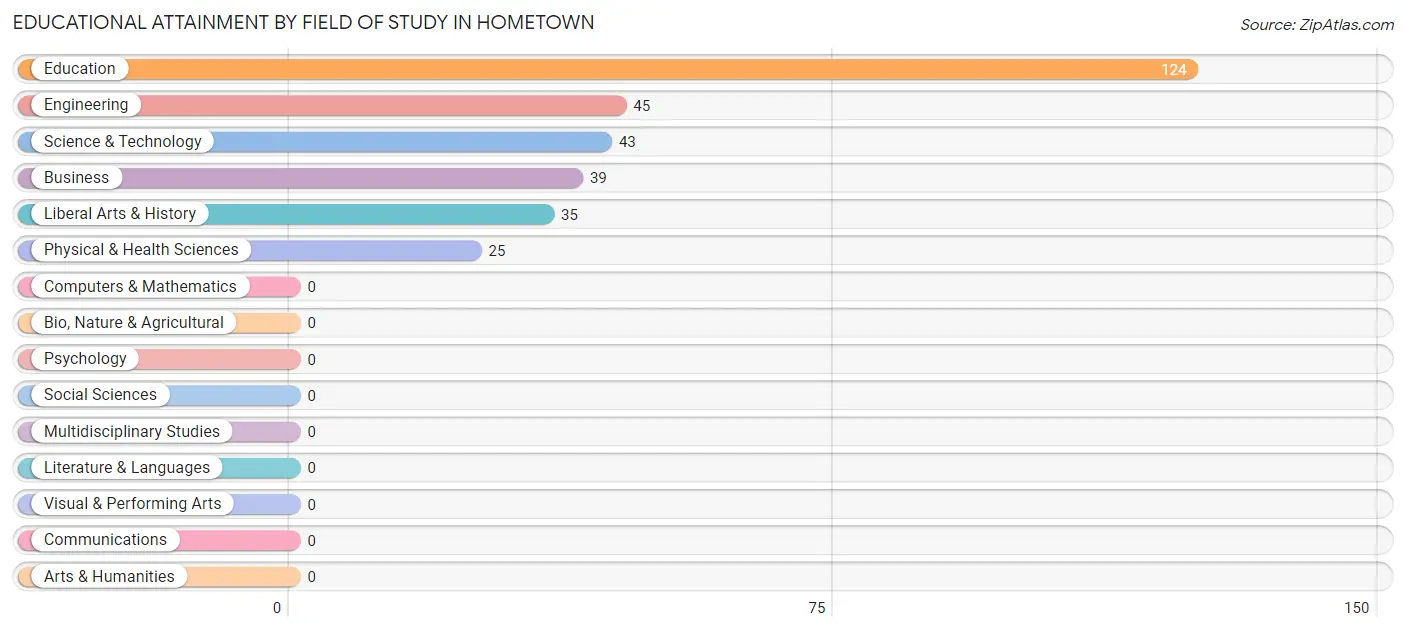
| Field of Study | # Graduates | % Graduates |
| Computers & Mathematics | 0 | 0.0% |
| Bio, Nature & Agricultural | 0 | 0.0% |
| Physical & Health Sciences | 25 | 8.0% |
| Psychology | 0 | 0.0% |
| Social Sciences | 0 | 0.0% |
| Engineering | 45 | 14.5% |
| Multidisciplinary Studies | 0 | 0.0% |
| Science & Technology | 43 | 13.8% |
| Business | 39 | 12.5% |
| Education | 124 | 39.9% |
| Literature & Languages | 0 | 0.0% |
| Liberal Arts & History | 35 | 11.3% |
| Visual & Performing Arts | 0 | 0.0% |
| Communications | 0 | 0.0% |
| Arts & Humanities | 0 | 0.0% |
| Total | 311 | 100.0% |
Transportation & Commute in Hometown
Vehicle Availability by Sex in Hometown
The most prevalent vehicle ownership categories in Hometown are males with 2 vehicles (221, accounting for 43.4%) and females with 2 vehicles (173, making up 47.6%).
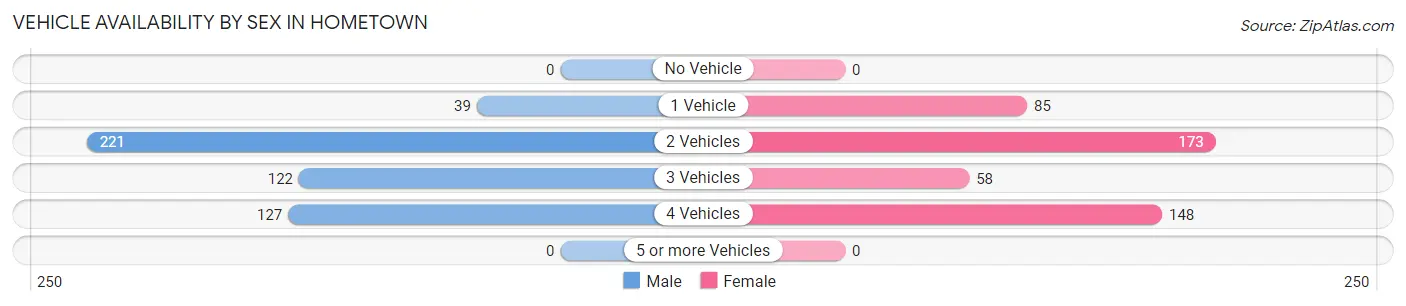
| Vehicles Available | Male | Female |
| No Vehicle | 0 (0.0%) | 0 (0.0%) |
| 1 Vehicle | 39 (7.7%) | 85 (18.3%) |
| 2 Vehicles | 221 (43.4%) | 173 (37.3%) |
| 3 Vehicles | 122 (24.0%) | 58 (12.5%) |
| 4 Vehicles | 127 (24.9%) | 148 (31.9%) |
| 5 or more Vehicles | 0 (0.0%) | 0 (0.0%) |
| Total | 509 (100.0%) | 464 (100.0%) |
Commute Time in Hometown
The most frequently occuring commute durations in Hometown are 45 to 59 minutes (245 commuters, 28.4%), 60 to 89 minutes (142 commuters, 16.4%), and 15 to 19 minutes (110 commuters, 12.7%).
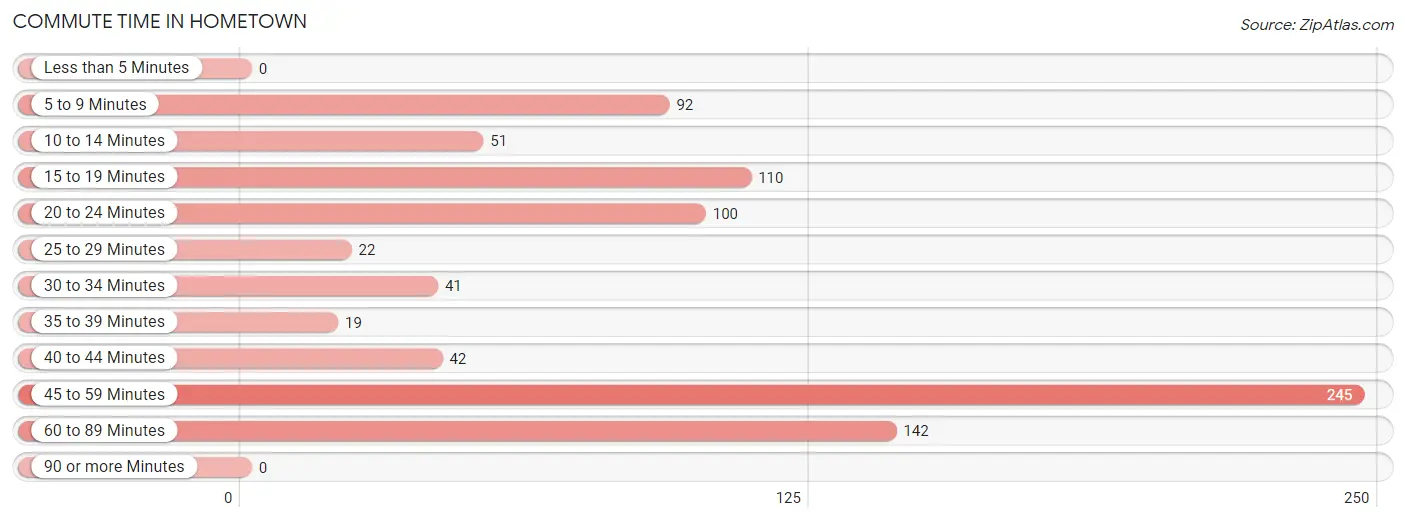
| Commute Time | # Commuters | % Commuters |
| Less than 5 Minutes | 0 | 0.0% |
| 5 to 9 Minutes | 92 | 10.6% |
| 10 to 14 Minutes | 51 | 5.9% |
| 15 to 19 Minutes | 110 | 12.7% |
| 20 to 24 Minutes | 100 | 11.6% |
| 25 to 29 Minutes | 22 | 2.5% |
| 30 to 34 Minutes | 41 | 4.8% |
| 35 to 39 Minutes | 19 | 2.2% |
| 40 to 44 Minutes | 42 | 4.9% |
| 45 to 59 Minutes | 245 | 28.4% |
| 60 to 89 Minutes | 142 | 16.4% |
| 90 or more Minutes | 0 | 0.0% |
Commute Time by Sex in Hometown
The most common commute times in Hometown are 45 to 59 minutes (128 commuters, 28.9%) for males and 45 to 59 minutes (117 commuters, 27.8%) for females.
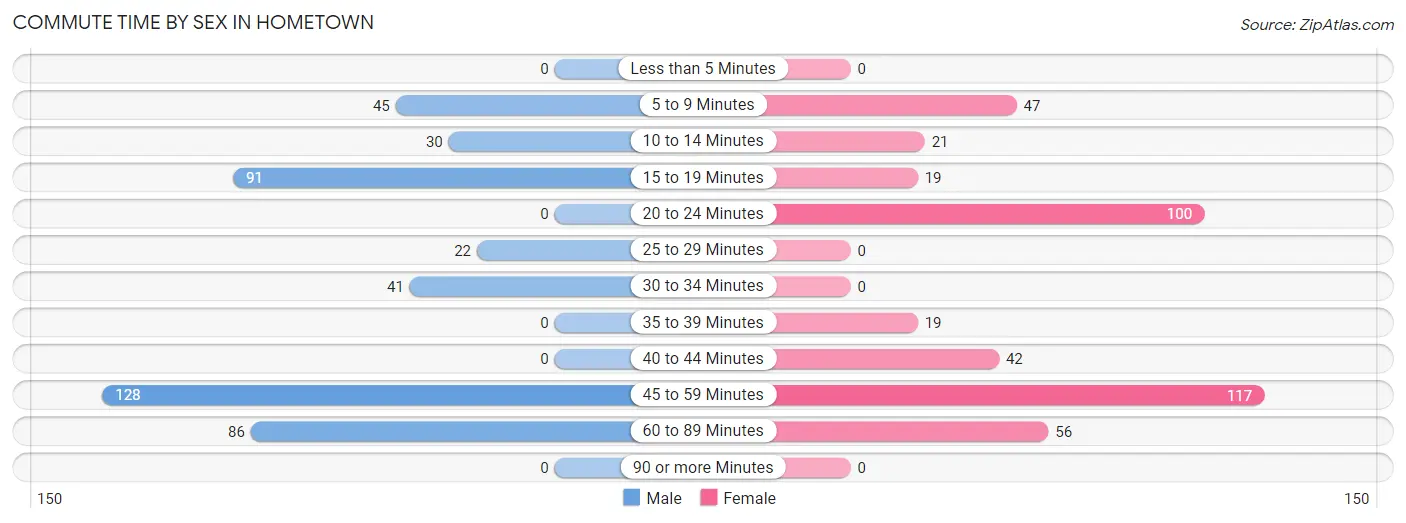
| Commute Time | Male | Female |
| Less than 5 Minutes | 0 (0.0%) | 0 (0.0%) |
| 5 to 9 Minutes | 45 (10.2%) | 47 (11.2%) |
| 10 to 14 Minutes | 30 (6.8%) | 21 (5.0%) |
| 15 to 19 Minutes | 91 (20.5%) | 19 (4.5%) |
| 20 to 24 Minutes | 0 (0.0%) | 100 (23.7%) |
| 25 to 29 Minutes | 22 (5.0%) | 0 (0.0%) |
| 30 to 34 Minutes | 41 (9.3%) | 0 (0.0%) |
| 35 to 39 Minutes | 0 (0.0%) | 19 (4.5%) |
| 40 to 44 Minutes | 0 (0.0%) | 42 (10.0%) |
| 45 to 59 Minutes | 128 (28.9%) | 117 (27.8%) |
| 60 to 89 Minutes | 86 (19.4%) | 56 (13.3%) |
| 90 or more Minutes | 0 (0.0%) | 0 (0.0%) |
Time of Departure to Work by Sex in Hometown
The most frequent times of departure to work in Hometown are 12:00 AM to 4:59 AM (163, 36.8%) for males and 5:30 AM to 5:59 AM (136, 32.3%) for females.
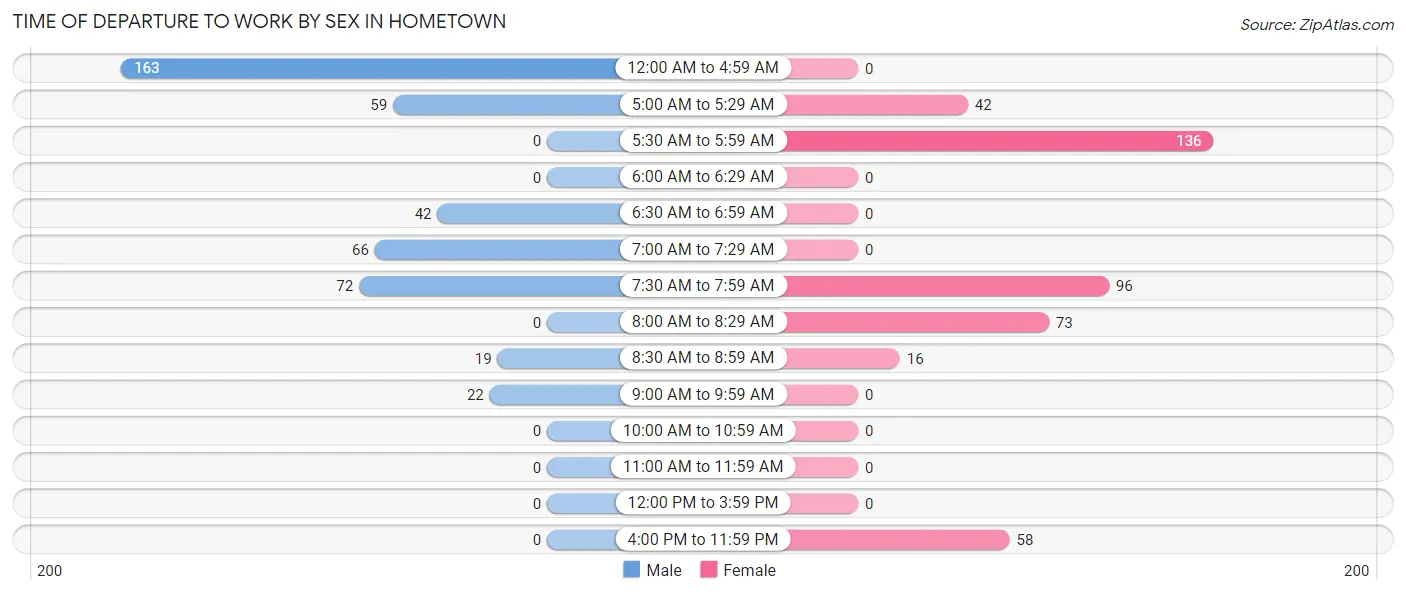
| Time of Departure | Male | Female |
| 12:00 AM to 4:59 AM | 163 (36.8%) | 0 (0.0%) |
| 5:00 AM to 5:29 AM | 59 (13.3%) | 42 (10.0%) |
| 5:30 AM to 5:59 AM | 0 (0.0%) | 136 (32.3%) |
| 6:00 AM to 6:29 AM | 0 (0.0%) | 0 (0.0%) |
| 6:30 AM to 6:59 AM | 42 (9.5%) | 0 (0.0%) |
| 7:00 AM to 7:29 AM | 66 (14.9%) | 0 (0.0%) |
| 7:30 AM to 7:59 AM | 72 (16.3%) | 96 (22.8%) |
| 8:00 AM to 8:29 AM | 0 (0.0%) | 73 (17.3%) |
| 8:30 AM to 8:59 AM | 19 (4.3%) | 16 (3.8%) |
| 9:00 AM to 9:59 AM | 22 (5.0%) | 0 (0.0%) |
| 10:00 AM to 10:59 AM | 0 (0.0%) | 0 (0.0%) |
| 11:00 AM to 11:59 AM | 0 (0.0%) | 0 (0.0%) |
| 12:00 PM to 3:59 PM | 0 (0.0%) | 0 (0.0%) |
| 4:00 PM to 11:59 PM | 0 (0.0%) | 58 (13.8%) |
| Total | 443 (100.0%) | 421 (100.0%) |
Housing Occupancy in Hometown
Occupancy by Ownership in Hometown
Of the total 699 dwellings in Hometown, owner-occupied units account for 651 (93.1%), while renter-occupied units make up 48 (6.9%).
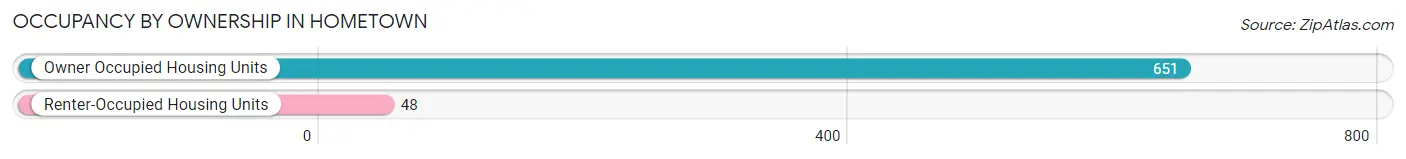
| Occupancy | # Housing Units | % Housing Units |
| Owner Occupied Housing Units | 651 | 93.1% |
| Renter-Occupied Housing Units | 48 | 6.9% |
| Total Occupied Housing Units | 699 | 100.0% |
Occupancy by Household Size in Hometown
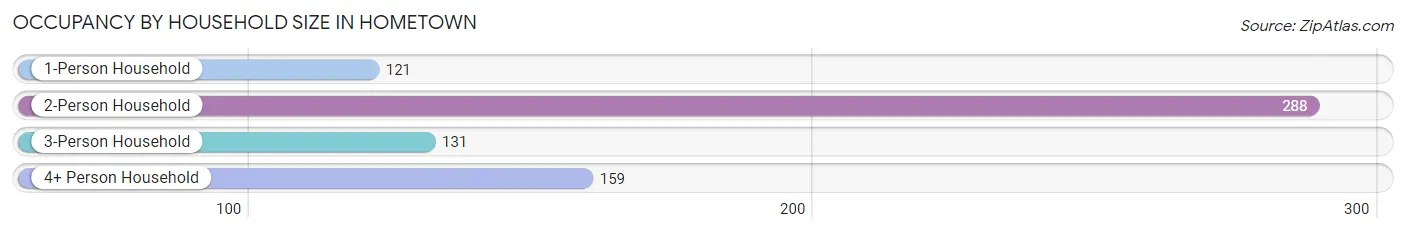
| Household Size | # Housing Units | % Housing Units |
| 1-Person Household | 121 | 17.3% |
| 2-Person Household | 288 | 41.2% |
| 3-Person Household | 131 | 18.7% |
| 4+ Person Household | 159 | 22.8% |
| Total Housing Units | 699 | 100.0% |
Occupancy by Ownership by Household Size in Hometown
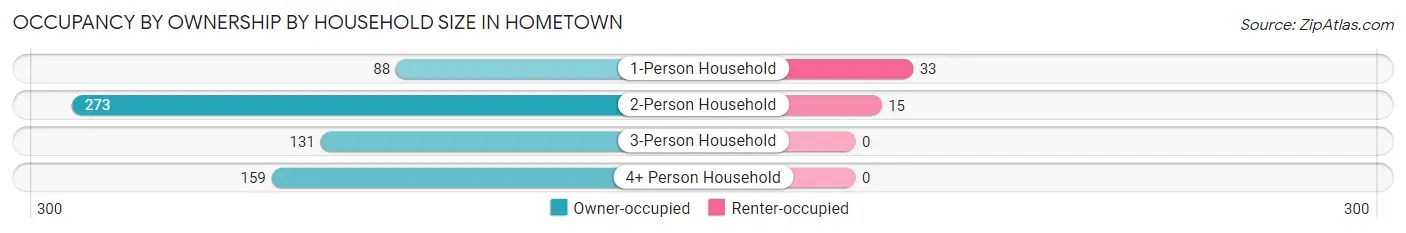
| Household Size | Owner-occupied | Renter-occupied |
| 1-Person Household | 88 (72.7%) | 33 (27.3%) |
| 2-Person Household | 273 (94.8%) | 15 (5.2%) |
| 3-Person Household | 131 (100.0%) | 0 (0.0%) |
| 4+ Person Household | 159 (100.0%) | 0 (0.0%) |
| Total Housing Units | 651 (93.1%) | 48 (6.9%) |
Occupancy by Educational Attainment in Hometown
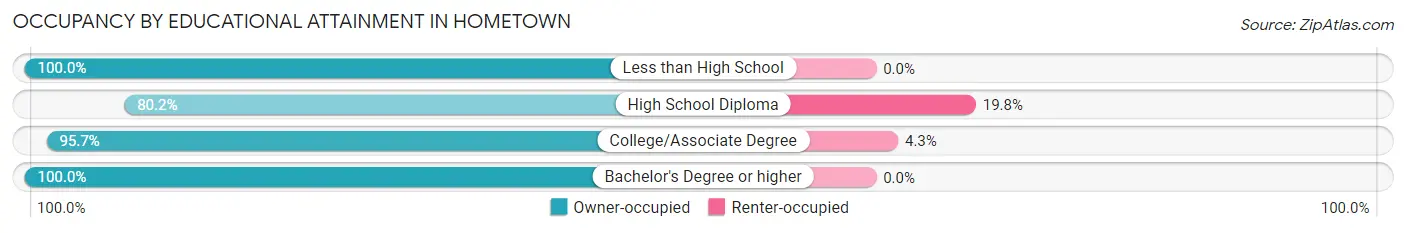
| Household Size | Owner-occupied | Renter-occupied |
| Less than High School | 17 (100.0%) | 0 (0.0%) |
| High School Diploma | 134 (80.2%) | 33 (19.8%) |
| College/Associate Degree | 331 (95.7%) | 15 (4.3%) |
| Bachelor's Degree or higher | 169 (100.0%) | 0 (0.0%) |
Occupancy by Age of Householder in Hometown
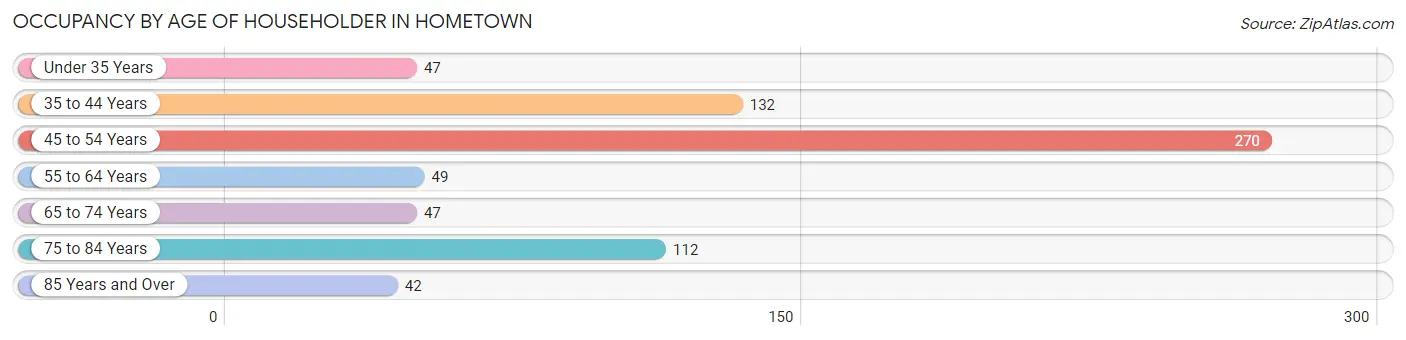
| Age Bracket | # Households | % Households |
| Under 35 Years | 47 | 6.7% |
| 35 to 44 Years | 132 | 18.9% |
| 45 to 54 Years | 270 | 38.6% |
| 55 to 64 Years | 49 | 7.0% |
| 65 to 74 Years | 47 | 6.7% |
| 75 to 84 Years | 112 | 16.0% |
| 85 Years and Over | 42 | 6.0% |
| Total | 699 | 100.0% |
Housing Finances in Hometown
Median Income by Occupancy in Hometown
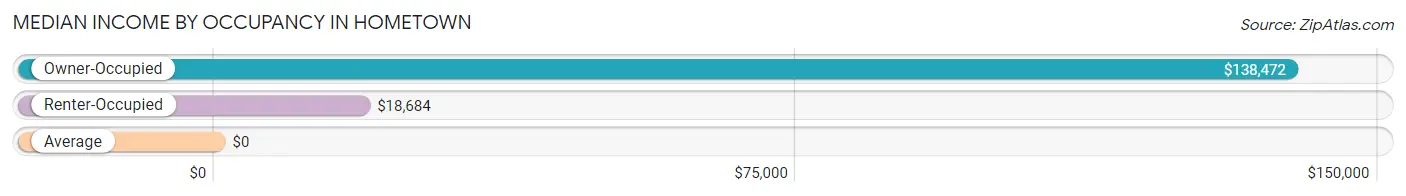
| Occupancy Type | # Households | Median Income |
| Owner-Occupied | 651 (93.1%) | $138,472 |
| Renter-Occupied | 48 (6.9%) | $18,684 |
| Average | 699 (100.0%) | $0 |
Occupancy by Householder Income Bracket in Hometown
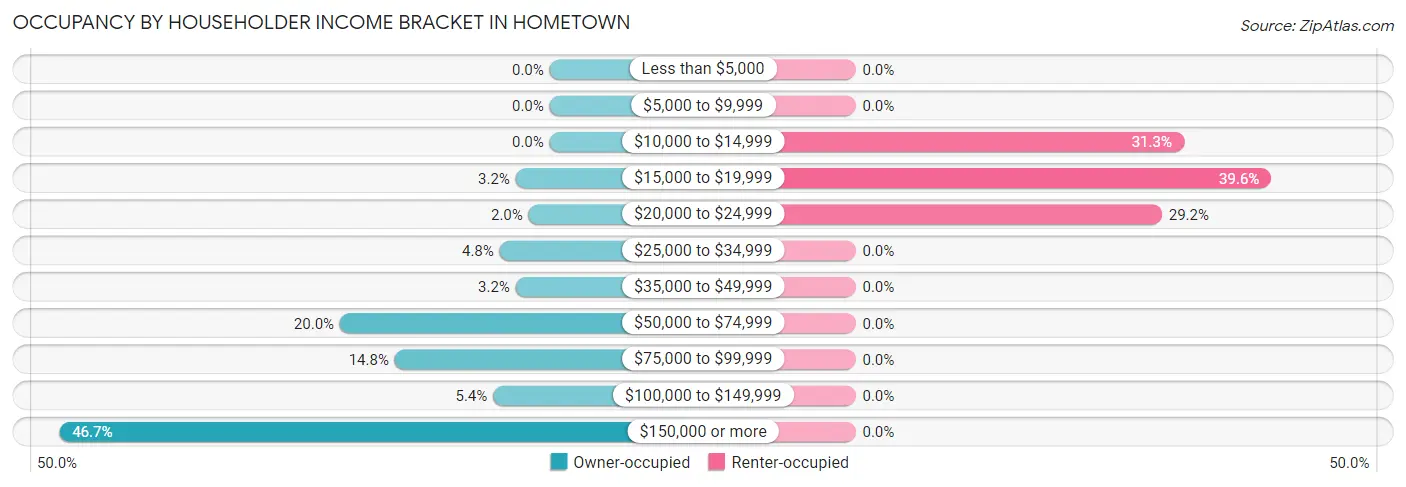
| Income Bracket | Owner-occupied | Renter-occupied |
| Less than $5,000 | 0 (0.0%) | 0 (0.0%) |
| $5,000 to $9,999 | 0 (0.0%) | 0 (0.0%) |
| $10,000 to $14,999 | 0 (0.0%) | 15 (31.2%) |
| $15,000 to $19,999 | 21 (3.2%) | 19 (39.6%) |
| $20,000 to $24,999 | 13 (2.0%) | 14 (29.2%) |
| $25,000 to $34,999 | 31 (4.8%) | 0 (0.0%) |
| $35,000 to $49,999 | 21 (3.2%) | 0 (0.0%) |
| $50,000 to $74,999 | 130 (20.0%) | 0 (0.0%) |
| $75,000 to $99,999 | 96 (14.7%) | 0 (0.0%) |
| $100,000 to $149,999 | 35 (5.4%) | 0 (0.0%) |
| $150,000 or more | 304 (46.7%) | 0 (0.0%) |
| Total | 651 (100.0%) | 48 (100.0%) |
Monthly Housing Cost Tiers in Hometown
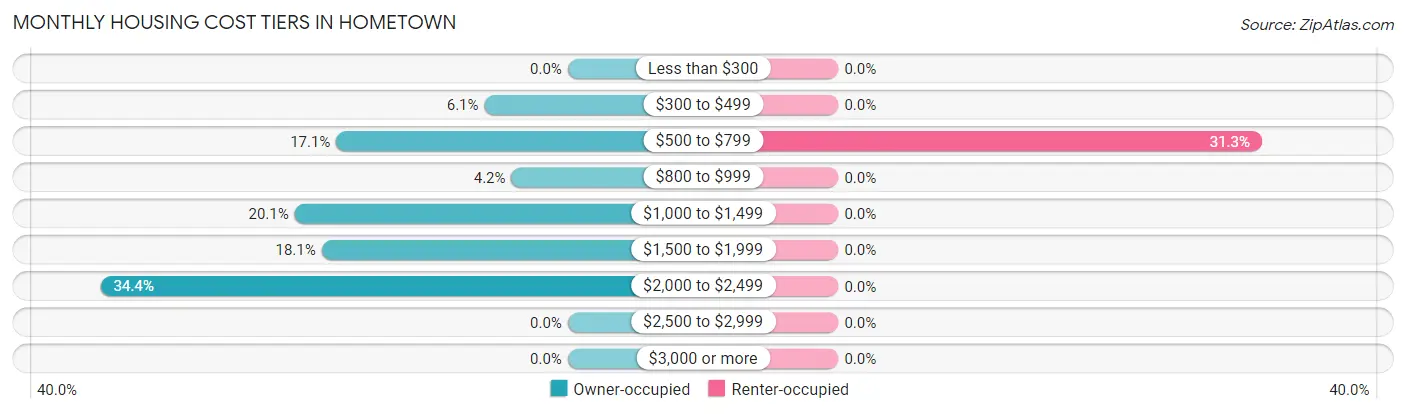
| Monthly Cost | Owner-occupied | Renter-occupied |
| Less than $300 | 0 (0.0%) | 0 (0.0%) |
| $300 to $499 | 40 (6.1%) | 0 (0.0%) |
| $500 to $799 | 111 (17.1%) | 15 (31.2%) |
| $800 to $999 | 27 (4.2%) | 0 (0.0%) |
| $1,000 to $1,499 | 131 (20.1%) | 0 (0.0%) |
| $1,500 to $1,999 | 118 (18.1%) | 0 (0.0%) |
| $2,000 to $2,499 | 224 (34.4%) | 0 (0.0%) |
| $2,500 to $2,999 | 0 (0.0%) | 0 (0.0%) |
| $3,000 or more | 0 (0.0%) | 0 (0.0%) |
| Total | 651 (100.0%) | 48 (100.0%) |
Physical Housing Characteristics in Hometown
Housing Structures in Hometown
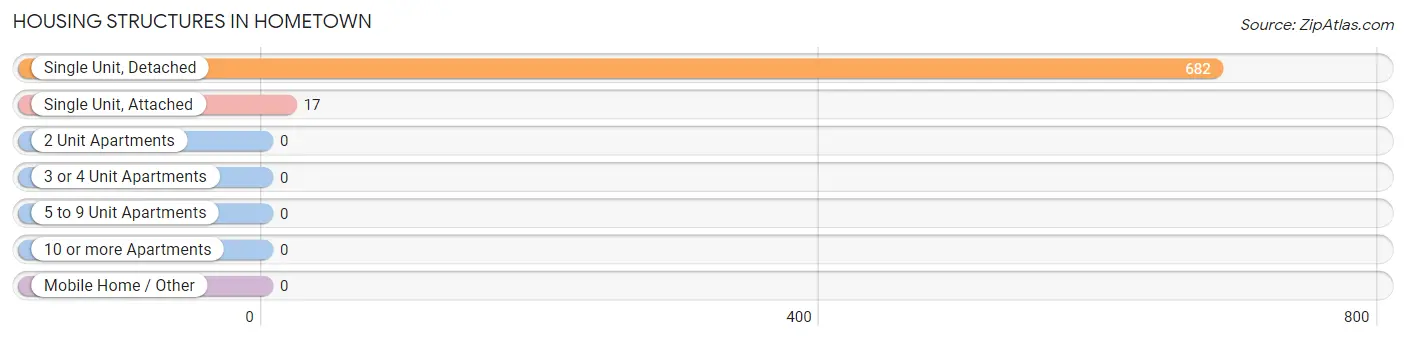
| Structure Type | # Housing Units | % Housing Units |
| Single Unit, Detached | 682 | 97.6% |
| Single Unit, Attached | 17 | 2.4% |
| 2 Unit Apartments | 0 | 0.0% |
| 3 or 4 Unit Apartments | 0 | 0.0% |
| 5 to 9 Unit Apartments | 0 | 0.0% |
| 10 or more Apartments | 0 | 0.0% |
| Mobile Home / Other | 0 | 0.0% |
| Total | 699 | 100.0% |
Housing Structures by Occupancy in Hometown
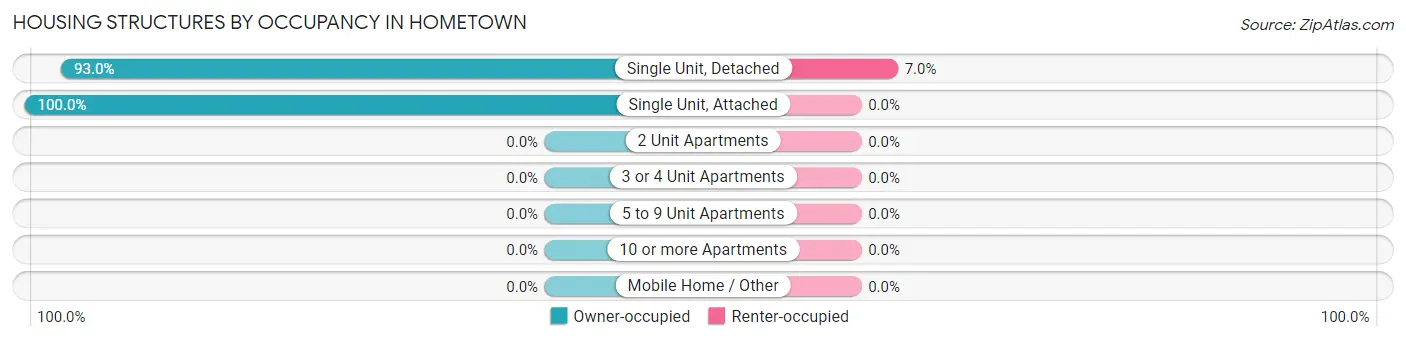
| Structure Type | Owner-occupied | Renter-occupied |
| Single Unit, Detached | 634 (93.0%) | 48 (7.0%) |
| Single Unit, Attached | 17 (100.0%) | 0 (0.0%) |
| 2 Unit Apartments | 0 (0.0%) | 0 (0.0%) |
| 3 or 4 Unit Apartments | 0 (0.0%) | 0 (0.0%) |
| 5 to 9 Unit Apartments | 0 (0.0%) | 0 (0.0%) |
| 10 or more Apartments | 0 (0.0%) | 0 (0.0%) |
| Mobile Home / Other | 0 (0.0%) | 0 (0.0%) |
| Total | 651 (93.1%) | 48 (6.9%) |
Housing Structures by Number of Rooms in Hometown
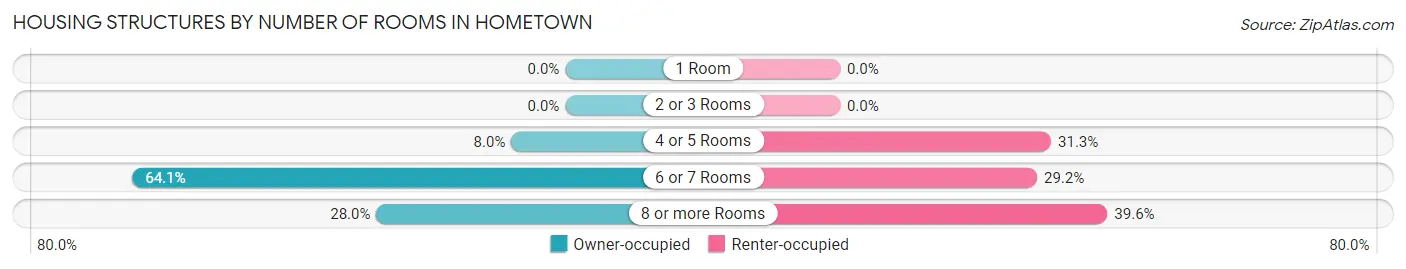
| Number of Rooms | Owner-occupied | Renter-occupied |
| 1 Room | 0 (0.0%) | 0 (0.0%) |
| 2 or 3 Rooms | 0 (0.0%) | 0 (0.0%) |
| 4 or 5 Rooms | 52 (8.0%) | 15 (31.2%) |
| 6 or 7 Rooms | 417 (64.1%) | 14 (29.2%) |
| 8 or more Rooms | 182 (28.0%) | 19 (39.6%) |
| Total | 651 (100.0%) | 48 (100.0%) |
Housing Structure by Heating Type in Hometown
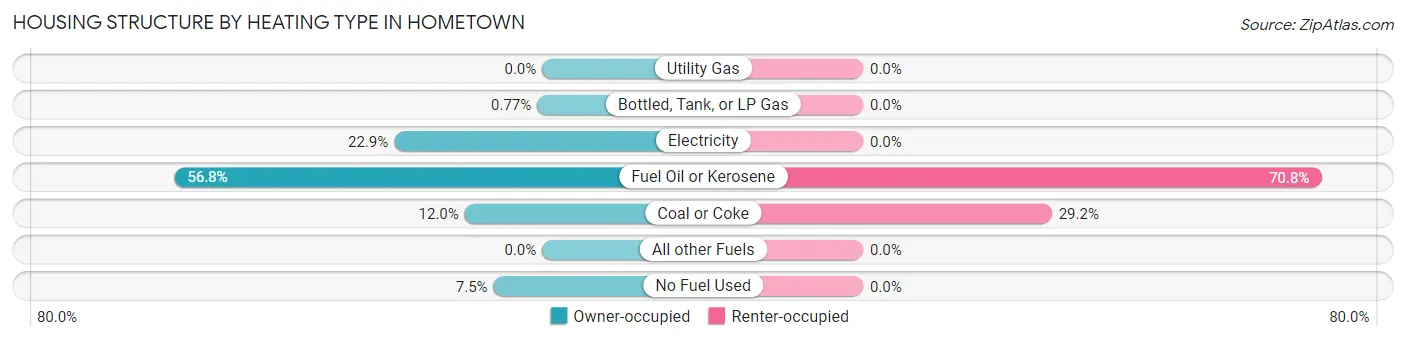
| Heating Type | Owner-occupied | Renter-occupied |
| Utility Gas | 0 (0.0%) | 0 (0.0%) |
| Bottled, Tank, or LP Gas | 5 (0.8%) | 0 (0.0%) |
| Electricity | 149 (22.9%) | 0 (0.0%) |
| Fuel Oil or Kerosene | 370 (56.8%) | 34 (70.8%) |
| Coal or Coke | 78 (12.0%) | 14 (29.2%) |
| All other Fuels | 0 (0.0%) | 0 (0.0%) |
| No Fuel Used | 49 (7.5%) | 0 (0.0%) |
| Total | 651 (100.0%) | 48 (100.0%) |
Household Vehicle Usage in Hometown
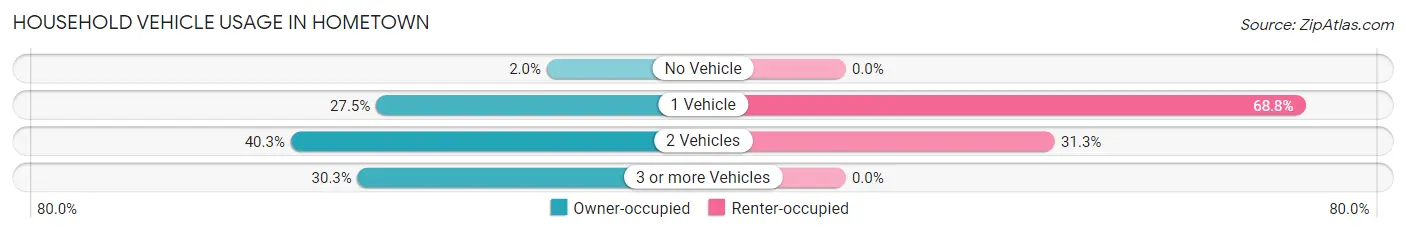
| Vehicles per Household | Owner-occupied | Renter-occupied |
| No Vehicle | 13 (2.0%) | 0 (0.0%) |
| 1 Vehicle | 179 (27.5%) | 33 (68.8%) |
| 2 Vehicles | 262 (40.3%) | 15 (31.2%) |
| 3 or more Vehicles | 197 (30.3%) | 0 (0.0%) |
| Total | 651 (100.0%) | 48 (100.0%) |
Real Estate & Mortgages in Hometown
Real Estate and Mortgage Overview in Hometown
| Characteristic | Without Mortgage | With Mortgage |
| Housing Units | 180 | 471 |
| Median Property Value | $166,700 | $220,600 |
| Median Household Income | $70,909 | $279 |
| Monthly Housing Costs | $653 | $0 |
| Real Estate Taxes | $3,381 | $0 |
Property Value by Mortgage Status in Hometown
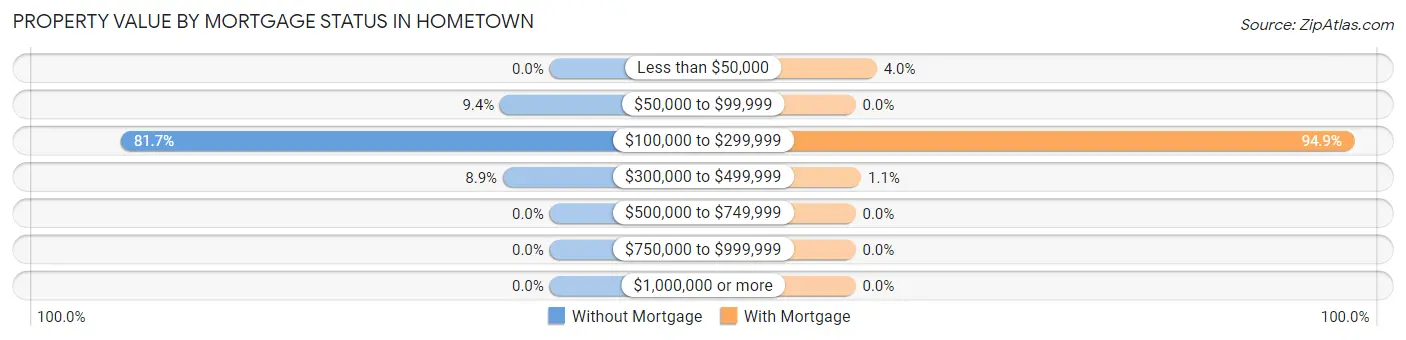
| Property Value | Without Mortgage | With Mortgage |
| Less than $50,000 | 0 (0.0%) | 19 (4.0%) |
| $50,000 to $99,999 | 17 (9.4%) | 0 (0.0%) |
| $100,000 to $299,999 | 147 (81.7%) | 447 (94.9%) |
| $300,000 to $499,999 | 16 (8.9%) | 5 (1.1%) |
| $500,000 to $749,999 | 0 (0.0%) | 0 (0.0%) |
| $750,000 to $999,999 | 0 (0.0%) | 0 (0.0%) |
| $1,000,000 or more | 0 (0.0%) | 0 (0.0%) |
| Total | 180 (100.0%) | 471 (100.0%) |
Household Income by Mortgage Status in Hometown
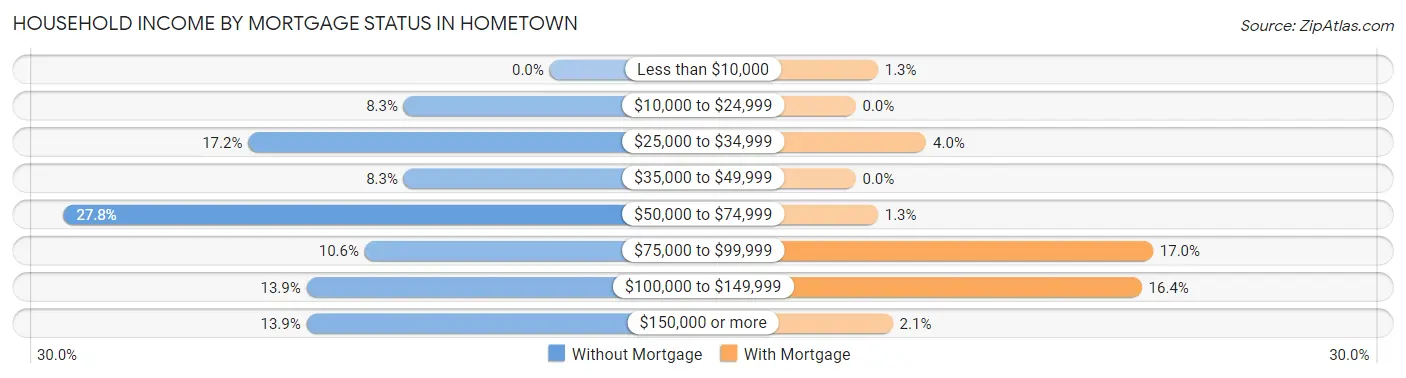
| Household Income | Without Mortgage | With Mortgage |
| Less than $10,000 | 0 (0.0%) | 6 (1.3%) |
| $10,000 to $24,999 | 15 (8.3%) | 0 (0.0%) |
| $25,000 to $34,999 | 31 (17.2%) | 19 (4.0%) |
| $35,000 to $49,999 | 15 (8.3%) | 0 (0.0%) |
| $50,000 to $74,999 | 50 (27.8%) | 6 (1.3%) |
| $75,000 to $99,999 | 19 (10.6%) | 80 (17.0%) |
| $100,000 to $149,999 | 25 (13.9%) | 77 (16.4%) |
| $150,000 or more | 25 (13.9%) | 10 (2.1%) |
| Total | 180 (100.0%) | 471 (100.0%) |
Property Value to Household Income Ratio in Hometown
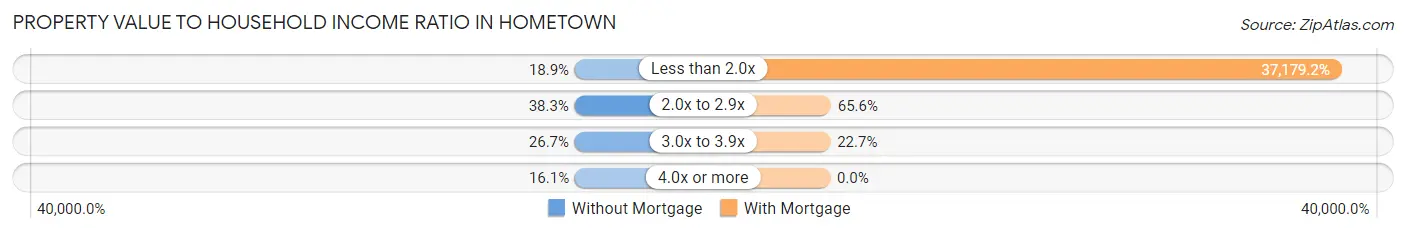
| Value-to-Income Ratio | Without Mortgage | With Mortgage |
| Less than 2.0x | 34 (18.9%) | 175,114 (37,179.2%) |
| 2.0x to 2.9x | 69 (38.3%) | 309 (65.6%) |
| 3.0x to 3.9x | 48 (26.7%) | 107 (22.7%) |
| 4.0x or more | 29 (16.1%) | 0 (0.0%) |
| Total | 180 (100.0%) | 471 (100.0%) |
Real Estate Taxes by Mortgage Status in Hometown
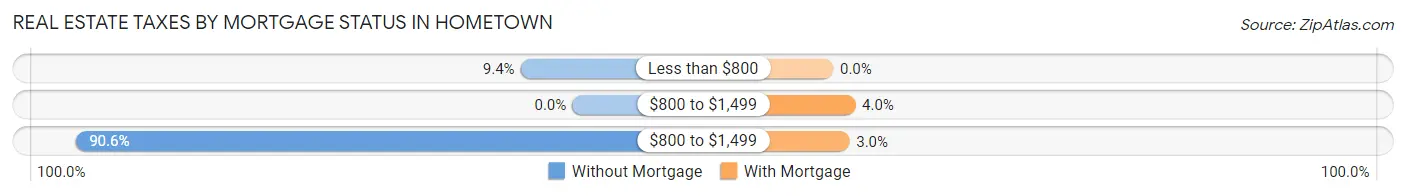
| Property Taxes | Without Mortgage | With Mortgage |
| Less than $800 | 17 (9.4%) | 0 (0.0%) |
| $800 to $1,499 | 0 (0.0%) | 19 (4.0%) |
| $800 to $1,499 | 163 (90.6%) | 14 (3.0%) |
| Total | 180 (100.0%) | 471 (100.0%) |
Health & Disability in Hometown
Health Insurance Coverage by Age in Hometown
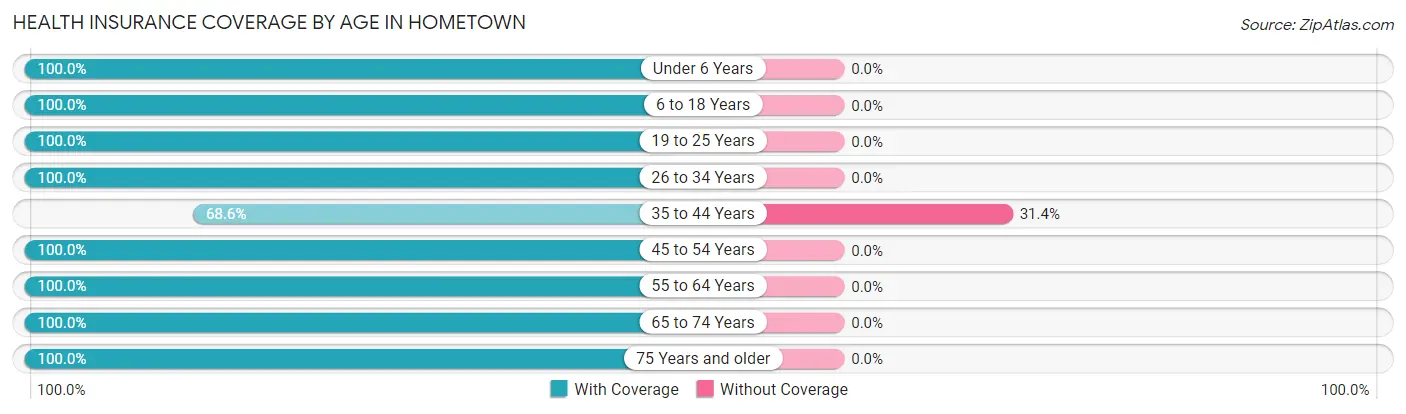
| Age Bracket | With Coverage | Without Coverage |
| Under 6 Years | 20 (100.0%) | 0 (0.0%) |
| 6 to 18 Years | 349 (100.0%) | 0 (0.0%) |
| 19 to 25 Years | 119 (100.0%) | 0 (0.0%) |
| 26 to 34 Years | 113 (100.0%) | 0 (0.0%) |
| 35 to 44 Years | 107 (68.6%) | 49 (31.4%) |
| 45 to 54 Years | 516 (100.0%) | 0 (0.0%) |
| 55 to 64 Years | 112 (100.0%) | 0 (0.0%) |
| 65 to 74 Years | 93 (100.0%) | 0 (0.0%) |
| 75 Years and older | 182 (100.0%) | 0 (0.0%) |
| Total | 1,611 (97.1%) | 49 (2.9%) |
Health Insurance Coverage by Citizenship Status in Hometown
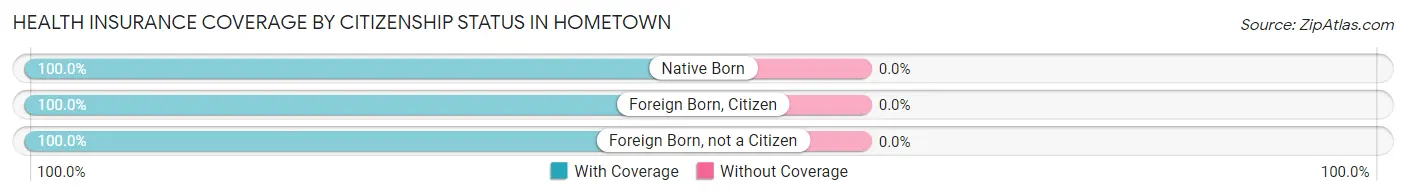
| Citizenship Status | With Coverage | Without Coverage |
| Native Born | 20 (100.0%) | 0 (0.0%) |
| Foreign Born, Citizen | 349 (100.0%) | 0 (0.0%) |
| Foreign Born, not a Citizen | 119 (100.0%) | 0 (0.0%) |
Health Insurance Coverage by Household Income in Hometown
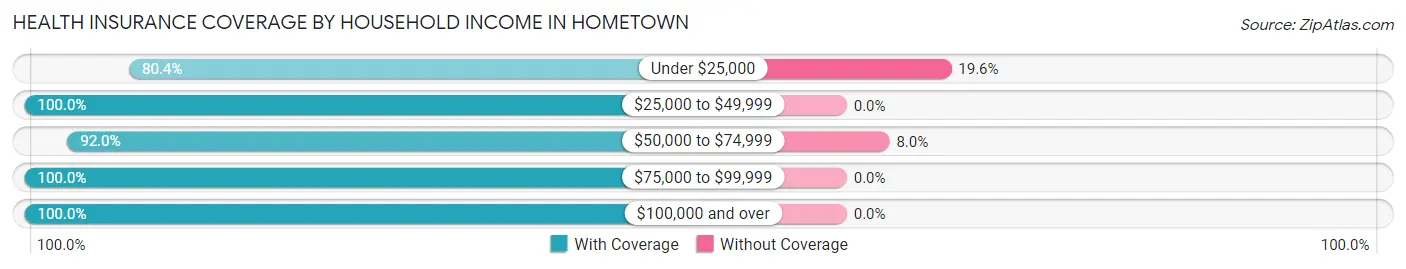
| Household Income | With Coverage | Without Coverage |
| Under $25,000 | 78 (80.4%) | 19 (19.6%) |
| $25,000 to $49,999 | 83 (100.0%) | 0 (0.0%) |
| $50,000 to $74,999 | 345 (92.0%) | 30 (8.0%) |
| $75,000 to $99,999 | 201 (100.0%) | 0 (0.0%) |
| $100,000 and over | 904 (100.0%) | 0 (0.0%) |
Public vs Private Health Insurance Coverage by Age in Hometown
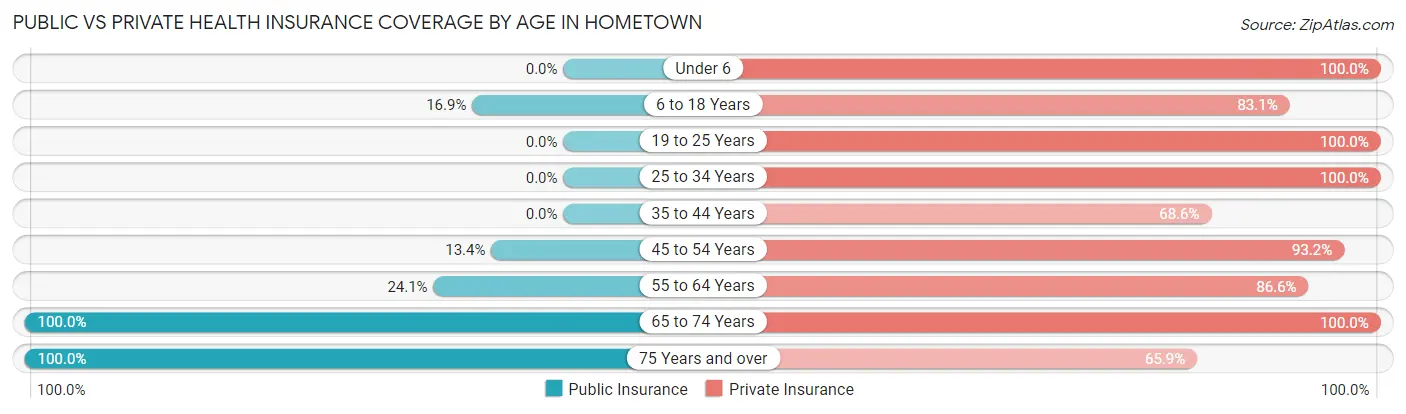
| Age Bracket | Public Insurance | Private Insurance |
| Under 6 | 0 (0.0%) | 20 (100.0%) |
| 6 to 18 Years | 59 (16.9%) | 290 (83.1%) |
| 19 to 25 Years | 0 (0.0%) | 119 (100.0%) |
| 25 to 34 Years | 0 (0.0%) | 113 (100.0%) |
| 35 to 44 Years | 0 (0.0%) | 107 (68.6%) |
| 45 to 54 Years | 69 (13.4%) | 481 (93.2%) |
| 55 to 64 Years | 27 (24.1%) | 97 (86.6%) |
| 65 to 74 Years | 93 (100.0%) | 93 (100.0%) |
| 75 Years and over | 182 (100.0%) | 120 (65.9%) |
| Total | 430 (25.9%) | 1,440 (86.8%) |
Disability Status by Sex by Age in Hometown
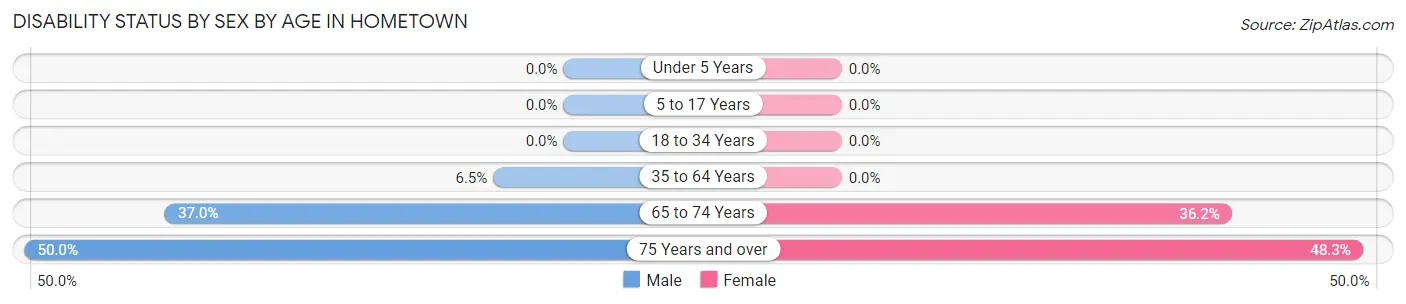
| Age Bracket | Male | Female |
| Under 5 Years | 0 (0.0%) | 0 (0.0%) |
| 5 to 17 Years | 0 (0.0%) | 0 (0.0%) |
| 18 to 34 Years | 0 (0.0%) | 0 (0.0%) |
| 35 to 64 Years | 27 (6.5%) | 0 (0.0%) |
| 65 to 74 Years | 17 (37.0%) | 17 (36.2%) |
| 75 Years and over | 31 (50.0%) | 58 (48.3%) |
Disability Class by Sex by Age in Hometown
Disability Class: Hearing Difficulty
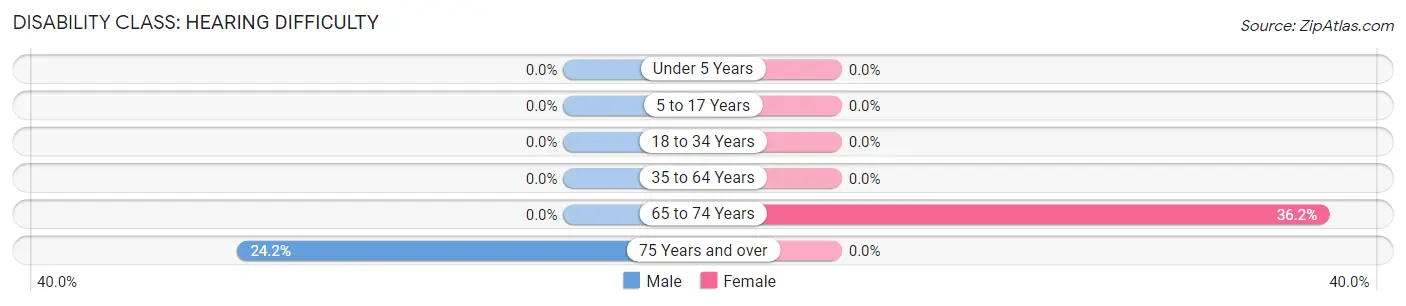
| Age Bracket | Male | Female |
| Under 5 Years | 0 (0.0%) | 0 (0.0%) |
| 5 to 17 Years | 0 (0.0%) | 0 (0.0%) |
| 18 to 34 Years | 0 (0.0%) | 0 (0.0%) |
| 35 to 64 Years | 0 (0.0%) | 0 (0.0%) |
| 65 to 74 Years | 0 (0.0%) | 17 (36.2%) |
| 75 Years and over | 15 (24.2%) | 0 (0.0%) |
Disability Class: Vision Difficulty
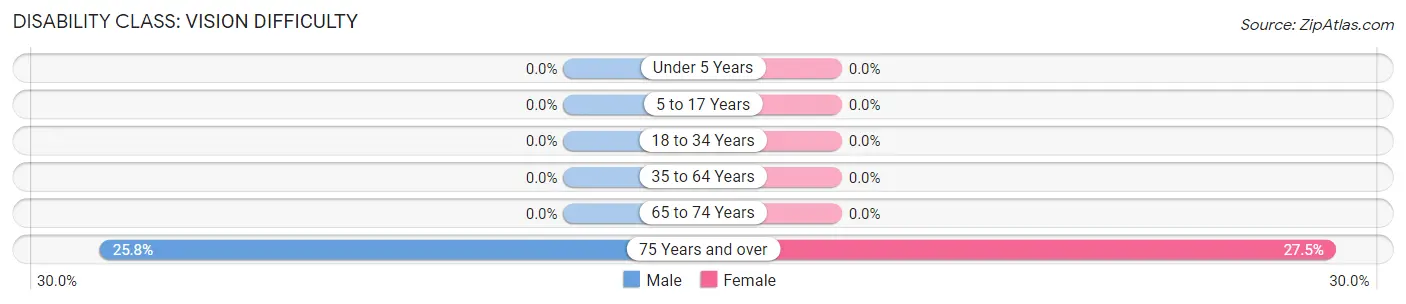
| Age Bracket | Male | Female |
| Under 5 Years | 0 (0.0%) | 0 (0.0%) |
| 5 to 17 Years | 0 (0.0%) | 0 (0.0%) |
| 18 to 34 Years | 0 (0.0%) | 0 (0.0%) |
| 35 to 64 Years | 0 (0.0%) | 0 (0.0%) |
| 65 to 74 Years | 0 (0.0%) | 0 (0.0%) |
| 75 Years and over | 16 (25.8%) | 33 (27.5%) |
Disability Class: Cognitive Difficulty
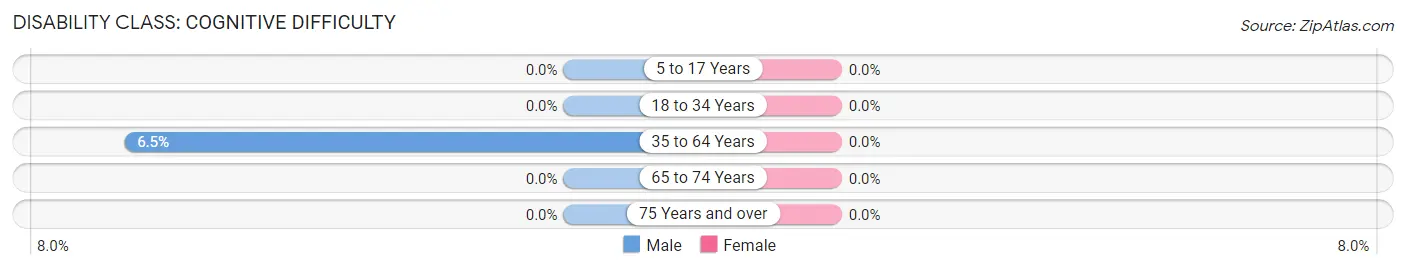
| Age Bracket | Male | Female |
| 5 to 17 Years | 0 (0.0%) | 0 (0.0%) |
| 18 to 34 Years | 0 (0.0%) | 0 (0.0%) |
| 35 to 64 Years | 27 (6.5%) | 0 (0.0%) |
| 65 to 74 Years | 0 (0.0%) | 0 (0.0%) |
| 75 Years and over | 0 (0.0%) | 0 (0.0%) |
Disability Class: Ambulatory Difficulty
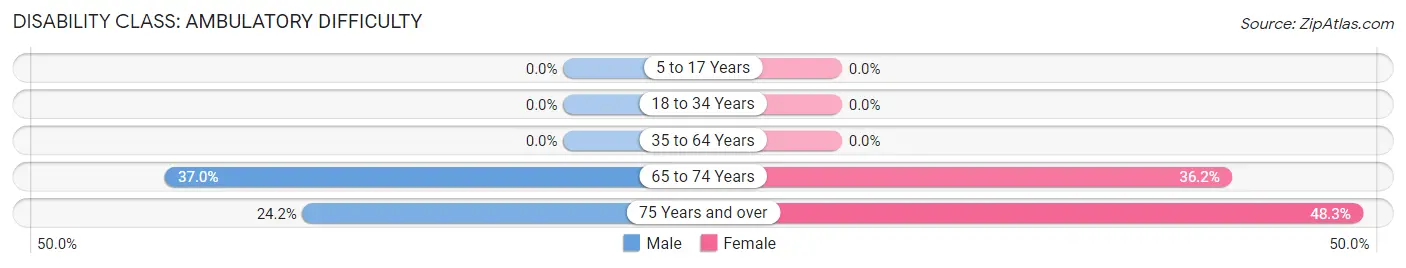
| Age Bracket | Male | Female |
| 5 to 17 Years | 0 (0.0%) | 0 (0.0%) |
| 18 to 34 Years | 0 (0.0%) | 0 (0.0%) |
| 35 to 64 Years | 0 (0.0%) | 0 (0.0%) |
| 65 to 74 Years | 17 (37.0%) | 17 (36.2%) |
| 75 Years and over | 15 (24.2%) | 58 (48.3%) |
Disability Class: Self-Care Difficulty
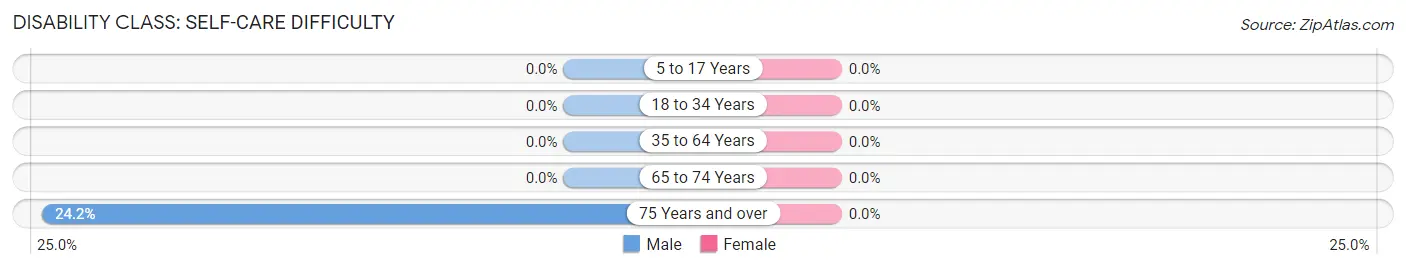
| Age Bracket | Male | Female |
| 5 to 17 Years | 0 (0.0%) | 0 (0.0%) |
| 18 to 34 Years | 0 (0.0%) | 0 (0.0%) |
| 35 to 64 Years | 0 (0.0%) | 0 (0.0%) |
| 65 to 74 Years | 0 (0.0%) | 0 (0.0%) |
| 75 Years and over | 15 (24.2%) | 0 (0.0%) |
Technology Access in Hometown
Computing Device Access in Hometown
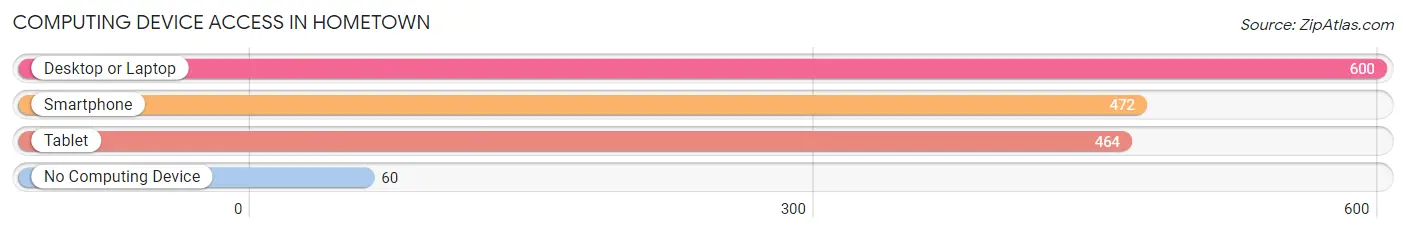
| Device Type | # Households | % Households |
| Desktop or Laptop | 600 | 85.8% |
| Smartphone | 472 | 67.5% |
| Tablet | 464 | 66.4% |
| No Computing Device | 60 | 8.6% |
| Total | 699 | 100.0% |
Internet Access in Hometown
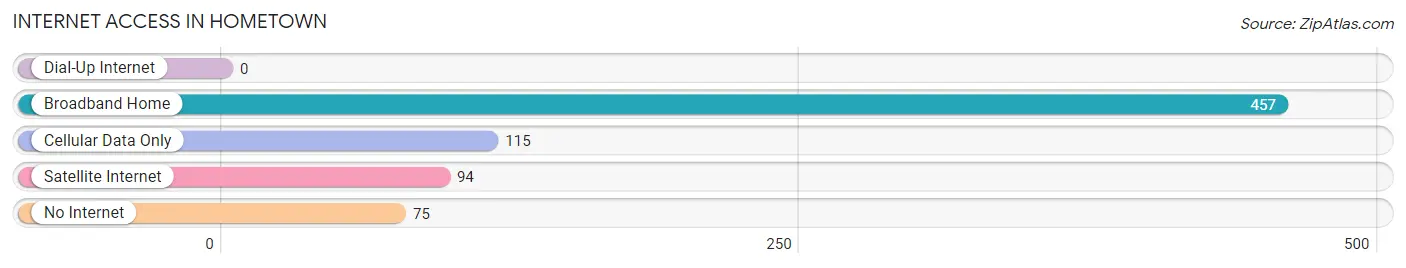
| Internet Type | # Households | % Households |
| Dial-Up Internet | 0 | 0.0% |
| Broadband Home | 457 | 65.4% |
| Cellular Data Only | 115 | 16.5% |
| Satellite Internet | 94 | 13.5% |
| No Internet | 75 | 10.7% |
| Total | 699 | 100.0% |
Hometown Summary
Hometown, PA is a small borough located in the heart of Pennsylvania. It is situated in the southeastern corner of the state, just north of Philadelphia and south of Allentown. The borough is home to a population of approximately 4,000 people, and is part of the Lehigh Valley region.
History
Hometown, PA was founded in 1790 by a group of settlers from Philadelphia. The settlers were looking for a place to settle and start a new life, and they chose the area due to its proximity to Philadelphia and its abundance of natural resources. The settlers named the town after their hometown in Philadelphia, and the name has remained ever since.
The town quickly grew and prospered, and by the mid-1800s it had become a bustling center of commerce and industry. The town was home to several mills, a tannery, and a variety of other businesses. The town also had a thriving agricultural sector, with many farms located in the surrounding area.
The town continued to grow and prosper throughout the 19th and early 20th centuries, and by the 1950s it had become a popular tourist destination. The town was home to several resorts and attractions, and it was a popular destination for vacationers from Philadelphia and other nearby cities.
Geography
Hometown, PA is located in the southeastern corner of Pennsylvania, just north of Philadelphia and south of Allentown. The borough is situated in the Lehigh Valley region, and is surrounded by the townships of Upper Macungie, Lower Macungie, and South Whitehall. The borough is located on the banks of the Lehigh River, and is bordered by the townships of Upper Macungie and Lower Macungie to the north, and South Whitehall to the south.
The borough is located in a hilly region, and is home to several small mountains and hills. The highest point in the borough is located at the summit of Mount Penn, which stands at an elevation of 1,067 feet. The borough is also home to several small creeks and streams, including the Little Lehigh Creek and the Jordan Creek.
Economy
Hometown, PA is a small borough, and its economy is largely based on tourism and small businesses. The town is home to several resorts and attractions, and it is a popular destination for vacationers from Philadelphia and other nearby cities. The town is also home to several small businesses, including restaurants, shops, and other services.
The town is also home to several manufacturing and industrial businesses, including a paper mill, a printing company, and a plastics factory. The town is also home to several farms, and the surrounding area is home to several vineyards and wineries.
Demographics
As of the 2010 census, the population of Hometown, PA was 4,000. The population is largely white (90.2%), with small percentages of African American (3.2%), Asian (2.2%), and Hispanic (2.4%) residents. The median household income in the borough is $50,000, and the median age is 40.
Conclusion
Hometown, PA is a small borough located in the southeastern corner of Pennsylvania. The town was founded in 1790 by a group of settlers from Philadelphia, and it has since grown and prospered. The town is home to a population of approximately 4,000 people, and is part of the Lehigh Valley region. The town is largely dependent on tourism and small businesses, and it is home to several resorts and attractions. The town is also home to several manufacturing and industrial businesses, and the surrounding area is home to several farms and vineyards.
Common Questions
What is Per Capita Income in Hometown?
Per Capita income in Hometown is $47,342.
What is the Median Family Income in Hometown?
Median Family Income in Hometown is $163,808.
What is Income or Wage Gap in Hometown?
Income or Wage Gap in Hometown is 4.0%.
Women in Hometown earn 96.0 cents for every dollar earned by a man.
What is Inequality or Gini Index in Hometown?
Inequality or Gini Index in Hometown is 0.34.
What is the Total Population of Hometown?
Total Population of Hometown is 1,660.
What is the Total Male Population of Hometown?
Total Male Population of Hometown is 761.
What is the Total Female Population of Hometown?
Total Female Population of Hometown is 899.
What is the Ratio of Males per 100 Females in Hometown?
There are 84.65 Males per 100 Females in Hometown.
What is the Ratio of Females per 100 Males in Hometown?
There are 118.13 Females per 100 Males in Hometown.
What is the Median Population Age in Hometown?
Median Population Age in Hometown is 45.7 Years.
What is the Average Family Size in Hometown
Average Family Size in Hometown is 2.7 People.
What is the Average Household Size in Hometown
Average Household Size in Hometown is 2.4 People.
How Large is the Labor Force in Hometown?
There are 1,088 People in the Labor Forcein in Hometown.
What is the Percentage of People in the Labor Force in Hometown?
74.3% of People are in the Labor Force in Hometown.
What is the Unemployment Rate in Hometown?
Unemployment Rate in Hometown is 3.1%.