Lake City borough, PA Map & Demographics
Lake City borough Overview
$31,467
PER CAPITA INCOME
$73,482
AVG FAMILY INCOME
$76,250
AVG HOUSEHOLD INCOME
19.1%
WAGE / INCOME GAP [ % ]
80.9¢/ $1
WAGE / INCOME GAP [ $ ]
$12,705
FAMILY INCOME DEFICIT
0.35
INEQUALITY / GINI INDEX
2,925
TOTAL POPULATION
1,434
MALE POPULATION
1,491
FEMALE POPULATION
96.18
MALES / 100 FEMALES
103.97
FEMALES / 100 MALES
36.3
MEDIAN AGE
3.1
AVG FAMILY SIZE
2.8
AVG HOUSEHOLD SIZE
1,548
LABOR FORCE [ PEOPLE ]
68.4%
PERCENT IN LABOR FORCE
3.2%
UNEMPLOYMENT RATE
Income in Lake City borough
Income Overview in Lake City borough
Per Capita Income in Lake City borough is $31,467, while median incomes of families and households are $73,482 and $76,250 respectively.
| Characteristic | Number | Measure |
| Per Capita Income | 2,925 | $31,467 |
| Median Family Income | 730 | $73,482 |
| Mean Family Income | 730 | $85,265 |
| Median Household Income | 1,057 | $76,250 |
| Mean Household Income | 1,057 | $86,689 |
| Income Deficit | 730 | $12,705 |
| Wage / Income Gap (%) | 2,925 | 19.12% |
| Wage / Income Gap ($) | 2,925 | 80.88¢ per $1 |
| Gini / Inequality Index | 2,925 | 0.35 |
Earnings by Sex in Lake City borough
Average Earnings in Lake City borough are $41,084, $44,821 for men and $36,250 for women, a difference of 19.1%.
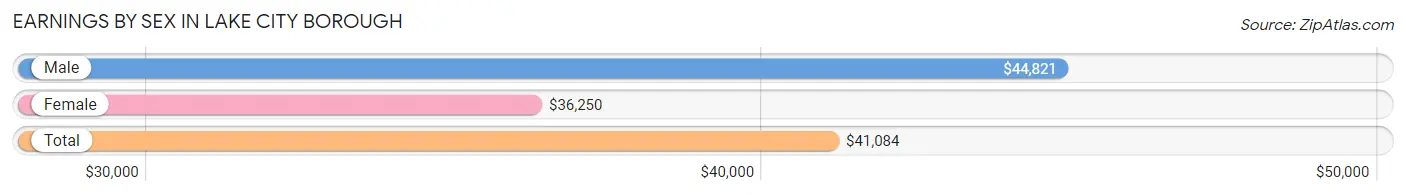
| Sex | Number | Average Earnings |
| Male | 835 (53.3%) | $44,821 |
| Female | 731 (46.7%) | $36,250 |
| Total | 1,566 (100.0%) | $41,084 |
Earnings by Sex by Income Bracket in Lake City borough
The most common earnings brackets in Lake City borough are $65,000 to $74,999 for men (132 | 15.8%) and $55,000 to $64,999 for women (110 | 15.0%).
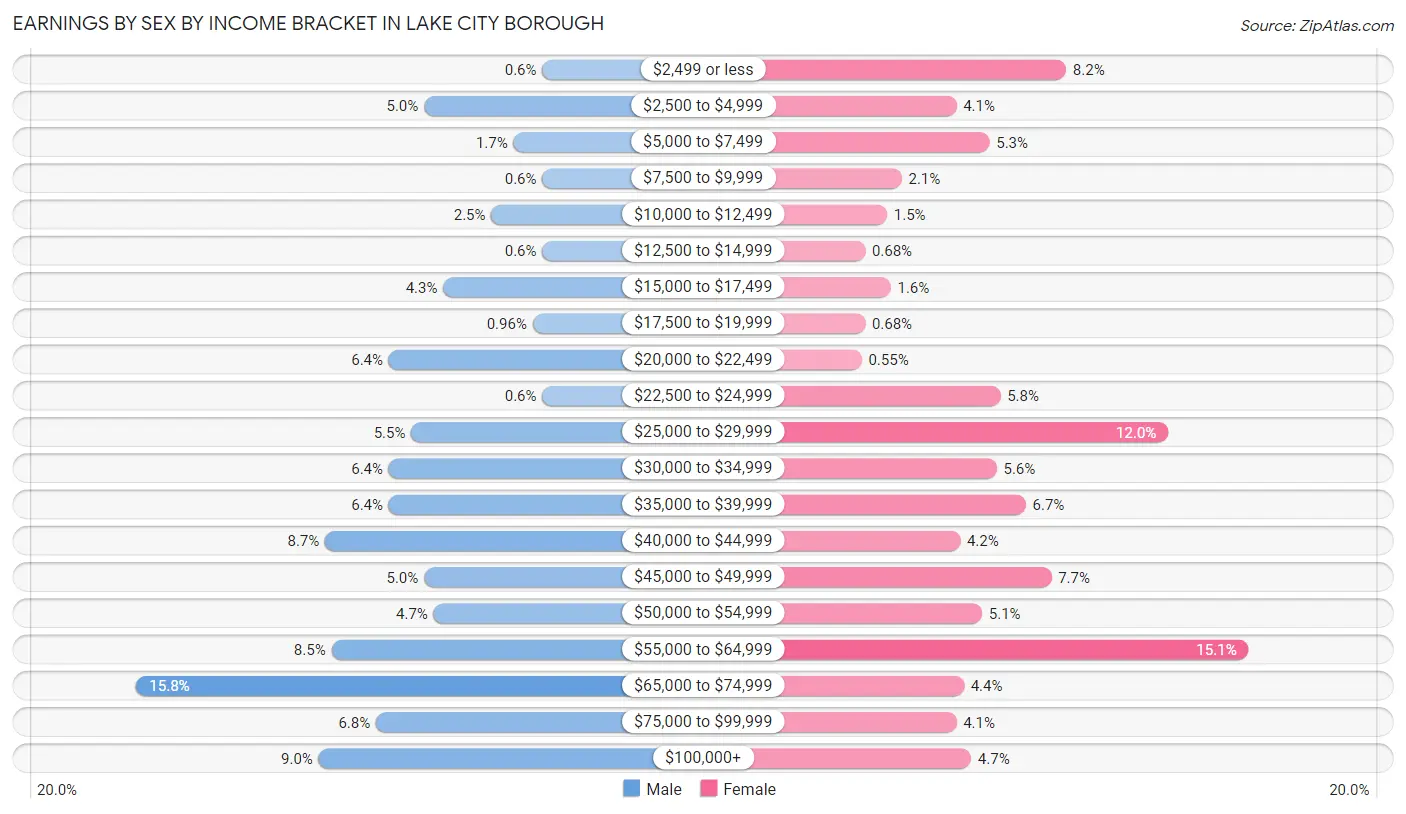
| Income | Male | Female |
| $2,499 or less | 5 (0.6%) | 60 (8.2%) |
| $2,500 to $4,999 | 42 (5.0%) | 30 (4.1%) |
| $5,000 to $7,499 | 14 (1.7%) | 39 (5.3%) |
| $7,500 to $9,999 | 5 (0.6%) | 15 (2.1%) |
| $10,000 to $12,499 | 21 (2.5%) | 11 (1.5%) |
| $12,500 to $14,999 | 5 (0.6%) | 5 (0.7%) |
| $15,000 to $17,499 | 36 (4.3%) | 12 (1.6%) |
| $17,500 to $19,999 | 8 (1.0%) | 5 (0.7%) |
| $20,000 to $22,499 | 53 (6.4%) | 4 (0.5%) |
| $22,500 to $24,999 | 5 (0.6%) | 42 (5.8%) |
| $25,000 to $29,999 | 46 (5.5%) | 88 (12.0%) |
| $30,000 to $34,999 | 53 (6.4%) | 41 (5.6%) |
| $35,000 to $39,999 | 53 (6.4%) | 49 (6.7%) |
| $40,000 to $44,999 | 73 (8.7%) | 31 (4.2%) |
| $45,000 to $49,999 | 42 (5.0%) | 56 (7.7%) |
| $50,000 to $54,999 | 39 (4.7%) | 37 (5.1%) |
| $55,000 to $64,999 | 71 (8.5%) | 110 (15.0%) |
| $65,000 to $74,999 | 132 (15.8%) | 32 (4.4%) |
| $75,000 to $99,999 | 57 (6.8%) | 30 (4.1%) |
| $100,000+ | 75 (9.0%) | 34 (4.6%) |
| Total | 835 (100.0%) | 731 (100.0%) |
Earnings by Sex by Educational Attainment in Lake City borough
Average earnings in Lake City borough are $51,186 for men and $40,565 for women, a difference of 20.7%. Men with an educational attainment of graduate degree enjoy the highest average annual earnings of $69,661, while those with college or associate's degree education earn the least with $36,250. Women with an educational attainment of graduate degree earn the most with the average annual earnings of $63,636, while those with less than high school education have the smallest earnings of $2,499.
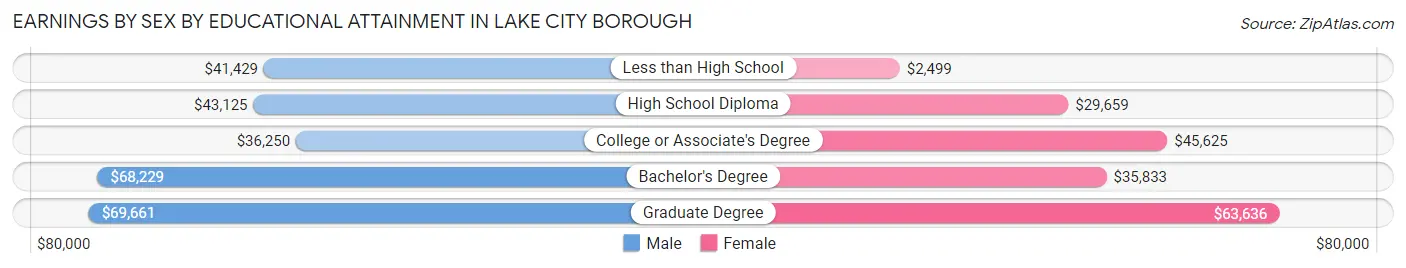
| Educational Attainment | Male Income | Female Income |
| Less than High School | $41,429 | $2,499 |
| High School Diploma | $43,125 | $29,659 |
| College or Associate's Degree | $36,250 | $45,625 |
| Bachelor's Degree | $68,229 | $35,833 |
| Graduate Degree | $69,661 | $63,636 |
| Total | $51,186 | $40,565 |
Family Income in Lake City borough
Family Income Brackets in Lake City borough
According to the Lake City borough family income data, there are 180 families falling into the $100,000 to $149,999 income range, which is the most common income bracket and makes up 24.7% of all families. Conversely, the $10,000 to $14,999 income bracket is the least frequent group with only 23 families (3.2%) belonging to this category.
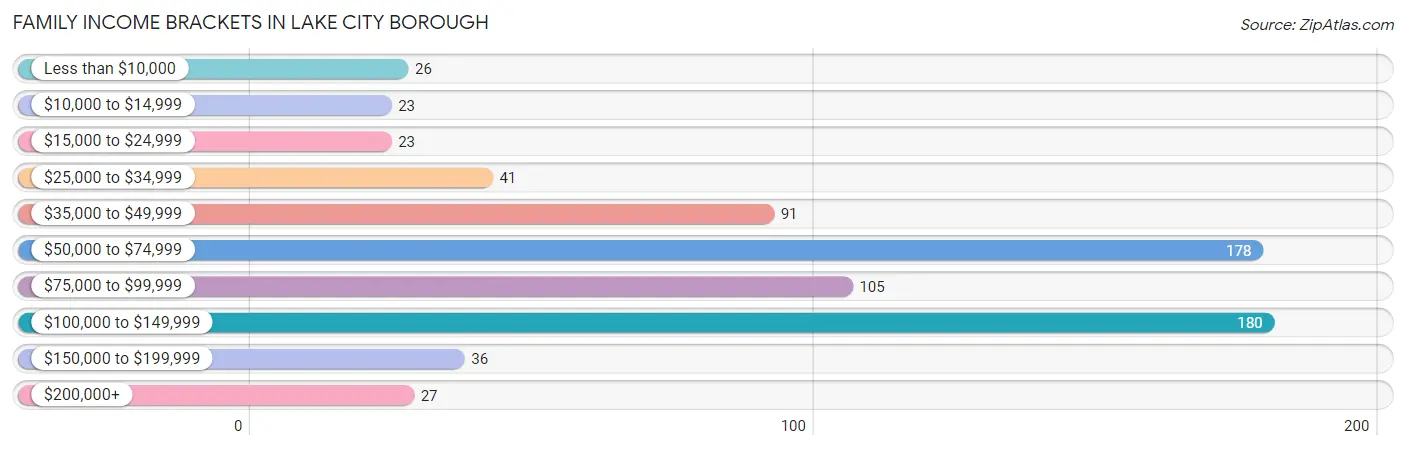
| Income Bracket | # Families | % Families |
| Less than $10,000 | 26 | 3.6% |
| $10,000 to $14,999 | 23 | 3.2% |
| $15,000 to $24,999 | 23 | 3.2% |
| $25,000 to $34,999 | 41 | 5.6% |
| $35,000 to $49,999 | 91 | 12.5% |
| $50,000 to $74,999 | 178 | 24.4% |
| $75,000 to $99,999 | 105 | 14.4% |
| $100,000 to $149,999 | 180 | 24.7% |
| $150,000 to $199,999 | 36 | 4.9% |
| $200,000+ | 27 | 3.7% |
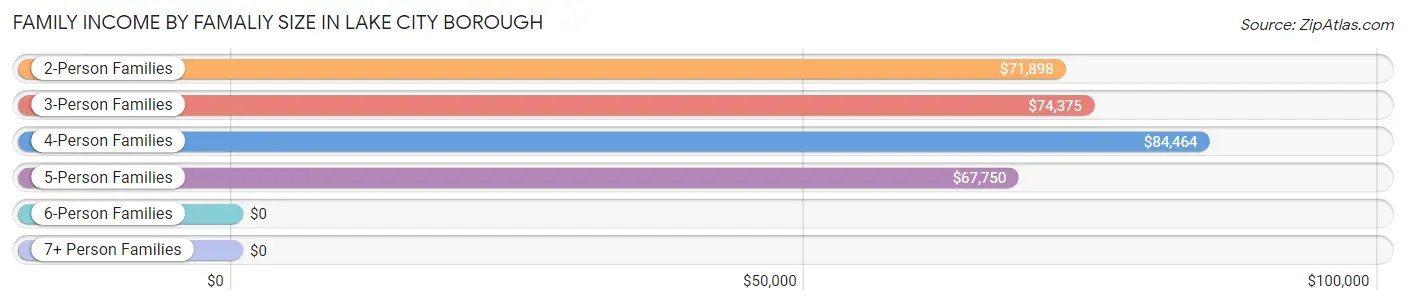
Family Income by Famaliy Size in Lake City borough
4-person families (181 | 24.8%) account for the highest median family income in Lake City borough with $84,464 per family, while 2-person families (357 | 48.9%) have the highest median income of $35,949 per family member.
| Income Bracket | # Families | Median Income |
| 2-Person Families | 357 (48.9%) | $71,898 |
| 3-Person Families | 125 (17.1%) | $74,375 |
| 4-Person Families | 181 (24.8%) | $84,464 |
| 5-Person Families | 33 (4.5%) | $67,750 |
| 6-Person Families | 34 (4.7%) | $0 |
| 7+ Person Families | 0 (0.0%) | $0 |
| Total | 730 (100.0%) | $73,482 |
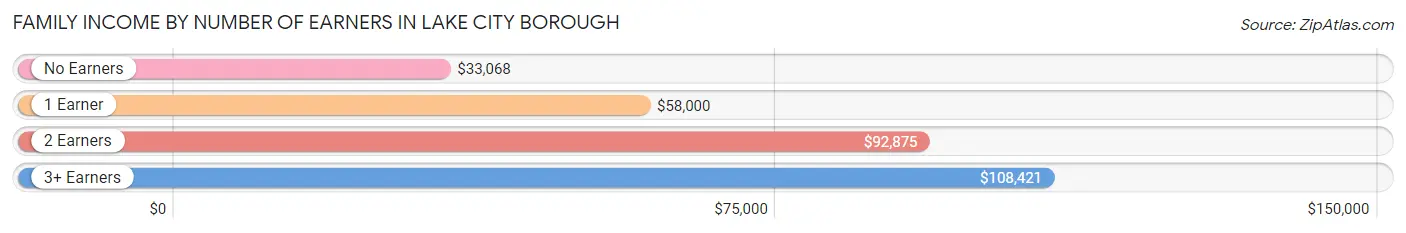
Family Income by Number of Earners in Lake City borough
The median family income in Lake City borough is $73,482, with families comprising 3+ earners (104) having the highest median family income of $108,421, while families with no earners (113) have the lowest median family income of $33,068, accounting for 14.2% and 15.5% of families, respectively.
| Number of Earners | # Families | Median Income |
| No Earners | 113 (15.5%) | $33,068 |
| 1 Earner | 210 (28.8%) | $58,000 |
| 2 Earners | 303 (41.5%) | $92,875 |
| 3+ Earners | 104 (14.2%) | $108,421 |
| Total | 730 (100.0%) | $73,482 |
Household Income in Lake City borough
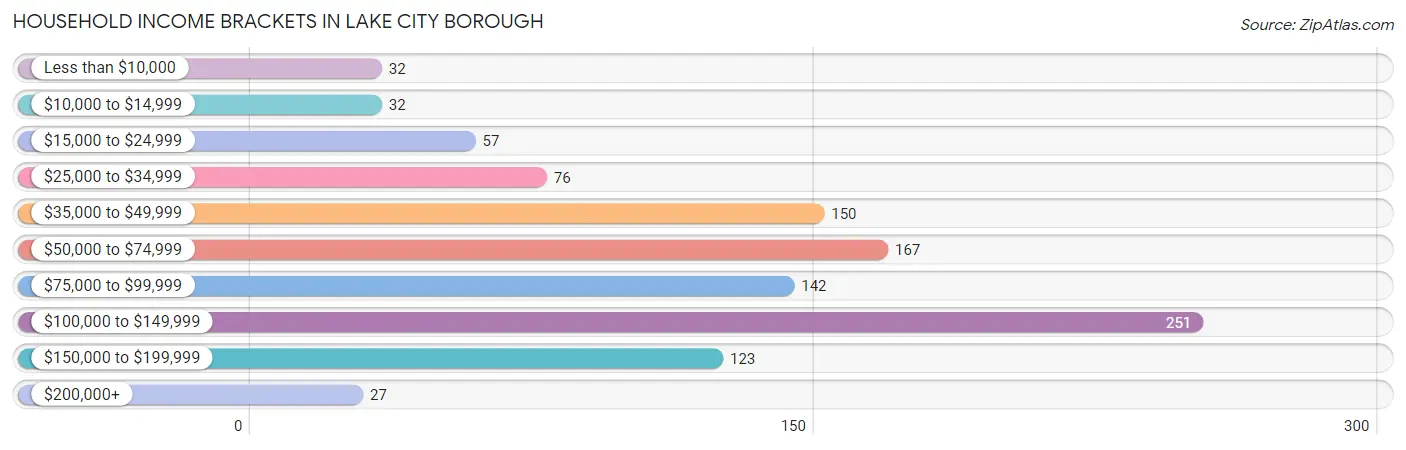
Household Income Brackets in Lake City borough
With 251 households falling in the category, the $100,000 to $149,999 income range is the most frequent in Lake City borough, accounting for 23.7% of all households. In contrast, only 27 households (2.5%) fall into the $200,000+ income bracket, making it the least populous group.
| Income Bracket | # Households | % Households |
| Less than $10,000 | 32 | 3.0% |
| $10,000 to $14,999 | 32 | 3.0% |
| $15,000 to $24,999 | 57 | 5.4% |
| $25,000 to $34,999 | 76 | 7.2% |
| $35,000 to $49,999 | 150 | 14.2% |
| $50,000 to $74,999 | 167 | 15.8% |
| $75,000 to $99,999 | 142 | 13.4% |
| $100,000 to $149,999 | 251 | 23.7% |
| $150,000 to $199,999 | 123 | 11.6% |
| $200,000+ | 27 | 2.6% |
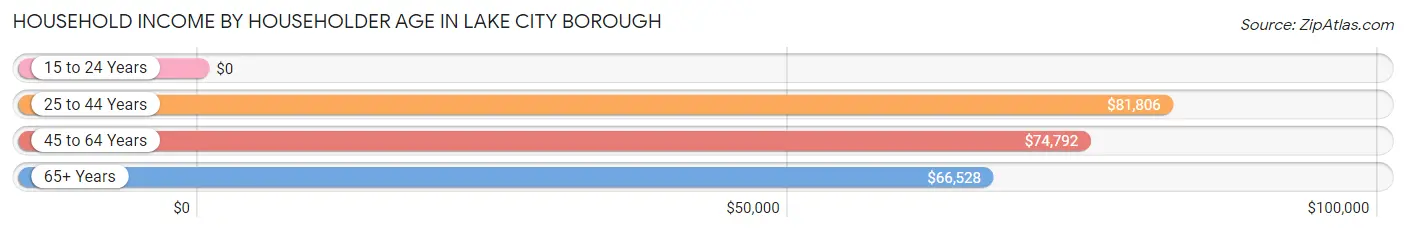
Household Income by Householder Age in Lake City borough
The median household income in Lake City borough is $76,250, with the highest median household income of $81,806 found in the 25 to 44 years age bracket for the primary householder. A total of 365 households (34.5%) fall into this category. Meanwhile, the 15 to 24 years age bracket for the primary householder has the lowest median household income of $0, with 5 households (0.5%) in this group.
| Income Bracket | # Households | Median Income |
| 15 to 24 Years | 5 (0.5%) | $0 |
| 25 to 44 Years | 365 (34.5%) | $81,806 |
| 45 to 64 Years | 486 (46.0%) | $74,792 |
| 65+ Years | 201 (19.0%) | $66,528 |
| Total | 1,057 (100.0%) | $76,250 |
Poverty in Lake City borough
Income Below Poverty by Sex and Age in Lake City borough
With 8.4% poverty level for males and 13.6% for females among the residents of Lake City borough, 16 and 17 year old males and 16 and 17 year old females are the most vulnerable to poverty, with 10 males (30.3%) and 44 females (46.3%) in their respective age groups living below the poverty level.
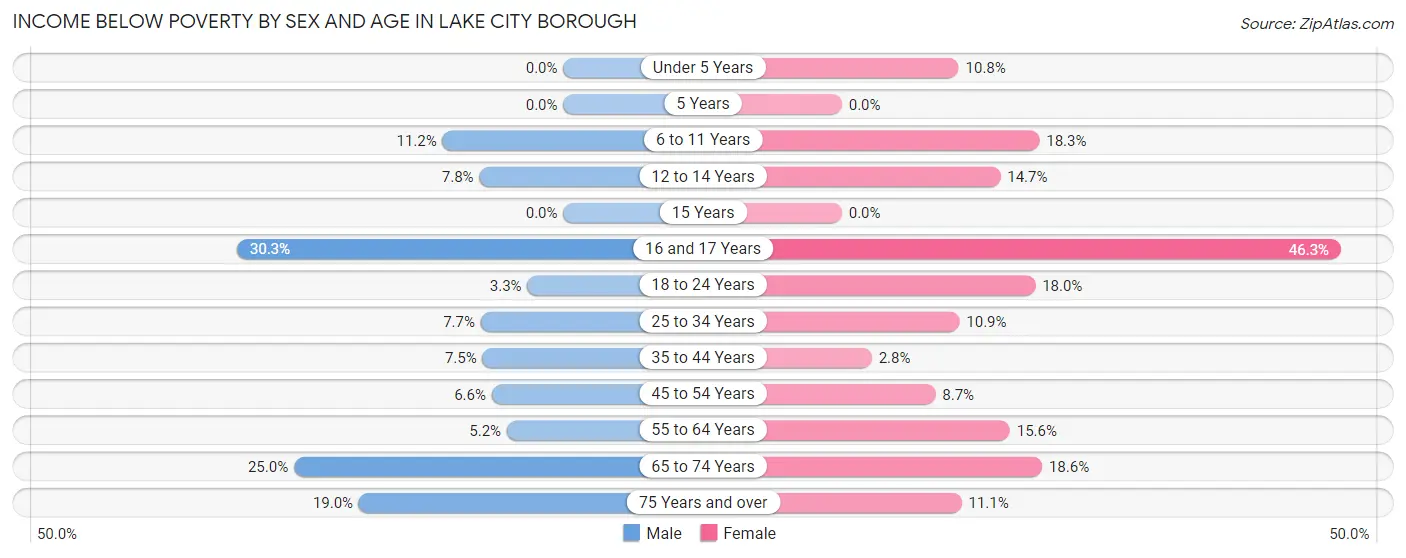
| Age Bracket | Male | Female |
| Under 5 Years | 0 (0.0%) | 9 (10.8%) |
| 5 Years | 0 (0.0%) | 0 (0.0%) |
| 6 to 11 Years | 13 (11.2%) | 11 (18.3%) |
| 12 to 14 Years | 6 (7.8%) | 10 (14.7%) |
| 15 Years | 0 (0.0%) | 0 (0.0%) |
| 16 and 17 Years | 10 (30.3%) | 44 (46.3%) |
| 18 to 24 Years | 5 (3.3%) | 14 (17.9%) |
| 25 to 34 Years | 18 (7.7%) | 18 (10.9%) |
| 35 to 44 Years | 12 (7.5%) | 5 (2.8%) |
| 45 to 54 Years | 14 (6.6%) | 21 (8.7%) |
| 55 to 64 Years | 10 (5.2%) | 29 (15.6%) |
| 65 to 74 Years | 19 (25.0%) | 21 (18.6%) |
| 75 Years and over | 11 (19.0%) | 10 (11.1%) |
| Total | 118 (8.4%) | 192 (13.6%) |
Income Above Poverty by Sex and Age in Lake City borough
According to the poverty statistics in Lake City borough, males aged under 5 years and females aged 5 years are the age groups that are most secure financially, with 100.0% of males and 100.0% of females in these age groups living above the poverty line.
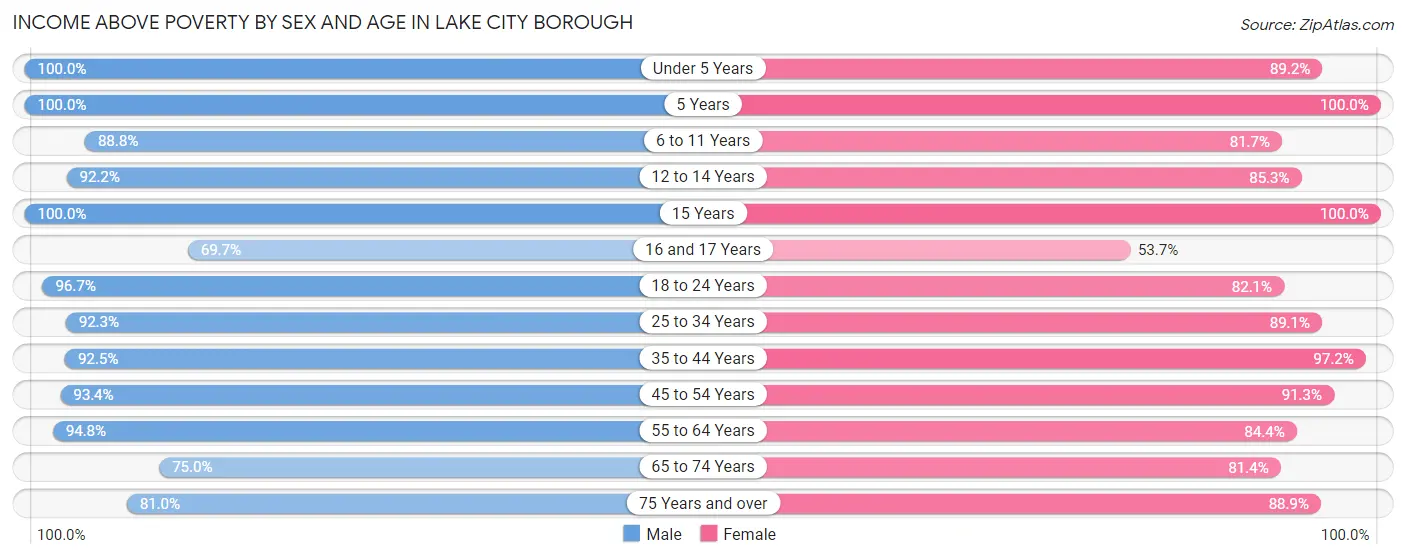
| Age Bracket | Male | Female |
| Under 5 Years | 72 (100.0%) | 74 (89.2%) |
| 5 Years | 10 (100.0%) | 21 (100.0%) |
| 6 to 11 Years | 103 (88.8%) | 49 (81.7%) |
| 12 to 14 Years | 71 (92.2%) | 58 (85.3%) |
| 15 Years | 10 (100.0%) | 29 (100.0%) |
| 16 and 17 Years | 23 (69.7%) | 51 (53.7%) |
| 18 to 24 Years | 145 (96.7%) | 64 (82.1%) |
| 25 to 34 Years | 217 (92.3%) | 147 (89.1%) |
| 35 to 44 Years | 148 (92.5%) | 175 (97.2%) |
| 45 to 54 Years | 197 (93.4%) | 221 (91.3%) |
| 55 to 64 Years | 181 (94.8%) | 157 (84.4%) |
| 65 to 74 Years | 57 (75.0%) | 92 (81.4%) |
| 75 Years and over | 47 (81.0%) | 80 (88.9%) |
| Total | 1,281 (91.6%) | 1,218 (86.4%) |
Income Below Poverty Among Married-Couple Families in Lake City borough
The poverty statistics for married-couple families in Lake City borough show that 4.9% or 26 of the total 531 families live below the poverty line. Families with 3 or 4 children have the highest poverty rate of 14.0%, comprising of 6 families. On the other hand, families with 1 or 2 children have the lowest poverty rate of 2.3%, which includes 5 families.
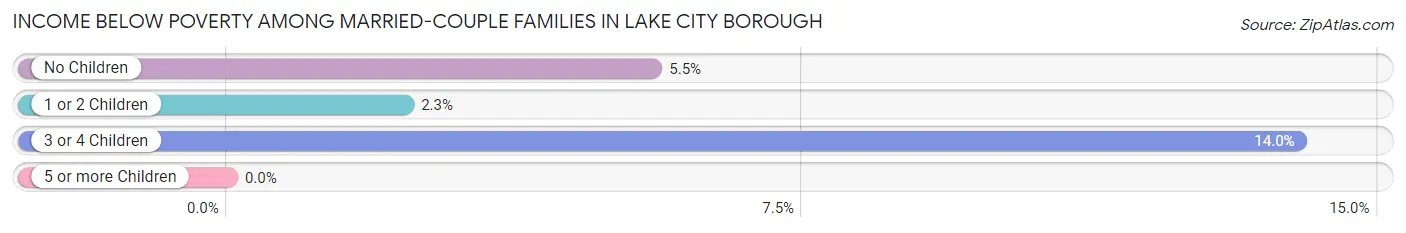
| Children | Above Poverty | Below Poverty |
| No Children | 256 (94.5%) | 15 (5.5%) |
| 1 or 2 Children | 212 (97.7%) | 5 (2.3%) |
| 3 or 4 Children | 37 (86.1%) | 6 (14.0%) |
| 5 or more Children | 0 (0.0%) | 0 (0.0%) |
| Total | 505 (95.1%) | 26 (4.9%) |
Income Below Poverty Among Single-Parent Households in Lake City borough
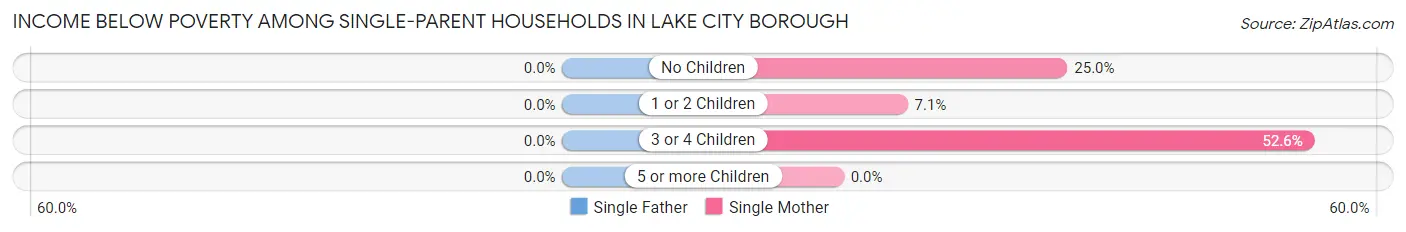
| Children | Single Father | Single Mother |
| No Children | 0 (0.0%) | 21 (25.0%) |
| 1 or 2 Children | 0 (0.0%) | 5 (7.1%) |
| 3 or 4 Children | 0 (0.0%) | 10 (52.6%) |
| 5 or more Children | 0 (0.0%) | 0 (0.0%) |
| Total | 0 (0.0%) | 36 (20.8%) |
Income Below Poverty Among Married-Couple vs Single-Parent Households in Lake City borough
The poverty data for Lake City borough shows that 26 of the married-couple family households (4.9%) and 36 of the single-parent households (18.1%) are living below the poverty level. Within the married-couple family households, those with 3 or 4 children have the highest poverty rate, with 6 households (14.0%) falling below the poverty line. Among the single-parent households, those with 3 or 4 children have the highest poverty rate, with 10 household (52.6%) living below poverty.
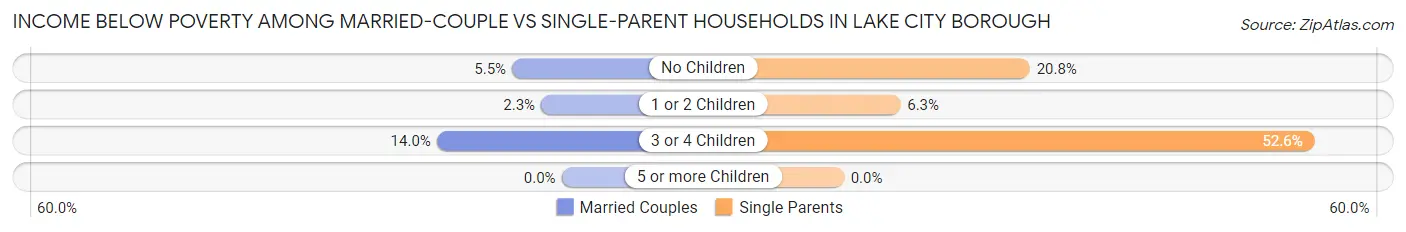
| Children | Married-Couple Families | Single-Parent Households |
| No Children | 15 (5.5%) | 21 (20.8%) |
| 1 or 2 Children | 5 (2.3%) | 5 (6.3%) |
| 3 or 4 Children | 6 (14.0%) | 10 (52.6%) |
| 5 or more Children | 0 (0.0%) | 0 (0.0%) |
| Total | 26 (4.9%) | 36 (18.1%) |
Race in Lake City borough
The most populous races in Lake City borough are White / Caucasian (2,586 | 88.4%), Two or more Races (280 | 9.6%), and Hispanic or Latino (173 | 5.9%).
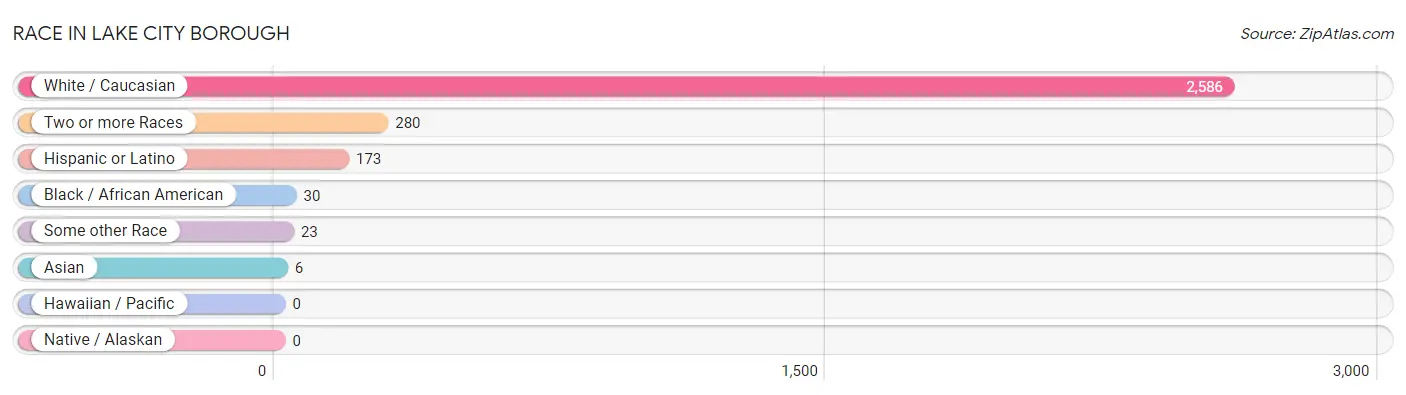
| Race | # Population | % Population |
| Asian | 6 | 0.2% |
| Black / African American | 30 | 1.0% |
| Hawaiian / Pacific | 0 | 0.0% |
| Hispanic or Latino | 173 | 5.9% |
| Native / Alaskan | 0 | 0.0% |
| White / Caucasian | 2,586 | 88.4% |
| Two or more Races | 280 | 9.6% |
| Some other Race | 23 | 0.8% |
| Total | 2,925 | 100.0% |
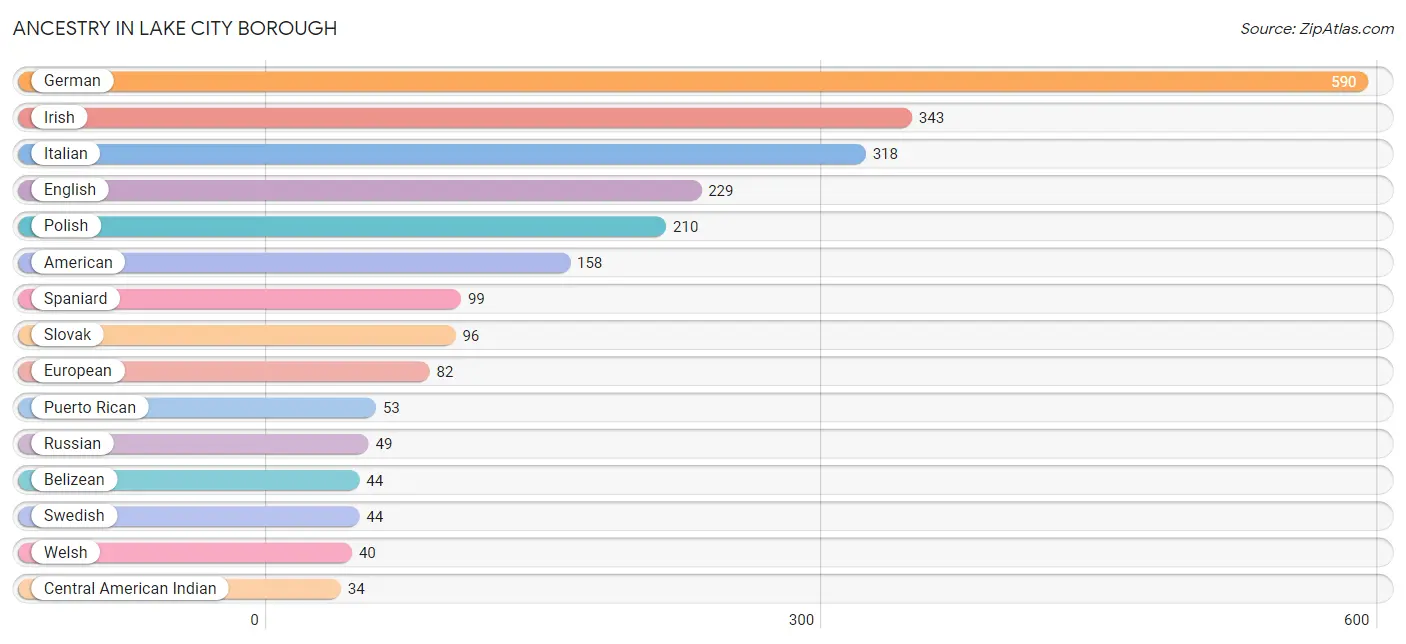
Ancestry in Lake City borough
The most populous ancestries reported in Lake City borough are German (590 | 20.2%), Irish (343 | 11.7%), Italian (318 | 10.9%), English (229 | 7.8%), and Polish (210 | 7.2%), together accounting for 57.8% of all Lake City borough residents.
| Ancestry | # Population | % Population |
| American | 158 | 5.4% |
| Apache | 4 | 0.1% |
| Belizean | 44 | 1.5% |
| British | 15 | 0.5% |
| Central American Indian | 34 | 1.2% |
| Cuban | 3 | 0.1% |
| Czech | 21 | 0.7% |
| Czechoslovakian | 5 | 0.2% |
| Delaware | 5 | 0.2% |
| Dominican | 14 | 0.5% |
| Dutch | 16 | 0.5% |
| Eastern European | 5 | 0.2% |
| English | 229 | 7.8% |
| European | 82 | 2.8% |
| Finnish | 6 | 0.2% |
| French | 7 | 0.2% |
| German | 590 | 20.2% |
| Hungarian | 11 | 0.4% |
| Indian (Asian) | 5 | 0.2% |
| Irish | 343 | 11.7% |
| Iroquois | 3 | 0.1% |
| Italian | 318 | 10.9% |
| Korean | 12 | 0.4% |
| Mexican | 4 | 0.1% |
| Norwegian | 9 | 0.3% |
| Pennsylvania German | 6 | 0.2% |
| Polish | 210 | 7.2% |
| Puerto Rican | 53 | 1.8% |
| Russian | 49 | 1.7% |
| Scotch-Irish | 24 | 0.8% |
| Scottish | 2 | 0.1% |
| Slavic | 5 | 0.2% |
| Slovak | 96 | 3.3% |
| Spaniard | 99 | 3.4% |
| Swedish | 44 | 1.5% |
| Swiss | 7 | 0.2% |
| Turkish | 5 | 0.2% |
| Ukrainian | 15 | 0.5% |
| Welsh | 40 | 1.4% | View All 39 Rows |
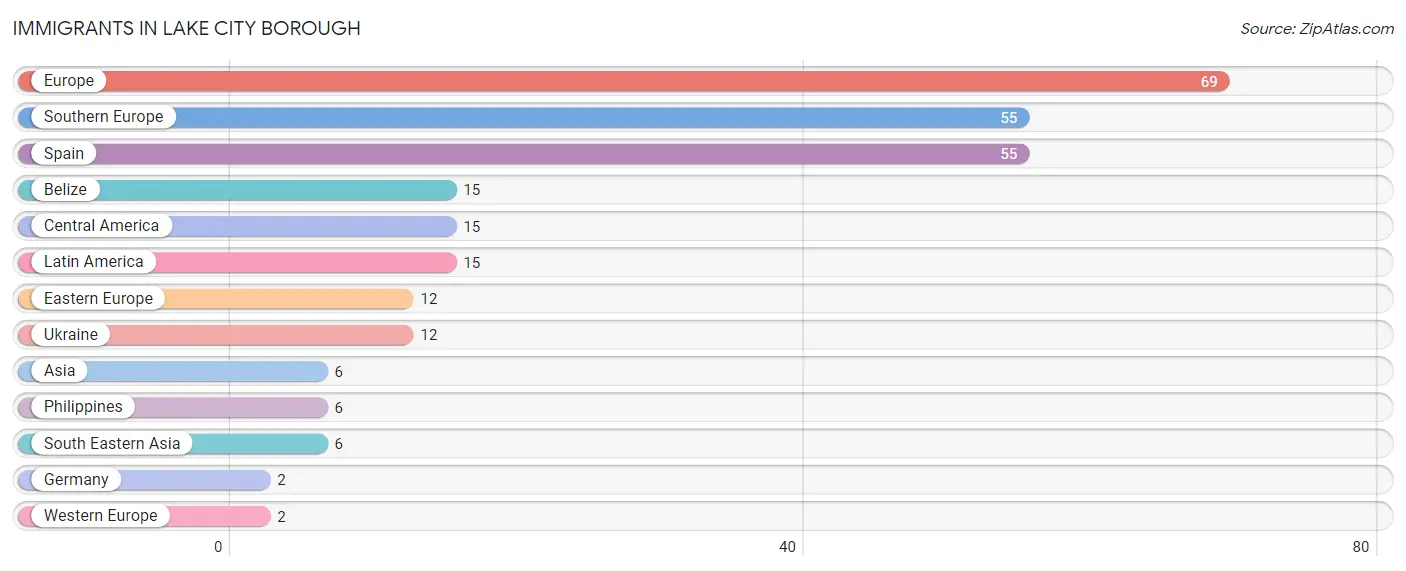
Immigrants in Lake City borough
The most numerous immigrant groups reported in Lake City borough came from Europe (69 | 2.4%), Southern Europe (55 | 1.9%), Spain (55 | 1.9%), Belize (15 | 0.5%), and Central America (15 | 0.5%), together accounting for 7.1% of all Lake City borough residents.
| Immigration Origin | # Population | % Population |
| Asia | 6 | 0.2% |
| Belize | 15 | 0.5% |
| Central America | 15 | 0.5% |
| Eastern Europe | 12 | 0.4% |
| Europe | 69 | 2.4% |
| Germany | 2 | 0.1% |
| Latin America | 15 | 0.5% |
| Philippines | 6 | 0.2% |
| South Eastern Asia | 6 | 0.2% |
| Southern Europe | 55 | 1.9% |
| Spain | 55 | 1.9% |
| Ukraine | 12 | 0.4% |
| Western Europe | 2 | 0.1% | View All 13 Rows |
Sex and Age in Lake City borough
Sex and Age in Lake City borough
The most populous age groups in Lake City borough are 10 to 14 Years (135 | 9.4%) for men and 15 to 19 Years (155 | 10.4%) for women.
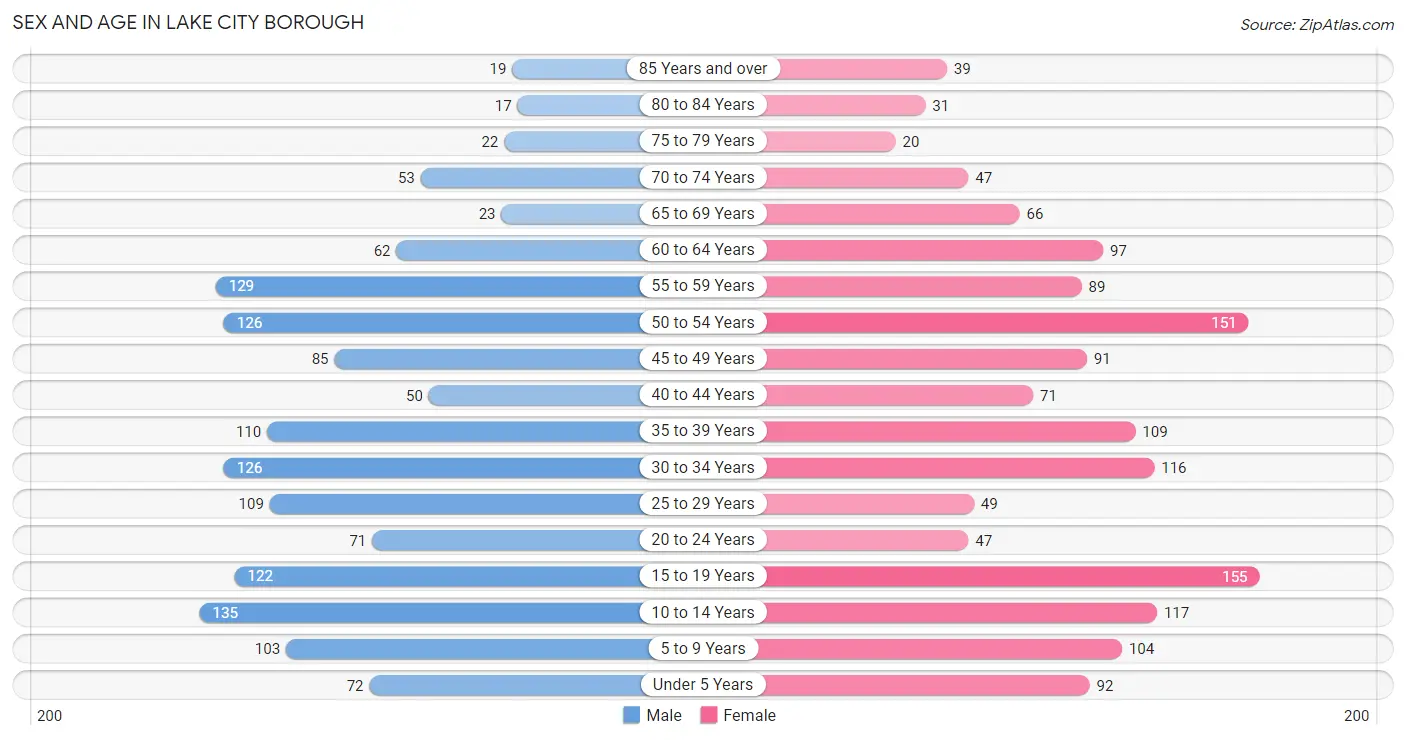
| Age Bracket | Male | Female |
| Under 5 Years | 72 (5.0%) | 92 (6.2%) |
| 5 to 9 Years | 103 (7.2%) | 104 (7.0%) |
| 10 to 14 Years | 135 (9.4%) | 117 (7.9%) |
| 15 to 19 Years | 122 (8.5%) | 155 (10.4%) |
| 20 to 24 Years | 71 (5.0%) | 47 (3.2%) |
| 25 to 29 Years | 109 (7.6%) | 49 (3.3%) |
| 30 to 34 Years | 126 (8.8%) | 116 (7.8%) |
| 35 to 39 Years | 110 (7.7%) | 109 (7.3%) |
| 40 to 44 Years | 50 (3.5%) | 71 (4.8%) |
| 45 to 49 Years | 85 (5.9%) | 91 (6.1%) |
| 50 to 54 Years | 126 (8.8%) | 151 (10.1%) |
| 55 to 59 Years | 129 (9.0%) | 89 (6.0%) |
| 60 to 64 Years | 62 (4.3%) | 97 (6.5%) |
| 65 to 69 Years | 23 (1.6%) | 66 (4.4%) |
| 70 to 74 Years | 53 (3.7%) | 47 (3.2%) |
| 75 to 79 Years | 22 (1.5%) | 20 (1.3%) |
| 80 to 84 Years | 17 (1.2%) | 31 (2.1%) |
| 85 Years and over | 19 (1.3%) | 39 (2.6%) |
| Total | 1,434 (100.0%) | 1,491 (100.0%) |
Families and Households in Lake City borough
Median Family Size in Lake City borough
The median family size in Lake City borough is 3.06 persons per family, with married-couple families (531 | 72.7%) accounting for the largest median family size of 3.21 persons per family. On the other hand, single male/father families (26 | 3.6%) represent the smallest median family size with 2.19 persons per family.
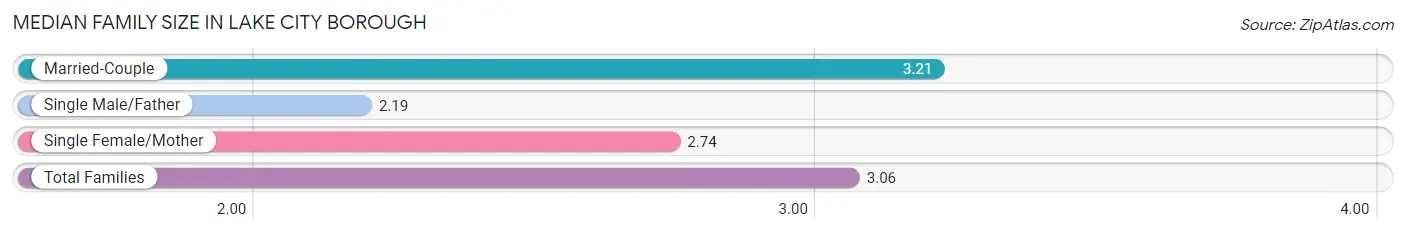
| Family Type | # Families | Family Size |
| Married-Couple | 531 (72.7%) | 3.21 |
| Single Male/Father | 26 (3.6%) | 2.19 |
| Single Female/Mother | 173 (23.7%) | 2.74 |
| Total Families | 730 (100.0%) | 3.06 |
Median Household Size in Lake City borough
The median household size in Lake City borough is 2.75 persons per household, with single female/mother households (173 | 16.4%) accounting for the largest median household size of 3.62 persons per household. non-family households (327 | 30.9%) represent the smallest median household size with 1.43 persons per household.
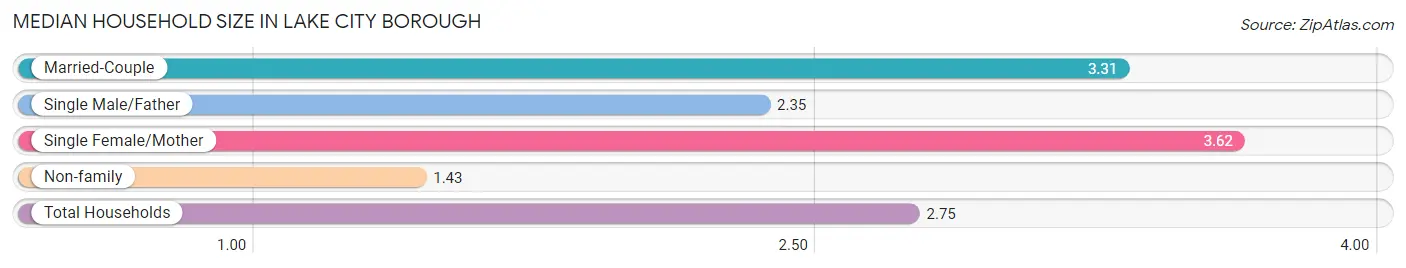
| Household Type | # Households | Household Size |
| Married-Couple | 531 (50.2%) | 3.31 |
| Single Male/Father | 26 (2.5%) | 2.35 |
| Single Female/Mother | 173 (16.4%) | 3.62 |
| Non-family | 327 (30.9%) | 1.43 |
| Total Households | 1,057 (100.0%) | 2.75 |
Household Size by Marriage Status in Lake City borough
Out of a total of 1,057 households in Lake City borough, 730 (69.1%) are family households, while 327 (30.9%) are nonfamily households. The most numerous type of family households are 2-person households, comprising 300, and the most common type of nonfamily households are 1-person households, comprising 223.
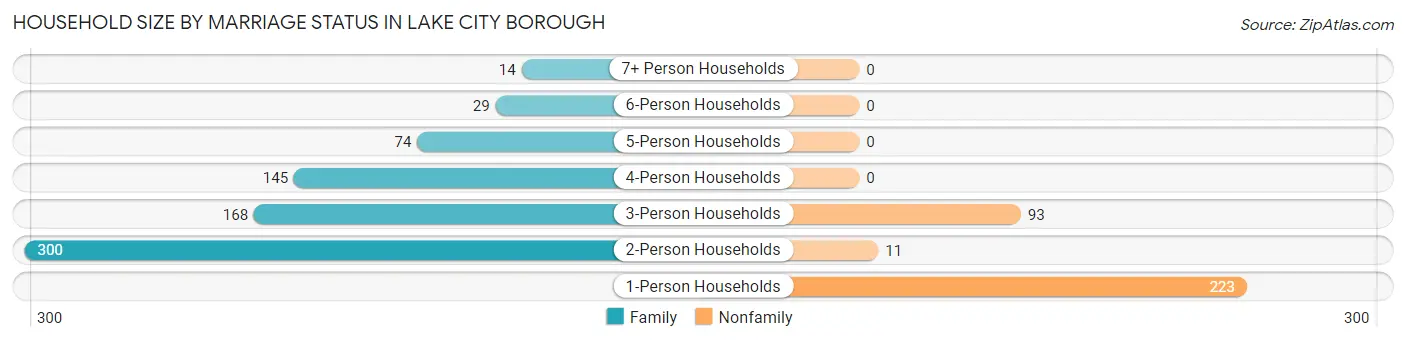
| Household Size | Family Households | Nonfamily Households |
| 1-Person Households | - | 223 (21.1%) |
| 2-Person Households | 300 (28.4%) | 11 (1.0%) |
| 3-Person Households | 168 (15.9%) | 93 (8.8%) |
| 4-Person Households | 145 (13.7%) | 0 (0.0%) |
| 5-Person Households | 74 (7.0%) | 0 (0.0%) |
| 6-Person Households | 29 (2.7%) | 0 (0.0%) |
| 7+ Person Households | 14 (1.3%) | 0 (0.0%) |
| Total | 730 (69.1%) | 327 (30.9%) |
Female Fertility in Lake City borough
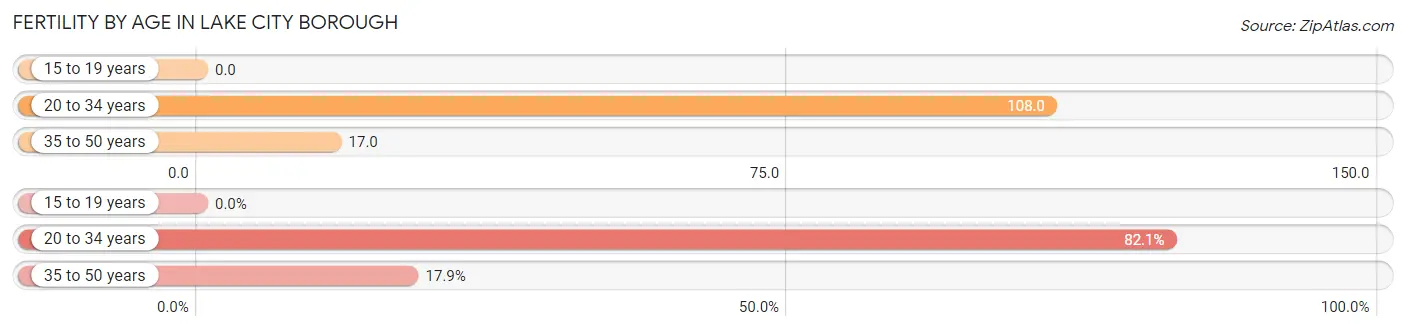
Fertility by Age in Lake City borough
Average fertility rate in Lake City borough is 42.0 births per 1,000 women. Women in the age bracket of 20 to 34 years have the highest fertility rate with 108.0 births per 1,000 women. Women in the age bracket of 20 to 34 years acount for 82.1% of all women with births.
| Age Bracket | Women with Births | Births / 1,000 Women |
| 15 to 19 years | 0 (0.0%) | 0.0 |
| 20 to 34 years | 23 (82.1%) | 108.0 |
| 35 to 50 years | 5 (17.9%) | 17.0 |
| Total | 28 (100.0%) | 42.0 |
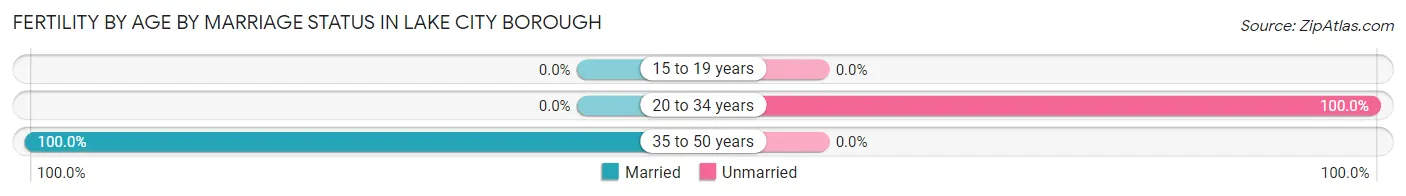
Fertility by Age by Marriage Status in Lake City borough
17.9% of women with births (28) in Lake City borough are married. The highest percentage of unmarried women with births falls into 20 to 34 years age bracket with 100.0% of them unmarried at the time of birth, while the lowest percentage of unmarried women with births belong to 35 to 50 years age bracket with 0.0% of them unmarried.
| Age Bracket | Married | Unmarried |
| 15 to 19 years | 0 (0.0%) | 0 (0.0%) |
| 20 to 34 years | 0 (0.0%) | 23 (100.0%) |
| 35 to 50 years | 5 (100.0%) | 0 (0.0%) |
| Total | 5 (17.9%) | 23 (82.1%) |
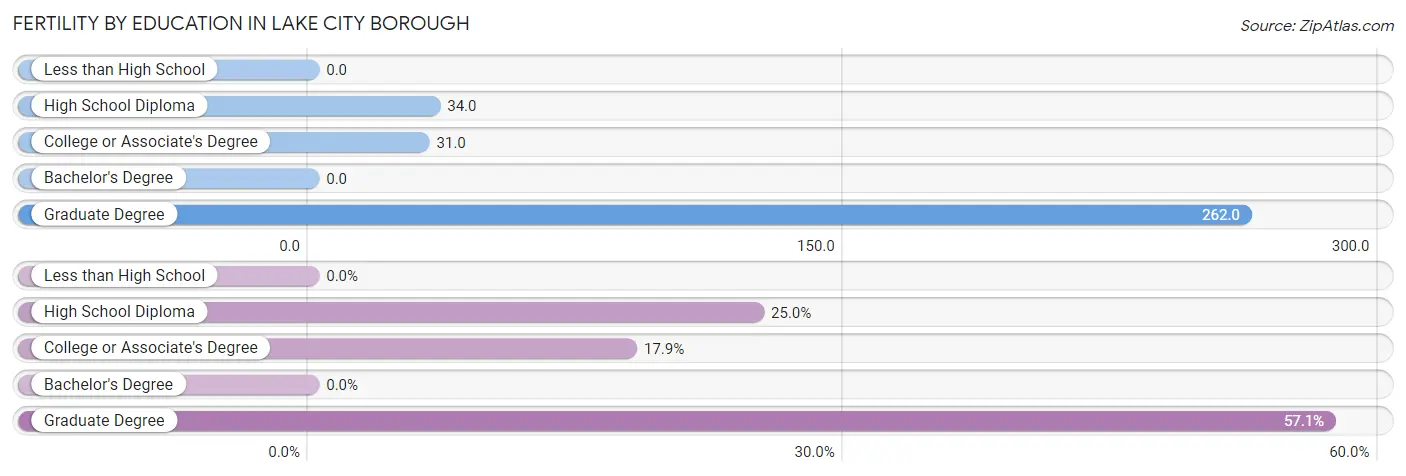
Fertility by Education in Lake City borough
| Educational Attainment | Women with Births | Births / 1,000 Women |
| Less than High School | 0 (0.0%) | 0.0 |
| High School Diploma | 7 (25.0%) | 34.0 |
| College or Associate's Degree | 5 (17.9%) | 31.0 |
| Bachelor's Degree | 0 (0.0%) | 0.0 |
| Graduate Degree | 16 (57.1%) | 262.0 |
| Total | 28 (100.0%) | 42.0 |
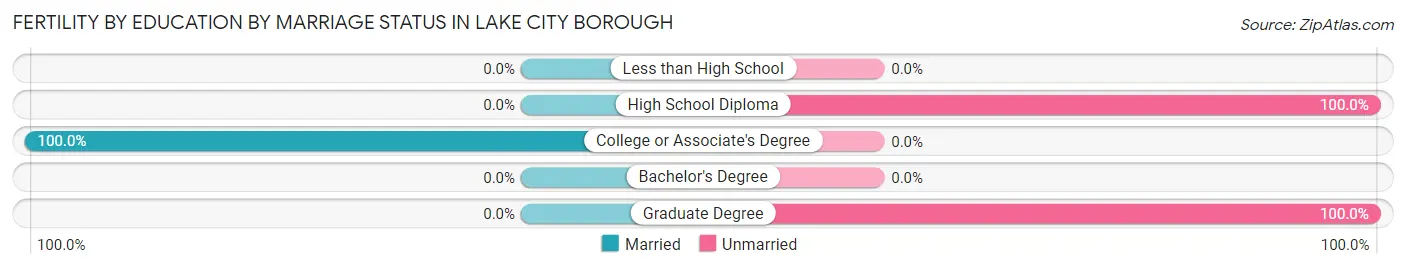
Fertility by Education by Marriage Status in Lake City borough
82.1% of women with births in Lake City borough are unmarried. Women with the educational attainment of college or associate's degree are most likely to be married with 100.0% of them married at childbirth, while women with the educational attainment of high school diploma are least likely to be married with 100.0% of them unmarried at childbirth.
| Educational Attainment | Married | Unmarried |
| Less than High School | 0 (0.0%) | 0 (0.0%) |
| High School Diploma | 0 (0.0%) | 7 (100.0%) |
| College or Associate's Degree | 5 (100.0%) | 0 (0.0%) |
| Bachelor's Degree | 0 (0.0%) | 0 (0.0%) |
| Graduate Degree | 0 (0.0%) | 16 (100.0%) |
| Total | 5 (17.9%) | 23 (82.1%) |
Employment Characteristics in Lake City borough
Employment by Class of Employer in Lake City borough
Among the 1,482 employed individuals in Lake City borough, private company employees (1,003 | 67.7%), not-for-profit organizations (214 | 14.4%), and state government employees (98 | 6.6%) make up the most common classes of employment.
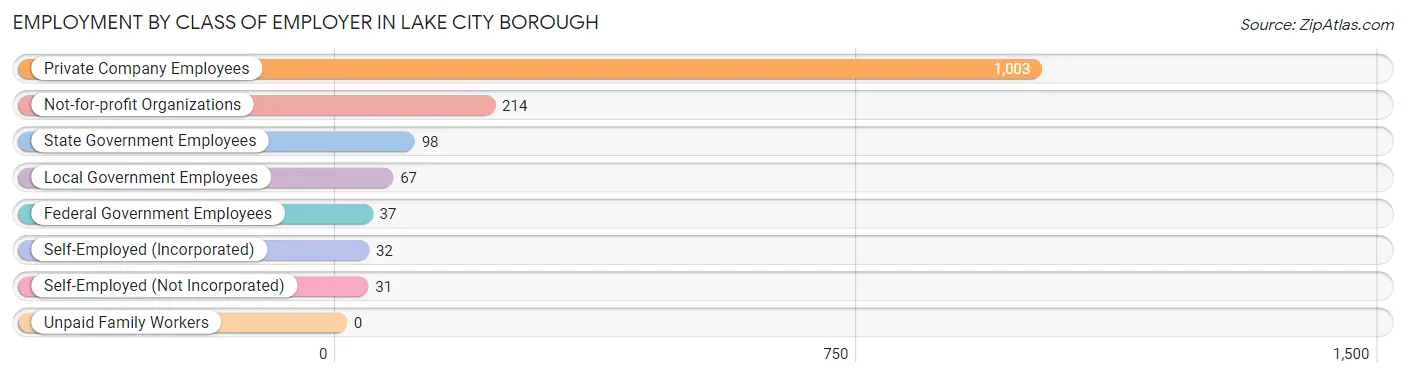
| Employer Class | # Employees | % Employees |
| Private Company Employees | 1,003 | 67.7% |
| Self-Employed (Incorporated) | 32 | 2.2% |
| Self-Employed (Not Incorporated) | 31 | 2.1% |
| Not-for-profit Organizations | 214 | 14.4% |
| Local Government Employees | 67 | 4.5% |
| State Government Employees | 98 | 6.6% |
| Federal Government Employees | 37 | 2.5% |
| Unpaid Family Workers | 0 | 0.0% |
| Total | 1,482 | 100.0% |
Employment Status by Age in Lake City borough
According to the labor force statistics for Lake City borough, out of the total population over 16 years of age (2,263), 68.4% or 1,548 individuals are in the labor force, with 3.2% or 50 of them unemployed. The age group with the highest labor force participation rate is 35 to 44 years, with 93.5% or 318 individuals in the labor force. Within the labor force, the 16 to 19 years age range has the highest percentage of unemployed individuals, with 9.2% or 11 of them being unemployed.
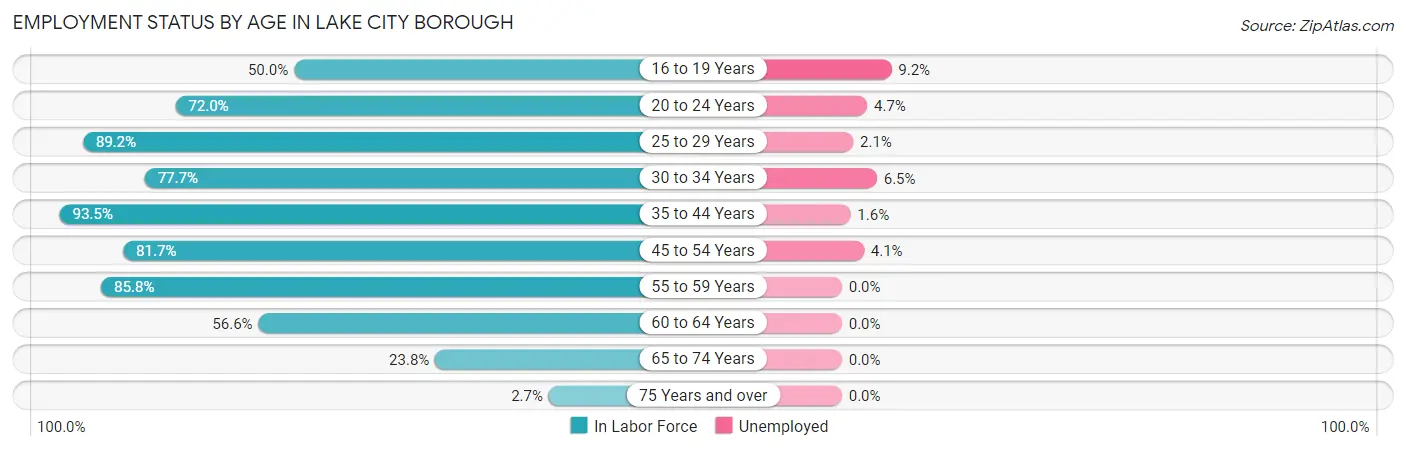
| Age Bracket | In Labor Force | Unemployed |
| 16 to 19 Years | 119 (50.0%) | 11 (9.2%) |
| 20 to 24 Years | 85 (72.0%) | 4 (4.7%) |
| 25 to 29 Years | 141 (89.2%) | 3 (2.1%) |
| 30 to 34 Years | 188 (77.7%) | 12 (6.5%) |
| 35 to 44 Years | 318 (93.5%) | 5 (1.6%) |
| 45 to 54 Years | 370 (81.7%) | 15 (4.1%) |
| 55 to 59 Years | 187 (85.8%) | 0 (0.0%) |
| 60 to 64 Years | 90 (56.6%) | 0 (0.0%) |
| 65 to 74 Years | 45 (23.8%) | 0 (0.0%) |
| 75 Years and over | 4 (2.7%) | 0 (0.0%) |
| Total | 1,548 (68.4%) | 50 (3.2%) |
Employment Status by Educational Attainment in Lake City borough
According to labor force statistics for Lake City borough, 82.4% of individuals (1,294) out of the total population between 25 and 64 years of age (1,570) are in the labor force, with 2.7% or 35 of them being unemployed. The group with the highest labor force participation rate are those with the educational attainment of bachelor's degree or higher, with 92.2% or 413 individuals in the labor force. Within the labor force, individuals with college / associate degree education have the highest percentage of unemployment, with 8.8% or 26 of them being unemployed.
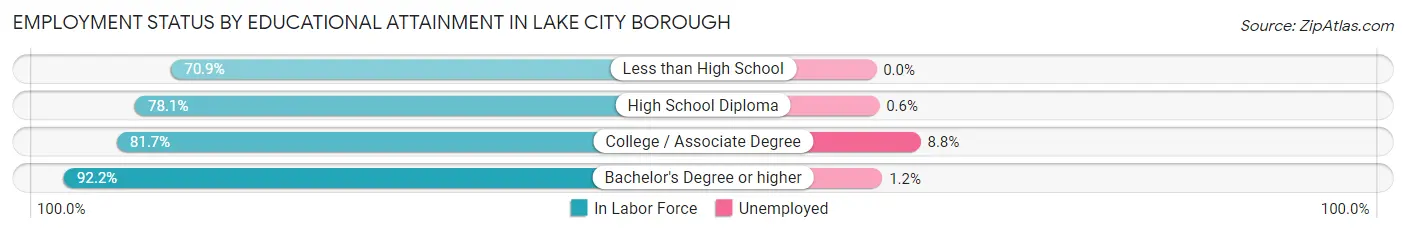
| Educational Attainment | In Labor Force | Unemployed |
| Less than High School | 83 (70.9%) | 0 (0.0%) |
| High School Diploma | 503 (78.1%) | 4 (0.6%) |
| College / Associate Degree | 295 (81.7%) | 32 (8.8%) |
| Bachelor's Degree or higher | 413 (92.2%) | 5 (1.2%) |
| Total | 1,294 (82.4%) | 42 (2.7%) |
Employment Occupations by Sex in Lake City borough
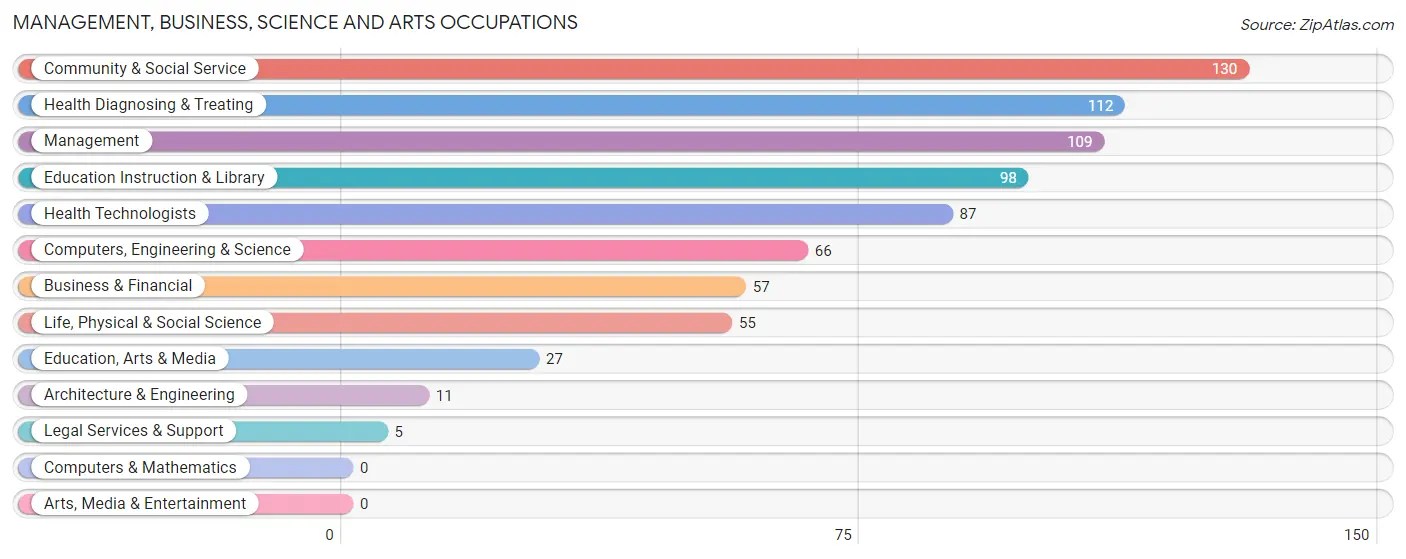
Management, Business, Science and Arts Occupations
The most common Management, Business, Science and Arts occupations in Lake City borough are Community & Social Service (130 | 8.8%), Health Diagnosing & Treating (112 | 7.6%), Management (109 | 7.4%), Education Instruction & Library (98 | 6.6%), and Health Technologists (87 | 5.9%).
Management, Business, Science and Arts Occupations by Sex
Within the Management, Business, Science and Arts occupations in Lake City borough, the most male-oriented occupations are Computers, Engineering & Science (100.0%), Architecture & Engineering (100.0%), and Life, Physical & Social Science (100.0%), while the most female-oriented occupations are Education Instruction & Library (100.0%), Community & Social Service (83.1%), and Health Diagnosing & Treating (82.1%).
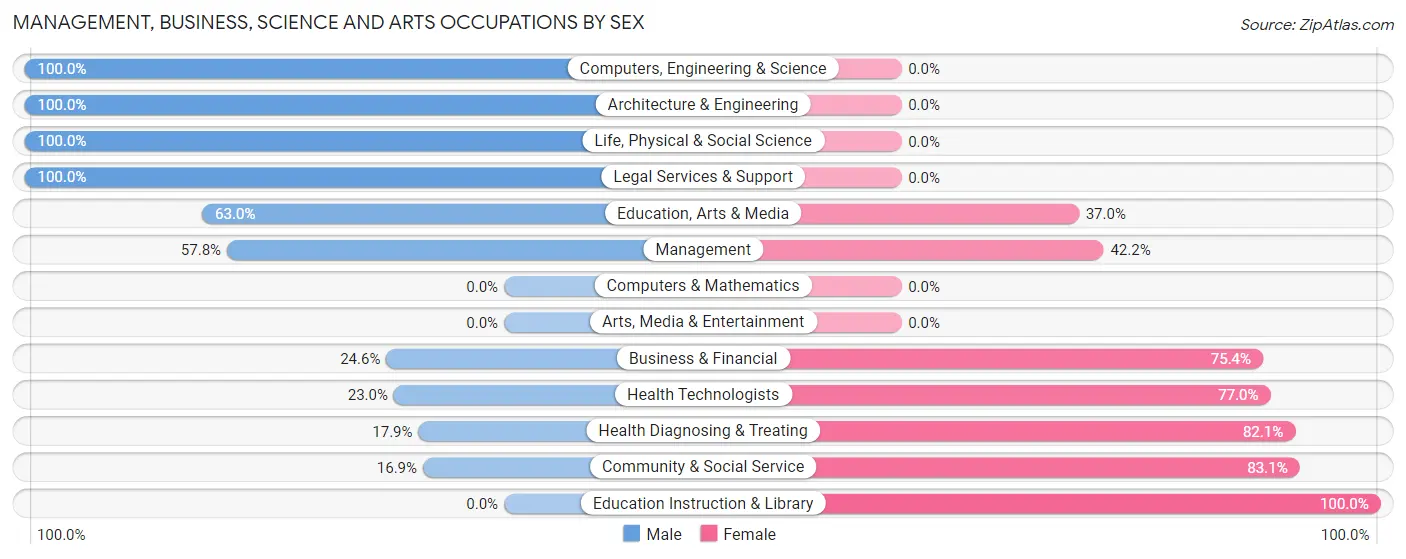
| Occupation | Male | Female |
| Management | 63 (57.8%) | 46 (42.2%) |
| Business & Financial | 14 (24.6%) | 43 (75.4%) |
| Computers, Engineering & Science | 66 (100.0%) | 0 (0.0%) |
| Computers & Mathematics | 0 (0.0%) | 0 (0.0%) |
| Architecture & Engineering | 11 (100.0%) | 0 (0.0%) |
| Life, Physical & Social Science | 55 (100.0%) | 0 (0.0%) |
| Community & Social Service | 22 (16.9%) | 108 (83.1%) |
| Education, Arts & Media | 17 (63.0%) | 10 (37.0%) |
| Legal Services & Support | 5 (100.0%) | 0 (0.0%) |
| Education Instruction & Library | 0 (0.0%) | 98 (100.0%) |
| Arts, Media & Entertainment | 0 (0.0%) | 0 (0.0%) |
| Health Diagnosing & Treating | 20 (17.9%) | 92 (82.1%) |
| Health Technologists | 20 (23.0%) | 67 (77.0%) |
| Total (Category) | 185 (39.0%) | 289 (61.0%) |
| Total (Overall) | 772 (52.2%) | 706 (47.8%) |
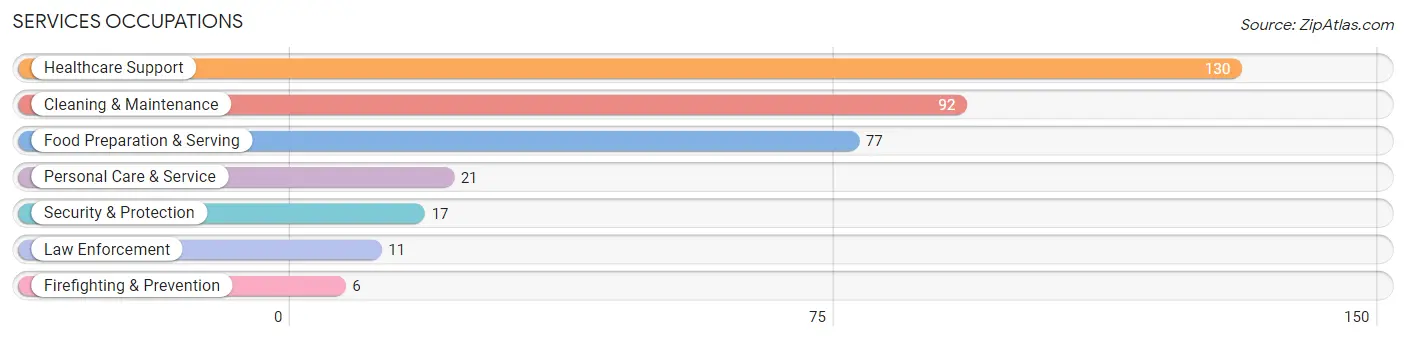
Services Occupations
The most common Services occupations in Lake City borough are Healthcare Support (130 | 8.8%), Cleaning & Maintenance (92 | 6.2%), Food Preparation & Serving (77 | 5.2%), Personal Care & Service (21 | 1.4%), and Security & Protection (17 | 1.1%).
Services Occupations by Sex
Within the Services occupations in Lake City borough, the most male-oriented occupations are Security & Protection (100.0%), Firefighting & Prevention (100.0%), and Law Enforcement (100.0%), while the most female-oriented occupations are Personal Care & Service (76.2%), Healthcare Support (73.1%), and Food Preparation & Serving (66.2%).
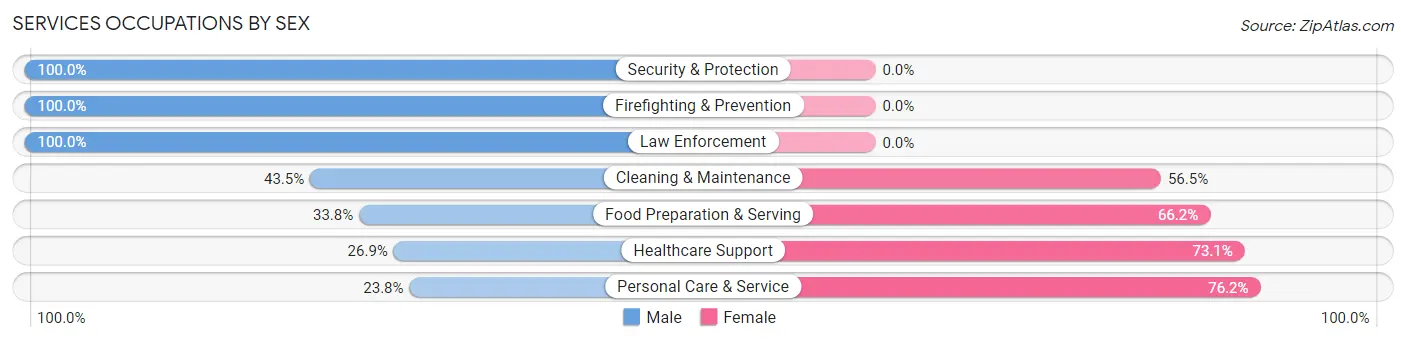
| Occupation | Male | Female |
| Healthcare Support | 35 (26.9%) | 95 (73.1%) |
| Security & Protection | 17 (100.0%) | 0 (0.0%) |
| Firefighting & Prevention | 6 (100.0%) | 0 (0.0%) |
| Law Enforcement | 11 (100.0%) | 0 (0.0%) |
| Food Preparation & Serving | 26 (33.8%) | 51 (66.2%) |
| Cleaning & Maintenance | 40 (43.5%) | 52 (56.5%) |
| Personal Care & Service | 5 (23.8%) | 16 (76.2%) |
| Total (Category) | 123 (36.5%) | 214 (63.5%) |
| Total (Overall) | 772 (52.2%) | 706 (47.8%) |
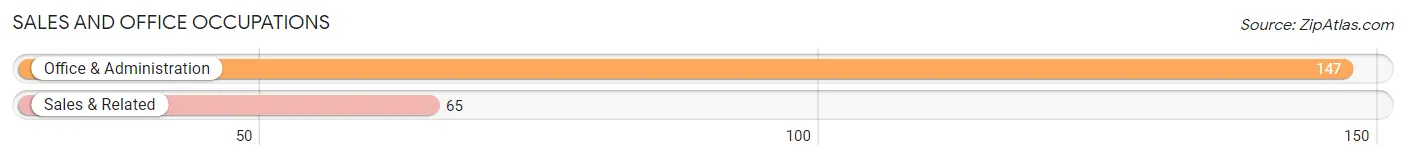
Sales and Office Occupations
The most common Sales and Office occupations in Lake City borough are Office & Administration (147 | 10.0%), and Sales & Related (65 | 4.4%).
Sales and Office Occupations by Sex
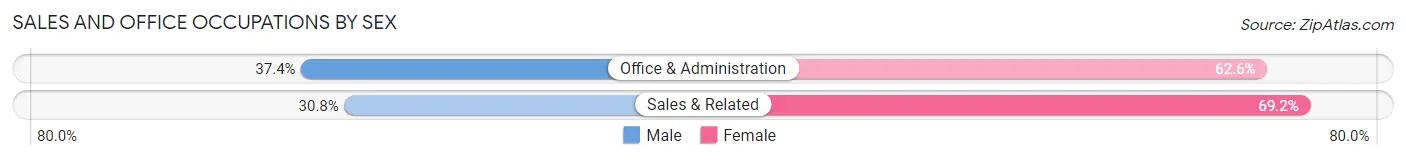
| Occupation | Male | Female |
| Sales & Related | 20 (30.8%) | 45 (69.2%) |
| Office & Administration | 55 (37.4%) | 92 (62.6%) |
| Total (Category) | 75 (35.4%) | 137 (64.6%) |
| Total (Overall) | 772 (52.2%) | 706 (47.8%) |
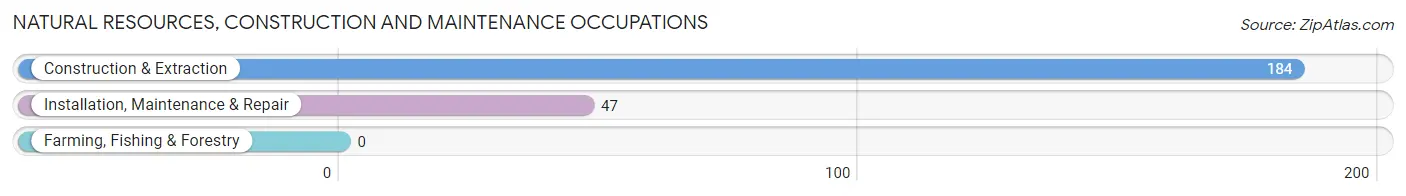
Natural Resources, Construction and Maintenance Occupations
The most common Natural Resources, Construction and Maintenance occupations in Lake City borough are Construction & Extraction (184 | 12.4%), and Installation, Maintenance & Repair (47 | 3.2%).
Natural Resources, Construction and Maintenance Occupations by Sex
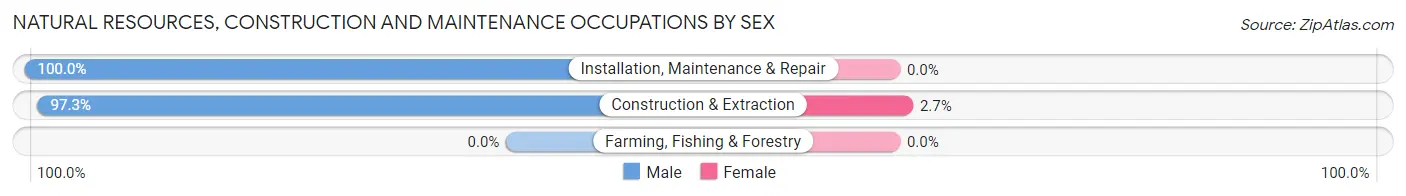
| Occupation | Male | Female |
| Farming, Fishing & Forestry | 0 (0.0%) | 0 (0.0%) |
| Construction & Extraction | 179 (97.3%) | 5 (2.7%) |
| Installation, Maintenance & Repair | 47 (100.0%) | 0 (0.0%) |
| Total (Category) | 226 (97.8%) | 5 (2.2%) |
| Total (Overall) | 772 (52.2%) | 706 (47.8%) |
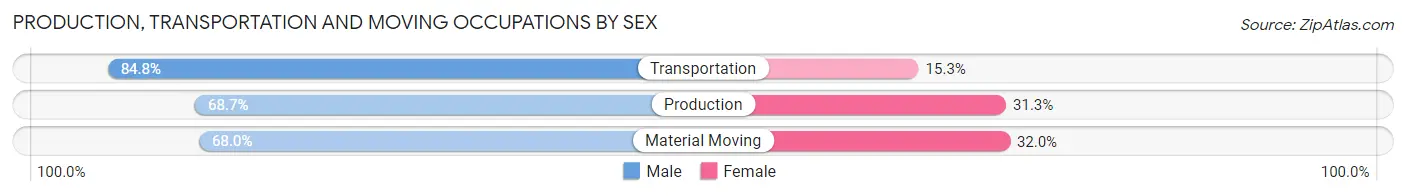
Production, Transportation and Moving Occupations
The most common Production, Transportation and Moving occupations in Lake City borough are Production (115 | 7.8%), Transportation (59 | 4.0%), and Material Moving (50 | 3.4%).
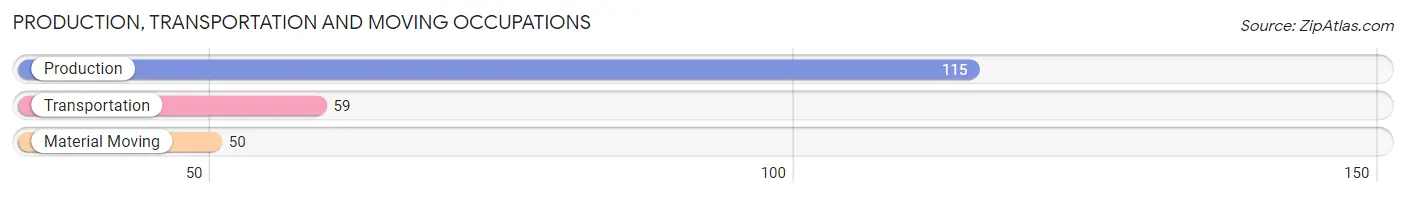
Production, Transportation and Moving Occupations by Sex
| Occupation | Male | Female |
| Production | 79 (68.7%) | 36 (31.3%) |
| Transportation | 50 (84.8%) | 9 (15.2%) |
| Material Moving | 34 (68.0%) | 16 (32.0%) |
| Total (Category) | 163 (72.8%) | 61 (27.2%) |
| Total (Overall) | 772 (52.2%) | 706 (47.8%) |
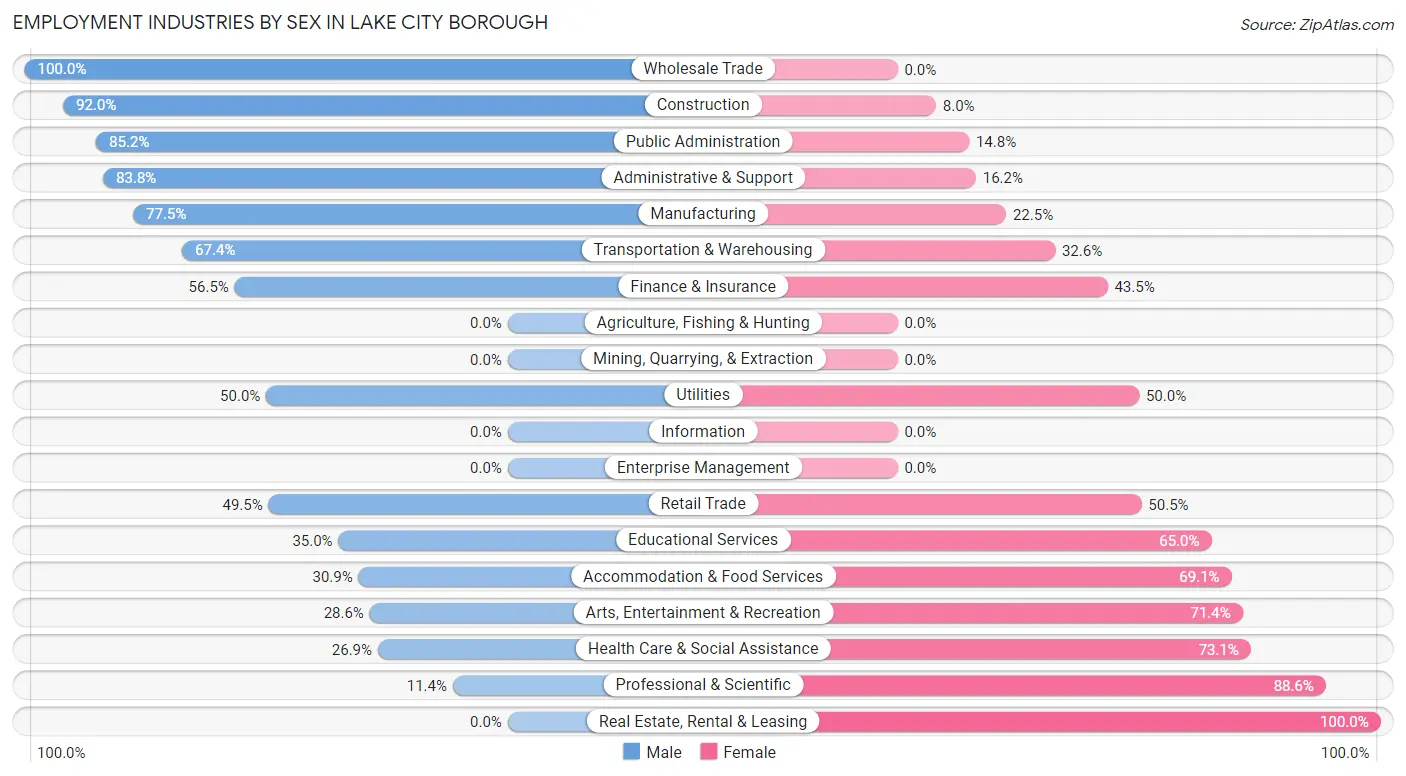
Employment Industries by Sex in Lake City borough
Employment Industries in Lake City borough
The major employment industries in Lake City borough include Health Care & Social Assistance (320 | 21.6%), Educational Services (234 | 15.8%), Manufacturing (227 | 15.4%), Construction (226 | 15.3%), and Retail Trade (101 | 6.8%).

Employment Industries by Sex in Lake City borough
The Lake City borough industries that see more men than women are Wholesale Trade (100.0%), Construction (92.0%), and Public Administration (85.2%), whereas the industries that tend to have a higher number of women are Real Estate, Rental & Leasing (100.0%), Professional & Scientific (88.6%), and Health Care & Social Assistance (73.1%).
| Industry | Male | Female |
| Agriculture, Fishing & Hunting | 0 (0.0%) | 0 (0.0%) |
| Mining, Quarrying, & Extraction | 0 (0.0%) | 0 (0.0%) |
| Construction | 208 (92.0%) | 18 (8.0%) |
| Manufacturing | 176 (77.5%) | 51 (22.5%) |
| Wholesale Trade | 6 (100.0%) | 0 (0.0%) |
| Retail Trade | 50 (49.5%) | 51 (50.5%) |
| Transportation & Warehousing | 31 (67.4%) | 15 (32.6%) |
| Utilities | 5 (50.0%) | 5 (50.0%) |
| Information | 0 (0.0%) | 0 (0.0%) |
| Finance & Insurance | 26 (56.5%) | 20 (43.5%) |
| Real Estate, Rental & Leasing | 0 (0.0%) | 17 (100.0%) |
| Professional & Scientific | 5 (11.4%) | 39 (88.6%) |
| Enterprise Management | 0 (0.0%) | 0 (0.0%) |
| Administrative & Support | 31 (83.8%) | 6 (16.2%) |
| Educational Services | 82 (35.0%) | 152 (65.0%) |
| Health Care & Social Assistance | 86 (26.9%) | 234 (73.1%) |
| Arts, Entertainment & Recreation | 10 (28.6%) | 25 (71.4%) |
| Accommodation & Food Services | 21 (30.9%) | 47 (69.1%) |
| Public Administration | 23 (85.2%) | 4 (14.8%) |
| Total | 772 (52.2%) | 706 (47.8%) |
Education in Lake City borough
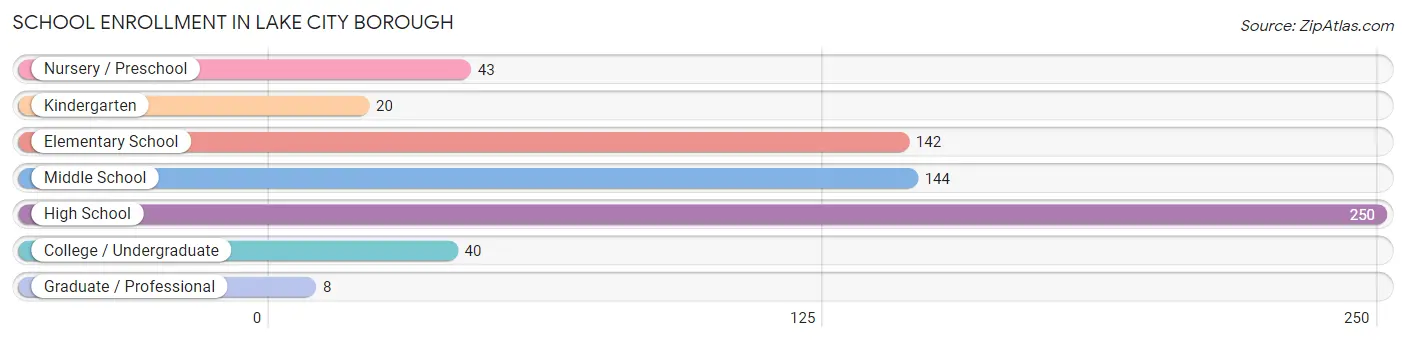
School Enrollment in Lake City borough
The most common levels of schooling among the 647 students in Lake City borough are high school (250 | 38.6%), middle school (144 | 22.3%), and elementary school (142 | 22.0%).
| School Level | # Students | % Students |
| Nursery / Preschool | 43 | 6.7% |
| Kindergarten | 20 | 3.1% |
| Elementary School | 142 | 22.0% |
| Middle School | 144 | 22.3% |
| High School | 250 | 38.6% |
| College / Undergraduate | 40 | 6.2% |
| Graduate / Professional | 8 | 1.2% |
| Total | 647 | 100.0% |
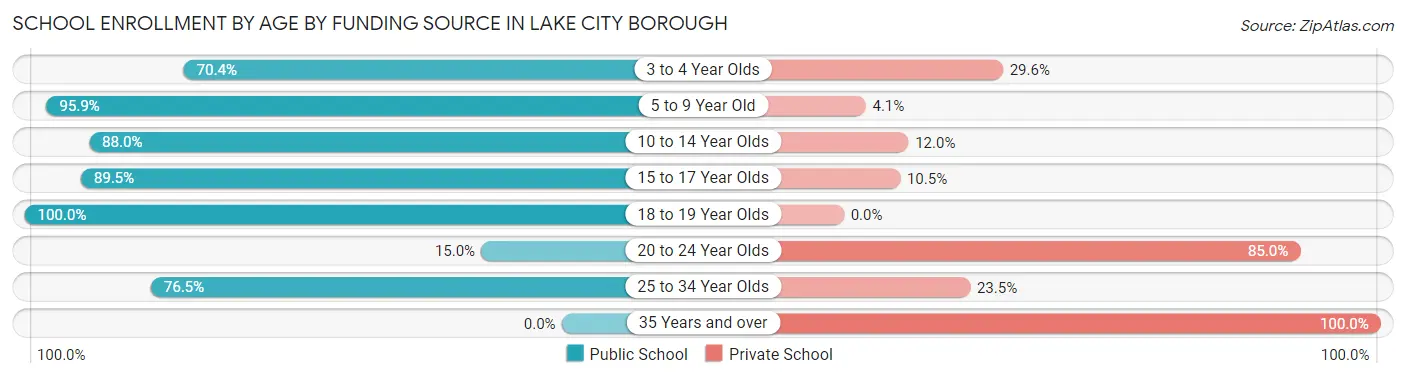
School Enrollment by Age by Funding Source in Lake City borough
Out of a total of 647 students who are enrolled in schools in Lake City borough, 101 (15.6%) attend a private institution, while the remaining 546 (84.4%) are enrolled in public schools. The age group of 35 years and over has the highest likelihood of being enrolled in private schools, with 4 (100.0% in the age bracket) enrolled. Conversely, the age group of 18 to 19 year olds has the lowest likelihood of being enrolled in a private school, with 33 (100.0% in the age bracket) attending a public institution.
| Age Bracket | Public School | Private School |
| 3 to 4 Year Olds | 19 (70.4%) | 8 (29.6%) |
| 5 to 9 Year Old | 118 (95.9%) | 5 (4.1%) |
| 10 to 14 Year Olds | 212 (88.0%) | 29 (12.0%) |
| 15 to 17 Year Olds | 145 (89.5%) | 17 (10.5%) |
| 18 to 19 Year Olds | 33 (100.0%) | 0 (0.0%) |
| 20 to 24 Year Olds | 6 (15.0%) | 34 (85.0%) |
| 25 to 34 Year Olds | 13 (76.5%) | 4 (23.5%) |
| 35 Years and over | 0 (0.0%) | 4 (100.0%) |
| Total | 546 (84.4%) | 101 (15.6%) |
Educational Attainment by Field of Study in Lake City borough
Business (121 | 22.9%), education (102 | 19.3%), bio, nature & agricultural (69 | 13.0%), arts & humanities (60 | 11.3%), and science & technology (50 | 9.5%) are the most common fields of study among 529 individuals in Lake City borough who have obtained a bachelor's degree or higher.
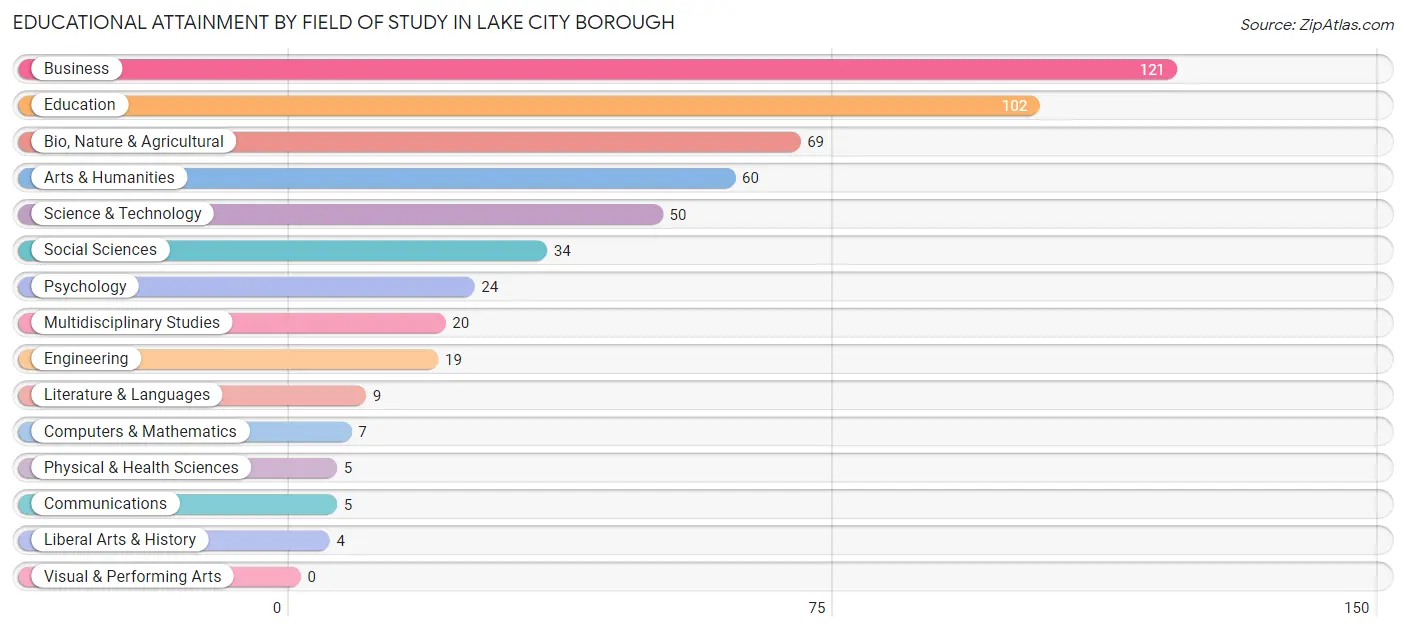
| Field of Study | # Graduates | % Graduates |
| Computers & Mathematics | 7 | 1.3% |
| Bio, Nature & Agricultural | 69 | 13.0% |
| Physical & Health Sciences | 5 | 0.9% |
| Psychology | 24 | 4.5% |
| Social Sciences | 34 | 6.4% |
| Engineering | 19 | 3.6% |
| Multidisciplinary Studies | 20 | 3.8% |
| Science & Technology | 50 | 9.5% |
| Business | 121 | 22.9% |
| Education | 102 | 19.3% |
| Literature & Languages | 9 | 1.7% |
| Liberal Arts & History | 4 | 0.8% |
| Visual & Performing Arts | 0 | 0.0% |
| Communications | 5 | 0.9% |
| Arts & Humanities | 60 | 11.3% |
| Total | 529 | 100.0% |
Transportation & Commute in Lake City borough
Vehicle Availability by Sex in Lake City borough
The most prevalent vehicle ownership categories in Lake City borough are males with 2 vehicles (474, accounting for 60.2%) and females with 2 vehicles (451, making up 68.3%).
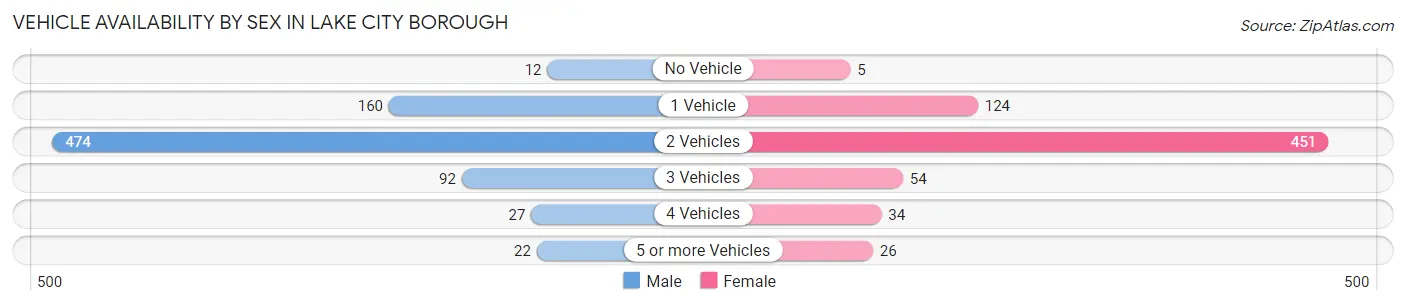
| Vehicles Available | Male | Female |
| No Vehicle | 12 (1.5%) | 5 (0.7%) |
| 1 Vehicle | 160 (20.3%) | 124 (17.9%) |
| 2 Vehicles | 474 (60.2%) | 451 (65.0%) |
| 3 Vehicles | 92 (11.7%) | 54 (7.8%) |
| 4 Vehicles | 27 (3.4%) | 34 (4.9%) |
| 5 or more Vehicles | 22 (2.8%) | 26 (3.7%) |
| Total | 787 (100.0%) | 694 (100.0%) |
Commute Time in Lake City borough
The most frequently occuring commute durations in Lake City borough are 20 to 24 minutes (244 commuters, 17.1%), 5 to 9 minutes (222 commuters, 15.6%), and 10 to 14 minutes (219 commuters, 15.4%).
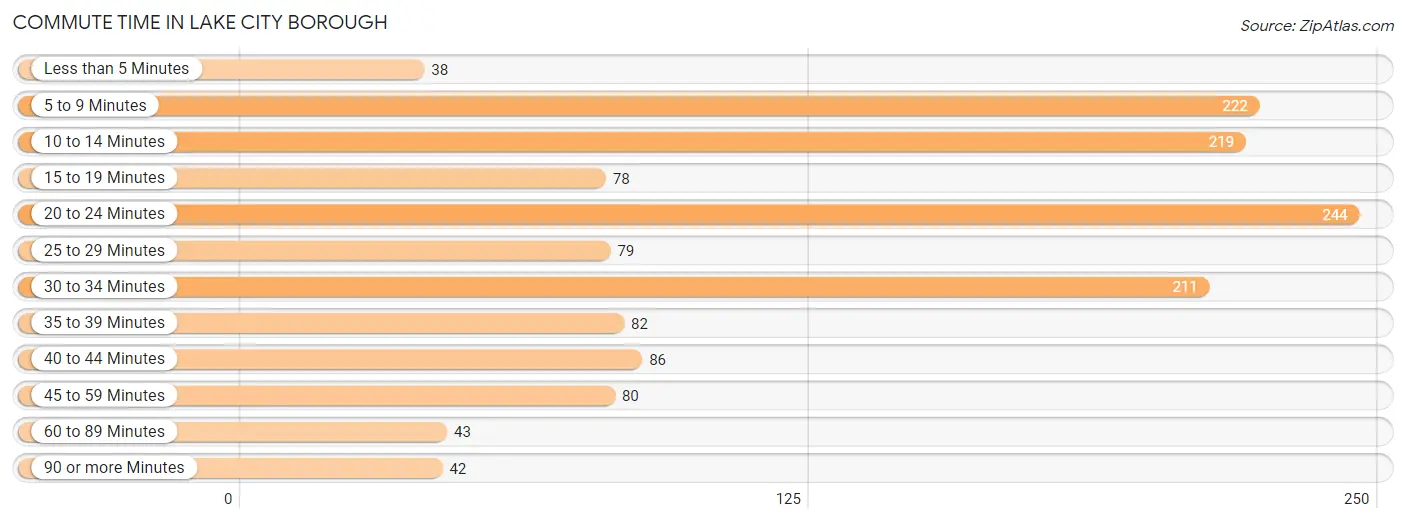
| Commute Time | # Commuters | % Commuters |
| Less than 5 Minutes | 38 | 2.7% |
| 5 to 9 Minutes | 222 | 15.6% |
| 10 to 14 Minutes | 219 | 15.4% |
| 15 to 19 Minutes | 78 | 5.5% |
| 20 to 24 Minutes | 244 | 17.1% |
| 25 to 29 Minutes | 79 | 5.6% |
| 30 to 34 Minutes | 211 | 14.8% |
| 35 to 39 Minutes | 82 | 5.8% |
| 40 to 44 Minutes | 86 | 6.0% |
| 45 to 59 Minutes | 80 | 5.6% |
| 60 to 89 Minutes | 43 | 3.0% |
| 90 or more Minutes | 42 | 2.9% |
Commute Time by Sex in Lake City borough
The most common commute times in Lake City borough are 10 to 14 minutes (164 commuters, 20.9%) for males and 20 to 24 minutes (151 commuters, 23.6%) for females.
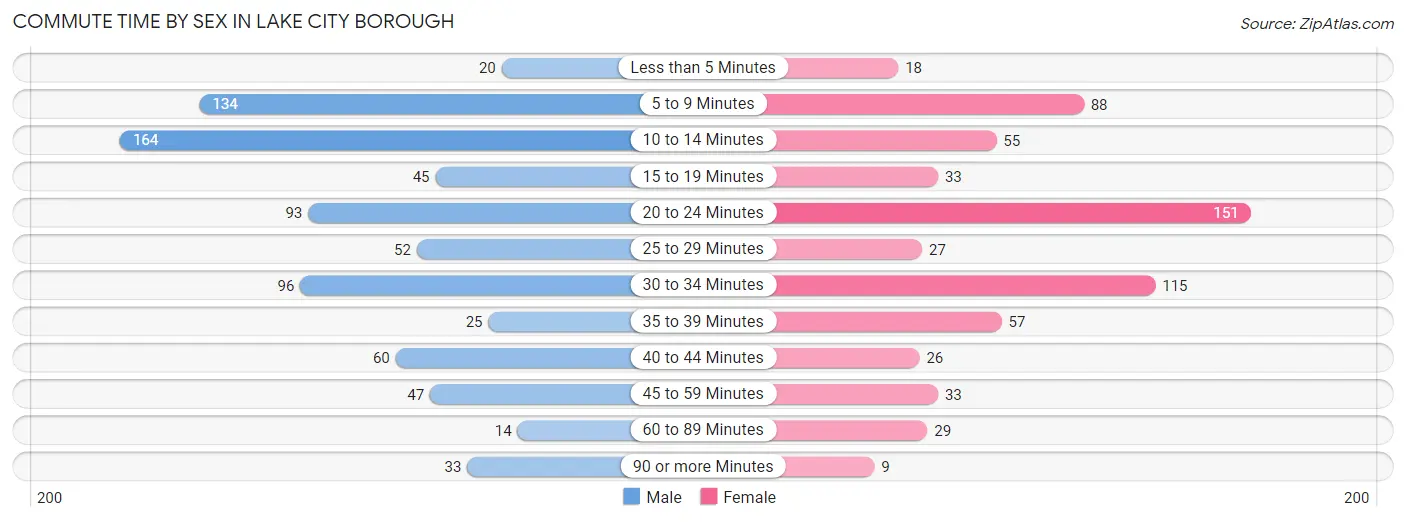
| Commute Time | Male | Female |
| Less than 5 Minutes | 20 (2.5%) | 18 (2.8%) |
| 5 to 9 Minutes | 134 (17.1%) | 88 (13.7%) |
| 10 to 14 Minutes | 164 (20.9%) | 55 (8.6%) |
| 15 to 19 Minutes | 45 (5.8%) | 33 (5.1%) |
| 20 to 24 Minutes | 93 (11.9%) | 151 (23.6%) |
| 25 to 29 Minutes | 52 (6.6%) | 27 (4.2%) |
| 30 to 34 Minutes | 96 (12.3%) | 115 (17.9%) |
| 35 to 39 Minutes | 25 (3.2%) | 57 (8.9%) |
| 40 to 44 Minutes | 60 (7.7%) | 26 (4.1%) |
| 45 to 59 Minutes | 47 (6.0%) | 33 (5.1%) |
| 60 to 89 Minutes | 14 (1.8%) | 29 (4.5%) |
| 90 or more Minutes | 33 (4.2%) | 9 (1.4%) |
Time of Departure to Work by Sex in Lake City borough
The most frequent times of departure to work in Lake City borough are 7:00 AM to 7:29 AM (209, 26.7%) for males and 7:00 AM to 7:29 AM (207, 32.3%) for females.
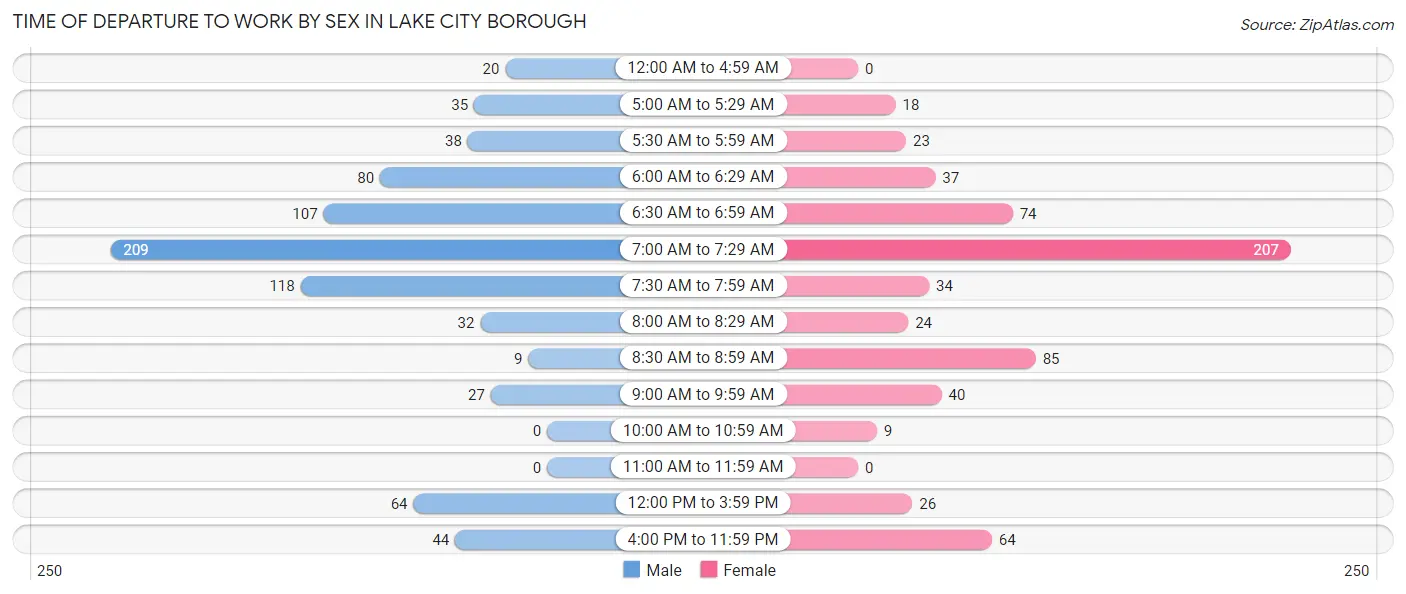
| Time of Departure | Male | Female |
| 12:00 AM to 4:59 AM | 20 (2.5%) | 0 (0.0%) |
| 5:00 AM to 5:29 AM | 35 (4.5%) | 18 (2.8%) |
| 5:30 AM to 5:59 AM | 38 (4.9%) | 23 (3.6%) |
| 6:00 AM to 6:29 AM | 80 (10.2%) | 37 (5.8%) |
| 6:30 AM to 6:59 AM | 107 (13.7%) | 74 (11.5%) |
| 7:00 AM to 7:29 AM | 209 (26.7%) | 207 (32.3%) |
| 7:30 AM to 7:59 AM | 118 (15.1%) | 34 (5.3%) |
| 8:00 AM to 8:29 AM | 32 (4.1%) | 24 (3.7%) |
| 8:30 AM to 8:59 AM | 9 (1.1%) | 85 (13.3%) |
| 9:00 AM to 9:59 AM | 27 (3.5%) | 40 (6.2%) |
| 10:00 AM to 10:59 AM | 0 (0.0%) | 9 (1.4%) |
| 11:00 AM to 11:59 AM | 0 (0.0%) | 0 (0.0%) |
| 12:00 PM to 3:59 PM | 64 (8.2%) | 26 (4.1%) |
| 4:00 PM to 11:59 PM | 44 (5.6%) | 64 (10.0%) |
| Total | 783 (100.0%) | 641 (100.0%) |
Housing Occupancy in Lake City borough
Occupancy by Ownership in Lake City borough
Of the total 1,057 dwellings in Lake City borough, owner-occupied units account for 925 (87.5%), while renter-occupied units make up 132 (12.5%).
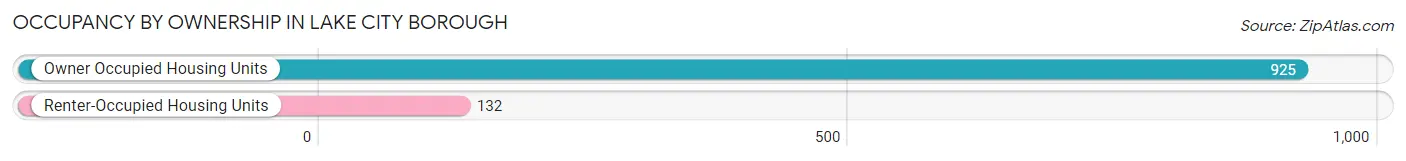
| Occupancy | # Housing Units | % Housing Units |
| Owner Occupied Housing Units | 925 | 87.5% |
| Renter-Occupied Housing Units | 132 | 12.5% |
| Total Occupied Housing Units | 1,057 | 100.0% |
Occupancy by Household Size in Lake City borough
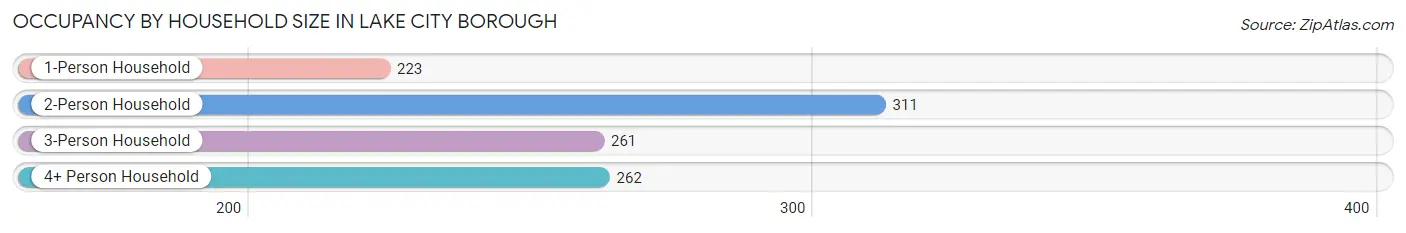
| Household Size | # Housing Units | % Housing Units |
| 1-Person Household | 223 | 21.1% |
| 2-Person Household | 311 | 29.4% |
| 3-Person Household | 261 | 24.7% |
| 4+ Person Household | 262 | 24.8% |
| Total Housing Units | 1,057 | 100.0% |
Occupancy by Ownership by Household Size in Lake City borough
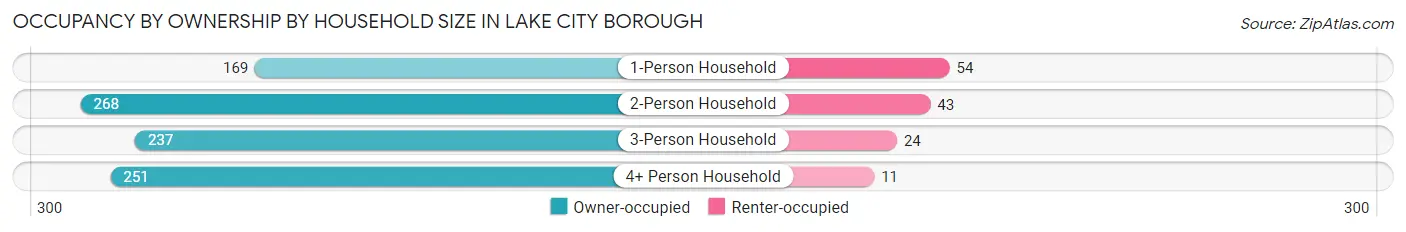
| Household Size | Owner-occupied | Renter-occupied |
| 1-Person Household | 169 (75.8%) | 54 (24.2%) |
| 2-Person Household | 268 (86.2%) | 43 (13.8%) |
| 3-Person Household | 237 (90.8%) | 24 (9.2%) |
| 4+ Person Household | 251 (95.8%) | 11 (4.2%) |
| Total Housing Units | 925 (87.5%) | 132 (12.5%) |
Occupancy by Educational Attainment in Lake City borough
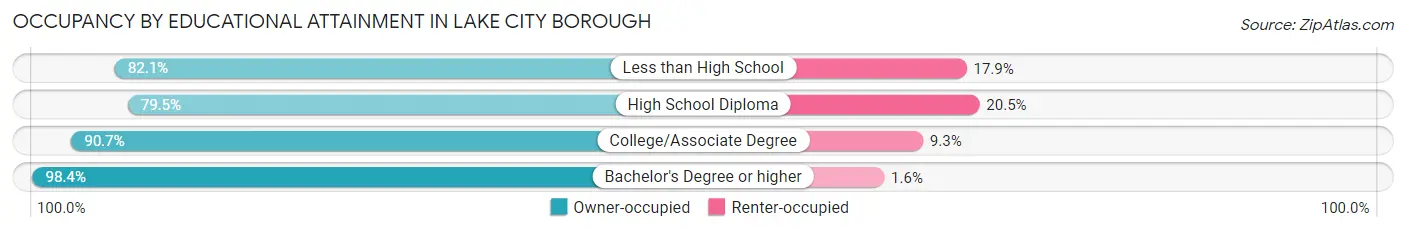
| Household Size | Owner-occupied | Renter-occupied |
| Less than High School | 55 (82.1%) | 12 (17.9%) |
| High School Diploma | 373 (79.5%) | 96 (20.5%) |
| College/Associate Degree | 186 (90.7%) | 19 (9.3%) |
| Bachelor's Degree or higher | 311 (98.4%) | 5 (1.6%) |
Occupancy by Age of Householder in Lake City borough
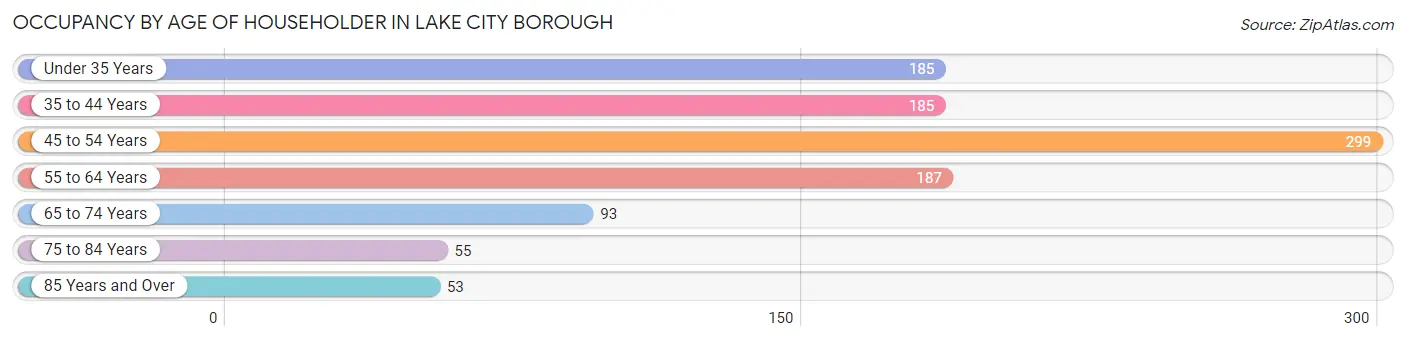
| Age Bracket | # Households | % Households |
| Under 35 Years | 185 | 17.5% |
| 35 to 44 Years | 185 | 17.5% |
| 45 to 54 Years | 299 | 28.3% |
| 55 to 64 Years | 187 | 17.7% |
| 65 to 74 Years | 93 | 8.8% |
| 75 to 84 Years | 55 | 5.2% |
| 85 Years and Over | 53 | 5.0% |
| Total | 1,057 | 100.0% |
Housing Finances in Lake City borough
Median Income by Occupancy in Lake City borough
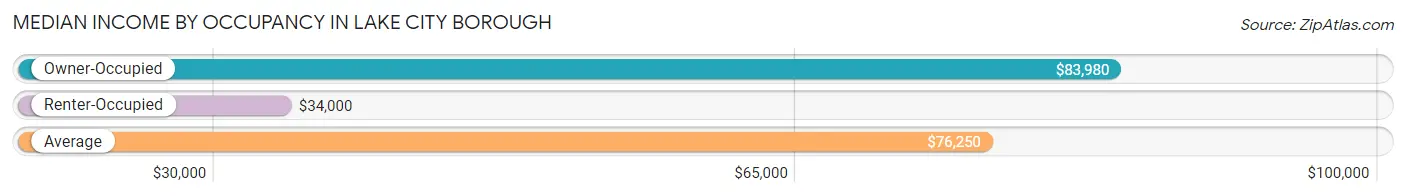
| Occupancy Type | # Households | Median Income |
| Owner-Occupied | 925 (87.5%) | $83,980 |
| Renter-Occupied | 132 (12.5%) | $34,000 |
| Average | 1,057 (100.0%) | $76,250 |
Occupancy by Householder Income Bracket in Lake City borough
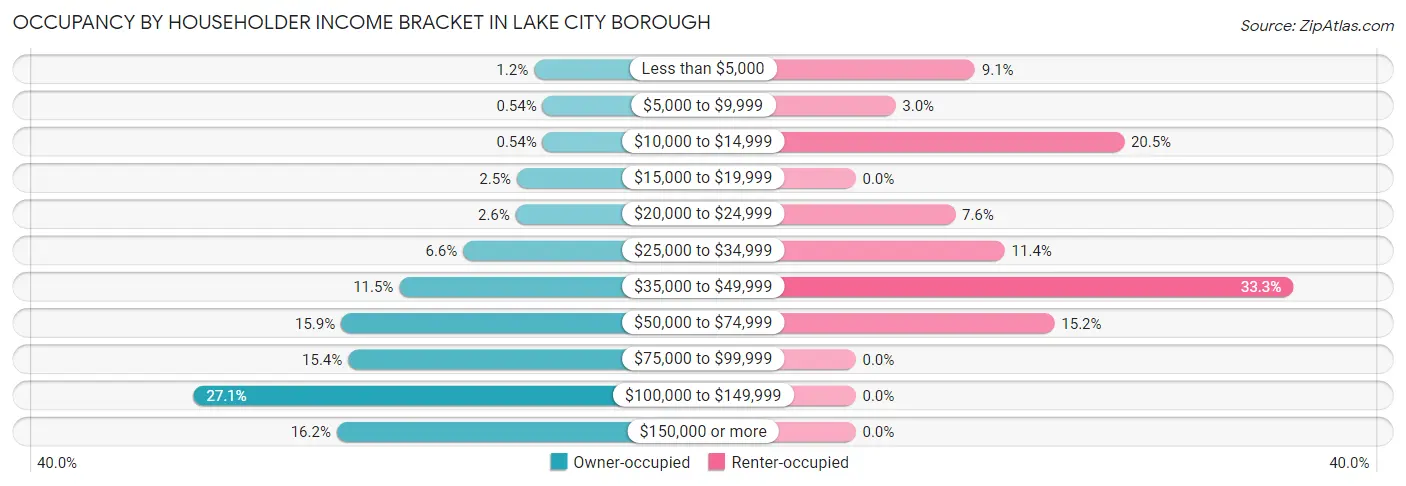
| Income Bracket | Owner-occupied | Renter-occupied |
| Less than $5,000 | 11 (1.2%) | 12 (9.1%) |
| $5,000 to $9,999 | 5 (0.5%) | 4 (3.0%) |
| $10,000 to $14,999 | 5 (0.5%) | 27 (20.4%) |
| $15,000 to $19,999 | 23 (2.5%) | 0 (0.0%) |
| $20,000 to $24,999 | 24 (2.6%) | 10 (7.6%) |
| $25,000 to $34,999 | 61 (6.6%) | 15 (11.4%) |
| $35,000 to $49,999 | 106 (11.5%) | 44 (33.3%) |
| $50,000 to $74,999 | 147 (15.9%) | 20 (15.1%) |
| $75,000 to $99,999 | 142 (15.3%) | 0 (0.0%) |
| $100,000 to $149,999 | 251 (27.1%) | 0 (0.0%) |
| $150,000 or more | 150 (16.2%) | 0 (0.0%) |
| Total | 925 (100.0%) | 132 (100.0%) |
Monthly Housing Cost Tiers in Lake City borough
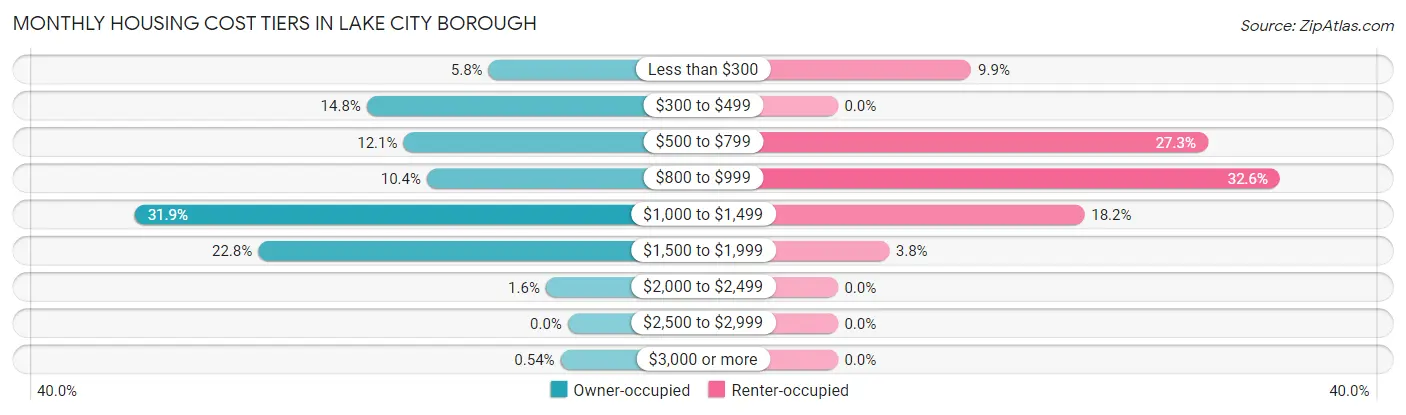
| Monthly Cost | Owner-occupied | Renter-occupied |
| Less than $300 | 54 (5.8%) | 13 (9.9%) |
| $300 to $499 | 137 (14.8%) | 0 (0.0%) |
| $500 to $799 | 112 (12.1%) | 36 (27.3%) |
| $800 to $999 | 96 (10.4%) | 43 (32.6%) |
| $1,000 to $1,499 | 295 (31.9%) | 24 (18.2%) |
| $1,500 to $1,999 | 211 (22.8%) | 5 (3.8%) |
| $2,000 to $2,499 | 15 (1.6%) | 0 (0.0%) |
| $2,500 to $2,999 | 0 (0.0%) | 0 (0.0%) |
| $3,000 or more | 5 (0.5%) | 0 (0.0%) |
| Total | 925 (100.0%) | 132 (100.0%) |
Physical Housing Characteristics in Lake City borough
Housing Structures in Lake City borough
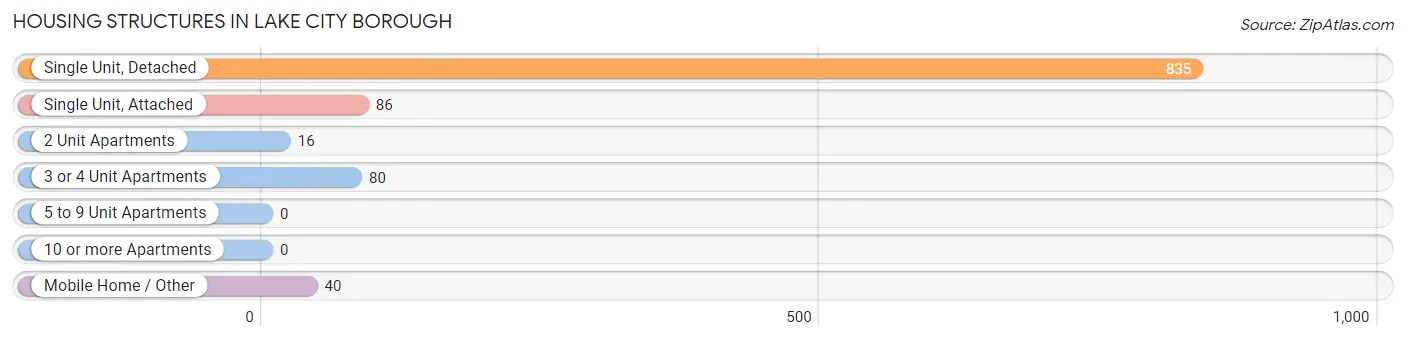
| Structure Type | # Housing Units | % Housing Units |
| Single Unit, Detached | 835 | 79.0% |
| Single Unit, Attached | 86 | 8.1% |
| 2 Unit Apartments | 16 | 1.5% |
| 3 or 4 Unit Apartments | 80 | 7.6% |
| 5 to 9 Unit Apartments | 0 | 0.0% |
| 10 or more Apartments | 0 | 0.0% |
| Mobile Home / Other | 40 | 3.8% |
| Total | 1,057 | 100.0% |
Housing Structures by Occupancy in Lake City borough
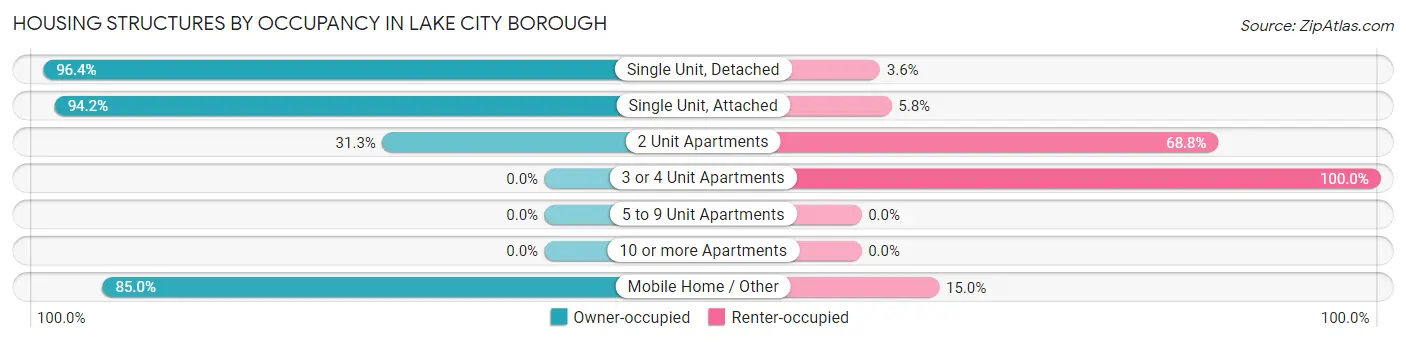
| Structure Type | Owner-occupied | Renter-occupied |
| Single Unit, Detached | 805 (96.4%) | 30 (3.6%) |
| Single Unit, Attached | 81 (94.2%) | 5 (5.8%) |
| 2 Unit Apartments | 5 (31.2%) | 11 (68.8%) |
| 3 or 4 Unit Apartments | 0 (0.0%) | 80 (100.0%) |
| 5 to 9 Unit Apartments | 0 (0.0%) | 0 (0.0%) |
| 10 or more Apartments | 0 (0.0%) | 0 (0.0%) |
| Mobile Home / Other | 34 (85.0%) | 6 (15.0%) |
| Total | 925 (87.5%) | 132 (12.5%) |
Housing Structures by Number of Rooms in Lake City borough
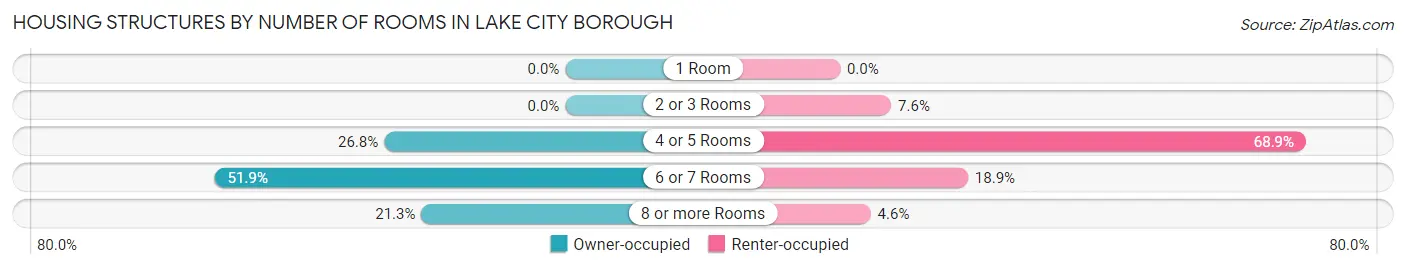
| Number of Rooms | Owner-occupied | Renter-occupied |
| 1 Room | 0 (0.0%) | 0 (0.0%) |
| 2 or 3 Rooms | 0 (0.0%) | 10 (7.6%) |
| 4 or 5 Rooms | 248 (26.8%) | 91 (68.9%) |
| 6 or 7 Rooms | 480 (51.9%) | 25 (18.9%) |
| 8 or more Rooms | 197 (21.3%) | 6 (4.5%) |
| Total | 925 (100.0%) | 132 (100.0%) |
Housing Structure by Heating Type in Lake City borough
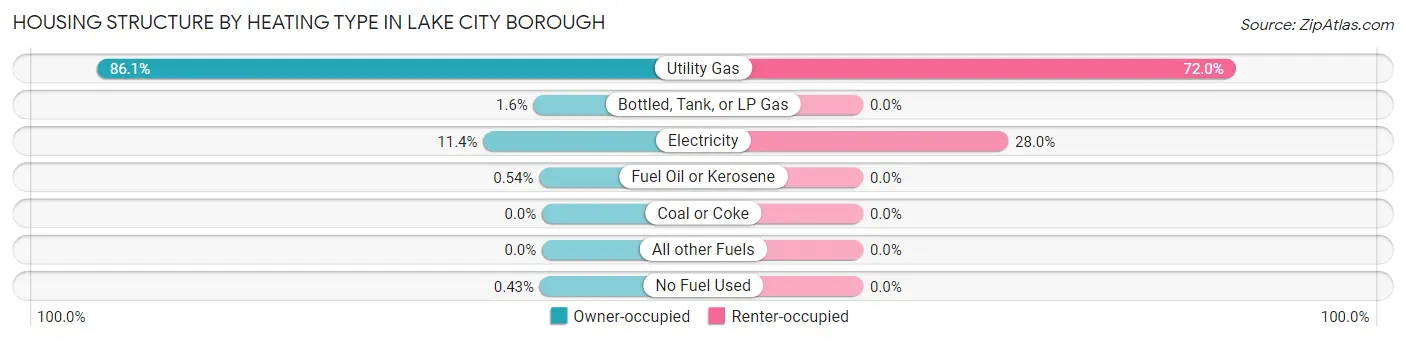
| Heating Type | Owner-occupied | Renter-occupied |
| Utility Gas | 796 (86.1%) | 95 (72.0%) |
| Bottled, Tank, or LP Gas | 15 (1.6%) | 0 (0.0%) |
| Electricity | 105 (11.4%) | 37 (28.0%) |
| Fuel Oil or Kerosene | 5 (0.5%) | 0 (0.0%) |
| Coal or Coke | 0 (0.0%) | 0 (0.0%) |
| All other Fuels | 0 (0.0%) | 0 (0.0%) |
| No Fuel Used | 4 (0.4%) | 0 (0.0%) |
| Total | 925 (100.0%) | 132 (100.0%) |
Household Vehicle Usage in Lake City borough
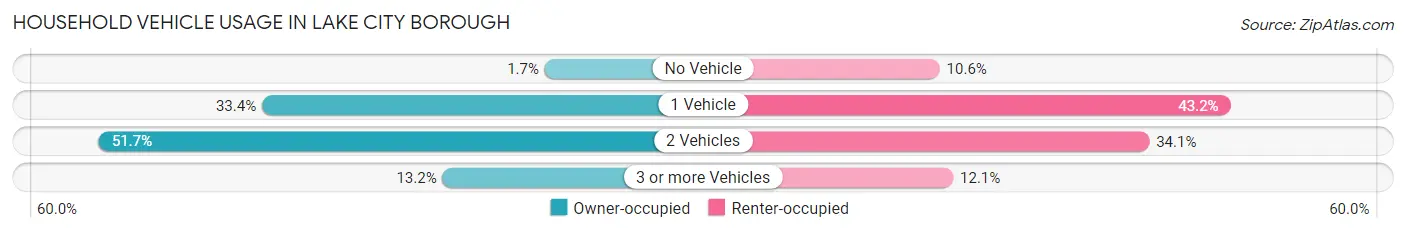
| Vehicles per Household | Owner-occupied | Renter-occupied |
| No Vehicle | 16 (1.7%) | 14 (10.6%) |
| 1 Vehicle | 309 (33.4%) | 57 (43.2%) |
| 2 Vehicles | 478 (51.7%) | 45 (34.1%) |
| 3 or more Vehicles | 122 (13.2%) | 16 (12.1%) |
| Total | 925 (100.0%) | 132 (100.0%) |
Real Estate & Mortgages in Lake City borough
Real Estate and Mortgage Overview in Lake City borough
| Characteristic | Without Mortgage | With Mortgage |
| Housing Units | 299 | 626 |
| Median Property Value | $113,100 | $158,200 |
| Median Household Income | $71,250 | $109 |
| Monthly Housing Costs | $442 | $5 |
| Real Estate Taxes | $1,630 | $15 |
Property Value by Mortgage Status in Lake City borough
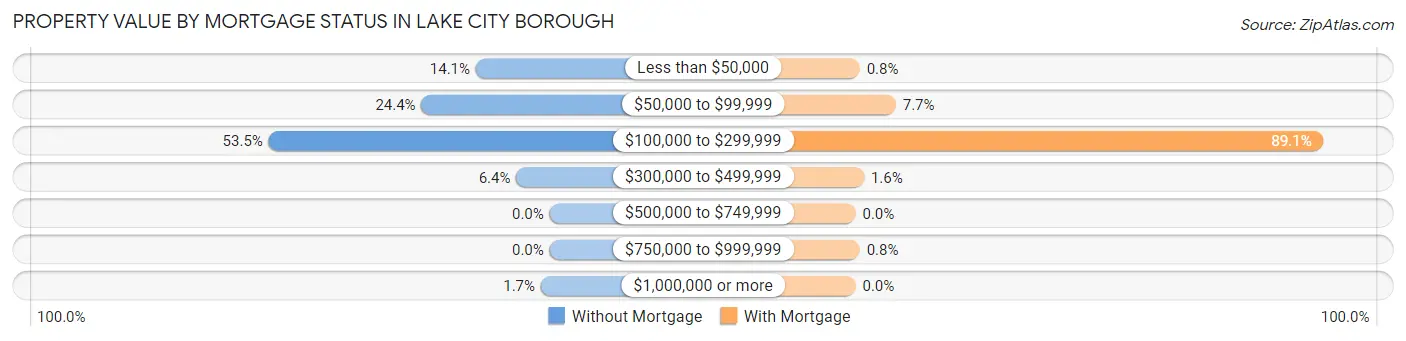
| Property Value | Without Mortgage | With Mortgage |
| Less than $50,000 | 42 (14.1%) | 5 (0.8%) |
| $50,000 to $99,999 | 73 (24.4%) | 48 (7.7%) |
| $100,000 to $299,999 | 160 (53.5%) | 558 (89.1%) |
| $300,000 to $499,999 | 19 (6.4%) | 10 (1.6%) |
| $500,000 to $749,999 | 0 (0.0%) | 0 (0.0%) |
| $750,000 to $999,999 | 0 (0.0%) | 5 (0.8%) |
| $1,000,000 or more | 5 (1.7%) | 0 (0.0%) |
| Total | 299 (100.0%) | 626 (100.0%) |
Household Income by Mortgage Status in Lake City borough
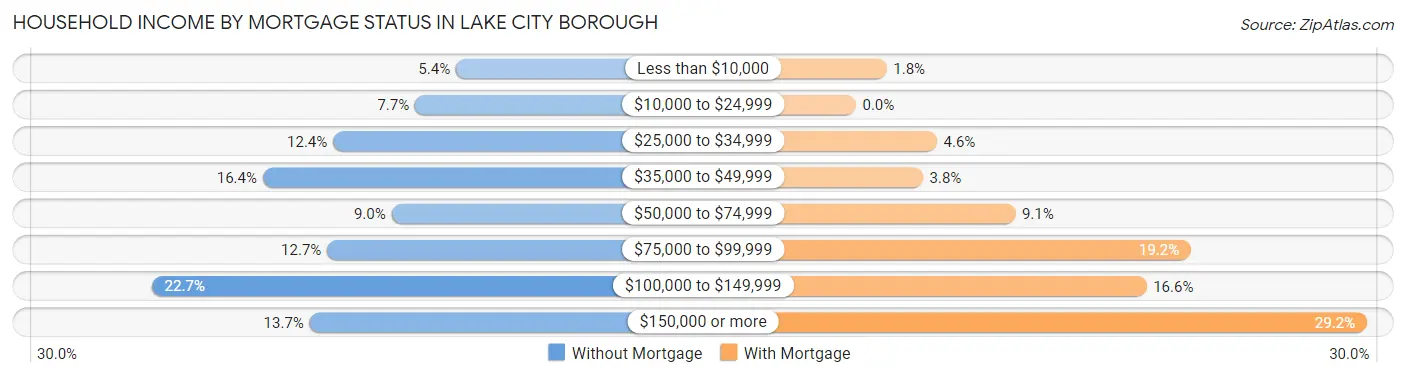
| Household Income | Without Mortgage | With Mortgage |
| Less than $10,000 | 16 (5.3%) | 11 (1.8%) |
| $10,000 to $24,999 | 23 (7.7%) | 0 (0.0%) |
| $25,000 to $34,999 | 37 (12.4%) | 29 (4.6%) |
| $35,000 to $49,999 | 49 (16.4%) | 24 (3.8%) |
| $50,000 to $74,999 | 27 (9.0%) | 57 (9.1%) |
| $75,000 to $99,999 | 38 (12.7%) | 120 (19.2%) |
| $100,000 to $149,999 | 68 (22.7%) | 104 (16.6%) |
| $150,000 or more | 41 (13.7%) | 183 (29.2%) |
| Total | 299 (100.0%) | 626 (100.0%) |
Property Value to Household Income Ratio in Lake City borough
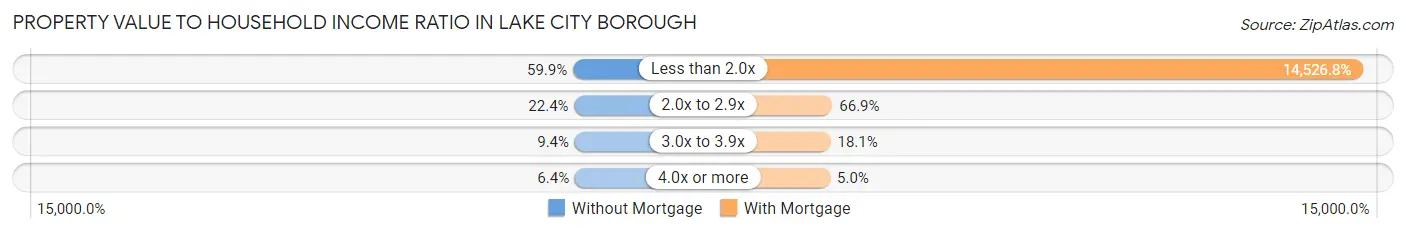
| Value-to-Income Ratio | Without Mortgage | With Mortgage |
| Less than 2.0x | 179 (59.9%) | 90,938 (14,526.8%) |
| 2.0x to 2.9x | 67 (22.4%) | 419 (66.9%) |
| 3.0x to 3.9x | 28 (9.4%) | 113 (18.0%) |
| 4.0x or more | 19 (6.4%) | 31 (5.0%) |
| Total | 299 (100.0%) | 626 (100.0%) |
Real Estate Taxes by Mortgage Status in Lake City borough
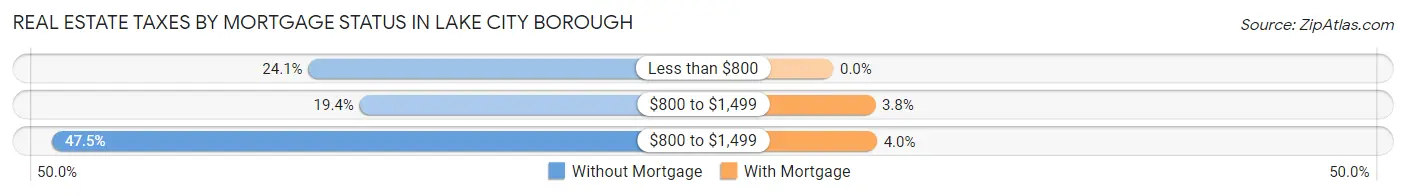
| Property Taxes | Without Mortgage | With Mortgage |
| Less than $800 | 72 (24.1%) | 0 (0.0%) |
| $800 to $1,499 | 58 (19.4%) | 24 (3.8%) |
| $800 to $1,499 | 142 (47.5%) | 25 (4.0%) |
| Total | 299 (100.0%) | 626 (100.0%) |
Health & Disability in Lake City borough
Health Insurance Coverage by Age in Lake City borough
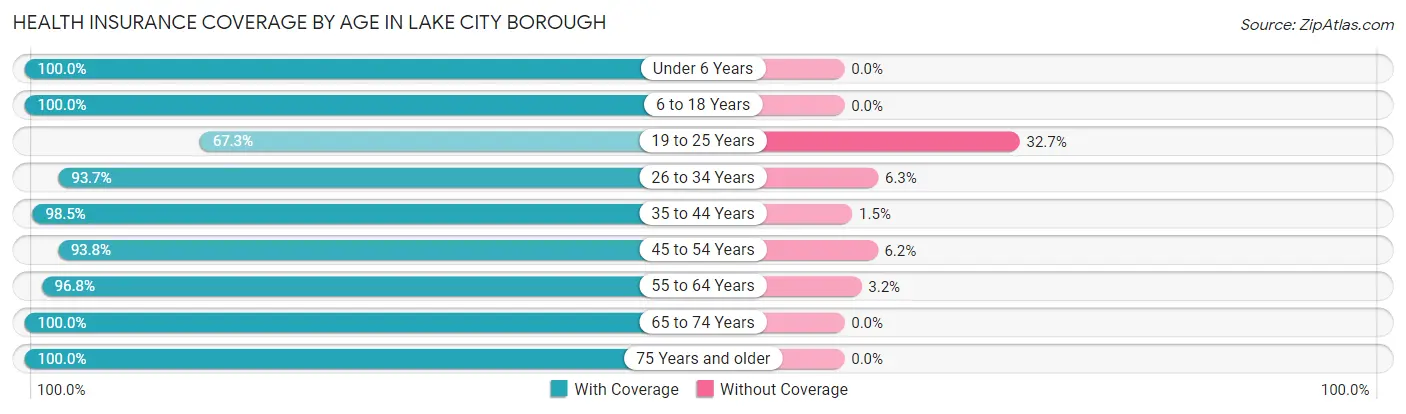
| Age Bracket | With Coverage | Without Coverage |
| Under 6 Years | 262 (100.0%) | 0 (0.0%) |
| 6 to 18 Years | 633 (100.0%) | 0 (0.0%) |
| 19 to 25 Years | 103 (67.3%) | 50 (32.7%) |
| 26 to 34 Years | 328 (93.7%) | 22 (6.3%) |
| 35 to 44 Years | 335 (98.5%) | 5 (1.5%) |
| 45 to 54 Years | 425 (93.8%) | 28 (6.2%) |
| 55 to 64 Years | 365 (96.8%) | 12 (3.2%) |
| 65 to 74 Years | 189 (100.0%) | 0 (0.0%) |
| 75 Years and older | 148 (100.0%) | 0 (0.0%) |
| Total | 2,788 (96.0%) | 117 (4.0%) |
Health Insurance Coverage by Citizenship Status in Lake City borough
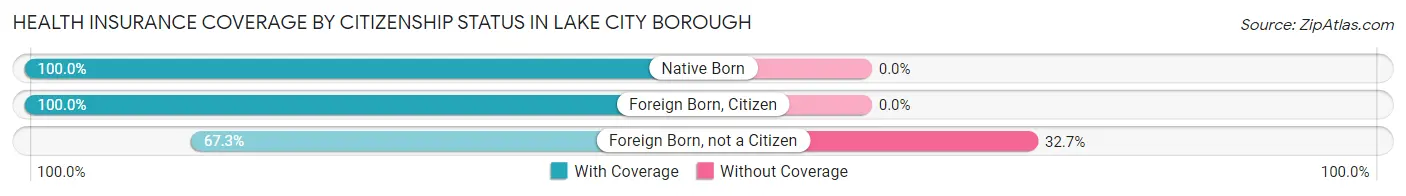
| Citizenship Status | With Coverage | Without Coverage |
| Native Born | 262 (100.0%) | 0 (0.0%) |
| Foreign Born, Citizen | 633 (100.0%) | 0 (0.0%) |
| Foreign Born, not a Citizen | 103 (67.3%) | 50 (32.7%) |
Health Insurance Coverage by Household Income in Lake City borough
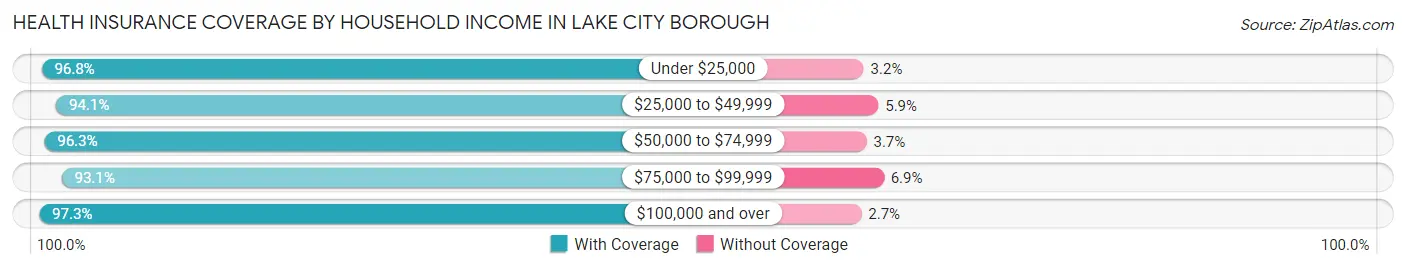
| Household Income | With Coverage | Without Coverage |
| Under $25,000 | 245 (96.8%) | 8 (3.2%) |
| $25,000 to $49,999 | 415 (94.1%) | 26 (5.9%) |
| $50,000 to $74,999 | 547 (96.3%) | 21 (3.7%) |
| $75,000 to $99,999 | 390 (93.1%) | 29 (6.9%) |
| $100,000 and over | 1,178 (97.3%) | 33 (2.7%) |
Public vs Private Health Insurance Coverage by Age in Lake City borough
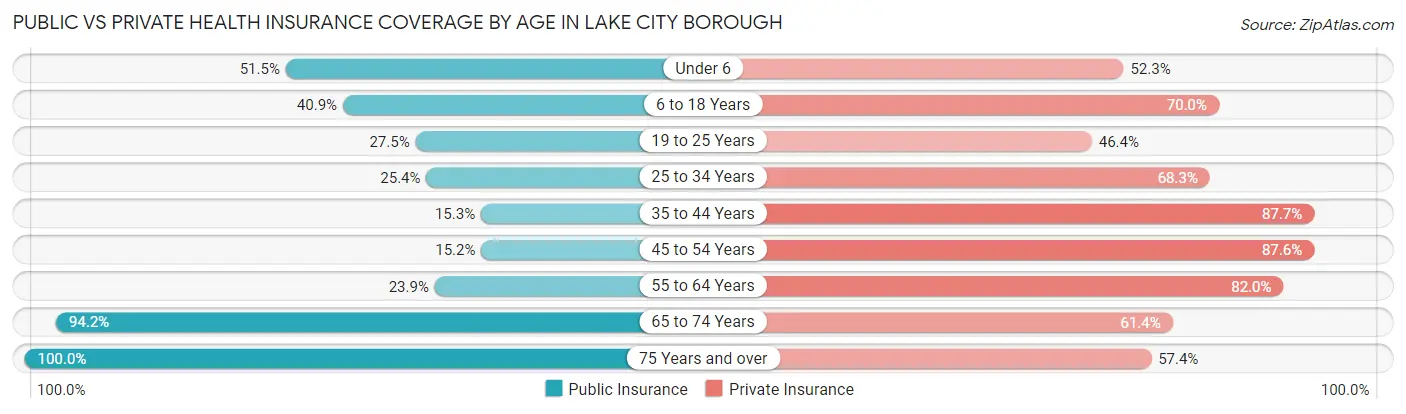
| Age Bracket | Public Insurance | Private Insurance |
| Under 6 | 135 (51.5%) | 137 (52.3%) |
| 6 to 18 Years | 259 (40.9%) | 443 (70.0%) |
| 19 to 25 Years | 42 (27.5%) | 71 (46.4%) |
| 25 to 34 Years | 89 (25.4%) | 239 (68.3%) |
| 35 to 44 Years | 52 (15.3%) | 298 (87.6%) |
| 45 to 54 Years | 69 (15.2%) | 397 (87.6%) |
| 55 to 64 Years | 90 (23.9%) | 309 (82.0%) |
| 65 to 74 Years | 178 (94.2%) | 116 (61.4%) |
| 75 Years and over | 148 (100.0%) | 85 (57.4%) |
| Total | 1,062 (36.6%) | 2,095 (72.1%) |
Disability Status by Sex by Age in Lake City borough
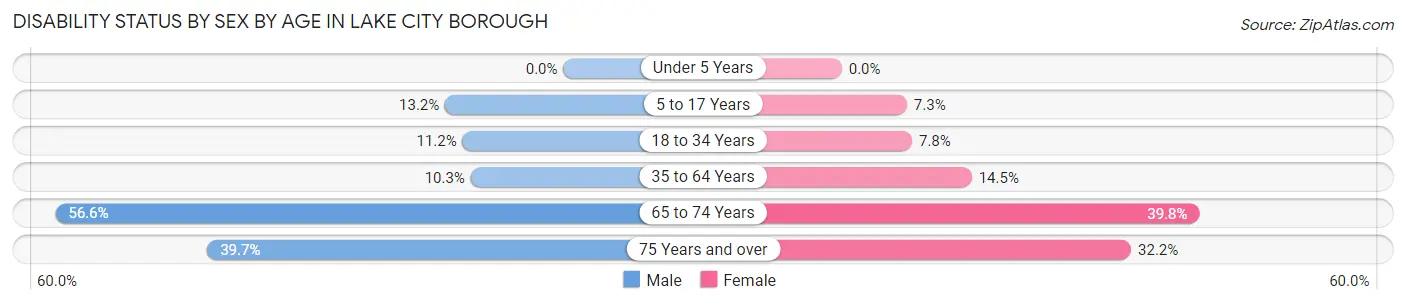
| Age Bracket | Male | Female |
| Under 5 Years | 0 (0.0%) | 0 (0.0%) |
| 5 to 17 Years | 37 (13.2%) | 25 (7.2%) |
| 18 to 34 Years | 41 (11.2%) | 19 (7.8%) |
| 35 to 64 Years | 58 (10.3%) | 88 (14.5%) |
| 65 to 74 Years | 43 (56.6%) | 45 (39.8%) |
| 75 Years and over | 23 (39.7%) | 29 (32.2%) |
Disability Class by Sex by Age in Lake City borough
Disability Class: Hearing Difficulty
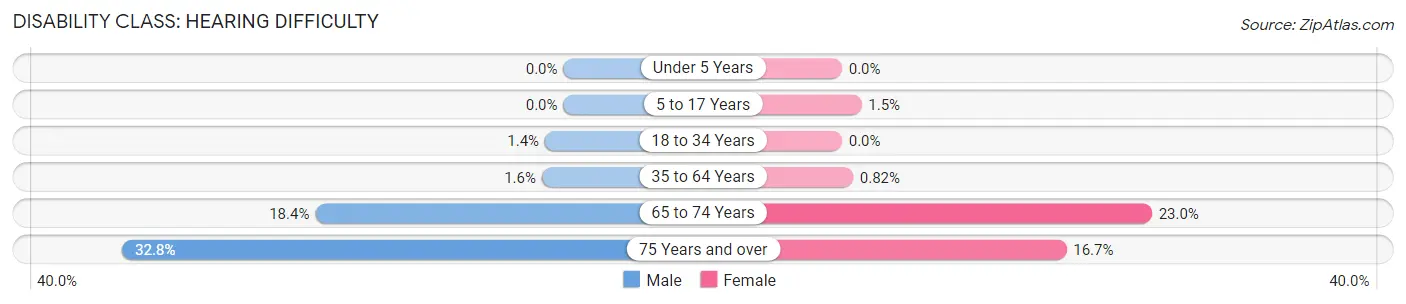
| Age Bracket | Male | Female |
| Under 5 Years | 0 (0.0%) | 0 (0.0%) |
| 5 to 17 Years | 0 (0.0%) | 5 (1.5%) |
| 18 to 34 Years | 5 (1.4%) | 0 (0.0%) |
| 35 to 64 Years | 9 (1.6%) | 5 (0.8%) |
| 65 to 74 Years | 14 (18.4%) | 26 (23.0%) |
| 75 Years and over | 19 (32.8%) | 15 (16.7%) |
Disability Class: Vision Difficulty
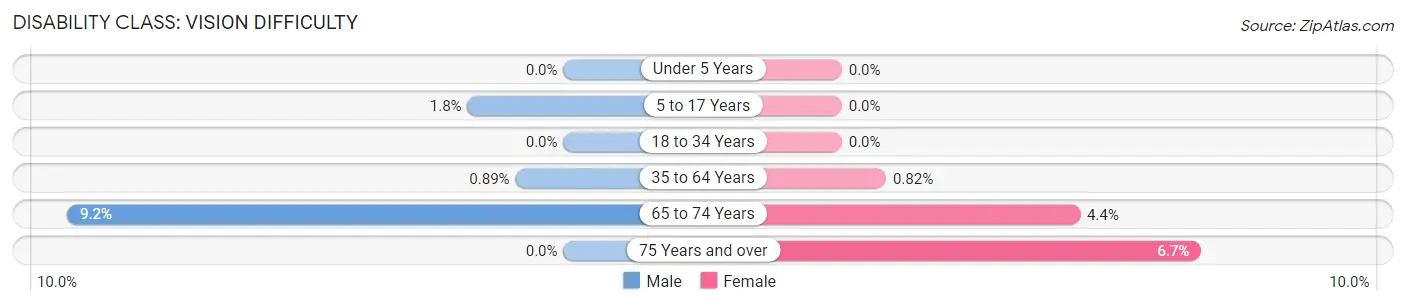
| Age Bracket | Male | Female |
| Under 5 Years | 0 (0.0%) | 0 (0.0%) |
| 5 to 17 Years | 5 (1.8%) | 0 (0.0%) |
| 18 to 34 Years | 0 (0.0%) | 0 (0.0%) |
| 35 to 64 Years | 5 (0.9%) | 5 (0.8%) |
| 65 to 74 Years | 7 (9.2%) | 5 (4.4%) |
| 75 Years and over | 0 (0.0%) | 6 (6.7%) |
Disability Class: Cognitive Difficulty
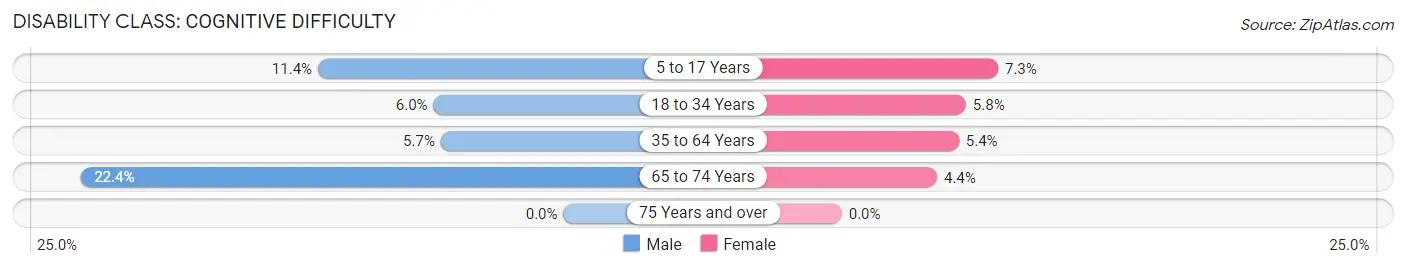
| Age Bracket | Male | Female |
| 5 to 17 Years | 32 (11.4%) | 25 (7.2%) |
| 18 to 34 Years | 22 (6.0%) | 14 (5.8%) |
| 35 to 64 Years | 32 (5.7%) | 33 (5.4%) |
| 65 to 74 Years | 17 (22.4%) | 5 (4.4%) |
| 75 Years and over | 0 (0.0%) | 0 (0.0%) |
Disability Class: Ambulatory Difficulty
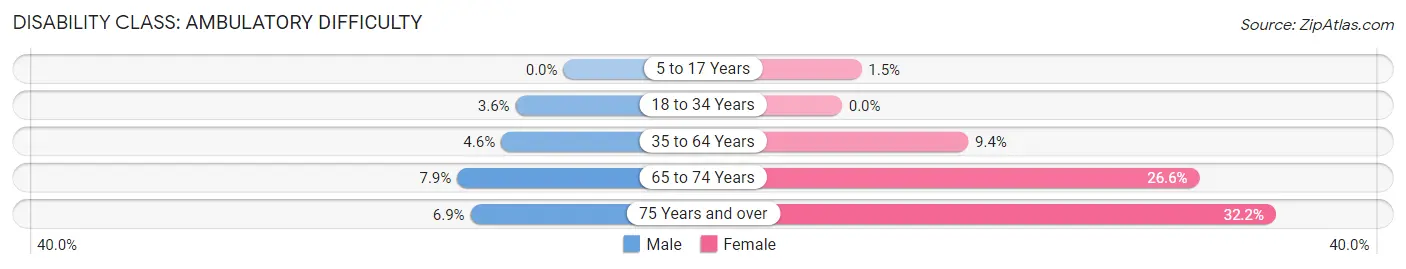
| Age Bracket | Male | Female |
| 5 to 17 Years | 0 (0.0%) | 5 (1.5%) |
| 18 to 34 Years | 13 (3.6%) | 0 (0.0%) |
| 35 to 64 Years | 26 (4.6%) | 57 (9.4%) |
| 65 to 74 Years | 6 (7.9%) | 30 (26.6%) |
| 75 Years and over | 4 (6.9%) | 29 (32.2%) |
Disability Class: Self-Care Difficulty
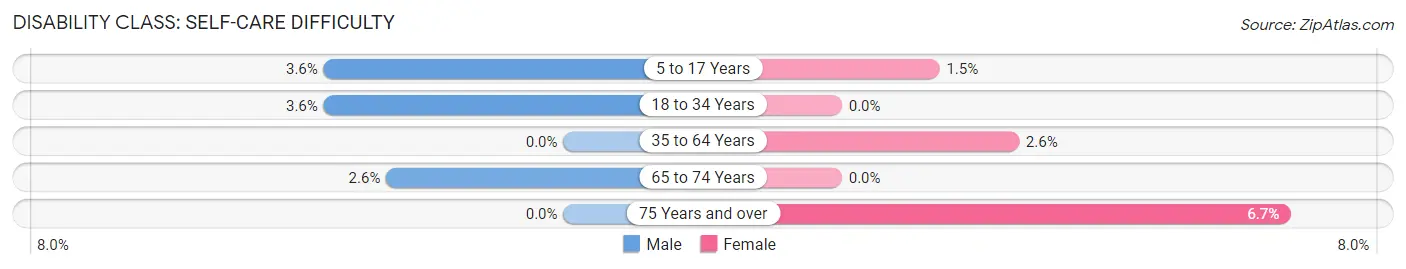
| Age Bracket | Male | Female |
| 5 to 17 Years | 10 (3.6%) | 5 (1.5%) |
| 18 to 34 Years | 13 (3.6%) | 0 (0.0%) |
| 35 to 64 Years | 0 (0.0%) | 16 (2.6%) |
| 65 to 74 Years | 2 (2.6%) | 0 (0.0%) |
| 75 Years and over | 0 (0.0%) | 6 (6.7%) |
Technology Access in Lake City borough
Computing Device Access in Lake City borough
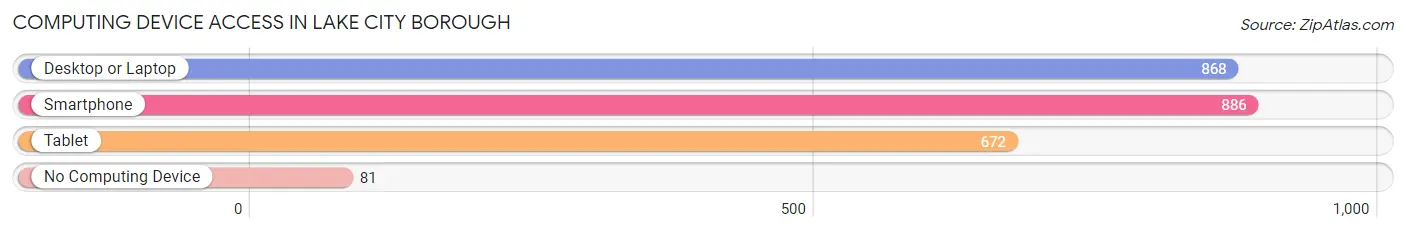
| Device Type | # Households | % Households |
| Desktop or Laptop | 868 | 82.1% |
| Smartphone | 886 | 83.8% |
| Tablet | 672 | 63.6% |
| No Computing Device | 81 | 7.7% |
| Total | 1,057 | 100.0% |
Internet Access in Lake City borough
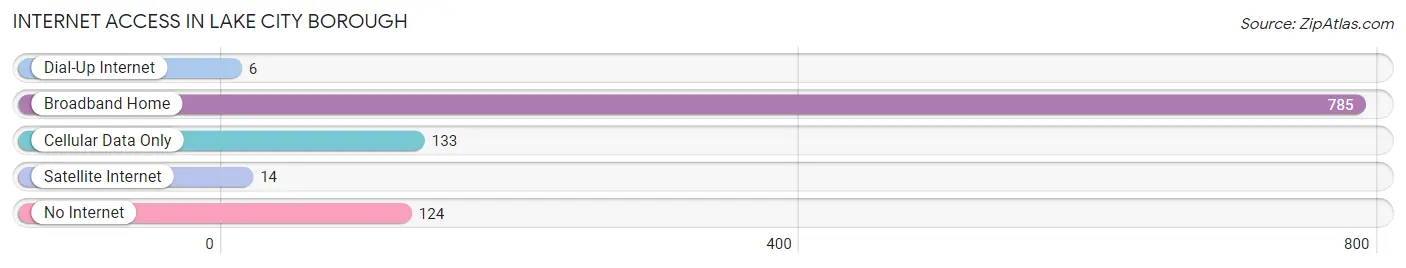
| Internet Type | # Households | % Households |
| Dial-Up Internet | 6 | 0.6% |
| Broadband Home | 785 | 74.3% |
| Cellular Data Only | 133 | 12.6% |
| Satellite Internet | 14 | 1.3% |
| No Internet | 124 | 11.7% |
| Total | 1,057 | 100.0% |
Lake City borough Summary
Introduction
Located in the northwest corner of Pennsylvania, Lake City Borough is a small borough in Erie County. It is situated on the banks of Lake Erie and is part of the Erie Metropolitan Statistical Area. The borough has a population of 1,845 people, according to the 2010 census. The borough is known for its beautiful lakefront views and its small-town charm.
History
The area that is now Lake City Borough was first settled in the early 1800s by a group of settlers from New England. The settlers were attracted to the area by its abundance of natural resources, including timber, fish, and game. The first permanent settlement was established in 1818, and the area was officially incorporated as a borough in 1851.
The borough was originally known as "Lake City," but the name was changed to "Lake City Borough" in 1875. The name change was made to distinguish the borough from the nearby city of Erie.
The borough was an important port for the lumber industry in the late 19th and early 20th centuries. The lumber industry was the primary source of employment for the residents of the borough. The lumber industry declined in the mid-20th century, and the borough's economy shifted to tourism and recreation.
Geography
Lake City Borough is located in the northwest corner of Pennsylvania, on the banks of Lake Erie. The borough is bordered by the city of Erie to the east, and by the townships of Millcreek and Harborcreek to the south and west, respectively. The borough covers an area of 1.2 square miles, and has a population of 1,845 people, according to the 2010 census.
The borough is situated on a peninsula, with Lake Erie to the north and east, and the Millcreek and Harborcreek townships to the south and west, respectively. The borough is home to several parks and recreational areas, including Lake City Park, which offers a beach, picnic areas, and a playground.
Economy
The economy of Lake City Borough is largely based on tourism and recreation. The borough is home to several parks and recreational areas, including Lake City Park, which offers a beach, picnic areas, and a playground. The borough is also home to several marinas, which offer boat rentals and other services.
The borough is also home to several small businesses, including restaurants, retail stores, and professional services. The borough is served by the Erie International Airport, which is located just outside of the borough limits.
Demographics
According to the 2010 census, the population of Lake City Borough was 1,845 people. The racial makeup of the borough was 95.3% White, 1.2% African American, 0.7% Native American, 0.7% Asian, 0.2% Pacific Islander, and 1.9% from other races. Hispanic or Latino of any race were 2.2% of the population.
The median household income in the borough was $41,250, and the median family income was $50,000. The per capita income in the borough was $20,945. About 11.2% of the population was below the poverty line.
Conclusion
Lake City Borough is a small borough in Erie County, Pennsylvania. It is situated on the banks of Lake Erie and is part of the Erie Metropolitan Statistical Area. The borough has a population of 1,845 people, according to the 2010 census. The borough is known for its beautiful lakefront views and its small-town charm. The economy of the borough is largely based on tourism and recreation, and the borough is home to several parks and recreational areas. The racial makeup of the borough is predominantly White, with a small percentage of African American, Native American, Asian, and Pacific Islander residents. The median household income in the borough is $41,250, and the per capita income is $20,945.
Common Questions
What is Per Capita Income in Lake City borough?
Per Capita income in Lake City borough is $31,467.
What is the Median Family Income in Lake City borough?
Median Family Income in Lake City borough is $73,482.
What is the Median Household income in Lake City borough?
Median Household Income in Lake City borough is $76,250.
What is Income or Wage Gap in Lake City borough?
Income or Wage Gap in Lake City borough is 19.1%.
Women in Lake City borough earn 80.9 cents for every dollar earned by a man.
What is Family Income Deficit in Lake City borough?
Family Income Deficit in Lake City borough is $12,705.
Families that are below poverty line in Lake City borough earn $12,705 less on average than the poverty threshold level.
What is Inequality or Gini Index in Lake City borough?
Inequality or Gini Index in Lake City borough is 0.35.
What is the Total Population of Lake City borough?
Total Population of Lake City borough is 2,925.
What is the Total Male Population of Lake City borough?
Total Male Population of Lake City borough is 1,434.
What is the Total Female Population of Lake City borough?
Total Female Population of Lake City borough is 1,491.
What is the Ratio of Males per 100 Females in Lake City borough?
There are 96.18 Males per 100 Females in Lake City borough.
What is the Ratio of Females per 100 Males in Lake City borough?
There are 103.97 Females per 100 Males in Lake City borough.
What is the Median Population Age in Lake City borough?
Median Population Age in Lake City borough is 36.3 Years.
What is the Average Family Size in Lake City borough
Average Family Size in Lake City borough is 3.1 People.
What is the Average Household Size in Lake City borough
Average Household Size in Lake City borough is 2.8 People.
How Large is the Labor Force in Lake City borough?
There are 1,548 People in the Labor Forcein in Lake City borough.
What is the Percentage of People in the Labor Force in Lake City borough?
68.4% of People are in the Labor Force in Lake City borough.
What is the Unemployment Rate in Lake City borough?
Unemployment Rate in Lake City borough is 3.2%.