Zip Codes with the Highest Percentage of Population Employed in Life, Physical & Social Science in Philadelphia, PA
RELATED REPORTS & OPTIONS
Life, Physical & Social Science
Philadelphia
Compare Zip Codes
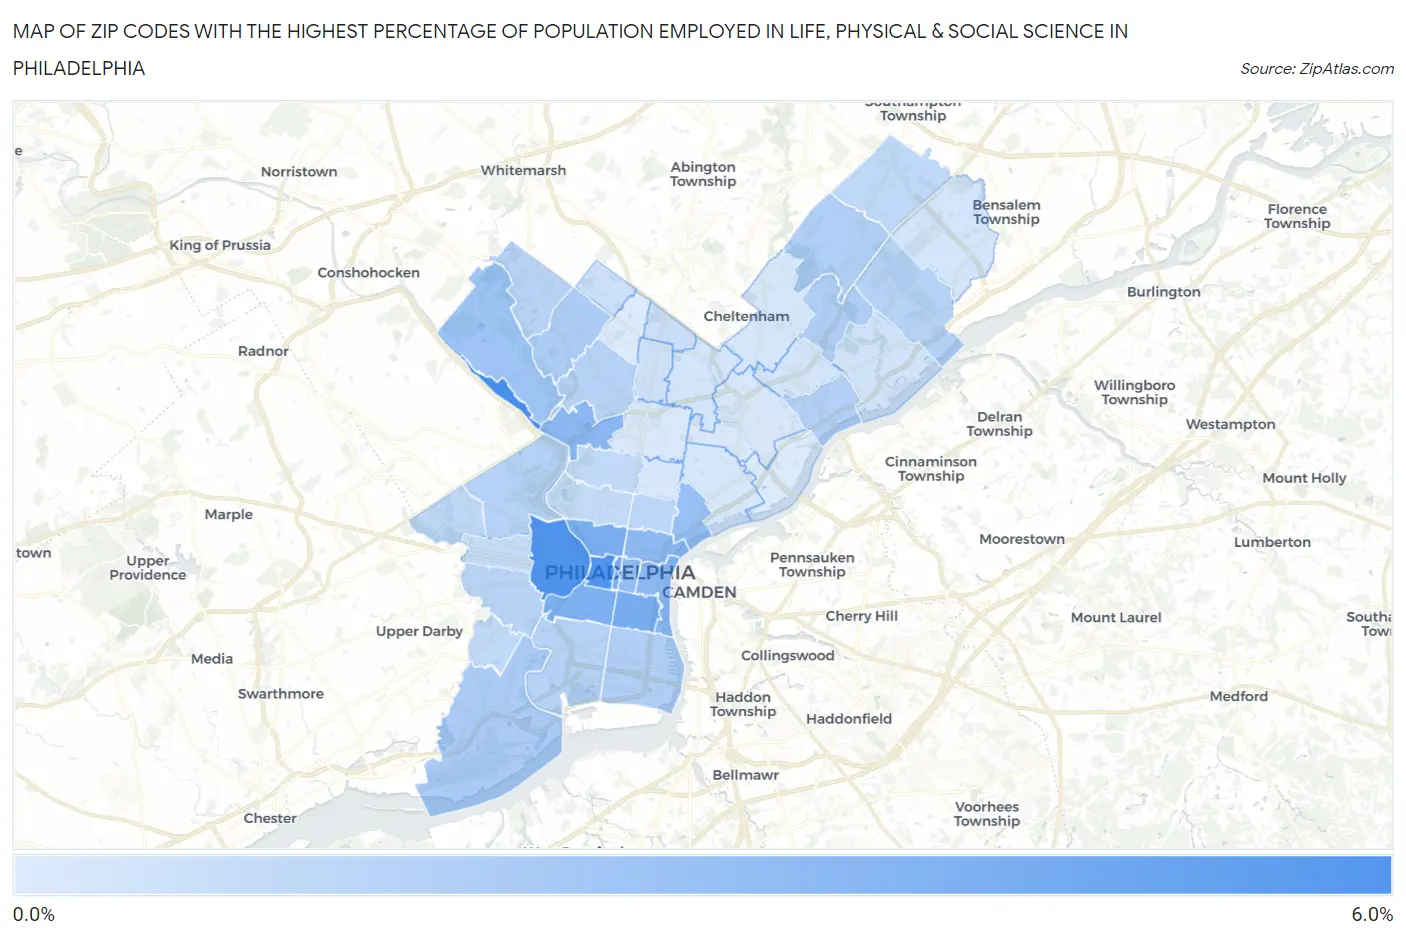
Map of Zip Codes with the Highest Percentage of Population Employed in Life, Physical & Social Science in Philadelphia
0.20%
5.3%
Zip Codes with the Highest Percentage of Population Employed in Life, Physical & Social Science in Philadelphia, PA
| Zip Code | % Employed | vs State | vs National | |
| 1. | 19127 | 5.3% | 1.2%(+4.13)#32 | 1.1%(+4.26)#665 |
| 2. | 19103 | 5.1% | 1.2%(+3.83)#37 | 1.1%(+3.96)#745 |
| 3. | 19104 | 5.0% | 1.2%(+3.77)#39 | 1.1%(+3.91)#762 |
| 4. | 19147 | 3.7% | 1.2%(+2.44)#65 | 1.1%(+2.57)#1,337 |
| 5. | 19130 | 3.6% | 1.2%(+2.35)#67 | 1.1%(+2.48)#1,385 |
| 6. | 19146 | 3.5% | 1.2%(+2.31)#69 | 1.1%(+2.44)#1,403 |
| 7. | 19102 | 3.5% | 1.2%(+2.26)#72 | 1.1%(+2.39)#1,441 |
| 8. | 19129 | 3.0% | 1.2%(+1.80)#93 | 1.1%(+1.94)#1,845 |
| 9. | 19123 | 2.9% | 1.2%(+1.71)#98 | 1.1%(+1.84)#1,956 |
| 10. | 19106 | 2.8% | 1.2%(+1.61)#103 | 1.1%(+1.75)#2,070 |
| 11. | 19107 | 2.7% | 1.2%(+1.52)#110 | 1.1%(+1.65)#2,193 |
| 12. | 19125 | 2.5% | 1.2%(+1.31)#127 | 1.1%(+1.44)#2,516 |
| 13. | 19128 | 2.3% | 1.2%(+1.10)#144 | 1.1%(+1.23)#2,913 |
| 14. | 19153 | 1.9% | 1.2%(+0.707)#199 | 1.1%(+0.838)#3,891 |
| 15. | 19119 | 1.8% | 1.2%(+0.619)#211 | 1.1%(+0.751)#4,169 |
| 16. | 19152 | 1.7% | 1.2%(+0.527)#224 | 1.1%(+0.658)#4,513 |
| 17. | 19115 | 1.7% | 1.2%(+0.469)#232 | 1.1%(+0.601)#4,773 |
| 18. | 19148 | 1.6% | 1.2%(+0.427)#245 | 1.1%(+0.559)#4,949 |
| 19. | 19135 | 1.6% | 1.2%(+0.386)#259 | 1.1%(+0.517)#5,114 |
| 20. | 19131 | 1.5% | 1.2%(+0.320)#277 | 1.1%(+0.451)#5,431 |
| 21. | 19145 | 1.5% | 1.2%(+0.316)#281 | 1.1%(+0.447)#5,458 |
| 22. | 19144 | 1.5% | 1.2%(+0.297)#288 | 1.1%(+0.429)#5,547 |
| 23. | 19114 | 1.5% | 1.2%(+0.275)#294 | 1.1%(+0.407)#5,669 |
| 24. | 19143 | 1.5% | 1.2%(+0.238)#307 | 1.1%(+0.370)#5,866 |
| 25. | 19118 | 1.4% | 1.2%(+0.210)#314 | 1.1%(+0.342)#6,010 |
| 26. | 19122 | 1.3% | 1.2%(+0.065)#361 | 1.1%(+0.196)#6,888 |
| 27. | 19116 | 1.2% | 1.2%(+0.006)#382 | 1.1%(+0.138)#7,278 |
| 28. | 19151 | 1.2% | 1.2%(-0.019)#393 | 1.1%(+0.113)#7,472 |
| 29. | 19132 | 1.1% | 1.2%(-0.086)#420 | 1.1%(+0.046)#7,959 |
| 30. | 19142 | 1.1% | 1.2%(-0.115)#437 | 1.1%(+0.017)#8,169 |
| 31. | 19121 | 1.0% | 1.2%(-0.189)#463 | 1.1%(-0.058)#8,773 |
| 32. | 19139 | 0.95% | 1.2%(-0.272)#508 | 1.1%(-0.140)#9,485 |
| 33. | 19126 | 0.84% | 1.2%(-0.381)#555 | 1.1%(-0.250)#10,562 |
| 34. | 19150 | 0.77% | 1.2%(-0.452)#595 | 1.1%(-0.320)#11,296 |
| 35. | 19141 | 0.69% | 1.2%(-0.536)#641 | 1.1%(-0.404)#12,204 |
| 36. | 19136 | 0.60% | 1.2%(-0.625)#693 | 1.1%(-0.494)#13,338 |
| 37. | 19120 | 0.54% | 1.2%(-0.682)#732 | 1.1%(-0.550)#14,010 |
| 38. | 19149 | 0.51% | 1.2%(-0.707)#746 | 1.1%(-0.576)#14,319 |
| 39. | 19154 | 0.51% | 1.2%(-0.715)#750 | 1.1%(-0.583)#14,411 |
| 40. | 19111 | 0.44% | 1.2%(-0.780)#794 | 1.1%(-0.648)#15,226 |
| 41. | 19134 | 0.40% | 1.2%(-0.819)#818 | 1.1%(-0.688)#15,710 |
| 42. | 19133 | 0.38% | 1.2%(-0.838)#833 | 1.1%(-0.706)#15,949 |
| 43. | 19140 | 0.33% | 1.2%(-0.895)#888 | 1.1%(-0.764)#16,710 |
| 44. | 19124 | 0.32% | 1.2%(-0.905)#897 | 1.1%(-0.773)#16,833 |
| 45. | 19137 | 0.21% | 1.2%(-1.02)#965 | 1.1%(-0.884)#18,126 |
| 46. | 19138 | 0.20% | 1.2%(-1.02)#972 | 1.1%(-0.892)#18,210 |
1
Common Questions
What are the Top 10 Zip Codes with the Highest Percentage of Population Employed in Life, Physical & Social Science in Philadelphia, PA?
Top 10 Zip Codes with the Highest Percentage of Population Employed in Life, Physical & Social Science in Philadelphia, PA are:
What zip code has the Highest Percentage of Population Employed in Life, Physical & Social Science in Philadelphia, PA?
19127 has the Highest Percentage of Population Employed in Life, Physical & Social Science in Philadelphia, PA with 5.3%.
What is the Percentage of Population Employed in Life, Physical & Social Science in Philadelphia, PA?
Percentage of Population Employed in Life, Physical & Social Science in Philadelphia is 1.7%.
What is the Percentage of Population Employed in Life, Physical & Social Science in Pennsylvania?
Percentage of Population Employed in Life, Physical & Social Science in Pennsylvania is 1.2%.
What is the Percentage of Population Employed in Life, Physical & Social Science in the United States?
Percentage of Population Employed in Life, Physical & Social Science in the United States is 1.1%.