Burlington borough, PA Map & Demographics
Burlington borough Overview
$22,968
PER CAPITA INCOME
$41,094
AVG FAMILY INCOME
$41,250
AVG HOUSEHOLD INCOME
35.4%
WAGE / INCOME GAP [ % ]
64.6¢/ $1
WAGE / INCOME GAP [ $ ]
0.32
INEQUALITY / GINI INDEX
154
TOTAL POPULATION
71
MALE POPULATION
83
FEMALE POPULATION
85.54
MALES / 100 FEMALES
116.90
FEMALES / 100 MALES
27.6
MEDIAN AGE
3.0
AVG FAMILY SIZE
2.4
AVG HOUSEHOLD SIZE
70
LABOR FORCE [ PEOPLE ]
57.9%
PERCENT IN LABOR FORCE
1.4%
UNEMPLOYMENT RATE
Income in Burlington borough
Income Overview in Burlington borough
Per Capita Income in Burlington borough is $22,968, while median incomes of families and households are $41,094 and $41,250 respectively.
| Characteristic | Number | Measure |
| Per Capita Income | 154 | $22,968 |
| Median Family Income | 33 | $41,094 |
| Mean Family Income | 33 | $53,582 |
| Median Household Income | 65 | $41,250 |
| Mean Household Income | 65 | $52,720 |
| Income Deficit | 33 | $0 |
| Wage / Income Gap (%) | 154 | 35.41% |
| Wage / Income Gap ($) | 154 | 64.59¢ per $1 |
| Gini / Inequality Index | 154 | 0.32 |
Earnings by Sex in Burlington borough
Average Earnings in Burlington borough are $36,250, $41,125 for men and $26,563 for women, a difference of 35.4%.
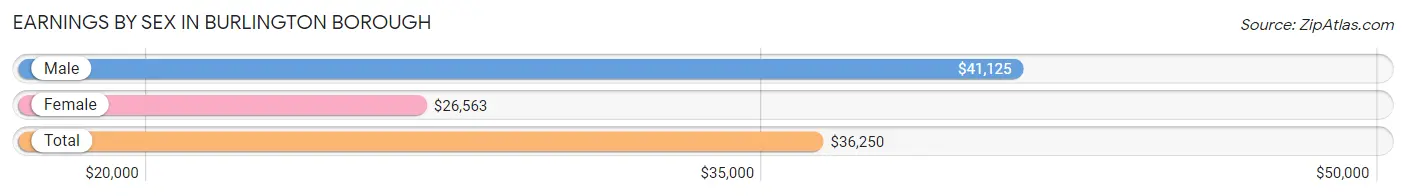
| Sex | Number | Average Earnings |
| Male | 37 (50.0%) | $41,125 |
| Female | 37 (50.0%) | $26,563 |
| Total | 74 (100.0%) | $36,250 |
Earnings by Sex by Income Bracket in Burlington borough
The most common earnings brackets in Burlington borough are $40,000 to $44,999 for men (12 | 32.4%) and $30,000 to $34,999 for women (9 | 24.3%).
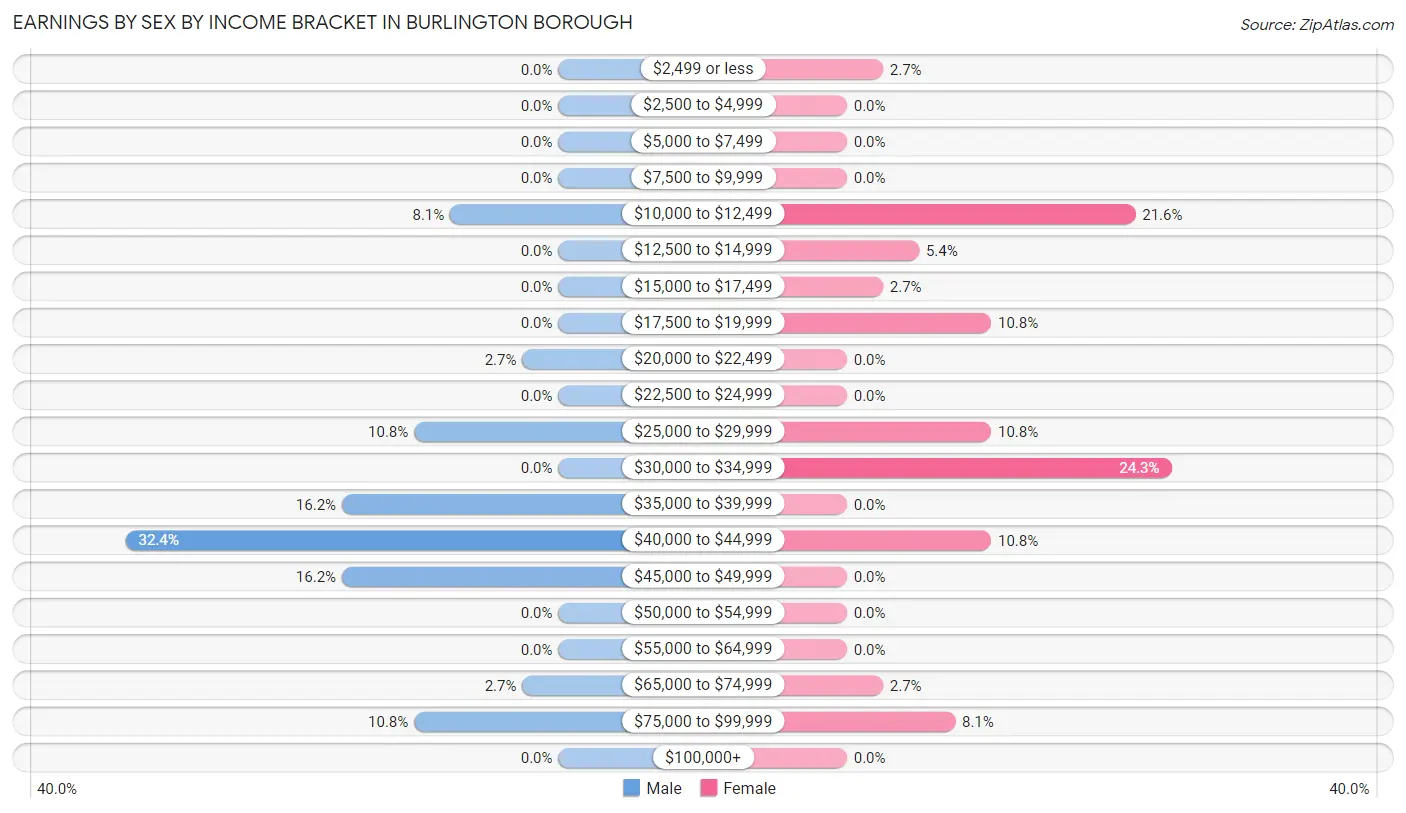
| Income | Male | Female |
| $2,499 or less | 0 (0.0%) | 1 (2.7%) |
| $2,500 to $4,999 | 0 (0.0%) | 0 (0.0%) |
| $5,000 to $7,499 | 0 (0.0%) | 0 (0.0%) |
| $7,500 to $9,999 | 0 (0.0%) | 0 (0.0%) |
| $10,000 to $12,499 | 3 (8.1%) | 8 (21.6%) |
| $12,500 to $14,999 | 0 (0.0%) | 2 (5.4%) |
| $15,000 to $17,499 | 0 (0.0%) | 1 (2.7%) |
| $17,500 to $19,999 | 0 (0.0%) | 4 (10.8%) |
| $20,000 to $22,499 | 1 (2.7%) | 0 (0.0%) |
| $22,500 to $24,999 | 0 (0.0%) | 0 (0.0%) |
| $25,000 to $29,999 | 4 (10.8%) | 4 (10.8%) |
| $30,000 to $34,999 | 0 (0.0%) | 9 (24.3%) |
| $35,000 to $39,999 | 6 (16.2%) | 0 (0.0%) |
| $40,000 to $44,999 | 12 (32.4%) | 4 (10.8%) |
| $45,000 to $49,999 | 6 (16.2%) | 0 (0.0%) |
| $50,000 to $54,999 | 0 (0.0%) | 0 (0.0%) |
| $55,000 to $64,999 | 0 (0.0%) | 0 (0.0%) |
| $65,000 to $74,999 | 1 (2.7%) | 1 (2.7%) |
| $75,000 to $99,999 | 4 (10.8%) | 3 (8.1%) |
| $100,000+ | 0 (0.0%) | 0 (0.0%) |
| Total | 37 (100.0%) | 37 (100.0%) |
Earnings by Sex by Educational Attainment in Burlington borough
Average earnings in Burlington borough are $40,875 for men and $25,938 for women, a difference of 36.5%. Men with an educational attainment of high school diploma enjoy the highest average annual earnings of $40,833, while those with high school diploma education earn the least with $40,833. Women with an educational attainment of college or associate's degree earn the most with the average annual earnings of $19,375, while those with college or associate's degree education have the smallest earnings of $19,375.
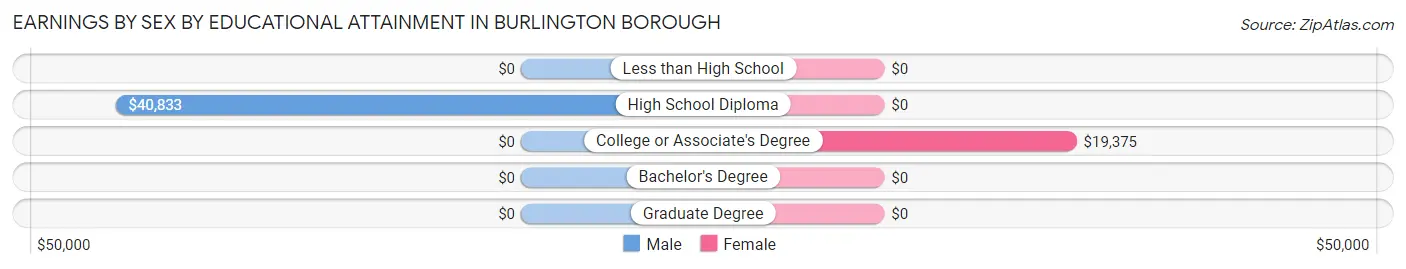
| Educational Attainment | Male Income | Female Income |
| Less than High School | - | - |
| High School Diploma | $40,833 | $0 |
| College or Associate's Degree | - | - |
| Bachelor's Degree | - | - |
| Graduate Degree | - | - |
| Total | $40,875 | $25,938 |
Family Income in Burlington borough
Family Income Brackets in Burlington borough
According to the Burlington borough family income data, there are 12 families falling into the $35,000 to $49,999 income range, which is the most common income bracket and makes up 36.4% of all families.
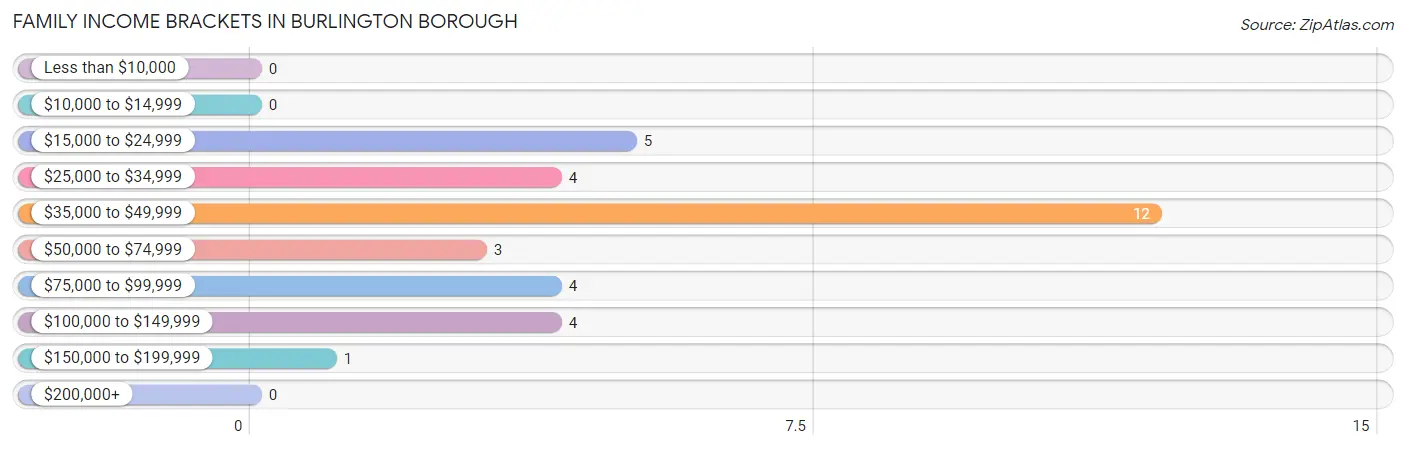
| Income Bracket | # Families | % Families |
| Less than $10,000 | 0 | 0.0% |
| $10,000 to $14,999 | 0 | 0.0% |
| $15,000 to $24,999 | 5 | 15.2% |
| $25,000 to $34,999 | 4 | 12.1% |
| $35,000 to $49,999 | 12 | 36.4% |
| $50,000 to $74,999 | 3 | 9.1% |
| $75,000 to $99,999 | 4 | 12.1% |
| $100,000 to $149,999 | 4 | 12.1% |
| $150,000 to $199,999 | 1 | 3.0% |
| $200,000+ | 0 | 0.0% |
Family Income by Famaliy Size in Burlington borough
3-person families (10 | 30.3%) account for the highest median family income in Burlington borough with $42,083 per family, while 2-person families (14 | 42.4%) have the highest median income of $19,375 per family member.
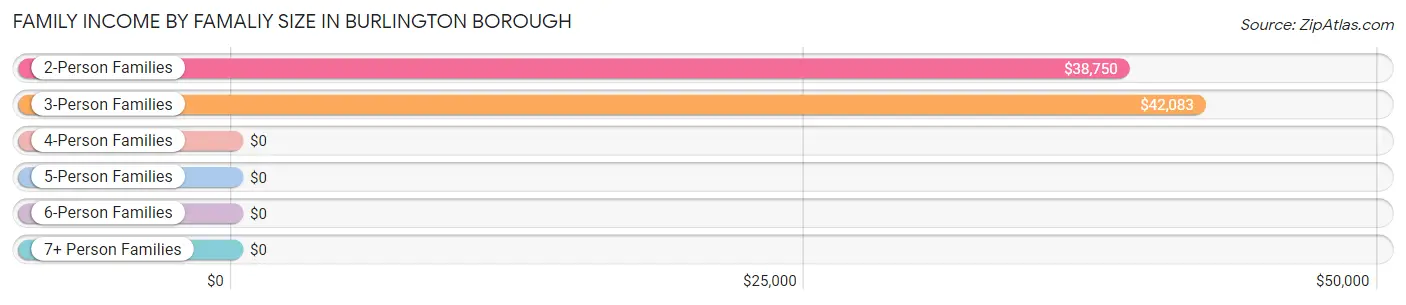
| Income Bracket | # Families | Median Income |
| 2-Person Families | 14 (42.4%) | $38,750 |
| 3-Person Families | 10 (30.3%) | $42,083 |
| 4-Person Families | 9 (27.3%) | $0 |
| 5-Person Families | 0 (0.0%) | $0 |
| 6-Person Families | 0 (0.0%) | $0 |
| 7+ Person Families | 0 (0.0%) | $0 |
| Total | 33 (100.0%) | $41,094 |
Family Income by Number of Earners in Burlington borough
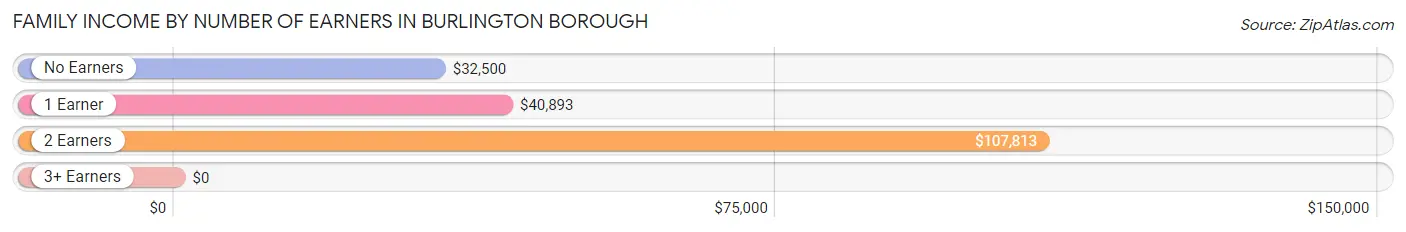
| Number of Earners | # Families | Median Income |
| No Earners | 8 (24.2%) | $32,500 |
| 1 Earner | 15 (45.5%) | $40,893 |
| 2 Earners | 9 (27.3%) | $107,813 |
| 3+ Earners | 1 (3.0%) | $0 |
| Total | 33 (100.0%) | $41,094 |
Household Income in Burlington borough
Household Income Brackets in Burlington borough
With 22 households falling in the category, the $35,000 to $49,999 income range is the most frequent in Burlington borough, accounting for 33.9% of all households.
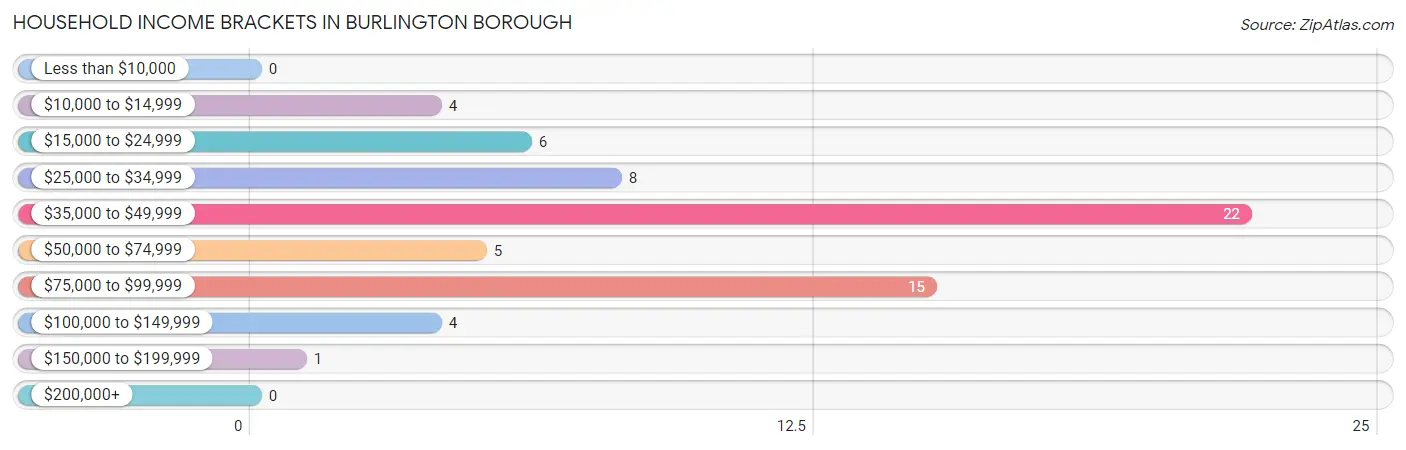
| Income Bracket | # Households | % Households |
| Less than $10,000 | 0 | 0.0% |
| $10,000 to $14,999 | 4 | 6.2% |
| $15,000 to $24,999 | 6 | 9.2% |
| $25,000 to $34,999 | 8 | 12.3% |
| $35,000 to $49,999 | 22 | 33.8% |
| $50,000 to $74,999 | 5 | 7.7% |
| $75,000 to $99,999 | 15 | 23.1% |
| $100,000 to $149,999 | 4 | 6.2% |
| $150,000 to $199,999 | 1 | 1.5% |
| $200,000+ | 0 | 0.0% |
Household Income by Householder Age in Burlington borough
The median household income in Burlington borough is $41,250, with the highest median household income of $37,188 found in the 65+ years age bracket for the primary householder. A total of 25 households (38.5%) fall into this category. Meanwhile, the 15 to 24 years age bracket for the primary householder has the lowest median household income of $0, with 4 households (6.1%) in this group.
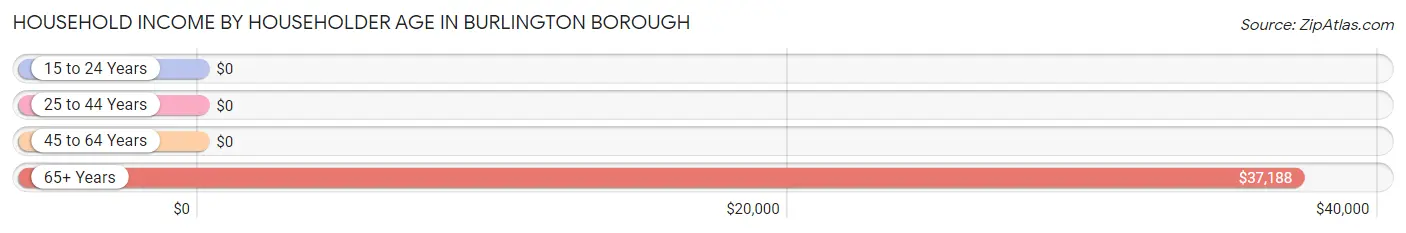
| Income Bracket | # Households | Median Income |
| 15 to 24 Years | 4 (6.1%) | $0 |
| 25 to 44 Years | 21 (32.3%) | $0 |
| 45 to 64 Years | 15 (23.1%) | $0 |
| 65+ Years | 25 (38.5%) | $37,188 |
| Total | 65 (100.0%) | $41,250 |
Poverty in Burlington borough
Income Below Poverty by Sex and Age in Burlington borough
With 21.1% poverty level for males and 16.9% for females among the residents of Burlington borough, under 5 year old males and 35 to 44 year old females are the most vulnerable to poverty, with 7 males (100.0%) and 1 females (100.0%) in their respective age groups living below the poverty level.
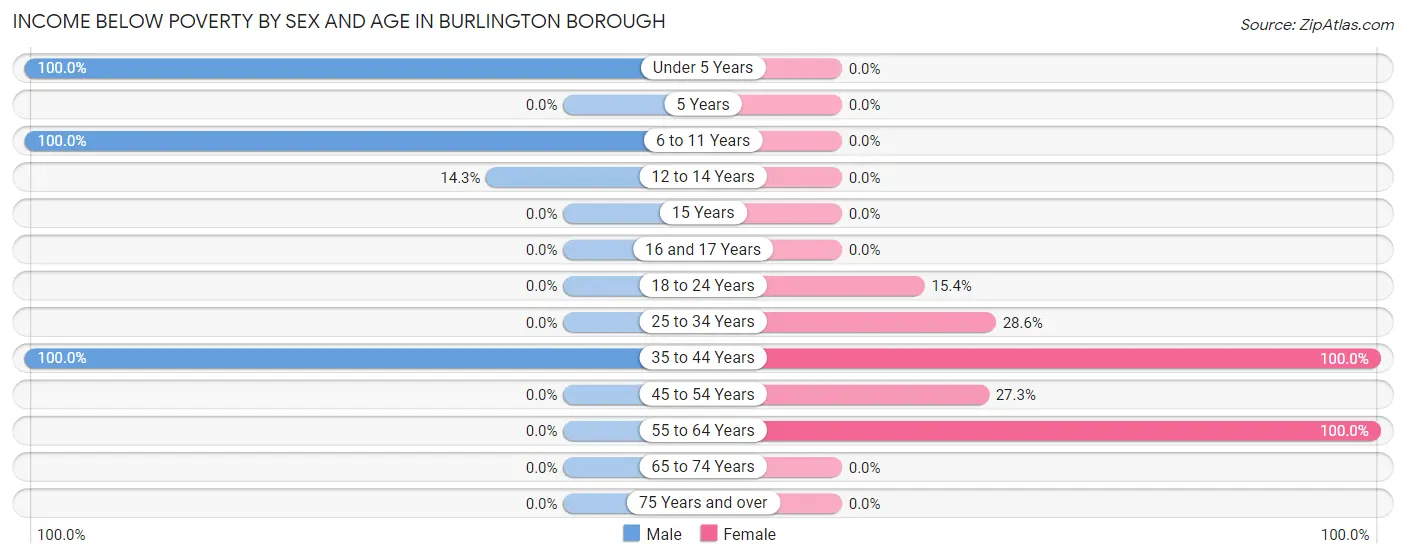
| Age Bracket | Male | Female |
| Under 5 Years | 7 (100.0%) | 0 (0.0%) |
| 5 Years | 0 (0.0%) | 0 (0.0%) |
| 6 to 11 Years | 4 (100.0%) | 0 (0.0%) |
| 12 to 14 Years | 1 (14.3%) | 0 (0.0%) |
| 15 Years | 0 (0.0%) | 0 (0.0%) |
| 16 and 17 Years | 0 (0.0%) | 0 (0.0%) |
| 18 to 24 Years | 0 (0.0%) | 2 (15.4%) |
| 25 to 34 Years | 0 (0.0%) | 4 (28.6%) |
| 35 to 44 Years | 3 (100.0%) | 1 (100.0%) |
| 45 to 54 Years | 0 (0.0%) | 3 (27.3%) |
| 55 to 64 Years | 0 (0.0%) | 4 (100.0%) |
| 65 to 74 Years | 0 (0.0%) | 0 (0.0%) |
| 75 Years and over | 0 (0.0%) | 0 (0.0%) |
| Total | 15 (21.1%) | 14 (16.9%) |
Income Above Poverty by Sex and Age in Burlington borough
According to the poverty statistics in Burlington borough, males aged 5 years and females aged under 5 years are the age groups that are most secure financially, with 100.0% of males and 100.0% of females in these age groups living above the poverty line.
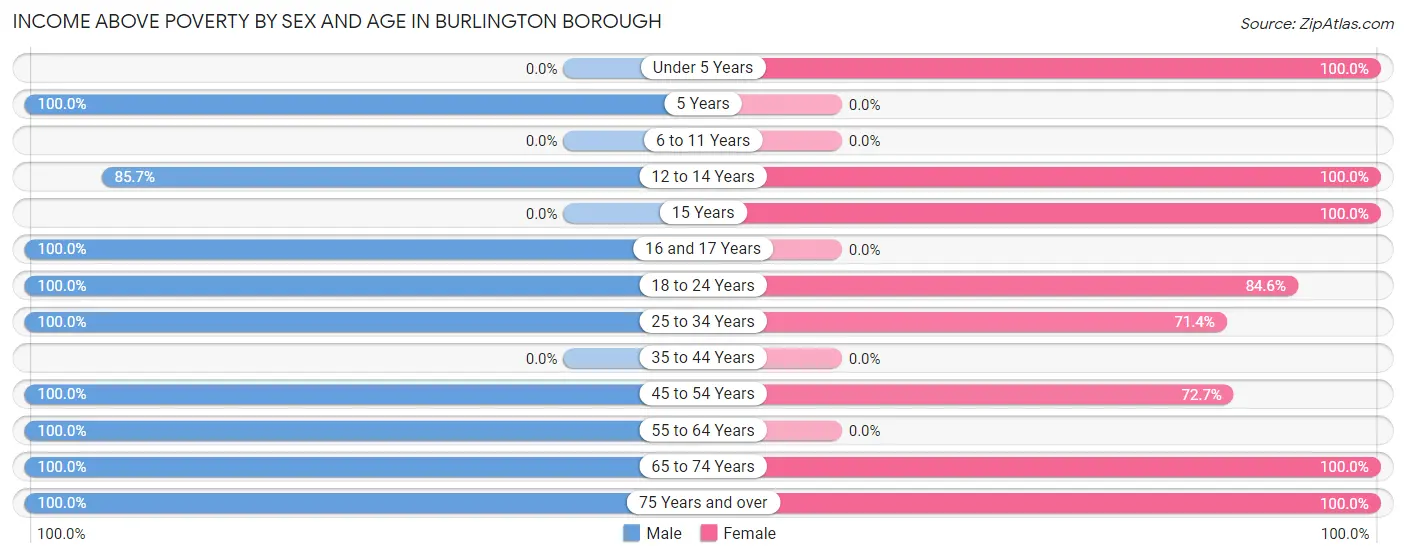
| Age Bracket | Male | Female |
| Under 5 Years | 0 (0.0%) | 7 (100.0%) |
| 5 Years | 1 (100.0%) | 0 (0.0%) |
| 6 to 11 Years | 0 (0.0%) | 0 (0.0%) |
| 12 to 14 Years | 6 (85.7%) | 4 (100.0%) |
| 15 Years | 0 (0.0%) | 3 (100.0%) |
| 16 and 17 Years | 4 (100.0%) | 0 (0.0%) |
| 18 to 24 Years | 4 (100.0%) | 11 (84.6%) |
| 25 to 34 Years | 20 (100.0%) | 10 (71.4%) |
| 35 to 44 Years | 0 (0.0%) | 0 (0.0%) |
| 45 to 54 Years | 8 (100.0%) | 8 (72.7%) |
| 55 to 64 Years | 4 (100.0%) | 0 (0.0%) |
| 65 to 74 Years | 5 (100.0%) | 16 (100.0%) |
| 75 Years and over | 4 (100.0%) | 10 (100.0%) |
| Total | 56 (78.9%) | 69 (83.1%) |
Income Below Poverty Among Married-Couple Families in Burlington borough
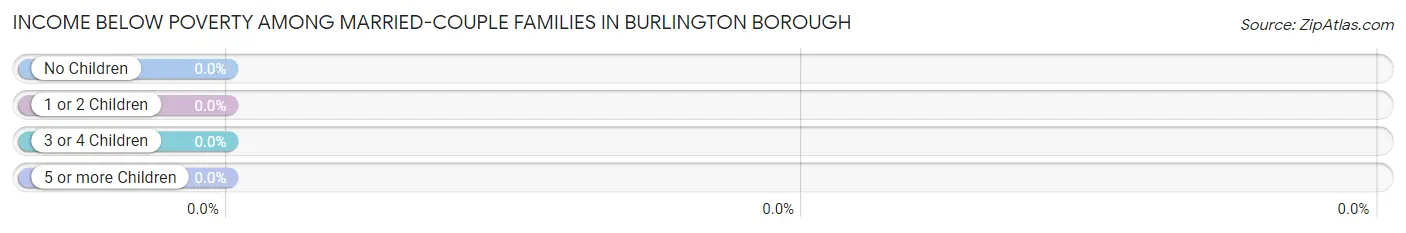
| Children | Above Poverty | Below Poverty |
| No Children | 9 (100.0%) | 0 (0.0%) |
| 1 or 2 Children | 10 (100.0%) | 0 (0.0%) |
| 3 or 4 Children | 0 (0.0%) | 0 (0.0%) |
| 5 or more Children | 0 (0.0%) | 0 (0.0%) |
| Total | 19 (100.0%) | 0 (0.0%) |
Income Below Poverty Among Single-Parent Households in Burlington borough
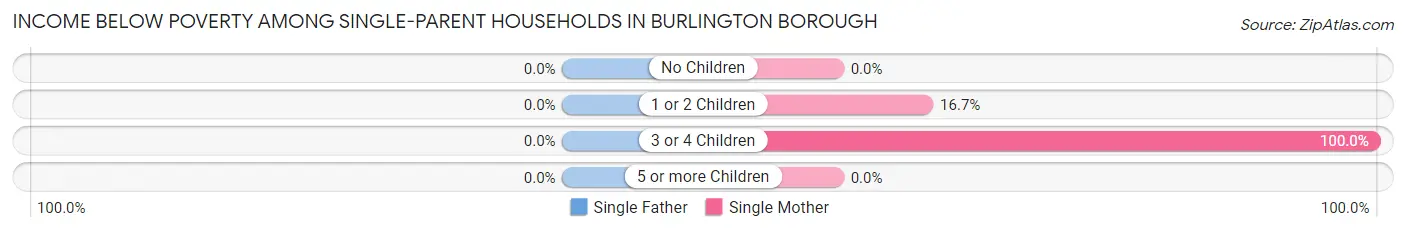
| Children | Single Father | Single Mother |
| No Children | 0 (0.0%) | 0 (0.0%) |
| 1 or 2 Children | 0 (0.0%) | 1 (16.7%) |
| 3 or 4 Children | 0 (0.0%) | 4 (100.0%) |
| 5 or more Children | 0 (0.0%) | 0 (0.0%) |
| Total | 0 (0.0%) | 5 (50.0%) |
Income Below Poverty Among Married-Couple vs Single-Parent Households in Burlington borough
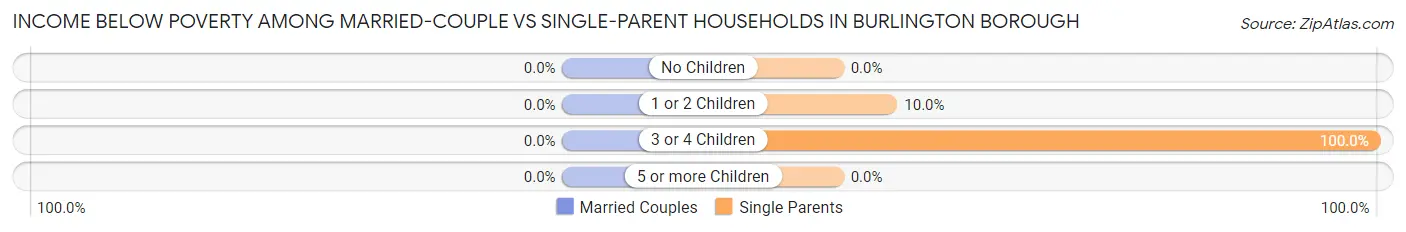
| Children | Married-Couple Families | Single-Parent Households |
| No Children | 0 (0.0%) | 0 (0.0%) |
| 1 or 2 Children | 0 (0.0%) | 1 (10.0%) |
| 3 or 4 Children | 0 (0.0%) | 4 (100.0%) |
| 5 or more Children | 0 (0.0%) | 0 (0.0%) |
| Total | 0 (0.0%) | 5 (35.7%) |
Race in Burlington borough
The most populous races in Burlington borough are White / Caucasian (140 | 90.9%), Hispanic or Latino (9 | 5.8%), and Two or more Races (9 | 5.8%).
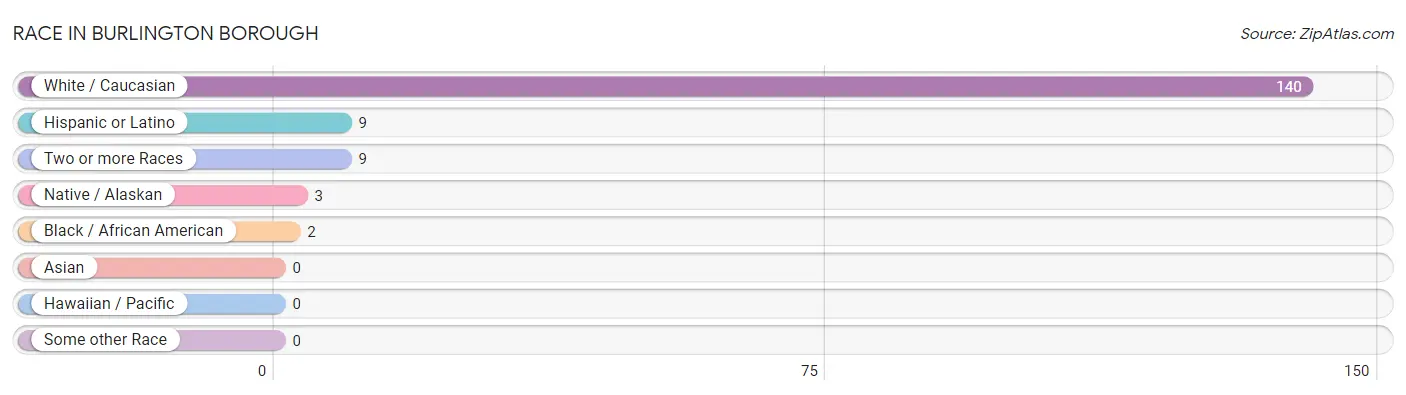
| Race | # Population | % Population |
| Asian | 0 | 0.0% |
| Black / African American | 2 | 1.3% |
| Hawaiian / Pacific | 0 | 0.0% |
| Hispanic or Latino | 9 | 5.8% |
| Native / Alaskan | 3 | 1.9% |
| White / Caucasian | 140 | 90.9% |
| Two or more Races | 9 | 5.8% |
| Some other Race | 0 | 0.0% |
| Total | 154 | 100.0% |
Ancestry in Burlington borough
The most populous ancestries reported in Burlington borough are German (19 | 12.3%), English (15 | 9.7%), Puerto Rican (9 | 5.8%), American (6 | 3.9%), and Irish (4 | 2.6%), together accounting for 34.4% of all Burlington borough residents.
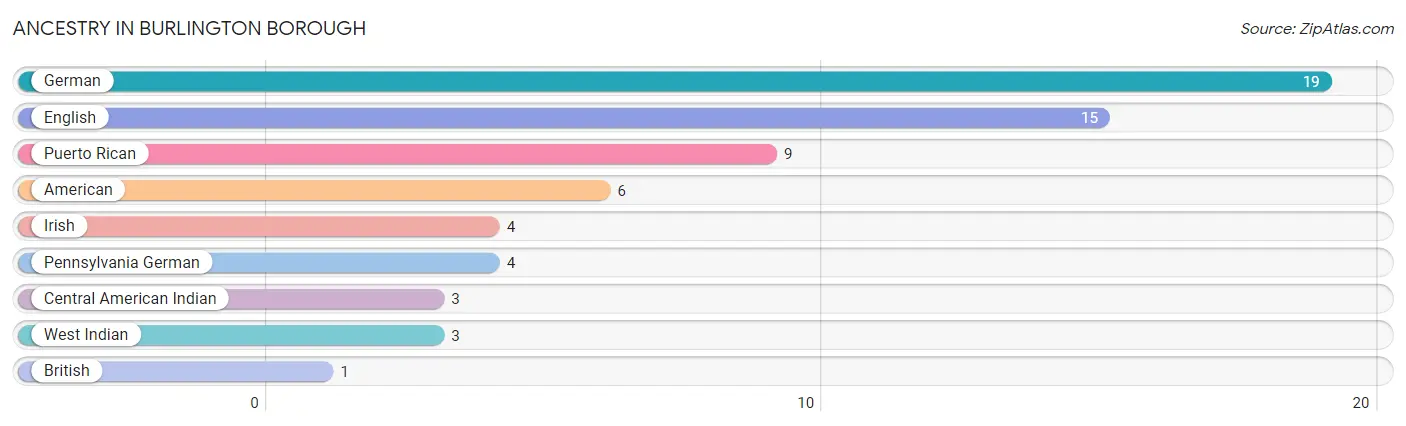
| Ancestry | # Population | % Population |
| American | 6 | 3.9% |
| British | 1 | 0.6% |
| Central American Indian | 3 | 1.9% |
| English | 15 | 9.7% |
| German | 19 | 12.3% |
| Irish | 4 | 2.6% |
| Pennsylvania German | 4 | 2.6% |
| Puerto Rican | 9 | 5.8% |
| West Indian | 3 | 1.9% | View All 9 Rows |
Immigrants in Burlington borough

| Immigration Origin | # Population | % Population | View All 0 Rows |
Sex and Age in Burlington borough
Sex and Age in Burlington borough
The most populous age groups in Burlington borough are 25 to 29 Years (16 | 22.5%) for men and 25 to 29 Years (14 | 16.9%) for women.
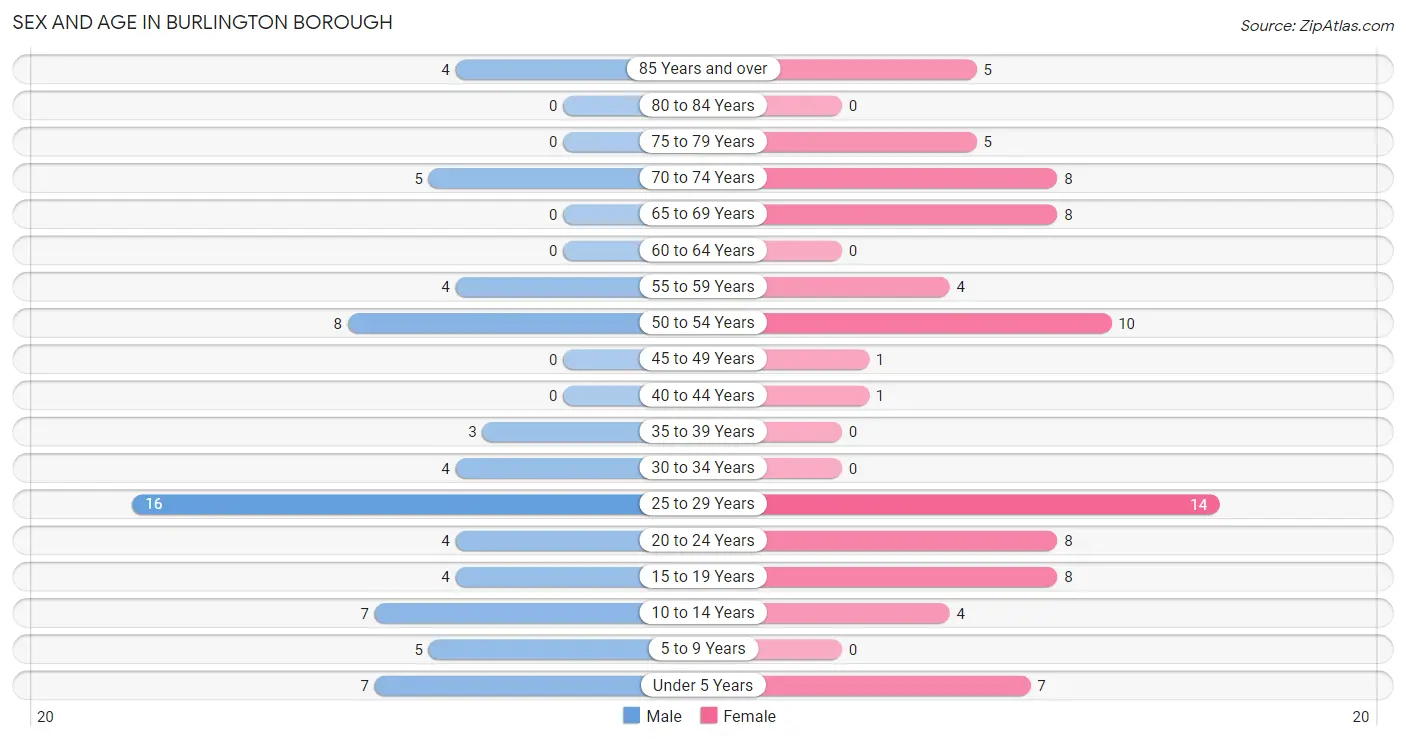
| Age Bracket | Male | Female |
| Under 5 Years | 7 (9.9%) | 7 (8.4%) |
| 5 to 9 Years | 5 (7.0%) | 0 (0.0%) |
| 10 to 14 Years | 7 (9.9%) | 4 (4.8%) |
| 15 to 19 Years | 4 (5.6%) | 8 (9.6%) |
| 20 to 24 Years | 4 (5.6%) | 8 (9.6%) |
| 25 to 29 Years | 16 (22.5%) | 14 (16.9%) |
| 30 to 34 Years | 4 (5.6%) | 0 (0.0%) |
| 35 to 39 Years | 3 (4.2%) | 0 (0.0%) |
| 40 to 44 Years | 0 (0.0%) | 1 (1.2%) |
| 45 to 49 Years | 0 (0.0%) | 1 (1.2%) |
| 50 to 54 Years | 8 (11.3%) | 10 (12.0%) |
| 55 to 59 Years | 4 (5.6%) | 4 (4.8%) |
| 60 to 64 Years | 0 (0.0%) | 0 (0.0%) |
| 65 to 69 Years | 0 (0.0%) | 8 (9.6%) |
| 70 to 74 Years | 5 (7.0%) | 8 (9.6%) |
| 75 to 79 Years | 0 (0.0%) | 5 (6.0%) |
| 80 to 84 Years | 0 (0.0%) | 0 (0.0%) |
| 85 Years and over | 4 (5.6%) | 5 (6.0%) |
| Total | 71 (100.0%) | 83 (100.0%) |
Families and Households in Burlington borough
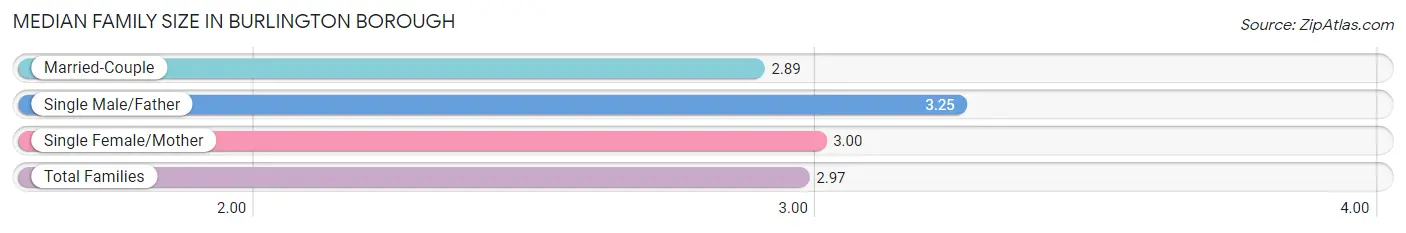
Median Family Size in Burlington borough
The median family size in Burlington borough is 2.97 persons per family, with single male/father families (4 | 12.1%) accounting for the largest median family size of 3.25 persons per family. On the other hand, married-couple families (19 | 57.6%) represent the smallest median family size with 2.89 persons per family.
| Family Type | # Families | Family Size |
| Married-Couple | 19 (57.6%) | 2.89 |
| Single Male/Father | 4 (12.1%) | 3.25 |
| Single Female/Mother | 10 (30.3%) | 3.00 |
| Total Families | 33 (100.0%) | 2.97 |
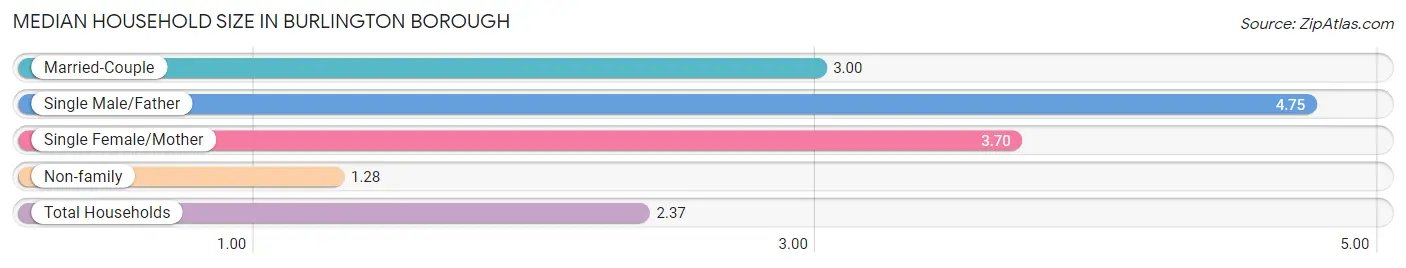
Median Household Size in Burlington borough
The median household size in Burlington borough is 2.37 persons per household, with single male/father households (4 | 6.1%) accounting for the largest median household size of 4.75 persons per household. non-family households (32 | 49.2%) represent the smallest median household size with 1.28 persons per household.
| Household Type | # Households | Household Size |
| Married-Couple | 19 (29.2%) | 3.00 |
| Single Male/Father | 4 (6.1%) | 4.75 |
| Single Female/Mother | 10 (15.4%) | 3.70 |
| Non-family | 32 (49.2%) | 1.28 |
| Total Households | 65 (100.0%) | 2.37 |
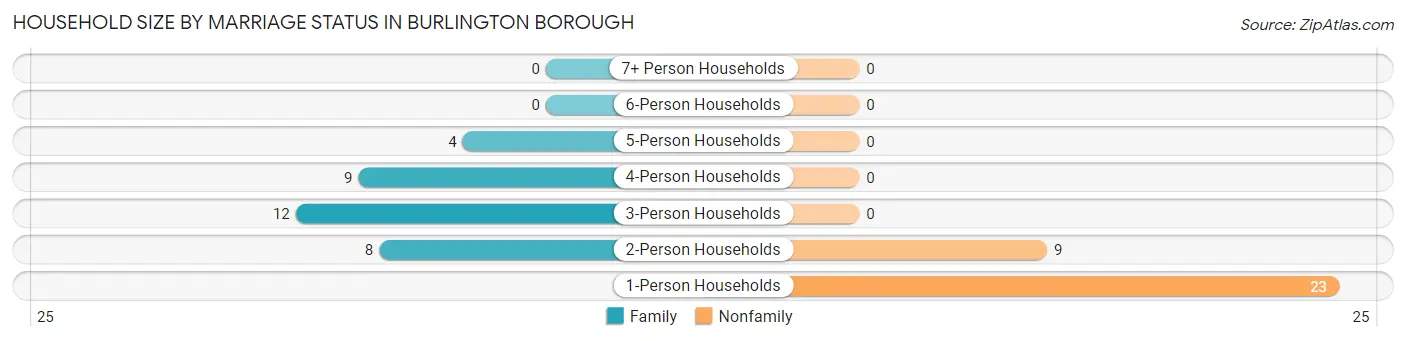
Household Size by Marriage Status in Burlington borough
Out of a total of 65 households in Burlington borough, 33 (50.8%) are family households, while 32 (49.2%) are nonfamily households. The most numerous type of family households are 3-person households, comprising 12, and the most common type of nonfamily households are 1-person households, comprising 23.
| Household Size | Family Households | Nonfamily Households |
| 1-Person Households | - | 23 (35.4%) |
| 2-Person Households | 8 (12.3%) | 9 (13.9%) |
| 3-Person Households | 12 (18.5%) | 0 (0.0%) |
| 4-Person Households | 9 (13.9%) | 0 (0.0%) |
| 5-Person Households | 4 (6.1%) | 0 (0.0%) |
| 6-Person Households | 0 (0.0%) | 0 (0.0%) |
| 7+ Person Households | 0 (0.0%) | 0 (0.0%) |
| Total | 33 (50.8%) | 32 (49.2%) |
Female Fertility in Burlington borough
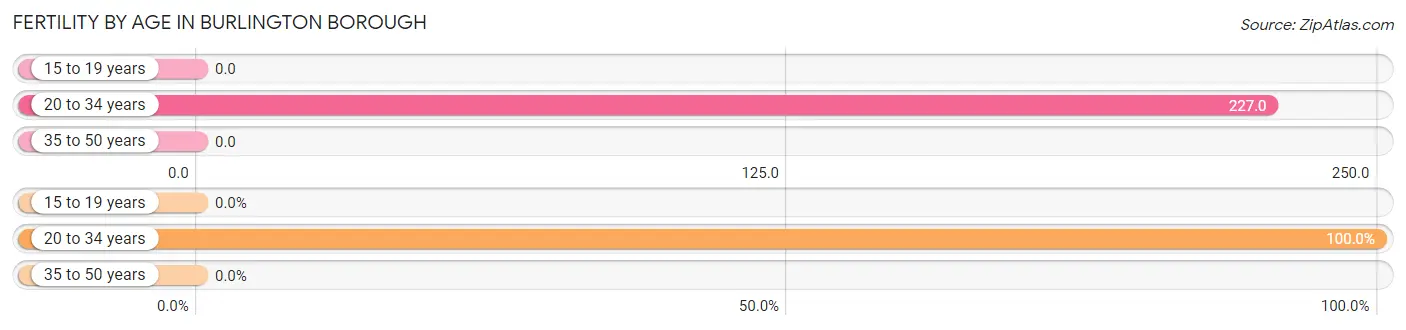
Fertility by Age in Burlington borough
Average fertility rate in Burlington borough is 147.0 births per 1,000 women. Women in the age bracket of 20 to 34 years have the highest fertility rate with 227.0 births per 1,000 women. Women in the age bracket of 20 to 34 years acount for 100.0% of all women with births.
| Age Bracket | Women with Births | Births / 1,000 Women |
| 15 to 19 years | 0 (0.0%) | 0.0 |
| 20 to 34 years | 5 (100.0%) | 227.0 |
| 35 to 50 years | 0 (0.0%) | 0.0 |
| Total | 5 (100.0%) | 147.0 |
Fertility by Age by Marriage Status in Burlington borough
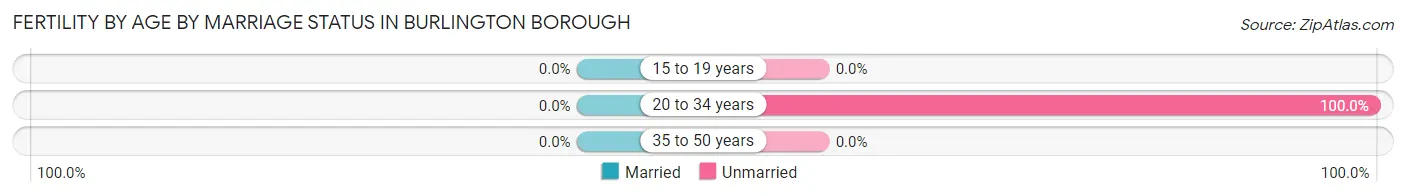
| Age Bracket | Married | Unmarried |
| 15 to 19 years | 0 (0.0%) | 0 (0.0%) |
| 20 to 34 years | 0 (0.0%) | 5 (100.0%) |
| 35 to 50 years | 0 (0.0%) | 0 (0.0%) |
| Total | 0 (0.0%) | 5 (100.0%) |
Fertility by Education in Burlington borough
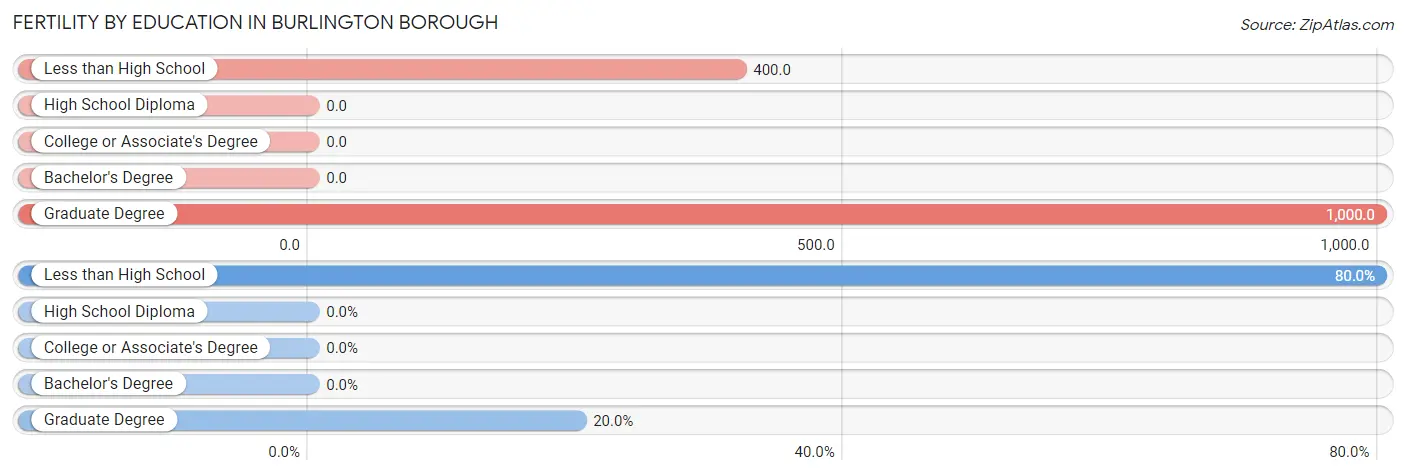
| Educational Attainment | Women with Births | Births / 1,000 Women |
| Less than High School | 4 (80.0%) | 400.0 |
| High School Diploma | 0 (0.0%) | 0.0 |
| College or Associate's Degree | 0 (0.0%) | 0.0 |
| Bachelor's Degree | 0 (0.0%) | 0.0 |
| Graduate Degree | 1 (20.0%) | 1,000.0 |
| Total | 5 (100.0%) | 147.0 |
Fertility by Education by Marriage Status in Burlington borough
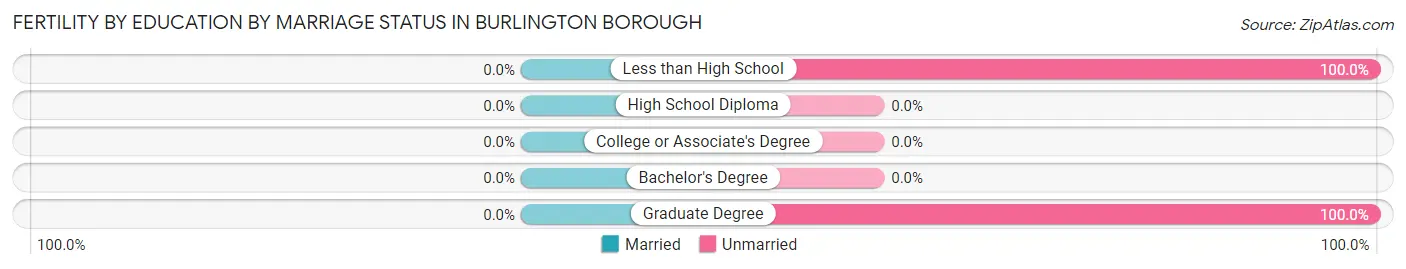
| Educational Attainment | Married | Unmarried |
| Less than High School | 0 (0.0%) | 4 (100.0%) |
| High School Diploma | 0 (0.0%) | 0 (0.0%) |
| College or Associate's Degree | 0 (0.0%) | 0 (0.0%) |
| Bachelor's Degree | 0 (0.0%) | 0 (0.0%) |
| Graduate Degree | 0 (0.0%) | 1 (100.0%) |
| Total | 0 (0.0%) | 5 (100.0%) |
Employment Characteristics in Burlington borough
Employment by Class of Employer in Burlington borough
Among the 63 employed individuals in Burlington borough, private company employees (45 | 71.4%), not-for-profit organizations (11 | 17.5%), and local government employees (6 | 9.5%) make up the most common classes of employment.
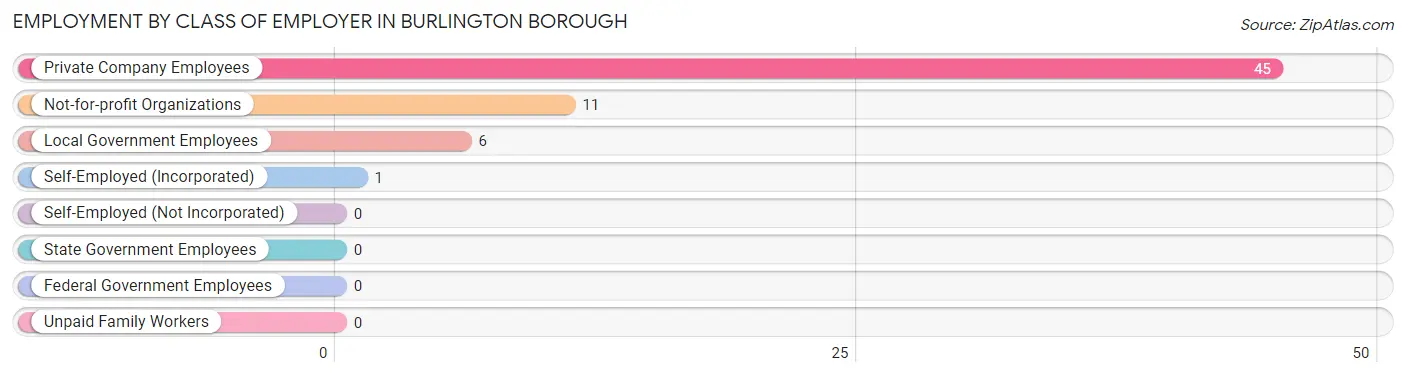
| Employer Class | # Employees | % Employees |
| Private Company Employees | 45 | 71.4% |
| Self-Employed (Incorporated) | 1 | 1.6% |
| Self-Employed (Not Incorporated) | 0 | 0.0% |
| Not-for-profit Organizations | 11 | 17.5% |
| Local Government Employees | 6 | 9.5% |
| State Government Employees | 0 | 0.0% |
| Federal Government Employees | 0 | 0.0% |
| Unpaid Family Workers | 0 | 0.0% |
| Total | 63 | 100.0% |
Employment Status by Age in Burlington borough
According to the labor force statistics for Burlington borough, out of the total population over 16 years of age (121), 57.9% or 70 individuals are in the labor force, with 1.4% or 1 of them unemployed. The age group with the highest labor force participation rate is 30 to 34 years, with 100.0% or 4 individuals in the labor force. Within the labor force, the 20 to 24 years age range has the highest percentage of unemployed individuals, with 20.0% or 1 of them being unemployed.
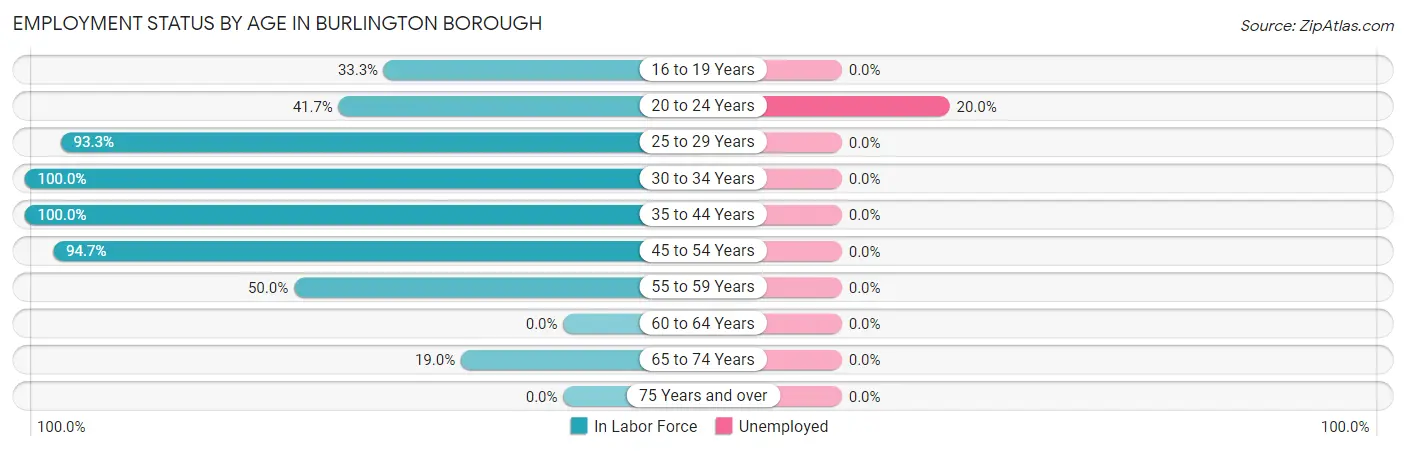
| Age Bracket | In Labor Force | Unemployed |
| 16 to 19 Years | 3 (33.3%) | 0 (0.0%) |
| 20 to 24 Years | 5 (41.7%) | 1 (20.0%) |
| 25 to 29 Years | 28 (93.3%) | 0 (0.0%) |
| 30 to 34 Years | 4 (100.0%) | 0 (0.0%) |
| 35 to 44 Years | 4 (100.0%) | 0 (0.0%) |
| 45 to 54 Years | 18 (94.7%) | 0 (0.0%) |
| 55 to 59 Years | 4 (50.0%) | 0 (0.0%) |
| 60 to 64 Years | 0 (0.0%) | 0 (0.0%) |
| 65 to 74 Years | 4 (19.0%) | 0 (0.0%) |
| 75 Years and over | 0 (0.0%) | 0 (0.0%) |
| Total | 70 (57.9%) | 1 (1.4%) |
Employment Status by Educational Attainment in Burlington borough
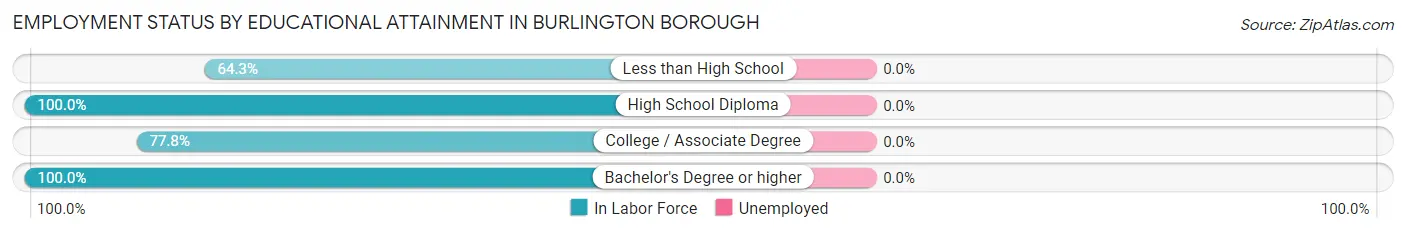
| Educational Attainment | In Labor Force | Unemployed |
| Less than High School | 9 (64.3%) | 0 (0.0%) |
| High School Diploma | 31 (100.0%) | 0 (0.0%) |
| College / Associate Degree | 7 (77.8%) | 0 (0.0%) |
| Bachelor's Degree or higher | 11 (100.0%) | 0 (0.0%) |
| Total | 58 (89.2%) | 0 (0.0%) |
Employment Occupations by Sex in Burlington borough
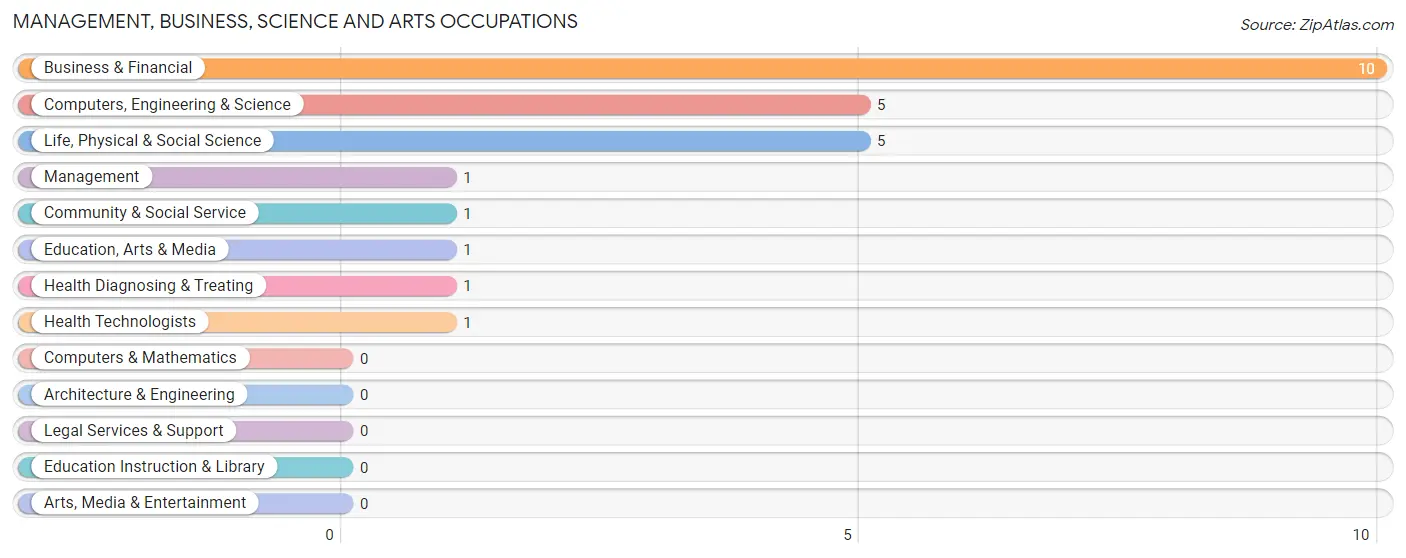
Management, Business, Science and Arts Occupations
The most common Management, Business, Science and Arts occupations in Burlington borough are Business & Financial (10 | 14.5%), Computers, Engineering & Science (5 | 7.2%), Life, Physical & Social Science (5 | 7.2%), Management (1 | 1.5%), and Community & Social Service (1 | 1.5%).
Management, Business, Science and Arts Occupations by Sex
Within the Management, Business, Science and Arts occupations in Burlington borough, the most male-oriented occupations are Management (100.0%), Computers, Engineering & Science (100.0%), and Life, Physical & Social Science (100.0%), while the most female-oriented occupations are Community & Social Service (100.0%), Education, Arts & Media (100.0%), and Health Diagnosing & Treating (100.0%).
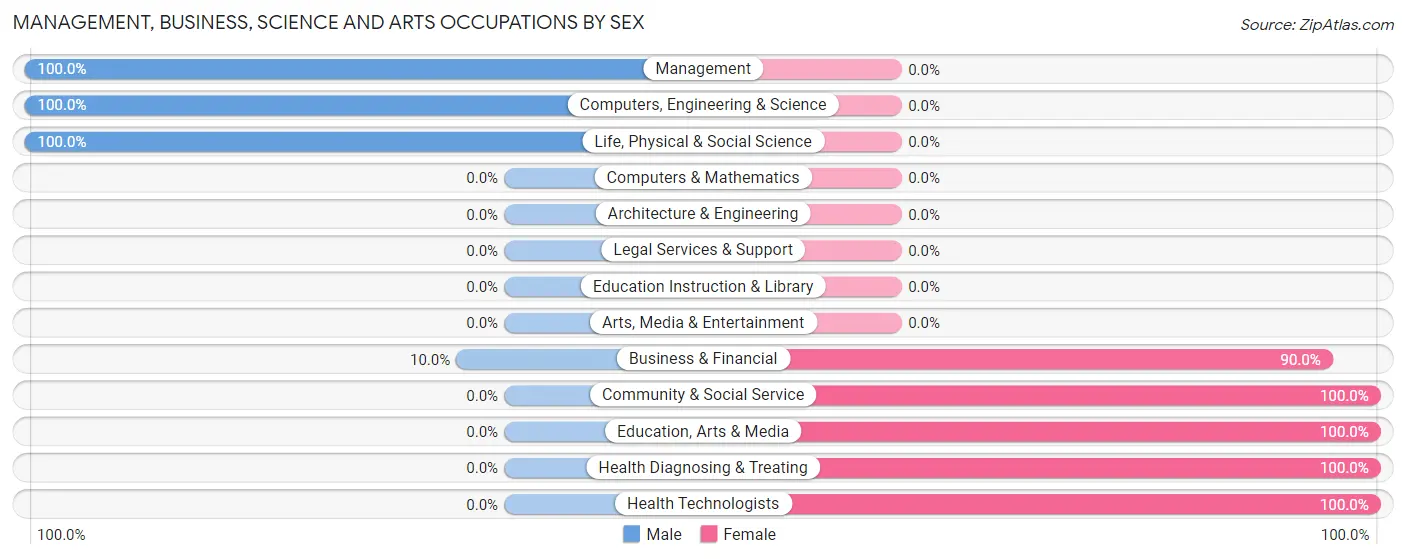
| Occupation | Male | Female |
| Management | 1 (100.0%) | 0 (0.0%) |
| Business & Financial | 1 (10.0%) | 9 (90.0%) |
| Computers, Engineering & Science | 5 (100.0%) | 0 (0.0%) |
| Computers & Mathematics | 0 (0.0%) | 0 (0.0%) |
| Architecture & Engineering | 0 (0.0%) | 0 (0.0%) |
| Life, Physical & Social Science | 5 (100.0%) | 0 (0.0%) |
| Community & Social Service | 0 (0.0%) | 1 (100.0%) |
| Education, Arts & Media | 0 (0.0%) | 1 (100.0%) |
| Legal Services & Support | 0 (0.0%) | 0 (0.0%) |
| Education Instruction & Library | 0 (0.0%) | 0 (0.0%) |
| Arts, Media & Entertainment | 0 (0.0%) | 0 (0.0%) |
| Health Diagnosing & Treating | 0 (0.0%) | 1 (100.0%) |
| Health Technologists | 0 (0.0%) | 1 (100.0%) |
| Total (Category) | 7 (38.9%) | 11 (61.1%) |
| Total (Overall) | 37 (53.6%) | 32 (46.4%) |
Services Occupations
The most common Services occupations in Burlington borough are Food Preparation & Serving (8 | 11.6%), Healthcare Support (4 | 5.8%), and Cleaning & Maintenance (4 | 5.8%).
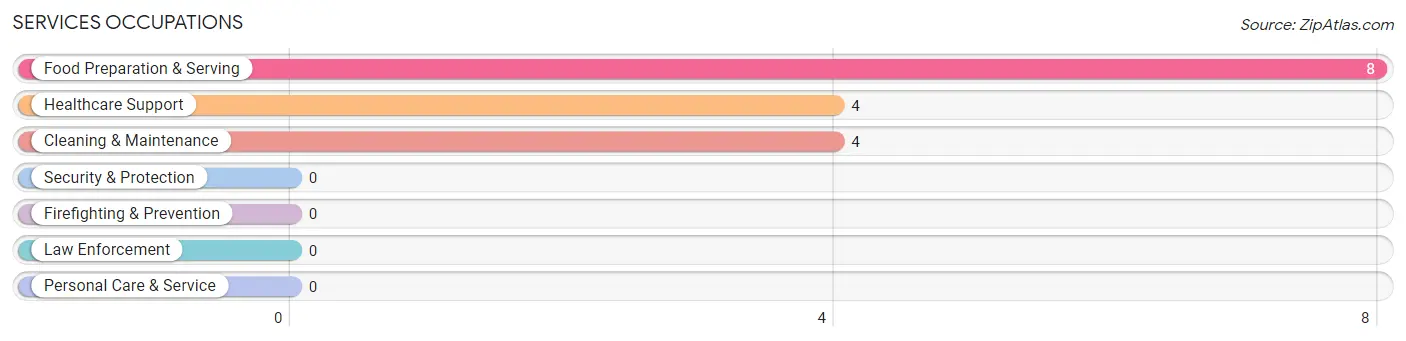
Services Occupations by Sex
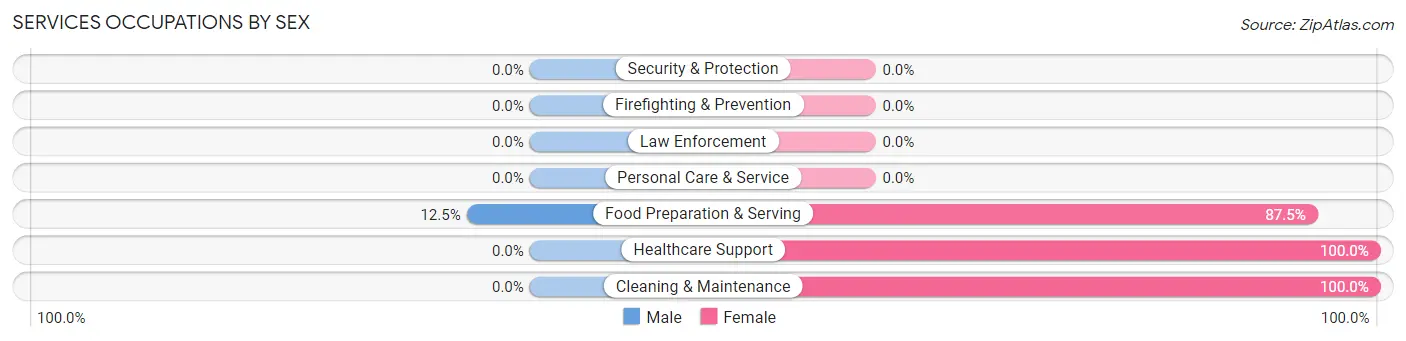
| Occupation | Male | Female |
| Healthcare Support | 0 (0.0%) | 4 (100.0%) |
| Security & Protection | 0 (0.0%) | 0 (0.0%) |
| Firefighting & Prevention | 0 (0.0%) | 0 (0.0%) |
| Law Enforcement | 0 (0.0%) | 0 (0.0%) |
| Food Preparation & Serving | 1 (12.5%) | 7 (87.5%) |
| Cleaning & Maintenance | 0 (0.0%) | 4 (100.0%) |
| Personal Care & Service | 0 (0.0%) | 0 (0.0%) |
| Total (Category) | 1 (6.2%) | 15 (93.8%) |
| Total (Overall) | 37 (53.6%) | 32 (46.4%) |
Sales and Office Occupations
The most common Sales and Office occupations in Burlington borough are , and Office & Administration (1 | 1.5%).

Sales and Office Occupations by Sex

| Occupation | Male | Female |
| Sales & Related | 0 (0.0%) | 0 (0.0%) |
| Office & Administration | 0 (0.0%) | 1 (100.0%) |
| Total (Category) | 0 (0.0%) | 1 (100.0%) |
| Total (Overall) | 37 (53.6%) | 32 (46.4%) |
Natural Resources, Construction and Maintenance Occupations
The most common Natural Resources, Construction and Maintenance occupations in Burlington borough are Construction & Extraction (6 | 8.7%), and Installation, Maintenance & Repair (4 | 5.8%).
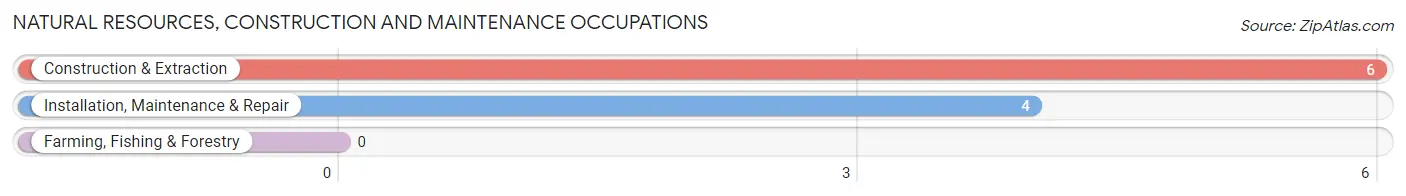
Natural Resources, Construction and Maintenance Occupations by Sex
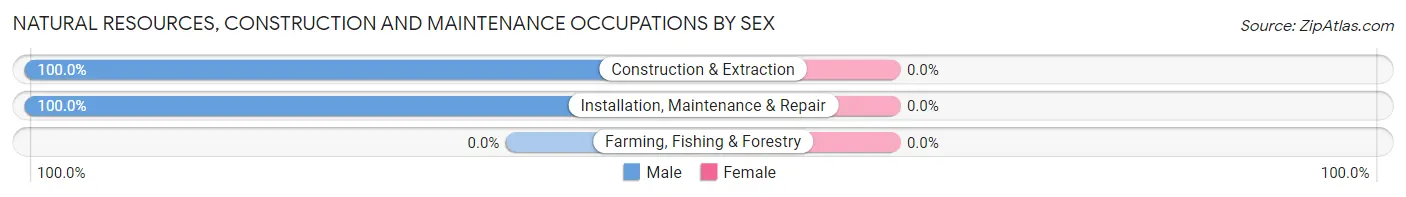
| Occupation | Male | Female |
| Farming, Fishing & Forestry | 0 (0.0%) | 0 (0.0%) |
| Construction & Extraction | 6 (100.0%) | 0 (0.0%) |
| Installation, Maintenance & Repair | 4 (100.0%) | 0 (0.0%) |
| Total (Category) | 10 (100.0%) | 0 (0.0%) |
| Total (Overall) | 37 (53.6%) | 32 (46.4%) |
Production, Transportation and Moving Occupations
The most common Production, Transportation and Moving occupations in Burlington borough are Transportation (16 | 23.2%), and Material Moving (8 | 11.6%).
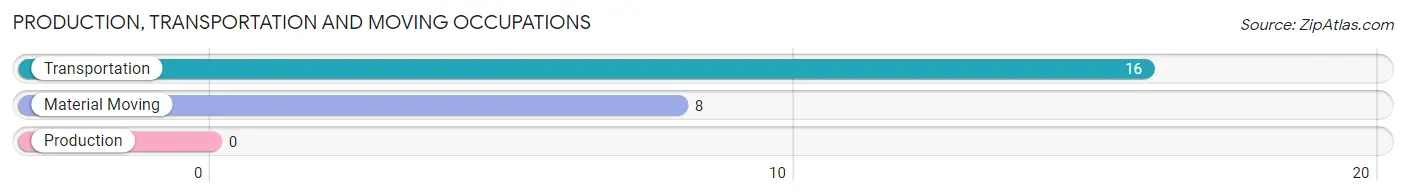
Production, Transportation and Moving Occupations by Sex
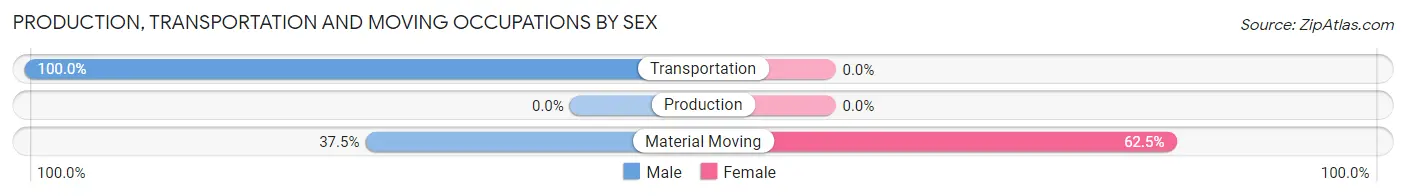
| Occupation | Male | Female |
| Production | 0 (0.0%) | 0 (0.0%) |
| Transportation | 16 (100.0%) | 0 (0.0%) |
| Material Moving | 3 (37.5%) | 5 (62.5%) |
| Total (Category) | 19 (79.2%) | 5 (20.8%) |
| Total (Overall) | 37 (53.6%) | 32 (46.4%) |
Employment Industries by Sex in Burlington borough
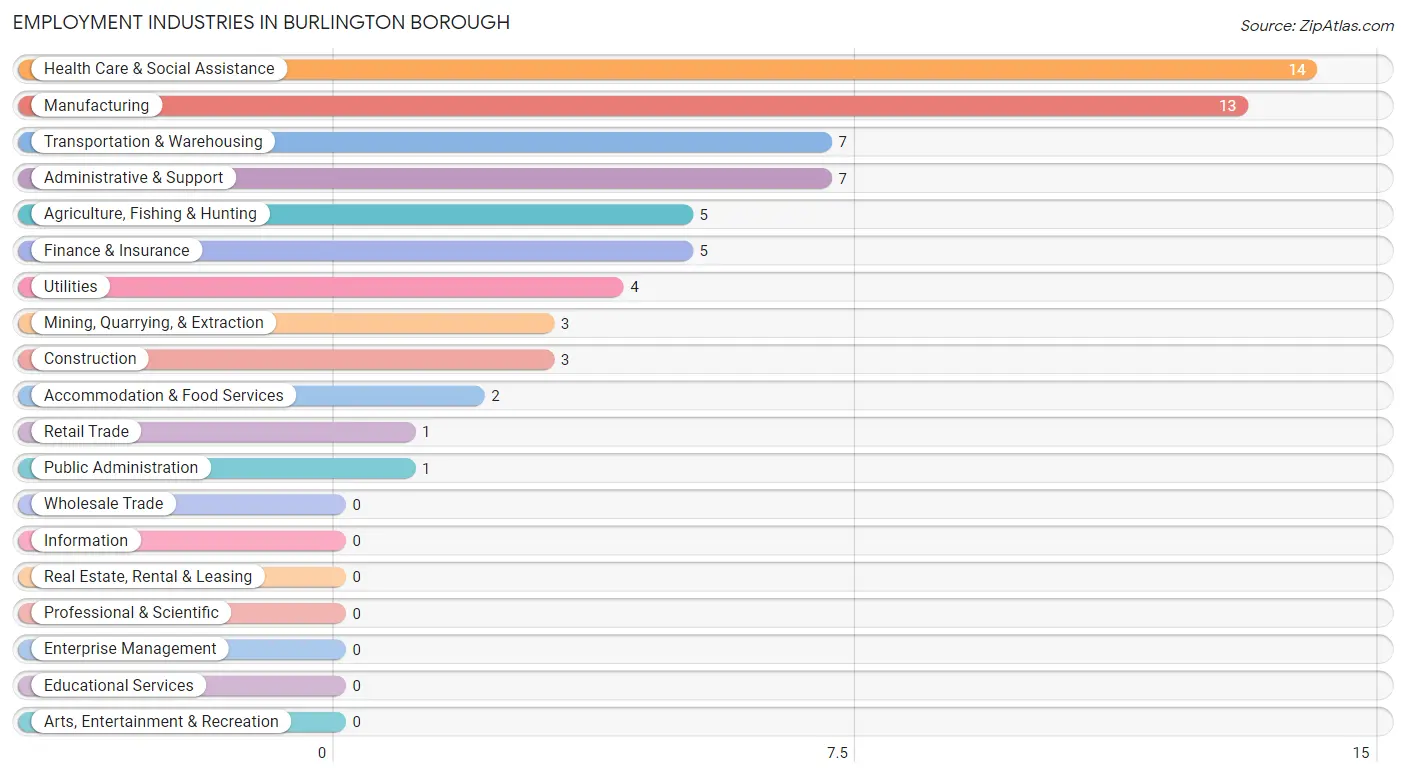
Employment Industries in Burlington borough
The major employment industries in Burlington borough include Health Care & Social Assistance (14 | 20.3%), Manufacturing (13 | 18.8%), Transportation & Warehousing (7 | 10.1%), Administrative & Support (7 | 10.1%), and Agriculture, Fishing & Hunting (5 | 7.2%).
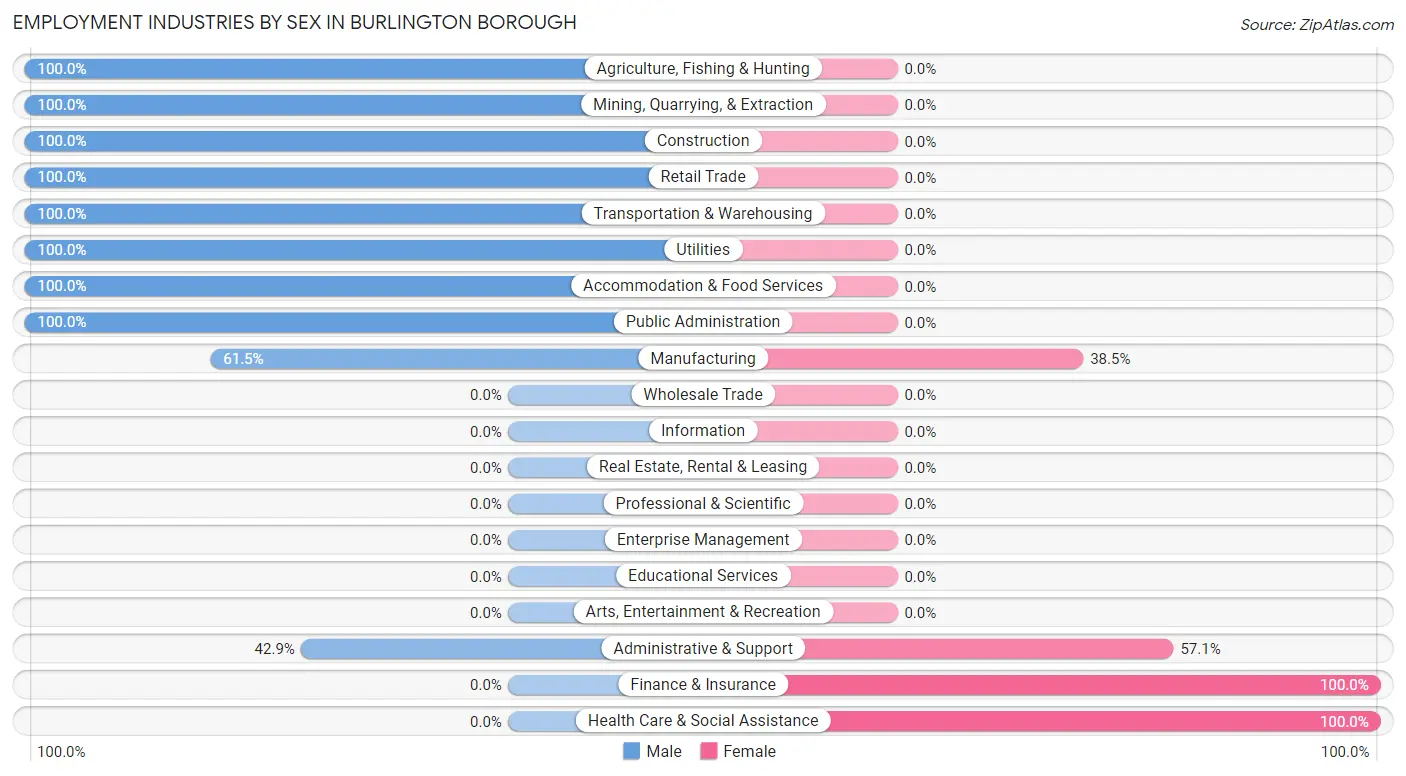
Employment Industries by Sex in Burlington borough
The Burlington borough industries that see more men than women are Agriculture, Fishing & Hunting (100.0%), Mining, Quarrying, & Extraction (100.0%), and Construction (100.0%), whereas the industries that tend to have a higher number of women are Finance & Insurance (100.0%), Health Care & Social Assistance (100.0%), and Administrative & Support (57.1%).
| Industry | Male | Female |
| Agriculture, Fishing & Hunting | 5 (100.0%) | 0 (0.0%) |
| Mining, Quarrying, & Extraction | 3 (100.0%) | 0 (0.0%) |
| Construction | 3 (100.0%) | 0 (0.0%) |
| Manufacturing | 8 (61.5%) | 5 (38.5%) |
| Wholesale Trade | 0 (0.0%) | 0 (0.0%) |
| Retail Trade | 1 (100.0%) | 0 (0.0%) |
| Transportation & Warehousing | 7 (100.0%) | 0 (0.0%) |
| Utilities | 4 (100.0%) | 0 (0.0%) |
| Information | 0 (0.0%) | 0 (0.0%) |
| Finance & Insurance | 0 (0.0%) | 5 (100.0%) |
| Real Estate, Rental & Leasing | 0 (0.0%) | 0 (0.0%) |
| Professional & Scientific | 0 (0.0%) | 0 (0.0%) |
| Enterprise Management | 0 (0.0%) | 0 (0.0%) |
| Administrative & Support | 3 (42.9%) | 4 (57.1%) |
| Educational Services | 0 (0.0%) | 0 (0.0%) |
| Health Care & Social Assistance | 0 (0.0%) | 14 (100.0%) |
| Arts, Entertainment & Recreation | 0 (0.0%) | 0 (0.0%) |
| Accommodation & Food Services | 2 (100.0%) | 0 (0.0%) |
| Public Administration | 1 (100.0%) | 0 (0.0%) |
| Total | 37 (53.6%) | 32 (46.4%) |
Education in Burlington borough
School Enrollment in Burlington borough
The most common levels of schooling among the 30 students in Burlington borough are middle school (11 | 36.7%), high school (7 | 23.3%), and nursery / preschool (5 | 16.7%).
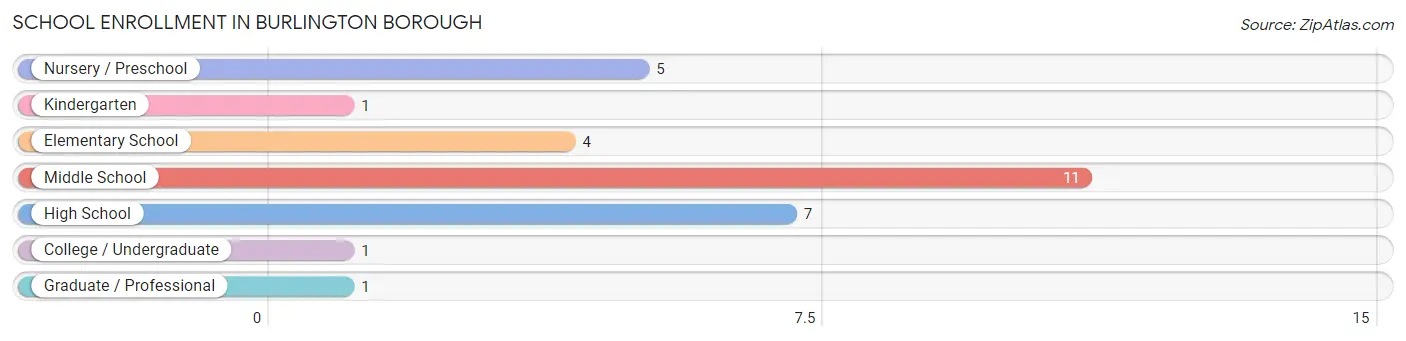
| School Level | # Students | % Students |
| Nursery / Preschool | 5 | 16.7% |
| Kindergarten | 1 | 3.3% |
| Elementary School | 4 | 13.3% |
| Middle School | 11 | 36.7% |
| High School | 7 | 23.3% |
| College / Undergraduate | 1 | 3.3% |
| Graduate / Professional | 1 | 3.3% |
| Total | 30 | 100.0% |
School Enrollment by Age by Funding Source in Burlington borough
Out of a total of 30 students who are enrolled in schools in Burlington borough, 1 (3.3%) attend a private institution, while the remaining 29 (96.7%) are enrolled in public schools. The age group of 35 years and over has the highest likelihood of being enrolled in private schools, with 1 (100.0% in the age bracket) enrolled. Conversely, the age group of 3 to 4 year olds has the lowest likelihood of being enrolled in a private school, with 5 (100.0% in the age bracket) attending a public institution.
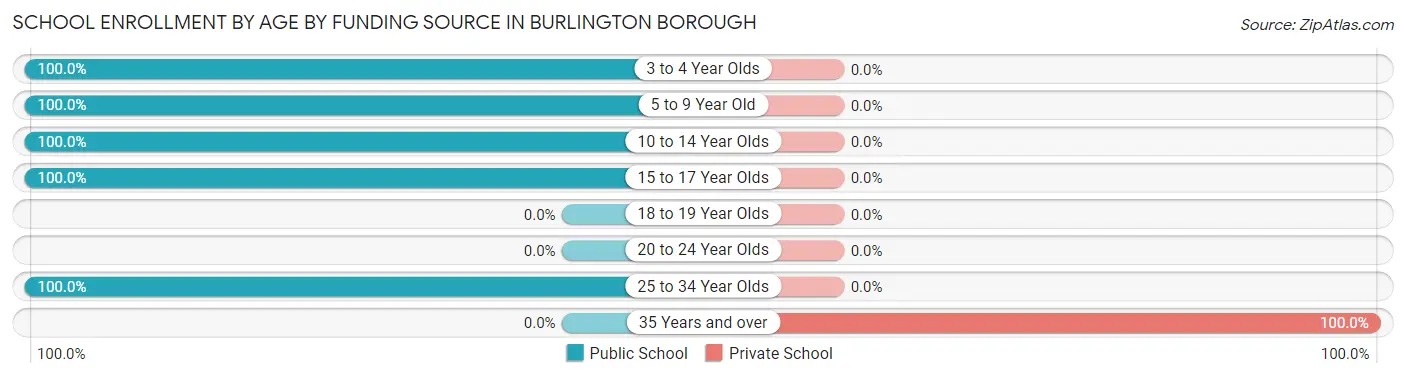
| Age Bracket | Public School | Private School |
| 3 to 4 Year Olds | 5 (100.0%) | 0 (0.0%) |
| 5 to 9 Year Old | 5 (100.0%) | 0 (0.0%) |
| 10 to 14 Year Olds | 11 (100.0%) | 0 (0.0%) |
| 15 to 17 Year Olds | 7 (100.0%) | 0 (0.0%) |
| 18 to 19 Year Olds | 0 (0.0%) | 0 (0.0%) |
| 20 to 24 Year Olds | 0 (0.0%) | 0 (0.0%) |
| 25 to 34 Year Olds | 1 (100.0%) | 0 (0.0%) |
| 35 Years and over | 0 (0.0%) | 1 (100.0%) |
| Total | 29 (96.7%) | 1 (3.3%) |
Educational Attainment by Field of Study in Burlington borough
Bio, nature & agricultural (9 | 81.8%), and arts & humanities (2 | 18.2%) are the most common fields of study among 11 individuals in Burlington borough who have obtained a bachelor's degree or higher.
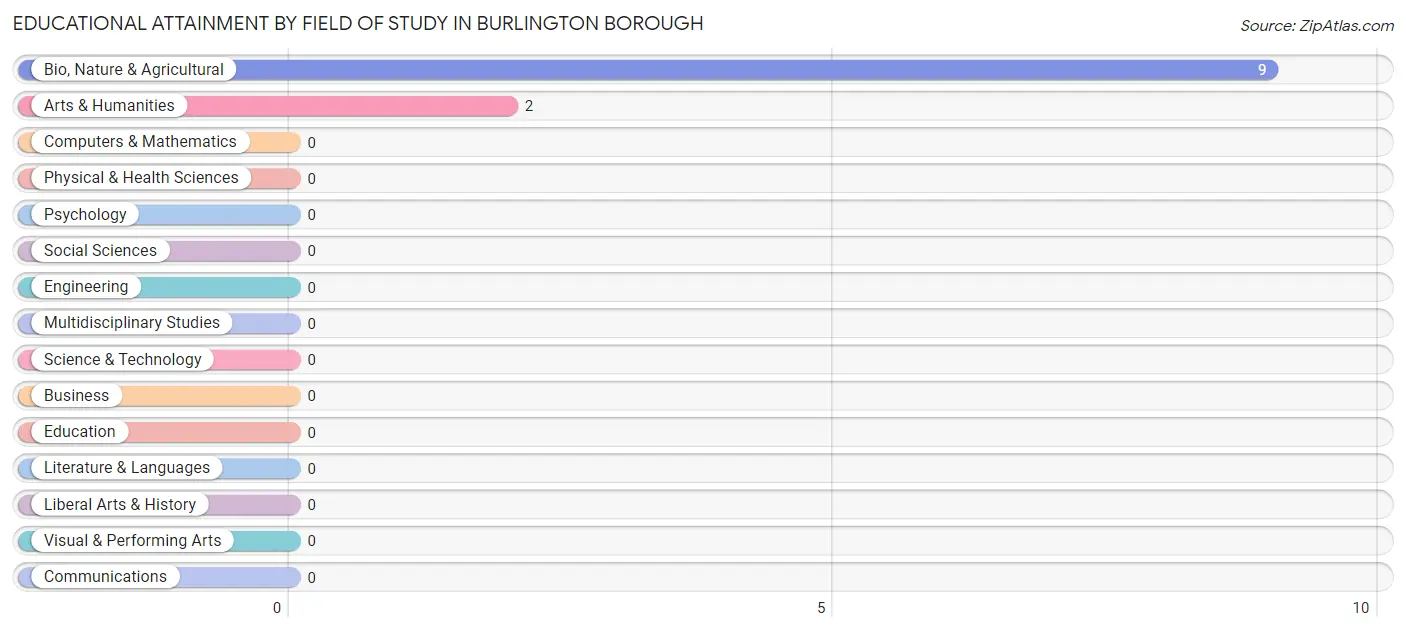
| Field of Study | # Graduates | % Graduates |
| Computers & Mathematics | 0 | 0.0% |
| Bio, Nature & Agricultural | 9 | 81.8% |
| Physical & Health Sciences | 0 | 0.0% |
| Psychology | 0 | 0.0% |
| Social Sciences | 0 | 0.0% |
| Engineering | 0 | 0.0% |
| Multidisciplinary Studies | 0 | 0.0% |
| Science & Technology | 0 | 0.0% |
| Business | 0 | 0.0% |
| Education | 0 | 0.0% |
| Literature & Languages | 0 | 0.0% |
| Liberal Arts & History | 0 | 0.0% |
| Visual & Performing Arts | 0 | 0.0% |
| Communications | 0 | 0.0% |
| Arts & Humanities | 2 | 18.2% |
| Total | 11 | 100.0% |
Transportation & Commute in Burlington borough
Vehicle Availability by Sex in Burlington borough
The most prevalent vehicle ownership categories in Burlington borough are males with 2 vehicles (13, accounting for 41.9%) and females with 2 vehicles (16, making up 40.6%).
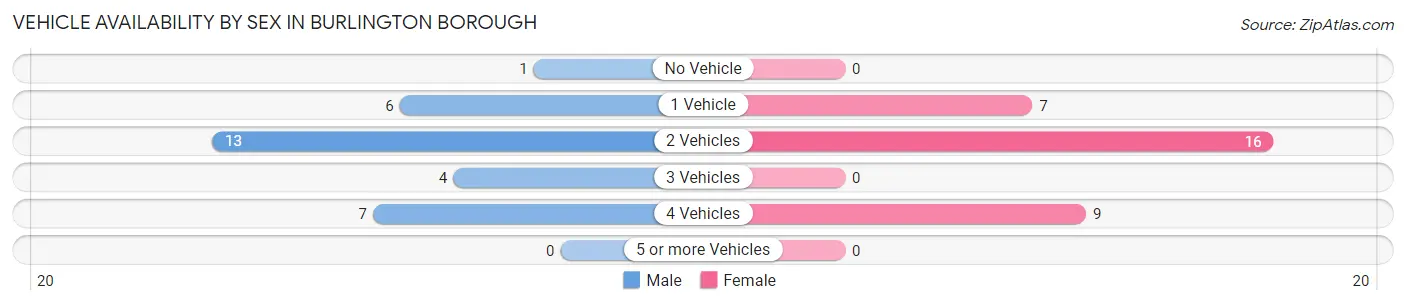
| Vehicles Available | Male | Female |
| No Vehicle | 1 (3.2%) | 0 (0.0%) |
| 1 Vehicle | 6 (19.4%) | 7 (21.9%) |
| 2 Vehicles | 13 (41.9%) | 16 (50.0%) |
| 3 Vehicles | 4 (12.9%) | 0 (0.0%) |
| 4 Vehicles | 7 (22.6%) | 9 (28.1%) |
| 5 or more Vehicles | 0 (0.0%) | 0 (0.0%) |
| Total | 31 (100.0%) | 32 (100.0%) |
Commute Time in Burlington borough
The most frequently occuring commute durations in Burlington borough are 15 to 19 minutes (18 commuters, 28.6%), 20 to 24 minutes (15 commuters, 23.8%), and less than 5 minutes (5 commuters, 7.9%).
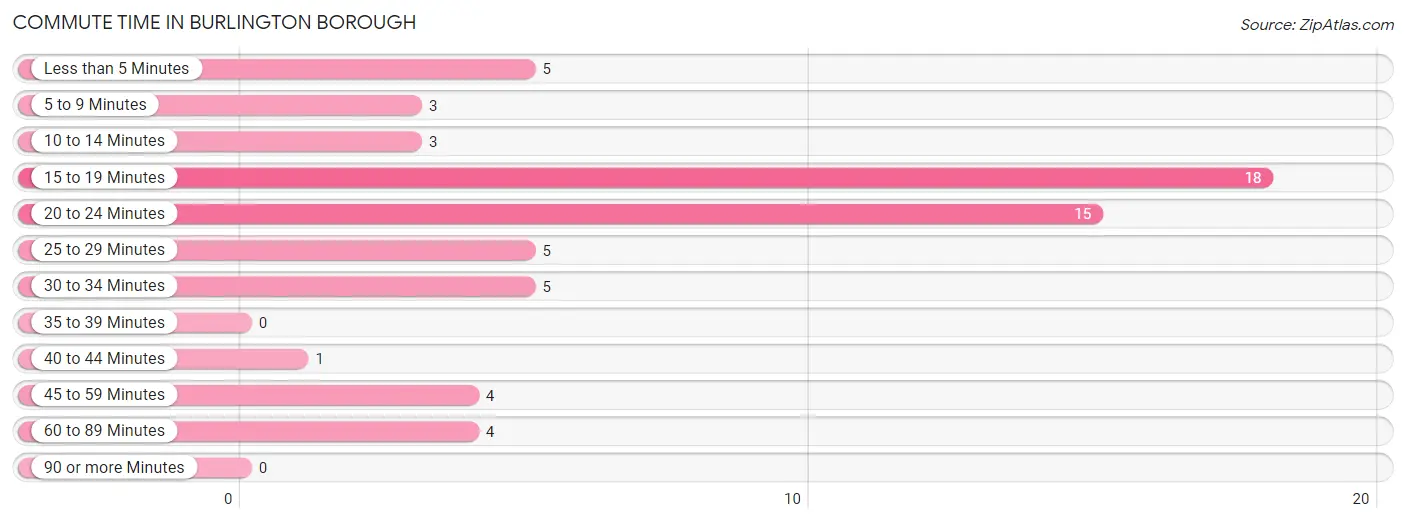
| Commute Time | # Commuters | % Commuters |
| Less than 5 Minutes | 5 | 7.9% |
| 5 to 9 Minutes | 3 | 4.8% |
| 10 to 14 Minutes | 3 | 4.8% |
| 15 to 19 Minutes | 18 | 28.6% |
| 20 to 24 Minutes | 15 | 23.8% |
| 25 to 29 Minutes | 5 | 7.9% |
| 30 to 34 Minutes | 5 | 7.9% |
| 35 to 39 Minutes | 0 | 0.0% |
| 40 to 44 Minutes | 1 | 1.6% |
| 45 to 59 Minutes | 4 | 6.4% |
| 60 to 89 Minutes | 4 | 6.4% |
| 90 or more Minutes | 0 | 0.0% |
Commute Time by Sex in Burlington borough
The most common commute times in Burlington borough are 15 to 19 minutes (14 commuters, 45.2%) for males and 20 to 24 minutes (10 commuters, 31.2%) for females.
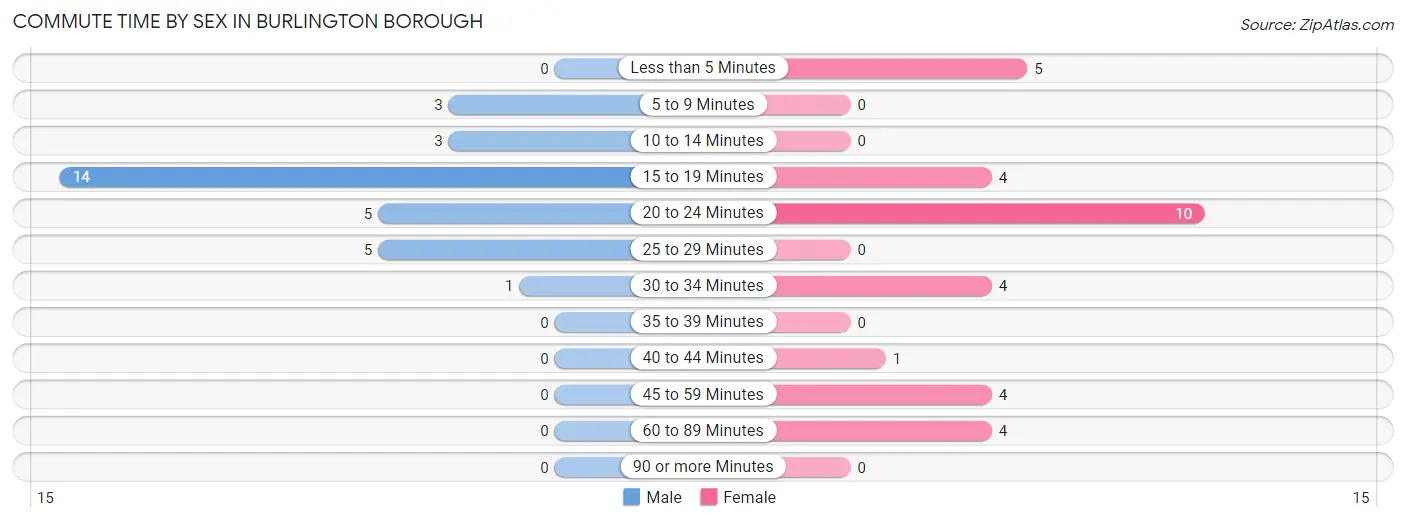
| Commute Time | Male | Female |
| Less than 5 Minutes | 0 (0.0%) | 5 (15.6%) |
| 5 to 9 Minutes | 3 (9.7%) | 0 (0.0%) |
| 10 to 14 Minutes | 3 (9.7%) | 0 (0.0%) |
| 15 to 19 Minutes | 14 (45.2%) | 4 (12.5%) |
| 20 to 24 Minutes | 5 (16.1%) | 10 (31.2%) |
| 25 to 29 Minutes | 5 (16.1%) | 0 (0.0%) |
| 30 to 34 Minutes | 1 (3.2%) | 4 (12.5%) |
| 35 to 39 Minutes | 0 (0.0%) | 0 (0.0%) |
| 40 to 44 Minutes | 0 (0.0%) | 1 (3.1%) |
| 45 to 59 Minutes | 0 (0.0%) | 4 (12.5%) |
| 60 to 89 Minutes | 0 (0.0%) | 4 (12.5%) |
| 90 or more Minutes | 0 (0.0%) | 0 (0.0%) |
Time of Departure to Work by Sex in Burlington borough
The most frequent times of departure to work in Burlington borough are 7:00 AM to 7:29 AM (13, 41.9%) for males and 6:00 AM to 6:29 AM (7, 21.9%) for females.
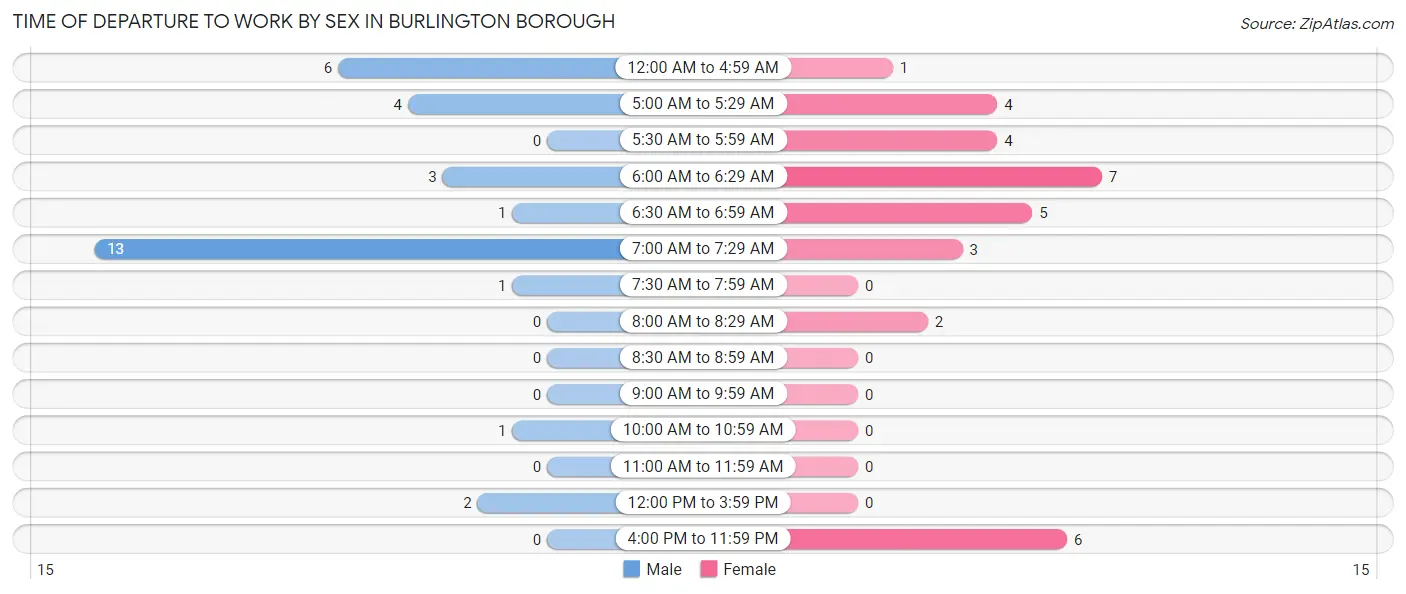
| Time of Departure | Male | Female |
| 12:00 AM to 4:59 AM | 6 (19.4%) | 1 (3.1%) |
| 5:00 AM to 5:29 AM | 4 (12.9%) | 4 (12.5%) |
| 5:30 AM to 5:59 AM | 0 (0.0%) | 4 (12.5%) |
| 6:00 AM to 6:29 AM | 3 (9.7%) | 7 (21.9%) |
| 6:30 AM to 6:59 AM | 1 (3.2%) | 5 (15.6%) |
| 7:00 AM to 7:29 AM | 13 (41.9%) | 3 (9.4%) |
| 7:30 AM to 7:59 AM | 1 (3.2%) | 0 (0.0%) |
| 8:00 AM to 8:29 AM | 0 (0.0%) | 2 (6.2%) |
| 8:30 AM to 8:59 AM | 0 (0.0%) | 0 (0.0%) |
| 9:00 AM to 9:59 AM | 0 (0.0%) | 0 (0.0%) |
| 10:00 AM to 10:59 AM | 1 (3.2%) | 0 (0.0%) |
| 11:00 AM to 11:59 AM | 0 (0.0%) | 0 (0.0%) |
| 12:00 PM to 3:59 PM | 2 (6.5%) | 0 (0.0%) |
| 4:00 PM to 11:59 PM | 0 (0.0%) | 6 (18.8%) |
| Total | 31 (100.0%) | 32 (100.0%) |
Housing Occupancy in Burlington borough
Occupancy by Ownership in Burlington borough
Of the total 65 dwellings in Burlington borough, owner-occupied units account for 53 (81.5%), while renter-occupied units make up 12 (18.5%).
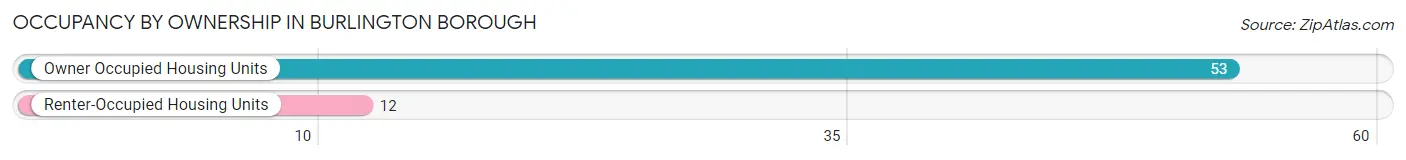
| Occupancy | # Housing Units | % Housing Units |
| Owner Occupied Housing Units | 53 | 81.5% |
| Renter-Occupied Housing Units | 12 | 18.5% |
| Total Occupied Housing Units | 65 | 100.0% |
Occupancy by Household Size in Burlington borough
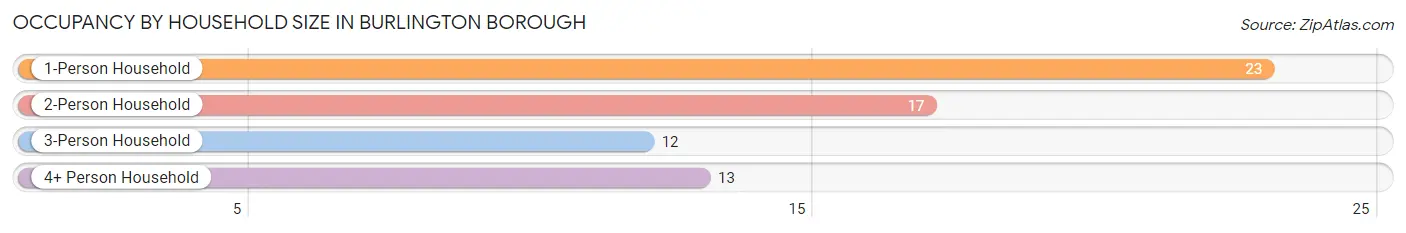
| Household Size | # Housing Units | % Housing Units |
| 1-Person Household | 23 | 35.4% |
| 2-Person Household | 17 | 26.2% |
| 3-Person Household | 12 | 18.5% |
| 4+ Person Household | 13 | 20.0% |
| Total Housing Units | 65 | 100.0% |
Occupancy by Ownership by Household Size in Burlington borough
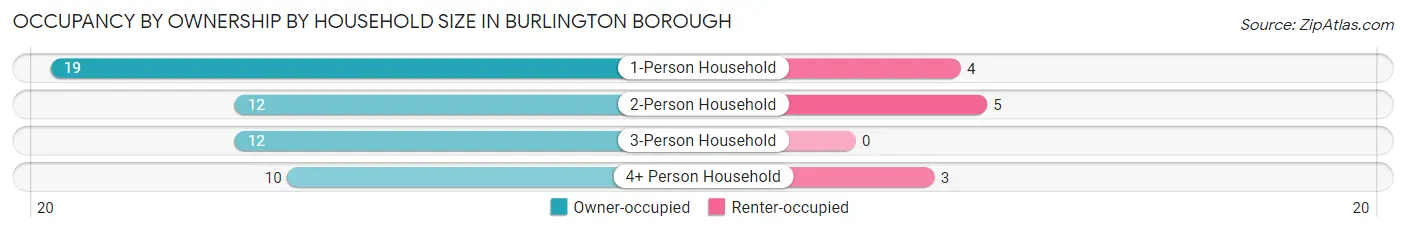
| Household Size | Owner-occupied | Renter-occupied |
| 1-Person Household | 19 (82.6%) | 4 (17.4%) |
| 2-Person Household | 12 (70.6%) | 5 (29.4%) |
| 3-Person Household | 12 (100.0%) | 0 (0.0%) |
| 4+ Person Household | 10 (76.9%) | 3 (23.1%) |
| Total Housing Units | 53 (81.5%) | 12 (18.5%) |
Occupancy by Educational Attainment in Burlington borough
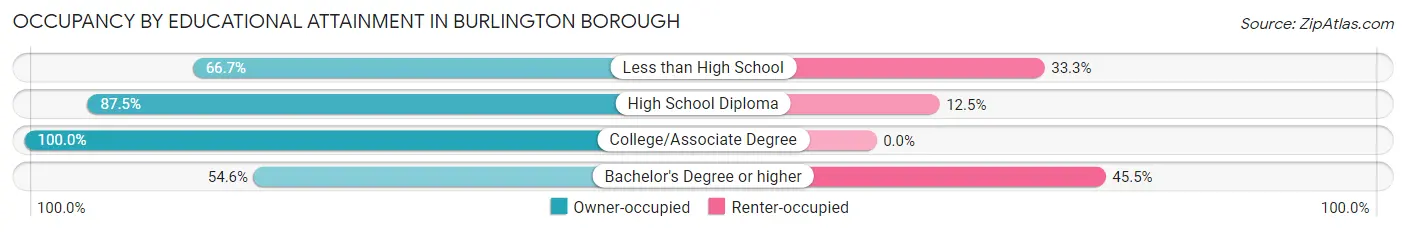
| Household Size | Owner-occupied | Renter-occupied |
| Less than High School | 8 (66.7%) | 4 (33.3%) |
| High School Diploma | 21 (87.5%) | 3 (12.5%) |
| College/Associate Degree | 18 (100.0%) | 0 (0.0%) |
| Bachelor's Degree or higher | 6 (54.5%) | 5 (45.5%) |
Occupancy by Age of Householder in Burlington borough
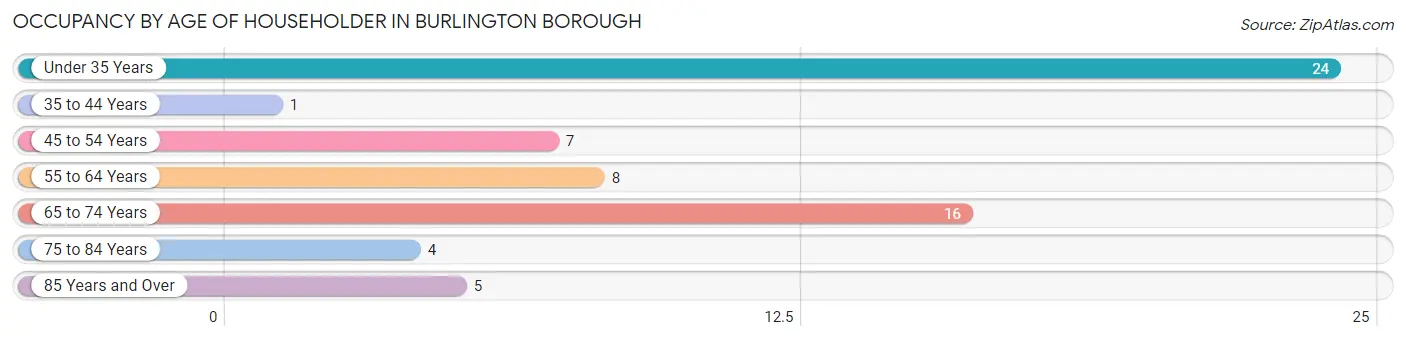
| Age Bracket | # Households | % Households |
| Under 35 Years | 24 | 36.9% |
| 35 to 44 Years | 1 | 1.5% |
| 45 to 54 Years | 7 | 10.8% |
| 55 to 64 Years | 8 | 12.3% |
| 65 to 74 Years | 16 | 24.6% |
| 75 to 84 Years | 4 | 6.1% |
| 85 Years and Over | 5 | 7.7% |
| Total | 65 | 100.0% |
Housing Finances in Burlington borough
Median Income by Occupancy in Burlington borough
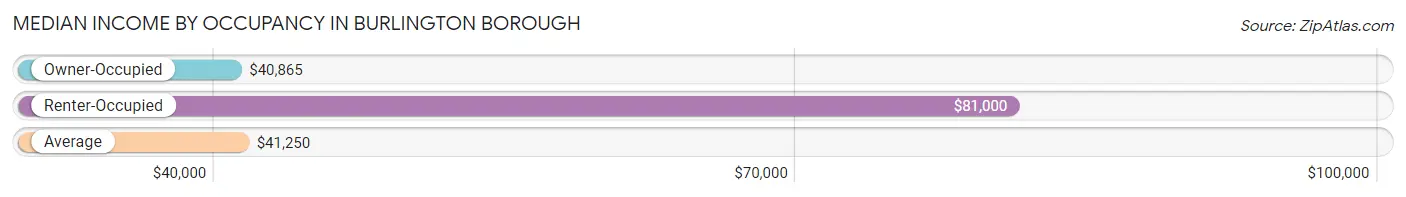
| Occupancy Type | # Households | Median Income |
| Owner-Occupied | 53 (81.5%) | $40,865 |
| Renter-Occupied | 12 (18.5%) | $81,000 |
| Average | 65 (100.0%) | $41,250 |
Occupancy by Householder Income Bracket in Burlington borough
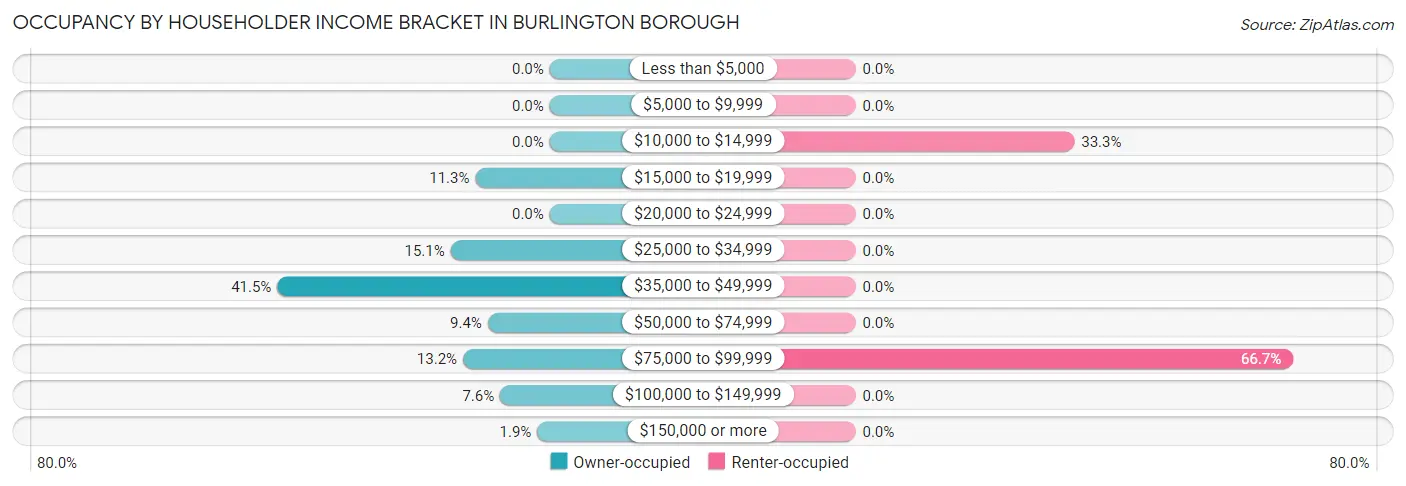
| Income Bracket | Owner-occupied | Renter-occupied |
| Less than $5,000 | 0 (0.0%) | 0 (0.0%) |
| $5,000 to $9,999 | 0 (0.0%) | 0 (0.0%) |
| $10,000 to $14,999 | 0 (0.0%) | 4 (33.3%) |
| $15,000 to $19,999 | 6 (11.3%) | 0 (0.0%) |
| $20,000 to $24,999 | 0 (0.0%) | 0 (0.0%) |
| $25,000 to $34,999 | 8 (15.1%) | 0 (0.0%) |
| $35,000 to $49,999 | 22 (41.5%) | 0 (0.0%) |
| $50,000 to $74,999 | 5 (9.4%) | 0 (0.0%) |
| $75,000 to $99,999 | 7 (13.2%) | 8 (66.7%) |
| $100,000 to $149,999 | 4 (7.5%) | 0 (0.0%) |
| $150,000 or more | 1 (1.9%) | 0 (0.0%) |
| Total | 53 (100.0%) | 12 (100.0%) |
Monthly Housing Cost Tiers in Burlington borough
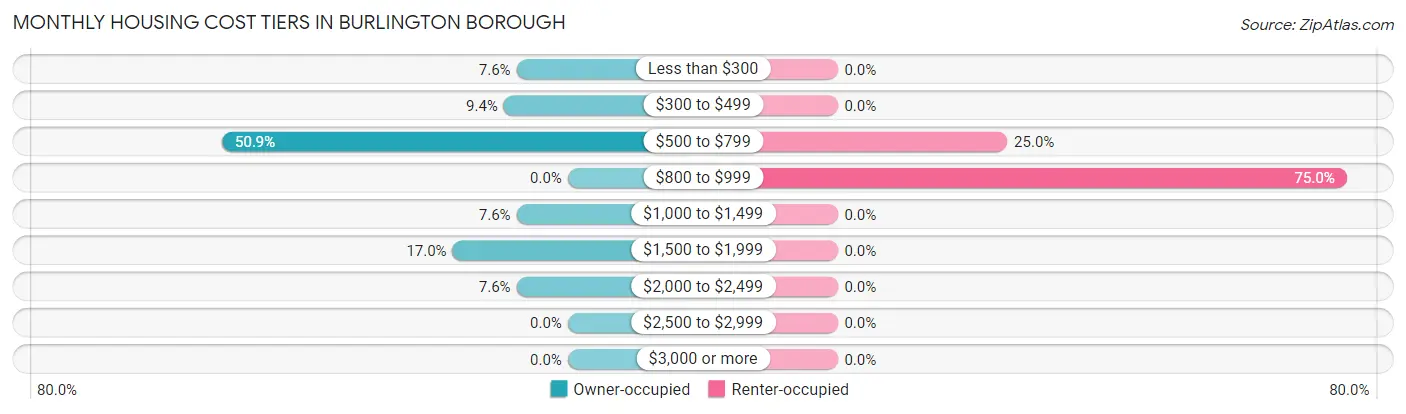
| Monthly Cost | Owner-occupied | Renter-occupied |
| Less than $300 | 4 (7.5%) | 0 (0.0%) |
| $300 to $499 | 5 (9.4%) | 0 (0.0%) |
| $500 to $799 | 27 (50.9%) | 3 (25.0%) |
| $800 to $999 | 0 (0.0%) | 9 (75.0%) |
| $1,000 to $1,499 | 4 (7.5%) | 0 (0.0%) |
| $1,500 to $1,999 | 9 (17.0%) | 0 (0.0%) |
| $2,000 to $2,499 | 4 (7.5%) | 0 (0.0%) |
| $2,500 to $2,999 | 0 (0.0%) | 0 (0.0%) |
| $3,000 or more | 0 (0.0%) | 0 (0.0%) |
| Total | 53 (100.0%) | 12 (100.0%) |
Physical Housing Characteristics in Burlington borough
Housing Structures in Burlington borough
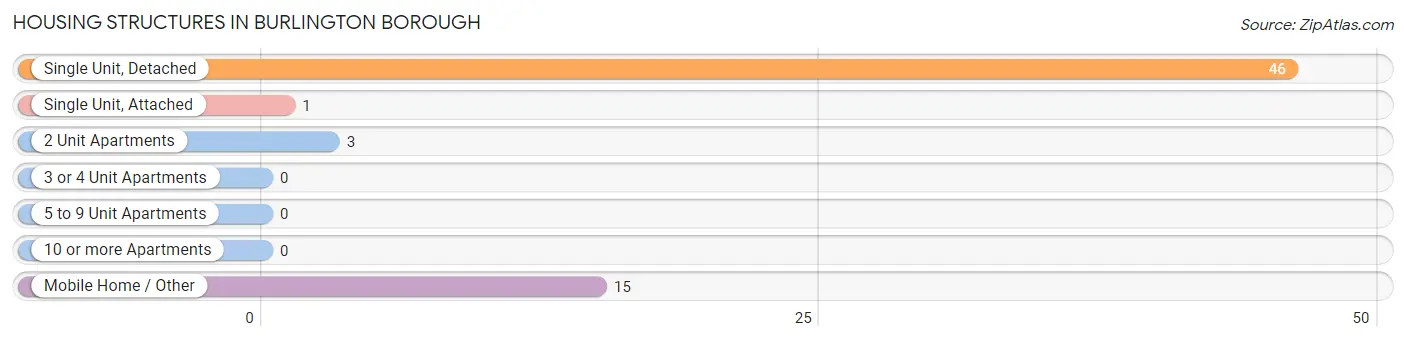
| Structure Type | # Housing Units | % Housing Units |
| Single Unit, Detached | 46 | 70.8% |
| Single Unit, Attached | 1 | 1.5% |
| 2 Unit Apartments | 3 | 4.6% |
| 3 or 4 Unit Apartments | 0 | 0.0% |
| 5 to 9 Unit Apartments | 0 | 0.0% |
| 10 or more Apartments | 0 | 0.0% |
| Mobile Home / Other | 15 | 23.1% |
| Total | 65 | 100.0% |
Housing Structures by Occupancy in Burlington borough
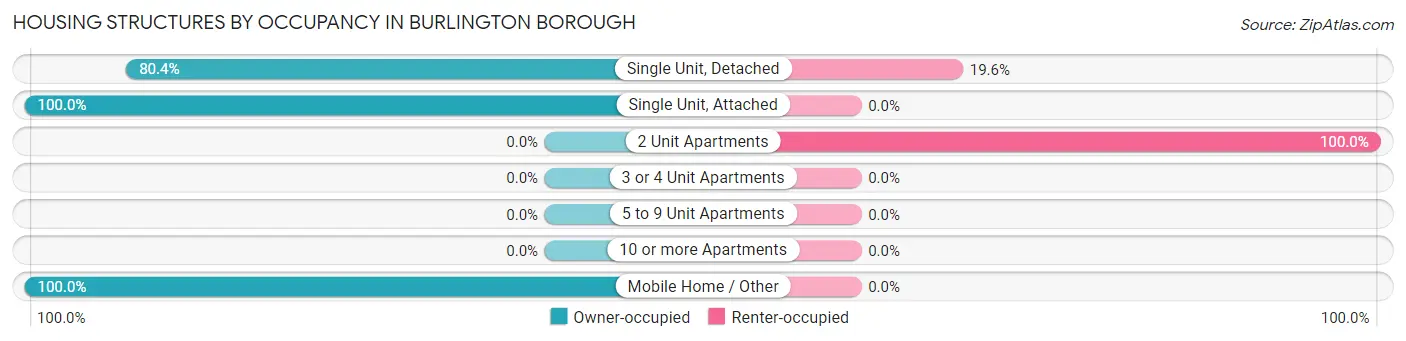
| Structure Type | Owner-occupied | Renter-occupied |
| Single Unit, Detached | 37 (80.4%) | 9 (19.6%) |
| Single Unit, Attached | 1 (100.0%) | 0 (0.0%) |
| 2 Unit Apartments | 0 (0.0%) | 3 (100.0%) |
| 3 or 4 Unit Apartments | 0 (0.0%) | 0 (0.0%) |
| 5 to 9 Unit Apartments | 0 (0.0%) | 0 (0.0%) |
| 10 or more Apartments | 0 (0.0%) | 0 (0.0%) |
| Mobile Home / Other | 15 (100.0%) | 0 (0.0%) |
| Total | 53 (81.5%) | 12 (18.5%) |
Housing Structures by Number of Rooms in Burlington borough
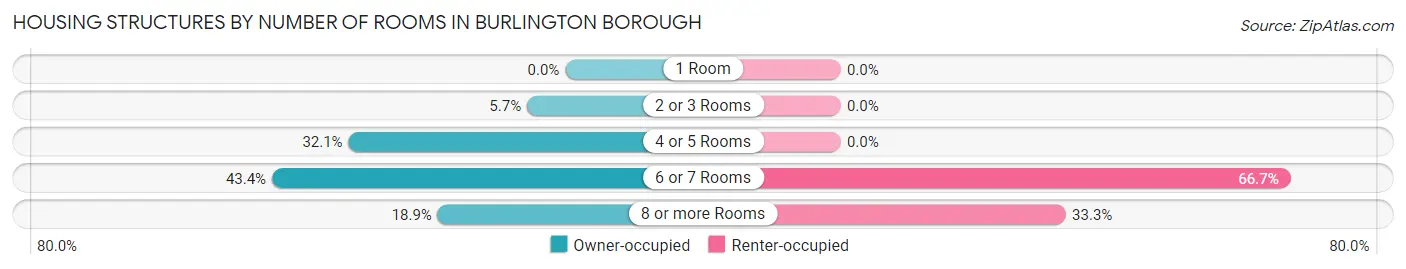
| Number of Rooms | Owner-occupied | Renter-occupied |
| 1 Room | 0 (0.0%) | 0 (0.0%) |
| 2 or 3 Rooms | 3 (5.7%) | 0 (0.0%) |
| 4 or 5 Rooms | 17 (32.1%) | 0 (0.0%) |
| 6 or 7 Rooms | 23 (43.4%) | 8 (66.7%) |
| 8 or more Rooms | 10 (18.9%) | 4 (33.3%) |
| Total | 53 (100.0%) | 12 (100.0%) |
Housing Structure by Heating Type in Burlington borough
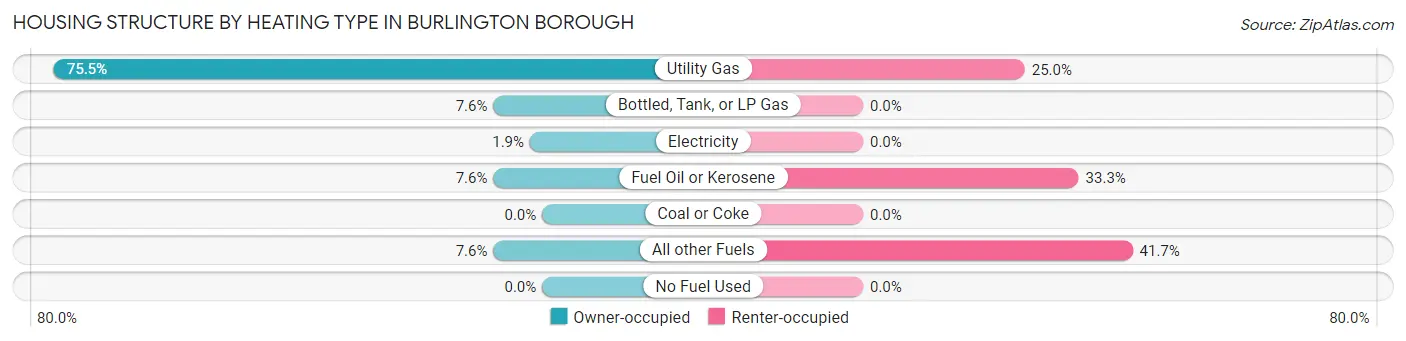
| Heating Type | Owner-occupied | Renter-occupied |
| Utility Gas | 40 (75.5%) | 3 (25.0%) |
| Bottled, Tank, or LP Gas | 4 (7.5%) | 0 (0.0%) |
| Electricity | 1 (1.9%) | 0 (0.0%) |
| Fuel Oil or Kerosene | 4 (7.5%) | 4 (33.3%) |
| Coal or Coke | 0 (0.0%) | 0 (0.0%) |
| All other Fuels | 4 (7.5%) | 5 (41.7%) |
| No Fuel Used | 0 (0.0%) | 0 (0.0%) |
| Total | 53 (100.0%) | 12 (100.0%) |
Household Vehicle Usage in Burlington borough
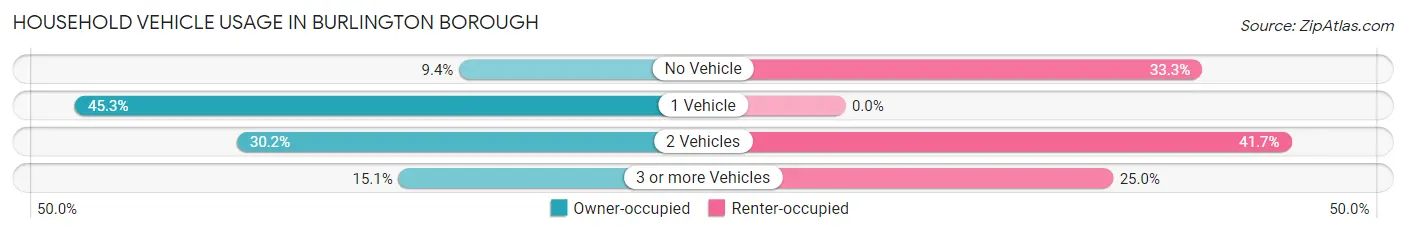
| Vehicles per Household | Owner-occupied | Renter-occupied |
| No Vehicle | 5 (9.4%) | 4 (33.3%) |
| 1 Vehicle | 24 (45.3%) | 0 (0.0%) |
| 2 Vehicles | 16 (30.2%) | 5 (41.7%) |
| 3 or more Vehicles | 8 (15.1%) | 3 (25.0%) |
| Total | 53 (100.0%) | 12 (100.0%) |
Real Estate & Mortgages in Burlington borough
Real Estate and Mortgage Overview in Burlington borough
| Characteristic | Without Mortgage | With Mortgage |
| Housing Units | 32 | 21 |
| Median Property Value | $75,000 | $254,200 |
| Median Household Income | $36,875 | $1 |
| Monthly Housing Costs | $613 | $0 |
| Real Estate Taxes | $917 | $1 |
Property Value by Mortgage Status in Burlington borough
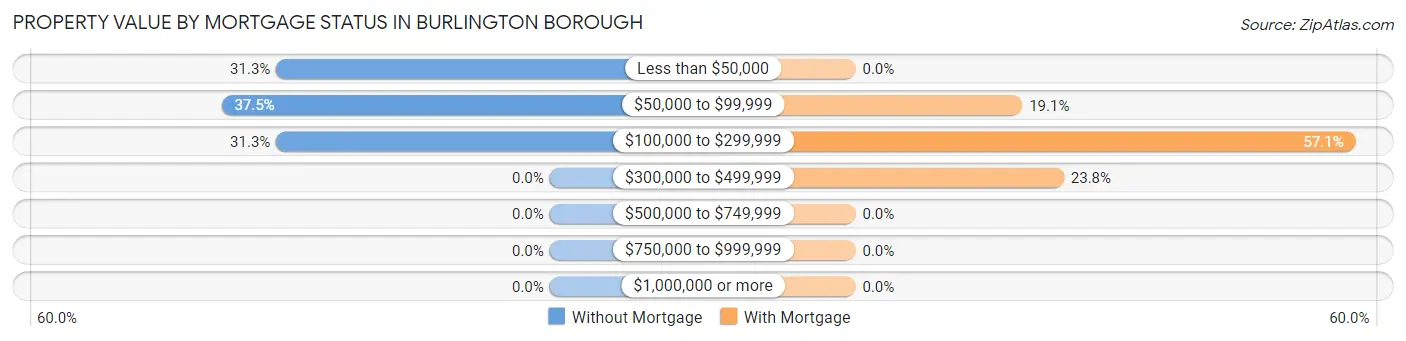
| Property Value | Without Mortgage | With Mortgage |
| Less than $50,000 | 10 (31.2%) | 0 (0.0%) |
| $50,000 to $99,999 | 12 (37.5%) | 4 (19.1%) |
| $100,000 to $299,999 | 10 (31.2%) | 12 (57.1%) |
| $300,000 to $499,999 | 0 (0.0%) | 5 (23.8%) |
| $500,000 to $749,999 | 0 (0.0%) | 0 (0.0%) |
| $750,000 to $999,999 | 0 (0.0%) | 0 (0.0%) |
| $1,000,000 or more | 0 (0.0%) | 0 (0.0%) |
| Total | 32 (100.0%) | 21 (100.0%) |
Household Income by Mortgage Status in Burlington borough
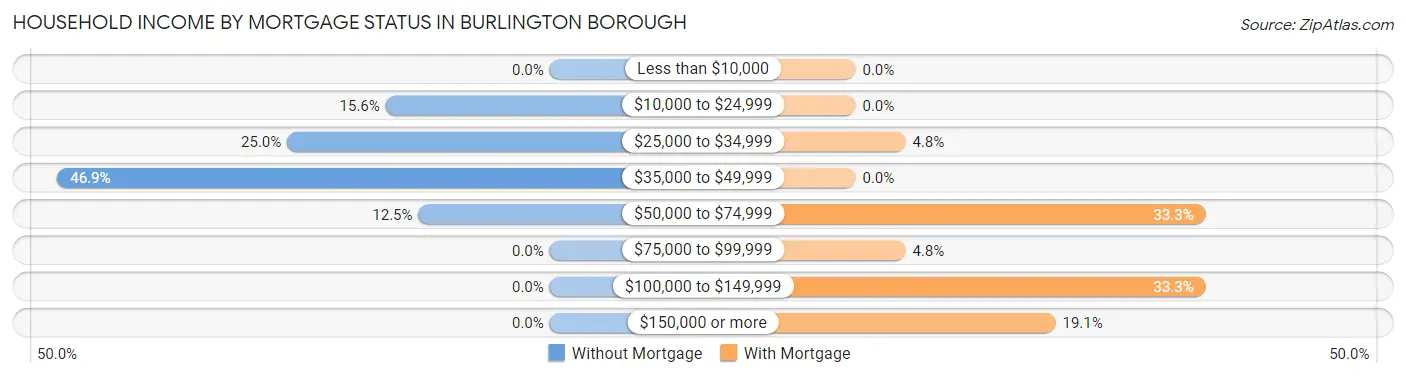
| Household Income | Without Mortgage | With Mortgage |
| Less than $10,000 | 0 (0.0%) | 0 (0.0%) |
| $10,000 to $24,999 | 5 (15.6%) | 0 (0.0%) |
| $25,000 to $34,999 | 8 (25.0%) | 1 (4.8%) |
| $35,000 to $49,999 | 15 (46.9%) | 0 (0.0%) |
| $50,000 to $74,999 | 4 (12.5%) | 7 (33.3%) |
| $75,000 to $99,999 | 0 (0.0%) | 1 (4.8%) |
| $100,000 to $149,999 | 0 (0.0%) | 7 (33.3%) |
| $150,000 or more | 0 (0.0%) | 4 (19.1%) |
| Total | 32 (100.0%) | 21 (100.0%) |
Property Value to Household Income Ratio in Burlington borough
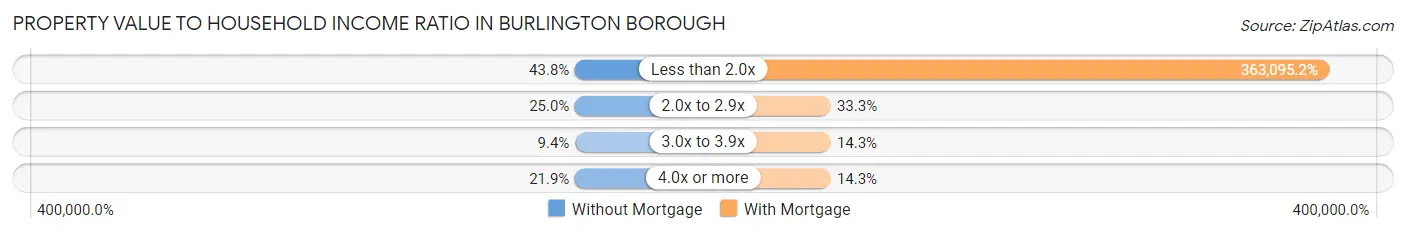
| Value-to-Income Ratio | Without Mortgage | With Mortgage |
| Less than 2.0x | 14 (43.8%) | 76,250 (363,095.2%) |
| 2.0x to 2.9x | 8 (25.0%) | 7 (33.3%) |
| 3.0x to 3.9x | 3 (9.4%) | 3 (14.3%) |
| 4.0x or more | 7 (21.9%) | 3 (14.3%) |
| Total | 32 (100.0%) | 21 (100.0%) |
Real Estate Taxes by Mortgage Status in Burlington borough
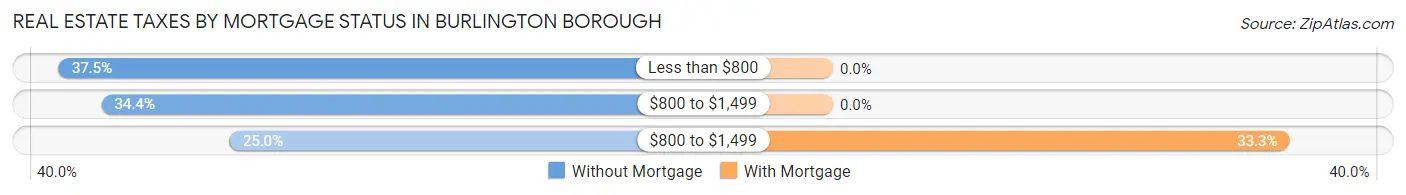
| Property Taxes | Without Mortgage | With Mortgage |
| Less than $800 | 12 (37.5%) | 0 (0.0%) |
| $800 to $1,499 | 11 (34.4%) | 0 (0.0%) |
| $800 to $1,499 | 8 (25.0%) | 7 (33.3%) |
| Total | 32 (100.0%) | 21 (100.0%) |
Health & Disability in Burlington borough
Health Insurance Coverage by Age in Burlington borough
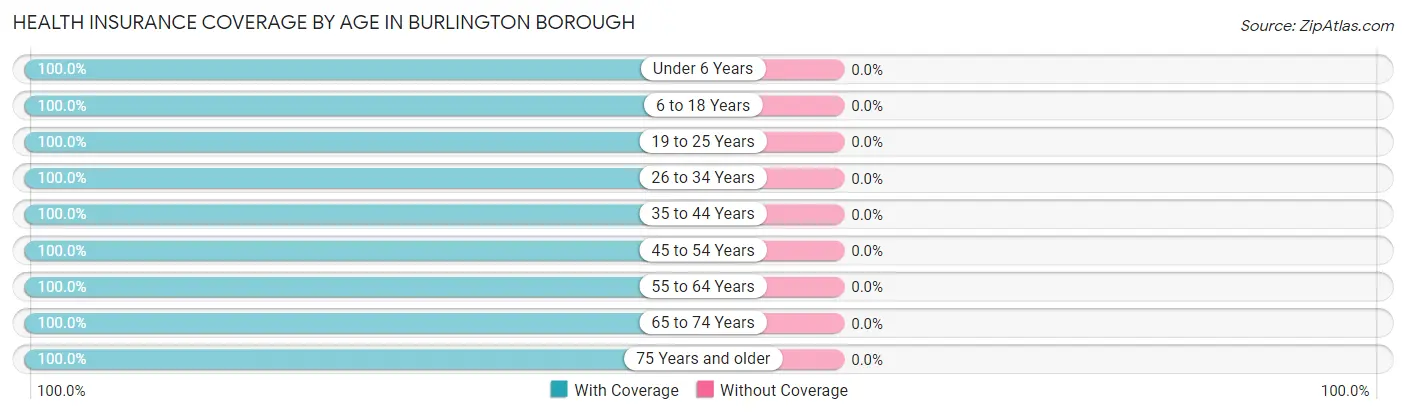
| Age Bracket | With Coverage | Without Coverage |
| Under 6 Years | 15 (100.0%) | 0 (0.0%) |
| 6 to 18 Years | 22 (100.0%) | 0 (0.0%) |
| 19 to 25 Years | 23 (100.0%) | 0 (0.0%) |
| 26 to 34 Years | 28 (100.0%) | 0 (0.0%) |
| 35 to 44 Years | 4 (100.0%) | 0 (0.0%) |
| 45 to 54 Years | 19 (100.0%) | 0 (0.0%) |
| 55 to 64 Years | 8 (100.0%) | 0 (0.0%) |
| 65 to 74 Years | 21 (100.0%) | 0 (0.0%) |
| 75 Years and older | 14 (100.0%) | 0 (0.0%) |
| Total | 154 (100.0%) | 0 (0.0%) |
Health Insurance Coverage by Citizenship Status in Burlington borough
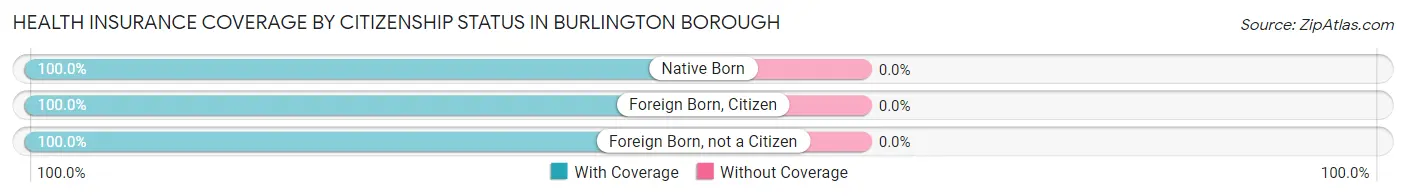
| Citizenship Status | With Coverage | Without Coverage |
| Native Born | 15 (100.0%) | 0 (0.0%) |
| Foreign Born, Citizen | 22 (100.0%) | 0 (0.0%) |
| Foreign Born, not a Citizen | 23 (100.0%) | 0 (0.0%) |
Health Insurance Coverage by Household Income in Burlington borough
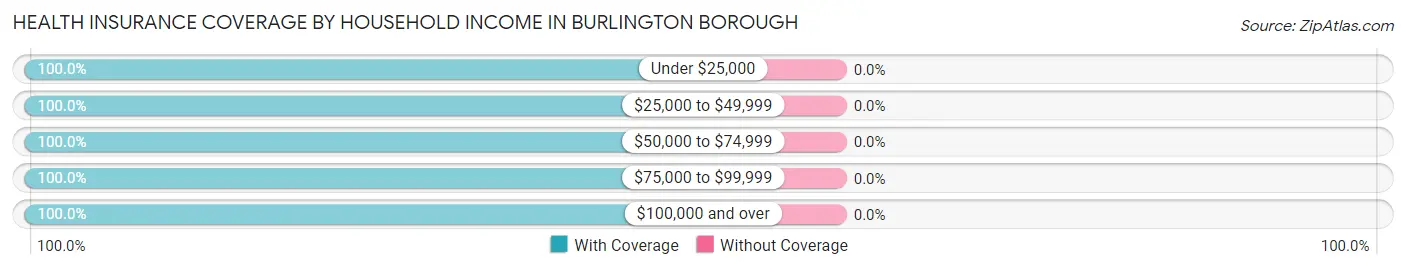
| Household Income | With Coverage | Without Coverage |
| Under $25,000 | 11 (100.0%) | 0 (0.0%) |
| $25,000 to $49,999 | 68 (100.0%) | 0 (0.0%) |
| $50,000 to $74,999 | 16 (100.0%) | 0 (0.0%) |
| $75,000 to $99,999 | 37 (100.0%) | 0 (0.0%) |
| $100,000 and over | 22 (100.0%) | 0 (0.0%) |
Public vs Private Health Insurance Coverage by Age in Burlington borough
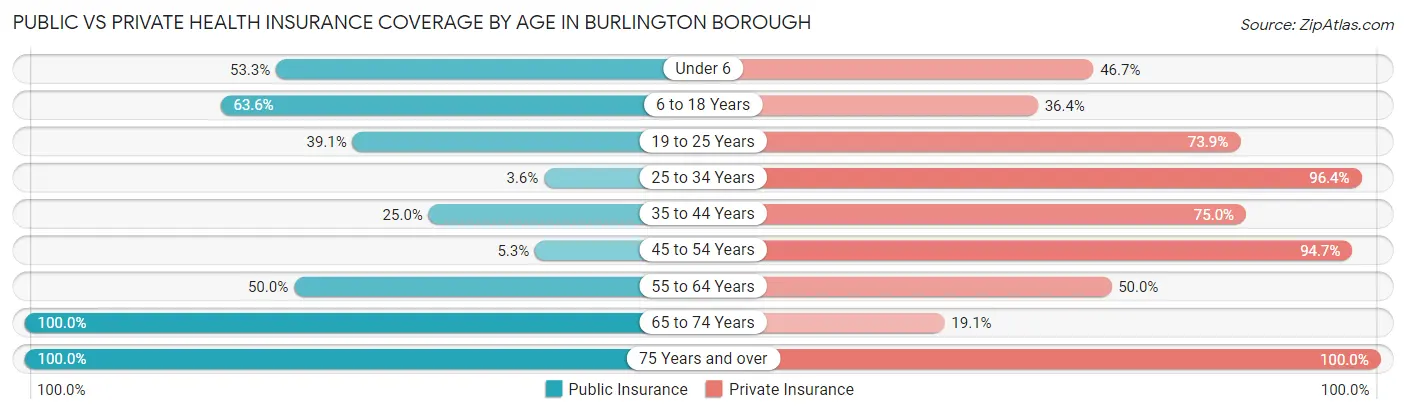
| Age Bracket | Public Insurance | Private Insurance |
| Under 6 | 8 (53.3%) | 7 (46.7%) |
| 6 to 18 Years | 14 (63.6%) | 8 (36.4%) |
| 19 to 25 Years | 9 (39.1%) | 17 (73.9%) |
| 25 to 34 Years | 1 (3.6%) | 27 (96.4%) |
| 35 to 44 Years | 1 (25.0%) | 3 (75.0%) |
| 45 to 54 Years | 1 (5.3%) | 18 (94.7%) |
| 55 to 64 Years | 4 (50.0%) | 4 (50.0%) |
| 65 to 74 Years | 21 (100.0%) | 4 (19.1%) |
| 75 Years and over | 14 (100.0%) | 14 (100.0%) |
| Total | 73 (47.4%) | 102 (66.2%) |
Disability Status by Sex by Age in Burlington borough
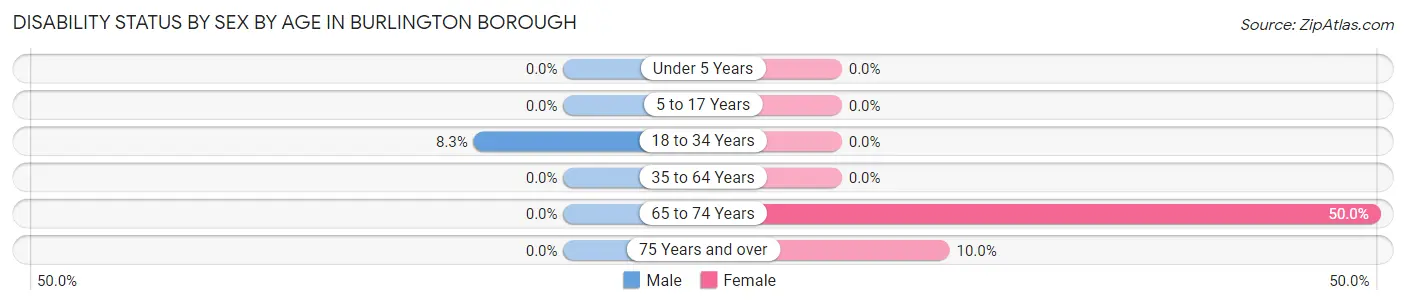
| Age Bracket | Male | Female |
| Under 5 Years | 0 (0.0%) | 0 (0.0%) |
| 5 to 17 Years | 0 (0.0%) | 0 (0.0%) |
| 18 to 34 Years | 2 (8.3%) | 0 (0.0%) |
| 35 to 64 Years | 0 (0.0%) | 0 (0.0%) |
| 65 to 74 Years | 0 (0.0%) | 8 (50.0%) |
| 75 Years and over | 0 (0.0%) | 1 (10.0%) |
Disability Class by Sex by Age in Burlington borough
Disability Class: Hearing Difficulty
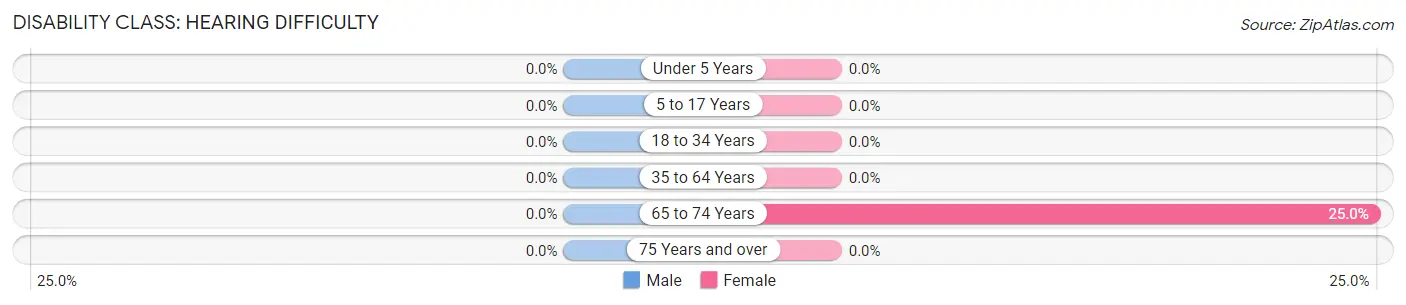
| Age Bracket | Male | Female |
| Under 5 Years | 0 (0.0%) | 0 (0.0%) |
| 5 to 17 Years | 0 (0.0%) | 0 (0.0%) |
| 18 to 34 Years | 0 (0.0%) | 0 (0.0%) |
| 35 to 64 Years | 0 (0.0%) | 0 (0.0%) |
| 65 to 74 Years | 0 (0.0%) | 4 (25.0%) |
| 75 Years and over | 0 (0.0%) | 0 (0.0%) |
Disability Class: Vision Difficulty
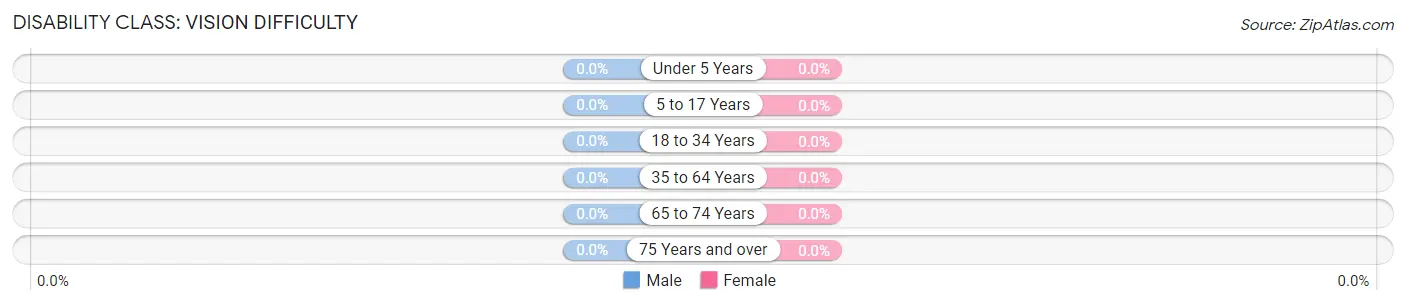
| Age Bracket | Male | Female |
| Under 5 Years | 0 (0.0%) | 0 (0.0%) |
| 5 to 17 Years | 0 (0.0%) | 0 (0.0%) |
| 18 to 34 Years | 0 (0.0%) | 0 (0.0%) |
| 35 to 64 Years | 0 (0.0%) | 0 (0.0%) |
| 65 to 74 Years | 0 (0.0%) | 0 (0.0%) |
| 75 Years and over | 0 (0.0%) | 0 (0.0%) |
Disability Class: Cognitive Difficulty
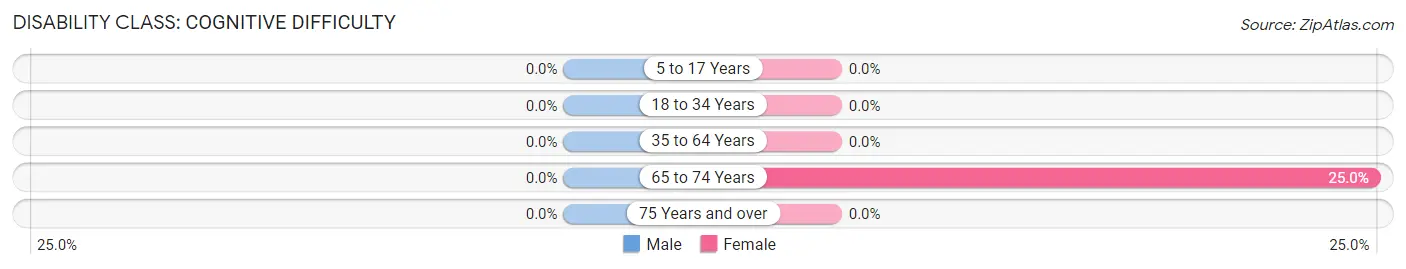
| Age Bracket | Male | Female |
| 5 to 17 Years | 0 (0.0%) | 0 (0.0%) |
| 18 to 34 Years | 0 (0.0%) | 0 (0.0%) |
| 35 to 64 Years | 0 (0.0%) | 0 (0.0%) |
| 65 to 74 Years | 0 (0.0%) | 4 (25.0%) |
| 75 Years and over | 0 (0.0%) | 0 (0.0%) |
Disability Class: Ambulatory Difficulty
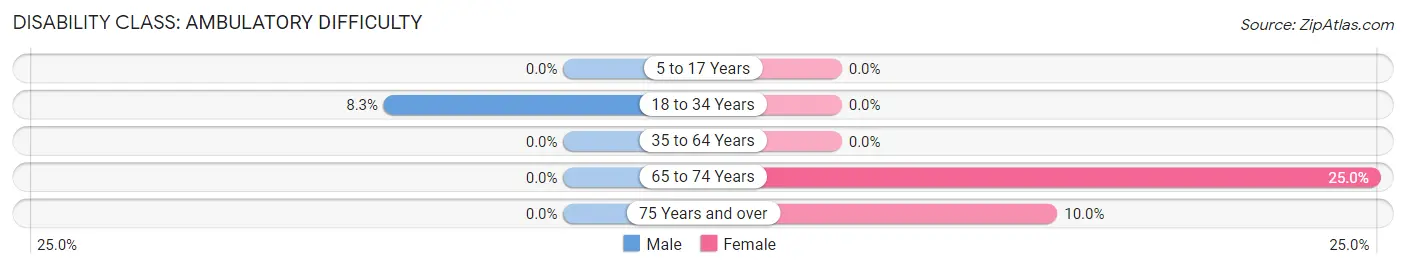
| Age Bracket | Male | Female |
| 5 to 17 Years | 0 (0.0%) | 0 (0.0%) |
| 18 to 34 Years | 2 (8.3%) | 0 (0.0%) |
| 35 to 64 Years | 0 (0.0%) | 0 (0.0%) |
| 65 to 74 Years | 0 (0.0%) | 4 (25.0%) |
| 75 Years and over | 0 (0.0%) | 1 (10.0%) |
Disability Class: Self-Care Difficulty
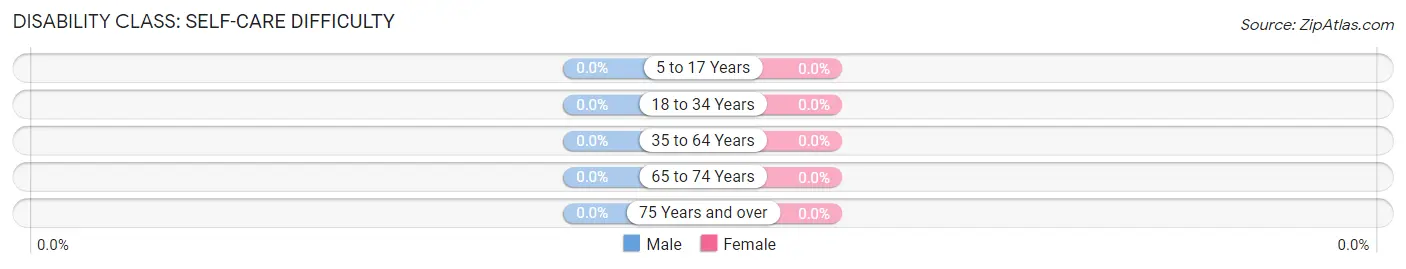
| Age Bracket | Male | Female |
| 5 to 17 Years | 0 (0.0%) | 0 (0.0%) |
| 18 to 34 Years | 0 (0.0%) | 0 (0.0%) |
| 35 to 64 Years | 0 (0.0%) | 0 (0.0%) |
| 65 to 74 Years | 0 (0.0%) | 0 (0.0%) |
| 75 Years and over | 0 (0.0%) | 0 (0.0%) |
Technology Access in Burlington borough
Computing Device Access in Burlington borough
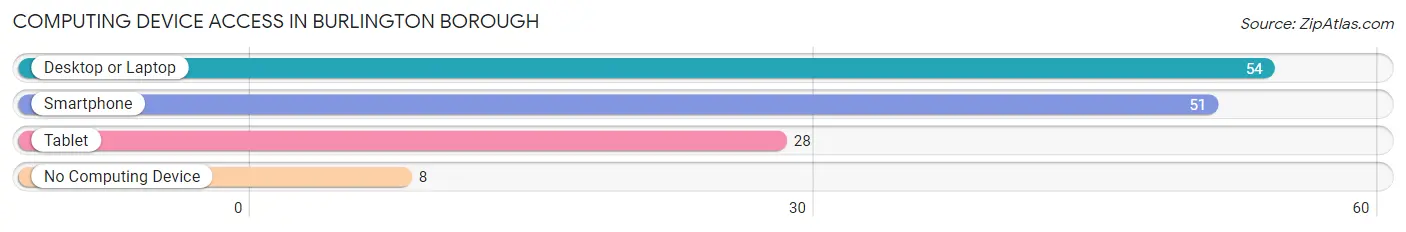
| Device Type | # Households | % Households |
| Desktop or Laptop | 54 | 83.1% |
| Smartphone | 51 | 78.5% |
| Tablet | 28 | 43.1% |
| No Computing Device | 8 | 12.3% |
| Total | 65 | 100.0% |
Internet Access in Burlington borough
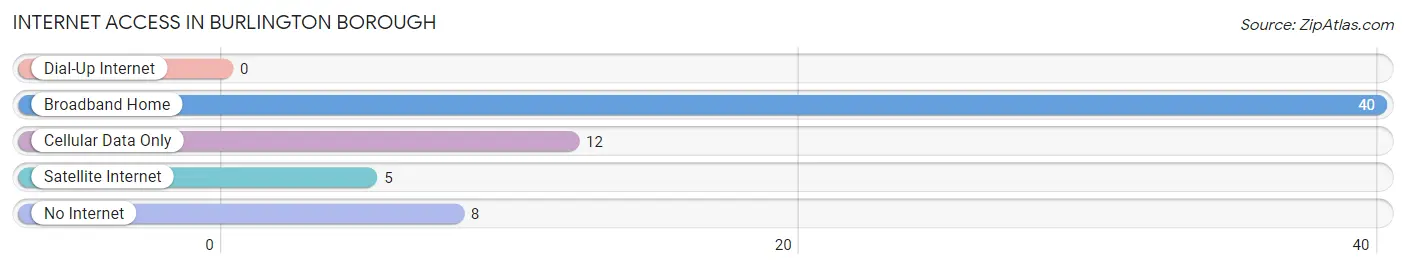
| Internet Type | # Households | % Households |
| Dial-Up Internet | 0 | 0.0% |
| Broadband Home | 40 | 61.5% |
| Cellular Data Only | 12 | 18.5% |
| Satellite Internet | 5 | 7.7% |
| No Internet | 8 | 12.3% |
| Total | 65 | 100.0% |
Burlington borough Summary
Burlington Borough is a small borough located in the state of Pennsylvania. It is situated in the northern part of Bucks County, approximately 25 miles north of Philadelphia. The borough is bordered by the townships of Northampton, Springfield, and Bristol. As of the 2010 census, the population of Burlington Borough was 2,919.
History
The area that is now Burlington Borough was originally inhabited by the Lenape Native Americans. The first European settlers arrived in the area in the late 17th century. The area was part of the original land grant given to William Penn in 1681. The area was first known as “Buck’s County” and was part of the larger township of Bristol.
In 1733, the area was officially incorporated as the Borough of Burlington. The name was chosen to honor the Earl of Burlington, who was a prominent figure in the British government at the time. The borough was an important stop on the stagecoach route between Philadelphia and New York City.
In the 19th century, the borough was an important center for the production of textiles. The Burlington Woolen Mills, which was established in 1820, was one of the largest employers in the area. The mills were destroyed by fire in 1876, but were rebuilt and continued to operate until the early 20th century.
Geography
Burlington Borough is located at 40°14'N 75°10'W (40.23, -75.17). According to the United States Census Bureau, the borough has a total area of 0.7 square miles (1.8 km2), all of it land.
The borough is located in the Delaware Valley, which is part of the larger Atlantic Coastal Plain. The terrain is generally flat, with some rolling hills. The borough is located in the northern part of Bucks County, approximately 25 miles north of Philadelphia.
Economy
The economy of Burlington Borough is largely based on the service industry. The borough is home to several small businesses, including restaurants, retail stores, and professional services. The borough is also home to several industrial parks, which provide employment opportunities for local residents.
The borough is also home to several large employers, including the Burlington Coat Factory, which is one of the largest employers in the area. The borough is also home to several educational institutions, including Bucks County Community College and the University of Pennsylvania.
Demographics
As of the 2010 census, there were 2,919 people, 1,093 households, and 745 families residing in the borough. The population density was 4,093.3 people per square mile (1,579.2/km2). There were 1,164 housing units at an average density of 1,637.3 per square mile (631.2/km2). The racial makeup of the borough was 87.2% White, 5.7% African American, 0.2% Native American, 2.2% Asian, 0.1% Pacific Islander, 2.3% from other races, and 2.4% from two or more races. Hispanic or Latino of any race were 5.2% of the population.
There were 1,093 households, out of which 33.2% had children under the age of 18 living with them, 48.2% were married couples living together, 14.2% had a female householder with no husband present, and 32.2% were non-families. 26.2% of all households were made up of individuals, and 10.2% had someone living alone who was 65 years of age or older. The average household size was 2.67 and the average family size was 3.25.
In the borough, the population was spread out, with 25.7% under the age of 18, 8.2% from 18 to 24, 30.2% from 25 to 44, 22.2% from 45 to 64, and 13.7% who were 65 years of age or older. The median age was 36 years. For every 100 females, there were 94.2 males. For every 100 females age 18 and over, there were 91.2 males.
The median income for a household in the borough was $45,938, and the median income for a family was $54,917. Males had a median income of $41,964 versus $30,917 for females. The per capita income for the borough was $21,945. About 6.2% of families and 8.2% of the population were below the poverty line, including 10.2% of those under age 18 and 8.2% of those age 65 or over.
Common Questions
What is Per Capita Income in Burlington borough?
Per Capita income in Burlington borough is $22,968.
What is the Median Family Income in Burlington borough?
Median Family Income in Burlington borough is $41,094.
What is the Median Household income in Burlington borough?
Median Household Income in Burlington borough is $41,250.
What is Income or Wage Gap in Burlington borough?
Income or Wage Gap in Burlington borough is 35.4%.
Women in Burlington borough earn 64.6 cents for every dollar earned by a man.
What is Inequality or Gini Index in Burlington borough?
Inequality or Gini Index in Burlington borough is 0.32.
What is the Total Population of Burlington borough?
Total Population of Burlington borough is 154.
What is the Total Male Population of Burlington borough?
Total Male Population of Burlington borough is 71.
What is the Total Female Population of Burlington borough?
Total Female Population of Burlington borough is 83.
What is the Ratio of Males per 100 Females in Burlington borough?
There are 85.54 Males per 100 Females in Burlington borough.
What is the Ratio of Females per 100 Males in Burlington borough?
There are 116.90 Females per 100 Males in Burlington borough.
What is the Median Population Age in Burlington borough?
Median Population Age in Burlington borough is 27.6 Years.
What is the Average Family Size in Burlington borough
Average Family Size in Burlington borough is 3.0 People.
What is the Average Household Size in Burlington borough
Average Household Size in Burlington borough is 2.4 People.
How Large is the Labor Force in Burlington borough?
There are 70 People in the Labor Forcein in Burlington borough.
What is the Percentage of People in the Labor Force in Burlington borough?
57.9% of People are in the Labor Force in Burlington borough.
What is the Unemployment Rate in Burlington borough?
Unemployment Rate in Burlington borough is 1.4%.