Pine Grove Mills, PA Map & Demographics
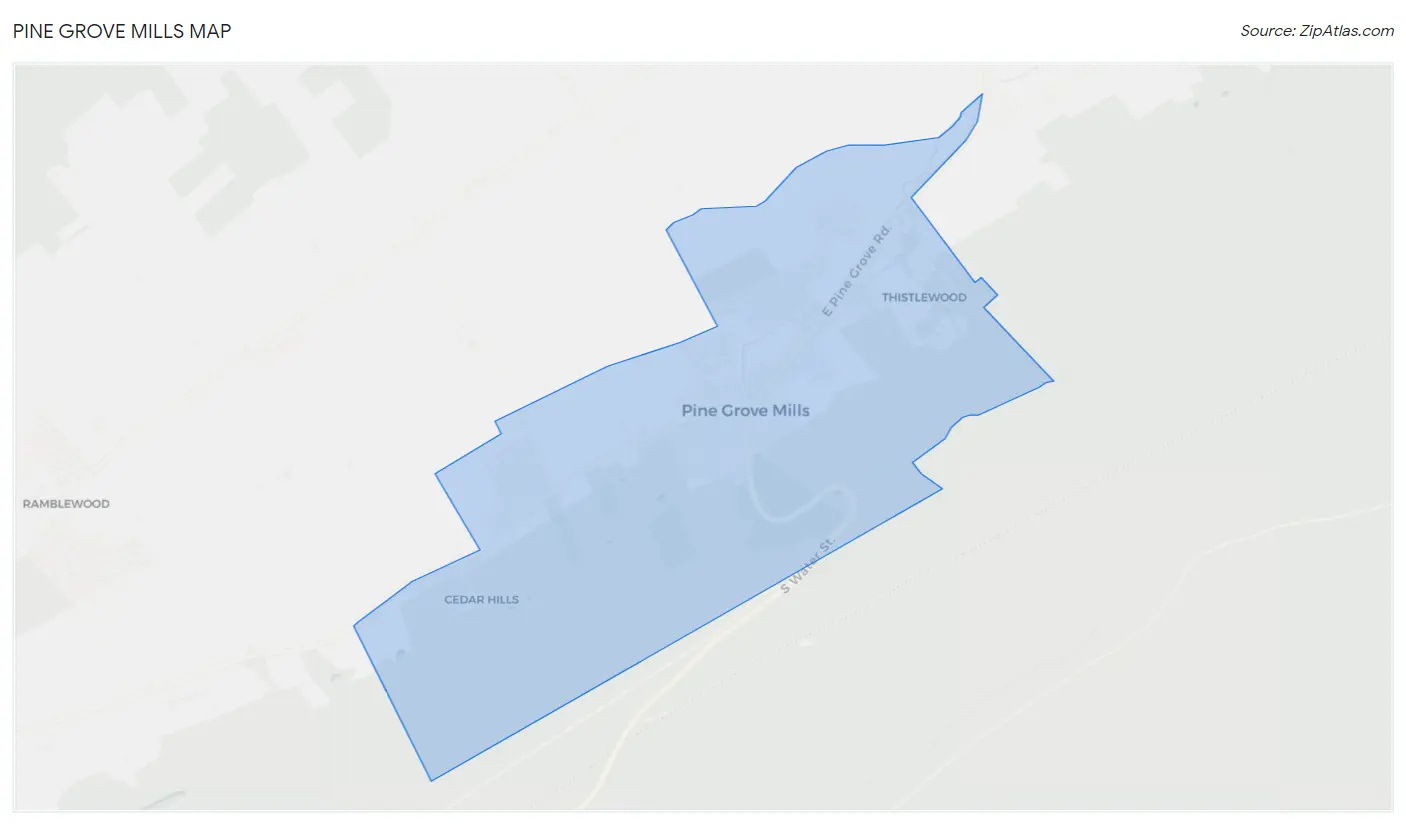
Pine Grove Mills Map
Pine Grove Mills Overview
$55,534
PER CAPITA INCOME
$119,349
AVG FAMILY INCOME
$145,881
AVG HOUSEHOLD INCOME
1.2%
WAGE / INCOME GAP [ % ]
98.8¢/ $1
WAGE / INCOME GAP [ $ ]
0.23
INEQUALITY / GINI INDEX
1,508
TOTAL POPULATION
747
MALE POPULATION
761
FEMALE POPULATION
98.16
MALES / 100 FEMALES
101.87
FEMALES / 100 MALES
48.6
MEDIAN AGE
2.8
AVG FAMILY SIZE
2.5
AVG HOUSEHOLD SIZE
957
LABOR FORCE [ PEOPLE ]
71.5%
PERCENT IN LABOR FORCE
Pine Grove Mills Zip Codes
Pine Grove Mills Area Codes
Income in Pine Grove Mills
Income Overview in Pine Grove Mills
Per Capita Income in Pine Grove Mills is $55,534, while median incomes of families and households are $119,349 and $145,881 respectively.
| Characteristic | Number | Measure |
| Per Capita Income | 1,508 | $55,534 |
| Median Family Income | 409 | $119,349 |
| Mean Family Income | 409 | $118,520 |
| Median Household Income | 613 | $145,881 |
| Mean Household Income | 613 | $125,871 |
| Income Deficit | 409 | $0 |
| Wage / Income Gap (%) | 1,508 | 1.24% |
| Wage / Income Gap ($) | 1,508 | 98.76¢ per $1 |
| Gini / Inequality Index | 1,508 | 0.23 |
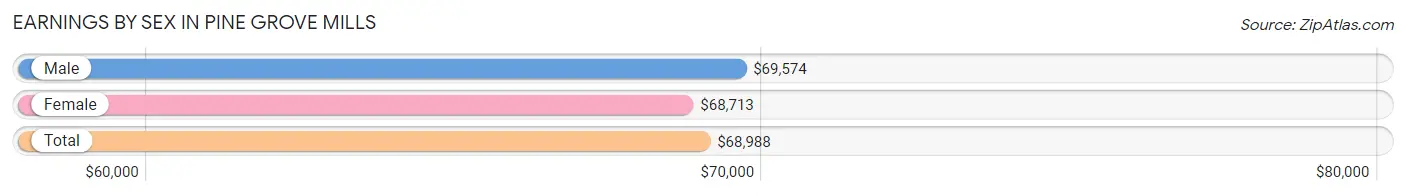
Earnings by Sex in Pine Grove Mills
Average Earnings in Pine Grove Mills are $68,988, $69,574 for men and $68,713 for women, a difference of 1.2%.
| Sex | Number | Average Earnings |
| Male | 574 (53.2%) | $69,574 |
| Female | 505 (46.8%) | $68,713 |
| Total | 1,079 (100.0%) | $68,988 |
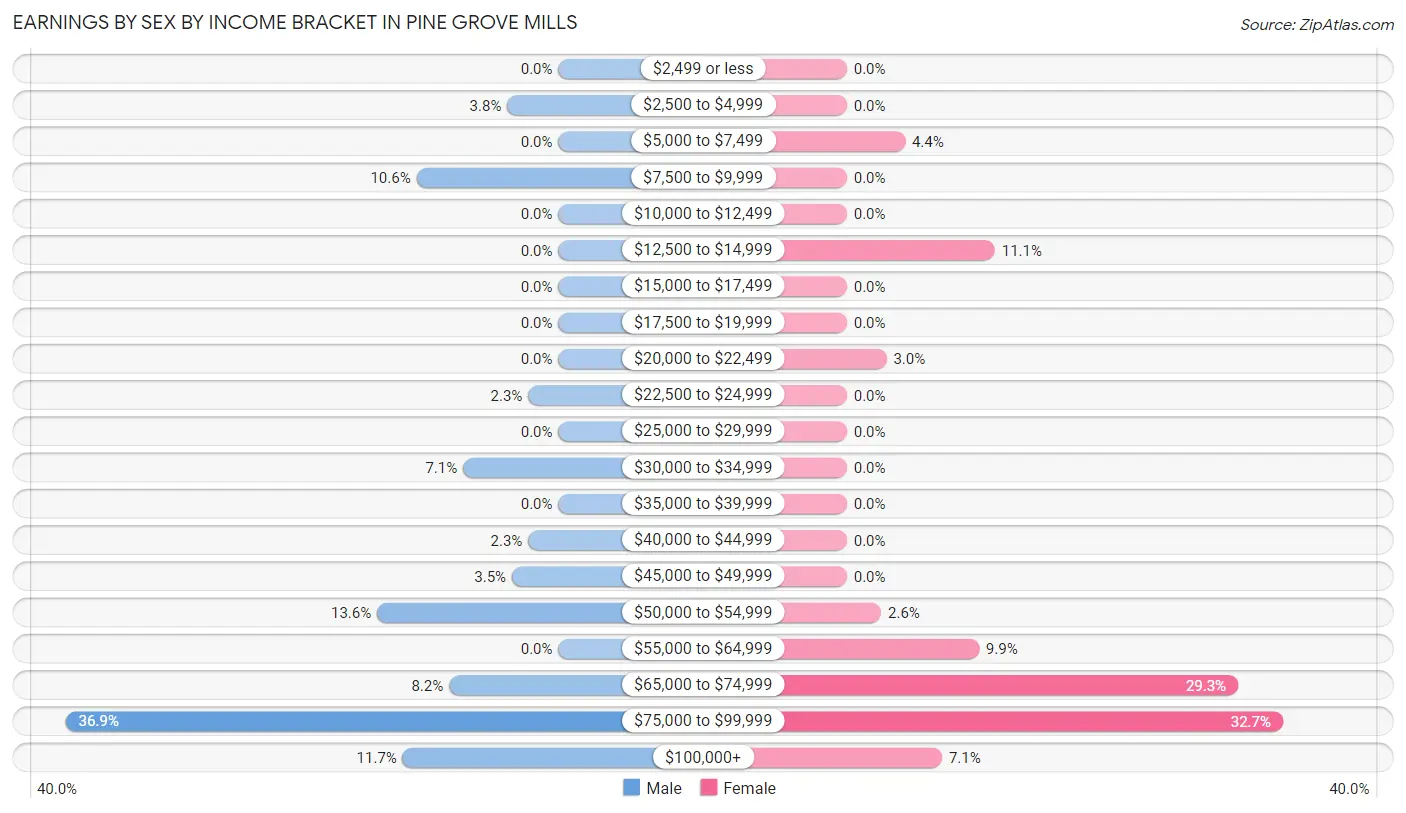
Earnings by Sex by Income Bracket in Pine Grove Mills
The most common earnings brackets in Pine Grove Mills are $75,000 to $99,999 for men (212 | 36.9%) and $75,000 to $99,999 for women (165 | 32.7%).
| Income | Male | Female |
| $2,499 or less | 0 (0.0%) | 0 (0.0%) |
| $2,500 to $4,999 | 22 (3.8%) | 0 (0.0%) |
| $5,000 to $7,499 | 0 (0.0%) | 22 (4.4%) |
| $7,500 to $9,999 | 61 (10.6%) | 0 (0.0%) |
| $10,000 to $12,499 | 0 (0.0%) | 0 (0.0%) |
| $12,500 to $14,999 | 0 (0.0%) | 56 (11.1%) |
| $15,000 to $17,499 | 0 (0.0%) | 0 (0.0%) |
| $17,500 to $19,999 | 0 (0.0%) | 0 (0.0%) |
| $20,000 to $22,499 | 0 (0.0%) | 15 (3.0%) |
| $22,500 to $24,999 | 13 (2.3%) | 0 (0.0%) |
| $25,000 to $29,999 | 0 (0.0%) | 0 (0.0%) |
| $30,000 to $34,999 | 41 (7.1%) | 0 (0.0%) |
| $35,000 to $39,999 | 0 (0.0%) | 0 (0.0%) |
| $40,000 to $44,999 | 13 (2.3%) | 0 (0.0%) |
| $45,000 to $49,999 | 20 (3.5%) | 0 (0.0%) |
| $50,000 to $54,999 | 78 (13.6%) | 13 (2.6%) |
| $55,000 to $64,999 | 0 (0.0%) | 50 (9.9%) |
| $65,000 to $74,999 | 47 (8.2%) | 148 (29.3%) |
| $75,000 to $99,999 | 212 (36.9%) | 165 (32.7%) |
| $100,000+ | 67 (11.7%) | 36 (7.1%) |
| Total | 574 (100.0%) | 505 (100.0%) |
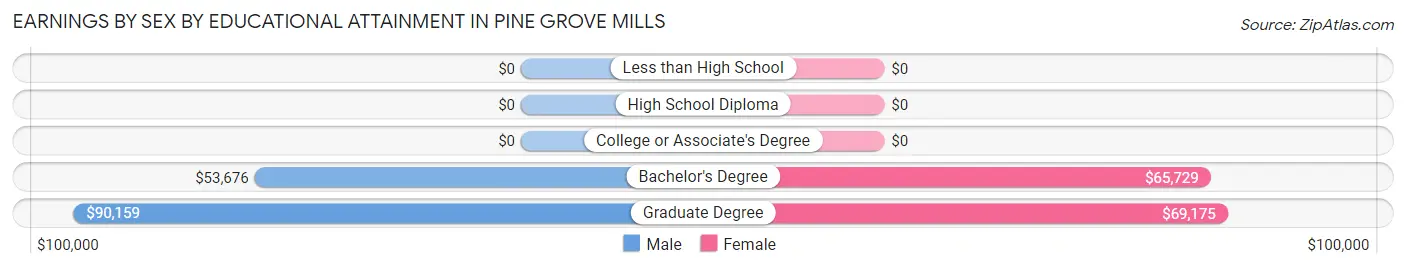
Earnings by Sex by Educational Attainment in Pine Grove Mills
Average earnings in Pine Grove Mills are $77,813 for men and $68,988 for women, a difference of 11.3%. Men with an educational attainment of graduate degree enjoy the highest average annual earnings of $90,159, while those with bachelor's degree education earn the least with $53,676. Women with an educational attainment of graduate degree earn the most with the average annual earnings of $69,175, while those with bachelor's degree education have the smallest earnings of $65,729.
| Educational Attainment | Male Income | Female Income |
| Less than High School | - | - |
| High School Diploma | - | - |
| College or Associate's Degree | - | - |
| Bachelor's Degree | $53,676 | $65,729 |
| Graduate Degree | $90,159 | $69,175 |
| Total | $77,813 | $68,988 |
Family Income in Pine Grove Mills
Family Income Brackets in Pine Grove Mills
According to the Pine Grove Mills family income data, there are 144 families falling into the $100,000 to $149,999 income range, which is the most common income bracket and makes up 35.2% of all families.
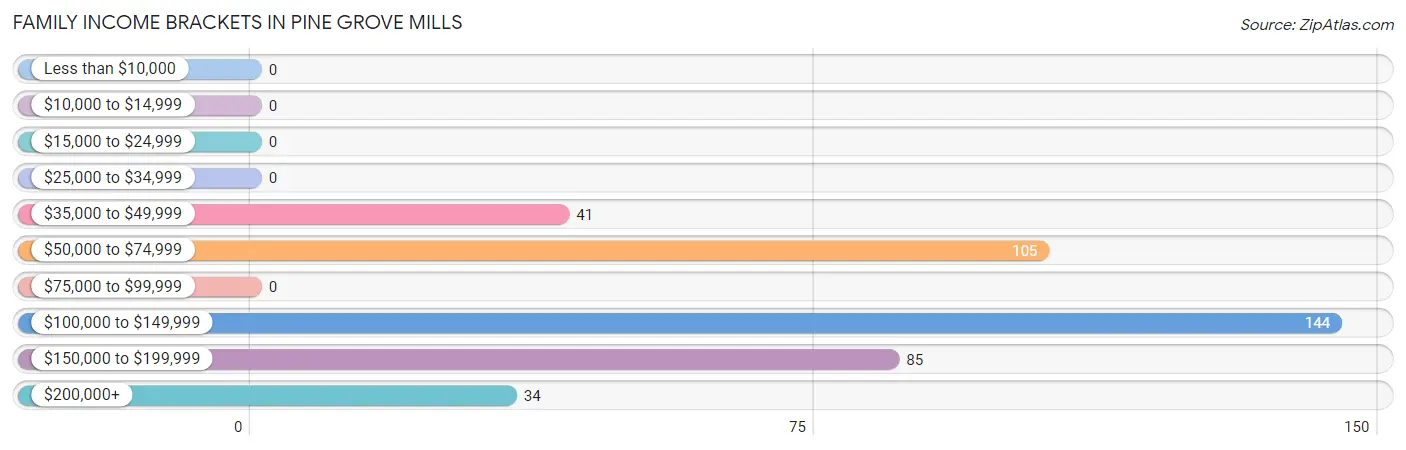
| Income Bracket | # Families | % Families |
| Less than $10,000 | 0 | 0.0% |
| $10,000 to $14,999 | 0 | 0.0% |
| $15,000 to $24,999 | 0 | 0.0% |
| $25,000 to $34,999 | 0 | 0.0% |
| $35,000 to $49,999 | 41 | 10.0% |
| $50,000 to $74,999 | 105 | 25.7% |
| $75,000 to $99,999 | 0 | 0.0% |
| $100,000 to $149,999 | 144 | 35.2% |
| $150,000 to $199,999 | 85 | 20.8% |
| $200,000+ | 34 | 8.3% |
Family Income by Famaliy Size in Pine Grove Mills
2-person families (290 | 70.9%) account for the highest median family income in Pine Grove Mills with $117,865 per family, while 2-person families (290 | 70.9%) have the highest median income of $58,932 per family member.
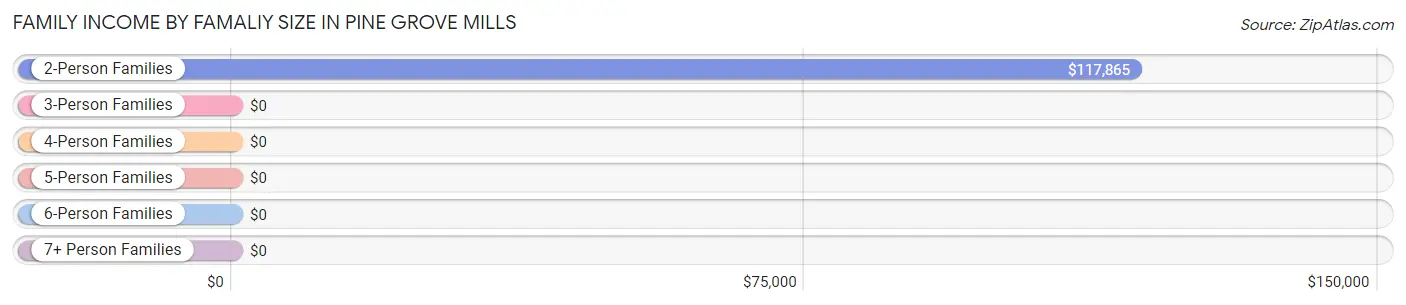
| Income Bracket | # Families | Median Income |
| 2-Person Families | 290 (70.9%) | $117,865 |
| 3-Person Families | 71 (17.4%) | $0 |
| 4-Person Families | 12 (2.9%) | $0 |
| 5-Person Families | 5 (1.2%) | $0 |
| 6-Person Families | 0 (0.0%) | $0 |
| 7+ Person Families | 31 (7.6%) | $0 |
| Total | 409 (100.0%) | $119,349 |
Family Income by Number of Earners in Pine Grove Mills
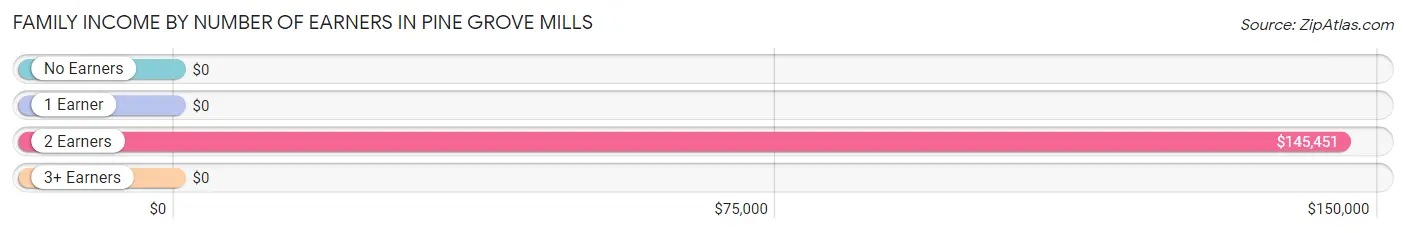
| Number of Earners | # Families | Median Income |
| No Earners | 59 (14.4%) | $0 |
| 1 Earner | 53 (13.0%) | $0 |
| 2 Earners | 280 (68.5%) | $145,451 |
| 3+ Earners | 17 (4.2%) | $0 |
| Total | 409 (100.0%) | $119,349 |
Household Income in Pine Grove Mills
Household Income Brackets in Pine Grove Mills
With 233 households falling in the category, the $150,000 to $199,999 income range is the most frequent in Pine Grove Mills, accounting for 38.0% of all households.
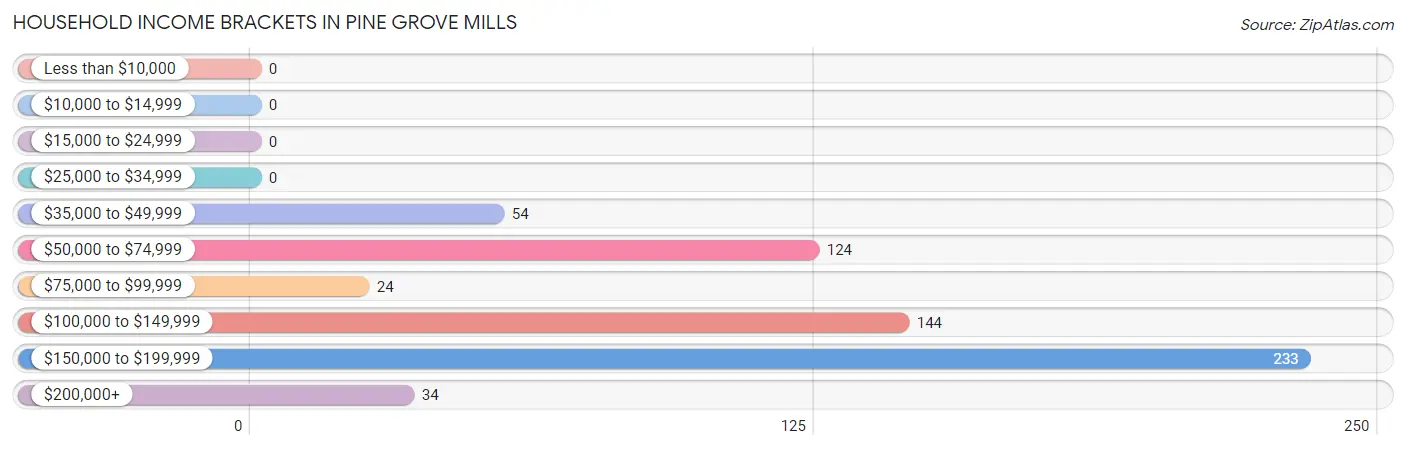
| Income Bracket | # Households | % Households |
| Less than $10,000 | 0 | 0.0% |
| $10,000 to $14,999 | 0 | 0.0% |
| $15,000 to $24,999 | 0 | 0.0% |
| $25,000 to $34,999 | 0 | 0.0% |
| $35,000 to $49,999 | 54 | 8.8% |
| $50,000 to $74,999 | 124 | 20.2% |
| $75,000 to $99,999 | 24 | 3.9% |
| $100,000 to $149,999 | 144 | 23.5% |
| $150,000 to $199,999 | 233 | 38.0% |
| $200,000+ | 34 | 5.5% |
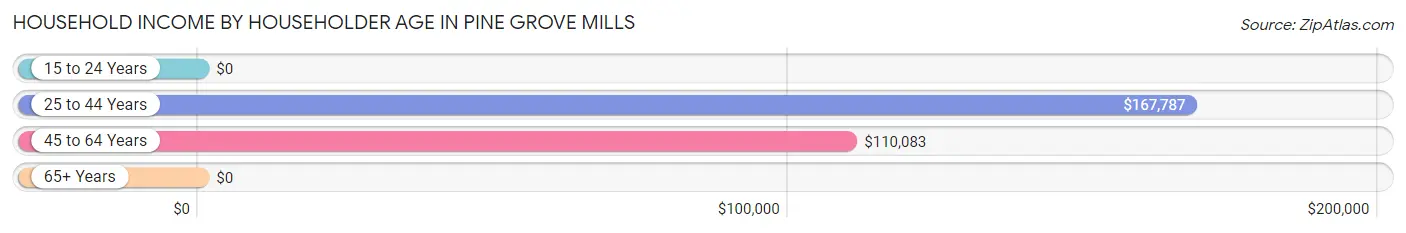
Household Income by Householder Age in Pine Grove Mills
The median household income in Pine Grove Mills is $145,881, with the highest median household income of $167,787 found in the 25 to 44 years age bracket for the primary householder. A total of 262 households (42.7%) fall into this category.
| Income Bracket | # Households | Median Income |
| 15 to 24 Years | 0 (0.0%) | $0 |
| 25 to 44 Years | 262 (42.7%) | $167,787 |
| 45 to 64 Years | 213 (34.7%) | $110,083 |
| 65+ Years | 138 (22.5%) | $0 |
| Total | 613 (100.0%) | $145,881 |
Poverty in Pine Grove Mills
Income Below Poverty by Sex and Age in Pine Grove Mills
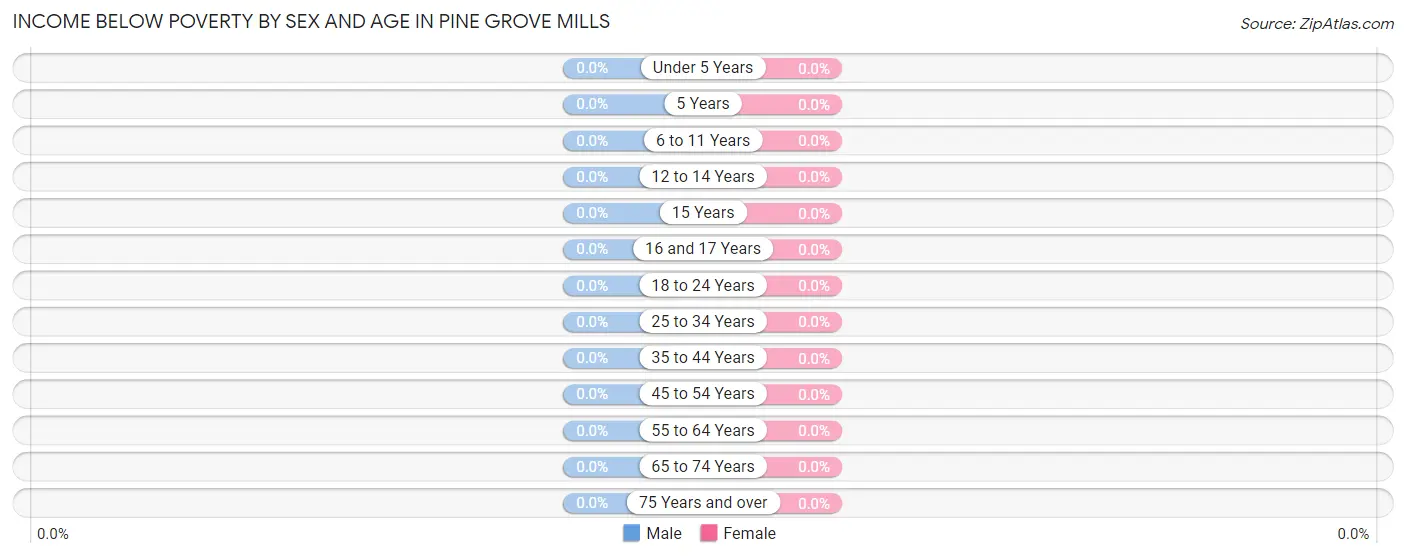
| Age Bracket | Male | Female |
| Under 5 Years | 0 (0.0%) | 0 (0.0%) |
| 5 Years | 0 (0.0%) | 0 (0.0%) |
| 6 to 11 Years | 0 (0.0%) | 0 (0.0%) |
| 12 to 14 Years | 0 (0.0%) | 0 (0.0%) |
| 15 Years | 0 (0.0%) | 0 (0.0%) |
| 16 and 17 Years | 0 (0.0%) | 0 (0.0%) |
| 18 to 24 Years | 0 (0.0%) | 0 (0.0%) |
| 25 to 34 Years | 0 (0.0%) | 0 (0.0%) |
| 35 to 44 Years | 0 (0.0%) | 0 (0.0%) |
| 45 to 54 Years | 0 (0.0%) | 0 (0.0%) |
| 55 to 64 Years | 0 (0.0%) | 0 (0.0%) |
| 65 to 74 Years | 0 (0.0%) | 0 (0.0%) |
| 75 Years and over | 0 (0.0%) | 0 (0.0%) |
| Total | 0 (0.0%) | 0 (0.0%) |
Income Above Poverty by Sex and Age in Pine Grove Mills
According to the poverty statistics in Pine Grove Mills, males aged 6 to 11 years and females aged 6 to 11 years are the age groups that are most secure financially, with 100.0% of males and 100.0% of females in these age groups living above the poverty line.
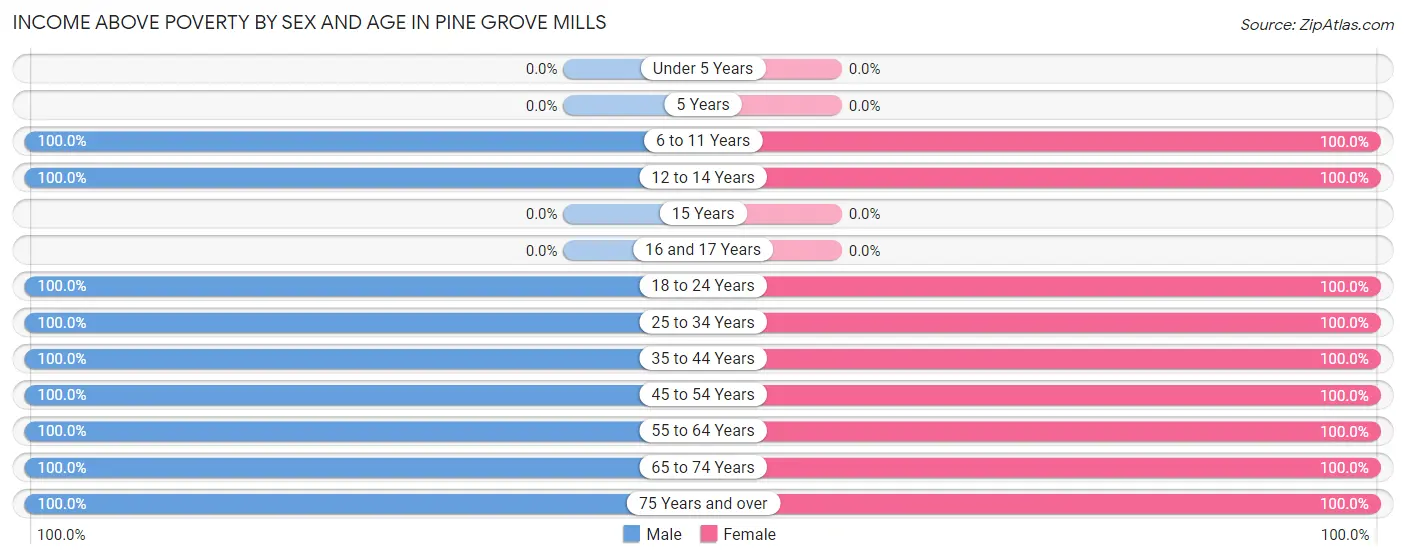
| Age Bracket | Male | Female |
| Under 5 Years | 0 (0.0%) | 0 (0.0%) |
| 5 Years | 0 (0.0%) | 0 (0.0%) |
| 6 to 11 Years | 39 (100.0%) | 53 (100.0%) |
| 12 to 14 Years | 60 (100.0%) | 17 (100.0%) |
| 15 Years | 0 (0.0%) | 0 (0.0%) |
| 16 and 17 Years | 0 (0.0%) | 0 (0.0%) |
| 18 to 24 Years | 26 (100.0%) | 29 (100.0%) |
| 25 to 34 Years | 41 (100.0%) | 29 (100.0%) |
| 35 to 44 Years | 197 (100.0%) | 212 (100.0%) |
| 45 to 54 Years | 118 (100.0%) | 52 (100.0%) |
| 55 to 64 Years | 122 (100.0%) | 253 (100.0%) |
| 65 to 74 Years | 53 (100.0%) | 47 (100.0%) |
| 75 Years and over | 91 (100.0%) | 69 (100.0%) |
| Total | 747 (100.0%) | 761 (100.0%) |
Income Below Poverty Among Married-Couple Families in Pine Grove Mills
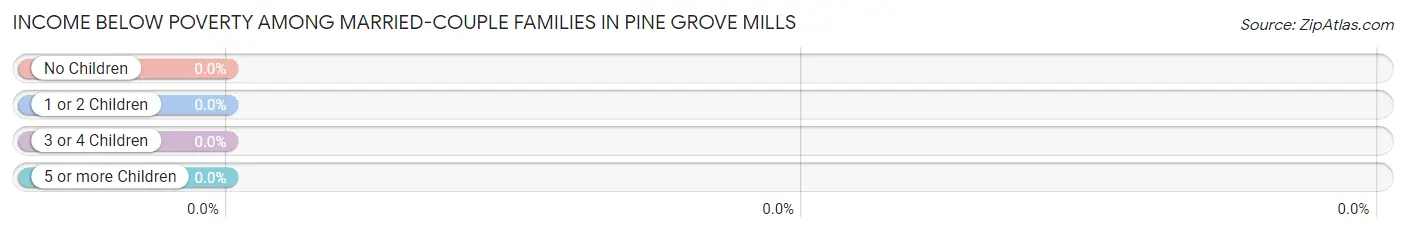
| Children | Above Poverty | Below Poverty |
| No Children | 246 (100.0%) | 0 (0.0%) |
| 1 or 2 Children | 71 (100.0%) | 0 (0.0%) |
| 3 or 4 Children | 31 (100.0%) | 0 (0.0%) |
| 5 or more Children | 0 (0.0%) | 0 (0.0%) |
| Total | 348 (100.0%) | 0 (0.0%) |
Income Below Poverty Among Single-Parent Households in Pine Grove Mills
| Children | Single Father | Single Mother |
| No Children | 0 (0.0%) | 0 (0.0%) |
| 1 or 2 Children | 0 (0.0%) | 0 (0.0%) |
| 3 or 4 Children | 0 (0.0%) | 0 (0.0%) |
| 5 or more Children | 0 (0.0%) | 0 (0.0%) |
| Total | 0 (0.0%) | 0 (0.0%) |
Income Below Poverty Among Married-Couple vs Single-Parent Households in Pine Grove Mills
| Children | Married-Couple Families | Single-Parent Households |
| No Children | 0 (0.0%) | 0 (0.0%) |
| 1 or 2 Children | 0 (0.0%) | 0 (0.0%) |
| 3 or 4 Children | 0 (0.0%) | 0 (0.0%) |
| 5 or more Children | 0 (0.0%) | 0 (0.0%) |
| Total | 0 (0.0%) | 0 (0.0%) |
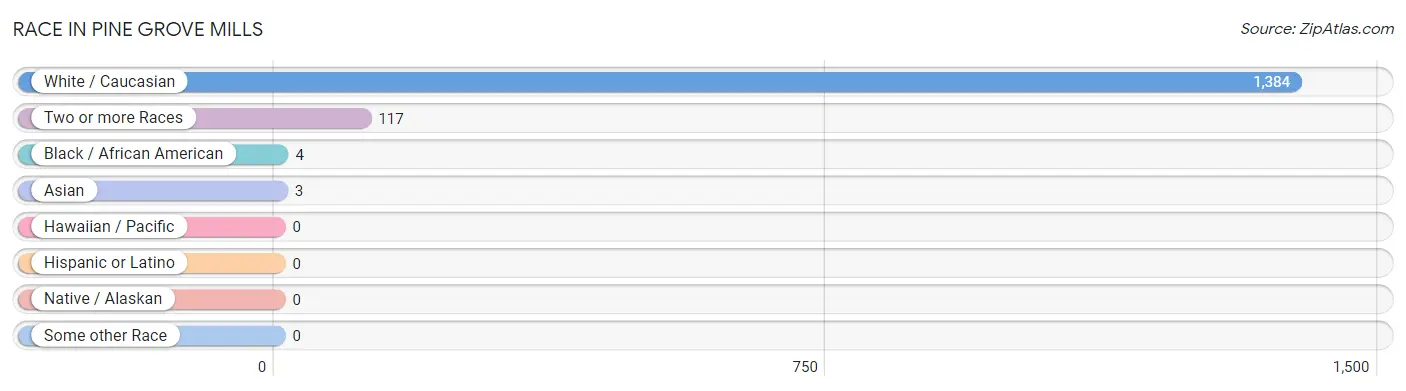
Race in Pine Grove Mills
The most populous races in Pine Grove Mills are White / Caucasian (1,384 | 91.8%), Two or more Races (117 | 7.8%), and Black / African American (4 | 0.3%).
| Race | # Population | % Population |
| Asian | 3 | 0.2% |
| Black / African American | 4 | 0.3% |
| Hawaiian / Pacific | 0 | 0.0% |
| Hispanic or Latino | 0 | 0.0% |
| Native / Alaskan | 0 | 0.0% |
| White / Caucasian | 1,384 | 91.8% |
| Two or more Races | 117 | 7.8% |
| Some other Race | 0 | 0.0% |
| Total | 1,508 | 100.0% |
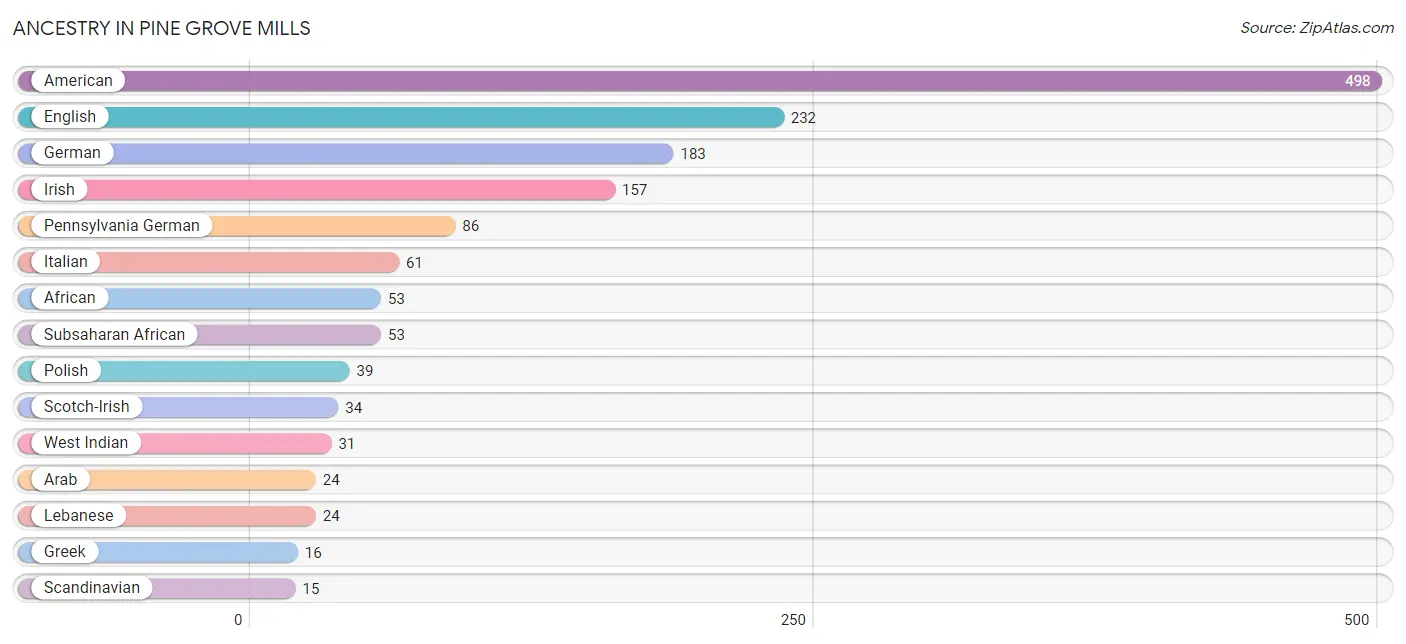
Ancestry in Pine Grove Mills
The most populous ancestries reported in Pine Grove Mills are American (498 | 33.0%), English (232 | 15.4%), German (183 | 12.1%), Irish (157 | 10.4%), and Pennsylvania German (86 | 5.7%), together accounting for 76.6% of all Pine Grove Mills residents.
| Ancestry | # Population | % Population |
| African | 53 | 3.5% |
| American | 498 | 33.0% |
| Arab | 24 | 1.6% |
| British | 9 | 0.6% |
| Cambodian | 8 | 0.5% |
| Chickasaw | 5 | 0.3% |
| English | 232 | 15.4% |
| German | 183 | 12.1% |
| Greek | 16 | 1.1% |
| Irish | 157 | 10.4% |
| Italian | 61 | 4.1% |
| Lebanese | 24 | 1.6% |
| Pennsylvania German | 86 | 5.7% |
| Polish | 39 | 2.6% |
| Scandinavian | 15 | 1.0% |
| Scotch-Irish | 34 | 2.2% |
| Slovak | 11 | 0.7% |
| Subsaharan African | 53 | 3.5% |
| Swiss | 13 | 0.9% |
| Thai | 3 | 0.2% |
| West Indian | 31 | 2.1% | View All 21 Rows |
Immigrants in Pine Grove Mills
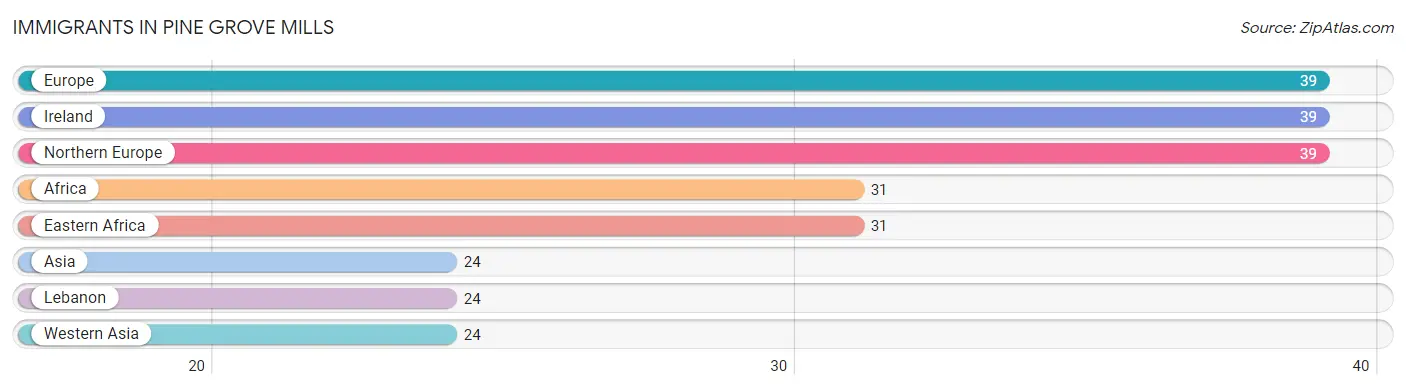
The most numerous immigrant groups reported in Pine Grove Mills came from Europe (39 | 2.6%), Ireland (39 | 2.6%), Northern Europe (39 | 2.6%), Africa (31 | 2.1%), and Eastern Africa (31 | 2.1%), together accounting for 11.9% of all Pine Grove Mills residents.
| Immigration Origin | # Population | % Population |
| Africa | 31 | 2.1% |
| Asia | 24 | 1.6% |
| Eastern Africa | 31 | 2.1% |
| Europe | 39 | 2.6% |
| Ireland | 39 | 2.6% |
| Lebanon | 24 | 1.6% |
| Northern Europe | 39 | 2.6% |
| Western Asia | 24 | 1.6% | View All 8 Rows |
Sex and Age in Pine Grove Mills
Sex and Age in Pine Grove Mills
The most populous age groups in Pine Grove Mills are 35 to 39 Years (197 | 26.4%) for men and 60 to 64 Years (238 | 31.3%) for women.
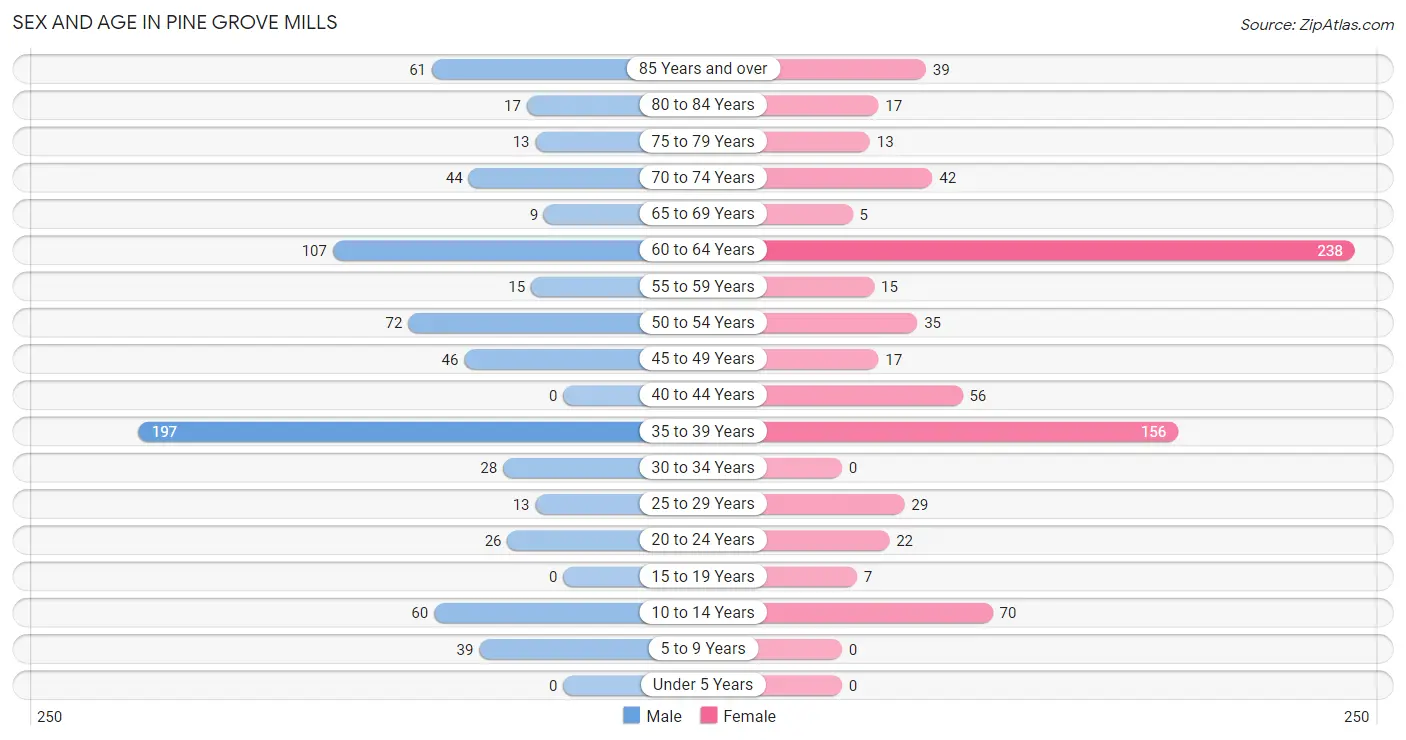
| Age Bracket | Male | Female |
| Under 5 Years | 0 (0.0%) | 0 (0.0%) |
| 5 to 9 Years | 39 (5.2%) | 0 (0.0%) |
| 10 to 14 Years | 60 (8.0%) | 70 (9.2%) |
| 15 to 19 Years | 0 (0.0%) | 7 (0.9%) |
| 20 to 24 Years | 26 (3.5%) | 22 (2.9%) |
| 25 to 29 Years | 13 (1.7%) | 29 (3.8%) |
| 30 to 34 Years | 28 (3.7%) | 0 (0.0%) |
| 35 to 39 Years | 197 (26.4%) | 156 (20.5%) |
| 40 to 44 Years | 0 (0.0%) | 56 (7.4%) |
| 45 to 49 Years | 46 (6.2%) | 17 (2.2%) |
| 50 to 54 Years | 72 (9.6%) | 35 (4.6%) |
| 55 to 59 Years | 15 (2.0%) | 15 (2.0%) |
| 60 to 64 Years | 107 (14.3%) | 238 (31.3%) |
| 65 to 69 Years | 9 (1.2%) | 5 (0.7%) |
| 70 to 74 Years | 44 (5.9%) | 42 (5.5%) |
| 75 to 79 Years | 13 (1.7%) | 13 (1.7%) |
| 80 to 84 Years | 17 (2.3%) | 17 (2.2%) |
| 85 Years and over | 61 (8.2%) | 39 (5.1%) |
| Total | 747 (100.0%) | 761 (100.0%) |
Families and Households in Pine Grove Mills
Median Family Size in Pine Grove Mills
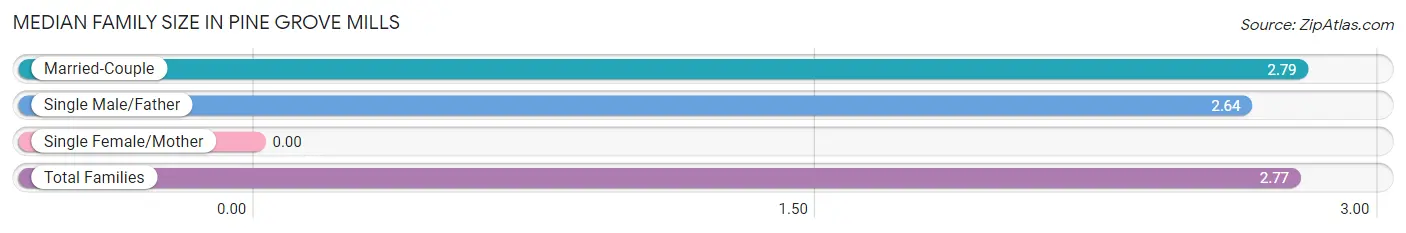
| Family Type | # Families | Family Size |
| Married-Couple | 348 (85.1%) | 2.79 |
| Single Male/Father | 61 (14.9%) | 2.64 |
| Single Female/Mother | 0 (0.0%) | - |
| Total Families | 409 (100.0%) | 2.77 |
Median Household Size in Pine Grove Mills
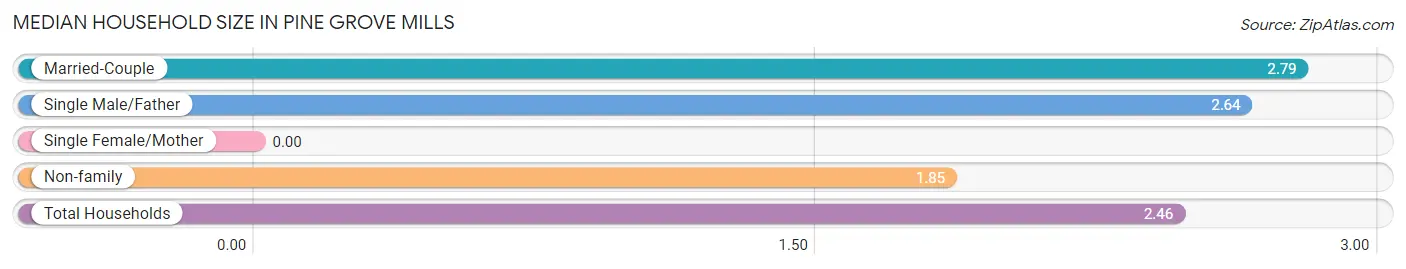
| Household Type | # Households | Household Size |
| Married-Couple | 348 (56.8%) | 2.79 |
| Single Male/Father | 61 (10.0%) | 2.64 |
| Single Female/Mother | 0 (0.0%) | - |
| Non-family | 204 (33.3%) | 1.85 |
| Total Households | 613 (100.0%) | 2.46 |
Household Size by Marriage Status in Pine Grove Mills
Out of a total of 613 households in Pine Grove Mills, 409 (66.7%) are family households, while 204 (33.3%) are nonfamily households. The most numerous type of family households are 2-person households, comprising 290, and the most common type of nonfamily households are 2-person households, comprising 148.
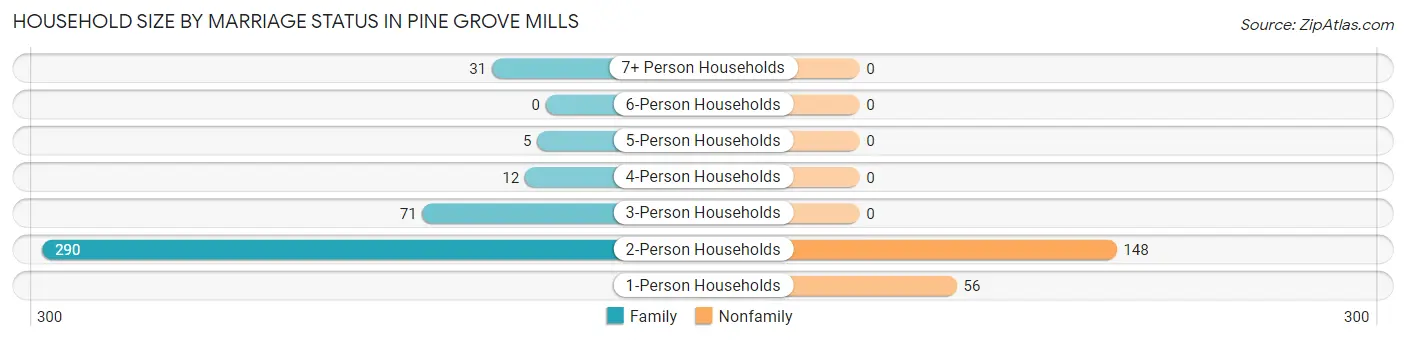
| Household Size | Family Households | Nonfamily Households |
| 1-Person Households | - | 56 (9.1%) |
| 2-Person Households | 290 (47.3%) | 148 (24.1%) |
| 3-Person Households | 71 (11.6%) | 0 (0.0%) |
| 4-Person Households | 12 (2.0%) | 0 (0.0%) |
| 5-Person Households | 5 (0.8%) | 0 (0.0%) |
| 6-Person Households | 0 (0.0%) | 0 (0.0%) |
| 7+ Person Households | 31 (5.1%) | 0 (0.0%) |
| Total | 409 (66.7%) | 204 (33.3%) |
Female Fertility in Pine Grove Mills
Fertility by Age in Pine Grove Mills
| Age Bracket | Women with Births | Births / 1,000 Women |
| 15 to 19 years | 0 (0.0%) | 0.0 |
| 20 to 34 years | 0 (0.0%) | 0.0 |
| 35 to 50 years | 0 (0.0%) | 0.0 |
| Total | 0 (0.0%) | 0.0 |
Fertility by Age by Marriage Status in Pine Grove Mills
| Age Bracket | Married | Unmarried |
| 15 to 19 years | 0 (0.0%) | 0 (0.0%) |
| 20 to 34 years | 0 (0.0%) | 0 (0.0%) |
| 35 to 50 years | 0 (0.0%) | 0 (0.0%) |
| Total | 0 (0.0%) | 0 (0.0%) |
Fertility by Education in Pine Grove Mills
| Educational Attainment | Women with Births | Births / 1,000 Women |
| Less than High School | 0 (0.0%) | 0.0 |
| High School Diploma | 0 (0.0%) | 0.0 |
| College or Associate's Degree | 0 (0.0%) | 0.0 |
| Bachelor's Degree | 0 (0.0%) | 0.0 |
| Graduate Degree | 0 (0.0%) | 0.0 |
| Total | 0 (0.0%) | 0.0 |
Fertility by Education by Marriage Status in Pine Grove Mills
| Educational Attainment | Married | Unmarried |
| Less than High School | 0 (0.0%) | 0 (0.0%) |
| High School Diploma | 0 (0.0%) | 0 (0.0%) |
| College or Associate's Degree | 0 (0.0%) | 0 (0.0%) |
| Bachelor's Degree | 0 (0.0%) | 0 (0.0%) |
| Graduate Degree | 0 (0.0%) | 0 (0.0%) |
| Total | 0 (0.0%) | 0 (0.0%) |
Employment Characteristics in Pine Grove Mills
Employment by Class of Employer in Pine Grove Mills
Among the 957 employed individuals in Pine Grove Mills, private company employees (386 | 40.3%), not-for-profit organizations (309 | 32.3%), and state government employees (167 | 17.4%) make up the most common classes of employment.
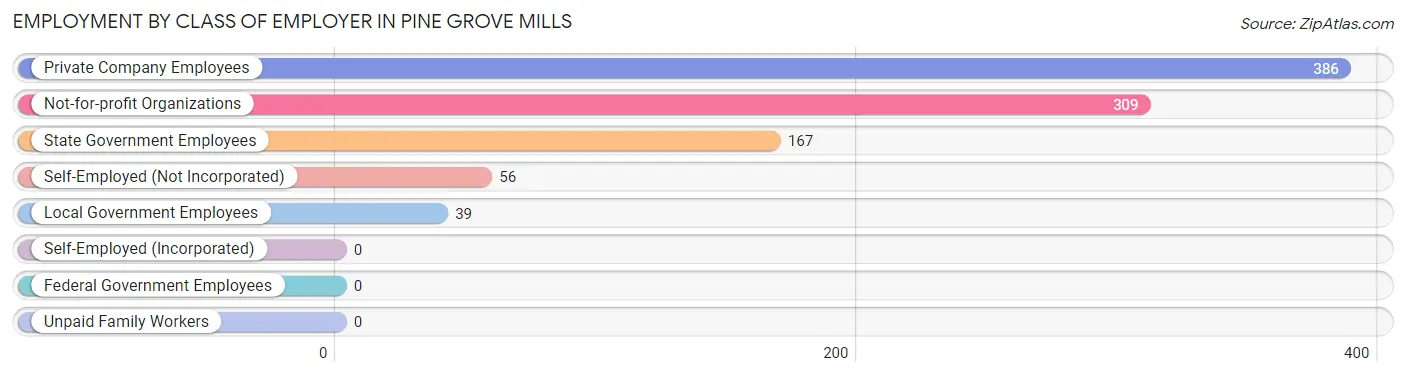
| Employer Class | # Employees | % Employees |
| Private Company Employees | 386 | 40.3% |
| Self-Employed (Incorporated) | 0 | 0.0% |
| Self-Employed (Not Incorporated) | 56 | 5.9% |
| Not-for-profit Organizations | 309 | 32.3% |
| Local Government Employees | 39 | 4.1% |
| State Government Employees | 167 | 17.4% |
| Federal Government Employees | 0 | 0.0% |
| Unpaid Family Workers | 0 | 0.0% |
| Total | 957 | 100.0% |
Employment Status by Age in Pine Grove Mills
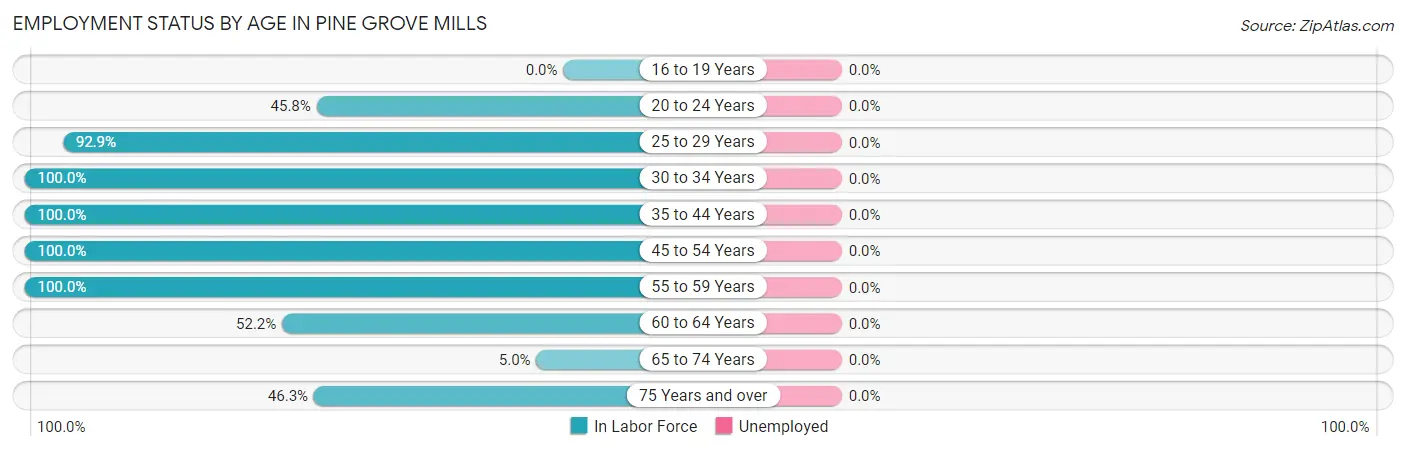
| Age Bracket | In Labor Force | Unemployed |
| 16 to 19 Years | 0 (0.0%) | 0 (0.0%) |
| 20 to 24 Years | 22 (45.8%) | 0 (0.0%) |
| 25 to 29 Years | 39 (92.9%) | 0 (0.0%) |
| 30 to 34 Years | 28 (100.0%) | 0 (0.0%) |
| 35 to 44 Years | 409 (100.0%) | 0 (0.0%) |
| 45 to 54 Years | 170 (100.0%) | 0 (0.0%) |
| 55 to 59 Years | 30 (100.0%) | 0 (0.0%) |
| 60 to 64 Years | 180 (52.2%) | 0 (0.0%) |
| 65 to 74 Years | 5 (5.0%) | 0 (0.0%) |
| 75 Years and over | 74 (46.3%) | 0 (0.0%) |
| Total | 957 (71.5%) | 0 (0.0%) |
Employment Status by Educational Attainment in Pine Grove Mills
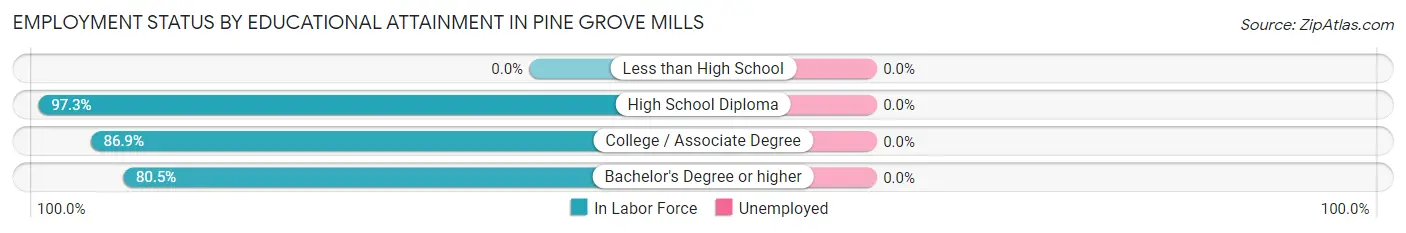
| Educational Attainment | In Labor Force | Unemployed |
| Less than High School | 0 (0.0%) | 0 (0.0%) |
| High School Diploma | 110 (97.3%) | 0 (0.0%) |
| College / Associate Degree | 173 (86.9%) | 0 (0.0%) |
| Bachelor's Degree or higher | 573 (80.5%) | 0 (0.0%) |
| Total | 856 (83.6%) | 0 (0.0%) |
Employment Occupations by Sex in Pine Grove Mills
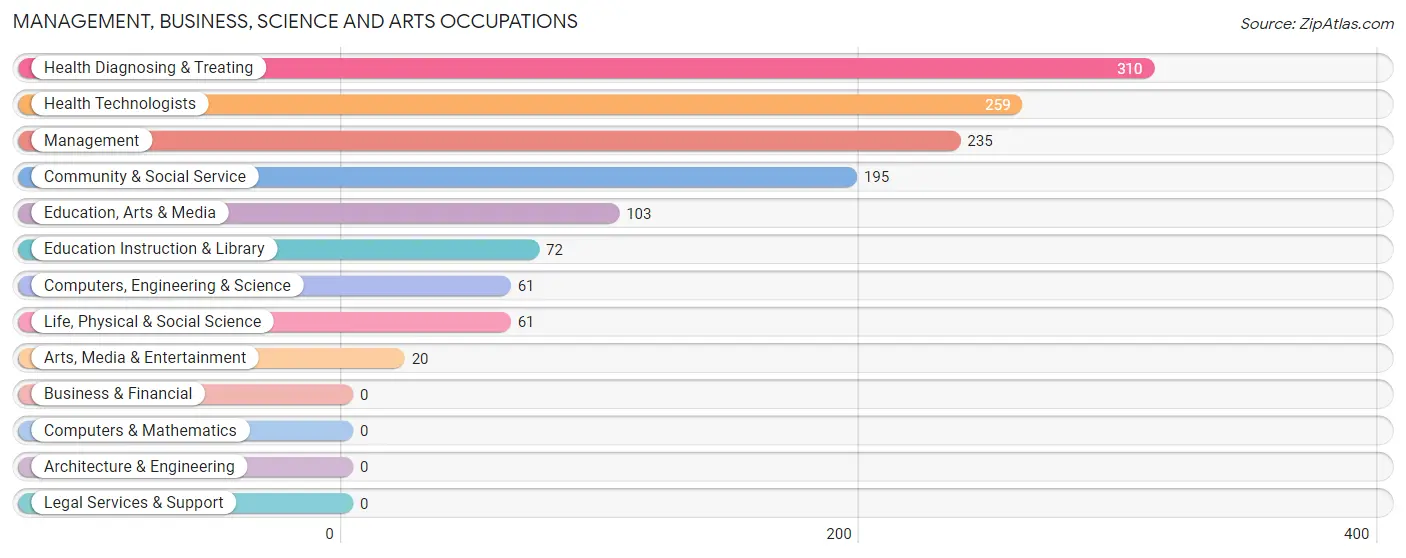
Management, Business, Science and Arts Occupations
The most common Management, Business, Science and Arts occupations in Pine Grove Mills are Health Diagnosing & Treating (310 | 32.4%), Health Technologists (259 | 27.1%), Management (235 | 24.6%), Community & Social Service (195 | 20.4%), and Education, Arts & Media (103 | 10.8%).
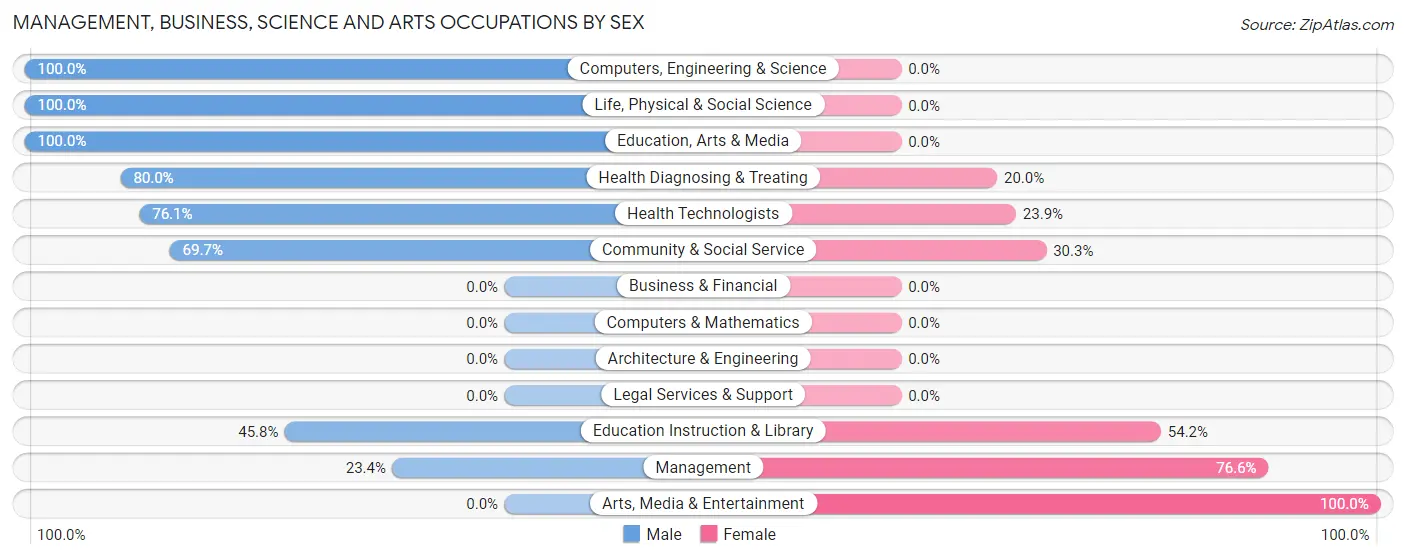
Management, Business, Science and Arts Occupations by Sex
Within the Management, Business, Science and Arts occupations in Pine Grove Mills, the most male-oriented occupations are Computers, Engineering & Science (100.0%), Life, Physical & Social Science (100.0%), and Education, Arts & Media (100.0%), while the most female-oriented occupations are Arts, Media & Entertainment (100.0%), Management (76.6%), and Education Instruction & Library (54.2%).
| Occupation | Male | Female |
| Management | 55 (23.4%) | 180 (76.6%) |
| Business & Financial | 0 (0.0%) | 0 (0.0%) |
| Computers, Engineering & Science | 61 (100.0%) | 0 (0.0%) |
| Computers & Mathematics | 0 (0.0%) | 0 (0.0%) |
| Architecture & Engineering | 0 (0.0%) | 0 (0.0%) |
| Life, Physical & Social Science | 61 (100.0%) | 0 (0.0%) |
| Community & Social Service | 136 (69.7%) | 59 (30.3%) |
| Education, Arts & Media | 103 (100.0%) | 0 (0.0%) |
| Legal Services & Support | 0 (0.0%) | 0 (0.0%) |
| Education Instruction & Library | 33 (45.8%) | 39 (54.2%) |
| Arts, Media & Entertainment | 0 (0.0%) | 20 (100.0%) |
| Health Diagnosing & Treating | 248 (80.0%) | 62 (20.0%) |
| Health Technologists | 197 (76.1%) | 62 (23.9%) |
| Total (Category) | 500 (62.4%) | 301 (37.6%) |
| Total (Overall) | 574 (60.0%) | 383 (40.0%) |
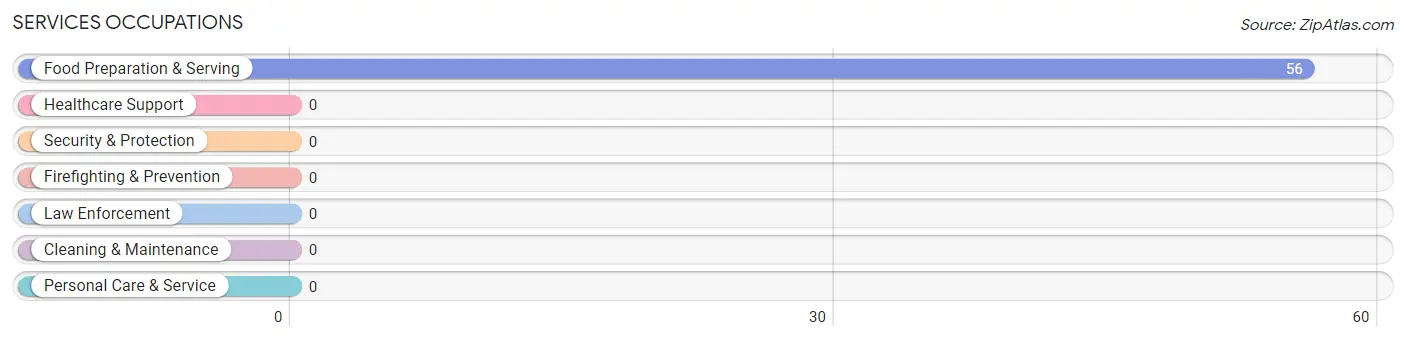
Services Occupations
The most common Services occupations in Pine Grove Mills are , and Food Preparation & Serving (56 | 5.9%).
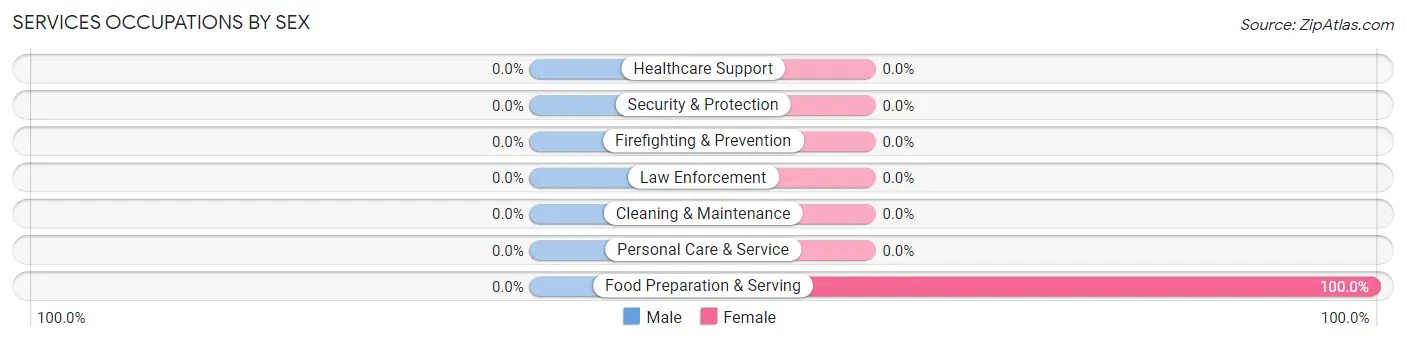
Services Occupations by Sex
| Occupation | Male | Female |
| Healthcare Support | 0 (0.0%) | 0 (0.0%) |
| Security & Protection | 0 (0.0%) | 0 (0.0%) |
| Firefighting & Prevention | 0 (0.0%) | 0 (0.0%) |
| Law Enforcement | 0 (0.0%) | 0 (0.0%) |
| Food Preparation & Serving | 0 (0.0%) | 56 (100.0%) |
| Cleaning & Maintenance | 0 (0.0%) | 0 (0.0%) |
| Personal Care & Service | 0 (0.0%) | 0 (0.0%) |
| Total (Category) | 0 (0.0%) | 56 (100.0%) |
| Total (Overall) | 574 (60.0%) | 383 (40.0%) |
Sales and Office Occupations
The most common Sales and Office occupations in Pine Grove Mills are Sales & Related (12 | 1.3%), and Office & Administration (11 | 1.1%).

Sales and Office Occupations by Sex

| Occupation | Male | Female |
| Sales & Related | 12 (100.0%) | 0 (0.0%) |
| Office & Administration | 0 (0.0%) | 11 (100.0%) |
| Total (Category) | 12 (52.2%) | 11 (47.8%) |
| Total (Overall) | 574 (60.0%) | 383 (40.0%) |
Natural Resources, Construction and Maintenance Occupations
The most common Natural Resources, Construction and Maintenance occupations in Pine Grove Mills are , and Construction & Extraction (15 | 1.6%).
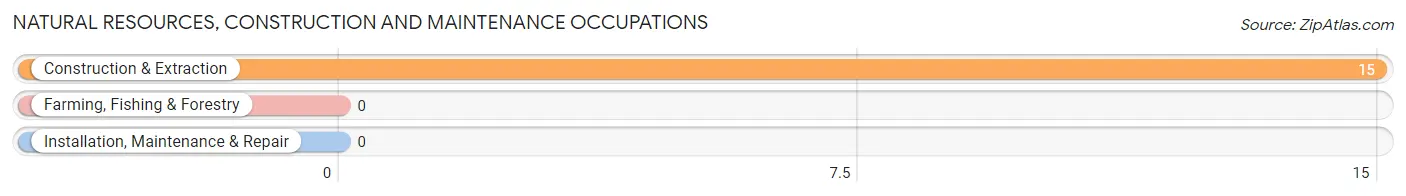
Natural Resources, Construction and Maintenance Occupations by Sex
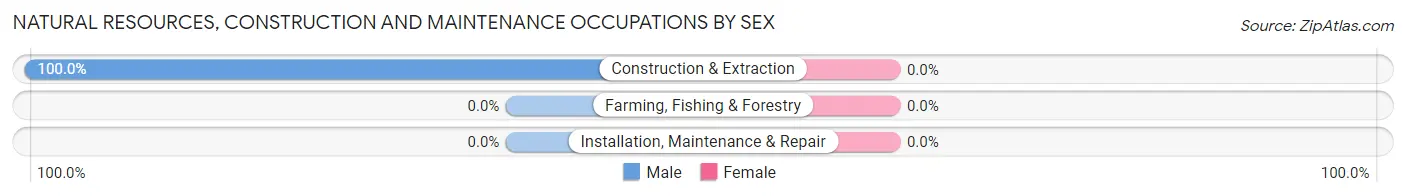
| Occupation | Male | Female |
| Farming, Fishing & Forestry | 0 (0.0%) | 0 (0.0%) |
| Construction & Extraction | 15 (100.0%) | 0 (0.0%) |
| Installation, Maintenance & Repair | 0 (0.0%) | 0 (0.0%) |
| Total (Category) | 15 (100.0%) | 0 (0.0%) |
| Total (Overall) | 574 (60.0%) | 383 (40.0%) |
Production, Transportation and Moving Occupations
The most common Production, Transportation and Moving occupations in Pine Grove Mills are Production (25 | 2.6%), Material Moving (22 | 2.3%), and Transportation (15 | 1.6%).
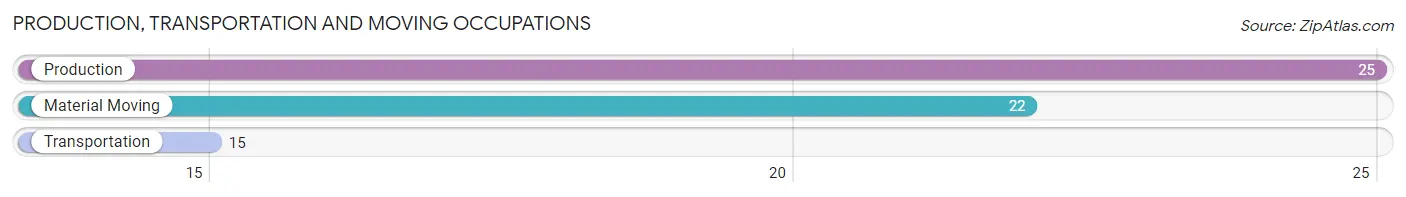
Production, Transportation and Moving Occupations by Sex
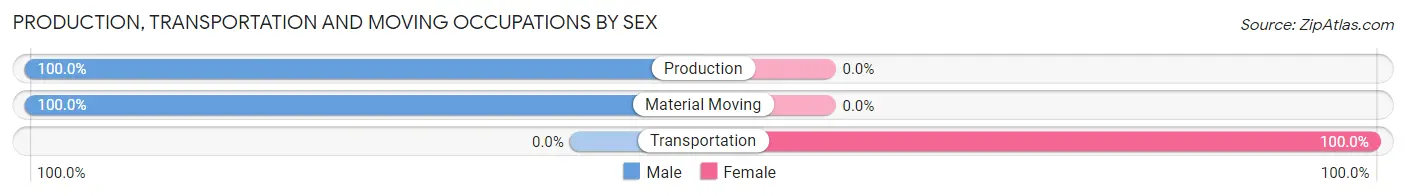
| Occupation | Male | Female |
| Production | 25 (100.0%) | 0 (0.0%) |
| Transportation | 0 (0.0%) | 15 (100.0%) |
| Material Moving | 22 (100.0%) | 0 (0.0%) |
| Total (Category) | 47 (75.8%) | 15 (24.2%) |
| Total (Overall) | 574 (60.0%) | 383 (40.0%) |
Employment Industries by Sex in Pine Grove Mills
Employment Industries in Pine Grove Mills
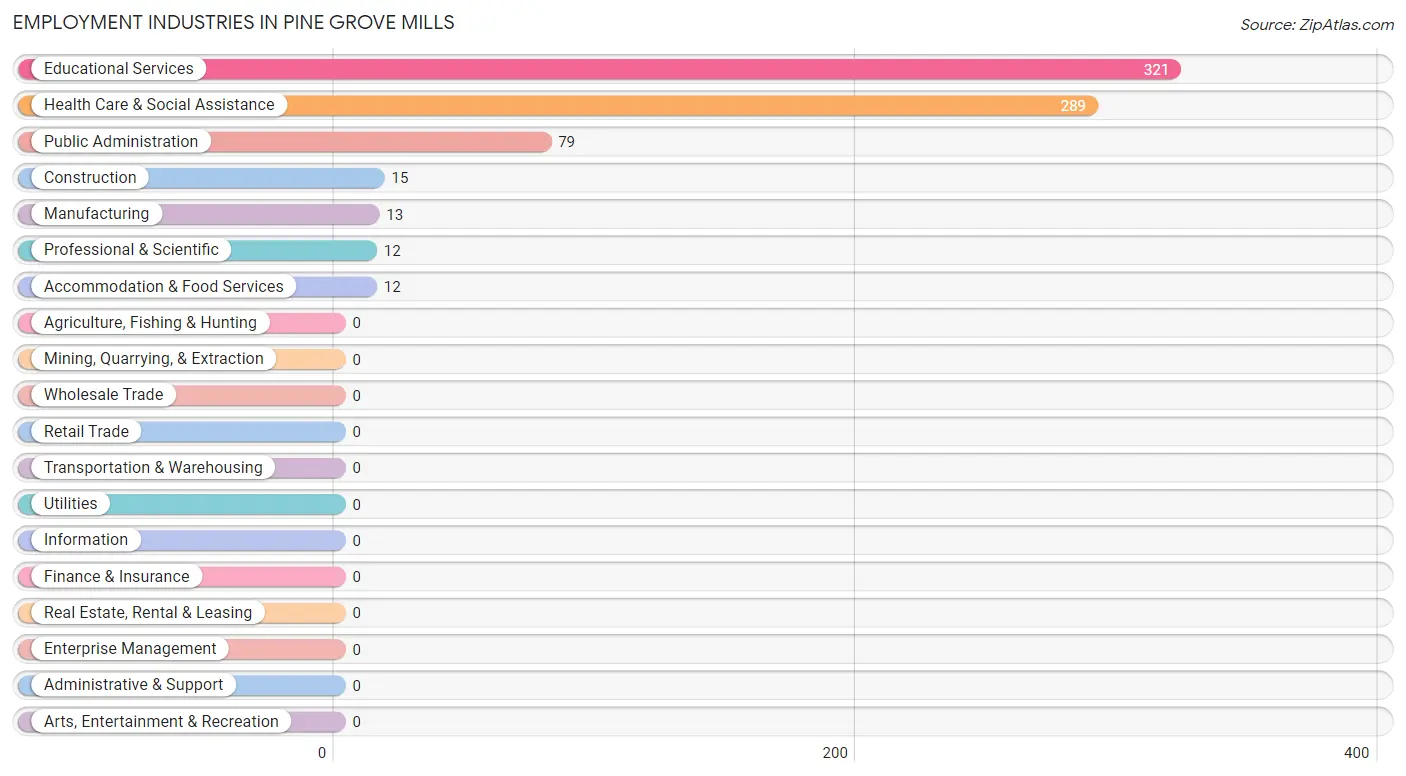
The major employment industries in Pine Grove Mills include Educational Services (321 | 33.5%), Health Care & Social Assistance (289 | 30.2%), Public Administration (79 | 8.3%), Construction (15 | 1.6%), and Manufacturing (13 | 1.4%).
Employment Industries by Sex in Pine Grove Mills
The Pine Grove Mills industries that see more men than women are Construction (100.0%), Manufacturing (100.0%), and Accommodation & Food Services (100.0%), whereas the industries that tend to have a higher number of women are Professional & Scientific (100.0%), Educational Services (46.1%), and Health Care & Social Assistance (26.0%).
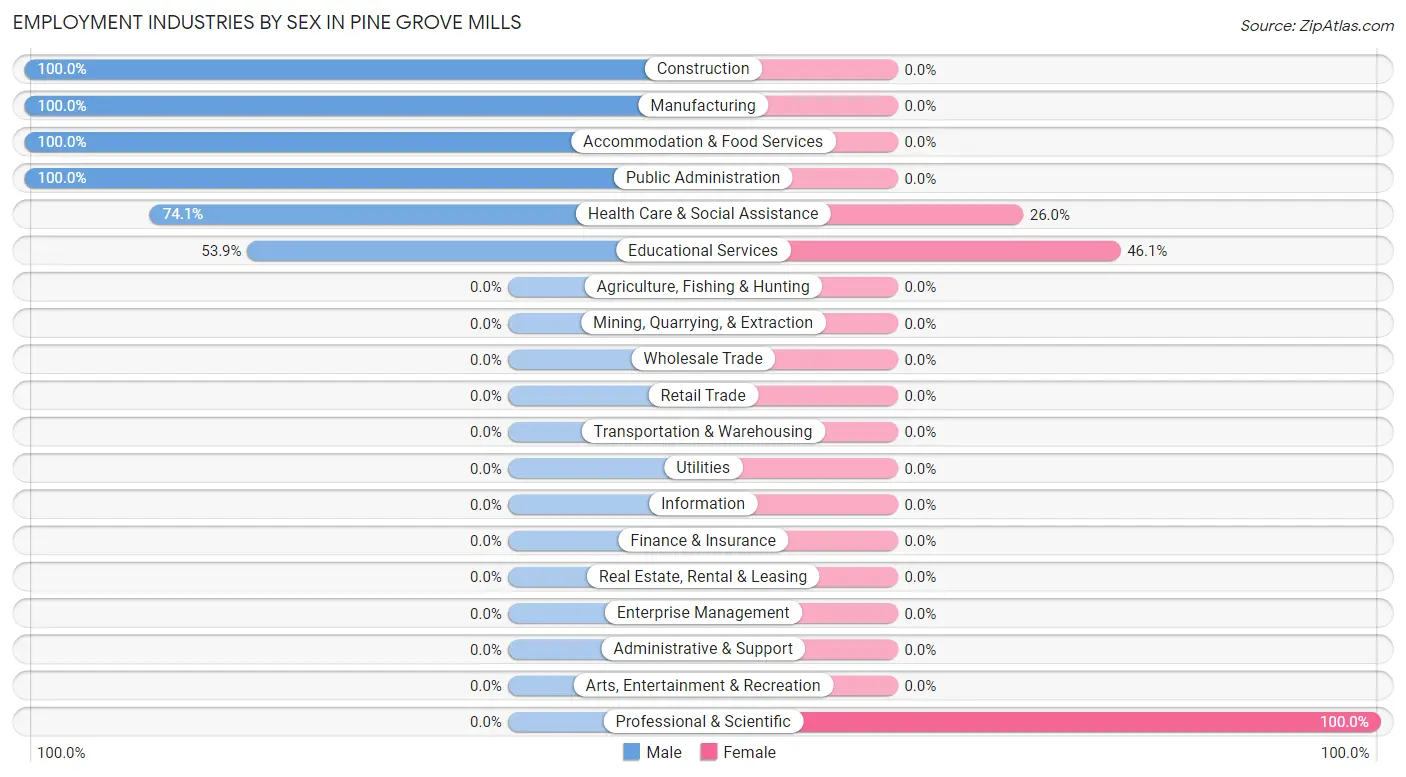
| Industry | Male | Female |
| Agriculture, Fishing & Hunting | 0 (0.0%) | 0 (0.0%) |
| Mining, Quarrying, & Extraction | 0 (0.0%) | 0 (0.0%) |
| Construction | 15 (100.0%) | 0 (0.0%) |
| Manufacturing | 13 (100.0%) | 0 (0.0%) |
| Wholesale Trade | 0 (0.0%) | 0 (0.0%) |
| Retail Trade | 0 (0.0%) | 0 (0.0%) |
| Transportation & Warehousing | 0 (0.0%) | 0 (0.0%) |
| Utilities | 0 (0.0%) | 0 (0.0%) |
| Information | 0 (0.0%) | 0 (0.0%) |
| Finance & Insurance | 0 (0.0%) | 0 (0.0%) |
| Real Estate, Rental & Leasing | 0 (0.0%) | 0 (0.0%) |
| Professional & Scientific | 0 (0.0%) | 12 (100.0%) |
| Enterprise Management | 0 (0.0%) | 0 (0.0%) |
| Administrative & Support | 0 (0.0%) | 0 (0.0%) |
| Educational Services | 173 (53.9%) | 148 (46.1%) |
| Health Care & Social Assistance | 214 (74.1%) | 75 (26.0%) |
| Arts, Entertainment & Recreation | 0 (0.0%) | 0 (0.0%) |
| Accommodation & Food Services | 12 (100.0%) | 0 (0.0%) |
| Public Administration | 79 (100.0%) | 0 (0.0%) |
| Total | 574 (60.0%) | 383 (40.0%) |
Education in Pine Grove Mills
School Enrollment in Pine Grove Mills
The most common levels of schooling among the 372 students in Pine Grove Mills are graduate / professional (167 | 44.9%), middle school (130 | 34.9%), and elementary school (39 | 10.5%).
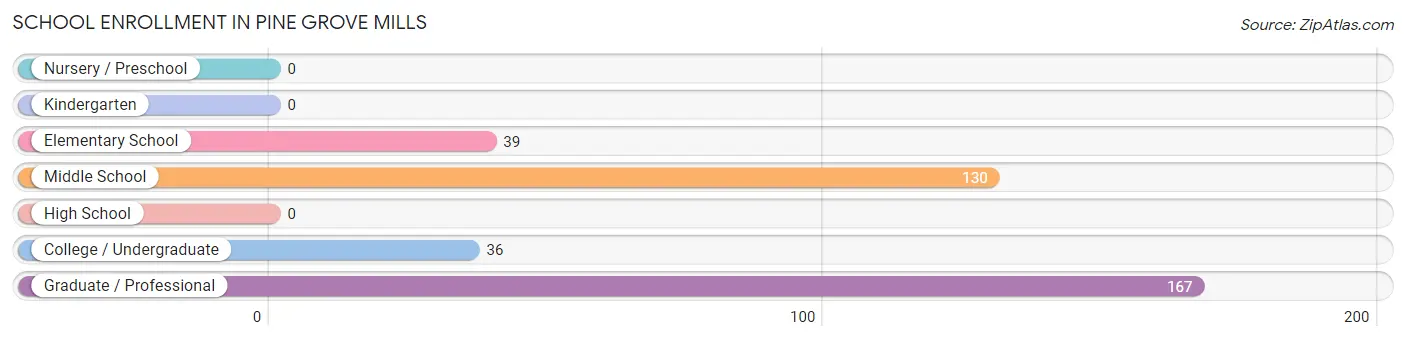
| School Level | # Students | % Students |
| Nursery / Preschool | 0 | 0.0% |
| Kindergarten | 0 | 0.0% |
| Elementary School | 39 | 10.5% |
| Middle School | 130 | 34.9% |
| High School | 0 | 0.0% |
| College / Undergraduate | 36 | 9.7% |
| Graduate / Professional | 167 | 44.9% |
| Total | 372 | 100.0% |
School Enrollment by Age by Funding Source in Pine Grove Mills
Out of a total of 372 students who are enrolled in schools in Pine Grove Mills, 118 (31.7%) attend a private institution, while the remaining 254 (68.3%) are enrolled in public schools. The age group of 5 to 9 year old has the highest likelihood of being enrolled in private schools, with 39 (100.0% in the age bracket) enrolled. Conversely, the age group of 18 to 19 year olds has the lowest likelihood of being enrolled in a private school, with 7 (100.0% in the age bracket) attending a public institution.
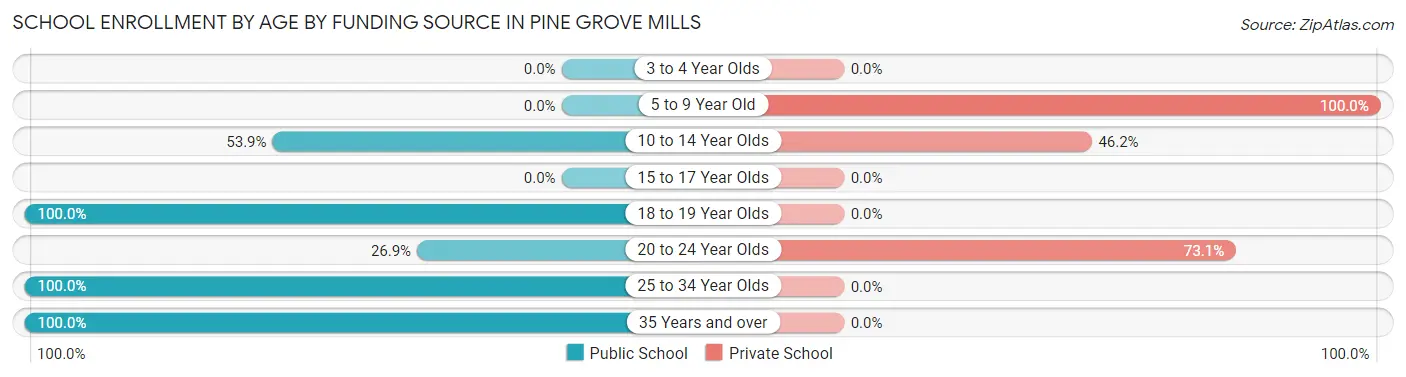
| Age Bracket | Public School | Private School |
| 3 to 4 Year Olds | 0 (0.0%) | 0 (0.0%) |
| 5 to 9 Year Old | 0 (0.0%) | 39 (100.0%) |
| 10 to 14 Year Olds | 70 (53.8%) | 60 (46.2%) |
| 15 to 17 Year Olds | 0 (0.0%) | 0 (0.0%) |
| 18 to 19 Year Olds | 7 (100.0%) | 0 (0.0%) |
| 20 to 24 Year Olds | 7 (26.9%) | 19 (73.1%) |
| 25 to 34 Year Olds | 3 (100.0%) | 0 (0.0%) |
| 35 Years and over | 167 (100.0%) | 0 (0.0%) |
| Total | 254 (68.3%) | 118 (31.7%) |
Educational Attainment by Field of Study in Pine Grove Mills
Science & technology (192 | 24.0%), bio, nature & agricultural (177 | 22.1%), education (164 | 20.5%), psychology (96 | 12.0%), and social sciences (69 | 8.6%) are the most common fields of study among 800 individuals in Pine Grove Mills who have obtained a bachelor's degree or higher.
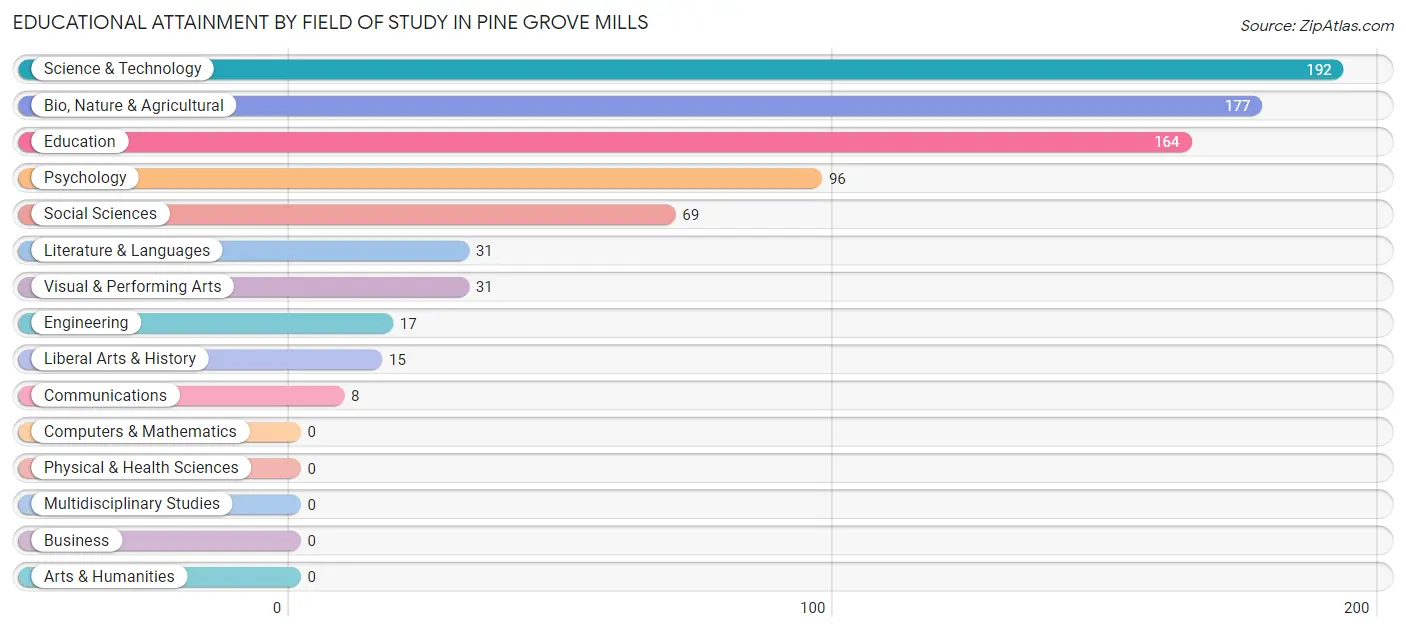
| Field of Study | # Graduates | % Graduates |
| Computers & Mathematics | 0 | 0.0% |
| Bio, Nature & Agricultural | 177 | 22.1% |
| Physical & Health Sciences | 0 | 0.0% |
| Psychology | 96 | 12.0% |
| Social Sciences | 69 | 8.6% |
| Engineering | 17 | 2.1% |
| Multidisciplinary Studies | 0 | 0.0% |
| Science & Technology | 192 | 24.0% |
| Business | 0 | 0.0% |
| Education | 164 | 20.5% |
| Literature & Languages | 31 | 3.9% |
| Liberal Arts & History | 15 | 1.9% |
| Visual & Performing Arts | 31 | 3.9% |
| Communications | 8 | 1.0% |
| Arts & Humanities | 0 | 0.0% |
| Total | 800 | 100.0% |
Transportation & Commute in Pine Grove Mills
Vehicle Availability by Sex in Pine Grove Mills
The most prevalent vehicle ownership categories in Pine Grove Mills are males with 2 vehicles (275, accounting for 47.9%) and females with 2 vehicles (214, making up 71.8%).
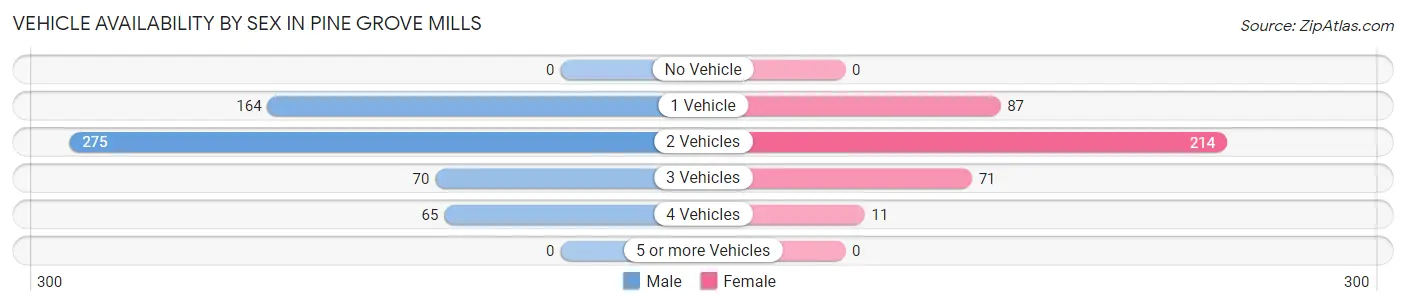
| Vehicles Available | Male | Female |
| No Vehicle | 0 (0.0%) | 0 (0.0%) |
| 1 Vehicle | 164 (28.6%) | 87 (22.7%) |
| 2 Vehicles | 275 (47.9%) | 214 (55.9%) |
| 3 Vehicles | 70 (12.2%) | 71 (18.5%) |
| 4 Vehicles | 65 (11.3%) | 11 (2.9%) |
| 5 or more Vehicles | 0 (0.0%) | 0 (0.0%) |
| Total | 574 (100.0%) | 383 (100.0%) |
Commute Time in Pine Grove Mills
The most frequently occuring commute durations in Pine Grove Mills are 15 to 19 minutes (150 commuters, 29.7%), 20 to 24 minutes (114 commuters, 22.6%), and 30 to 34 minutes (64 commuters, 12.7%).
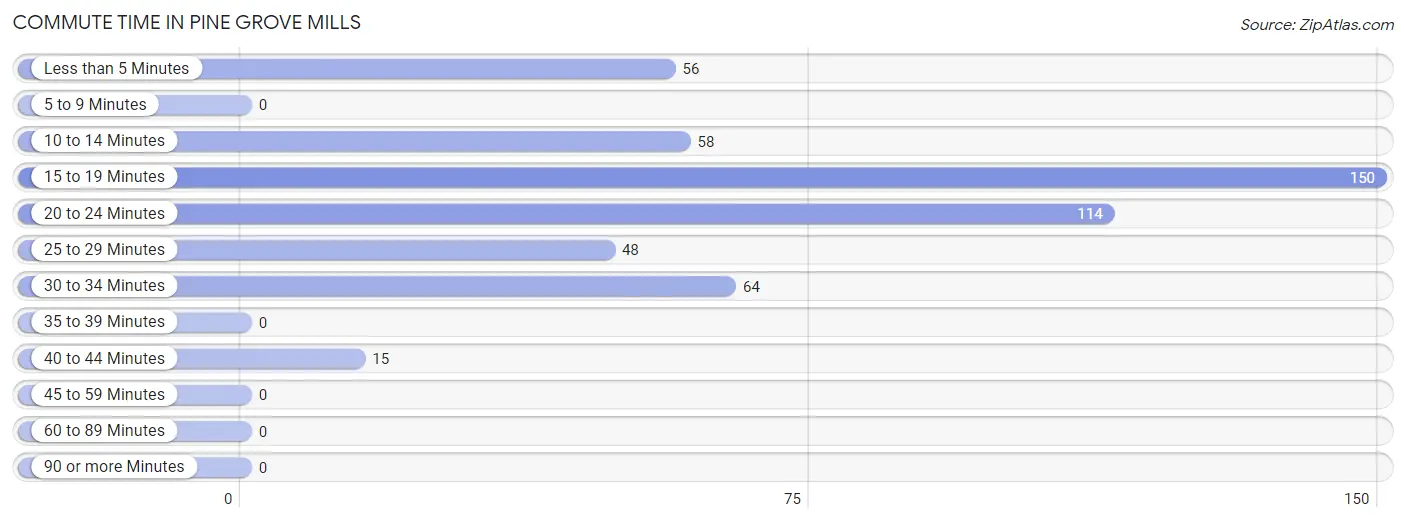
| Commute Time | # Commuters | % Commuters |
| Less than 5 Minutes | 56 | 11.1% |
| 5 to 9 Minutes | 0 | 0.0% |
| 10 to 14 Minutes | 58 | 11.5% |
| 15 to 19 Minutes | 150 | 29.7% |
| 20 to 24 Minutes | 114 | 22.6% |
| 25 to 29 Minutes | 48 | 9.5% |
| 30 to 34 Minutes | 64 | 12.7% |
| 35 to 39 Minutes | 0 | 0.0% |
| 40 to 44 Minutes | 15 | 3.0% |
| 45 to 59 Minutes | 0 | 0.0% |
| 60 to 89 Minutes | 0 | 0.0% |
| 90 or more Minutes | 0 | 0.0% |
Commute Time by Sex in Pine Grove Mills
The most common commute times in Pine Grove Mills are 20 to 24 minutes (114 commuters, 36.0%) for males and less than 5 minutes (56 commuters, 29.8%) for females.
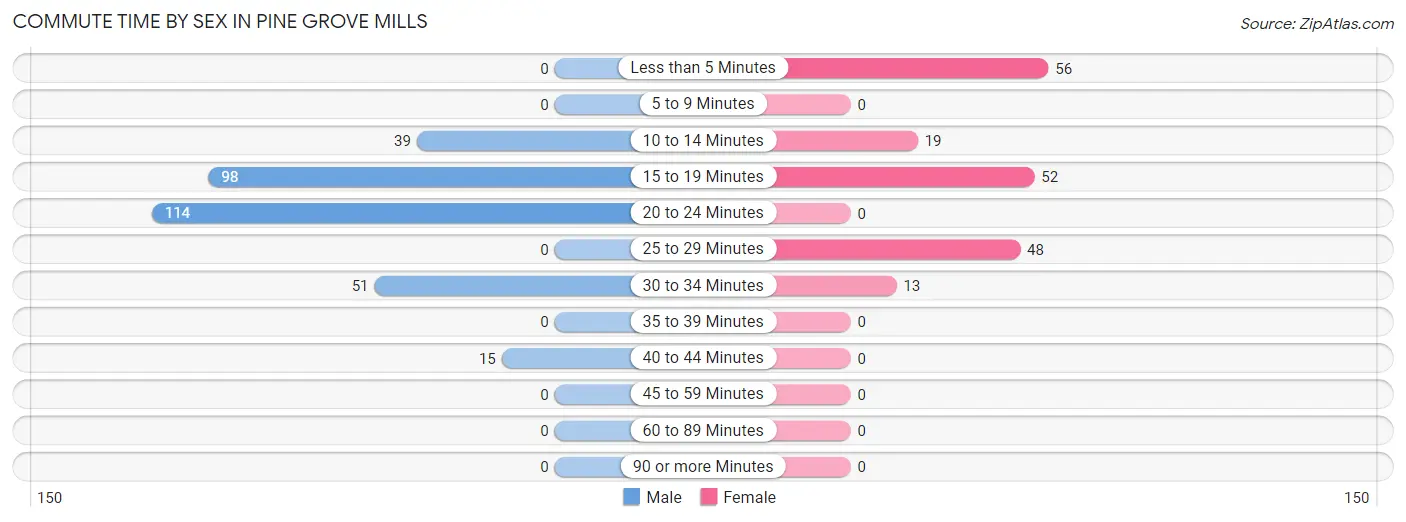
| Commute Time | Male | Female |
| Less than 5 Minutes | 0 (0.0%) | 56 (29.8%) |
| 5 to 9 Minutes | 0 (0.0%) | 0 (0.0%) |
| 10 to 14 Minutes | 39 (12.3%) | 19 (10.1%) |
| 15 to 19 Minutes | 98 (30.9%) | 52 (27.7%) |
| 20 to 24 Minutes | 114 (36.0%) | 0 (0.0%) |
| 25 to 29 Minutes | 0 (0.0%) | 48 (25.5%) |
| 30 to 34 Minutes | 51 (16.1%) | 13 (6.9%) |
| 35 to 39 Minutes | 0 (0.0%) | 0 (0.0%) |
| 40 to 44 Minutes | 15 (4.7%) | 0 (0.0%) |
| 45 to 59 Minutes | 0 (0.0%) | 0 (0.0%) |
| 60 to 89 Minutes | 0 (0.0%) | 0 (0.0%) |
| 90 or more Minutes | 0 (0.0%) | 0 (0.0%) |
Time of Departure to Work by Sex in Pine Grove Mills
The most frequent times of departure to work in Pine Grove Mills are 7:00 AM to 7:29 AM (117, 36.9%) for males and 7:30 AM to 7:59 AM (78, 41.5%) for females.
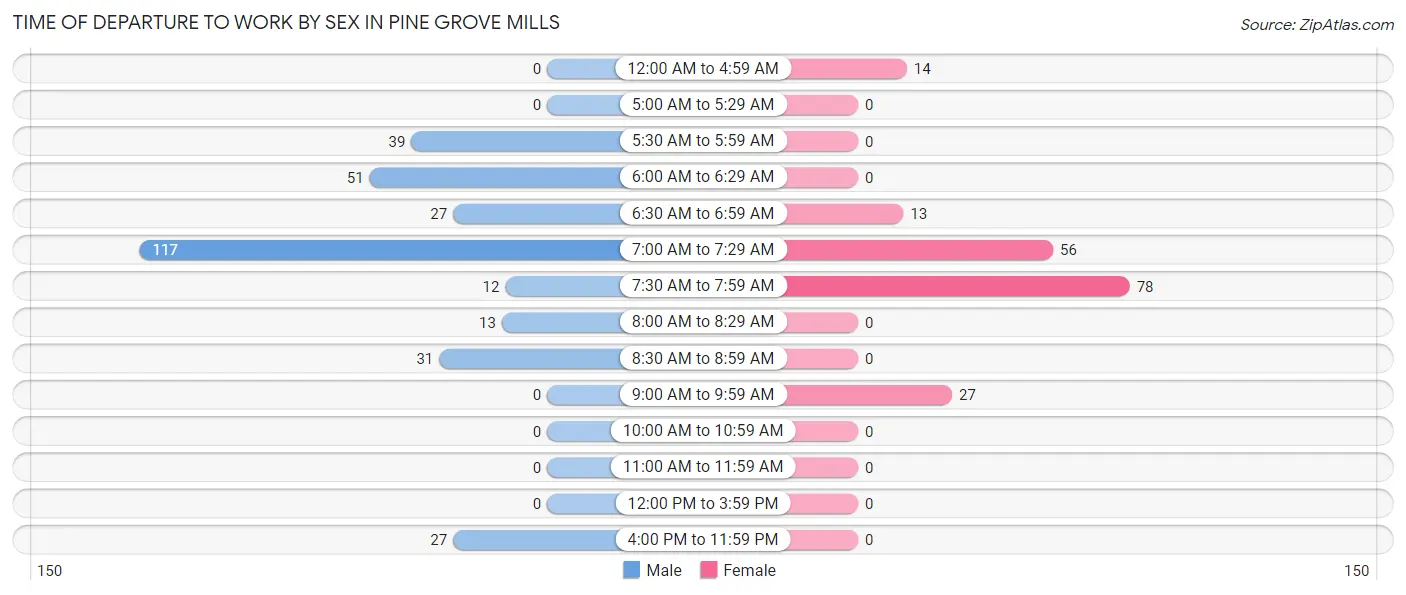
| Time of Departure | Male | Female |
| 12:00 AM to 4:59 AM | 0 (0.0%) | 14 (7.4%) |
| 5:00 AM to 5:29 AM | 0 (0.0%) | 0 (0.0%) |
| 5:30 AM to 5:59 AM | 39 (12.3%) | 0 (0.0%) |
| 6:00 AM to 6:29 AM | 51 (16.1%) | 0 (0.0%) |
| 6:30 AM to 6:59 AM | 27 (8.5%) | 13 (6.9%) |
| 7:00 AM to 7:29 AM | 117 (36.9%) | 56 (29.8%) |
| 7:30 AM to 7:59 AM | 12 (3.8%) | 78 (41.5%) |
| 8:00 AM to 8:29 AM | 13 (4.1%) | 0 (0.0%) |
| 8:30 AM to 8:59 AM | 31 (9.8%) | 0 (0.0%) |
| 9:00 AM to 9:59 AM | 0 (0.0%) | 27 (14.4%) |
| 10:00 AM to 10:59 AM | 0 (0.0%) | 0 (0.0%) |
| 11:00 AM to 11:59 AM | 0 (0.0%) | 0 (0.0%) |
| 12:00 PM to 3:59 PM | 0 (0.0%) | 0 (0.0%) |
| 4:00 PM to 11:59 PM | 27 (8.5%) | 0 (0.0%) |
| Total | 317 (100.0%) | 188 (100.0%) |
Housing Occupancy in Pine Grove Mills
Occupancy by Ownership in Pine Grove Mills
Of the total 613 dwellings in Pine Grove Mills, owner-occupied units account for 589 (96.1%), while renter-occupied units make up 24 (3.9%).
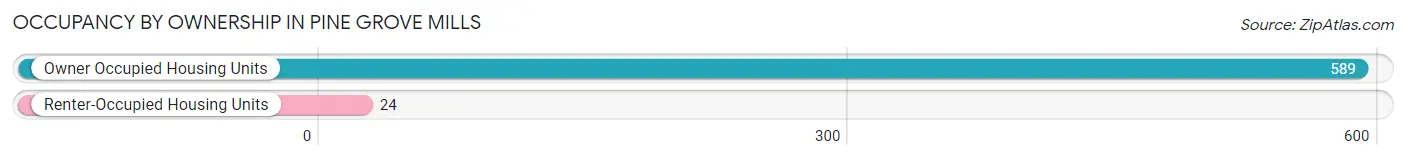
| Occupancy | # Housing Units | % Housing Units |
| Owner Occupied Housing Units | 589 | 96.1% |
| Renter-Occupied Housing Units | 24 | 3.9% |
| Total Occupied Housing Units | 613 | 100.0% |
Occupancy by Household Size in Pine Grove Mills
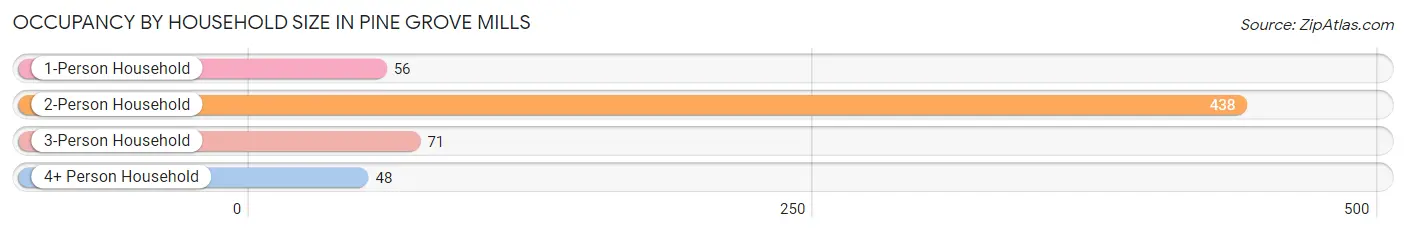
| Household Size | # Housing Units | % Housing Units |
| 1-Person Household | 56 | 9.1% |
| 2-Person Household | 438 | 71.5% |
| 3-Person Household | 71 | 11.6% |
| 4+ Person Household | 48 | 7.8% |
| Total Housing Units | 613 | 100.0% |
Occupancy by Ownership by Household Size in Pine Grove Mills
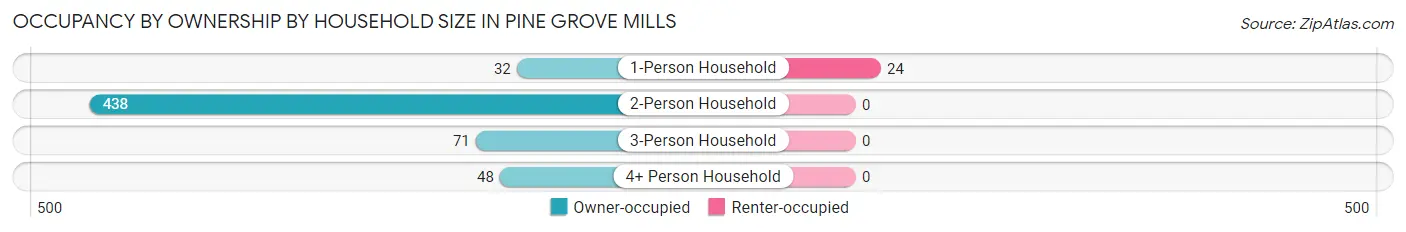
| Household Size | Owner-occupied | Renter-occupied |
| 1-Person Household | 32 (57.1%) | 24 (42.9%) |
| 2-Person Household | 438 (100.0%) | 0 (0.0%) |
| 3-Person Household | 71 (100.0%) | 0 (0.0%) |
| 4+ Person Household | 48 (100.0%) | 0 (0.0%) |
| Total Housing Units | 589 (96.1%) | 24 (3.9%) |
Occupancy by Educational Attainment in Pine Grove Mills
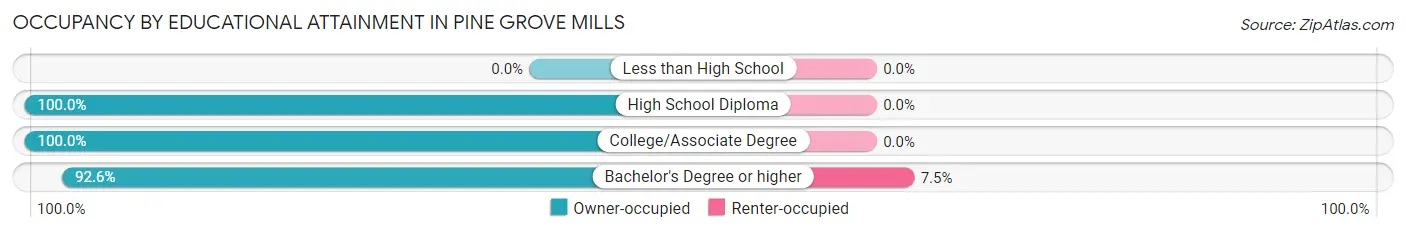
| Household Size | Owner-occupied | Renter-occupied |
| Less than High School | 0 (0.0%) | 0 (0.0%) |
| High School Diploma | 130 (100.0%) | 0 (0.0%) |
| College/Associate Degree | 161 (100.0%) | 0 (0.0%) |
| Bachelor's Degree or higher | 298 (92.5%) | 24 (7.4%) |
Occupancy by Age of Householder in Pine Grove Mills
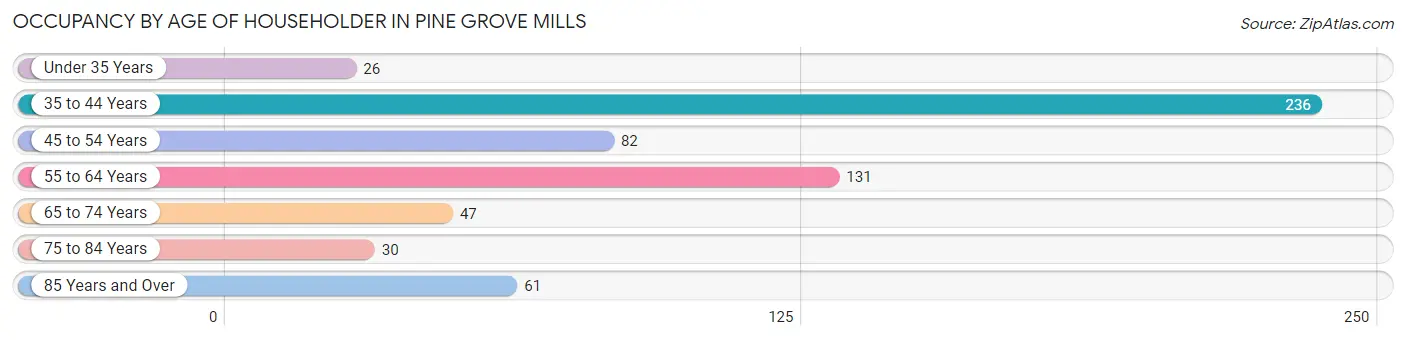
| Age Bracket | # Households | % Households |
| Under 35 Years | 26 | 4.2% |
| 35 to 44 Years | 236 | 38.5% |
| 45 to 54 Years | 82 | 13.4% |
| 55 to 64 Years | 131 | 21.4% |
| 65 to 74 Years | 47 | 7.7% |
| 75 to 84 Years | 30 | 4.9% |
| 85 Years and Over | 61 | 10.0% |
| Total | 613 | 100.0% |
Housing Finances in Pine Grove Mills
Median Income by Occupancy in Pine Grove Mills
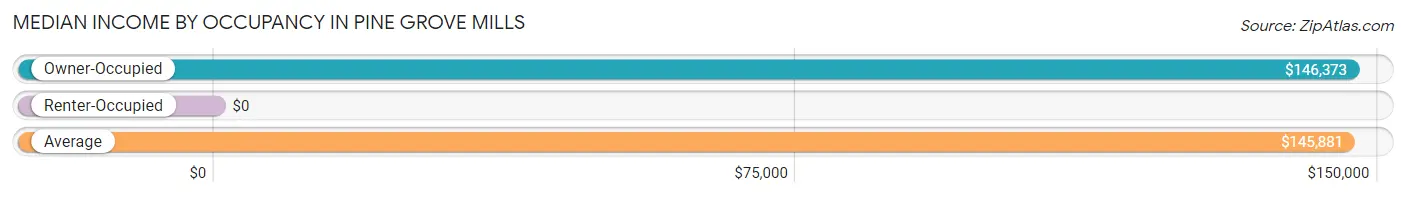
| Occupancy Type | # Households | Median Income |
| Owner-Occupied | 589 (96.1%) | $146,373 |
| Renter-Occupied | 24 (3.9%) | $0 |
| Average | 613 (100.0%) | $145,881 |
Occupancy by Householder Income Bracket in Pine Grove Mills
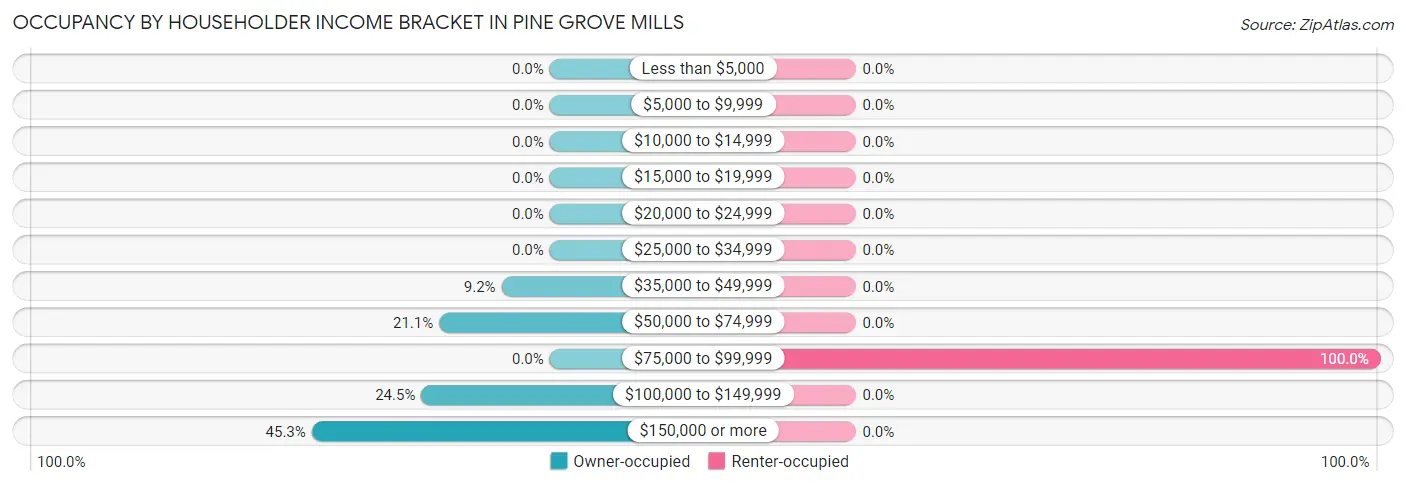
| Income Bracket | Owner-occupied | Renter-occupied |
| Less than $5,000 | 0 (0.0%) | 0 (0.0%) |
| $5,000 to $9,999 | 0 (0.0%) | 0 (0.0%) |
| $10,000 to $14,999 | 0 (0.0%) | 0 (0.0%) |
| $15,000 to $19,999 | 0 (0.0%) | 0 (0.0%) |
| $20,000 to $24,999 | 0 (0.0%) | 0 (0.0%) |
| $25,000 to $34,999 | 0 (0.0%) | 0 (0.0%) |
| $35,000 to $49,999 | 54 (9.2%) | 0 (0.0%) |
| $50,000 to $74,999 | 124 (21.0%) | 0 (0.0%) |
| $75,000 to $99,999 | 0 (0.0%) | 24 (100.0%) |
| $100,000 to $149,999 | 144 (24.4%) | 0 (0.0%) |
| $150,000 or more | 267 (45.3%) | 0 (0.0%) |
| Total | 589 (100.0%) | 24 (100.0%) |
Monthly Housing Cost Tiers in Pine Grove Mills
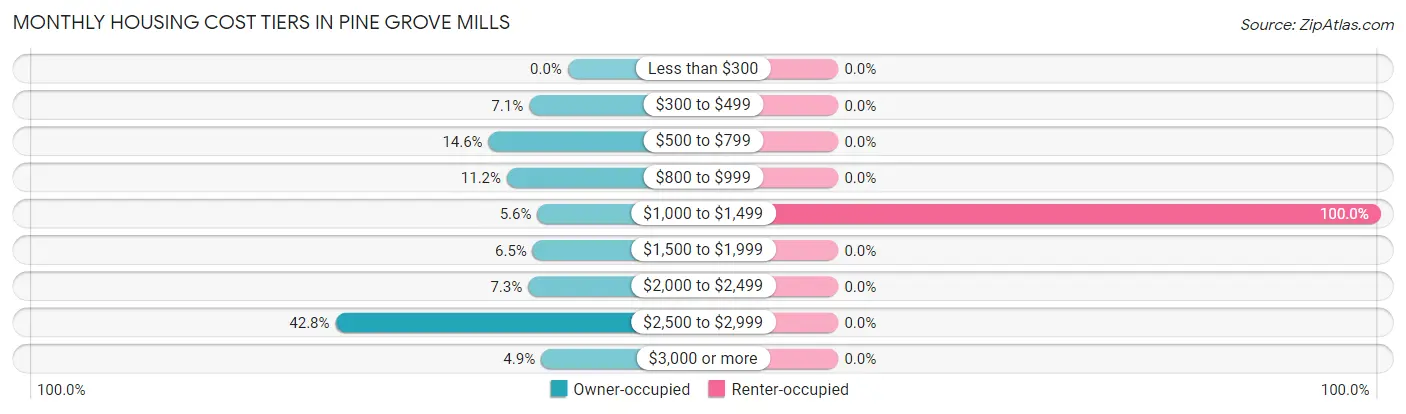
| Monthly Cost | Owner-occupied | Renter-occupied |
| Less than $300 | 0 (0.0%) | 0 (0.0%) |
| $300 to $499 | 42 (7.1%) | 0 (0.0%) |
| $500 to $799 | 86 (14.6%) | 0 (0.0%) |
| $800 to $999 | 66 (11.2%) | 0 (0.0%) |
| $1,000 to $1,499 | 33 (5.6%) | 24 (100.0%) |
| $1,500 to $1,999 | 38 (6.5%) | 0 (0.0%) |
| $2,000 to $2,499 | 43 (7.3%) | 0 (0.0%) |
| $2,500 to $2,999 | 252 (42.8%) | 0 (0.0%) |
| $3,000 or more | 29 (4.9%) | 0 (0.0%) |
| Total | 589 (100.0%) | 24 (100.0%) |
Physical Housing Characteristics in Pine Grove Mills
Housing Structures in Pine Grove Mills
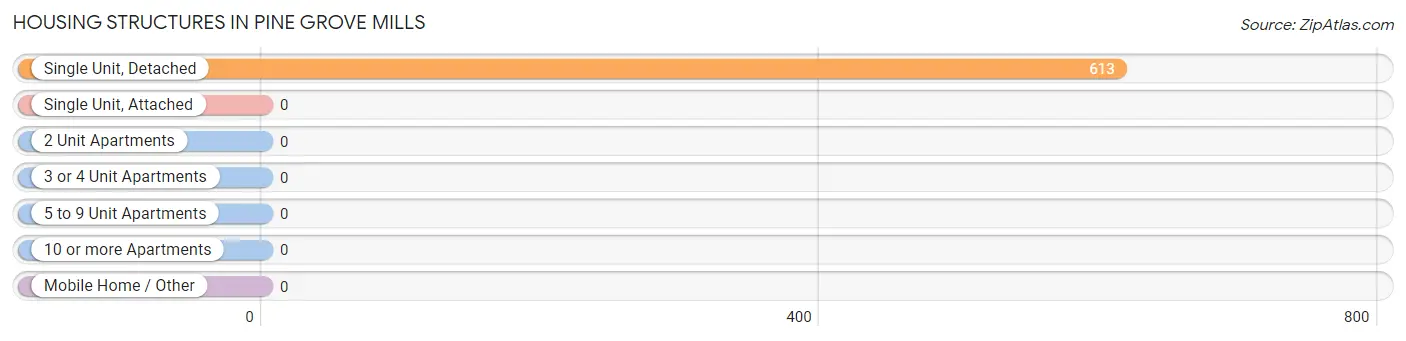
| Structure Type | # Housing Units | % Housing Units |
| Single Unit, Detached | 613 | 100.0% |
| Single Unit, Attached | 0 | 0.0% |
| 2 Unit Apartments | 0 | 0.0% |
| 3 or 4 Unit Apartments | 0 | 0.0% |
| 5 to 9 Unit Apartments | 0 | 0.0% |
| 10 or more Apartments | 0 | 0.0% |
| Mobile Home / Other | 0 | 0.0% |
| Total | 613 | 100.0% |
Housing Structures by Occupancy in Pine Grove Mills
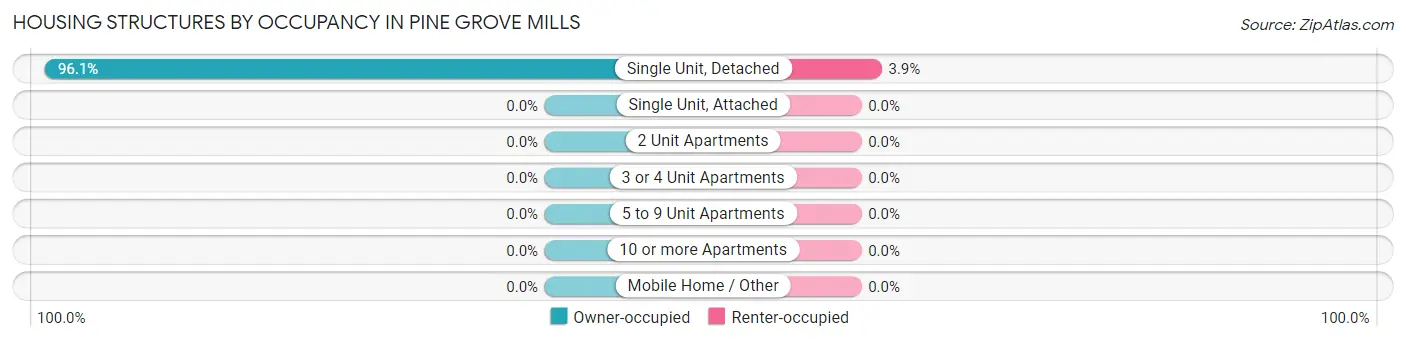
| Structure Type | Owner-occupied | Renter-occupied |
| Single Unit, Detached | 589 (96.1%) | 24 (3.9%) |
| Single Unit, Attached | 0 (0.0%) | 0 (0.0%) |
| 2 Unit Apartments | 0 (0.0%) | 0 (0.0%) |
| 3 or 4 Unit Apartments | 0 (0.0%) | 0 (0.0%) |
| 5 to 9 Unit Apartments | 0 (0.0%) | 0 (0.0%) |
| 10 or more Apartments | 0 (0.0%) | 0 (0.0%) |
| Mobile Home / Other | 0 (0.0%) | 0 (0.0%) |
| Total | 589 (96.1%) | 24 (3.9%) |
Housing Structures by Number of Rooms in Pine Grove Mills
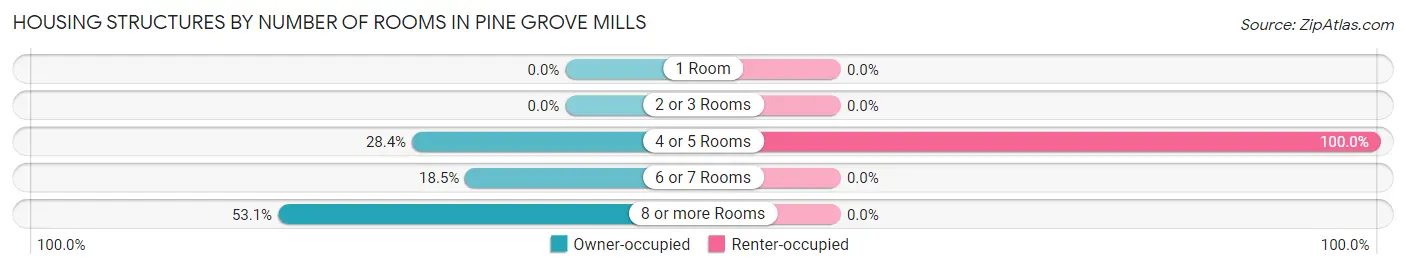
| Number of Rooms | Owner-occupied | Renter-occupied |
| 1 Room | 0 (0.0%) | 0 (0.0%) |
| 2 or 3 Rooms | 0 (0.0%) | 0 (0.0%) |
| 4 or 5 Rooms | 167 (28.3%) | 24 (100.0%) |
| 6 or 7 Rooms | 109 (18.5%) | 0 (0.0%) |
| 8 or more Rooms | 313 (53.1%) | 0 (0.0%) |
| Total | 589 (100.0%) | 24 (100.0%) |
Housing Structure by Heating Type in Pine Grove Mills
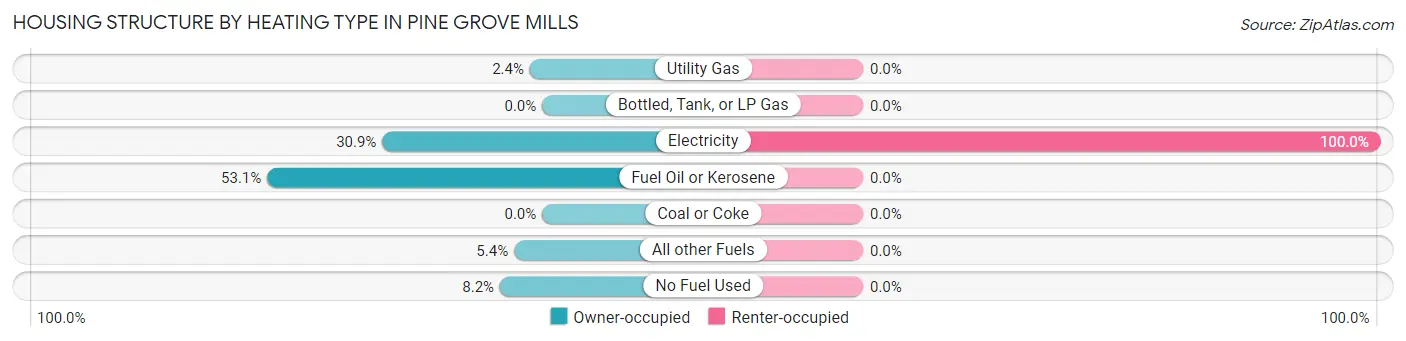
| Heating Type | Owner-occupied | Renter-occupied |
| Utility Gas | 14 (2.4%) | 0 (0.0%) |
| Bottled, Tank, or LP Gas | 0 (0.0%) | 0 (0.0%) |
| Electricity | 182 (30.9%) | 24 (100.0%) |
| Fuel Oil or Kerosene | 313 (53.1%) | 0 (0.0%) |
| Coal or Coke | 0 (0.0%) | 0 (0.0%) |
| All other Fuels | 32 (5.4%) | 0 (0.0%) |
| No Fuel Used | 48 (8.2%) | 0 (0.0%) |
| Total | 589 (100.0%) | 24 (100.0%) |
Household Vehicle Usage in Pine Grove Mills
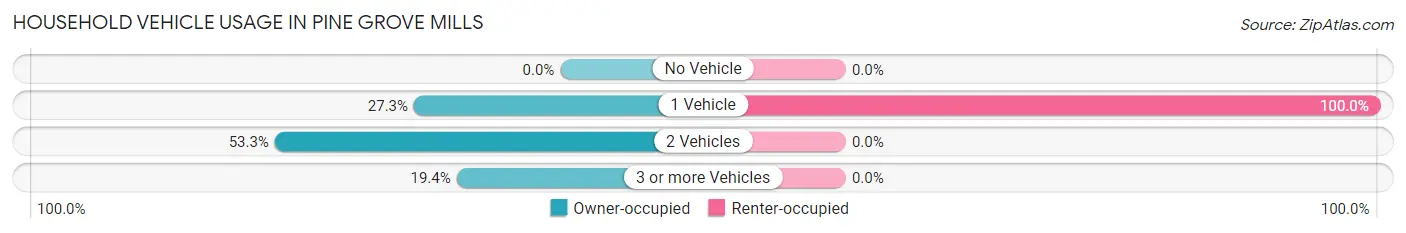
| Vehicles per Household | Owner-occupied | Renter-occupied |
| No Vehicle | 0 (0.0%) | 0 (0.0%) |
| 1 Vehicle | 161 (27.3%) | 24 (100.0%) |
| 2 Vehicles | 314 (53.3%) | 0 (0.0%) |
| 3 or more Vehicles | 114 (19.4%) | 0 (0.0%) |
| Total | 589 (100.0%) | 24 (100.0%) |
Real Estate & Mortgages in Pine Grove Mills
Real Estate and Mortgage Overview in Pine Grove Mills
| Characteristic | Without Mortgage | With Mortgage |
| Housing Units | 194 | 395 |
| Median Property Value | $236,200 | $365,500 |
| Median Household Income | - | - |
| Monthly Housing Costs | $724 | $29 |
| Real Estate Taxes | $3,244 | $0 |
Property Value by Mortgage Status in Pine Grove Mills
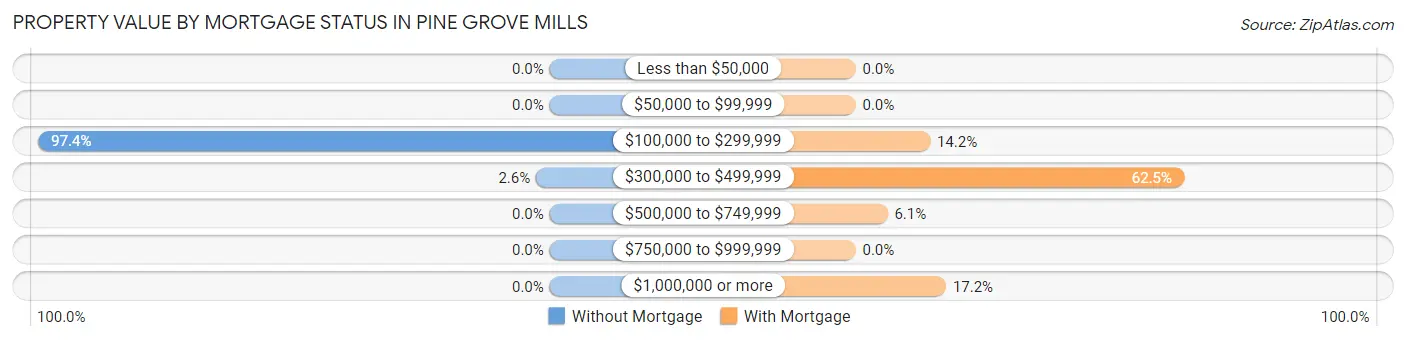
| Property Value | Without Mortgage | With Mortgage |
| Less than $50,000 | 0 (0.0%) | 0 (0.0%) |
| $50,000 to $99,999 | 0 (0.0%) | 0 (0.0%) |
| $100,000 to $299,999 | 189 (97.4%) | 56 (14.2%) |
| $300,000 to $499,999 | 5 (2.6%) | 247 (62.5%) |
| $500,000 to $749,999 | 0 (0.0%) | 24 (6.1%) |
| $750,000 to $999,999 | 0 (0.0%) | 0 (0.0%) |
| $1,000,000 or more | 0 (0.0%) | 68 (17.2%) |
| Total | 194 (100.0%) | 395 (100.0%) |
Household Income by Mortgage Status in Pine Grove Mills
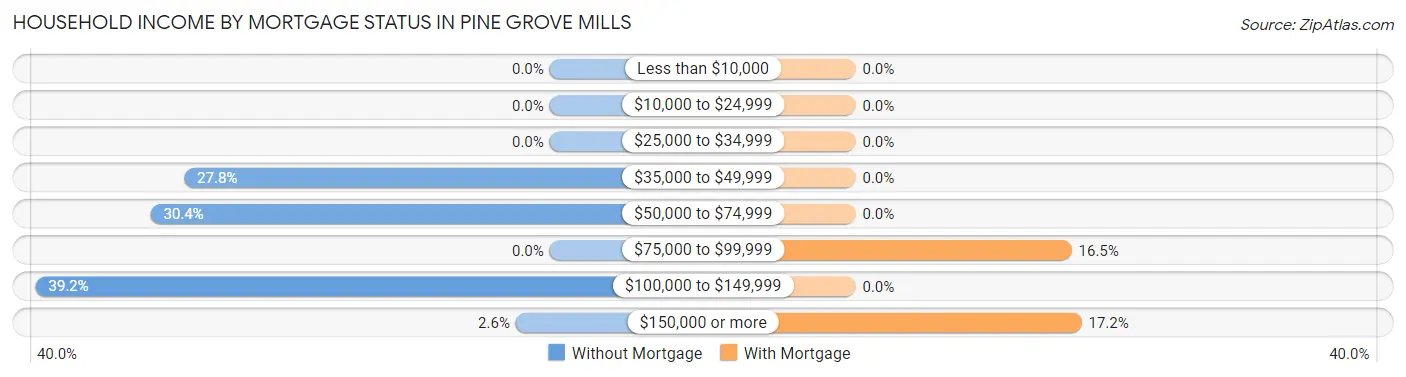
| Household Income | Without Mortgage | With Mortgage |
| Less than $10,000 | 0 (0.0%) | 0 (0.0%) |
| $10,000 to $24,999 | 0 (0.0%) | 0 (0.0%) |
| $25,000 to $34,999 | 0 (0.0%) | 0 (0.0%) |
| $35,000 to $49,999 | 54 (27.8%) | 0 (0.0%) |
| $50,000 to $74,999 | 59 (30.4%) | 0 (0.0%) |
| $75,000 to $99,999 | 0 (0.0%) | 65 (16.5%) |
| $100,000 to $149,999 | 76 (39.2%) | 0 (0.0%) |
| $150,000 or more | 5 (2.6%) | 68 (17.2%) |
| Total | 194 (100.0%) | 395 (100.0%) |
Property Value to Household Income Ratio in Pine Grove Mills
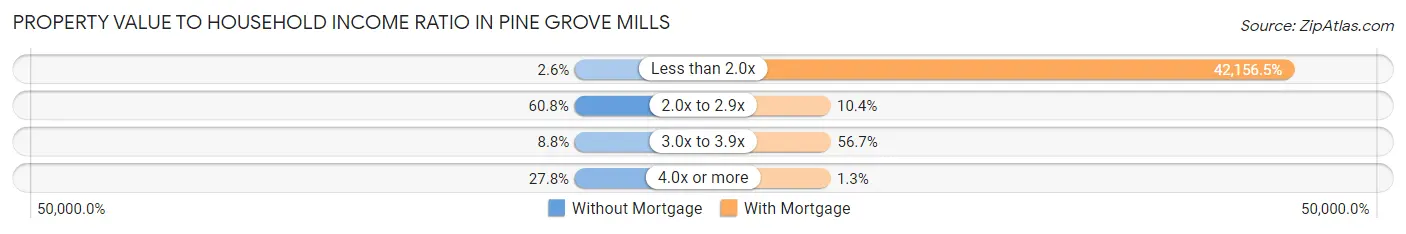
| Value-to-Income Ratio | Without Mortgage | With Mortgage |
| Less than 2.0x | 5 (2.6%) | 166,518 (42,156.5%) |
| 2.0x to 2.9x | 118 (60.8%) | 41 (10.4%) |
| 3.0x to 3.9x | 17 (8.8%) | 224 (56.7%) |
| 4.0x or more | 54 (27.8%) | 5 (1.3%) |
| Total | 194 (100.0%) | 395 (100.0%) |
Real Estate Taxes by Mortgage Status in Pine Grove Mills
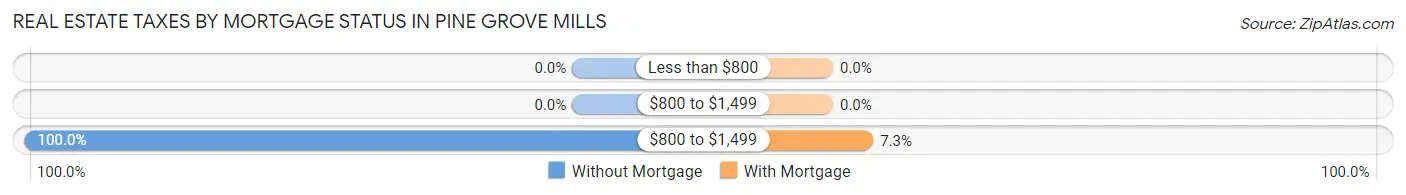
| Property Taxes | Without Mortgage | With Mortgage |
| Less than $800 | 0 (0.0%) | 0 (0.0%) |
| $800 to $1,499 | 0 (0.0%) | 0 (0.0%) |
| $800 to $1,499 | 194 (100.0%) | 29 (7.3%) |
| Total | 194 (100.0%) | 395 (100.0%) |
Health & Disability in Pine Grove Mills
Health Insurance Coverage by Age in Pine Grove Mills
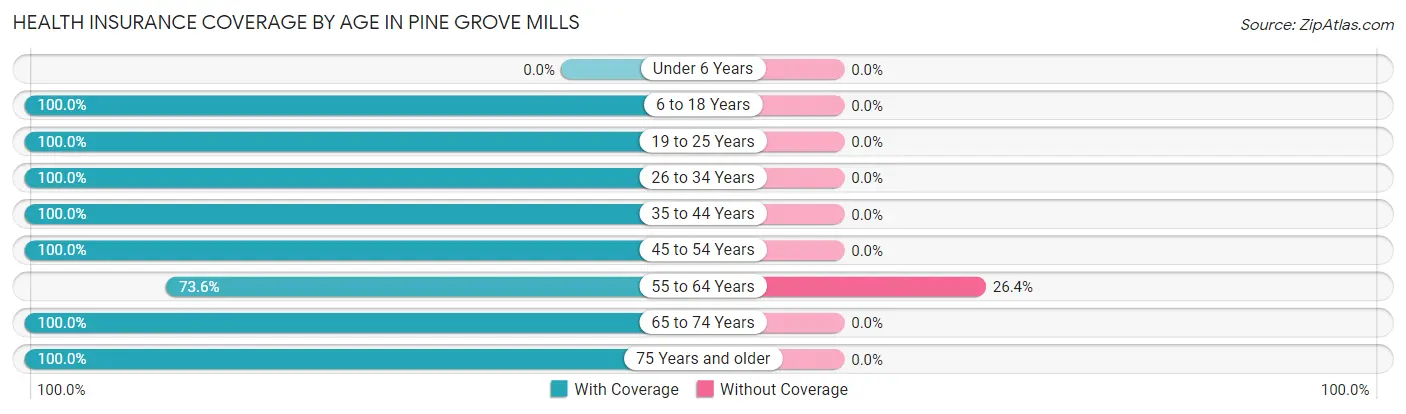
| Age Bracket | With Coverage | Without Coverage |
| Under 6 Years | 0 (0.0%) | 0 (0.0%) |
| 6 to 18 Years | 176 (100.0%) | 0 (0.0%) |
| 19 to 25 Years | 48 (100.0%) | 0 (0.0%) |
| 26 to 34 Years | 70 (100.0%) | 0 (0.0%) |
| 35 to 44 Years | 409 (100.0%) | 0 (0.0%) |
| 45 to 54 Years | 170 (100.0%) | 0 (0.0%) |
| 55 to 64 Years | 276 (73.6%) | 99 (26.4%) |
| 65 to 74 Years | 100 (100.0%) | 0 (0.0%) |
| 75 Years and older | 160 (100.0%) | 0 (0.0%) |
| Total | 1,409 (93.4%) | 99 (6.6%) |
Health Insurance Coverage by Citizenship Status in Pine Grove Mills
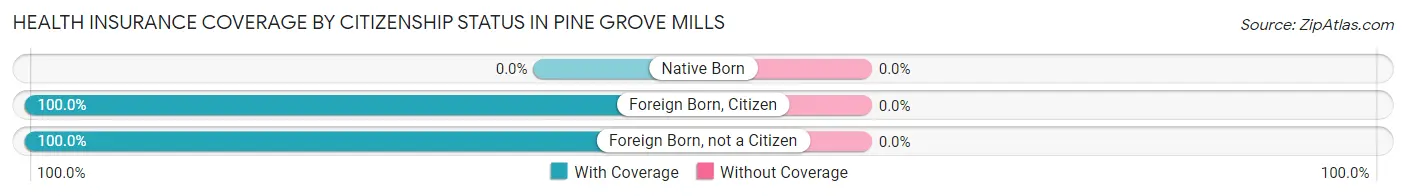
| Citizenship Status | With Coverage | Without Coverage |
| Native Born | 0 (0.0%) | 0 (0.0%) |
| Foreign Born, Citizen | 176 (100.0%) | 0 (0.0%) |
| Foreign Born, not a Citizen | 48 (100.0%) | 0 (0.0%) |
Health Insurance Coverage by Household Income in Pine Grove Mills
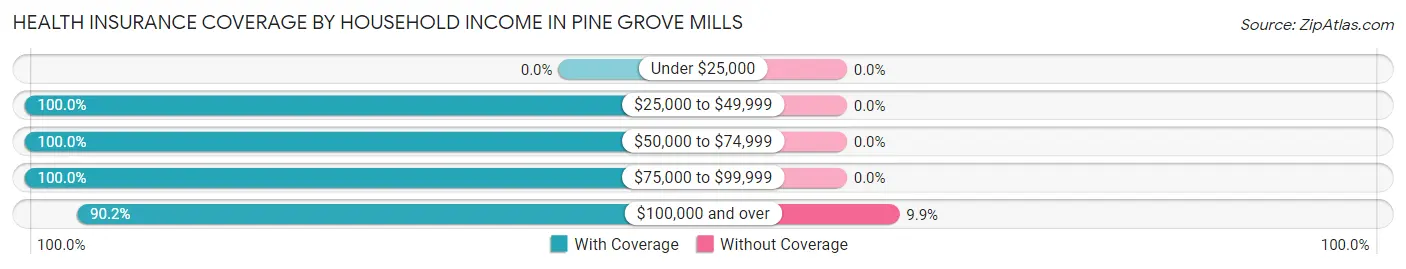
| Household Income | With Coverage | Without Coverage |
| Under $25,000 | 0 (0.0%) | 0 (0.0%) |
| $25,000 to $49,999 | 93 (100.0%) | 0 (0.0%) |
| $50,000 to $74,999 | 386 (100.0%) | 0 (0.0%) |
| $75,000 to $99,999 | 24 (100.0%) | 0 (0.0%) |
| $100,000 and over | 906 (90.1%) | 99 (9.9%) |
Public vs Private Health Insurance Coverage by Age in Pine Grove Mills
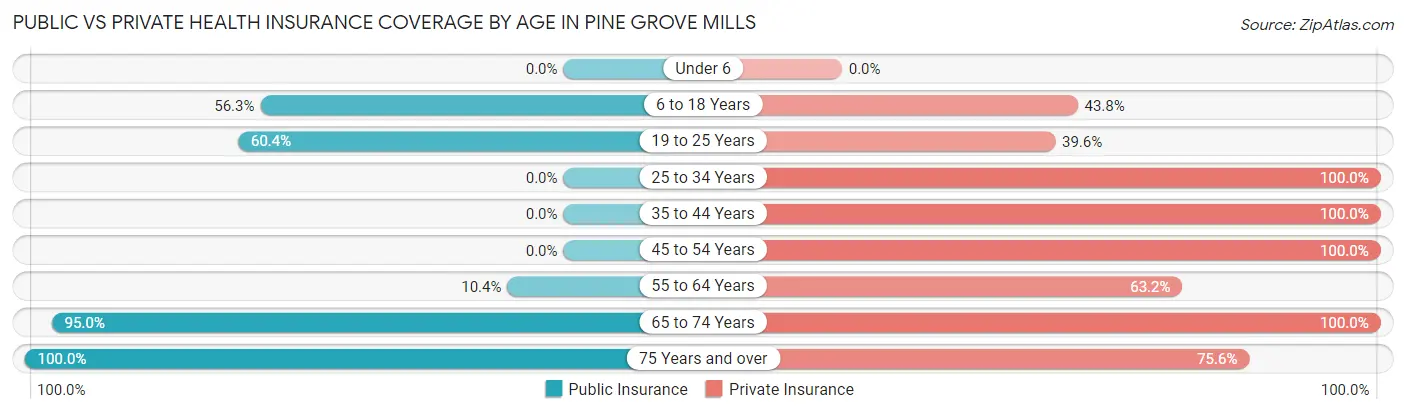
| Age Bracket | Public Insurance | Private Insurance |
| Under 6 | 0 (0.0%) | 0 (0.0%) |
| 6 to 18 Years | 99 (56.2%) | 77 (43.8%) |
| 19 to 25 Years | 29 (60.4%) | 19 (39.6%) |
| 25 to 34 Years | 0 (0.0%) | 70 (100.0%) |
| 35 to 44 Years | 0 (0.0%) | 409 (100.0%) |
| 45 to 54 Years | 0 (0.0%) | 170 (100.0%) |
| 55 to 64 Years | 39 (10.4%) | 237 (63.2%) |
| 65 to 74 Years | 95 (95.0%) | 100 (100.0%) |
| 75 Years and over | 160 (100.0%) | 121 (75.6%) |
| Total | 422 (28.0%) | 1,203 (79.8%) |
Disability Status by Sex by Age in Pine Grove Mills
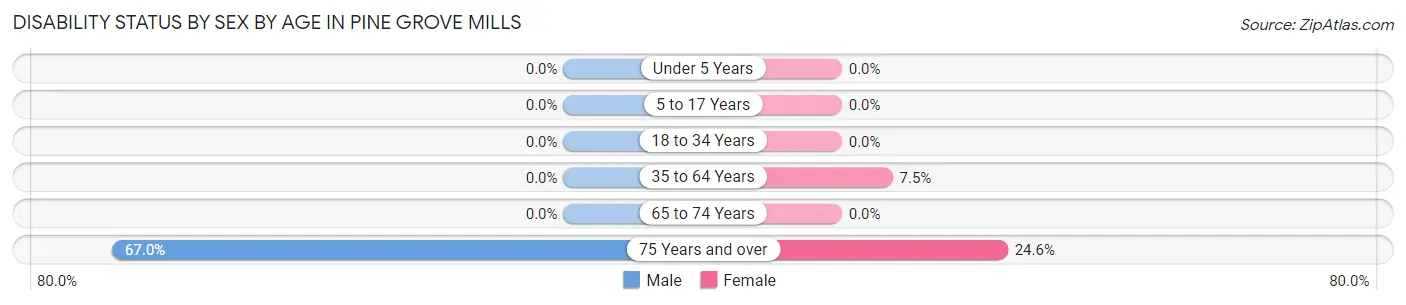
| Age Bracket | Male | Female |
| Under 5 Years | 0 (0.0%) | 0 (0.0%) |
| 5 to 17 Years | 0 (0.0%) | 0 (0.0%) |
| 18 to 34 Years | 0 (0.0%) | 0 (0.0%) |
| 35 to 64 Years | 0 (0.0%) | 39 (7.5%) |
| 65 to 74 Years | 0 (0.0%) | 0 (0.0%) |
| 75 Years and over | 61 (67.0%) | 17 (24.6%) |
Disability Class by Sex by Age in Pine Grove Mills
Disability Class: Hearing Difficulty
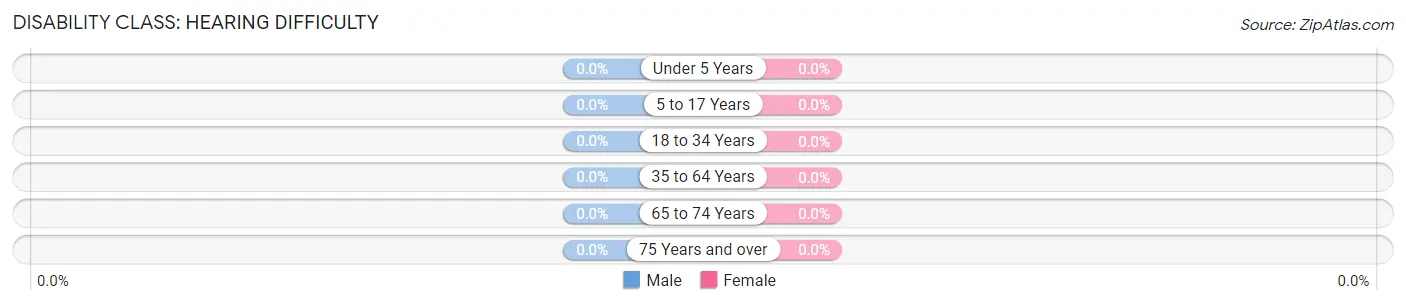
| Age Bracket | Male | Female |
| Under 5 Years | 0 (0.0%) | 0 (0.0%) |
| 5 to 17 Years | 0 (0.0%) | 0 (0.0%) |
| 18 to 34 Years | 0 (0.0%) | 0 (0.0%) |
| 35 to 64 Years | 0 (0.0%) | 0 (0.0%) |
| 65 to 74 Years | 0 (0.0%) | 0 (0.0%) |
| 75 Years and over | 0 (0.0%) | 0 (0.0%) |
Disability Class: Vision Difficulty
| Age Bracket | Male | Female |
| Under 5 Years | 0 (0.0%) | 0 (0.0%) |
| 5 to 17 Years | 0 (0.0%) | 0 (0.0%) |
| 18 to 34 Years | 0 (0.0%) | 0 (0.0%) |
| 35 to 64 Years | 0 (0.0%) | 0 (0.0%) |
| 65 to 74 Years | 0 (0.0%) | 0 (0.0%) |
| 75 Years and over | 0 (0.0%) | 0 (0.0%) |
Disability Class: Cognitive Difficulty
| Age Bracket | Male | Female |
| 5 to 17 Years | 0 (0.0%) | 0 (0.0%) |
| 18 to 34 Years | 0 (0.0%) | 0 (0.0%) |
| 35 to 64 Years | 0 (0.0%) | 0 (0.0%) |
| 65 to 74 Years | 0 (0.0%) | 0 (0.0%) |
| 75 Years and over | 0 (0.0%) | 0 (0.0%) |
Disability Class: Ambulatory Difficulty

| Age Bracket | Male | Female |
| 5 to 17 Years | 0 (0.0%) | 0 (0.0%) |
| 18 to 34 Years | 0 (0.0%) | 0 (0.0%) |
| 35 to 64 Years | 0 (0.0%) | 39 (7.5%) |
| 65 to 74 Years | 0 (0.0%) | 0 (0.0%) |
| 75 Years and over | 61 (67.0%) | 17 (24.6%) |
Disability Class: Self-Care Difficulty
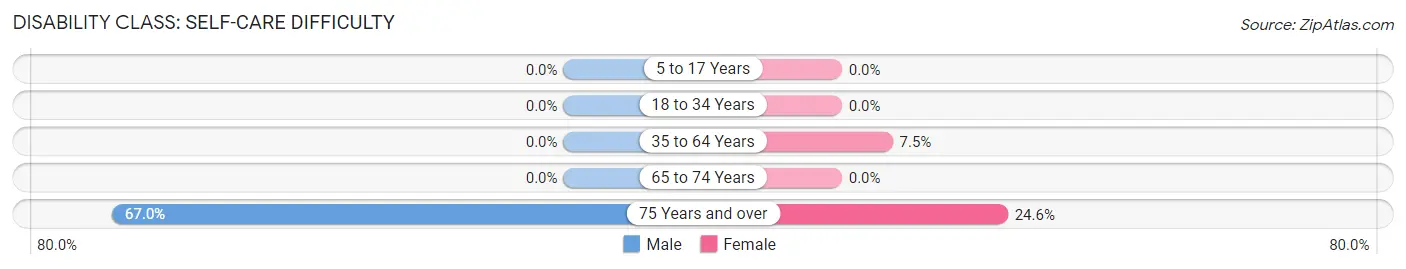
| Age Bracket | Male | Female |
| 5 to 17 Years | 0 (0.0%) | 0 (0.0%) |
| 18 to 34 Years | 0 (0.0%) | 0 (0.0%) |
| 35 to 64 Years | 0 (0.0%) | 39 (7.5%) |
| 65 to 74 Years | 0 (0.0%) | 0 (0.0%) |
| 75 Years and over | 61 (67.0%) | 17 (24.6%) |
Technology Access in Pine Grove Mills
Computing Device Access in Pine Grove Mills
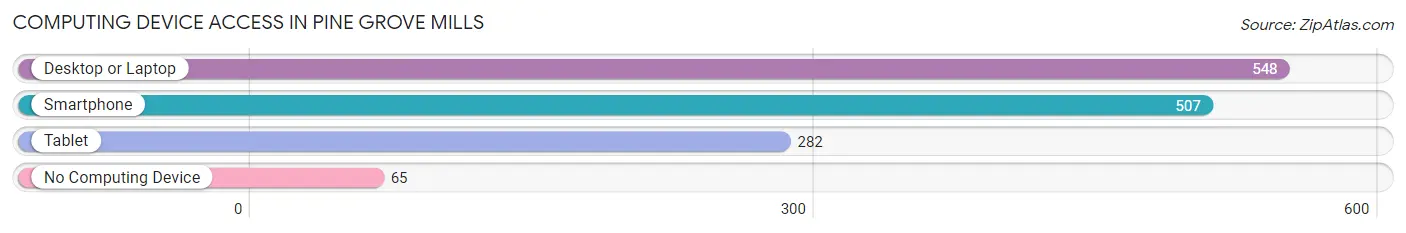
| Device Type | # Households | % Households |
| Desktop or Laptop | 548 | 89.4% |
| Smartphone | 507 | 82.7% |
| Tablet | 282 | 46.0% |
| No Computing Device | 65 | 10.6% |
| Total | 613 | 100.0% |
Internet Access in Pine Grove Mills
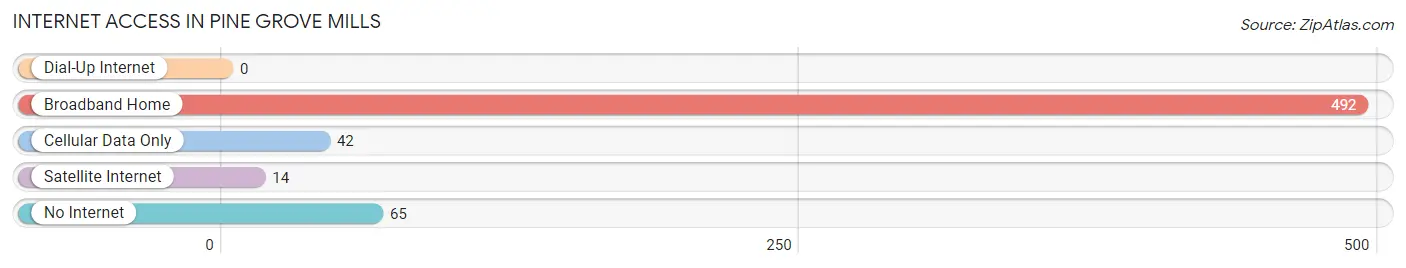
| Internet Type | # Households | % Households |
| Dial-Up Internet | 0 | 0.0% |
| Broadband Home | 492 | 80.3% |
| Cellular Data Only | 42 | 6.9% |
| Satellite Internet | 14 | 2.3% |
| No Internet | 65 | 10.6% |
| Total | 613 | 100.0% |
Pine Grove Mills Summary
Pine Grove Mills is a small unincorporated community located in Centre County, Pennsylvania. It is situated in the Nittany Valley, approximately 8 miles south of State College and 8 miles north of Bellefonte. The population of Pine Grove Mills was 1,093 as of the 2010 census.
History
Pine Grove Mills was founded in 1817 by John and Mary Pine, who purchased the land from the state of Pennsylvania. The Pines built a grist mill and saw mill on the property, which became the center of the community. The village was originally known as Pine’s Mills, but the name was changed to Pine Grove Mills in 1845.
The village grew slowly over the years, and by the late 19th century it had become a thriving community. The village was home to several businesses, including a general store, a blacksmith shop, a post office, a hotel, and a school. The village also had a railroad station, which was built in 1887.
Geography
Pine Grove Mills is located in the Nittany Valley, which is part of the Ridge and Valley physiographic province. The village is situated on the western side of the valley, at an elevation of 1,068 feet. The village is surrounded by rolling hills and forests, and is located near several small streams.
The village is located in the Bald Eagle State Forest, which is a popular destination for outdoor recreation. The forest is home to a variety of wildlife, including deer, bear, and wild turkey.
Economy
Pine Grove Mills is a small, rural community with a limited economy. The village is home to several small businesses, including a general store, a post office, and a few restaurants. The village also has a few small manufacturing businesses, including a furniture maker and a woodworking shop.
The village is also home to several farms, which produce a variety of crops, including corn, soybeans, and hay. The village is also home to several wineries, which produce a variety of wines.
Demographics
As of the 2010 census, the population of Pine Grove Mills was 1,093. The population is predominantly white (97.2%), with a small percentage of African Americans (1.2%) and Hispanics (1.6%). The median household income is $45,000, and the median age is 43.
Conclusion
Pine Grove Mills is a small, rural community located in Centre County, Pennsylvania. The village was founded in 1817 and has grown slowly over the years. The village is home to several small businesses, farms, and wineries, and is a popular destination for outdoor recreation. The population of Pine Grove Mills is predominantly white, with a median household income of $45,000 and a median age of 43.
Common Questions
What is Per Capita Income in Pine Grove Mills?
Per Capita income in Pine Grove Mills is $55,534.
What is the Median Family Income in Pine Grove Mills?
Median Family Income in Pine Grove Mills is $119,349.
What is the Median Household income in Pine Grove Mills?
Median Household Income in Pine Grove Mills is $145,881.
What is Income or Wage Gap in Pine Grove Mills?
Income or Wage Gap in Pine Grove Mills is 1.2%.
Women in Pine Grove Mills earn 98.8 cents for every dollar earned by a man.
What is Inequality or Gini Index in Pine Grove Mills?
Inequality or Gini Index in Pine Grove Mills is 0.23.
What is the Total Population of Pine Grove Mills?
Total Population of Pine Grove Mills is 1,508.
What is the Total Male Population of Pine Grove Mills?
Total Male Population of Pine Grove Mills is 747.
What is the Total Female Population of Pine Grove Mills?
Total Female Population of Pine Grove Mills is 761.
What is the Ratio of Males per 100 Females in Pine Grove Mills?
There are 98.16 Males per 100 Females in Pine Grove Mills.
What is the Ratio of Females per 100 Males in Pine Grove Mills?
There are 101.87 Females per 100 Males in Pine Grove Mills.
What is the Median Population Age in Pine Grove Mills?
Median Population Age in Pine Grove Mills is 48.6 Years.
What is the Average Family Size in Pine Grove Mills
Average Family Size in Pine Grove Mills is 2.8 People.
What is the Average Household Size in Pine Grove Mills
Average Household Size in Pine Grove Mills is 2.5 People.
How Large is the Labor Force in Pine Grove Mills?
There are 957 People in the Labor Forcein in Pine Grove Mills.
What is the Percentage of People in the Labor Force in Pine Grove Mills?
71.5% of People are in the Labor Force in Pine Grove Mills.