Newtown borough, PA Map & Demographics
Newtown borough Overview
$89,189
PER CAPITA INCOME
$187,278
AVG FAMILY INCOME
$145,893
AVG HOUSEHOLD INCOME
35.7%
WAGE / INCOME GAP [ % ]
64.3¢/ $1
WAGE / INCOME GAP [ $ ]
0.47
INEQUALITY / GINI INDEX
2,169
TOTAL POPULATION
941
MALE POPULATION
1,228
FEMALE POPULATION
76.63
MALES / 100 FEMALES
130.50
FEMALES / 100 MALES
48.1
MEDIAN AGE
3.0
AVG FAMILY SIZE
2.3
AVG HOUSEHOLD SIZE
1,216
LABOR FORCE [ PEOPLE ]
65.8%
PERCENT IN LABOR FORCE
3.1%
UNEMPLOYMENT RATE
Income in Newtown borough
Income Overview in Newtown borough
Per Capita Income in Newtown borough is $89,189, while median incomes of families and households are $187,278 and $145,893 respectively.
| Characteristic | Number | Measure |
| Per Capita Income | 2,169 | $89,189 |
| Median Family Income | 594 | $187,278 |
| Mean Family Income | 594 | $266,549 |
| Median Household Income | 936 | $145,893 |
| Mean Household Income | 936 | $204,112 |
| Income Deficit | 594 | $0 |
| Wage / Income Gap (%) | 2,169 | 35.68% |
| Wage / Income Gap ($) | 2,169 | 64.32¢ per $1 |
| Gini / Inequality Index | 2,169 | 0.47 |
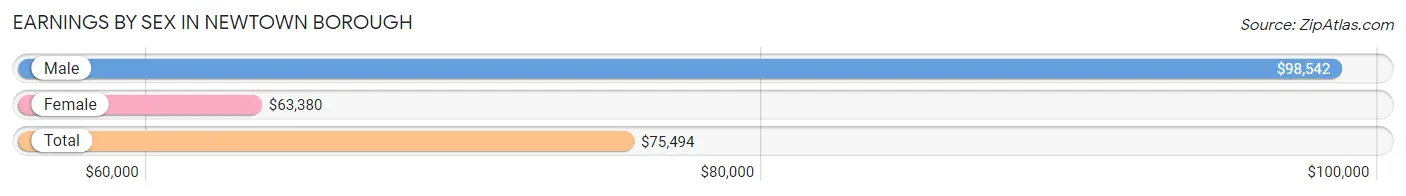
Earnings by Sex in Newtown borough
Average Earnings in Newtown borough are $75,494, $98,542 for men and $63,380 for women, a difference of 35.7%.
| Sex | Number | Average Earnings |
| Male | 597 (46.4%) | $98,542 |
| Female | 690 (53.6%) | $63,380 |
| Total | 1,287 (100.0%) | $75,494 |
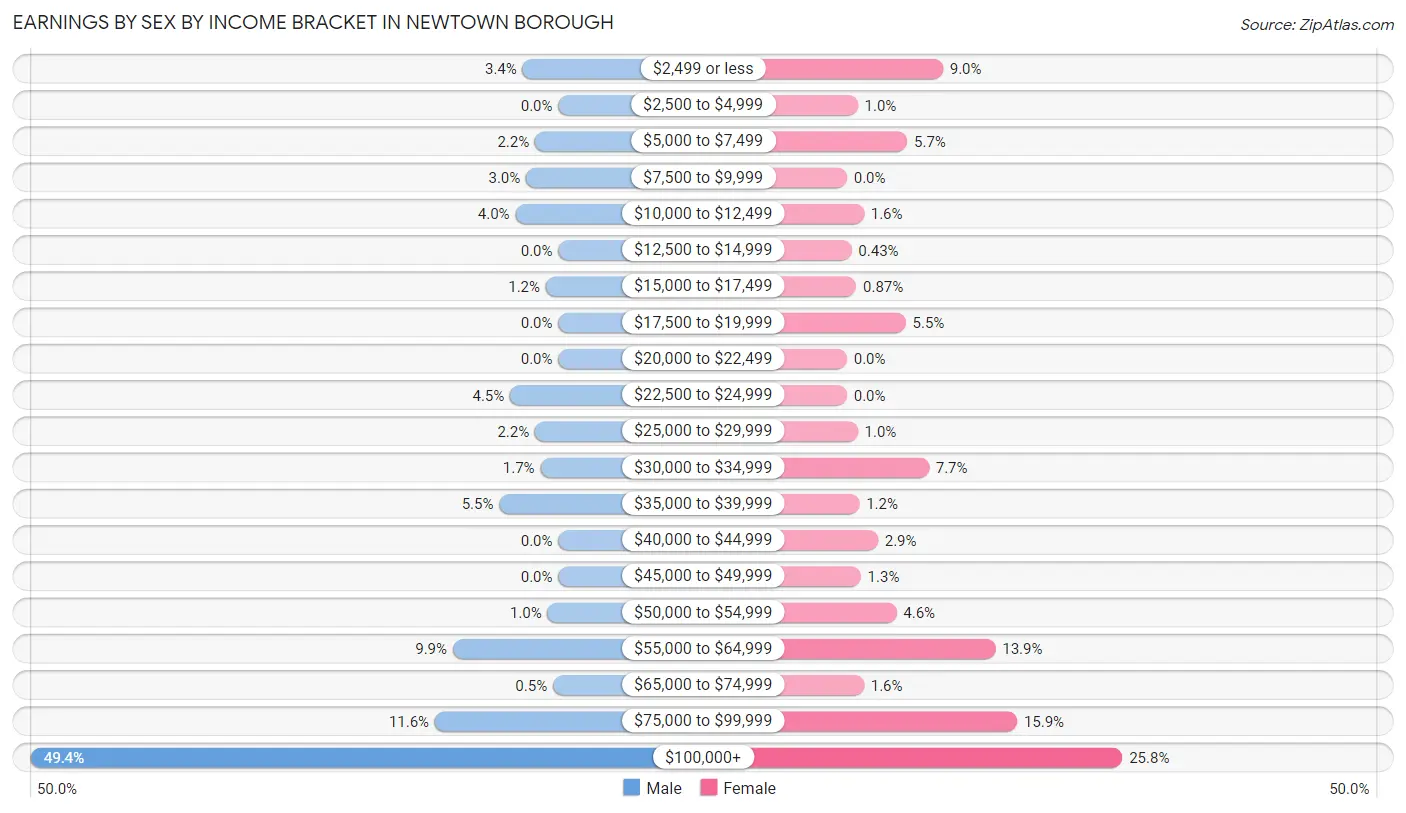
Earnings by Sex by Income Bracket in Newtown borough
The most common earnings brackets in Newtown borough are $100,000+ for men (295 | 49.4%) and $100,000+ for women (178 | 25.8%).
| Income | Male | Female |
| $2,499 or less | 20 (3.4%) | 62 (9.0%) |
| $2,500 to $4,999 | 0 (0.0%) | 7 (1.0%) |
| $5,000 to $7,499 | 13 (2.2%) | 39 (5.7%) |
| $7,500 to $9,999 | 18 (3.0%) | 0 (0.0%) |
| $10,000 to $12,499 | 24 (4.0%) | 11 (1.6%) |
| $12,500 to $14,999 | 0 (0.0%) | 3 (0.4%) |
| $15,000 to $17,499 | 7 (1.2%) | 6 (0.9%) |
| $17,500 to $19,999 | 0 (0.0%) | 38 (5.5%) |
| $20,000 to $22,499 | 0 (0.0%) | 0 (0.0%) |
| $22,500 to $24,999 | 27 (4.5%) | 0 (0.0%) |
| $25,000 to $29,999 | 13 (2.2%) | 7 (1.0%) |
| $30,000 to $34,999 | 10 (1.7%) | 53 (7.7%) |
| $35,000 to $39,999 | 33 (5.5%) | 8 (1.2%) |
| $40,000 to $44,999 | 0 (0.0%) | 20 (2.9%) |
| $45,000 to $49,999 | 0 (0.0%) | 9 (1.3%) |
| $50,000 to $54,999 | 6 (1.0%) | 32 (4.6%) |
| $55,000 to $64,999 | 59 (9.9%) | 96 (13.9%) |
| $65,000 to $74,999 | 3 (0.5%) | 11 (1.6%) |
| $75,000 to $99,999 | 69 (11.6%) | 110 (15.9%) |
| $100,000+ | 295 (49.4%) | 178 (25.8%) |
| Total | 597 (100.0%) | 690 (100.0%) |
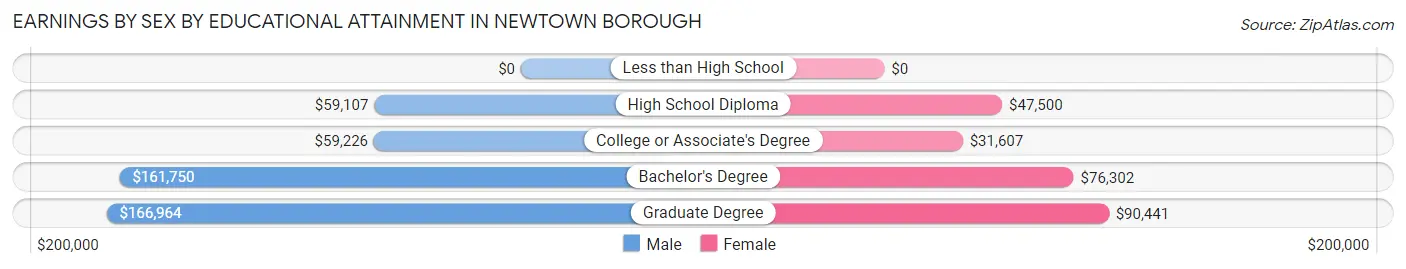
Earnings by Sex by Educational Attainment in Newtown borough
Average earnings in Newtown borough are $116,979 for men and $68,542 for women, a difference of 41.4%. Men with an educational attainment of graduate degree enjoy the highest average annual earnings of $166,964, while those with high school diploma education earn the least with $59,107. Women with an educational attainment of graduate degree earn the most with the average annual earnings of $90,441, while those with college or associate's degree education have the smallest earnings of $31,607.
| Educational Attainment | Male Income | Female Income |
| Less than High School | - | - |
| High School Diploma | $59,107 | $47,500 |
| College or Associate's Degree | $59,226 | $31,607 |
| Bachelor's Degree | $161,750 | $76,302 |
| Graduate Degree | $166,964 | $90,441 |
| Total | $116,979 | $68,542 |
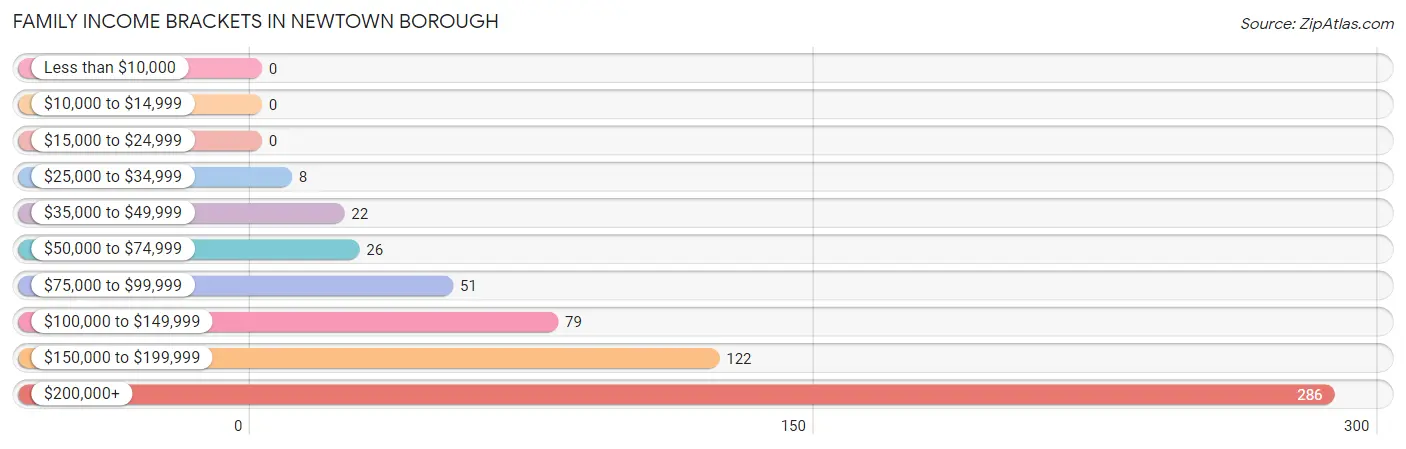
Family Income in Newtown borough
Family Income Brackets in Newtown borough
According to the Newtown borough family income data, there are 286 families falling into the $200,000+ income range, which is the most common income bracket and makes up 48.1% of all families.
| Income Bracket | # Families | % Families |
| Less than $10,000 | 0 | 0.0% |
| $10,000 to $14,999 | 0 | 0.0% |
| $15,000 to $24,999 | 0 | 0.0% |
| $25,000 to $34,999 | 8 | 1.3% |
| $35,000 to $49,999 | 22 | 3.7% |
| $50,000 to $74,999 | 26 | 4.4% |
| $75,000 to $99,999 | 51 | 8.6% |
| $100,000 to $149,999 | 79 | 13.3% |
| $150,000 to $199,999 | 122 | 20.5% |
| $200,000+ | 286 | 48.1% |
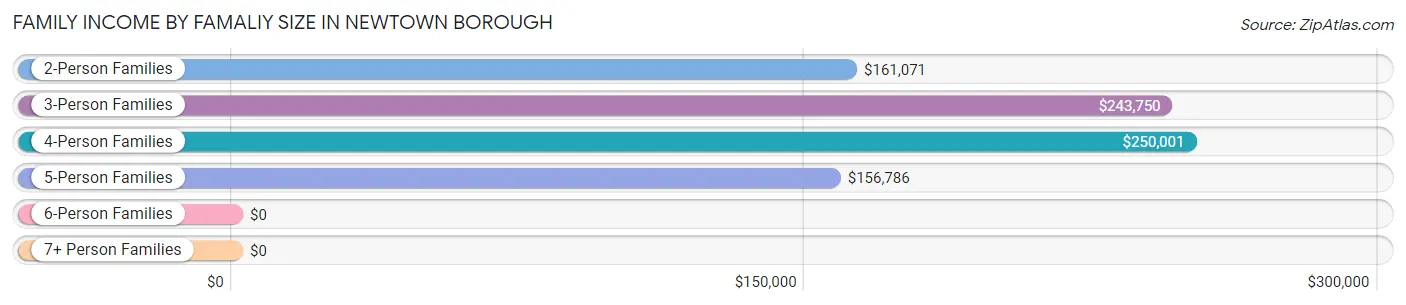
Family Income by Famaliy Size in Newtown borough
4-person families (107 | 18.0%) account for the highest median family income in Newtown borough with $250,001 per family, while 3-person families (110 | 18.5%) have the highest median income of $81,250 per family member.
| Income Bracket | # Families | Median Income |
| 2-Person Families | 314 (52.9%) | $161,071 |
| 3-Person Families | 110 (18.5%) | $243,750 |
| 4-Person Families | 107 (18.0%) | $250,001 |
| 5-Person Families | 54 (9.1%) | $156,786 |
| 6-Person Families | 7 (1.2%) | $0 |
| 7+ Person Families | 2 (0.3%) | $0 |
| Total | 594 (100.0%) | $187,278 |
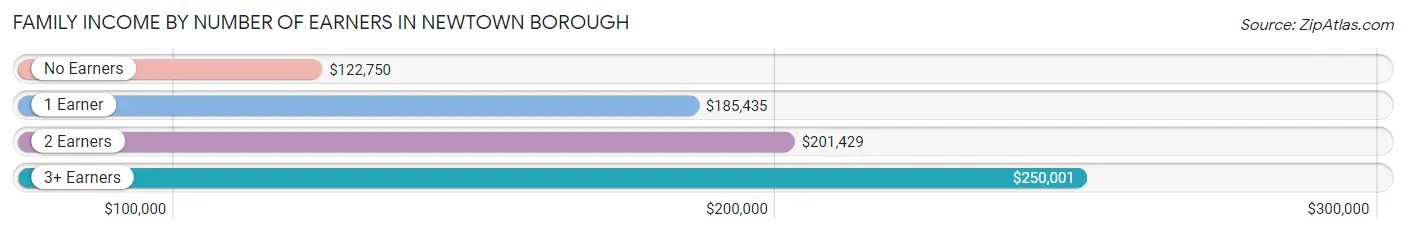
Family Income by Number of Earners in Newtown borough
The median family income in Newtown borough is $187,278, with families comprising 3+ earners (87) having the highest median family income of $250,001, while families with no earners (77) have the lowest median family income of $122,750, accounting for 14.6% and 13.0% of families, respectively.
| Number of Earners | # Families | Median Income |
| No Earners | 77 (13.0%) | $122,750 |
| 1 Earner | 206 (34.7%) | $185,435 |
| 2 Earners | 224 (37.7%) | $201,429 |
| 3+ Earners | 87 (14.6%) | $250,001 |
| Total | 594 (100.0%) | $187,278 |
Household Income in Newtown borough
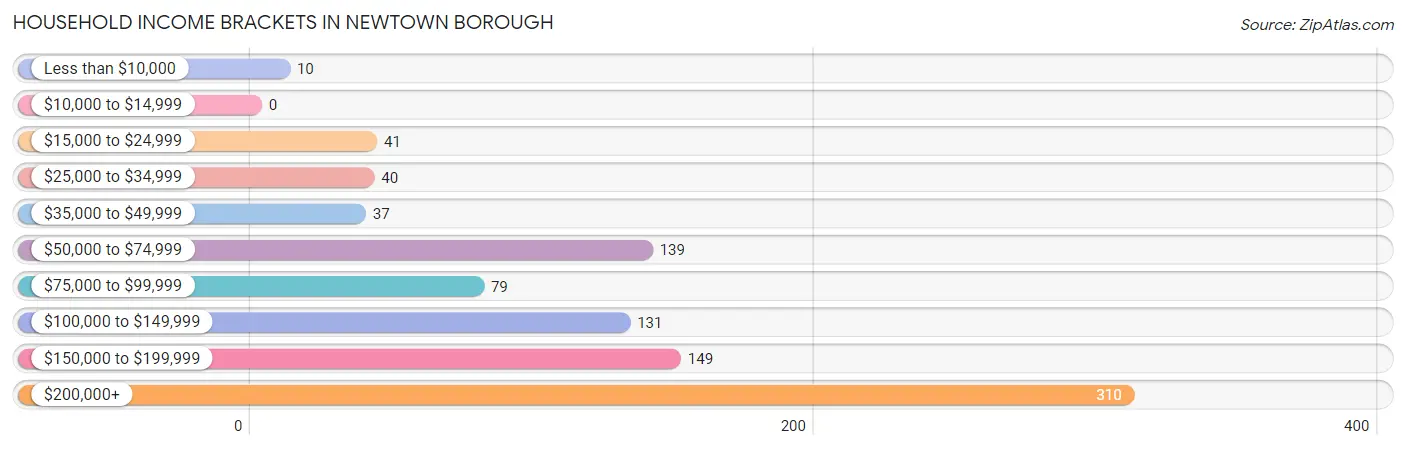
Household Income Brackets in Newtown borough
With 310 households falling in the category, the $200,000+ income range is the most frequent in Newtown borough, accounting for 33.1% of all households.
| Income Bracket | # Households | % Households |
| Less than $10,000 | 10 | 1.1% |
| $10,000 to $14,999 | 0 | 0.0% |
| $15,000 to $24,999 | 41 | 4.4% |
| $25,000 to $34,999 | 40 | 4.3% |
| $35,000 to $49,999 | 37 | 4.0% |
| $50,000 to $74,999 | 139 | 14.9% |
| $75,000 to $99,999 | 79 | 8.4% |
| $100,000 to $149,999 | 131 | 14.0% |
| $150,000 to $199,999 | 149 | 15.9% |
| $200,000+ | 310 | 33.1% |
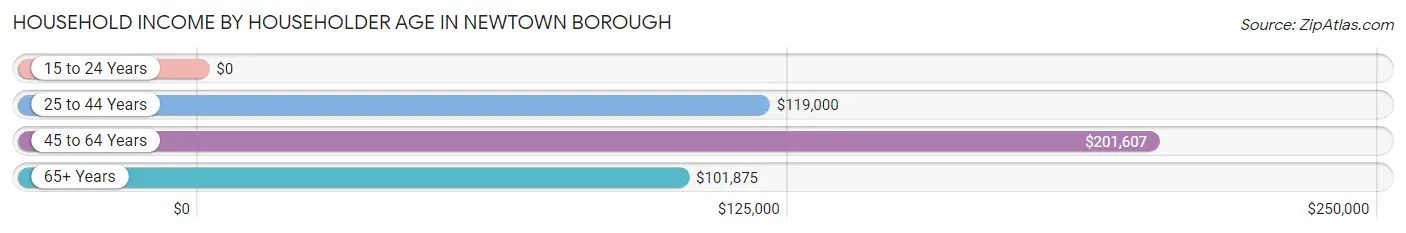
Household Income by Householder Age in Newtown borough
The median household income in Newtown borough is $145,893, with the highest median household income of $201,607 found in the 45 to 64 years age bracket for the primary householder. A total of 379 households (40.5%) fall into this category. Meanwhile, the 15 to 24 years age bracket for the primary householder has the lowest median household income of $0, with 5 households (0.5%) in this group.
| Income Bracket | # Households | Median Income |
| 15 to 24 Years | 5 (0.5%) | $0 |
| 25 to 44 Years | 252 (26.9%) | $119,000 |
| 45 to 64 Years | 379 (40.5%) | $201,607 |
| 65+ Years | 300 (32.1%) | $101,875 |
| Total | 936 (100.0%) | $145,893 |
Poverty in Newtown borough
Income Below Poverty by Sex and Age in Newtown borough
With 0.3% poverty level for males and 0.6% for females among the residents of Newtown borough, 55 to 64 year old males and 45 to 54 year old females are the most vulnerable to poverty, with 3 males (1.5%) and 7 females (5.1%) in their respective age groups living below the poverty level.
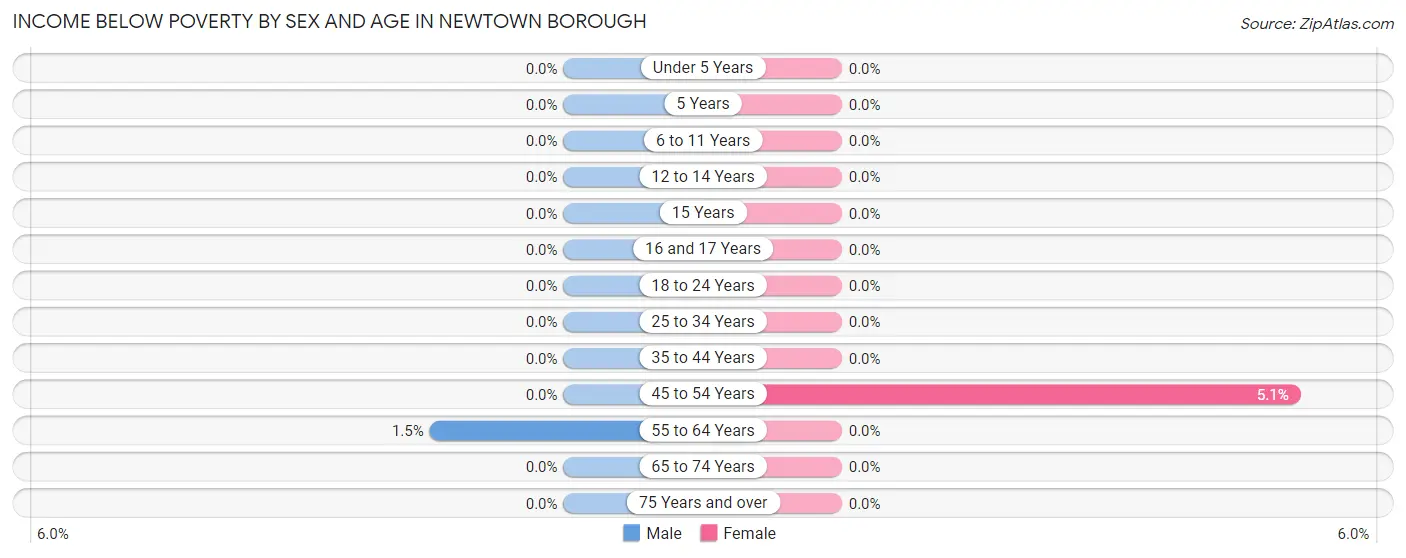
| Age Bracket | Male | Female |
| Under 5 Years | 0 (0.0%) | 0 (0.0%) |
| 5 Years | 0 (0.0%) | 0 (0.0%) |
| 6 to 11 Years | 0 (0.0%) | 0 (0.0%) |
| 12 to 14 Years | 0 (0.0%) | 0 (0.0%) |
| 15 Years | 0 (0.0%) | 0 (0.0%) |
| 16 and 17 Years | 0 (0.0%) | 0 (0.0%) |
| 18 to 24 Years | 0 (0.0%) | 0 (0.0%) |
| 25 to 34 Years | 0 (0.0%) | 0 (0.0%) |
| 35 to 44 Years | 0 (0.0%) | 0 (0.0%) |
| 45 to 54 Years | 0 (0.0%) | 7 (5.1%) |
| 55 to 64 Years | 3 (1.5%) | 0 (0.0%) |
| 65 to 74 Years | 0 (0.0%) | 0 (0.0%) |
| 75 Years and over | 0 (0.0%) | 0 (0.0%) |
| Total | 3 (0.3%) | 7 (0.6%) |
Income Above Poverty by Sex and Age in Newtown borough
According to the poverty statistics in Newtown borough, males aged under 5 years and females aged under 5 years are the age groups that are most secure financially, with 100.0% of males and 100.0% of females in these age groups living above the poverty line.
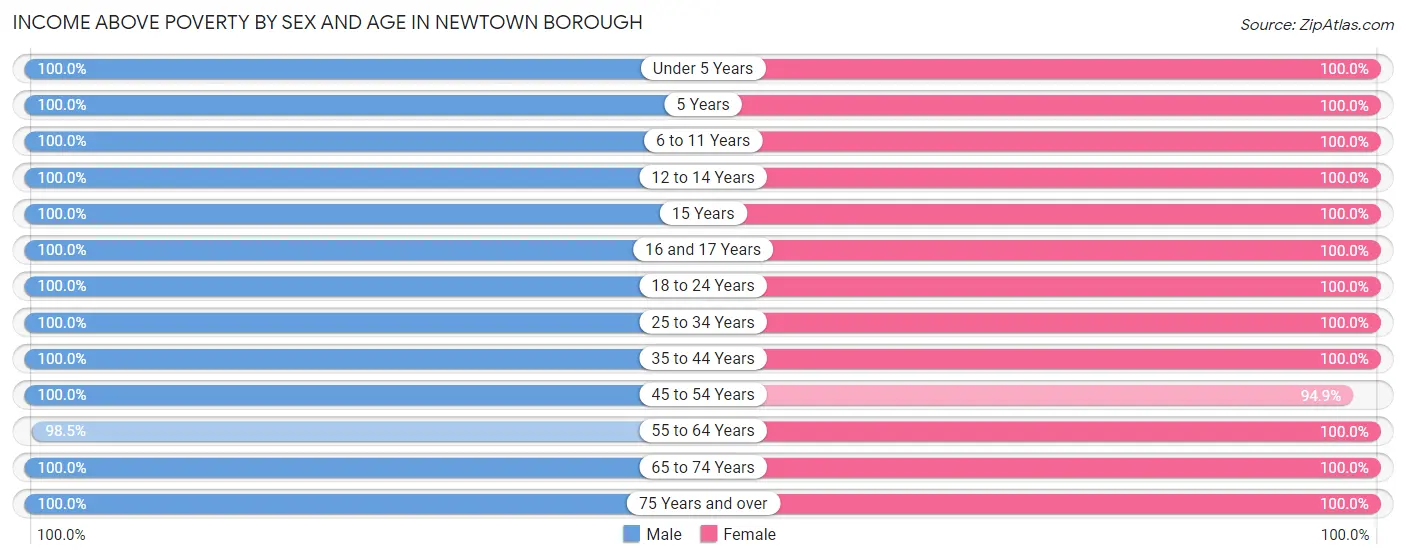
| Age Bracket | Male | Female |
| Under 5 Years | 87 (100.0%) | 108 (100.0%) |
| 5 Years | 4 (100.0%) | 7 (100.0%) |
| 6 to 11 Years | 23 (100.0%) | 45 (100.0%) |
| 12 to 14 Years | 19 (100.0%) | 16 (100.0%) |
| 15 Years | 3 (100.0%) | 9 (100.0%) |
| 16 and 17 Years | 17 (100.0%) | 27 (100.0%) |
| 18 to 24 Years | 74 (100.0%) | 101 (100.0%) |
| 25 to 34 Years | 132 (100.0%) | 153 (100.0%) |
| 35 to 44 Years | 109 (100.0%) | 112 (100.0%) |
| 45 to 54 Years | 92 (100.0%) | 130 (94.9%) |
| 55 to 64 Years | 198 (98.5%) | 236 (100.0%) |
| 65 to 74 Years | 111 (100.0%) | 190 (100.0%) |
| 75 Years and over | 69 (100.0%) | 87 (100.0%) |
| Total | 938 (99.7%) | 1,221 (99.4%) |
Income Below Poverty Among Married-Couple Families in Newtown borough
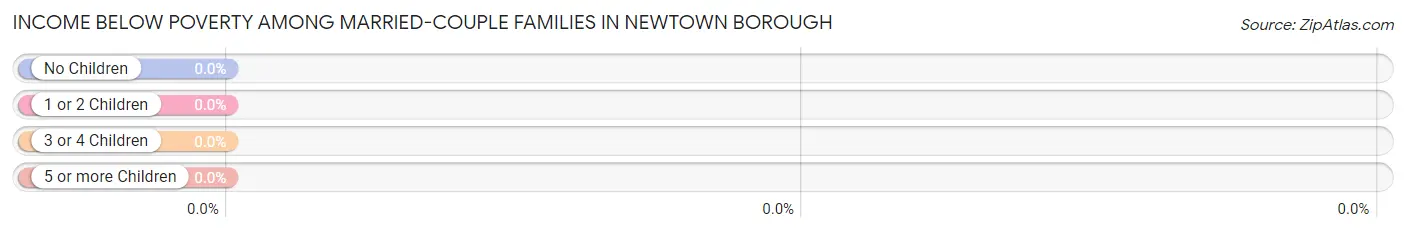
| Children | Above Poverty | Below Poverty |
| No Children | 355 (100.0%) | 0 (0.0%) |
| 1 or 2 Children | 132 (100.0%) | 0 (0.0%) |
| 3 or 4 Children | 17 (100.0%) | 0 (0.0%) |
| 5 or more Children | 0 (0.0%) | 0 (0.0%) |
| Total | 504 (100.0%) | 0 (0.0%) |
Income Below Poverty Among Single-Parent Households in Newtown borough
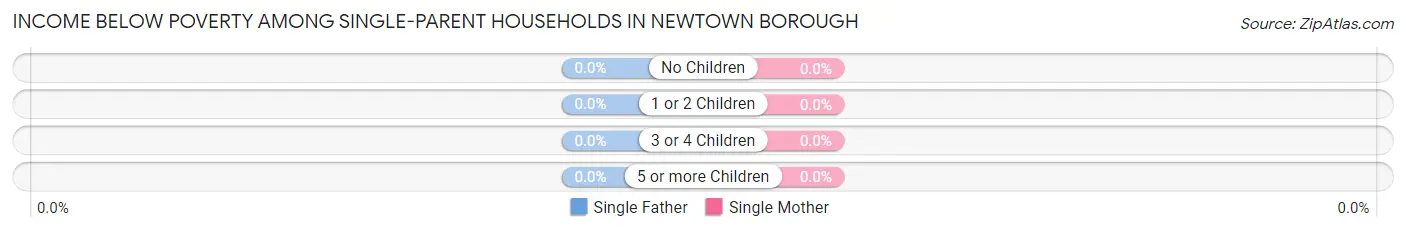
| Children | Single Father | Single Mother |
| No Children | 0 (0.0%) | 0 (0.0%) |
| 1 or 2 Children | 0 (0.0%) | 0 (0.0%) |
| 3 or 4 Children | 0 (0.0%) | 0 (0.0%) |
| 5 or more Children | 0 (0.0%) | 0 (0.0%) |
| Total | 0 (0.0%) | 0 (0.0%) |
Income Below Poverty Among Married-Couple vs Single-Parent Households in Newtown borough
| Children | Married-Couple Families | Single-Parent Households |
| No Children | 0 (0.0%) | 0 (0.0%) |
| 1 or 2 Children | 0 (0.0%) | 0 (0.0%) |
| 3 or 4 Children | 0 (0.0%) | 0 (0.0%) |
| 5 or more Children | 0 (0.0%) | 0 (0.0%) |
| Total | 0 (0.0%) | 0 (0.0%) |
Race in Newtown borough
The most populous races in Newtown borough are White / Caucasian (2,079 | 95.9%), Two or more Races (71 | 3.3%), and Hispanic or Latino (26 | 1.2%).
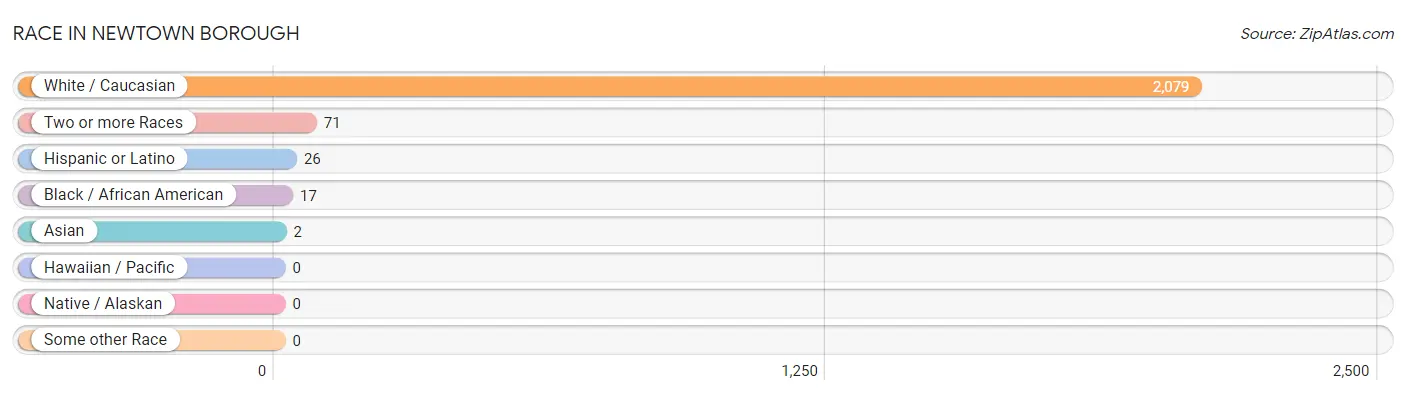
| Race | # Population | % Population |
| Asian | 2 | 0.1% |
| Black / African American | 17 | 0.8% |
| Hawaiian / Pacific | 0 | 0.0% |
| Hispanic or Latino | 26 | 1.2% |
| Native / Alaskan | 0 | 0.0% |
| White / Caucasian | 2,079 | 95.9% |
| Two or more Races | 71 | 3.3% |
| Some other Race | 0 | 0.0% |
| Total | 2,169 | 100.0% |
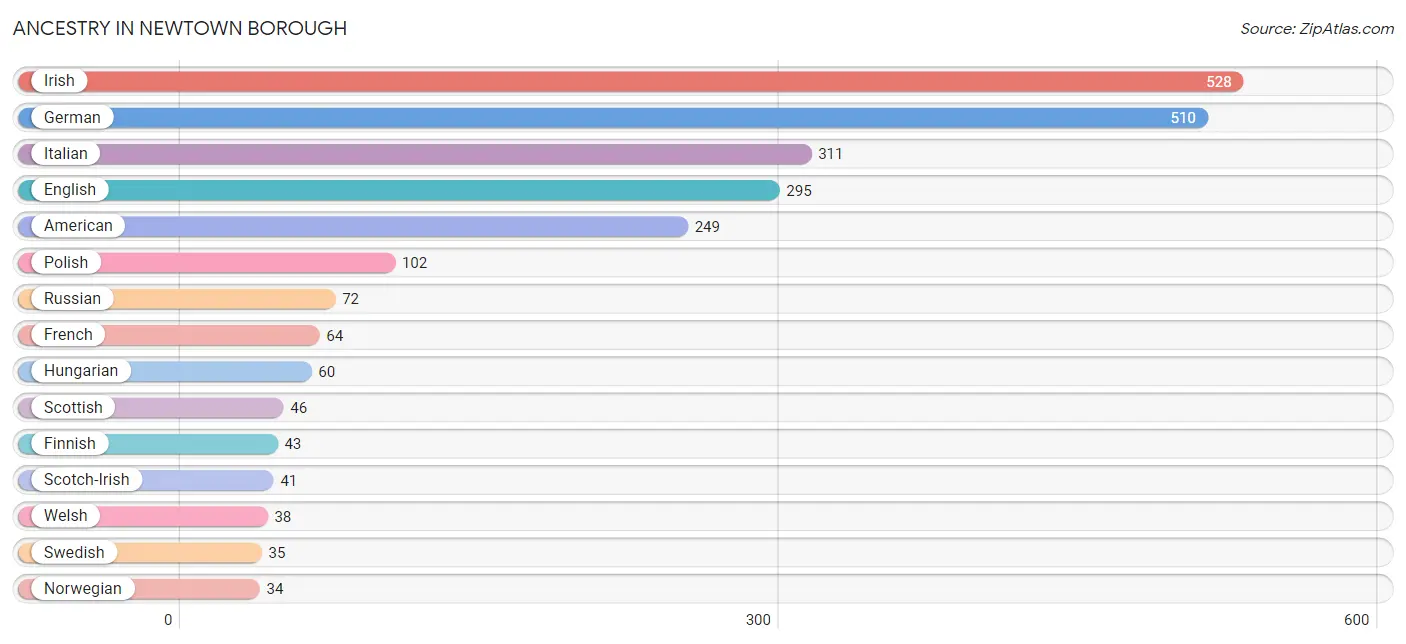
Ancestry in Newtown borough
The most populous ancestries reported in Newtown borough are Irish (528 | 24.3%), German (510 | 23.5%), Italian (311 | 14.3%), English (295 | 13.6%), and American (249 | 11.5%), together accounting for 87.3% of all Newtown borough residents.
| Ancestry | # Population | % Population |
| American | 249 | 11.5% |
| Arab | 12 | 0.5% |
| Armenian | 18 | 0.8% |
| Australian | 9 | 0.4% |
| Austrian | 5 | 0.2% |
| Bhutanese | 7 | 0.3% |
| British | 17 | 0.8% |
| Canadian | 5 | 0.2% |
| Chilean | 6 | 0.3% |
| Cuban | 8 | 0.4% |
| Dutch | 22 | 1.0% |
| Eastern European | 30 | 1.4% |
| English | 295 | 13.6% |
| European | 21 | 1.0% |
| Finnish | 43 | 2.0% |
| French | 64 | 2.9% |
| French Canadian | 15 | 0.7% |
| German | 510 | 23.5% |
| Greek | 14 | 0.6% |
| Hungarian | 60 | 2.8% |
| Irish | 528 | 24.3% |
| Iroquois | 5 | 0.2% |
| Italian | 311 | 14.3% |
| Jamaican | 2 | 0.1% |
| Lebanese | 12 | 0.5% |
| Lithuanian | 4 | 0.2% |
| Mexican | 5 | 0.2% |
| Norwegian | 34 | 1.6% |
| Polish | 102 | 4.7% |
| Potawatomi | 5 | 0.2% |
| Puerto Rican | 7 | 0.3% |
| Russian | 72 | 3.3% |
| Scandinavian | 7 | 0.3% |
| Scotch-Irish | 41 | 1.9% |
| Scottish | 46 | 2.1% |
| Slovene | 4 | 0.2% |
| South American | 6 | 0.3% |
| Swedish | 35 | 1.6% |
| Swiss | 12 | 0.5% |
| Ukrainian | 19 | 0.9% |
| Welsh | 38 | 1.8% | View All 41 Rows |
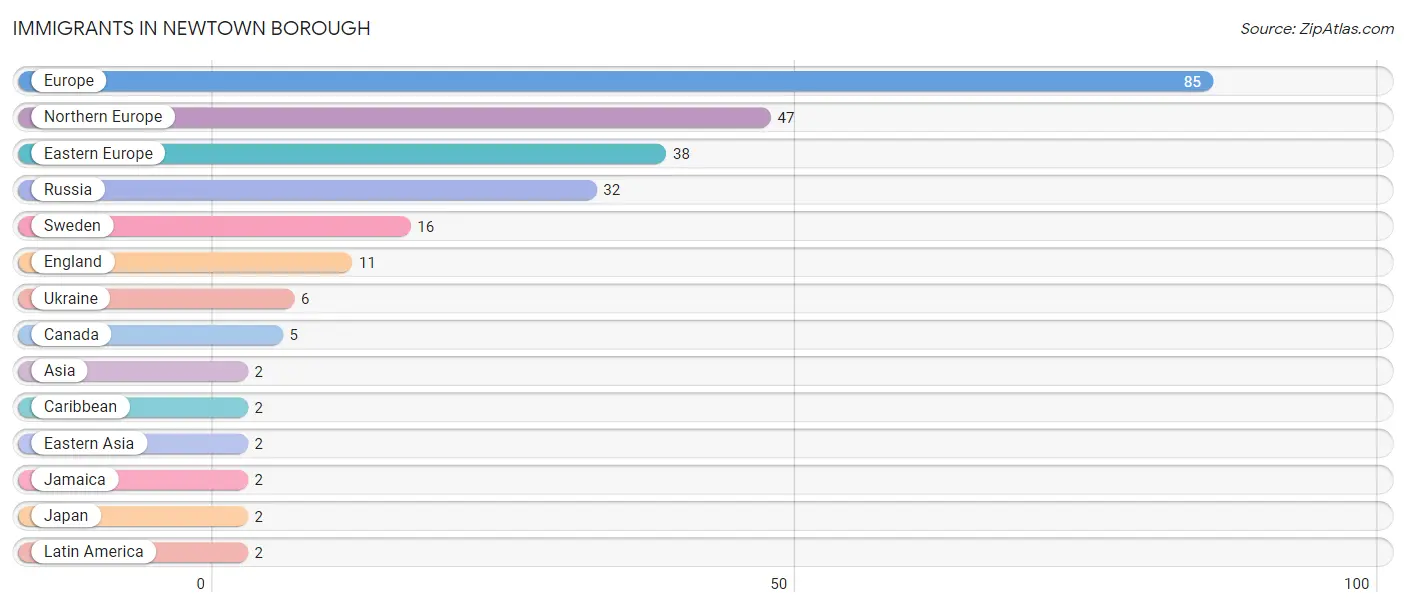
Immigrants in Newtown borough
The most numerous immigrant groups reported in Newtown borough came from Europe (85 | 3.9%), Northern Europe (47 | 2.2%), Eastern Europe (38 | 1.8%), Russia (32 | 1.5%), and Sweden (16 | 0.7%), together accounting for 10.1% of all Newtown borough residents.
| Immigration Origin | # Population | % Population |
| Asia | 2 | 0.1% |
| Canada | 5 | 0.2% |
| Caribbean | 2 | 0.1% |
| Eastern Asia | 2 | 0.1% |
| Eastern Europe | 38 | 1.8% |
| England | 11 | 0.5% |
| Europe | 85 | 3.9% |
| Jamaica | 2 | 0.1% |
| Japan | 2 | 0.1% |
| Latin America | 2 | 0.1% |
| Northern Europe | 47 | 2.2% |
| Russia | 32 | 1.5% |
| Sweden | 16 | 0.7% |
| Ukraine | 6 | 0.3% | View All 14 Rows |
Sex and Age in Newtown borough
Sex and Age in Newtown borough
The most populous age groups in Newtown borough are 55 to 59 Years (123 | 13.1%) for men and 55 to 59 Years (159 | 13.0%) for women.
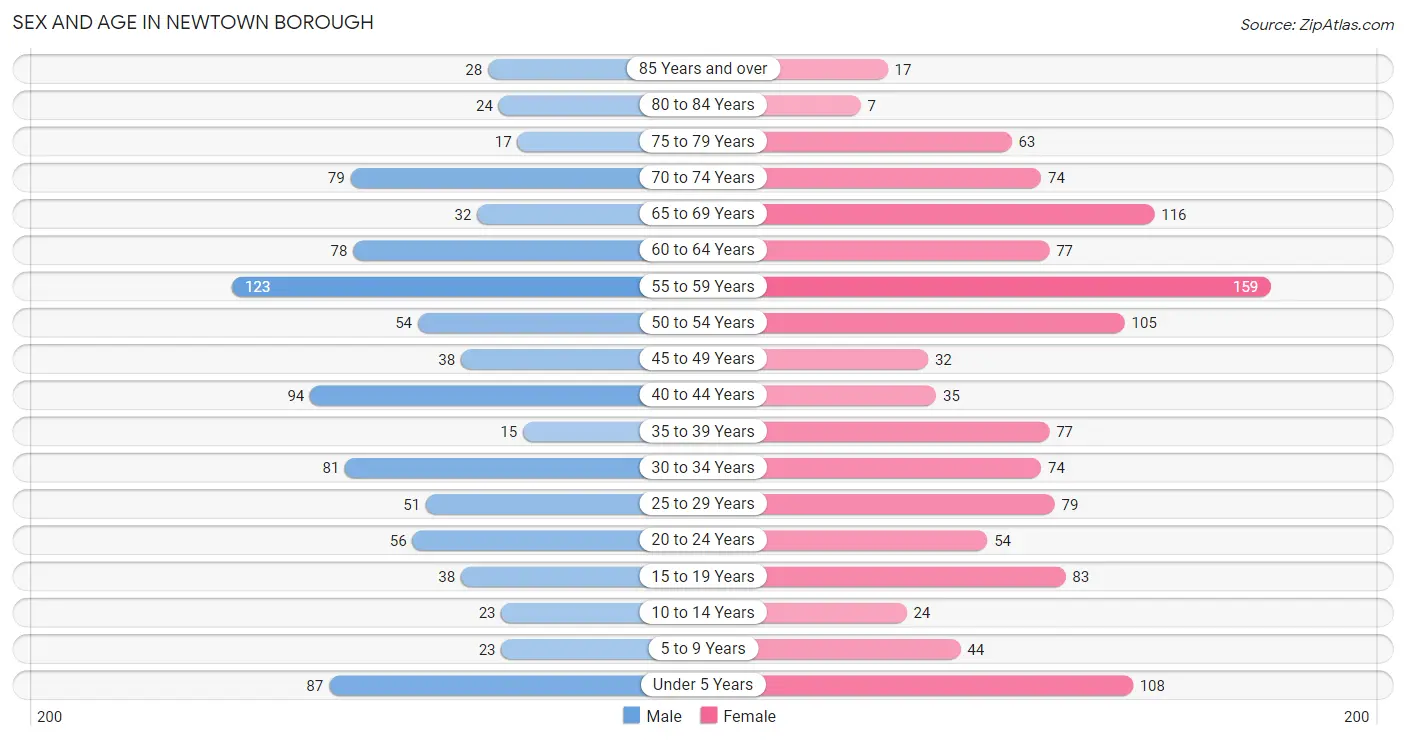
| Age Bracket | Male | Female |
| Under 5 Years | 87 (9.2%) | 108 (8.8%) |
| 5 to 9 Years | 23 (2.4%) | 44 (3.6%) |
| 10 to 14 Years | 23 (2.4%) | 24 (1.9%) |
| 15 to 19 Years | 38 (4.0%) | 83 (6.8%) |
| 20 to 24 Years | 56 (5.9%) | 54 (4.4%) |
| 25 to 29 Years | 51 (5.4%) | 79 (6.4%) |
| 30 to 34 Years | 81 (8.6%) | 74 (6.0%) |
| 35 to 39 Years | 15 (1.6%) | 77 (6.3%) |
| 40 to 44 Years | 94 (10.0%) | 35 (2.9%) |
| 45 to 49 Years | 38 (4.0%) | 32 (2.6%) |
| 50 to 54 Years | 54 (5.7%) | 105 (8.6%) |
| 55 to 59 Years | 123 (13.1%) | 159 (13.0%) |
| 60 to 64 Years | 78 (8.3%) | 77 (6.3%) |
| 65 to 69 Years | 32 (3.4%) | 116 (9.5%) |
| 70 to 74 Years | 79 (8.4%) | 74 (6.0%) |
| 75 to 79 Years | 17 (1.8%) | 63 (5.1%) |
| 80 to 84 Years | 24 (2.5%) | 7 (0.6%) |
| 85 Years and over | 28 (3.0%) | 17 (1.4%) |
| Total | 941 (100.0%) | 1,228 (100.0%) |
Families and Households in Newtown borough
Median Family Size in Newtown borough
The median family size in Newtown borough is 3.00 persons per family, with single female/mother families (83 | 14.0%) accounting for the largest median family size of 3.82 persons per family. On the other hand, single male/father families (7 | 1.2%) represent the smallest median family size with 2.57 persons per family.
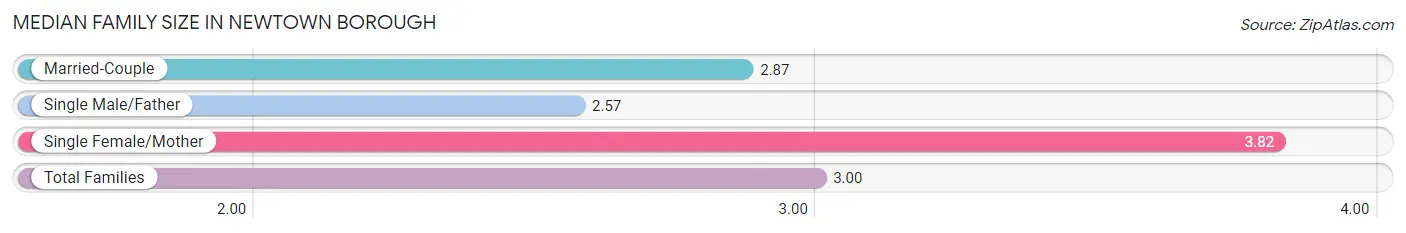
| Family Type | # Families | Family Size |
| Married-Couple | 504 (84.9%) | 2.87 |
| Single Male/Father | 7 (1.2%) | 2.57 |
| Single Female/Mother | 83 (14.0%) | 3.82 |
| Total Families | 594 (100.0%) | 3.00 |
Median Household Size in Newtown borough
The median household size in Newtown borough is 2.32 persons per household, with single female/mother households (83 | 8.9%) accounting for the largest median household size of 4.05 persons per household. non-family households (342 | 36.5%) represent the smallest median household size with 1.08 persons per household.
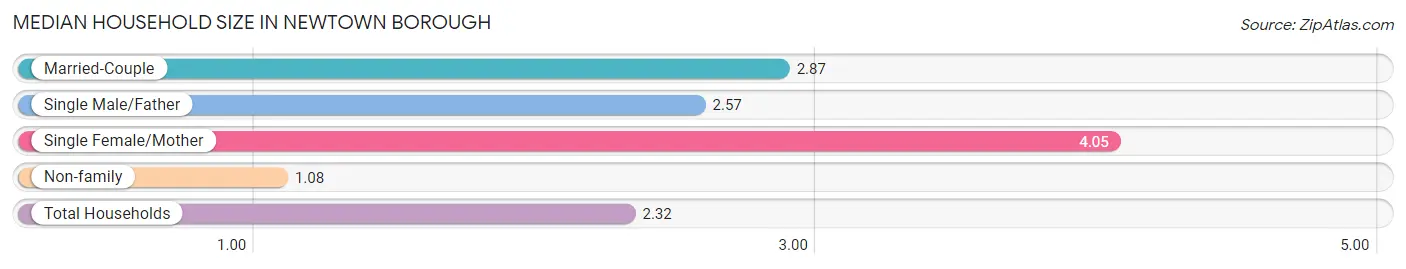
| Household Type | # Households | Household Size |
| Married-Couple | 504 (53.8%) | 2.87 |
| Single Male/Father | 7 (0.7%) | 2.57 |
| Single Female/Mother | 83 (8.9%) | 4.05 |
| Non-family | 342 (36.5%) | 1.08 |
| Total Households | 936 (100.0%) | 2.32 |
Household Size by Marriage Status in Newtown borough
Out of a total of 936 households in Newtown borough, 594 (63.5%) are family households, while 342 (36.5%) are nonfamily households. The most numerous type of family households are 2-person households, comprising 304, and the most common type of nonfamily households are 1-person households, comprising 313.
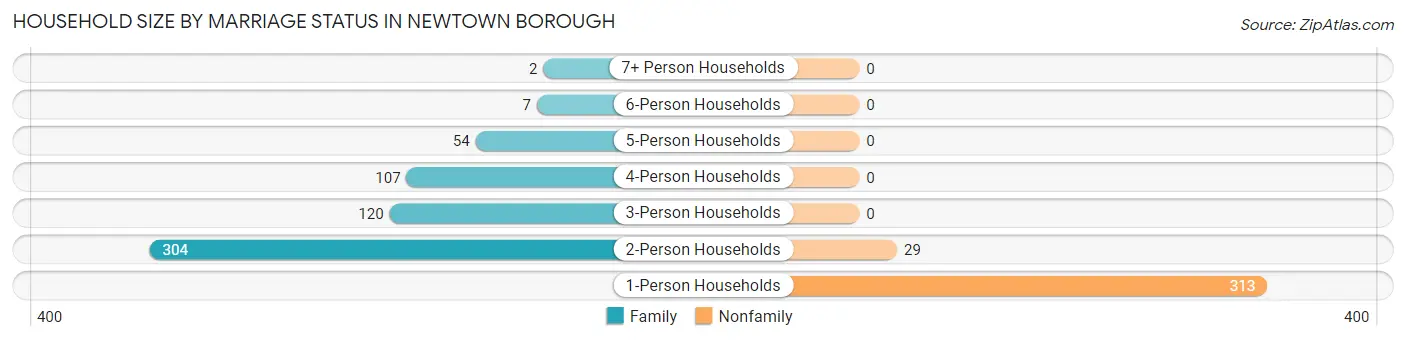
| Household Size | Family Households | Nonfamily Households |
| 1-Person Households | - | 313 (33.4%) |
| 2-Person Households | 304 (32.5%) | 29 (3.1%) |
| 3-Person Households | 120 (12.8%) | 0 (0.0%) |
| 4-Person Households | 107 (11.4%) | 0 (0.0%) |
| 5-Person Households | 54 (5.8%) | 0 (0.0%) |
| 6-Person Households | 7 (0.7%) | 0 (0.0%) |
| 7+ Person Households | 2 (0.2%) | 0 (0.0%) |
| Total | 594 (63.5%) | 342 (36.5%) |
Female Fertility in Newtown borough
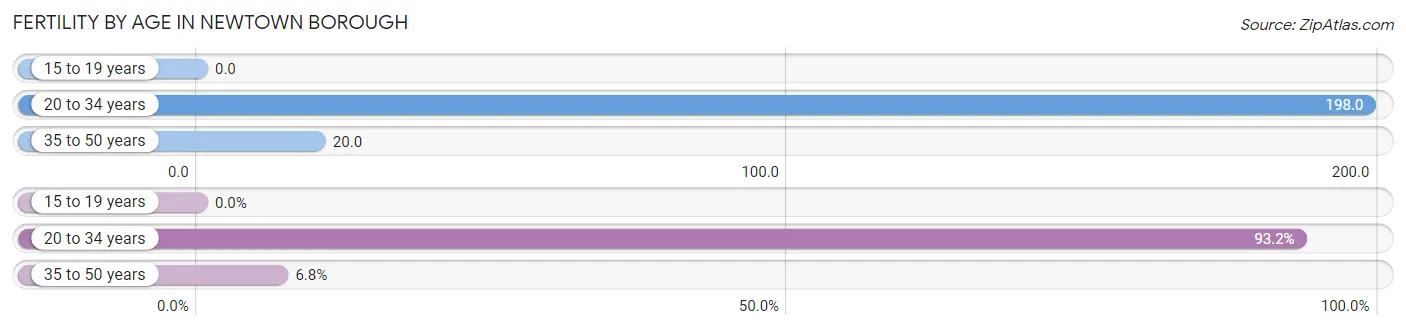
Fertility by Age in Newtown borough
Average fertility rate in Newtown borough is 100.0 births per 1,000 women. Women in the age bracket of 20 to 34 years have the highest fertility rate with 198.0 births per 1,000 women. Women in the age bracket of 20 to 34 years acount for 93.2% of all women with births.
| Age Bracket | Women with Births | Births / 1,000 Women |
| 15 to 19 years | 0 (0.0%) | 0.0 |
| 20 to 34 years | 41 (93.2%) | 198.0 |
| 35 to 50 years | 3 (6.8%) | 20.0 |
| Total | 44 (100.0%) | 100.0 |
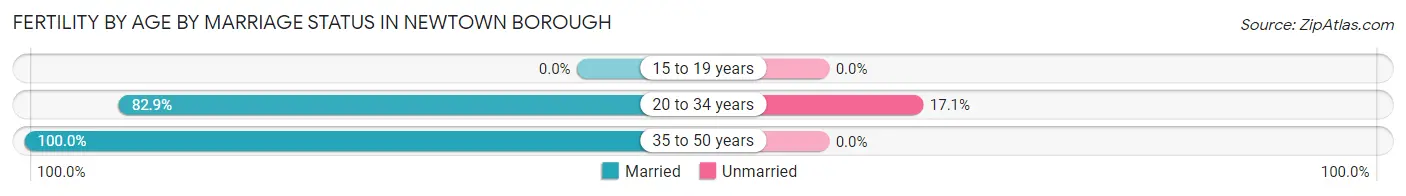
Fertility by Age by Marriage Status in Newtown borough
84.1% of women with births (44) in Newtown borough are married. The highest percentage of unmarried women with births falls into 20 to 34 years age bracket with 17.1% of them unmarried at the time of birth, while the lowest percentage of unmarried women with births belong to 35 to 50 years age bracket with 0.0% of them unmarried.
| Age Bracket | Married | Unmarried |
| 15 to 19 years | 0 (0.0%) | 0 (0.0%) |
| 20 to 34 years | 34 (82.9%) | 7 (17.1%) |
| 35 to 50 years | 3 (100.0%) | 0 (0.0%) |
| Total | 37 (84.1%) | 7 (15.9%) |
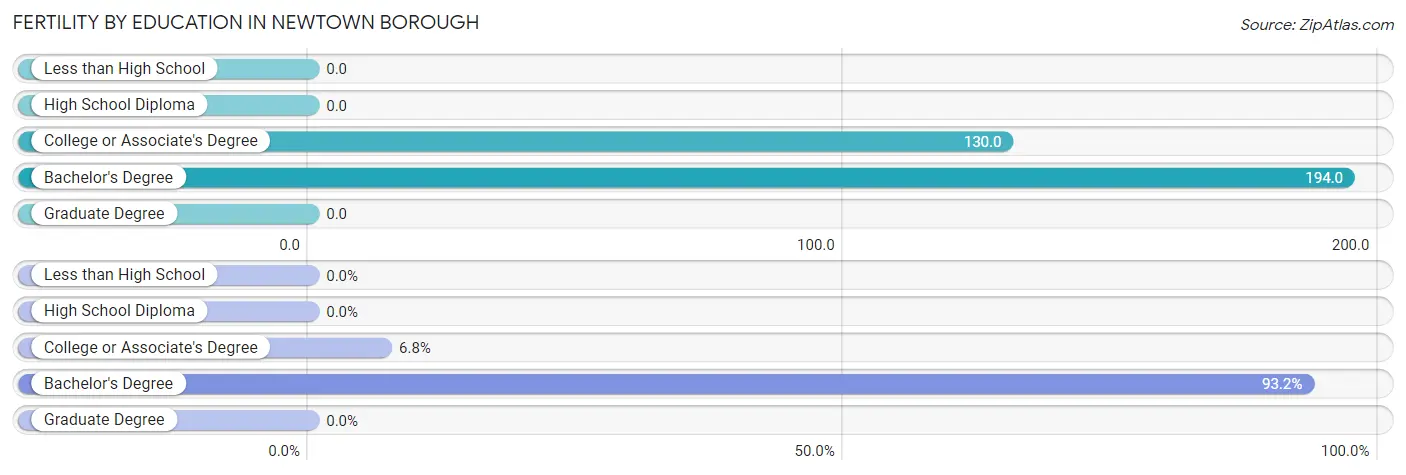
Fertility by Education in Newtown borough
| Educational Attainment | Women with Births | Births / 1,000 Women |
| Less than High School | 0 (0.0%) | 0.0 |
| High School Diploma | 0 (0.0%) | 0.0 |
| College or Associate's Degree | 3 (6.8%) | 130.0 |
| Bachelor's Degree | 41 (93.2%) | 194.0 |
| Graduate Degree | 0 (0.0%) | 0.0 |
| Total | 44 (100.0%) | 100.0 |
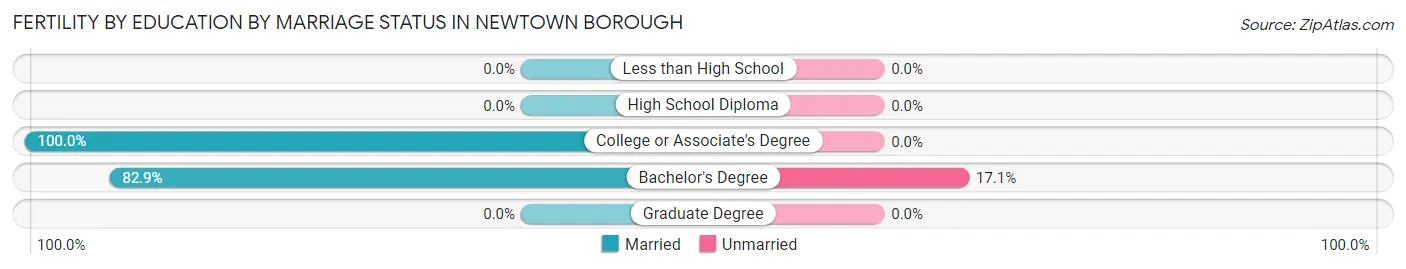
Fertility by Education by Marriage Status in Newtown borough
15.9% of women with births in Newtown borough are unmarried. Women with the educational attainment of college or associate's degree are most likely to be married with 100.0% of them married at childbirth, while women with the educational attainment of bachelor's degree are least likely to be married with 17.1% of them unmarried at childbirth.
| Educational Attainment | Married | Unmarried |
| Less than High School | 0 (0.0%) | 0 (0.0%) |
| High School Diploma | 0 (0.0%) | 0 (0.0%) |
| College or Associate's Degree | 3 (100.0%) | 0 (0.0%) |
| Bachelor's Degree | 34 (82.9%) | 7 (17.1%) |
| Graduate Degree | 0 (0.0%) | 0 (0.0%) |
| Total | 37 (84.1%) | 7 (15.9%) |
Employment Characteristics in Newtown borough
Employment by Class of Employer in Newtown borough
Among the 1,178 employed individuals in Newtown borough, private company employees (824 | 70.0%), not-for-profit organizations (148 | 12.6%), and self-employed (not incorporated) (71 | 6.0%) make up the most common classes of employment.
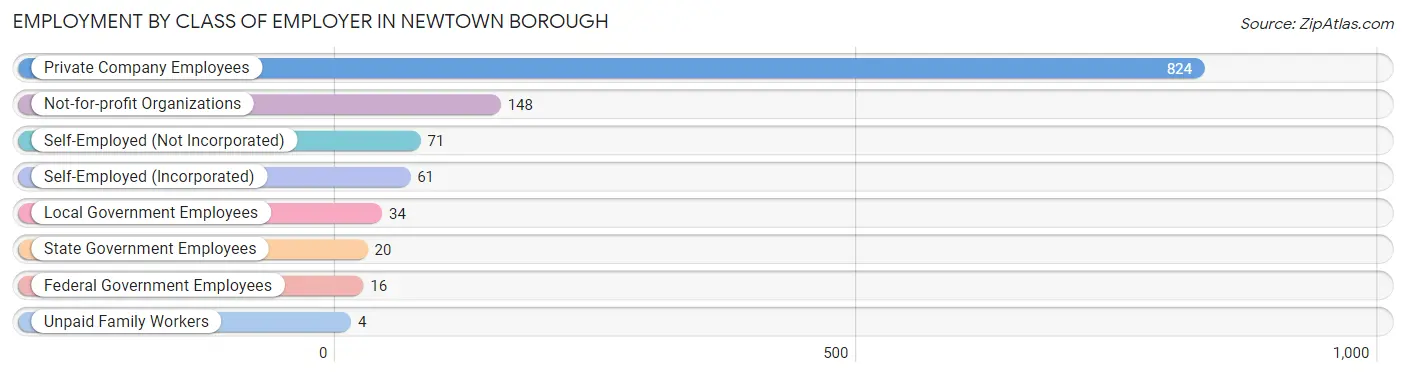
| Employer Class | # Employees | % Employees |
| Private Company Employees | 824 | 70.0% |
| Self-Employed (Incorporated) | 61 | 5.2% |
| Self-Employed (Not Incorporated) | 71 | 6.0% |
| Not-for-profit Organizations | 148 | 12.6% |
| Local Government Employees | 34 | 2.9% |
| State Government Employees | 20 | 1.7% |
| Federal Government Employees | 16 | 1.4% |
| Unpaid Family Workers | 4 | 0.3% |
| Total | 1,178 | 100.0% |
Employment Status by Age in Newtown borough
According to the labor force statistics for Newtown borough, out of the total population over 16 years of age (1,848), 65.8% or 1,216 individuals are in the labor force, with 3.1% or 38 of them unemployed. The age group with the highest labor force participation rate is 25 to 29 years, with 100.0% or 130 individuals in the labor force. Within the labor force, the 30 to 34 years age range has the highest percentage of unemployed individuals, with 6.1% or 7 of them being unemployed.
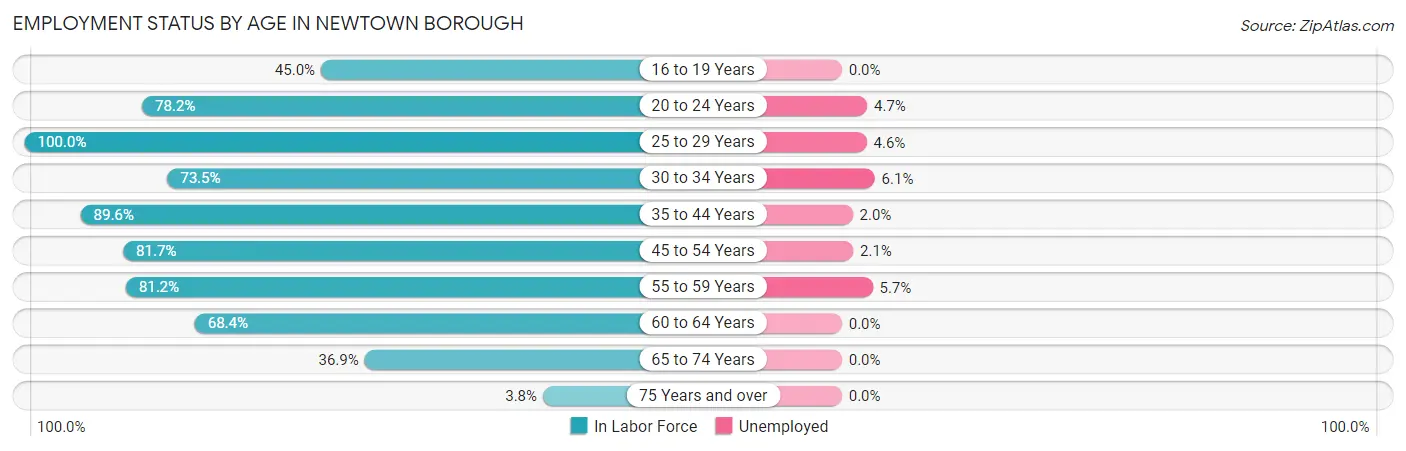
| Age Bracket | In Labor Force | Unemployed |
| 16 to 19 Years | 49 (45.0%) | 0 (0.0%) |
| 20 to 24 Years | 86 (78.2%) | 4 (4.7%) |
| 25 to 29 Years | 130 (100.0%) | 6 (4.6%) |
| 30 to 34 Years | 114 (73.5%) | 7 (6.1%) |
| 35 to 44 Years | 198 (89.6%) | 4 (2.0%) |
| 45 to 54 Years | 187 (81.7%) | 4 (2.1%) |
| 55 to 59 Years | 229 (81.2%) | 13 (5.7%) |
| 60 to 64 Years | 106 (68.4%) | 0 (0.0%) |
| 65 to 74 Years | 111 (36.9%) | 0 (0.0%) |
| 75 Years and over | 6 (3.8%) | 0 (0.0%) |
| Total | 1,216 (65.8%) | 38 (3.1%) |
Employment Status by Educational Attainment in Newtown borough
According to labor force statistics for Newtown borough, 82.3% of individuals (965) out of the total population between 25 and 64 years of age (1,172) are in the labor force, with 3.5% or 34 of them being unemployed. The group with the highest labor force participation rate are those with the educational attainment of less than high school, with 100.0% or 1 individuals in the labor force. Within the labor force, individuals with college / associate degree education have the highest percentage of unemployment, with 3.8% or 6 of them being unemployed.
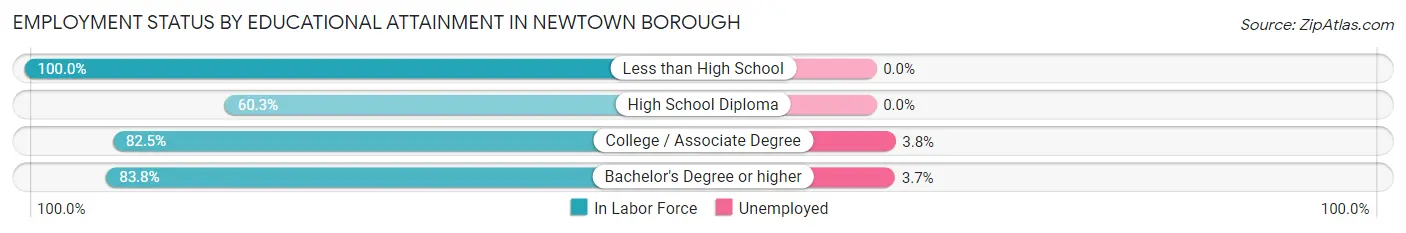
| Educational Attainment | In Labor Force | Unemployed |
| Less than High School | 1 (100.0%) | 0 (0.0%) |
| High School Diploma | 41 (60.3%) | 0 (0.0%) |
| College / Associate Degree | 160 (82.5%) | 7 (3.8%) |
| Bachelor's Degree or higher | 762 (83.8%) | 34 (3.7%) |
| Total | 965 (82.3%) | 41 (3.5%) |
Employment Occupations by Sex in Newtown borough
Management, Business, Science and Arts Occupations
The most common Management, Business, Science and Arts occupations in Newtown borough are Management (250 | 21.2%), Health Diagnosing & Treating (153 | 13.0%), Community & Social Service (147 | 12.5%), Health Technologists (122 | 10.4%), and Business & Financial (108 | 9.2%).
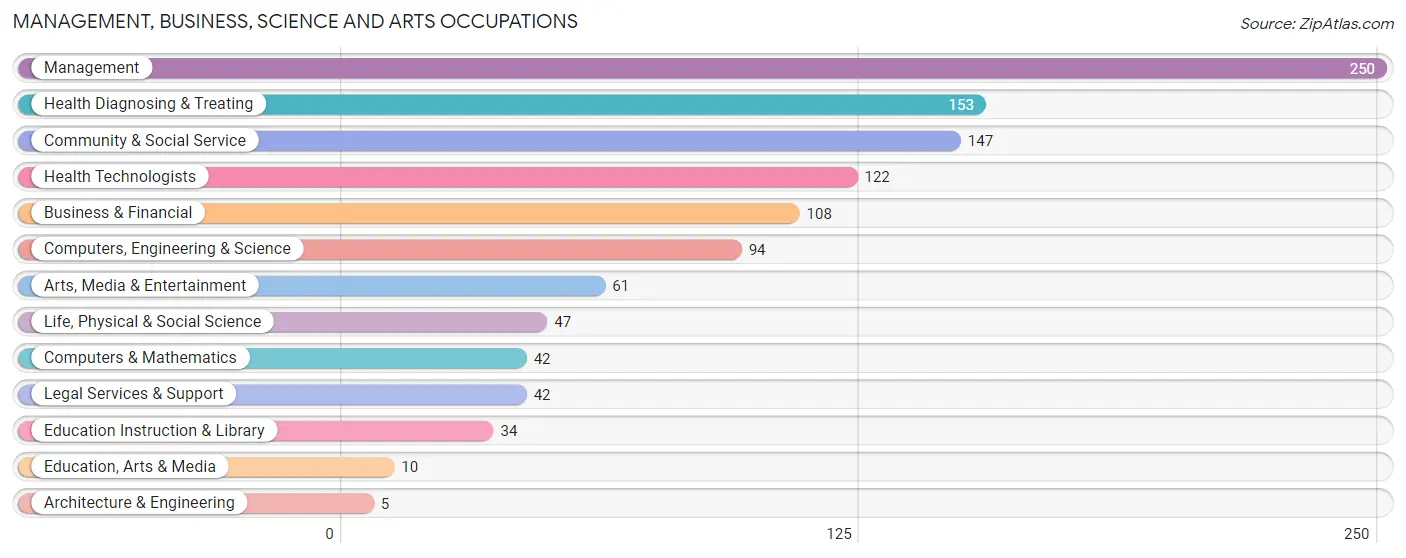
Management, Business, Science and Arts Occupations by Sex
Within the Management, Business, Science and Arts occupations in Newtown borough, the most male-oriented occupations are Architecture & Engineering (100.0%), Computers & Mathematics (80.9%), and Legal Services & Support (71.4%), while the most female-oriented occupations are Arts, Media & Entertainment (85.3%), Health Technologists (84.4%), and Life, Physical & Social Science (78.7%).
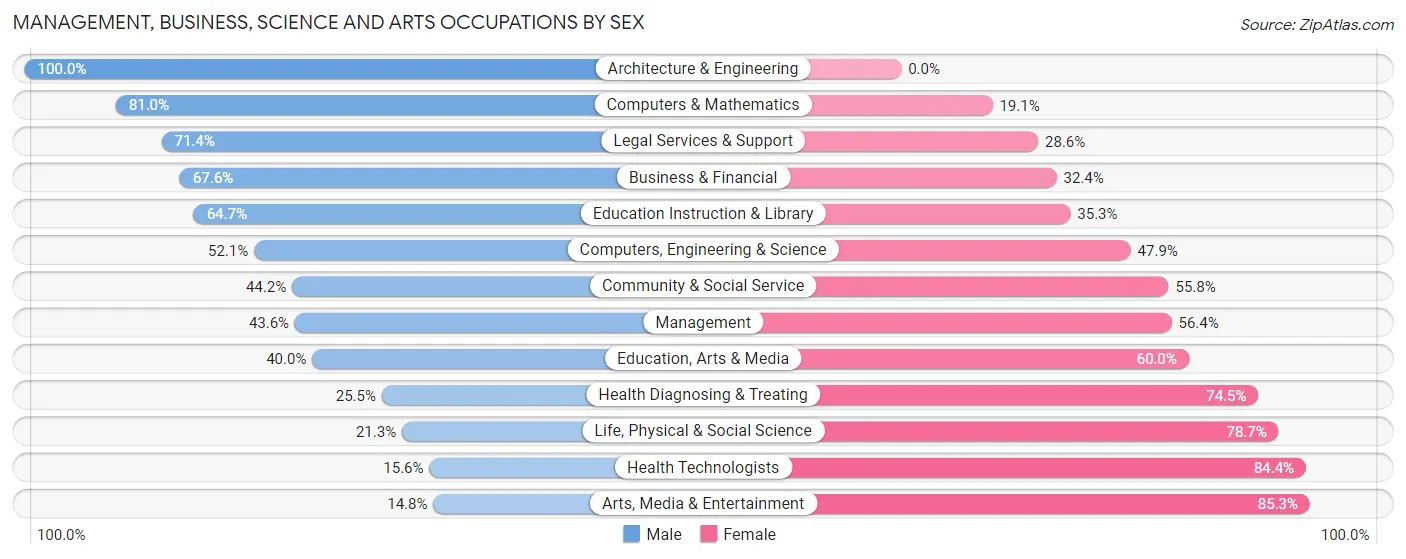
| Occupation | Male | Female |
| Management | 109 (43.6%) | 141 (56.4%) |
| Business & Financial | 73 (67.6%) | 35 (32.4%) |
| Computers, Engineering & Science | 49 (52.1%) | 45 (47.9%) |
| Computers & Mathematics | 34 (80.9%) | 8 (19.1%) |
| Architecture & Engineering | 5 (100.0%) | 0 (0.0%) |
| Life, Physical & Social Science | 10 (21.3%) | 37 (78.7%) |
| Community & Social Service | 65 (44.2%) | 82 (55.8%) |
| Education, Arts & Media | 4 (40.0%) | 6 (60.0%) |
| Legal Services & Support | 30 (71.4%) | 12 (28.6%) |
| Education Instruction & Library | 22 (64.7%) | 12 (35.3%) |
| Arts, Media & Entertainment | 9 (14.7%) | 52 (85.3%) |
| Health Diagnosing & Treating | 39 (25.5%) | 114 (74.5%) |
| Health Technologists | 19 (15.6%) | 103 (84.4%) |
| Total (Category) | 335 (44.6%) | 417 (55.4%) |
| Total (Overall) | 570 (48.4%) | 608 (51.6%) |
Services Occupations
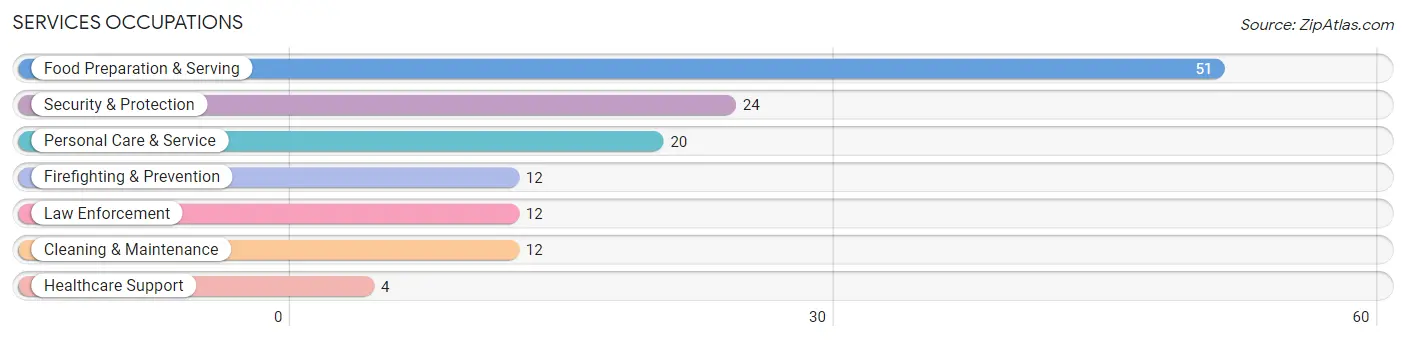
The most common Services occupations in Newtown borough are Food Preparation & Serving (51 | 4.3%), Security & Protection (24 | 2.0%), Personal Care & Service (20 | 1.7%), Firefighting & Prevention (12 | 1.0%), and Law Enforcement (12 | 1.0%).
Services Occupations by Sex
Within the Services occupations in Newtown borough, the most male-oriented occupations are Food Preparation & Serving (78.4%), Firefighting & Prevention (58.3%), and Cleaning & Maintenance (58.3%), while the most female-oriented occupations are Healthcare Support (100.0%), Personal Care & Service (65.0%), and Law Enforcement (58.3%).
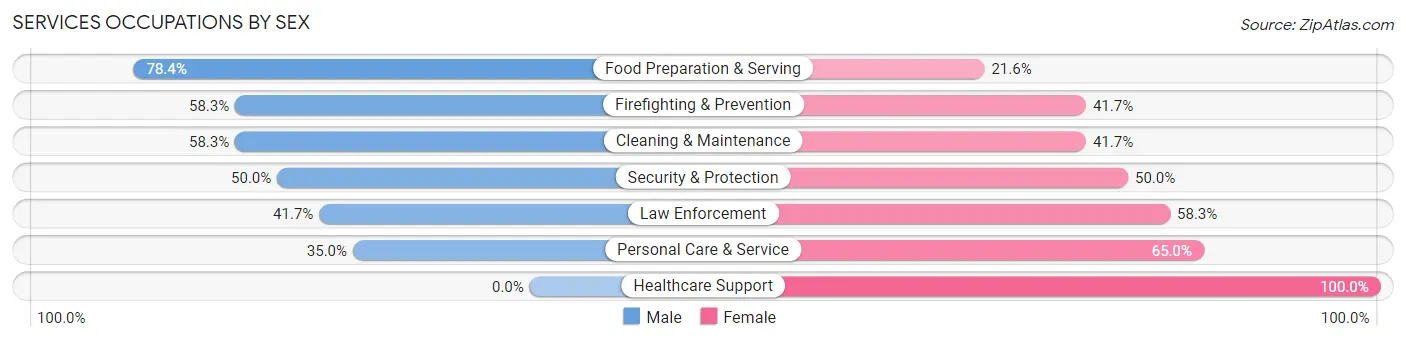
| Occupation | Male | Female |
| Healthcare Support | 0 (0.0%) | 4 (100.0%) |
| Security & Protection | 12 (50.0%) | 12 (50.0%) |
| Firefighting & Prevention | 7 (58.3%) | 5 (41.7%) |
| Law Enforcement | 5 (41.7%) | 7 (58.3%) |
| Food Preparation & Serving | 40 (78.4%) | 11 (21.6%) |
| Cleaning & Maintenance | 7 (58.3%) | 5 (41.7%) |
| Personal Care & Service | 7 (35.0%) | 13 (65.0%) |
| Total (Category) | 66 (59.5%) | 45 (40.5%) |
| Total (Overall) | 570 (48.4%) | 608 (51.6%) |
Sales and Office Occupations
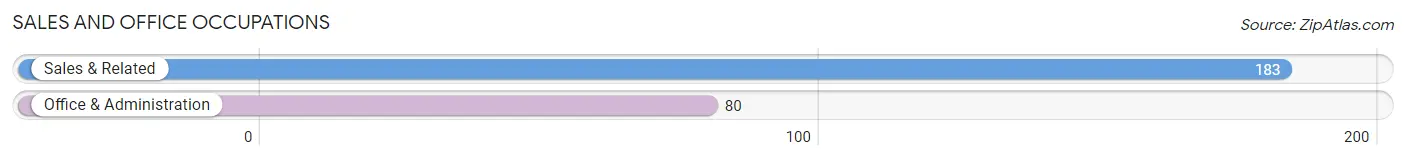
The most common Sales and Office occupations in Newtown borough are Sales & Related (183 | 15.5%), and Office & Administration (80 | 6.8%).
Sales and Office Occupations by Sex
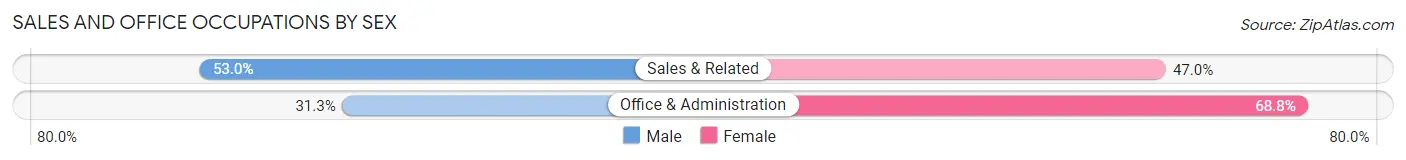
| Occupation | Male | Female |
| Sales & Related | 97 (53.0%) | 86 (47.0%) |
| Office & Administration | 25 (31.2%) | 55 (68.8%) |
| Total (Category) | 122 (46.4%) | 141 (53.6%) |
| Total (Overall) | 570 (48.4%) | 608 (51.6%) |
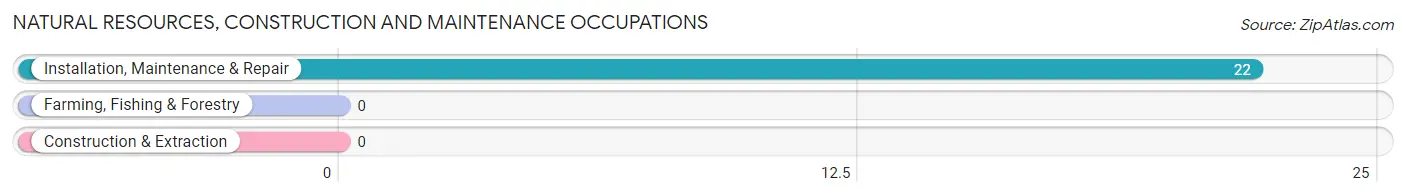
Natural Resources, Construction and Maintenance Occupations
The most common Natural Resources, Construction and Maintenance occupations in Newtown borough are , and Installation, Maintenance & Repair (22 | 1.9%).
Natural Resources, Construction and Maintenance Occupations by Sex
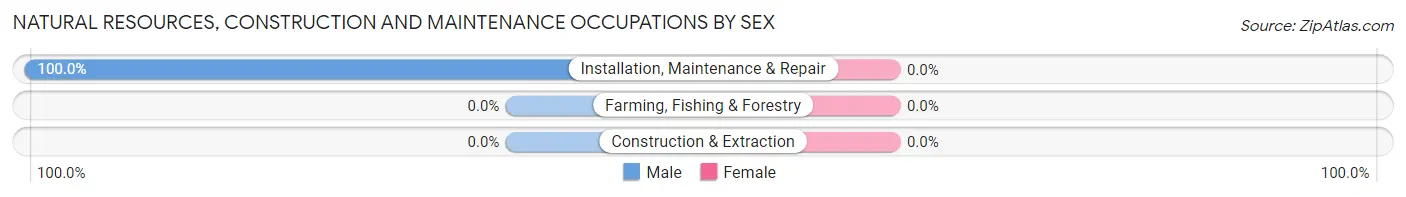
| Occupation | Male | Female |
| Farming, Fishing & Forestry | 0 (0.0%) | 0 (0.0%) |
| Construction & Extraction | 0 (0.0%) | 0 (0.0%) |
| Installation, Maintenance & Repair | 22 (100.0%) | 0 (0.0%) |
| Total (Category) | 22 (100.0%) | 0 (0.0%) |
| Total (Overall) | 570 (48.4%) | 608 (51.6%) |
Production, Transportation and Moving Occupations
The most common Production, Transportation and Moving occupations in Newtown borough are Transportation (12 | 1.0%), Production (10 | 0.9%), and Material Moving (8 | 0.7%).
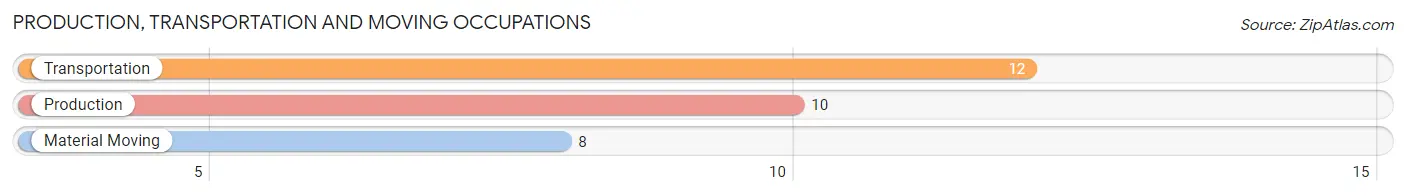
Production, Transportation and Moving Occupations by Sex
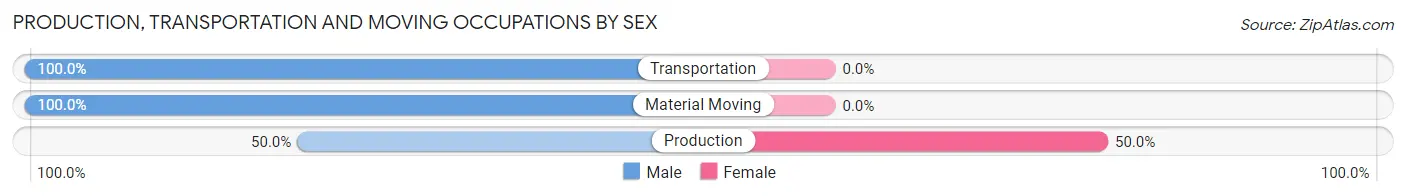
| Occupation | Male | Female |
| Production | 5 (50.0%) | 5 (50.0%) |
| Transportation | 12 (100.0%) | 0 (0.0%) |
| Material Moving | 8 (100.0%) | 0 (0.0%) |
| Total (Category) | 25 (83.3%) | 5 (16.7%) |
| Total (Overall) | 570 (48.4%) | 608 (51.6%) |
Employment Industries by Sex in Newtown borough
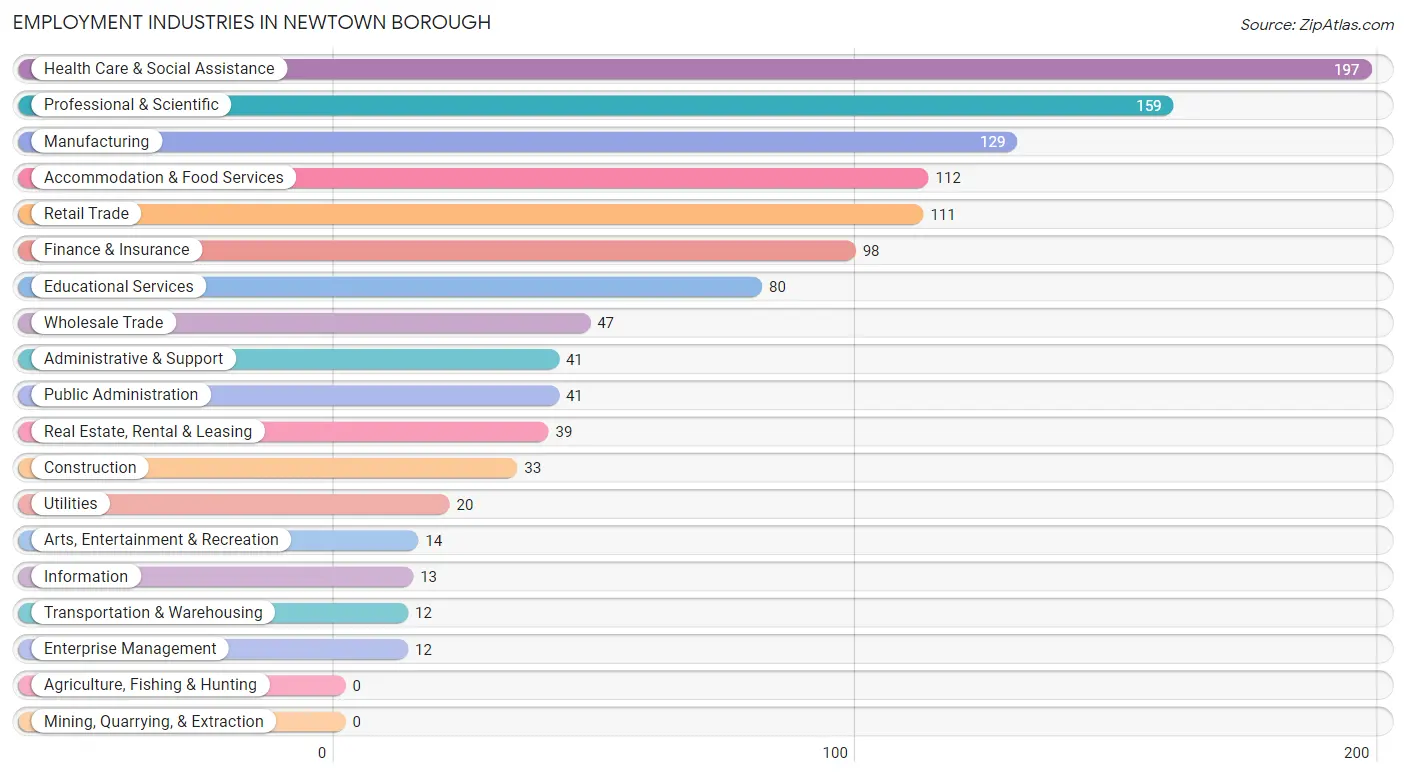
Employment Industries in Newtown borough
The major employment industries in Newtown borough include Health Care & Social Assistance (197 | 16.7%), Professional & Scientific (159 | 13.5%), Manufacturing (129 | 11.0%), Accommodation & Food Services (112 | 9.5%), and Retail Trade (111 | 9.4%).
Employment Industries by Sex in Newtown borough
The Newtown borough industries that see more men than women are Transportation & Warehousing (100.0%), Utilities (100.0%), and Arts, Entertainment & Recreation (100.0%), whereas the industries that tend to have a higher number of women are Information (100.0%), Health Care & Social Assistance (72.6%), and Retail Trade (66.7%).
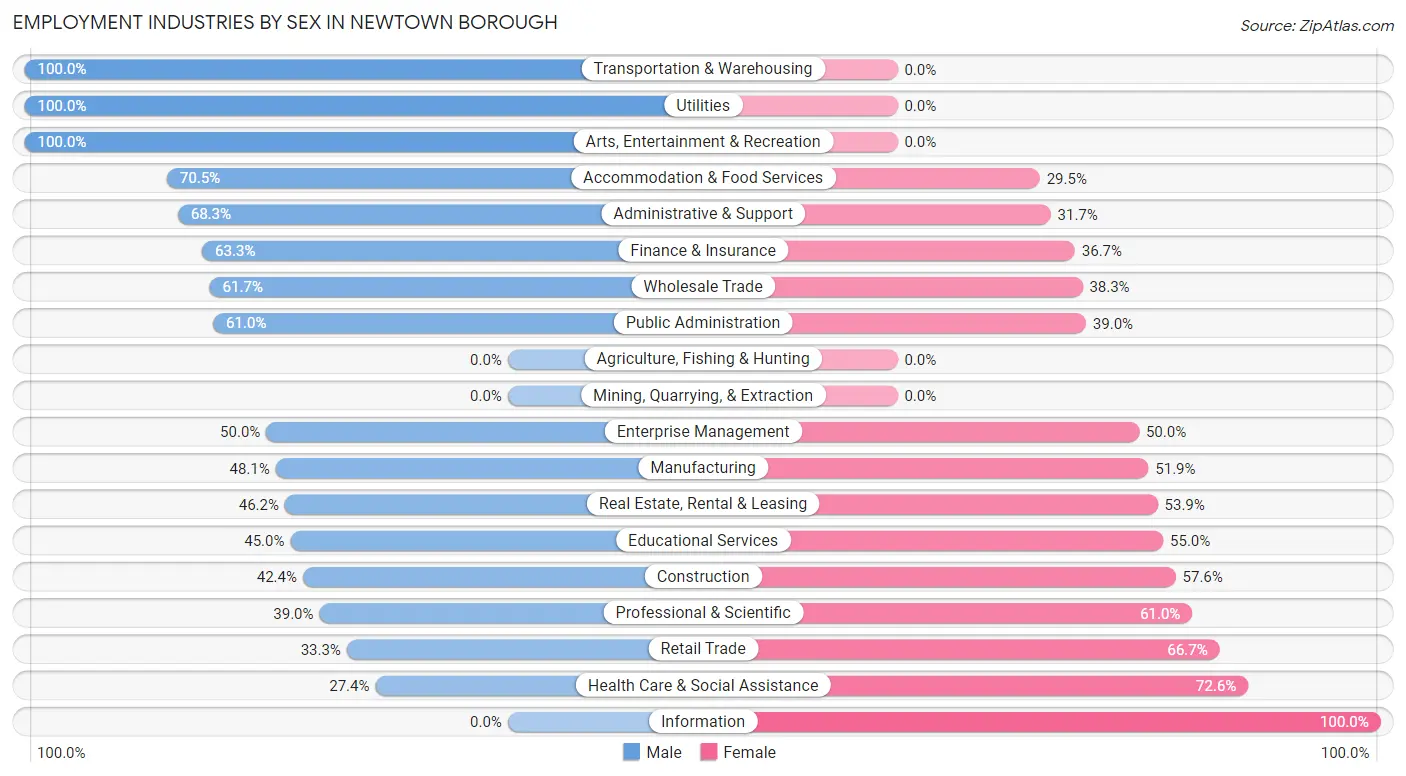
| Industry | Male | Female |
| Agriculture, Fishing & Hunting | 0 (0.0%) | 0 (0.0%) |
| Mining, Quarrying, & Extraction | 0 (0.0%) | 0 (0.0%) |
| Construction | 14 (42.4%) | 19 (57.6%) |
| Manufacturing | 62 (48.1%) | 67 (51.9%) |
| Wholesale Trade | 29 (61.7%) | 18 (38.3%) |
| Retail Trade | 37 (33.3%) | 74 (66.7%) |
| Transportation & Warehousing | 12 (100.0%) | 0 (0.0%) |
| Utilities | 20 (100.0%) | 0 (0.0%) |
| Information | 0 (0.0%) | 13 (100.0%) |
| Finance & Insurance | 62 (63.3%) | 36 (36.7%) |
| Real Estate, Rental & Leasing | 18 (46.2%) | 21 (53.8%) |
| Professional & Scientific | 62 (39.0%) | 97 (61.0%) |
| Enterprise Management | 6 (50.0%) | 6 (50.0%) |
| Administrative & Support | 28 (68.3%) | 13 (31.7%) |
| Educational Services | 36 (45.0%) | 44 (55.0%) |
| Health Care & Social Assistance | 54 (27.4%) | 143 (72.6%) |
| Arts, Entertainment & Recreation | 14 (100.0%) | 0 (0.0%) |
| Accommodation & Food Services | 79 (70.5%) | 33 (29.5%) |
| Public Administration | 25 (61.0%) | 16 (39.0%) |
| Total | 570 (48.4%) | 608 (51.6%) |
Education in Newtown borough
School Enrollment in Newtown borough
The most common levels of schooling among the 308 students in Newtown borough are high school (101 | 32.8%), elementary school (56 | 18.2%), and middle school (39 | 12.7%).
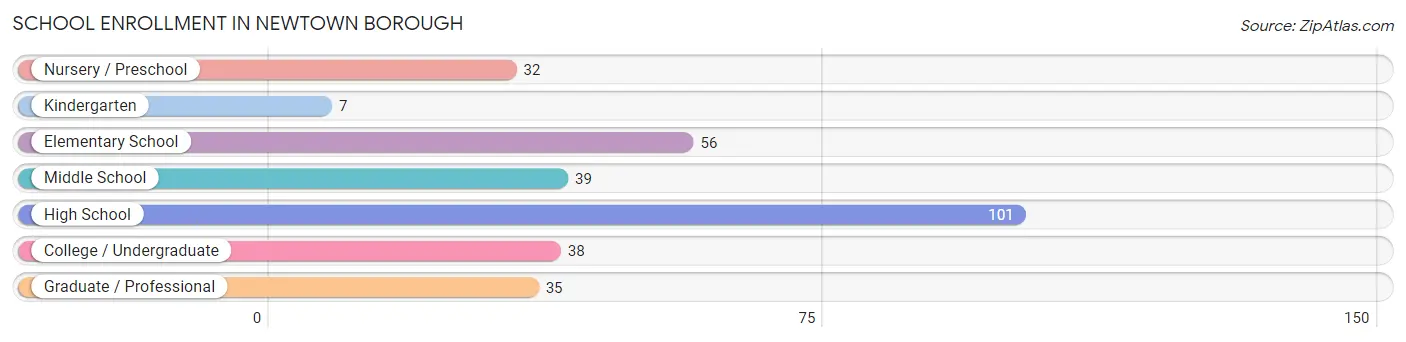
| School Level | # Students | % Students |
| Nursery / Preschool | 32 | 10.4% |
| Kindergarten | 7 | 2.3% |
| Elementary School | 56 | 18.2% |
| Middle School | 39 | 12.7% |
| High School | 101 | 32.8% |
| College / Undergraduate | 38 | 12.3% |
| Graduate / Professional | 35 | 11.4% |
| Total | 308 | 100.0% |
School Enrollment by Age by Funding Source in Newtown borough
Out of a total of 308 students who are enrolled in schools in Newtown borough, 105 (34.1%) attend a private institution, while the remaining 203 (65.9%) are enrolled in public schools. The age group of 3 to 4 year olds has the highest likelihood of being enrolled in private schools, with 28 (100.0% in the age bracket) enrolled. Conversely, the age group of 18 to 19 year olds has the lowest likelihood of being enrolled in a private school, with 58 (100.0% in the age bracket) attending a public institution.
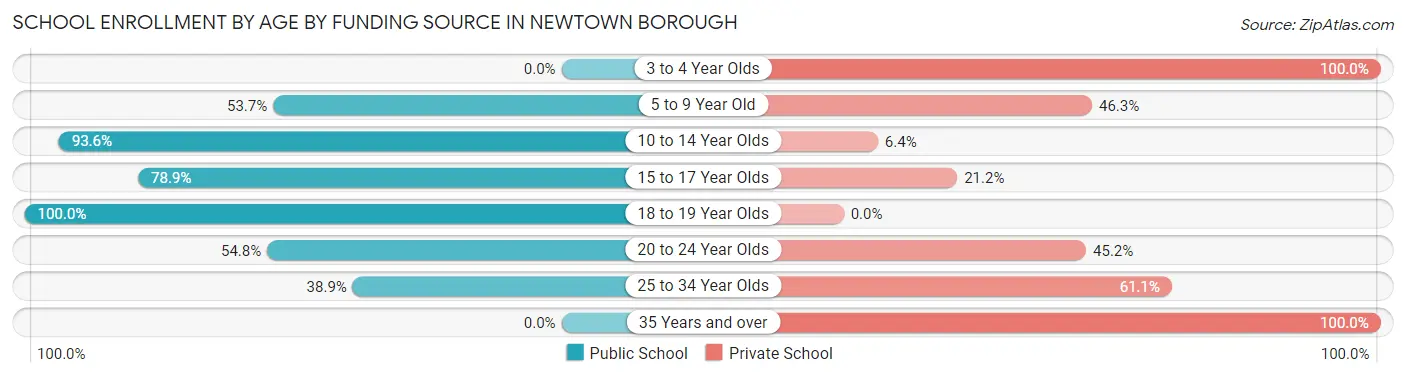
| Age Bracket | Public School | Private School |
| 3 to 4 Year Olds | 0 (0.0%) | 28 (100.0%) |
| 5 to 9 Year Old | 36 (53.7%) | 31 (46.3%) |
| 10 to 14 Year Olds | 44 (93.6%) | 3 (6.4%) |
| 15 to 17 Year Olds | 41 (78.8%) | 11 (21.1%) |
| 18 to 19 Year Olds | 58 (100.0%) | 0 (0.0%) |
| 20 to 24 Year Olds | 17 (54.8%) | 14 (45.2%) |
| 25 to 34 Year Olds | 7 (38.9%) | 11 (61.1%) |
| 35 Years and over | 0 (0.0%) | 7 (100.0%) |
| Total | 203 (65.9%) | 105 (34.1%) |
Educational Attainment by Field of Study in Newtown borough
Business (279 | 22.5%), science & technology (143 | 11.5%), social sciences (132 | 10.6%), education (130 | 10.5%), and bio, nature & agricultural (102 | 8.2%) are the most common fields of study among 1,242 individuals in Newtown borough who have obtained a bachelor's degree or higher.
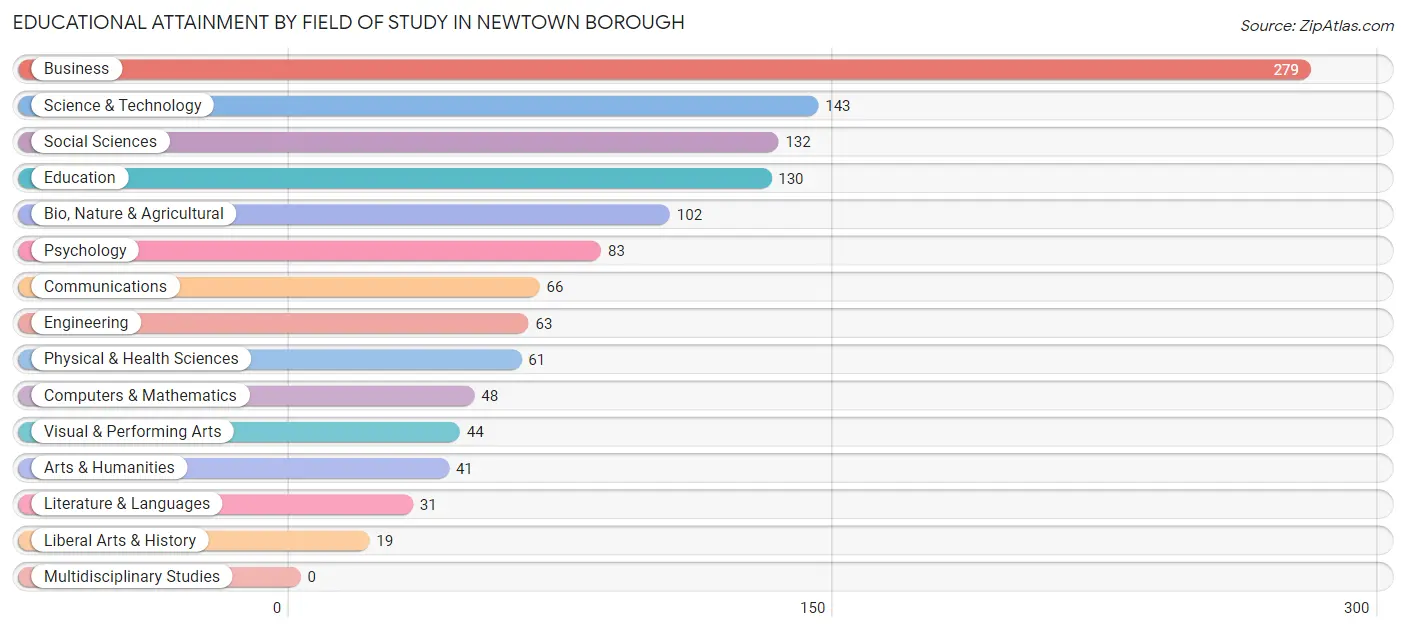
| Field of Study | # Graduates | % Graduates |
| Computers & Mathematics | 48 | 3.9% |
| Bio, Nature & Agricultural | 102 | 8.2% |
| Physical & Health Sciences | 61 | 4.9% |
| Psychology | 83 | 6.7% |
| Social Sciences | 132 | 10.6% |
| Engineering | 63 | 5.1% |
| Multidisciplinary Studies | 0 | 0.0% |
| Science & Technology | 143 | 11.5% |
| Business | 279 | 22.5% |
| Education | 130 | 10.5% |
| Literature & Languages | 31 | 2.5% |
| Liberal Arts & History | 19 | 1.5% |
| Visual & Performing Arts | 44 | 3.5% |
| Communications | 66 | 5.3% |
| Arts & Humanities | 41 | 3.3% |
| Total | 1,242 | 100.0% |
Transportation & Commute in Newtown borough
Vehicle Availability by Sex in Newtown borough
The most prevalent vehicle ownership categories in Newtown borough are males with 2 vehicles (266, accounting for 46.7%) and females with 2 vehicles (259, making up 43.8%).
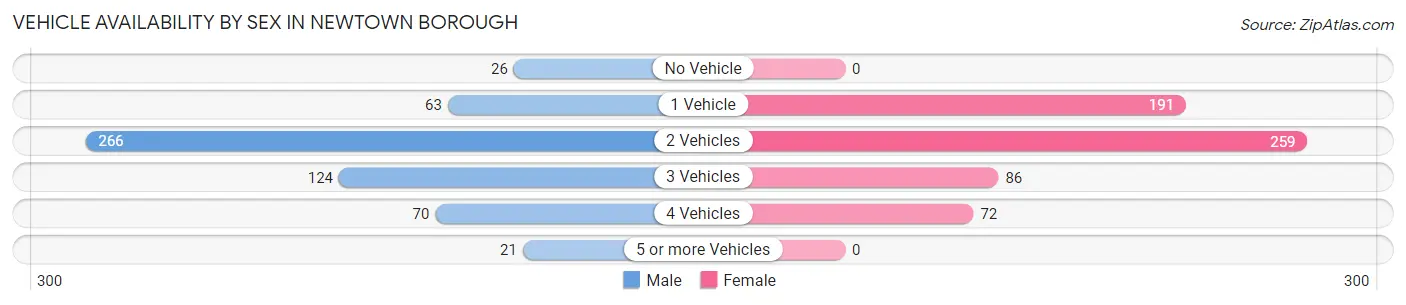
| Vehicles Available | Male | Female |
| No Vehicle | 26 (4.6%) | 0 (0.0%) |
| 1 Vehicle | 63 (11.1%) | 191 (31.4%) |
| 2 Vehicles | 266 (46.7%) | 259 (42.6%) |
| 3 Vehicles | 124 (21.7%) | 86 (14.1%) |
| 4 Vehicles | 70 (12.3%) | 72 (11.8%) |
| 5 or more Vehicles | 21 (3.7%) | 0 (0.0%) |
| Total | 570 (100.0%) | 608 (100.0%) |
Commute Time in Newtown borough
The most frequently occuring commute durations in Newtown borough are 20 to 24 minutes (133 commuters, 14.5%), 45 to 59 minutes (130 commuters, 14.2%), and 5 to 9 minutes (118 commuters, 12.9%).
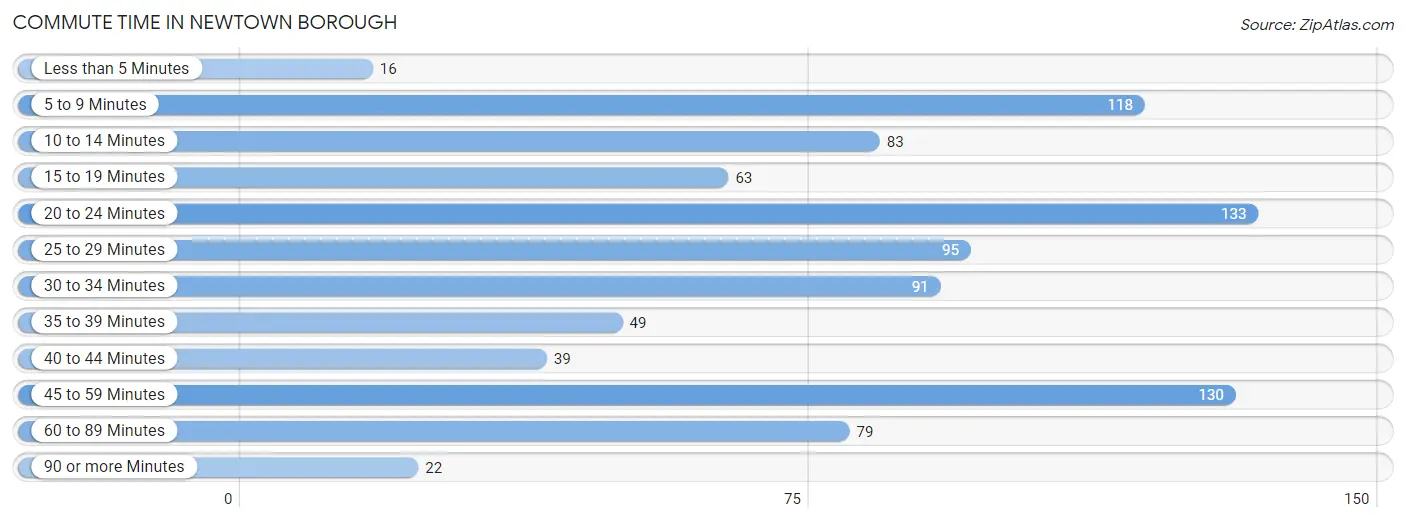
| Commute Time | # Commuters | % Commuters |
| Less than 5 Minutes | 16 | 1.7% |
| 5 to 9 Minutes | 118 | 12.9% |
| 10 to 14 Minutes | 83 | 9.0% |
| 15 to 19 Minutes | 63 | 6.9% |
| 20 to 24 Minutes | 133 | 14.5% |
| 25 to 29 Minutes | 95 | 10.3% |
| 30 to 34 Minutes | 91 | 9.9% |
| 35 to 39 Minutes | 49 | 5.3% |
| 40 to 44 Minutes | 39 | 4.3% |
| 45 to 59 Minutes | 130 | 14.2% |
| 60 to 89 Minutes | 79 | 8.6% |
| 90 or more Minutes | 22 | 2.4% |
Commute Time by Sex in Newtown borough
The most common commute times in Newtown borough are 25 to 29 minutes (68 commuters, 16.0%) for males and 45 to 59 minutes (78 commuters, 15.9%) for females.
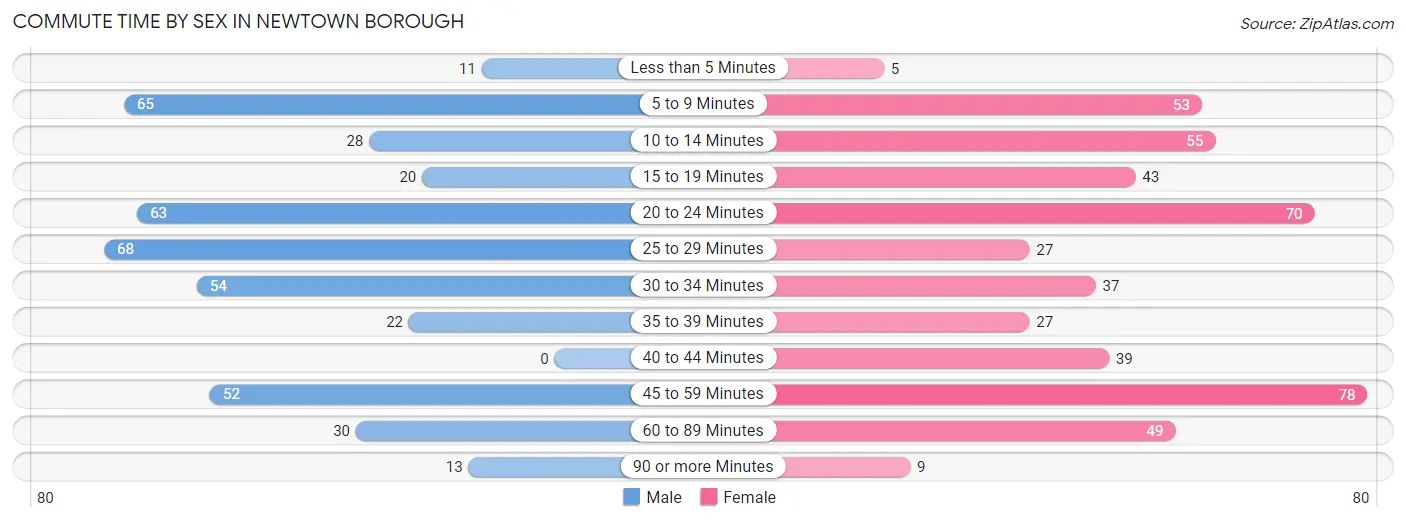
| Commute Time | Male | Female |
| Less than 5 Minutes | 11 (2.6%) | 5 (1.0%) |
| 5 to 9 Minutes | 65 (15.3%) | 53 (10.8%) |
| 10 to 14 Minutes | 28 (6.6%) | 55 (11.2%) |
| 15 to 19 Minutes | 20 (4.7%) | 43 (8.7%) |
| 20 to 24 Minutes | 63 (14.8%) | 70 (14.2%) |
| 25 to 29 Minutes | 68 (16.0%) | 27 (5.5%) |
| 30 to 34 Minutes | 54 (12.7%) | 37 (7.5%) |
| 35 to 39 Minutes | 22 (5.2%) | 27 (5.5%) |
| 40 to 44 Minutes | 0 (0.0%) | 39 (7.9%) |
| 45 to 59 Minutes | 52 (12.2%) | 78 (15.9%) |
| 60 to 89 Minutes | 30 (7.0%) | 49 (10.0%) |
| 90 or more Minutes | 13 (3.0%) | 9 (1.8%) |
Time of Departure to Work by Sex in Newtown borough
The most frequent times of departure to work in Newtown borough are 7:00 AM to 7:29 AM (81, 19.0%) for males and 6:30 AM to 6:59 AM (81, 16.5%) for females.
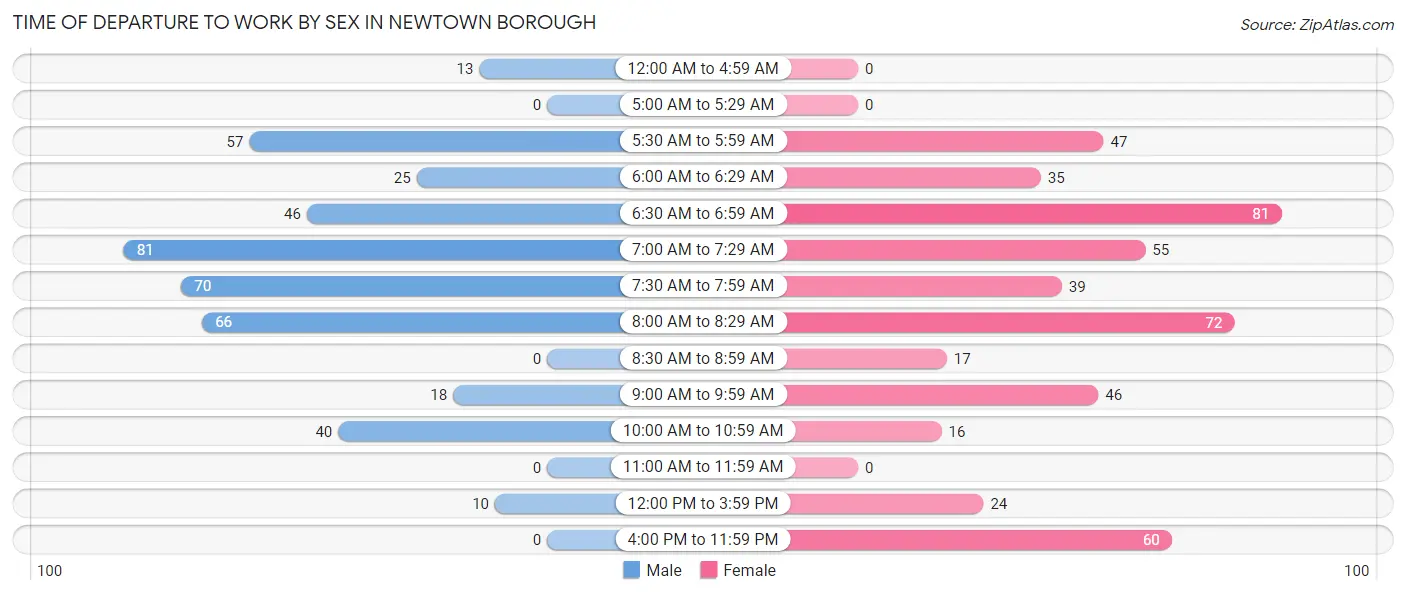
| Time of Departure | Male | Female |
| 12:00 AM to 4:59 AM | 13 (3.0%) | 0 (0.0%) |
| 5:00 AM to 5:29 AM | 0 (0.0%) | 0 (0.0%) |
| 5:30 AM to 5:59 AM | 57 (13.4%) | 47 (9.6%) |
| 6:00 AM to 6:29 AM | 25 (5.9%) | 35 (7.1%) |
| 6:30 AM to 6:59 AM | 46 (10.8%) | 81 (16.5%) |
| 7:00 AM to 7:29 AM | 81 (19.0%) | 55 (11.2%) |
| 7:30 AM to 7:59 AM | 70 (16.4%) | 39 (7.9%) |
| 8:00 AM to 8:29 AM | 66 (15.5%) | 72 (14.6%) |
| 8:30 AM to 8:59 AM | 0 (0.0%) | 17 (3.5%) |
| 9:00 AM to 9:59 AM | 18 (4.2%) | 46 (9.3%) |
| 10:00 AM to 10:59 AM | 40 (9.4%) | 16 (3.3%) |
| 11:00 AM to 11:59 AM | 0 (0.0%) | 0 (0.0%) |
| 12:00 PM to 3:59 PM | 10 (2.4%) | 24 (4.9%) |
| 4:00 PM to 11:59 PM | 0 (0.0%) | 60 (12.2%) |
| Total | 426 (100.0%) | 492 (100.0%) |
Housing Occupancy in Newtown borough
Occupancy by Ownership in Newtown borough
Of the total 936 dwellings in Newtown borough, owner-occupied units account for 706 (75.4%), while renter-occupied units make up 230 (24.6%).
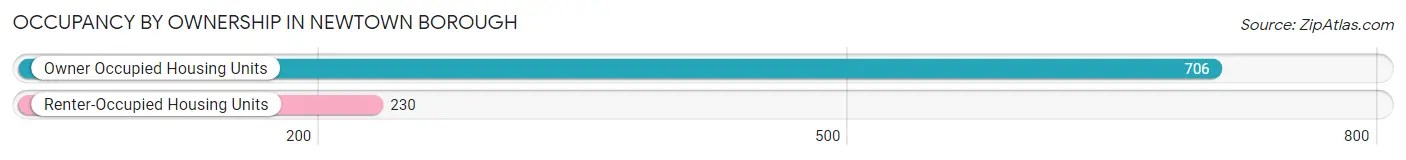
| Occupancy | # Housing Units | % Housing Units |
| Owner Occupied Housing Units | 706 | 75.4% |
| Renter-Occupied Housing Units | 230 | 24.6% |
| Total Occupied Housing Units | 936 | 100.0% |
Occupancy by Household Size in Newtown borough
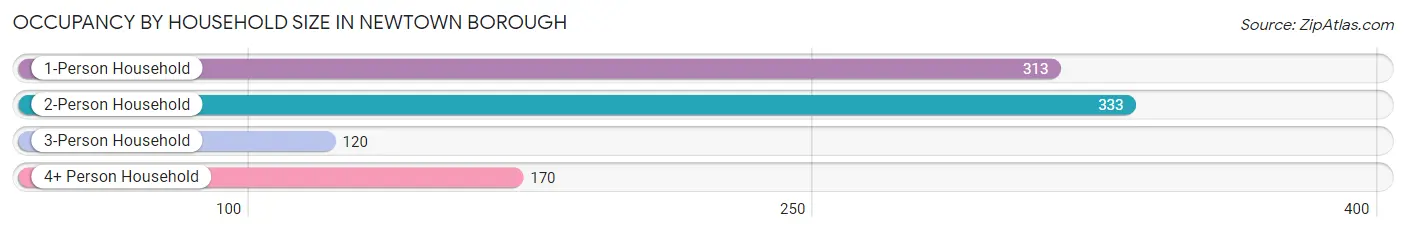
| Household Size | # Housing Units | % Housing Units |
| 1-Person Household | 313 | 33.4% |
| 2-Person Household | 333 | 35.6% |
| 3-Person Household | 120 | 12.8% |
| 4+ Person Household | 170 | 18.2% |
| Total Housing Units | 936 | 100.0% |
Occupancy by Ownership by Household Size in Newtown borough
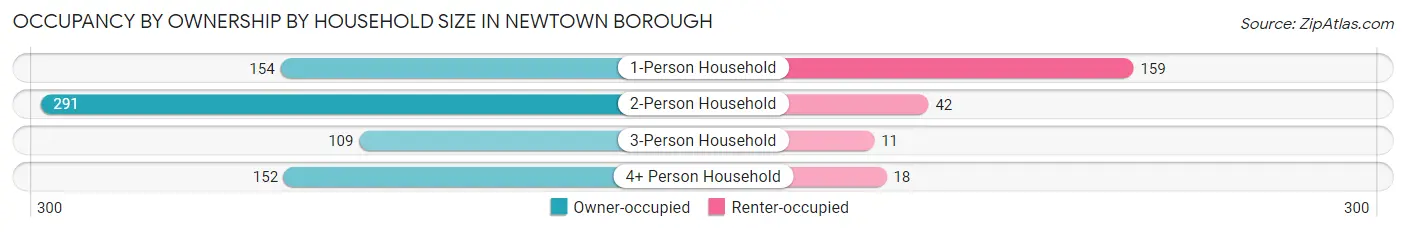
| Household Size | Owner-occupied | Renter-occupied |
| 1-Person Household | 154 (49.2%) | 159 (50.8%) |
| 2-Person Household | 291 (87.4%) | 42 (12.6%) |
| 3-Person Household | 109 (90.8%) | 11 (9.2%) |
| 4+ Person Household | 152 (89.4%) | 18 (10.6%) |
| Total Housing Units | 706 (75.4%) | 230 (24.6%) |
Occupancy by Educational Attainment in Newtown borough
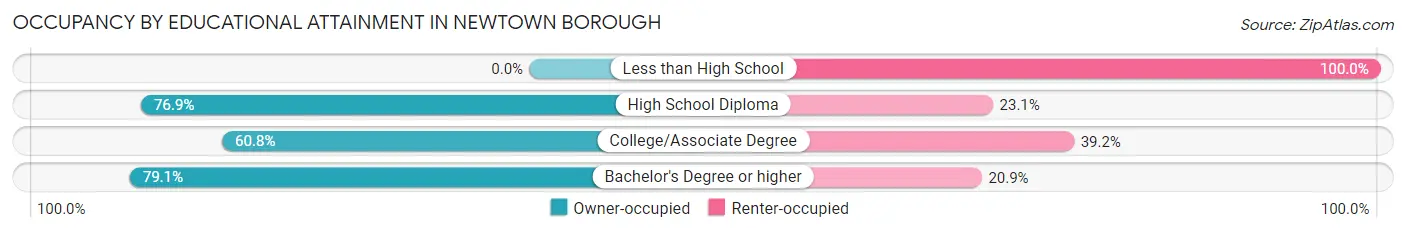
| Household Size | Owner-occupied | Renter-occupied |
| Less than High School | 0 (0.0%) | 4 (100.0%) |
| High School Diploma | 40 (76.9%) | 12 (23.1%) |
| College/Associate Degree | 101 (60.8%) | 65 (39.2%) |
| Bachelor's Degree or higher | 565 (79.1%) | 149 (20.9%) |
Occupancy by Age of Householder in Newtown borough
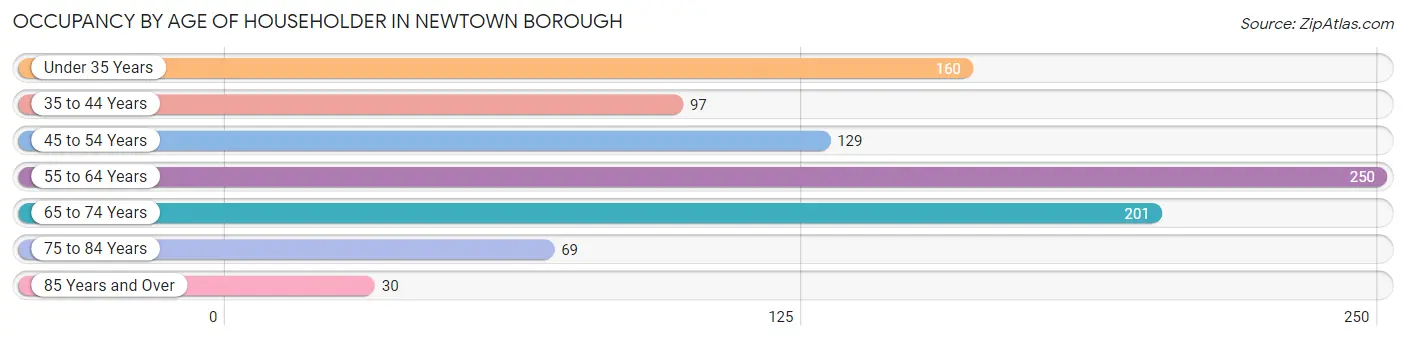
| Age Bracket | # Households | % Households |
| Under 35 Years | 160 | 17.1% |
| 35 to 44 Years | 97 | 10.4% |
| 45 to 54 Years | 129 | 13.8% |
| 55 to 64 Years | 250 | 26.7% |
| 65 to 74 Years | 201 | 21.5% |
| 75 to 84 Years | 69 | 7.4% |
| 85 Years and Over | 30 | 3.2% |
| Total | 936 | 100.0% |
Housing Finances in Newtown borough
Median Income by Occupancy in Newtown borough
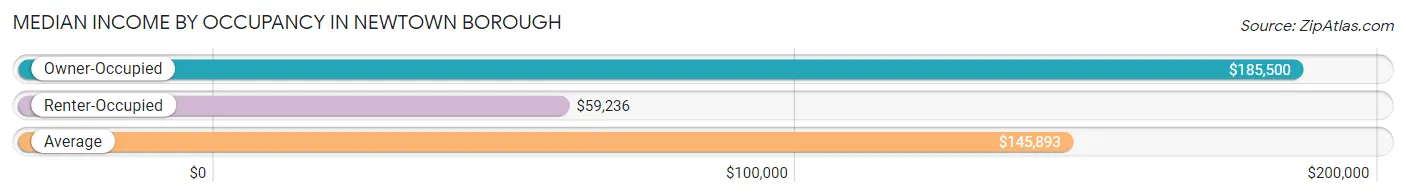
| Occupancy Type | # Households | Median Income |
| Owner-Occupied | 706 (75.4%) | $185,500 |
| Renter-Occupied | 230 (24.6%) | $59,236 |
| Average | 936 (100.0%) | $145,893 |
Occupancy by Householder Income Bracket in Newtown borough
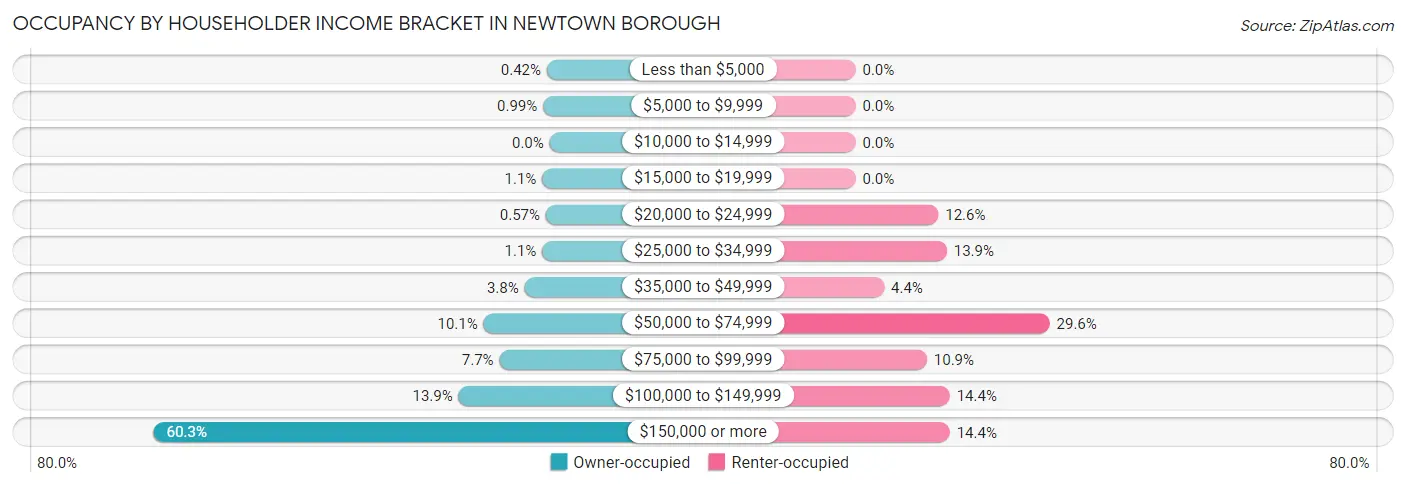
| Income Bracket | Owner-occupied | Renter-occupied |
| Less than $5,000 | 3 (0.4%) | 0 (0.0%) |
| $5,000 to $9,999 | 7 (1.0%) | 0 (0.0%) |
| $10,000 to $14,999 | 0 (0.0%) | 0 (0.0%) |
| $15,000 to $19,999 | 8 (1.1%) | 0 (0.0%) |
| $20,000 to $24,999 | 4 (0.6%) | 29 (12.6%) |
| $25,000 to $34,999 | 8 (1.1%) | 32 (13.9%) |
| $35,000 to $49,999 | 27 (3.8%) | 10 (4.3%) |
| $50,000 to $74,999 | 71 (10.1%) | 68 (29.6%) |
| $75,000 to $99,999 | 54 (7.6%) | 25 (10.9%) |
| $100,000 to $149,999 | 98 (13.9%) | 33 (14.3%) |
| $150,000 or more | 426 (60.3%) | 33 (14.3%) |
| Total | 706 (100.0%) | 230 (100.0%) |
Monthly Housing Cost Tiers in Newtown borough
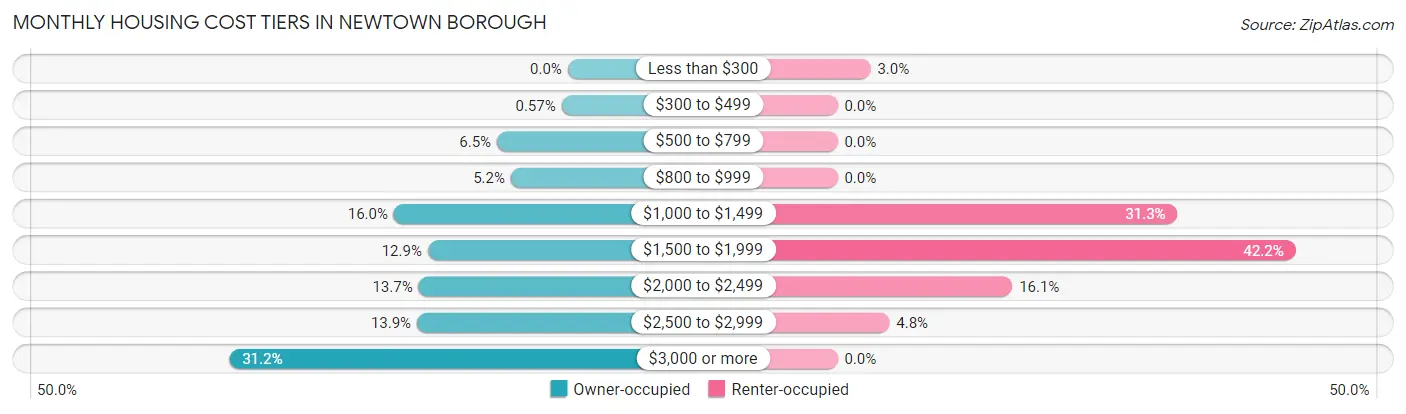
| Monthly Cost | Owner-occupied | Renter-occupied |
| Less than $300 | 0 (0.0%) | 7 (3.0%) |
| $300 to $499 | 4 (0.6%) | 0 (0.0%) |
| $500 to $799 | 46 (6.5%) | 0 (0.0%) |
| $800 to $999 | 37 (5.2%) | 0 (0.0%) |
| $1,000 to $1,499 | 113 (16.0%) | 72 (31.3%) |
| $1,500 to $1,999 | 91 (12.9%) | 97 (42.2%) |
| $2,000 to $2,499 | 97 (13.7%) | 37 (16.1%) |
| $2,500 to $2,999 | 98 (13.9%) | 11 (4.8%) |
| $3,000 or more | 220 (31.2%) | 0 (0.0%) |
| Total | 706 (100.0%) | 230 (100.0%) |
Physical Housing Characteristics in Newtown borough
Housing Structures in Newtown borough
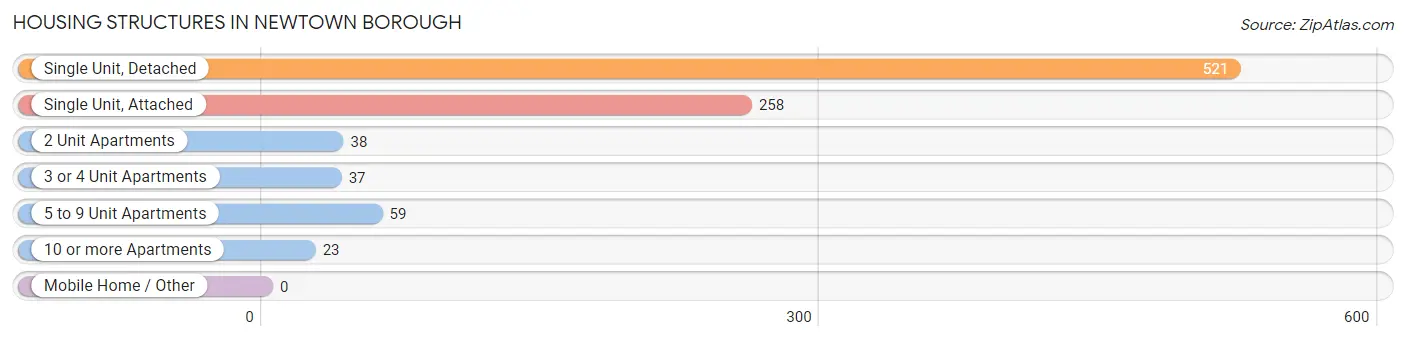
| Structure Type | # Housing Units | % Housing Units |
| Single Unit, Detached | 521 | 55.7% |
| Single Unit, Attached | 258 | 27.6% |
| 2 Unit Apartments | 38 | 4.1% |
| 3 or 4 Unit Apartments | 37 | 4.0% |
| 5 to 9 Unit Apartments | 59 | 6.3% |
| 10 or more Apartments | 23 | 2.5% |
| Mobile Home / Other | 0 | 0.0% |
| Total | 936 | 100.0% |
Housing Structures by Occupancy in Newtown borough
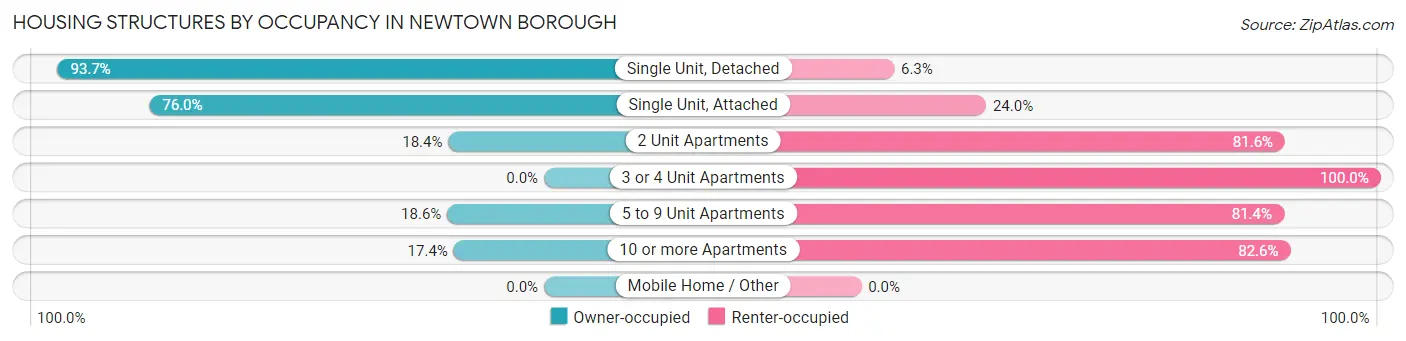
| Structure Type | Owner-occupied | Renter-occupied |
| Single Unit, Detached | 488 (93.7%) | 33 (6.3%) |
| Single Unit, Attached | 196 (76.0%) | 62 (24.0%) |
| 2 Unit Apartments | 7 (18.4%) | 31 (81.6%) |
| 3 or 4 Unit Apartments | 0 (0.0%) | 37 (100.0%) |
| 5 to 9 Unit Apartments | 11 (18.6%) | 48 (81.4%) |
| 10 or more Apartments | 4 (17.4%) | 19 (82.6%) |
| Mobile Home / Other | 0 (0.0%) | 0 (0.0%) |
| Total | 706 (75.4%) | 230 (24.6%) |
Housing Structures by Number of Rooms in Newtown borough
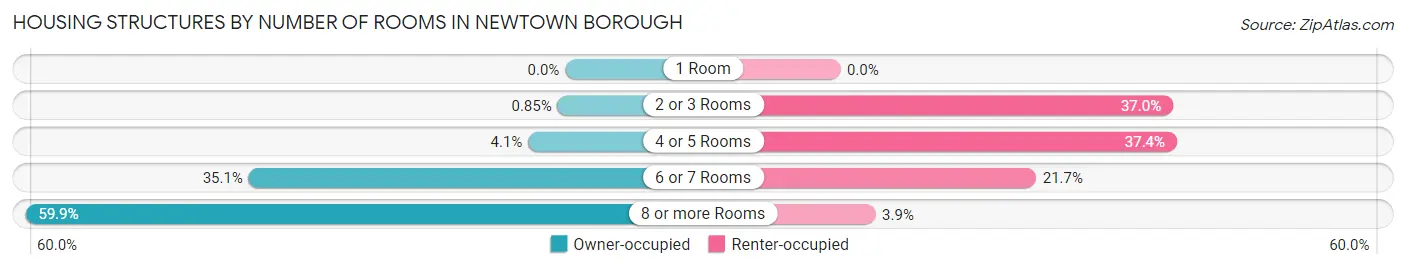
| Number of Rooms | Owner-occupied | Renter-occupied |
| 1 Room | 0 (0.0%) | 0 (0.0%) |
| 2 or 3 Rooms | 6 (0.9%) | 85 (37.0%) |
| 4 or 5 Rooms | 29 (4.1%) | 86 (37.4%) |
| 6 or 7 Rooms | 248 (35.1%) | 50 (21.7%) |
| 8 or more Rooms | 423 (59.9%) | 9 (3.9%) |
| Total | 706 (100.0%) | 230 (100.0%) |
Housing Structure by Heating Type in Newtown borough
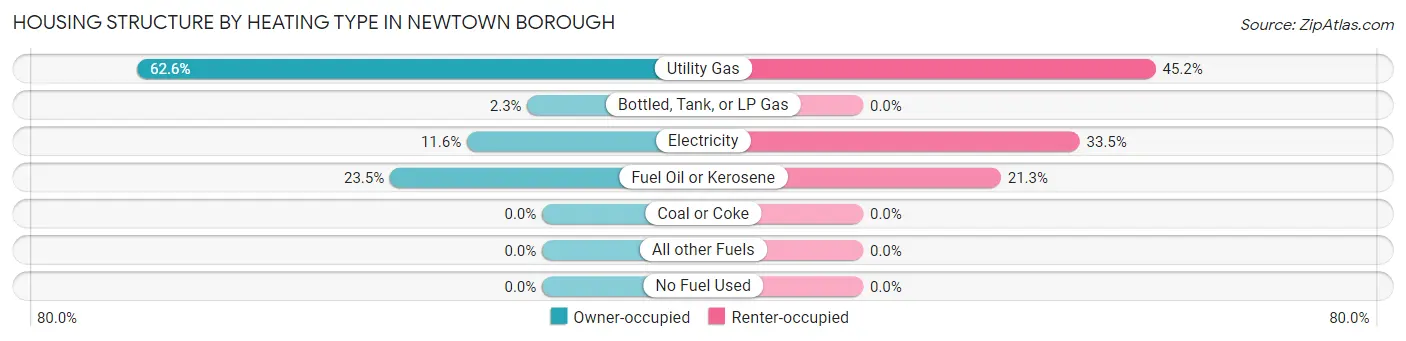
| Heating Type | Owner-occupied | Renter-occupied |
| Utility Gas | 442 (62.6%) | 104 (45.2%) |
| Bottled, Tank, or LP Gas | 16 (2.3%) | 0 (0.0%) |
| Electricity | 82 (11.6%) | 77 (33.5%) |
| Fuel Oil or Kerosene | 166 (23.5%) | 49 (21.3%) |
| Coal or Coke | 0 (0.0%) | 0 (0.0%) |
| All other Fuels | 0 (0.0%) | 0 (0.0%) |
| No Fuel Used | 0 (0.0%) | 0 (0.0%) |
| Total | 706 (100.0%) | 230 (100.0%) |
Household Vehicle Usage in Newtown borough
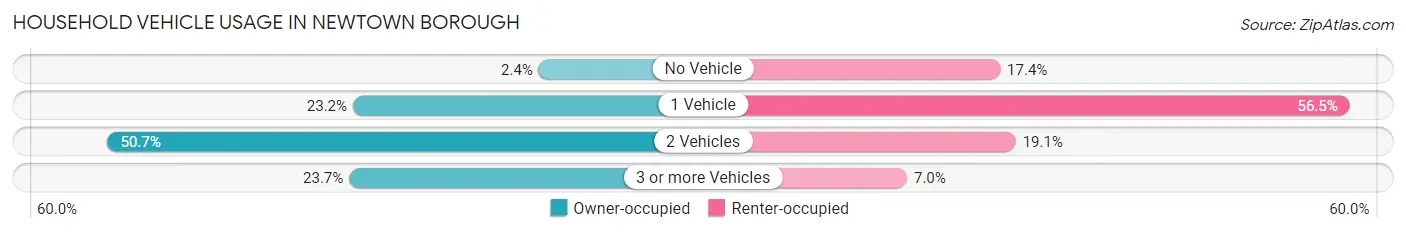
| Vehicles per Household | Owner-occupied | Renter-occupied |
| No Vehicle | 17 (2.4%) | 40 (17.4%) |
| 1 Vehicle | 164 (23.2%) | 130 (56.5%) |
| 2 Vehicles | 358 (50.7%) | 44 (19.1%) |
| 3 or more Vehicles | 167 (23.6%) | 16 (7.0%) |
| Total | 706 (100.0%) | 230 (100.0%) |
Real Estate & Mortgages in Newtown borough
Real Estate and Mortgage Overview in Newtown borough
| Characteristic | Without Mortgage | With Mortgage |
| Housing Units | 231 | 475 |
| Median Property Value | $792,300 | $642,900 |
| Median Household Income | $185,398 | $299 |
| Monthly Housing Costs | $1,323 | $220 |
| Real Estate Taxes | $7,275 | $9 |
Property Value by Mortgage Status in Newtown borough
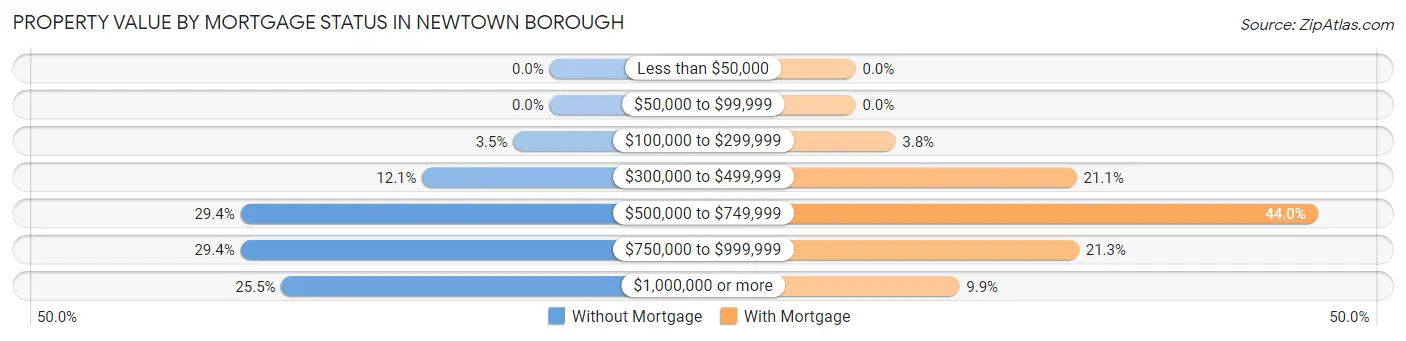
| Property Value | Without Mortgage | With Mortgage |
| Less than $50,000 | 0 (0.0%) | 0 (0.0%) |
| $50,000 to $99,999 | 0 (0.0%) | 0 (0.0%) |
| $100,000 to $299,999 | 8 (3.5%) | 18 (3.8%) |
| $300,000 to $499,999 | 28 (12.1%) | 100 (21.0%) |
| $500,000 to $749,999 | 68 (29.4%) | 209 (44.0%) |
| $750,000 to $999,999 | 68 (29.4%) | 101 (21.3%) |
| $1,000,000 or more | 59 (25.5%) | 47 (9.9%) |
| Total | 231 (100.0%) | 475 (100.0%) |
Household Income by Mortgage Status in Newtown borough
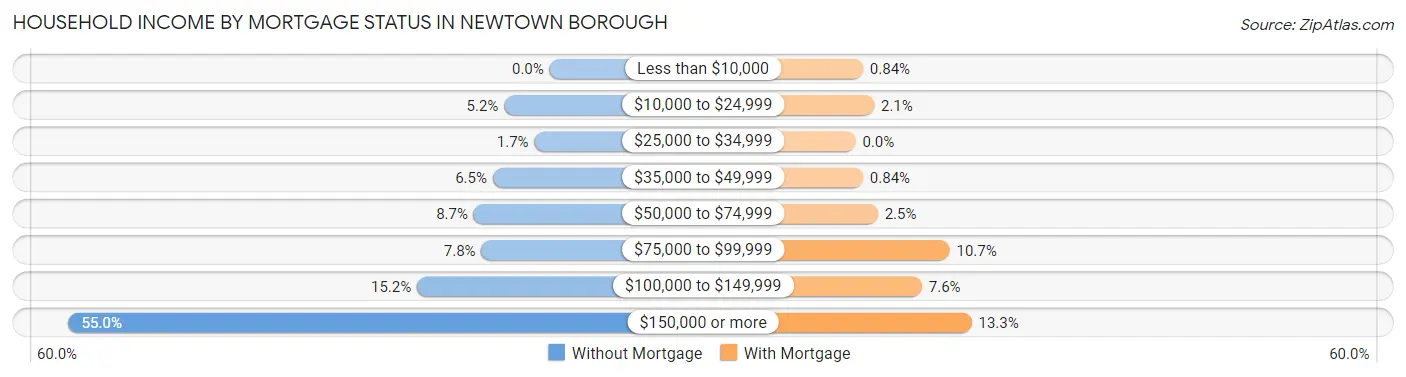
| Household Income | Without Mortgage | With Mortgage |
| Less than $10,000 | 0 (0.0%) | 4 (0.8%) |
| $10,000 to $24,999 | 12 (5.2%) | 10 (2.1%) |
| $25,000 to $34,999 | 4 (1.7%) | 0 (0.0%) |
| $35,000 to $49,999 | 15 (6.5%) | 4 (0.8%) |
| $50,000 to $74,999 | 20 (8.7%) | 12 (2.5%) |
| $75,000 to $99,999 | 18 (7.8%) | 51 (10.7%) |
| $100,000 to $149,999 | 35 (15.1%) | 36 (7.6%) |
| $150,000 or more | 127 (55.0%) | 63 (13.3%) |
| Total | 231 (100.0%) | 475 (100.0%) |
Property Value to Household Income Ratio in Newtown borough
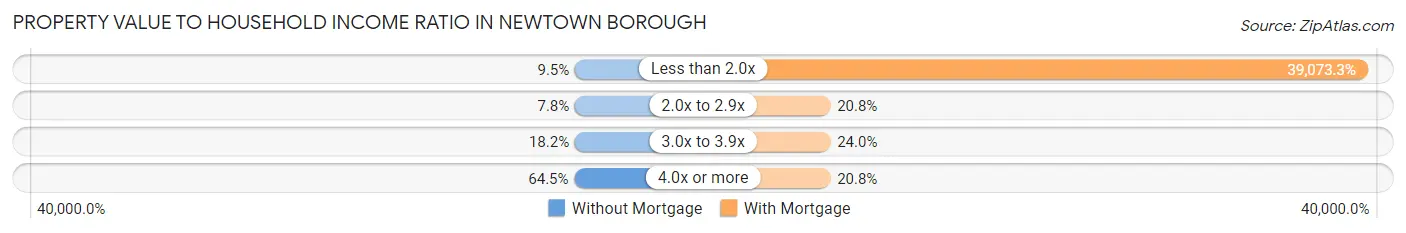
| Value-to-Income Ratio | Without Mortgage | With Mortgage |
| Less than 2.0x | 22 (9.5%) | 185,598 (39,073.3%) |
| 2.0x to 2.9x | 18 (7.8%) | 99 (20.8%) |
| 3.0x to 3.9x | 42 (18.2%) | 114 (24.0%) |
| 4.0x or more | 149 (64.5%) | 99 (20.8%) |
| Total | 231 (100.0%) | 475 (100.0%) |
Real Estate Taxes by Mortgage Status in Newtown borough
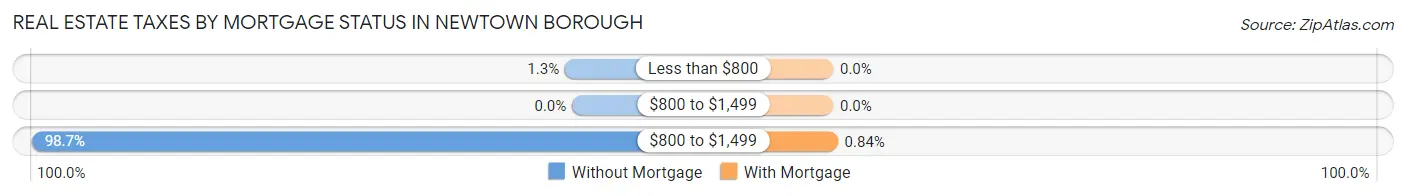
| Property Taxes | Without Mortgage | With Mortgage |
| Less than $800 | 3 (1.3%) | 0 (0.0%) |
| $800 to $1,499 | 0 (0.0%) | 0 (0.0%) |
| $800 to $1,499 | 228 (98.7%) | 4 (0.8%) |
| Total | 231 (100.0%) | 475 (100.0%) |
Health & Disability in Newtown borough
Health Insurance Coverage by Age in Newtown borough
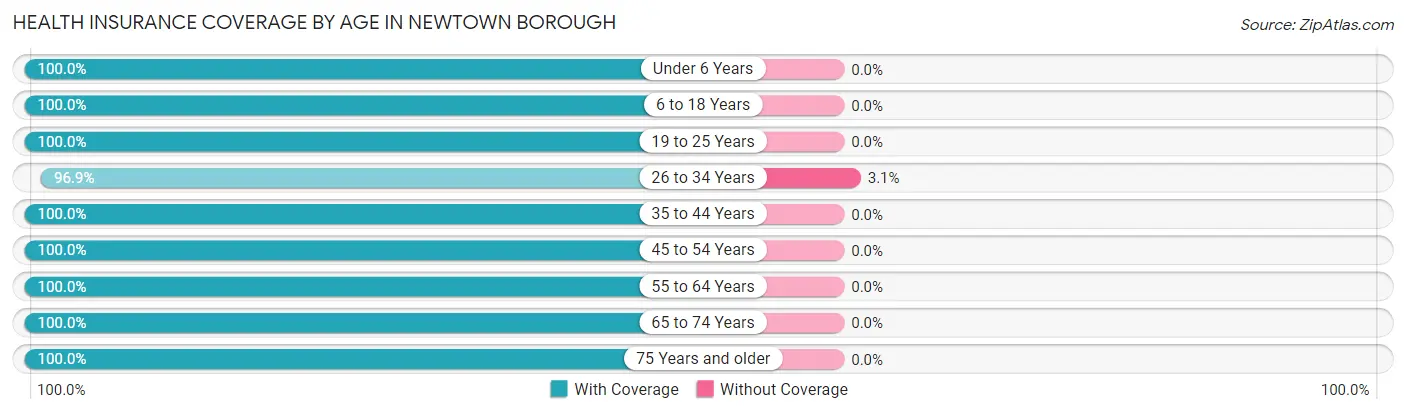
| Age Bracket | With Coverage | Without Coverage |
| Under 6 Years | 206 (100.0%) | 0 (0.0%) |
| 6 to 18 Years | 206 (100.0%) | 0 (0.0%) |
| 19 to 25 Years | 153 (100.0%) | 0 (0.0%) |
| 26 to 34 Years | 252 (96.9%) | 8 (3.1%) |
| 35 to 44 Years | 221 (100.0%) | 0 (0.0%) |
| 45 to 54 Years | 229 (100.0%) | 0 (0.0%) |
| 55 to 64 Years | 437 (100.0%) | 0 (0.0%) |
| 65 to 74 Years | 301 (100.0%) | 0 (0.0%) |
| 75 Years and older | 156 (100.0%) | 0 (0.0%) |
| Total | 2,161 (99.6%) | 8 (0.4%) |
Health Insurance Coverage by Citizenship Status in Newtown borough
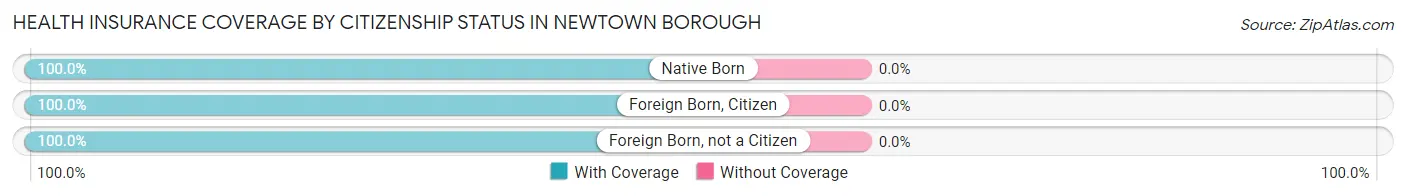
| Citizenship Status | With Coverage | Without Coverage |
| Native Born | 206 (100.0%) | 0 (0.0%) |
| Foreign Born, Citizen | 206 (100.0%) | 0 (0.0%) |
| Foreign Born, not a Citizen | 153 (100.0%) | 0 (0.0%) |
Health Insurance Coverage by Household Income in Newtown borough
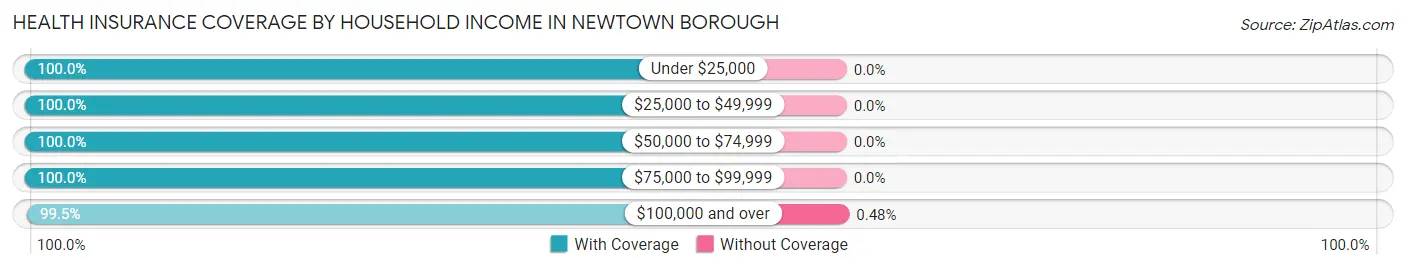
| Household Income | With Coverage | Without Coverage |
| Under $25,000 | 51 (100.0%) | 0 (0.0%) |
| $25,000 to $49,999 | 107 (100.0%) | 0 (0.0%) |
| $50,000 to $74,999 | 168 (100.0%) | 0 (0.0%) |
| $75,000 to $99,999 | 174 (100.0%) | 0 (0.0%) |
| $100,000 and over | 1,661 (99.5%) | 8 (0.5%) |
Public vs Private Health Insurance Coverage by Age in Newtown borough
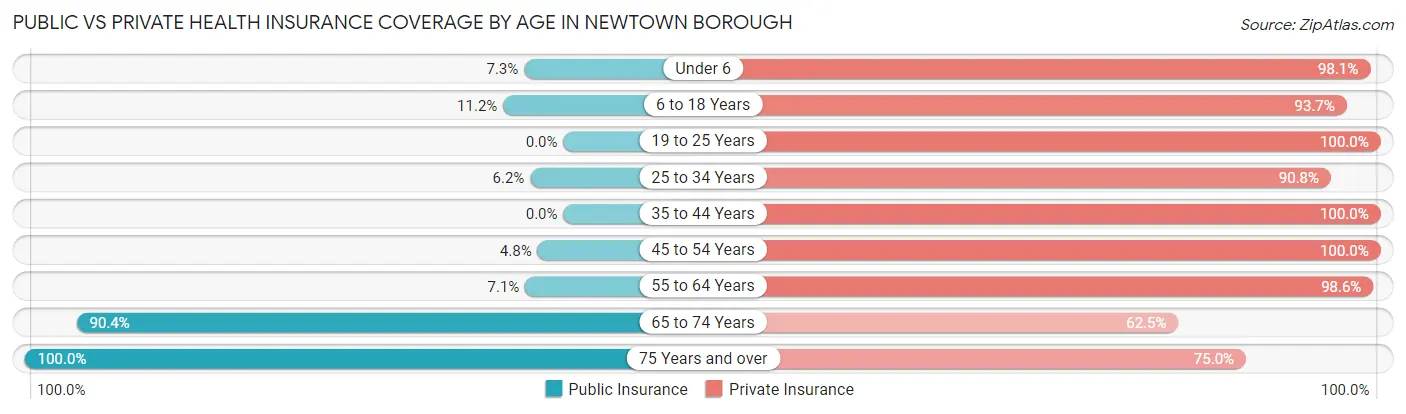
| Age Bracket | Public Insurance | Private Insurance |
| Under 6 | 15 (7.3%) | 202 (98.1%) |
| 6 to 18 Years | 23 (11.2%) | 193 (93.7%) |
| 19 to 25 Years | 0 (0.0%) | 153 (100.0%) |
| 25 to 34 Years | 16 (6.1%) | 236 (90.8%) |
| 35 to 44 Years | 0 (0.0%) | 221 (100.0%) |
| 45 to 54 Years | 11 (4.8%) | 229 (100.0%) |
| 55 to 64 Years | 31 (7.1%) | 431 (98.6%) |
| 65 to 74 Years | 272 (90.4%) | 188 (62.5%) |
| 75 Years and over | 156 (100.0%) | 117 (75.0%) |
| Total | 524 (24.2%) | 1,970 (90.8%) |
Disability Status by Sex by Age in Newtown borough
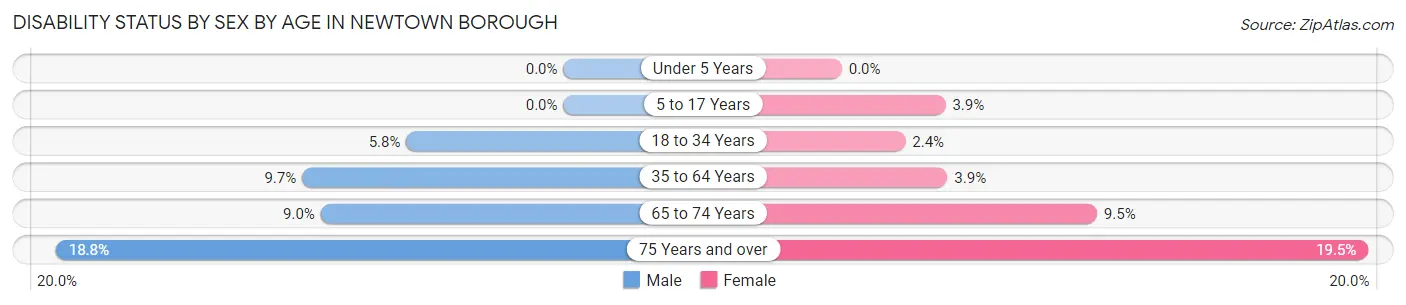
| Age Bracket | Male | Female |
| Under 5 Years | 0 (0.0%) | 0 (0.0%) |
| 5 to 17 Years | 0 (0.0%) | 4 (3.8%) |
| 18 to 34 Years | 12 (5.8%) | 6 (2.4%) |
| 35 to 64 Years | 39 (9.7%) | 19 (3.9%) |
| 65 to 74 Years | 10 (9.0%) | 18 (9.5%) |
| 75 Years and over | 13 (18.8%) | 17 (19.5%) |
Disability Class by Sex by Age in Newtown borough
Disability Class: Hearing Difficulty
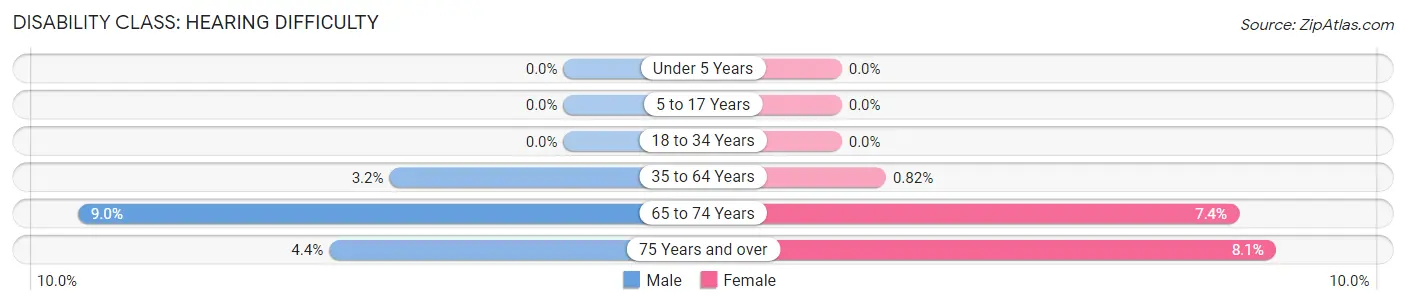
| Age Bracket | Male | Female |
| Under 5 Years | 0 (0.0%) | 0 (0.0%) |
| 5 to 17 Years | 0 (0.0%) | 0 (0.0%) |
| 18 to 34 Years | 0 (0.0%) | 0 (0.0%) |
| 35 to 64 Years | 13 (3.2%) | 4 (0.8%) |
| 65 to 74 Years | 10 (9.0%) | 14 (7.4%) |
| 75 Years and over | 3 (4.3%) | 7 (8.1%) |
Disability Class: Vision Difficulty
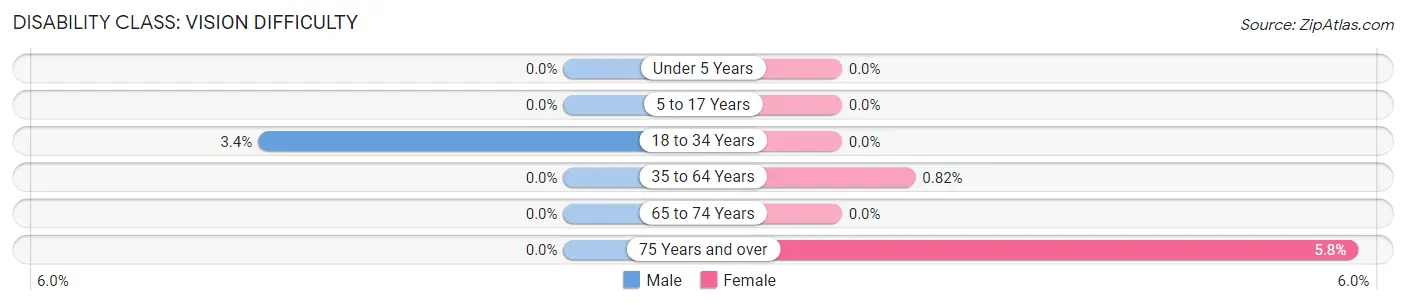
| Age Bracket | Male | Female |
| Under 5 Years | 0 (0.0%) | 0 (0.0%) |
| 5 to 17 Years | 0 (0.0%) | 0 (0.0%) |
| 18 to 34 Years | 7 (3.4%) | 0 (0.0%) |
| 35 to 64 Years | 0 (0.0%) | 4 (0.8%) |
| 65 to 74 Years | 0 (0.0%) | 0 (0.0%) |
| 75 Years and over | 0 (0.0%) | 5 (5.8%) |
Disability Class: Cognitive Difficulty
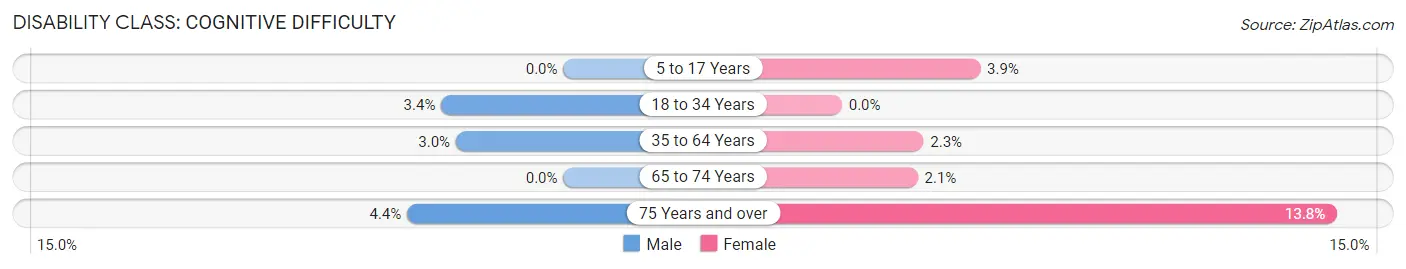
| Age Bracket | Male | Female |
| 5 to 17 Years | 0 (0.0%) | 4 (3.8%) |
| 18 to 34 Years | 7 (3.4%) | 0 (0.0%) |
| 35 to 64 Years | 12 (3.0%) | 11 (2.3%) |
| 65 to 74 Years | 0 (0.0%) | 4 (2.1%) |
| 75 Years and over | 3 (4.3%) | 12 (13.8%) |
Disability Class: Ambulatory Difficulty
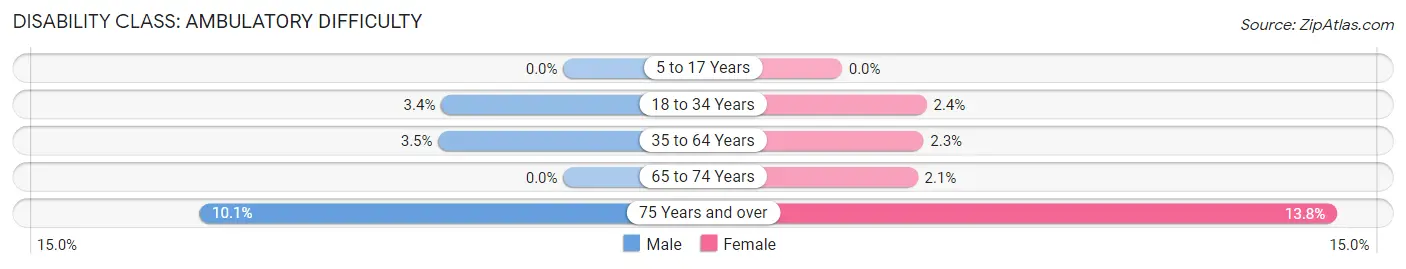
| Age Bracket | Male | Female |
| 5 to 17 Years | 0 (0.0%) | 0 (0.0%) |
| 18 to 34 Years | 7 (3.4%) | 6 (2.4%) |
| 35 to 64 Years | 14 (3.5%) | 11 (2.3%) |
| 65 to 74 Years | 0 (0.0%) | 4 (2.1%) |
| 75 Years and over | 7 (10.1%) | 12 (13.8%) |
Disability Class: Self-Care Difficulty
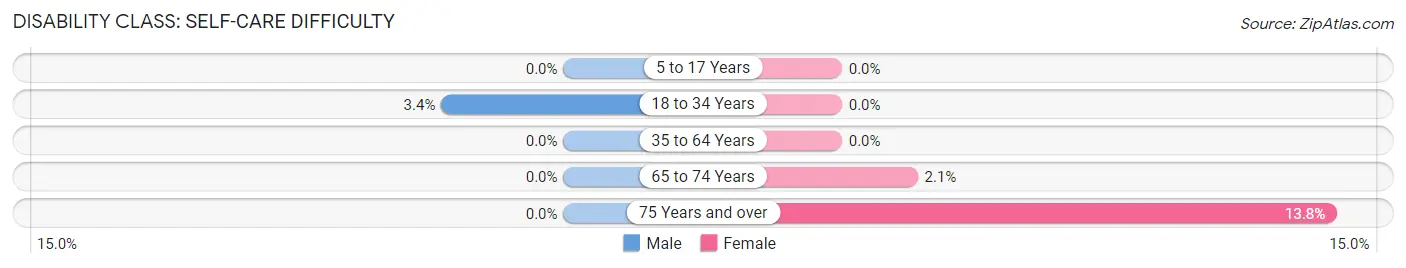
| Age Bracket | Male | Female |
| 5 to 17 Years | 0 (0.0%) | 0 (0.0%) |
| 18 to 34 Years | 7 (3.4%) | 0 (0.0%) |
| 35 to 64 Years | 0 (0.0%) | 0 (0.0%) |
| 65 to 74 Years | 0 (0.0%) | 4 (2.1%) |
| 75 Years and over | 0 (0.0%) | 12 (13.8%) |
Technology Access in Newtown borough
Computing Device Access in Newtown borough
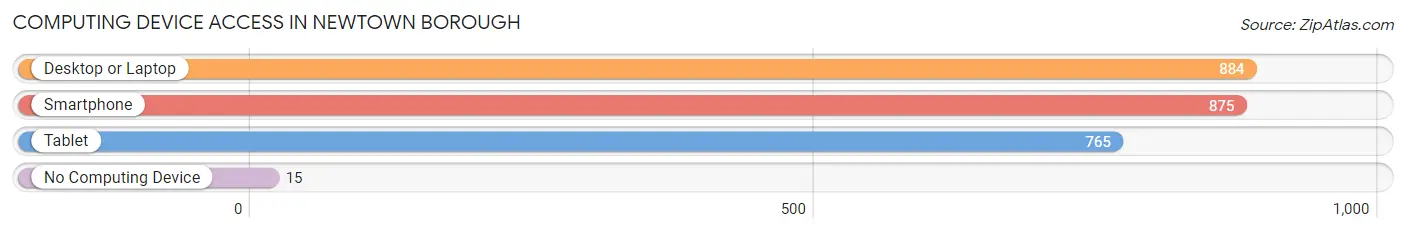
| Device Type | # Households | % Households |
| Desktop or Laptop | 884 | 94.4% |
| Smartphone | 875 | 93.5% |
| Tablet | 765 | 81.7% |
| No Computing Device | 15 | 1.6% |
| Total | 936 | 100.0% |
Internet Access in Newtown borough
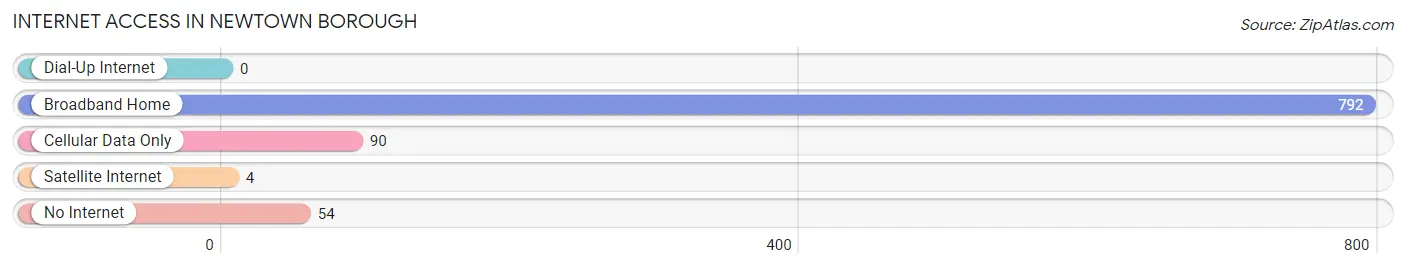
| Internet Type | # Households | % Households |
| Dial-Up Internet | 0 | 0.0% |
| Broadband Home | 792 | 84.6% |
| Cellular Data Only | 90 | 9.6% |
| Satellite Internet | 4 | 0.4% |
| No Internet | 54 | 5.8% |
| Total | 936 | 100.0% |
Newtown borough Summary
Newtown Borough is a small borough located in Bucks County, Pennsylvania. It is situated approximately 25 miles north of Philadelphia and is part of the larger Philadelphia metropolitan area. The borough is home to a population of 2,252 people, according to the 2010 census.
History
Newtown Borough was founded in 1711 by William Penn, who named it after his hometown of Newtown, Wales. The borough was originally part of Bucks County, but was incorporated as a separate borough in 1838. The borough was originally a farming community, but in the late 19th century, it began to develop into a residential suburb of Philadelphia.
Geography
Newtown Borough is located in Bucks County, Pennsylvania, approximately 25 miles north of Philadelphia. It is situated in the Delaware Valley, which is part of the larger Philadelphia metropolitan area. The borough is bordered by the townships of Northampton, Upper Makefield, and Lower Makefield. The borough covers an area of 1.2 square miles, and is home to a population of 2,252 people, according to the 2010 census.
The borough is situated on the banks of the Neshaminy Creek, which flows through the borough and is a tributary of the Delaware River. The borough is also home to several parks, including Tyler State Park, which is located on the banks of the Neshaminy Creek.
Economy
Newtown Borough is primarily a residential community, and the majority of its residents are employed in the service sector. The borough is home to several small businesses, including restaurants, retail stores, and professional services. The borough is also home to several large employers, including the Newtown Business Center, which is a business park that houses several corporate offices.
Demographics
According to the 2010 census, the population of Newtown Borough was 2,252 people. The racial makeup of the borough was 94.3% White, 2.2% African American, 0.3% Native American, 1.2% Asian, 0.1% Pacific Islander, 0.7% from other races, and 1.4% from two or more races. Hispanic or Latino of any race were 2.2% of the population.
The median household income in the borough was $76,944, and the median family income was $90,917. The per capita income for the borough was $35,945. About 4.2% of families and 5.3% of the population were below the poverty line, including 6.2% of those under age 18 and 4.2% of those age 65 or over.
Conclusion
Newtown Borough is a small borough located in Bucks County, Pennsylvania. It is situated approximately 25 miles north of Philadelphia and is part of the larger Philadelphia metropolitan area. The borough was founded in 1711 by William Penn and was originally a farming community. Today, it is primarily a residential community, and the majority of its residents are employed in the service sector. According to the 2010 census, the population of Newtown Borough was 2,252 people, and the median household income was $76,944.
Common Questions
What is Per Capita Income in Newtown borough?
Per Capita income in Newtown borough is $89,189.
What is the Median Family Income in Newtown borough?
Median Family Income in Newtown borough is $187,278.
What is the Median Household income in Newtown borough?
Median Household Income in Newtown borough is $145,893.
What is Income or Wage Gap in Newtown borough?
Income or Wage Gap in Newtown borough is 35.7%.
Women in Newtown borough earn 64.3 cents for every dollar earned by a man.
What is Inequality or Gini Index in Newtown borough?
Inequality or Gini Index in Newtown borough is 0.47.
What is the Total Population of Newtown borough?
Total Population of Newtown borough is 2,169.
What is the Total Male Population of Newtown borough?
Total Male Population of Newtown borough is 941.
What is the Total Female Population of Newtown borough?
Total Female Population of Newtown borough is 1,228.
What is the Ratio of Males per 100 Females in Newtown borough?
There are 76.63 Males per 100 Females in Newtown borough.
What is the Ratio of Females per 100 Males in Newtown borough?
There are 130.50 Females per 100 Males in Newtown borough.
What is the Median Population Age in Newtown borough?
Median Population Age in Newtown borough is 48.1 Years.
What is the Average Family Size in Newtown borough
Average Family Size in Newtown borough is 3.0 People.
What is the Average Household Size in Newtown borough
Average Household Size in Newtown borough is 2.3 People.
How Large is the Labor Force in Newtown borough?
There are 1,216 People in the Labor Forcein in Newtown borough.
What is the Percentage of People in the Labor Force in Newtown borough?
65.8% of People are in the Labor Force in Newtown borough.
What is the Unemployment Rate in Newtown borough?
Unemployment Rate in Newtown borough is 3.1%.