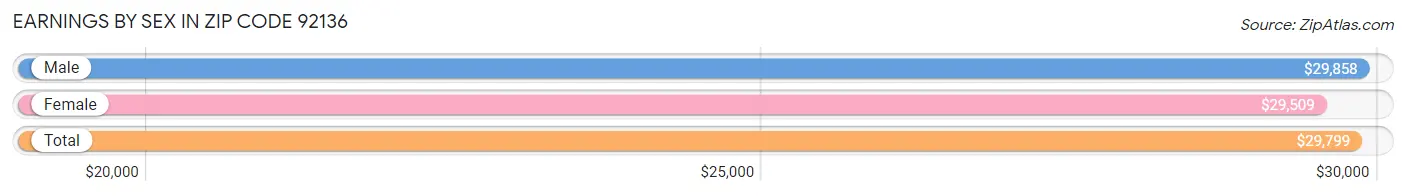
Average Earnings in Zip Code 92136 are $29,799, $29,858 for men and $29,509 for women, a difference of 1.2%.
Sex
Number
Average Earnings
Male
7,614 (79.5%)
$29,858
Female
1,965 (20.5%)
$29,509
Total
9,579 (100.0%)
$29,799
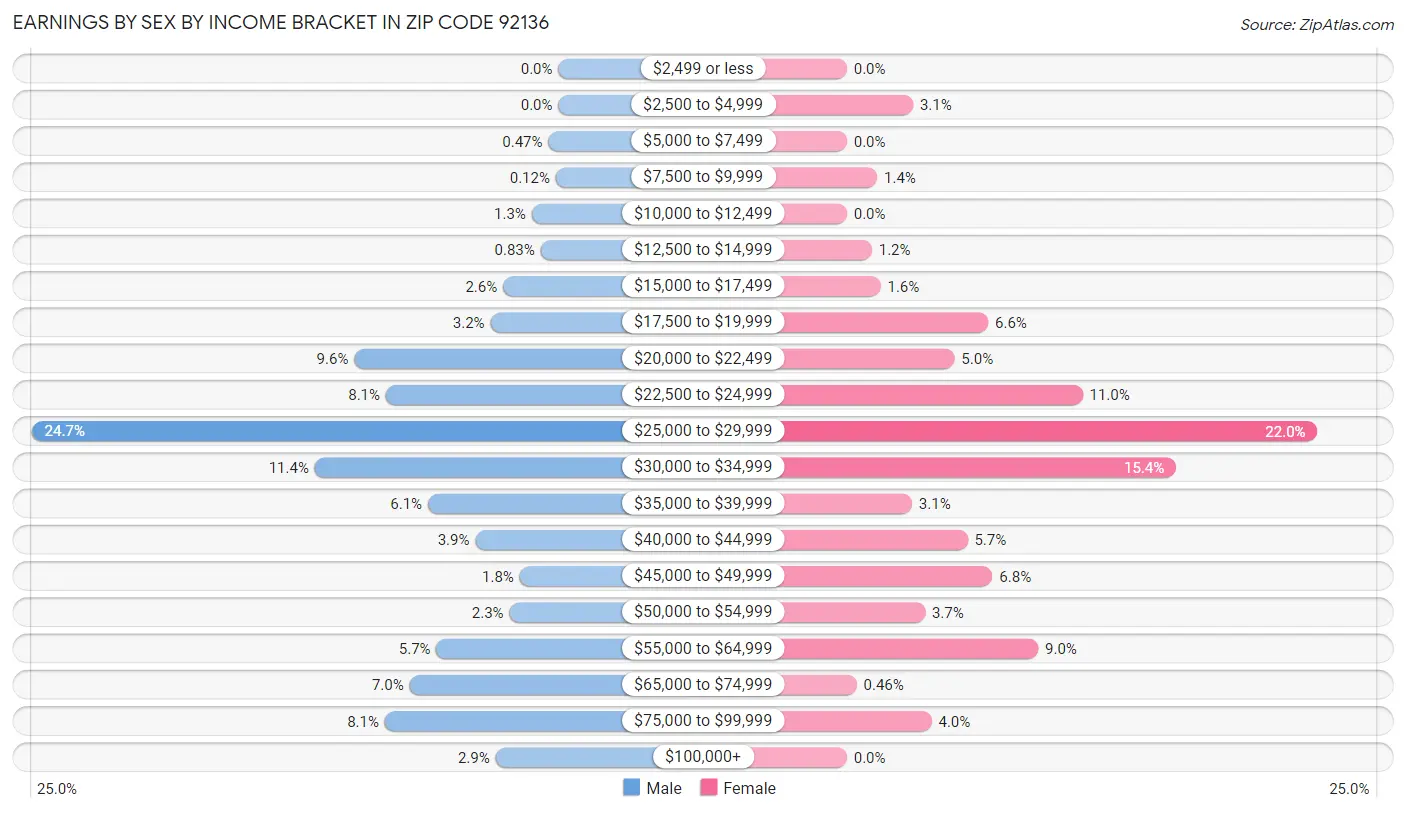
Earnings by Sex by Income Bracket in Zip Code 92136
The most common earnings brackets in Zip Code 92136 are $25,000 to $29,999 for men (1,878 | 24.7%) and $25,000 to $29,999 for women (433 | 22.0%).
Income
Male
Female
$2,499 or less
0 (0.0%)
0 (0.0%)
$2,500 to $4,999
0 (0.0%)
61 (3.1%)
$5,000 to $7,499
36 (0.5%)
0 (0.0%)
$7,500 to $9,999
9 (0.1%)
28 (1.4%)
$10,000 to $12,499
95 (1.3%)
0 (0.0%)
$12,500 to $14,999
63 (0.8%)
23 (1.2%)
$15,000 to $17,499
197 (2.6%)
31 (1.6%)
$17,500 to $19,999
242 (3.2%)
130 (6.6%)
$20,000 to $22,499
728 (9.6%)
99 (5.0%)
$22,500 to $24,999
615 (8.1%)
217 (11.0%)
$25,000 to $29,999
1,878 (24.7%)
433 (22.0%)
$30,000 to $34,999
869 (11.4%)
303 (15.4%)
$35,000 to $39,999
465 (6.1%)
60 (3.0%)
$40,000 to $44,999
296 (3.9%)
111 (5.7%)
$45,000 to $49,999
138 (1.8%)
134 (6.8%)
$50,000 to $54,999
174 (2.3%)
72 (3.7%)
$55,000 to $64,999
435 (5.7%)
176 (9.0%)
$65,000 to $74,999
531 (7.0%)
9 (0.5%)
$75,000 to $99,999
619 (8.1%)
78 (4.0%)
$100,000+
224 (2.9%)
0 (0.0%)
Total
7,614 (100.0%)
1,965 (100.0%)
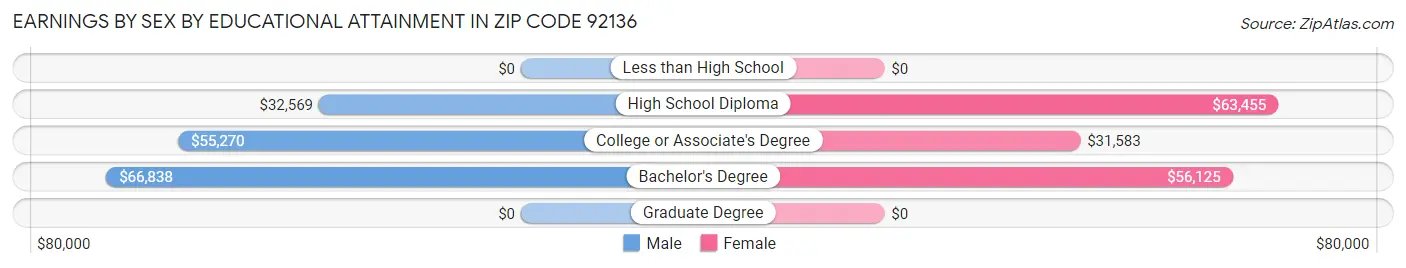
Earnings by Sex by Educational Attainment in Zip Code 92136
Average earnings in Zip Code 92136 are $53,020 for men and $39,857 for women, a difference of 24.8%. Men with an educational attainment of bachelor's degree enjoy the highest average annual earnings of $66,838, while those with high school diploma education earn the least with $32,569. Women with an educational attainment of high school diploma earn the most with the average annual earnings of $63,455, while those with college or associate's degree education have the smallest earnings of $31,583.
Educational Attainment
Male Income
Female Income
Less than High School
-
-
High School Diploma
$32,569
$63,455
College or Associate's Degree
$55,270
$31,583
Bachelor's Degree
$66,838
$56,125
Graduate Degree
-
-
Total
$53,020
$39,857
Family Income in Zip Code 92136
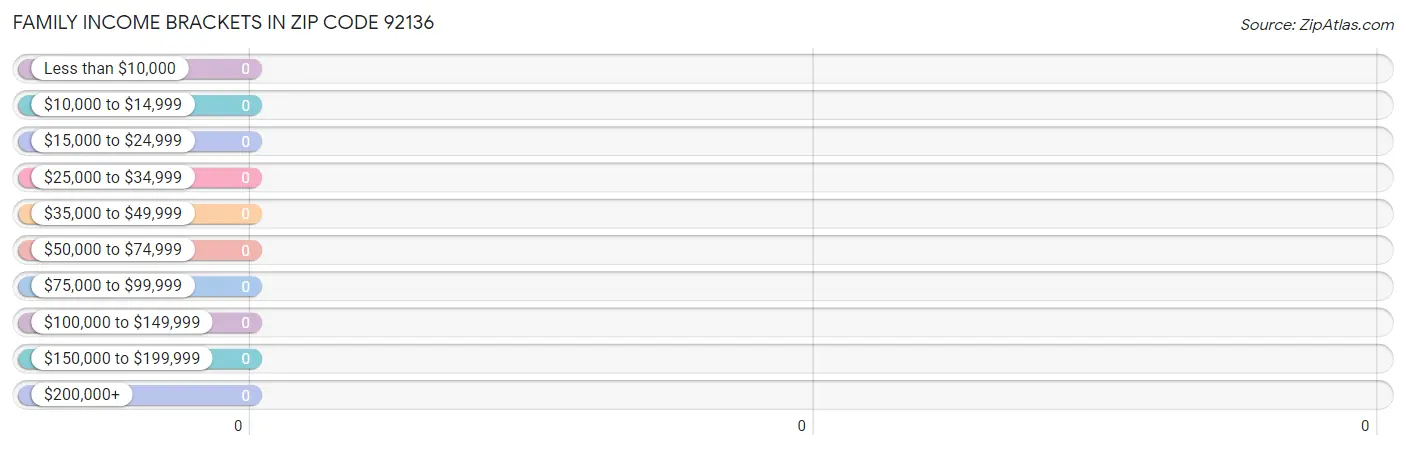
Family Income Brackets in Zip Code 92136
Income Bracket
# Families
% Families
Less than $10,000
0
0.0%
$10,000 to $14,999
0
0.0%
$15,000 to $24,999
0
0.0%
$25,000 to $34,999
0
0.0%
$35,000 to $49,999
0
0.0%
$50,000 to $74,999
0
0.0%
$75,000 to $99,999
0
0.0%
$100,000 to $149,999
0
0.0%
$150,000 to $199,999
0
0.0%
$200,000+
0
0.0%
Family Income by Famaliy Size in Zip Code 92136
Income Bracket
# Families
Median Income
2-Person Families
0 (0.0%)
$0
3-Person Families
0 (0.0%)
$0
4-Person Families
0 (0.0%)
$0
5-Person Families
0 (0.0%)
$0
6-Person Families
0 (0.0%)
$0
7+ Person Families
0 (0.0%)
$0
Total
0 (0.0%)
$0
Family Income by Number of Earners in Zip Code 92136
Number of Earners
# Families
Median Income
No Earners
0 (0.0%)
$0
1 Earner
0 (0.0%)
$0
2 Earners
0 (0.0%)
$0
3+ Earners
0 (0.0%)
$0
Total
0 (0.0%)
$0
Household Income in Zip Code 92136
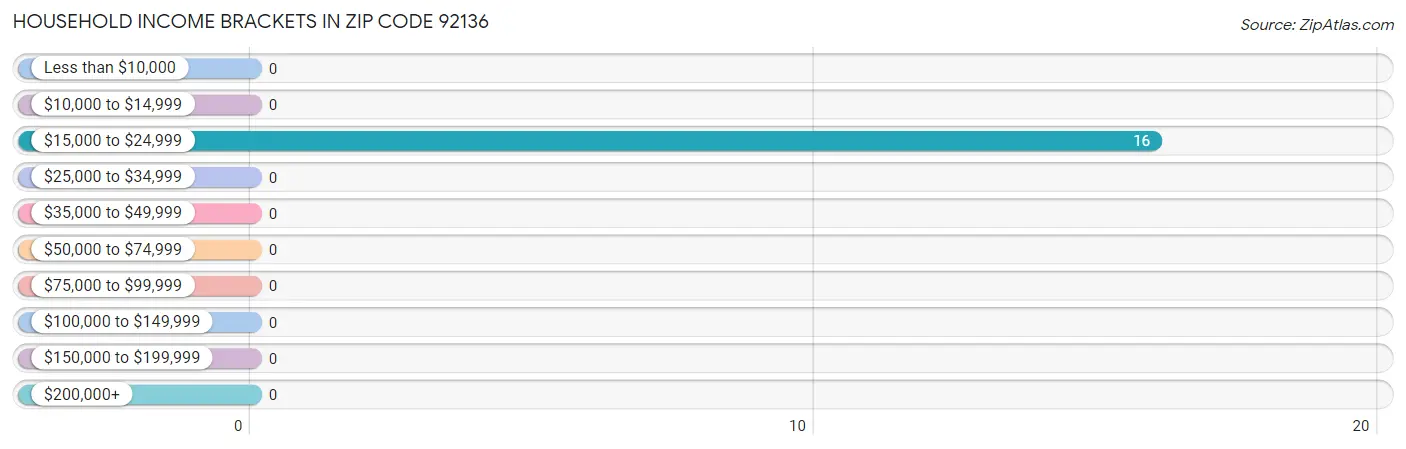
Household Income Brackets in Zip Code 92136
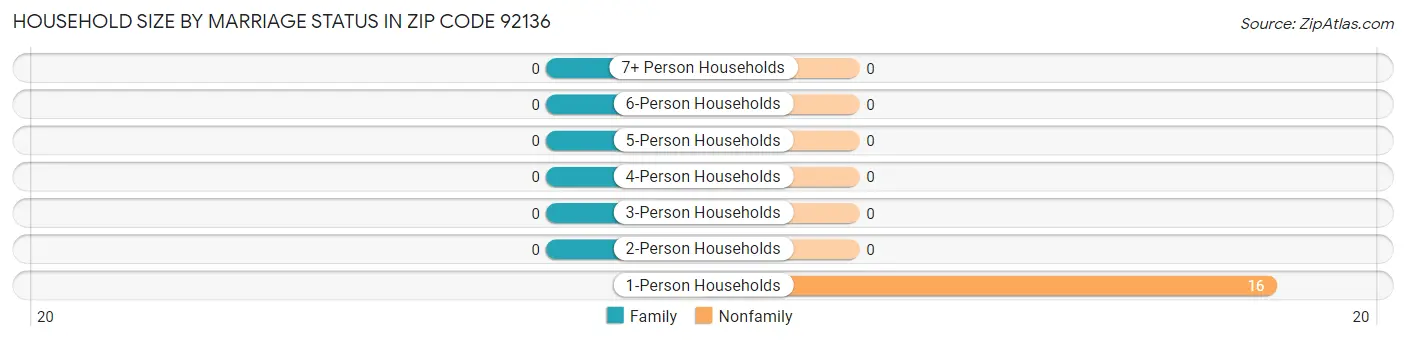
With 16 households falling in the category, the $15,000 to $24,999 income range is the most frequent in Zip Code 92136, accounting for 100.0% of all households.
Income Bracket
# Households
% Households
Less than $10,000
0
0.0%
$10,000 to $14,999
0
0.0%
$15,000 to $24,999
16
100.0%
$25,000 to $34,999
0
0.0%
$35,000 to $49,999
0
0.0%
$50,000 to $74,999
0
0.0%
$75,000 to $99,999
0
0.0%
$100,000 to $149,999
0
0.0%
$150,000 to $199,999
0
0.0%
$200,000+
0
0.0%
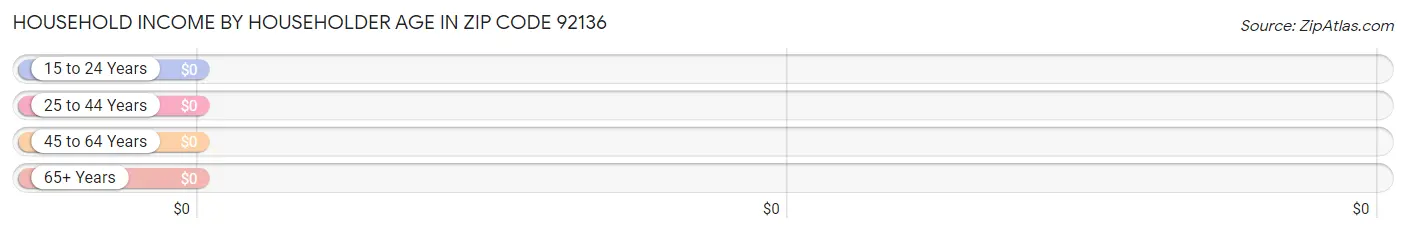
Household Income by Householder Age in Zip Code 92136
Income Bracket
# Households
Median Income
15 to 24 Years
0 (0.0%)
$0
25 to 44 Years
16 (100.0%)
$0
45 to 64 Years
0 (0.0%)
$0
65+ Years
0 (0.0%)
$0
Total
16 (100.0%)
$0
Poverty in Zip Code 92136
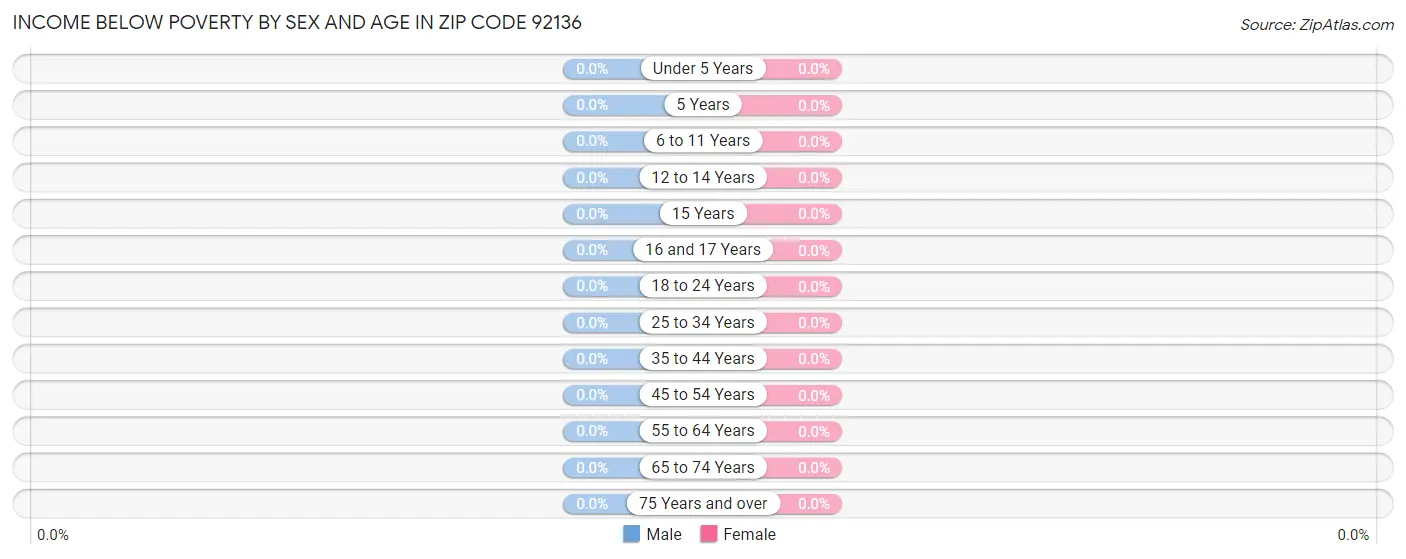
Income Below Poverty by Sex and Age in Zip Code 92136
Age Bracket
Male
Female
Under 5 Years
0 (0.0%)
0 (0.0%)
5 Years
0 (0.0%)
0 (0.0%)
6 to 11 Years
0 (0.0%)
0 (0.0%)
12 to 14 Years
0 (0.0%)
0 (0.0%)
15 Years
0 (0.0%)
0 (0.0%)
16 and 17 Years
0 (0.0%)
0 (0.0%)
18 to 24 Years
0 (0.0%)
0 (0.0%)
25 to 34 Years
0 (0.0%)
0 (0.0%)
35 to 44 Years
0 (0.0%)
0 (0.0%)
45 to 54 Years
0 (0.0%)
0 (0.0%)
55 to 64 Years
0 (0.0%)
0 (0.0%)
65 to 74 Years
0 (0.0%)
0 (0.0%)
75 Years and over
0 (0.0%)
0 (0.0%)
Total
0 (0.0%)
0 (0.0%)
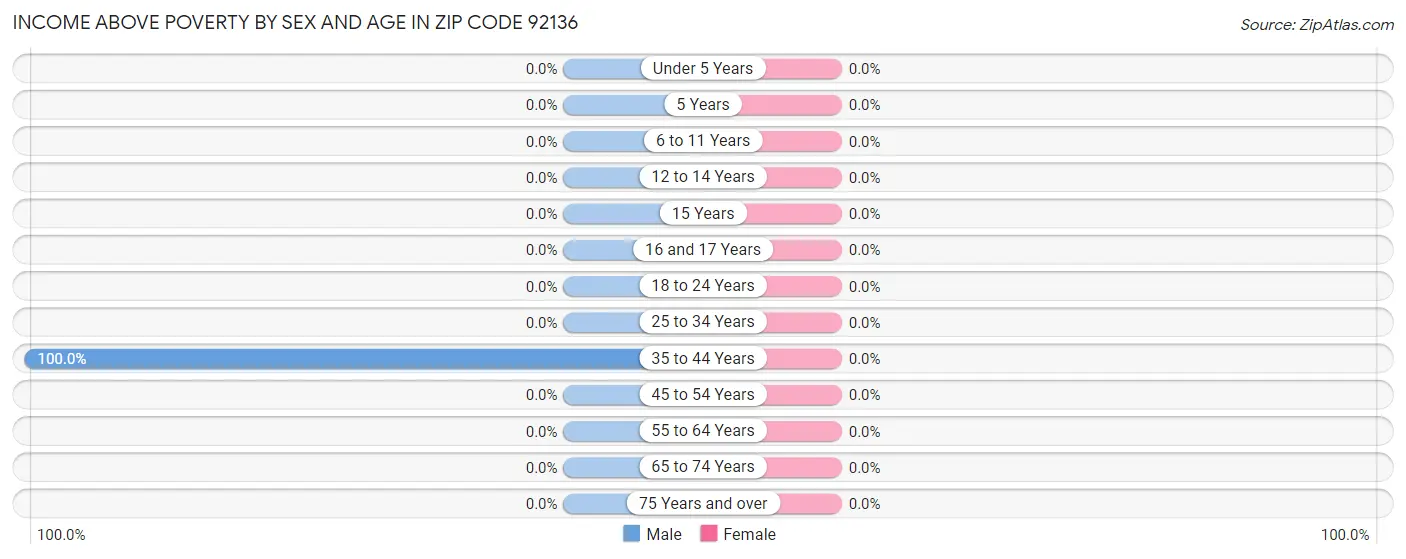
Income Above Poverty by Sex and Age in Zip Code 92136
Age Bracket
Male
Female
Under 5 Years
0 (0.0%)
0 (0.0%)
5 Years
0 (0.0%)
0 (0.0%)
6 to 11 Years
0 (0.0%)
0 (0.0%)
12 to 14 Years
0 (0.0%)
0 (0.0%)
15 Years
0 (0.0%)
0 (0.0%)
16 and 17 Years
0 (0.0%)
0 (0.0%)
18 to 24 Years
0 (0.0%)
0 (0.0%)
25 to 34 Years
0 (0.0%)
0 (0.0%)
35 to 44 Years
16 (100.0%)
0 (0.0%)
45 to 54 Years
0 (0.0%)
0 (0.0%)
55 to 64 Years
0 (0.0%)
0 (0.0%)
65 to 74 Years
0 (0.0%)
0 (0.0%)
75 Years and over
0 (0.0%)
0 (0.0%)
Total
16 (100.0%)
0 (0.0%)
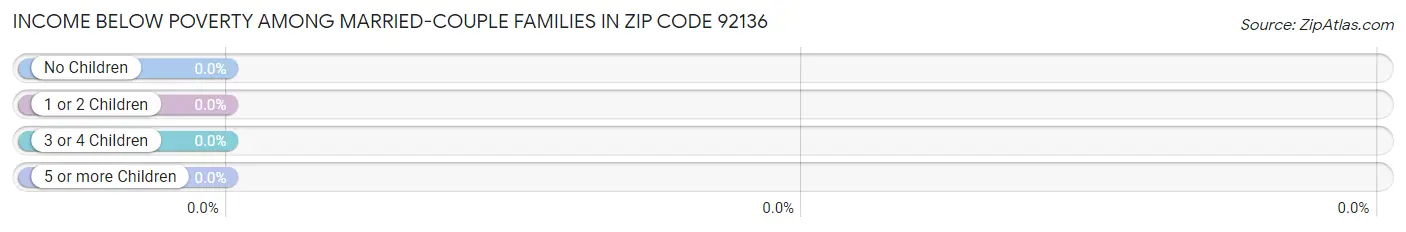
Income Below Poverty Among Married-Couple Families in Zip Code 92136
Children
Above Poverty
Below Poverty
No Children
0 (0.0%)
0 (0.0%)
1 or 2 Children
0 (0.0%)
0 (0.0%)
3 or 4 Children
0 (0.0%)
0 (0.0%)
5 or more Children
0 (0.0%)
0 (0.0%)
Total
0 (0.0%)
0 (0.0%)
Income Below Poverty Among Single-Parent Households in Zip Code 92136
Children
Single Father
Single Mother
No Children
0 (0.0%)
0 (0.0%)
1 or 2 Children
0 (0.0%)
0 (0.0%)
3 or 4 Children
0 (0.0%)
0 (0.0%)
5 or more Children
0 (0.0%)
0 (0.0%)
Total
0 (0.0%)
0 (0.0%)
Income Below Poverty Among Married-Couple vs Single-Parent Households in Zip Code 92136
Children
Married-Couple Families
Single-Parent Households
No Children
0 (0.0%)
0 (0.0%)
1 or 2 Children
0 (0.0%)
0 (0.0%)
3 or 4 Children
0 (0.0%)
0 (0.0%)
5 or more Children
0 (0.0%)
0 (0.0%)
Total
0 (0.0%)
0 (0.0%)
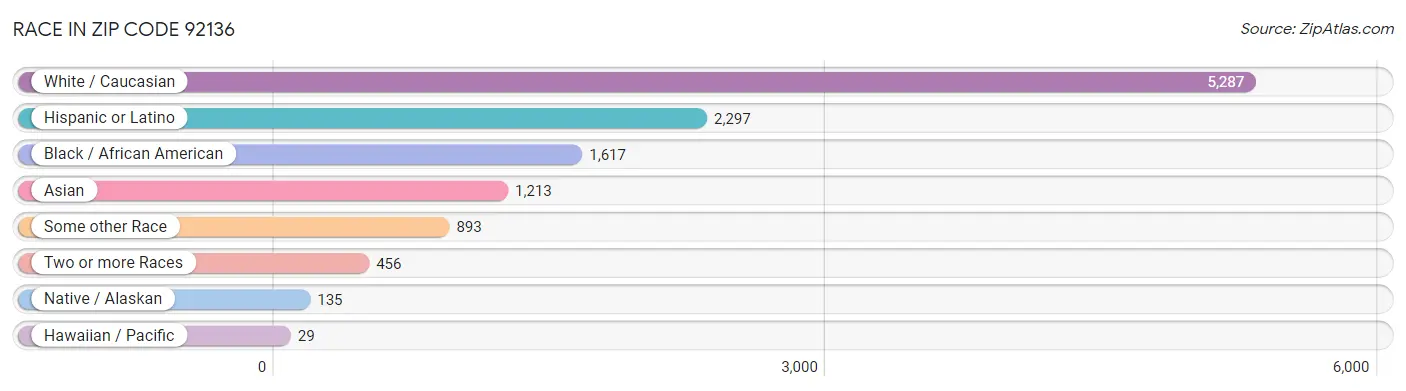
Race in Zip Code 92136
The most populous races in Zip Code 92136 are White / Caucasian (5,287 | 54.9%), Hispanic or Latino (2,297 | 23.8%), and Black / African American (1,617 | 16.8%).
Race
# Population
% Population
Asian
1,213
12.6%
Black / African American
1,617
16.8%
Hawaiian / Pacific
29
0.3%
Hispanic or Latino
2,297
23.8%
Native / Alaskan
135
1.4%
White / Caucasian
5,287
54.9%
Two or more Races
456
4.7%
Some other Race
893
9.3%
Total
9,630
100.0%
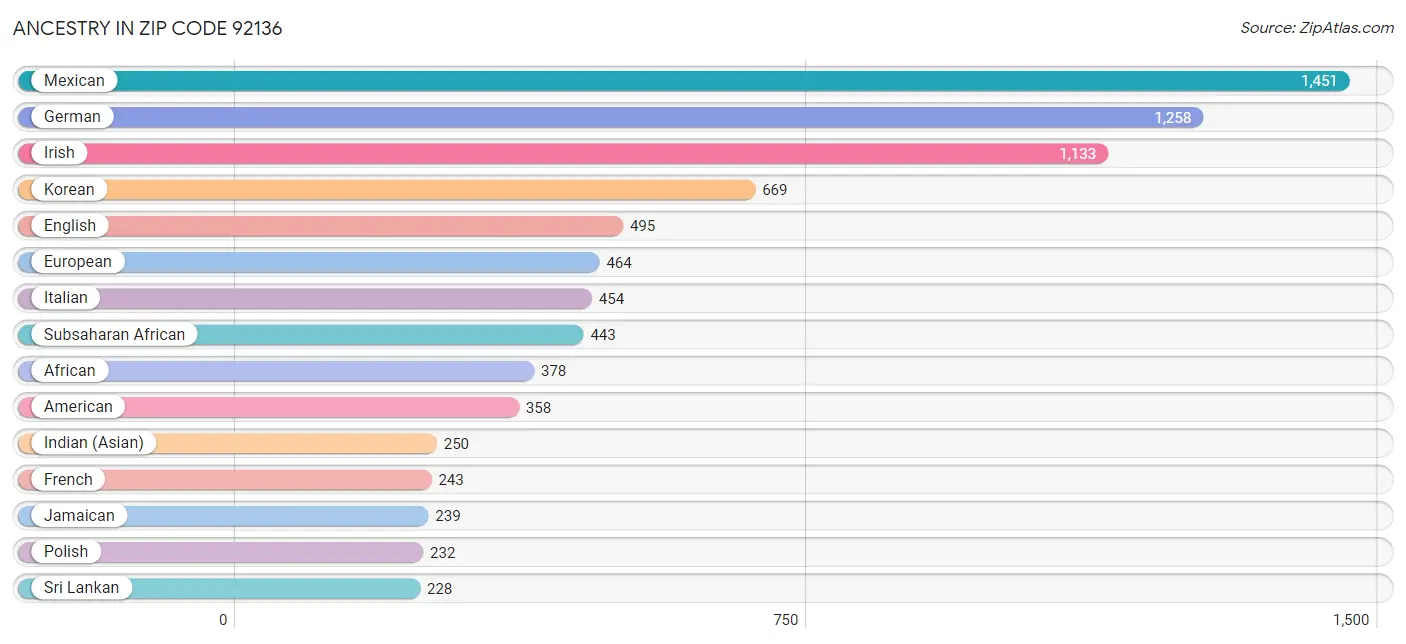
Ancestry in Zip Code 92136
The most populous ancestries reported in Zip Code 92136 are Mexican (1,451 | 15.1%), German (1,258 | 13.1%), Irish (1,133 | 11.8%), Korean (669 | 7.0%), and English (495 | 5.1%), together accounting for 52.0% of all Zip Code 92136 residents.
Ancestry
# Population
% Population
African
378
3.9%
American
358
3.7%
Apache
5
0.1%
Arab
17
0.2%
Bahamian
6
0.1%
Bangladeshi
45
0.5%
Belizean
5
0.1%
Bhutanese
17
0.2%
British
66
0.7%
Burmese
19
0.2%
Canadian
4
0.0%
Central American
142
1.5%
Cherokee
15
0.2%
Choctaw
13
0.1%
Colombian
128
1.3%
Costa Rican
13
0.1%
Croatian
24
0.3%
Cuban
75
0.8%
Czech
34
0.4%
Danish
67
0.7%
Dominican
101
1.1%
Dutch
89
0.9%
Eastern European
24
0.3%
English
495
5.1%
European
464
4.8%
Finnish
8
0.1%
French
243
2.5%
French Canadian
54
0.6%
German
1,258
13.1%
Greek
31
0.3%
Guamanian / Chamorro
79
0.8%
Guatemalan
53
0.5%
Guyanese
13
0.1%
Haitian
65
0.7%
Honduran
22
0.2%
Hungarian
28
0.3%
Indian (Asian)
250
2.6%
Iranian
13
0.1%
Irish
1,133
11.8%
Iroquois
24
0.3%
Israeli
5
0.1%
Italian
454
4.7%
Jamaican
239
2.5%
Japanese
24
0.3%
Korean
669
7.0%
Lithuanian
20
0.2%
Malaysian
21
0.2%
Mexican
1,451
15.1%
Native Hawaiian
19
0.2%
Navajo
56
0.6%
Nigerian
8
0.1%
Northern European
72
0.7%
Norwegian
64
0.7%
Pakistani
14
0.2%
Panamanian
21
0.2%
Peruvian
59
0.6%
Polish
232
2.4%
Portuguese
158
1.6%
Puerto Rican
172
1.8%
Romanian
102
1.1%
Russian
50
0.5%
Salvadoran
33
0.3%
Samoan
6
0.1%
Scandinavian
8
0.1%
Scotch-Irish
27
0.3%
Scottish
152
1.6%
Slovak
12
0.1%
South American
193
2.0%
Spaniard
95
1.0%
Spanish
8
0.1%
Sri Lankan
228
2.4%
Subsaharan African
443
4.6%
Swedish
18
0.2%
Swiss
7
0.1%
Thai
22
0.2%
Tlingit-Haida
10
0.1%
Trinidadian and Tobagonian
7
0.1%
Ukrainian
23
0.2%
Venezuelan
6
0.1%
Welsh
2
0.0%
West Indian
60
0.6%
View All 81 Rows
Immigrants in Zip Code 92136
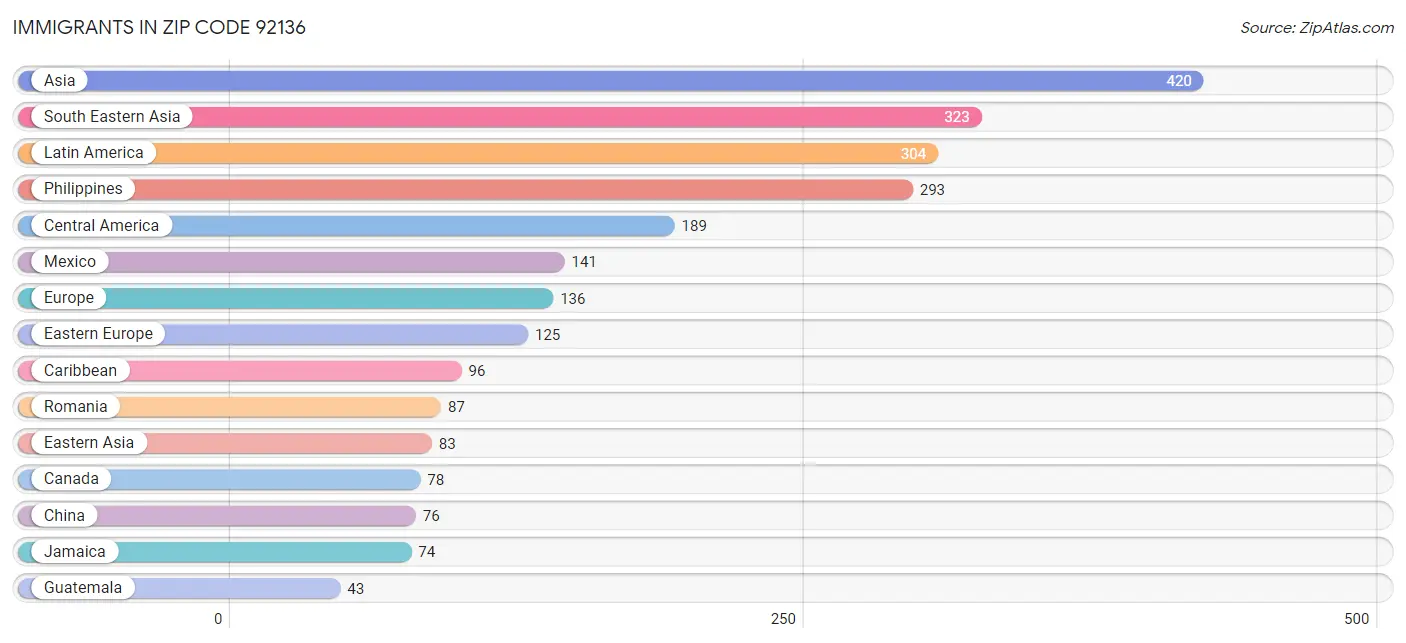
The most numerous immigrant groups reported in Zip Code 92136 came from Asia (420 | 4.4%), South Eastern Asia (323 | 3.4%), Latin America (304 | 3.2%), Philippines (293 | 3.0%), and Central America (189 | 2.0%), together accounting for 15.9% of all Zip Code 92136 residents.
Immigration Origin
# Population
% Population
Africa
3
0.0%
Asia
420
4.4%
Bahamas
6
0.1%
Belize
5
0.1%
Canada
78
0.8%
Caribbean
96
1.0%
Central America
189
2.0%
China
76
0.8%
Eastern Asia
83
0.9%
Eastern Europe
125
1.3%
Europe
136
1.4%
France
11
0.1%
Ghana
3
0.0%
Guatemala
43
0.4%
Guyana
13
0.1%
Haiti
9
0.1%
India
14
0.2%
Jamaica
74
0.8%
Korea
7
0.1%
Latin America
304
3.2%
Mexico
141
1.5%
Moldova
7
0.1%
Philippines
293
3.0%
Poland
10
0.1%
Romania
87
0.9%
Russia
21
0.2%
South America
19
0.2%
South Central Asia
14
0.2%
South Eastern Asia
323
3.4%
Trinidad and Tobago
7
0.1%
Venezuela
6
0.1%
Vietnam
30
0.3%
Western Africa
3
0.0%
Western Europe
11
0.1%
View All 34 Rows
Sex and Age in Zip Code 92136
Sex and Age in Zip Code 92136
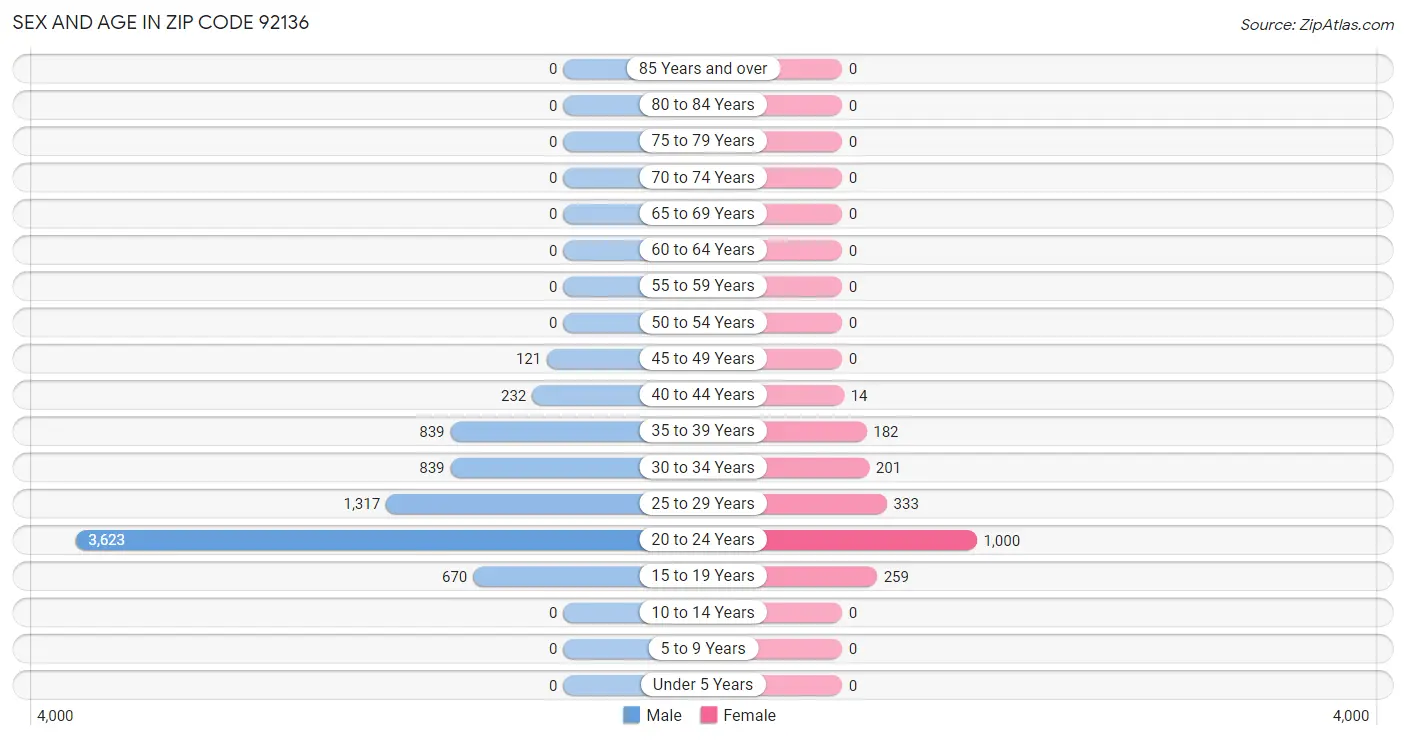
The most populous age groups in Zip Code 92136 are 20 to 24 Years (3,623 | 47.4%) for men and 20 to 24 Years (1,000 | 50.3%) for women.
Age Bracket
Male
Female
Under 5 Years
0 (0.0%)
0 (0.0%)
5 to 9 Years
0 (0.0%)
0 (0.0%)
10 to 14 Years
0 (0.0%)
0 (0.0%)
15 to 19 Years
670 (8.8%)
259 (13.0%)
20 to 24 Years
3,623 (47.4%)
1,000 (50.3%)
25 to 29 Years
1,317 (17.2%)
333 (16.7%)
30 to 34 Years
839 (11.0%)
201 (10.1%)
35 to 39 Years
839 (11.0%)
182 (9.1%)
40 to 44 Years
232 (3.0%)
14 (0.7%)
45 to 49 Years
121 (1.6%)
0 (0.0%)
50 to 54 Years
0 (0.0%)
0 (0.0%)
55 to 59 Years
0 (0.0%)
0 (0.0%)
60 to 64 Years
0 (0.0%)
0 (0.0%)
65 to 69 Years
0 (0.0%)
0 (0.0%)
70 to 74 Years
0 (0.0%)
0 (0.0%)
75 to 79 Years
0 (0.0%)
0 (0.0%)
80 to 84 Years
0 (0.0%)
0 (0.0%)
85 Years and over
0 (0.0%)
0 (0.0%)
Total
7,641 (100.0%)
1,989 (100.0%)
Families and Households in Zip Code 92136
Median Family Size in Zip Code 92136
Family Type
# Families
Family Size
Married-Couple
0 (0.0%)
-
Single Male/Father
0 (0.0%)
-
Single Female/Mother
0 (0.0%)
-
Total Families
0 (0.0%)
-
Median Household Size in Zip Code 92136
Household Type
# Households
Household Size
Married-Couple
0 (0.0%)
-
Single Male/Father
0 (0.0%)
-
Single Female/Mother
0 (0.0%)
-
Non-family
16 (100.0%)
-
Total Households
16 (100.0%)
-
Household Size by Marriage Status in Zip Code 92136
Household Size
Family Households
Nonfamily Households
1-Person Households
-
16 (100.0%)
2-Person Households
0 (0.0%)
0 (0.0%)
3-Person Households
0 (0.0%)
0 (0.0%)
4-Person Households
0 (0.0%)
0 (0.0%)
5-Person Households
0 (0.0%)
0 (0.0%)
6-Person Households
0 (0.0%)
0 (0.0%)
7+ Person Households
0 (0.0%)
0 (0.0%)
Total
0 (0.0%)
16 (100.0%)
Female Fertility in Zip Code 92136
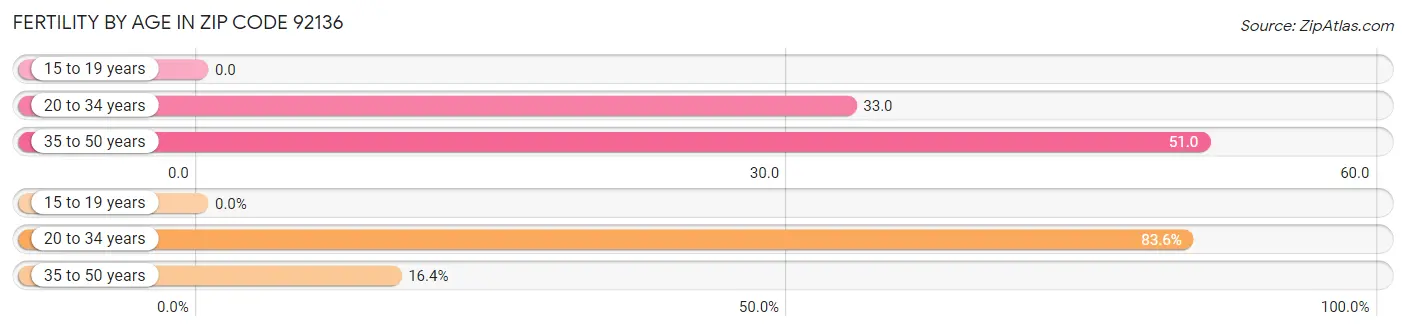
Fertility by Age in Zip Code 92136
Average fertility rate in Zip Code 92136 is 31.0 births per 1,000 women. Women in the age bracket of 35 to 50 years have the highest fertility rate with 51.0 births per 1,000 women. Women in the age bracket of 20 to 34 years acount for 83.6% of all women with births.
Age Bracket
Women with Births
Births / 1,000 Women
15 to 19 years
0 (0.0%)
0.0
20 to 34 years
51 (83.6%)
33.0
35 to 50 years
10 (16.4%)
51.0
Total
61 (100.0%)
31.0
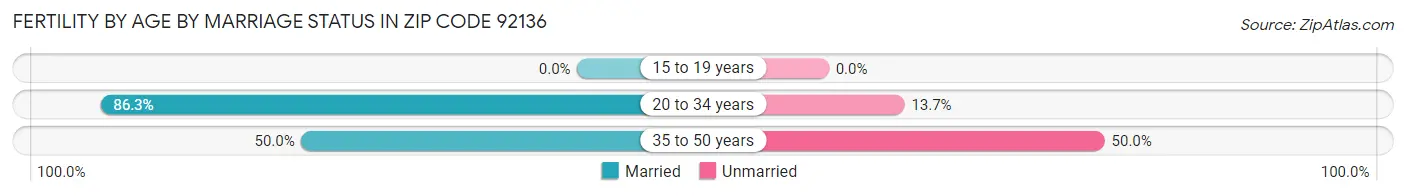
Fertility by Age by Marriage Status in Zip Code 92136
80.3% of women with births (61) in Zip Code 92136 are married. The highest percentage of unmarried women with births falls into 35 to 50 years age bracket with 50.0% of them unmarried at the time of birth, while the lowest percentage of unmarried women with births belong to 20 to 34 years age bracket with 13.7% of them unmarried.
Age Bracket
Married
Unmarried
15 to 19 years
0 (0.0%)
0 (0.0%)
20 to 34 years
44 (86.3%)
7 (13.7%)
35 to 50 years
5 (50.0%)
5 (50.0%)
Total
49 (80.3%)
12 (19.7%)
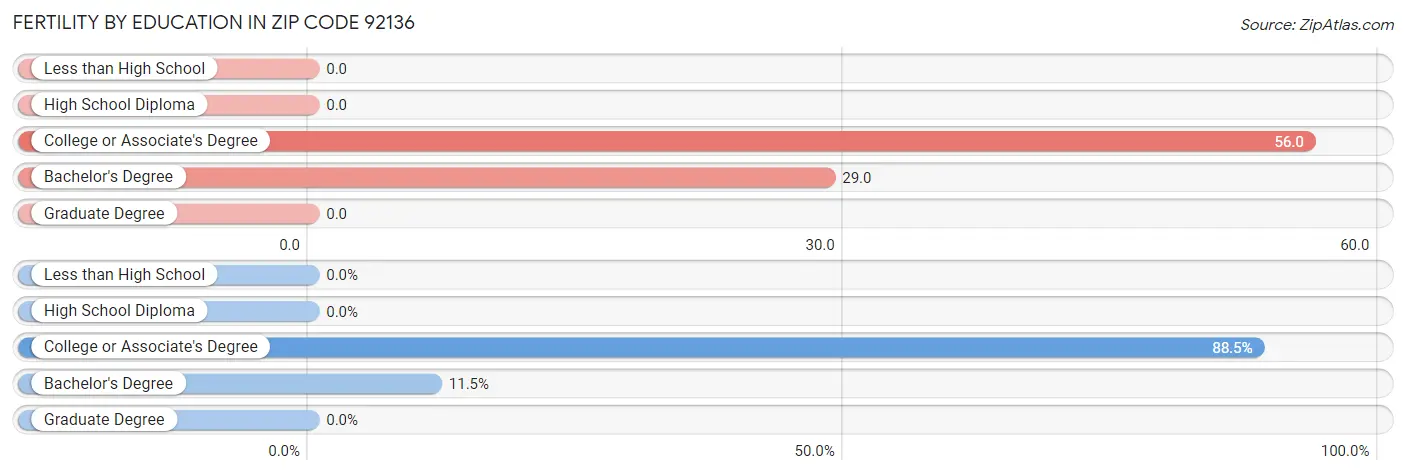
Fertility by Education in Zip Code 92136
Educational Attainment
Women with Births
Births / 1,000 Women
Less than High School
0 (0.0%)
0.0
High School Diploma
0 (0.0%)
0.0
College or Associate's Degree
54 (88.5%)
56.0
Bachelor's Degree
7 (11.5%)
29.0
Graduate Degree
0 (0.0%)
0.0
Total
61 (100.0%)
31.0
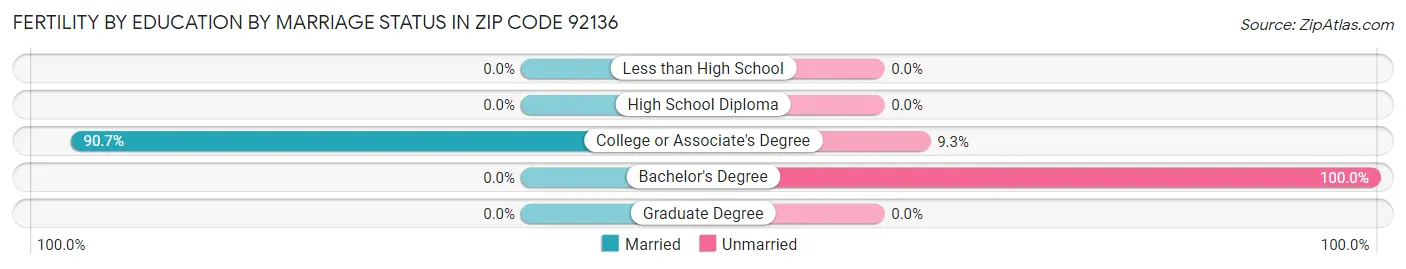
Fertility by Education by Marriage Status in Zip Code 92136
19.7% of women with births in Zip Code 92136 are unmarried. Women with the educational attainment of college or associate's degree are most likely to be married with 90.7% of them married at childbirth, while women with the educational attainment of bachelor's degree are least likely to be married with 100.0% of them unmarried at childbirth.
Educational Attainment
Married
Unmarried
Less than High School
0 (0.0%)
0 (0.0%)
High School Diploma
0 (0.0%)
0 (0.0%)
College or Associate's Degree
49 (90.7%)
5 (9.3%)
Bachelor's Degree
0 (0.0%)
7 (100.0%)
Graduate Degree
0 (0.0%)
0 (0.0%)
Total
49 (80.3%)
12 (19.7%)
Employment Characteristics in Zip Code 92136
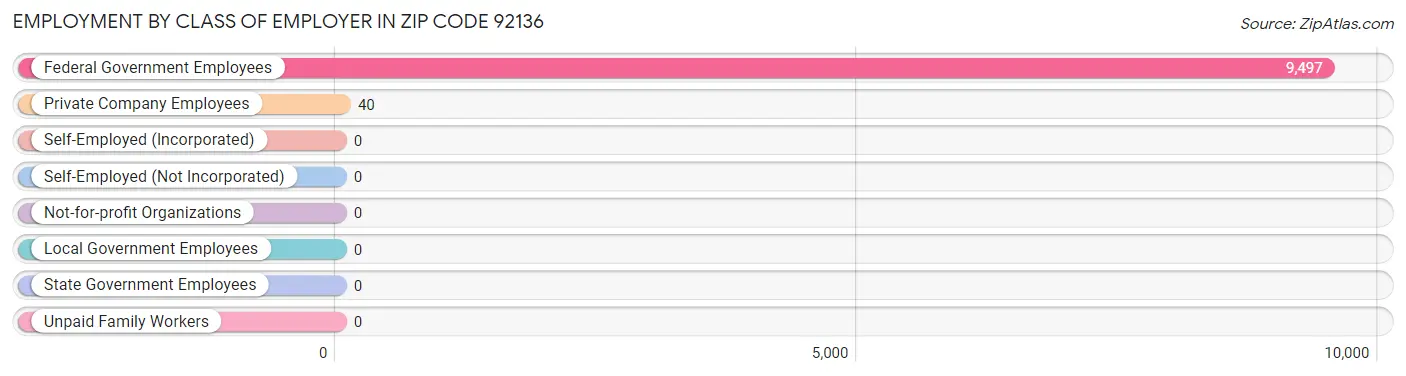
Employment by Class of Employer in Zip Code 92136
Among the 9,537 employed individuals in Zip Code 92136, federal government employees (9,497 | 99.6%), and private company employees (40 | 0.4%) make up the most common classes of employment.
Employer Class
# Employees
% Employees
Private Company Employees
40
0.4%
Self-Employed (Incorporated)
0
0.0%
Self-Employed (Not Incorporated)
0
0.0%
Not-for-profit Organizations
0
0.0%
Local Government Employees
0
0.0%
State Government Employees
0
0.0%
Federal Government Employees
9,497
99.6%
Unpaid Family Workers
0
0.0%
Total
9,537
100.0%
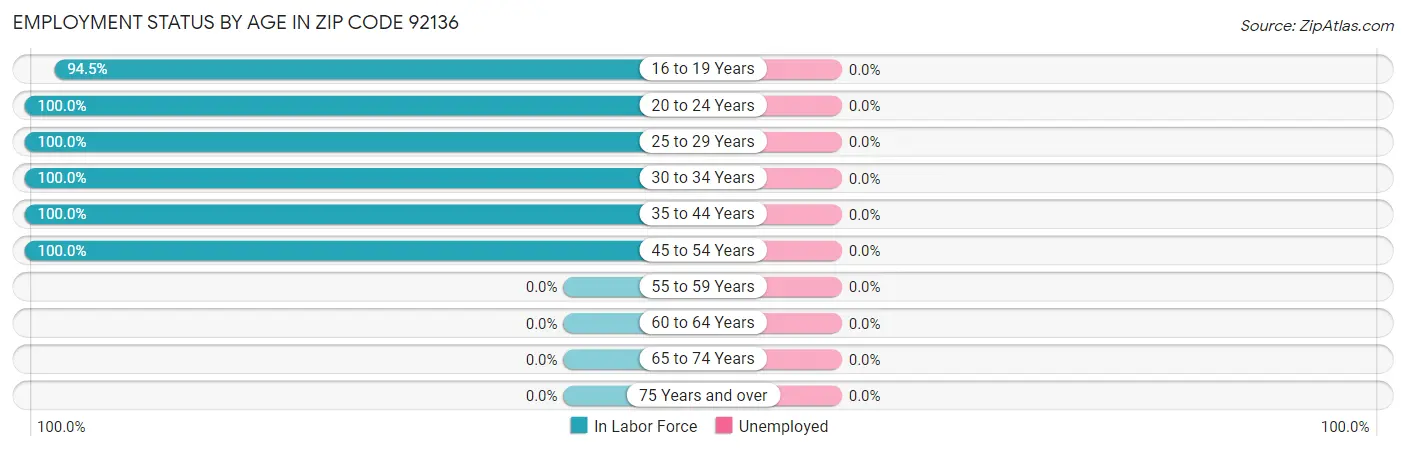
Employment Status by Age in Zip Code 92136
Age Bracket
In Labor Force
Unemployed
16 to 19 Years
878 (94.5%)
0 (0.0%)
20 to 24 Years
4,623 (100.0%)
0 (0.0%)
25 to 29 Years
1,650 (100.0%)
0 (0.0%)
30 to 34 Years
1,040 (100.0%)
0 (0.0%)
35 to 44 Years
1,267 (100.0%)
0 (0.0%)
45 to 54 Years
121 (100.0%)
0 (0.0%)
55 to 59 Years
0 (0.0%)
0 (0.0%)
60 to 64 Years
0 (0.0%)
0 (0.0%)
65 to 74 Years
0 (0.0%)
0 (0.0%)
75 Years and over
0 (0.0%)
0 (0.0%)
Total
9,582 (99.5%)
0 (0.0%)
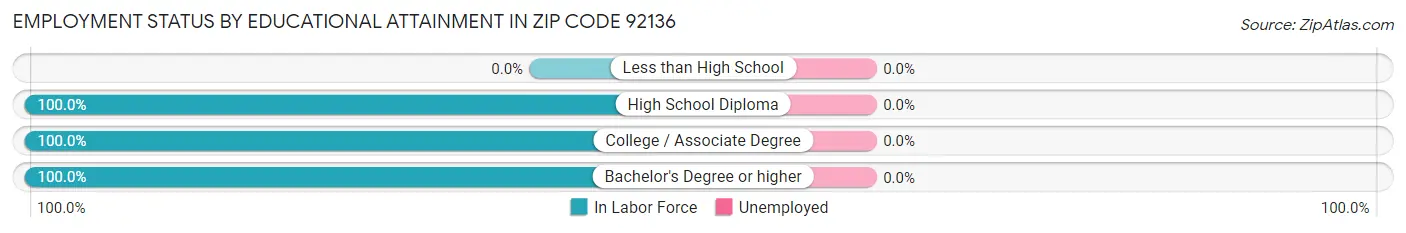
Employment Status by Educational Attainment in Zip Code 92136
Educational Attainment
In Labor Force
Unemployed
Less than High School
0 (0.0%)
0 (0.0%)
High School Diploma
807 (100.0%)
0 (0.0%)
College / Associate Degree
2,251 (100.0%)
0 (0.0%)
Bachelor's Degree or higher
1,020 (100.0%)
0 (0.0%)
Total
4,078 (100.0%)
0 (0.0%)
Employment Occupations by Sex in Zip Code 92136
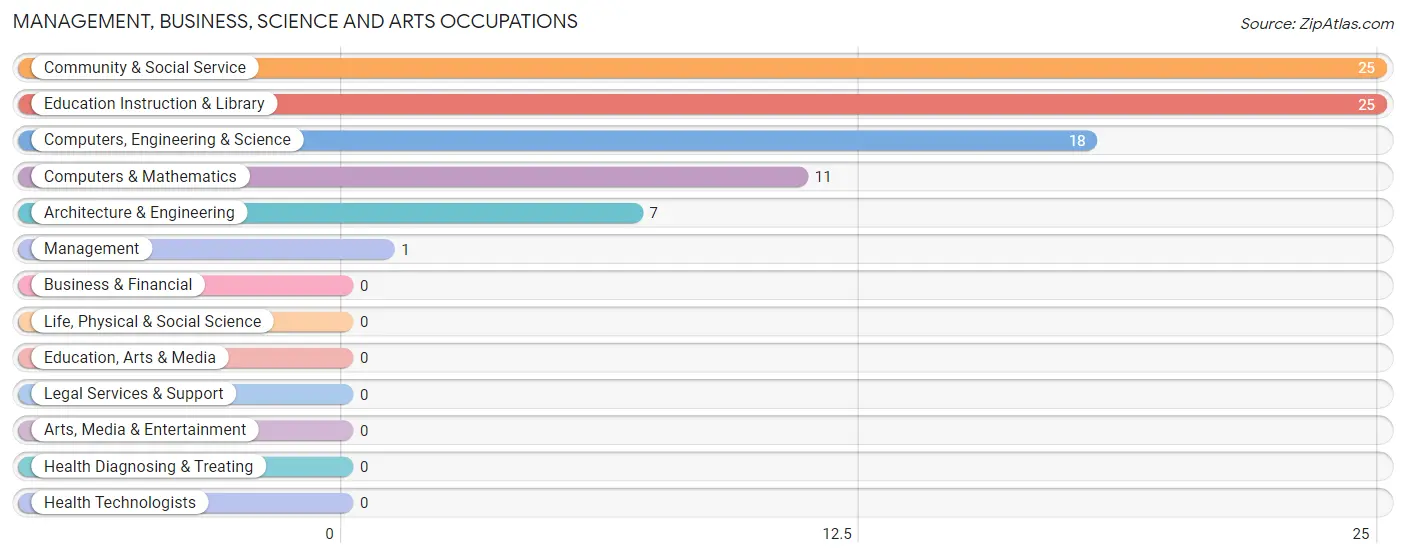
Management, Business, Science and Arts Occupations
The most common Management, Business, Science and Arts occupations in Zip Code 92136 are Community & Social Service (25 | 8.0%), Education Instruction & Library (25 | 8.0%), Computers, Engineering & Science (18 | 5.8%), Computers & Mathematics (11 | 3.5%), and Architecture & Engineering (7 | 2.2%).
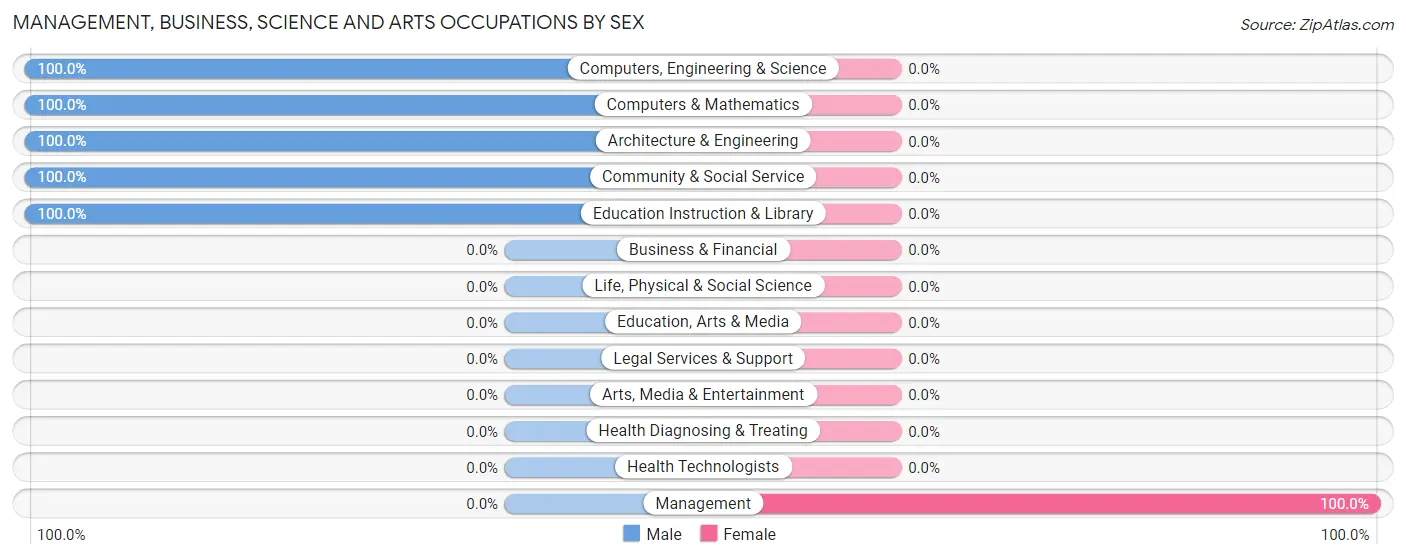
Management, Business, Science and Arts Occupations by Sex
Occupation
Male
Female
Management
0 (0.0%)
1 (100.0%)
Business & Financial
0 (0.0%)
0 (0.0%)
Computers, Engineering & Science
18 (100.0%)
0 (0.0%)
Computers & Mathematics
11 (100.0%)
0 (0.0%)
Architecture & Engineering
7 (100.0%)
0 (0.0%)
Life, Physical & Social Science
0 (0.0%)
0 (0.0%)
Community & Social Service
25 (100.0%)
0 (0.0%)
Education, Arts & Media
0 (0.0%)
0 (0.0%)
Legal Services & Support
0 (0.0%)
0 (0.0%)
Education Instruction & Library
25 (100.0%)
0 (0.0%)
Arts, Media & Entertainment
0 (0.0%)
0 (0.0%)
Health Diagnosing & Treating
0 (0.0%)
0 (0.0%)
Health Technologists
0 (0.0%)
0 (0.0%)
Total (Category)
43 (97.7%)
1 (2.3%)
Total (Overall)
284 (90.7%)
29 (9.3%)
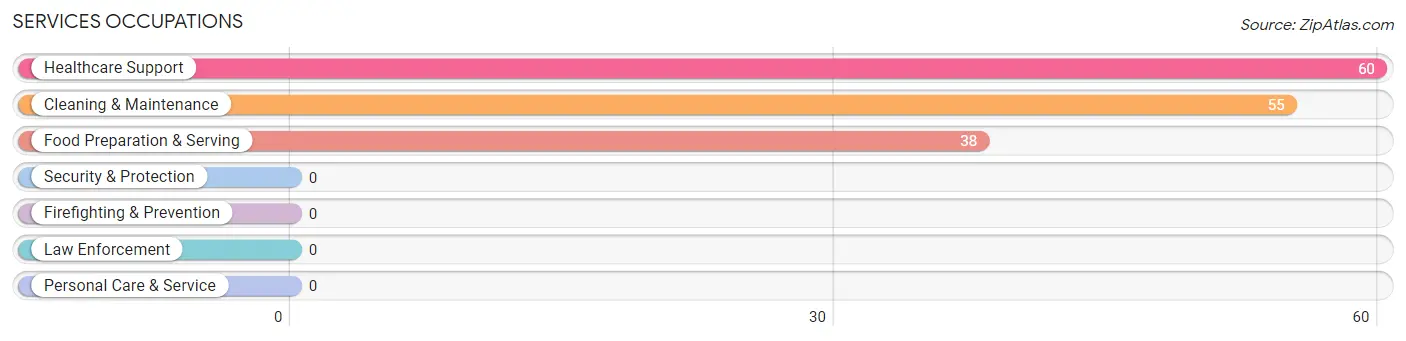
Services Occupations
The most common Services occupations in Zip Code 92136 are Healthcare Support (60 | 19.2%), Cleaning & Maintenance (55 | 17.6%), and Food Preparation & Serving (38 | 12.1%).
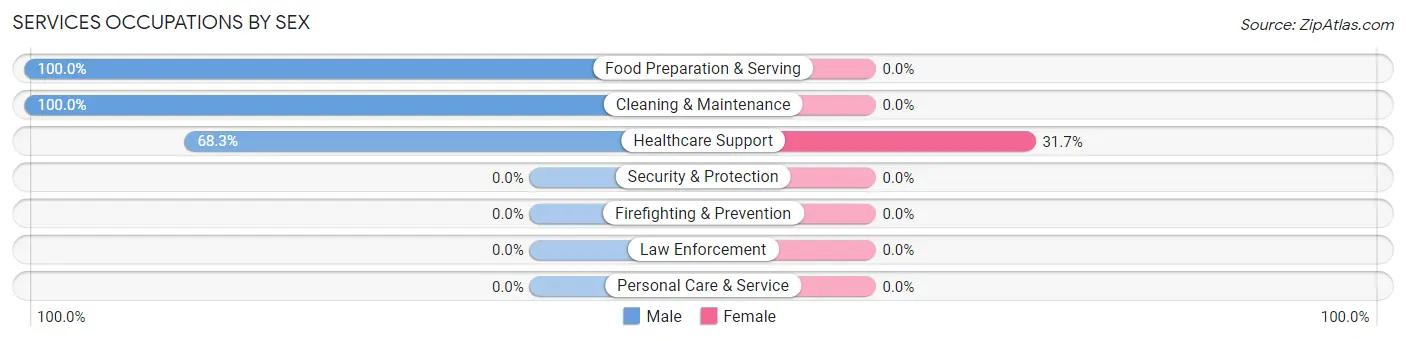
Services Occupations by Sex
Occupation
Male
Female
Healthcare Support
41 (68.3%)
19 (31.7%)
Security & Protection
0 (0.0%)
0 (0.0%)
Firefighting & Prevention
0 (0.0%)
0 (0.0%)
Law Enforcement
0 (0.0%)
0 (0.0%)
Food Preparation & Serving
38 (100.0%)
0 (0.0%)
Cleaning & Maintenance
55 (100.0%)
0 (0.0%)
Personal Care & Service
0 (0.0%)
0 (0.0%)
Total (Category)
134 (87.6%)
19 (12.4%)
Total (Overall)
284 (90.7%)
29 (9.3%)
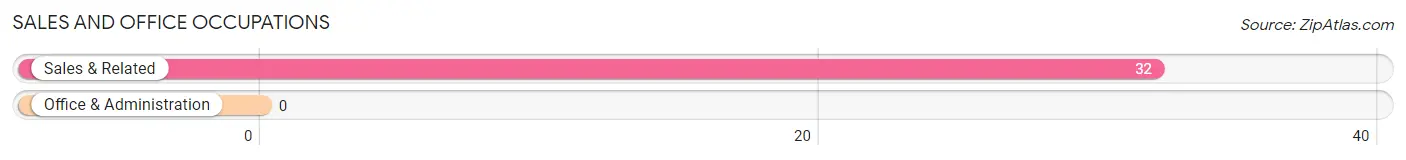
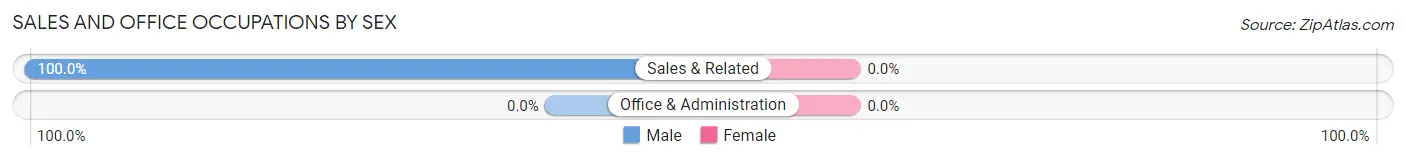
Sales and Office Occupations
The most common Sales and Office occupations in Zip Code 92136 are , and Sales & Related (32 | 10.2%).
Sales and Office Occupations by Sex
Occupation
Male
Female
Sales & Related
32 (100.0%)
0 (0.0%)
Office & Administration
0 (0.0%)
0 (0.0%)
Total (Category)
32 (100.0%)
0 (0.0%)
Total (Overall)
284 (90.7%)
29 (9.3%)
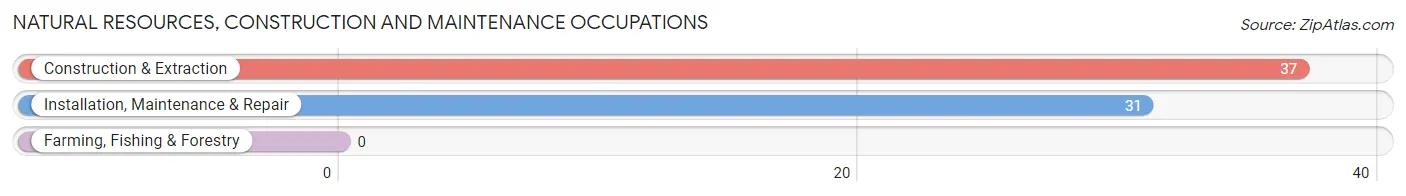
Natural Resources, Construction and Maintenance Occupations
The most common Natural Resources, Construction and Maintenance occupations in Zip Code 92136 are Construction & Extraction (37 | 11.8%), and Installation, Maintenance & Repair (31 | 9.9%).
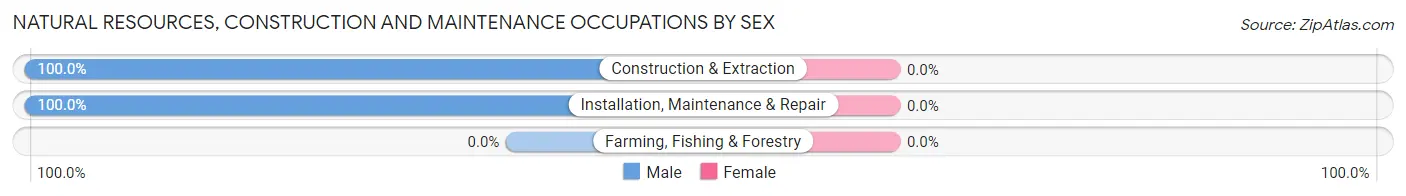
Natural Resources, Construction and Maintenance Occupations by Sex
Occupation
Male
Female
Farming, Fishing & Forestry
0 (0.0%)
0 (0.0%)
Construction & Extraction
37 (100.0%)
0 (0.0%)
Installation, Maintenance & Repair
31 (100.0%)
0 (0.0%)
Total (Category)
68 (100.0%)
0 (0.0%)
Total (Overall)
284 (90.7%)
29 (9.3%)
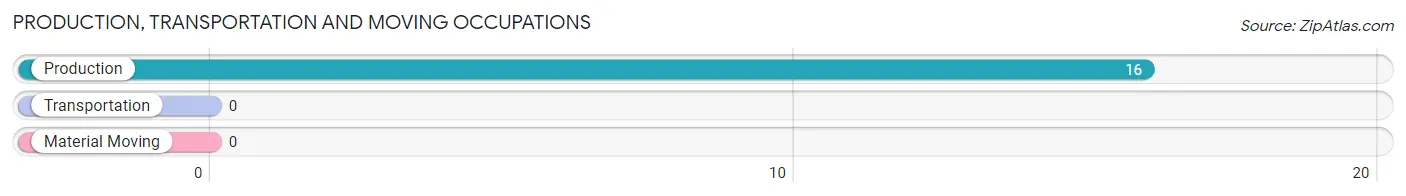
Production, Transportation and Moving Occupations
The most common Production, Transportation and Moving occupations in Zip Code 92136 are , and Production (16 | 5.1%).
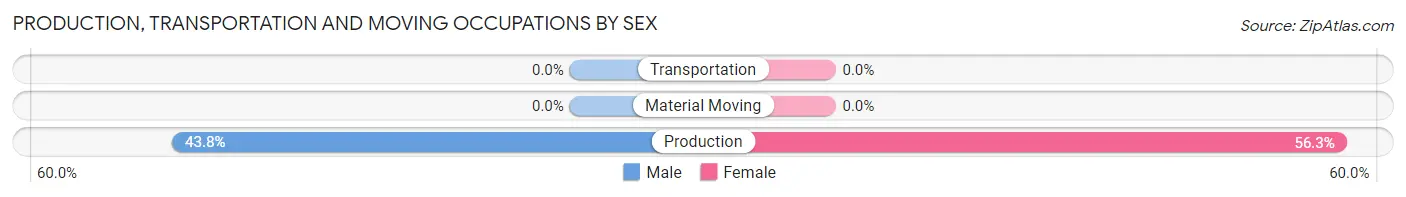
Production, Transportation and Moving Occupations by Sex
Occupation
Male
Female
Production
7 (43.8%)
9 (56.2%)
Transportation
0 (0.0%)
0 (0.0%)
Material Moving
0 (0.0%)
0 (0.0%)
Total (Category)
7 (43.8%)
9 (56.2%)
Total (Overall)
284 (90.7%)
29 (9.3%)
Employment Industries by Sex in Zip Code 92136
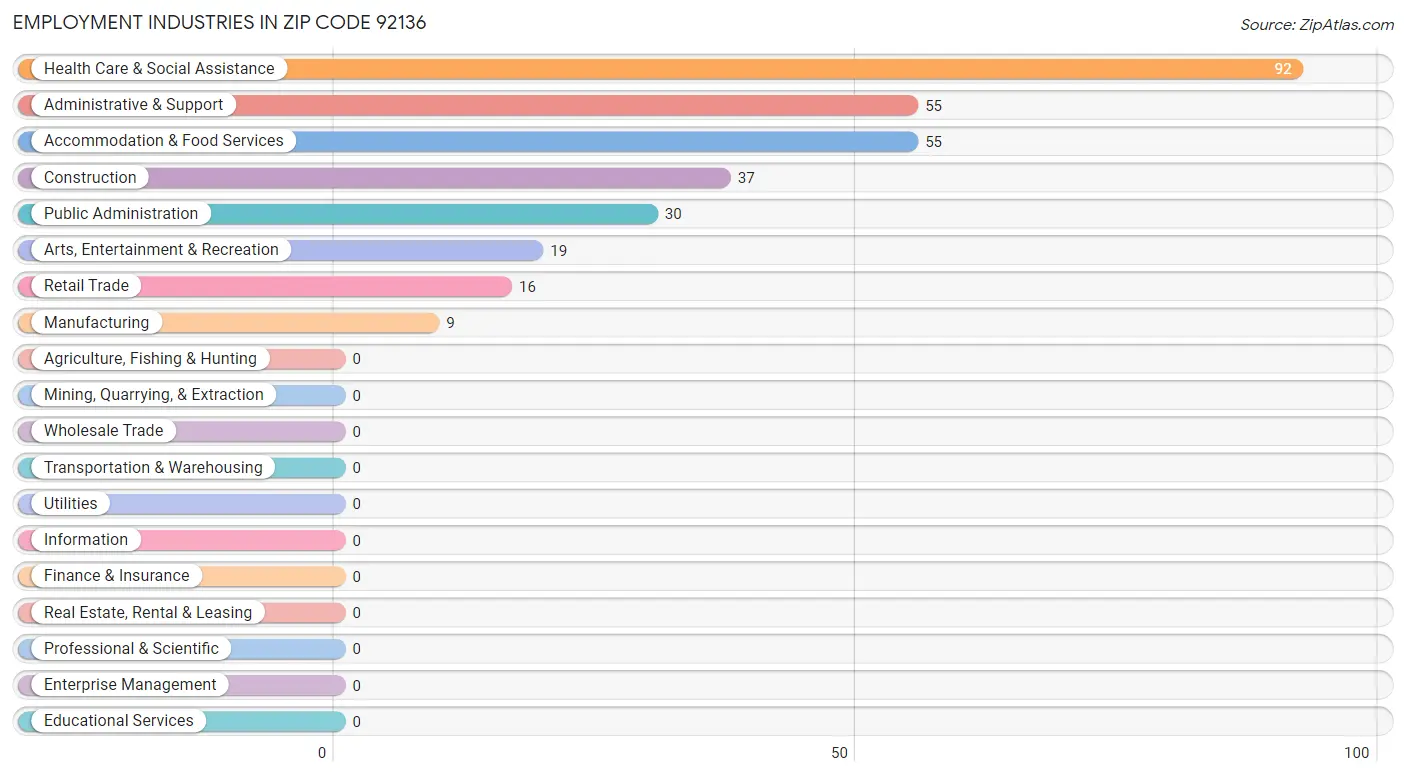
Employment Industries in Zip Code 92136
The major employment industries in Zip Code 92136 include Health Care & Social Assistance (92 | 29.4%), Administrative & Support (55 | 17.6%), Accommodation & Food Services (55 | 17.6%), Construction (37 | 11.8%), and Public Administration (30 | 9.6%).
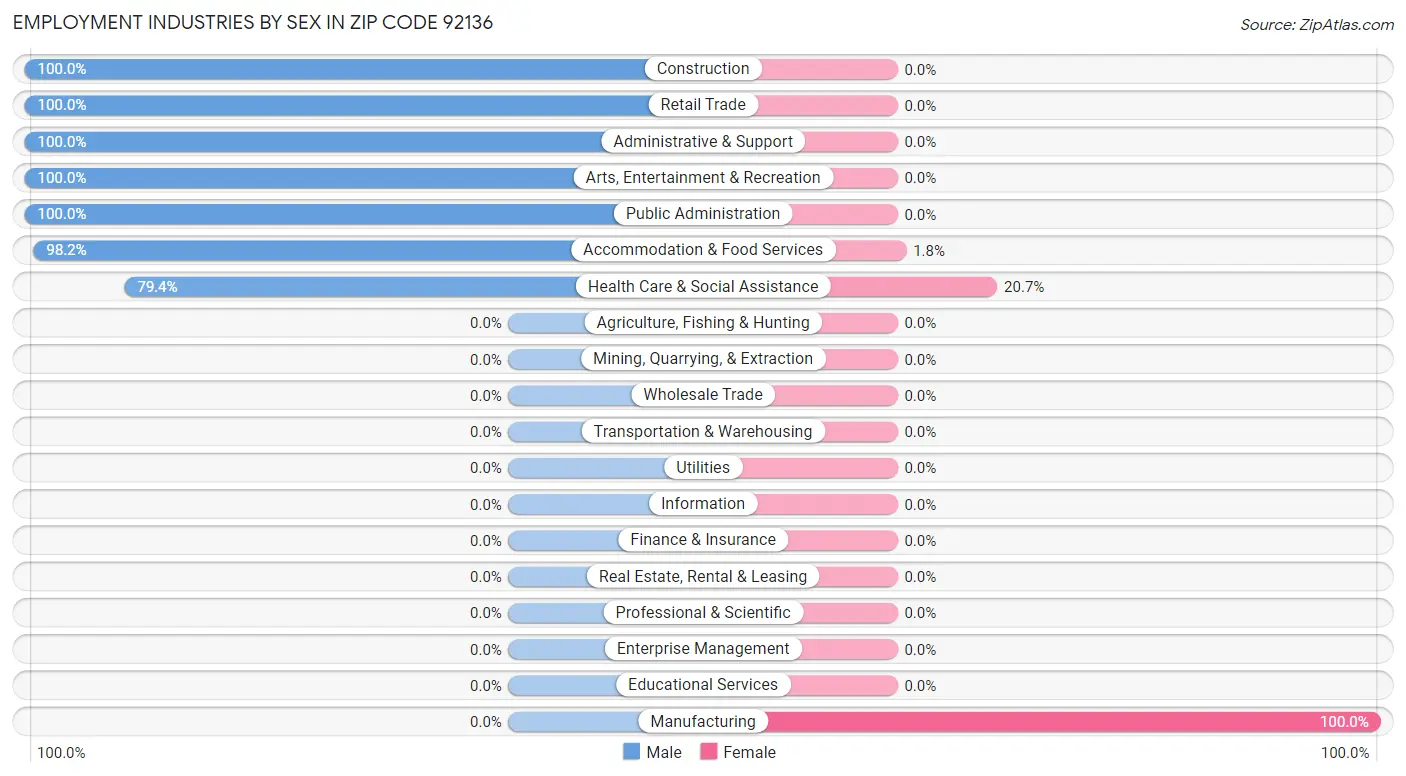
Employment Industries by Sex in Zip Code 92136
The Zip Code 92136 industries that see more men than women are Construction (100.0%), Retail Trade (100.0%), and Administrative & Support (100.0%), whereas the industries that tend to have a higher number of women are Manufacturing (100.0%), Health Care & Social Assistance (20.6%), and Accommodation & Food Services (1.8%).
Industry
Male
Female
Agriculture, Fishing & Hunting
0 (0.0%)
0 (0.0%)
Mining, Quarrying, & Extraction
0 (0.0%)
0 (0.0%)
Construction
37 (100.0%)
0 (0.0%)
Manufacturing
0 (0.0%)
9 (100.0%)
Wholesale Trade
0 (0.0%)
0 (0.0%)
Retail Trade
16 (100.0%)
0 (0.0%)
Transportation & Warehousing
0 (0.0%)
0 (0.0%)
Utilities
0 (0.0%)
0 (0.0%)
Information
0 (0.0%)
0 (0.0%)
Finance & Insurance
0 (0.0%)
0 (0.0%)
Real Estate, Rental & Leasing
0 (0.0%)
0 (0.0%)
Professional & Scientific
0 (0.0%)
0 (0.0%)
Enterprise Management
0 (0.0%)
0 (0.0%)
Administrative & Support
55 (100.0%)
0 (0.0%)
Educational Services
0 (0.0%)
0 (0.0%)
Health Care & Social Assistance
73 (79.3%)
19 (20.6%)
Arts, Entertainment & Recreation
19 (100.0%)
0 (0.0%)
Accommodation & Food Services
54 (98.2%)
1 (1.8%)
Public Administration
30 (100.0%)
0 (0.0%)
Total
284 (90.7%)
29 (9.3%)
Education in Zip Code 92136
School Enrollment in Zip Code 92136
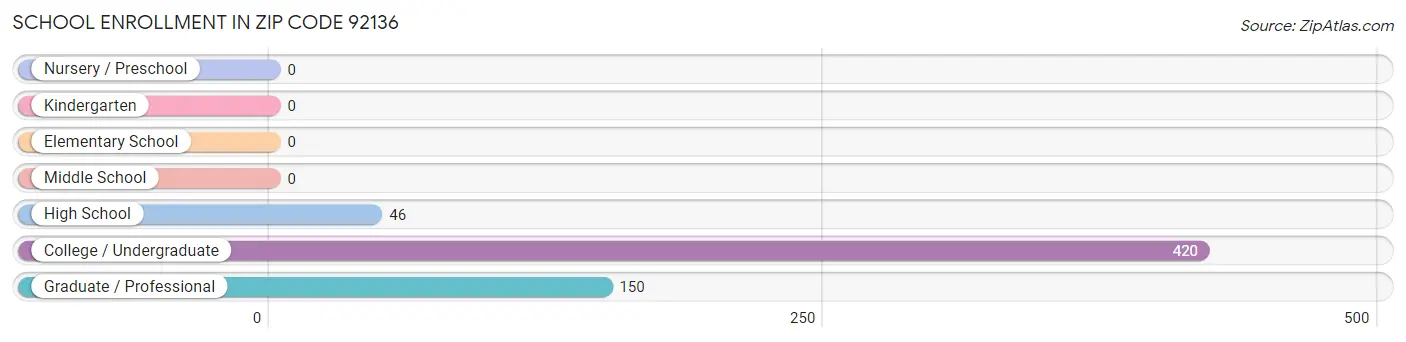
The most common levels of schooling among the 616 students in Zip Code 92136 are college / undergraduate (420 | 68.2%), graduate / professional (150 | 24.3%), and high school (46 | 7.5%).
School Level
# Students
% Students
Nursery / Preschool
0
0.0%
Kindergarten
0
0.0%
Elementary School
0
0.0%
Middle School
0
0.0%
High School
46
7.5%
College / Undergraduate
420
68.2%
Graduate / Professional
150
24.3%
Total
616
100.0%
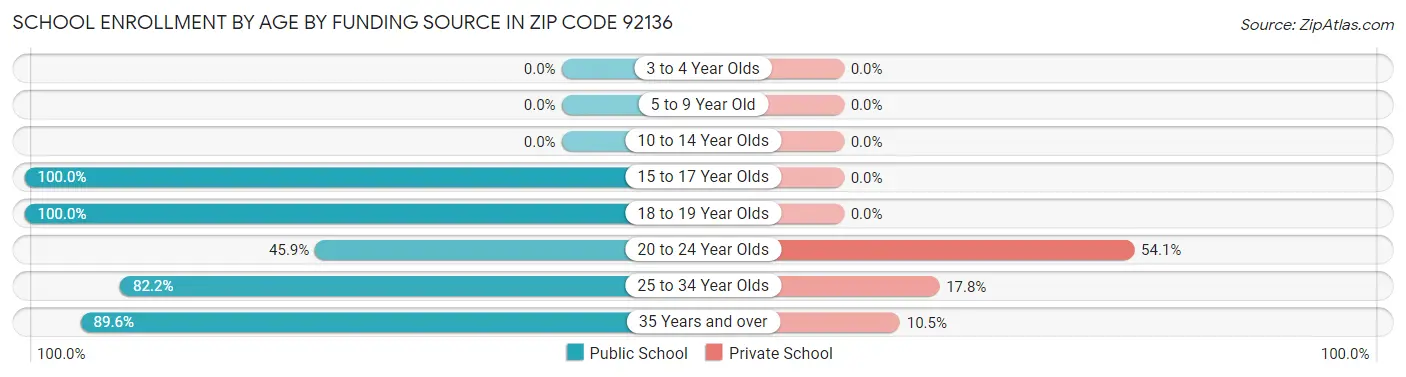
School Enrollment by Age by Funding Source in Zip Code 92136
Out of a total of 616 students who are enrolled in schools in Zip Code 92136, 163 (26.5%) attend a private institution, while the remaining 453 (73.5%) are enrolled in public schools. The age group of 20 to 24 year olds has the highest likelihood of being enrolled in private schools, with 112 (54.1% in the age bracket) enrolled. Conversely, the age group of 15 to 17 year olds has the lowest likelihood of being enrolled in a private school, with 6 (100.0% in the age bracket) attending a public institution.
Age Bracket
Public School
Private School
3 to 4 Year Olds
0 (0.0%)
0 (0.0%)
5 to 9 Year Old
0 (0.0%)
0 (0.0%)
10 to 14 Year Olds
0 (0.0%)
0 (0.0%)
15 to 17 Year Olds
6 (100.0%)
0 (0.0%)
18 to 19 Year Olds
61 (100.0%)
0 (0.0%)
20 to 24 Year Olds
95 (45.9%)
112 (54.1%)
25 to 34 Year Olds
171 (82.2%)
37 (17.8%)
35 Years and over
120 (89.5%)
14 (10.4%)
Total
453 (73.5%)
163 (26.5%)
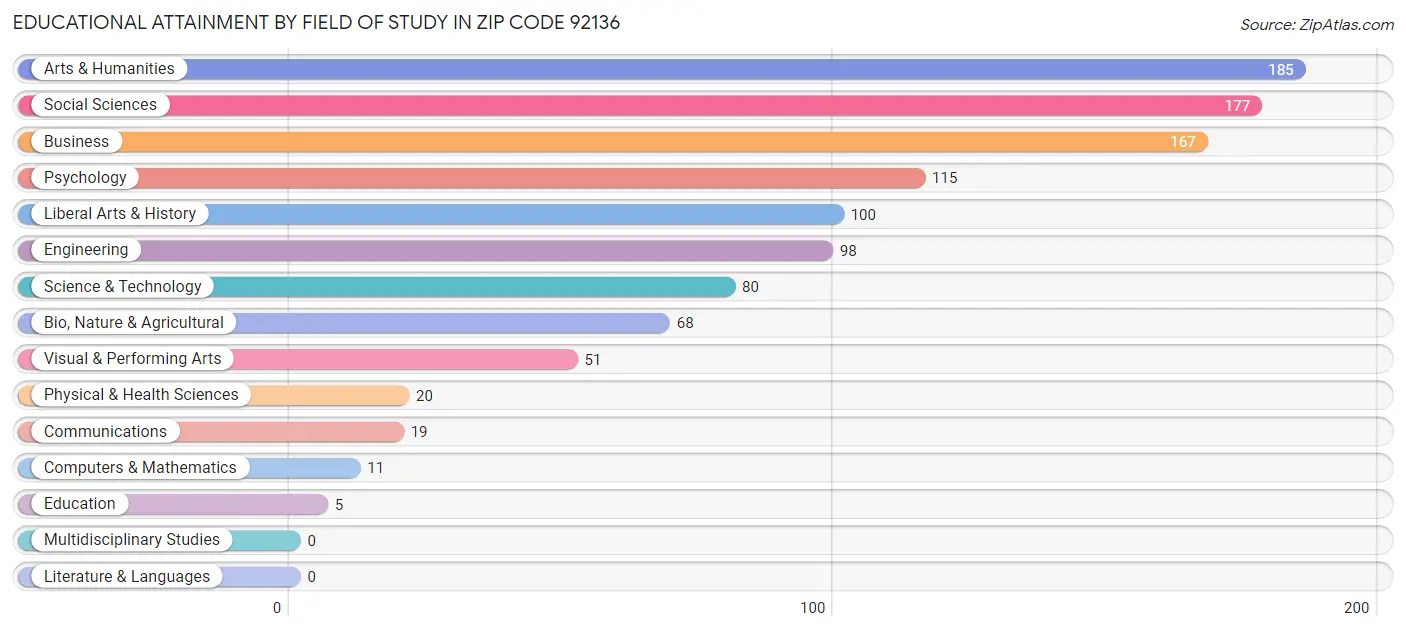
Educational Attainment by Field of Study in Zip Code 92136
Arts & humanities (185 | 16.9%), social sciences (177 | 16.2%), business (167 | 15.2%), psychology (115 | 10.5%), and liberal arts & history (100 | 9.1%) are the most common fields of study among 1,096 individuals in Zip Code 92136 who have obtained a bachelor's degree or higher.
Field of Study
# Graduates
% Graduates
Computers & Mathematics
11
1.0%
Bio, Nature & Agricultural
68
6.2%
Physical & Health Sciences
20
1.8%
Psychology
115
10.5%
Social Sciences
177
16.2%
Engineering
98
8.9%
Multidisciplinary Studies
0
0.0%
Science & Technology
80
7.3%
Business
167
15.2%
Education
5
0.5%
Literature & Languages
0
0.0%
Liberal Arts & History
100
9.1%
Visual & Performing Arts
51
4.6%
Communications
19
1.7%
Arts & Humanities
185
16.9%
Total
1,096
100.0%
Transportation & Commute in Zip Code 92136
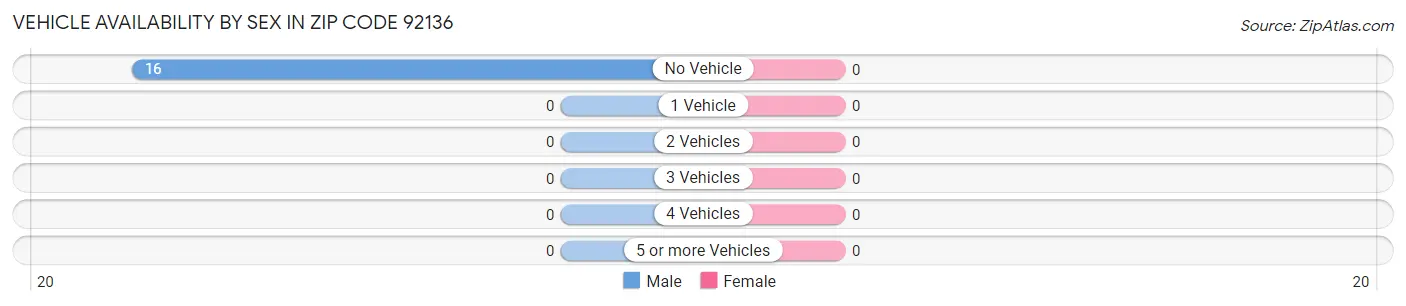
Vehicle Availability by Sex in Zip Code 92136
Vehicles Available
Male
Female
No Vehicle
16 (100.0%)
0 (0.0%)
1 Vehicle
0 (0.0%)
0 (0.0%)
2 Vehicles
0 (0.0%)
0 (0.0%)
3 Vehicles
0 (0.0%)
0 (0.0%)
4 Vehicles
0 (0.0%)
0 (0.0%)
5 or more Vehicles
0 (0.0%)
0 (0.0%)
Total
16 (100.0%)
0 (0.0%)
Commute Time in Zip Code 92136
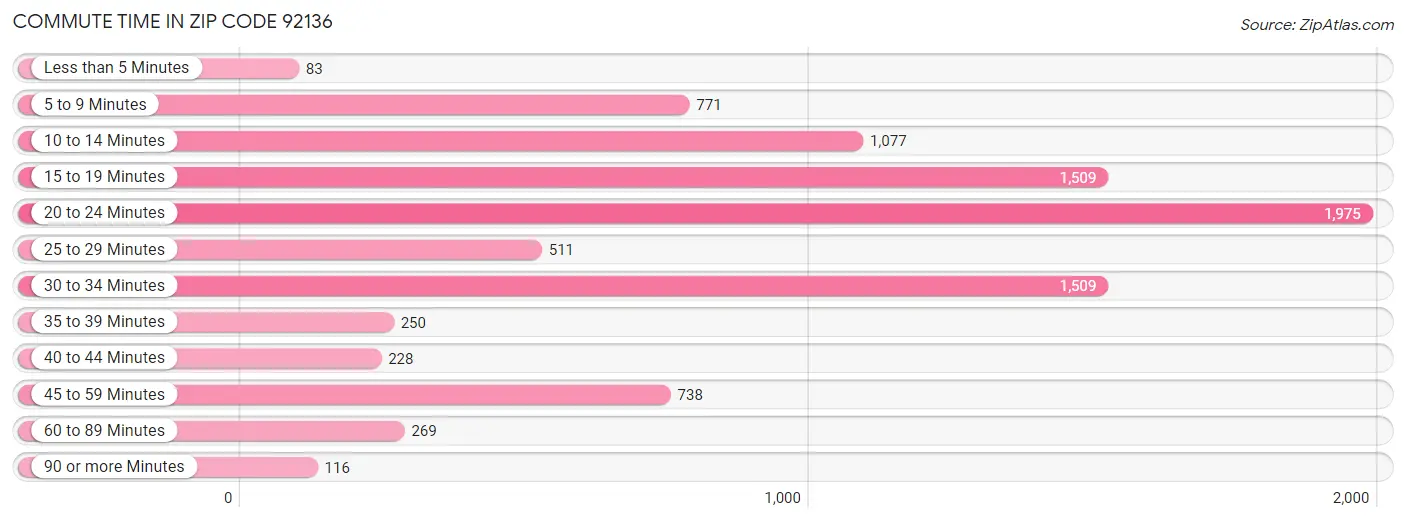
The most frequently occuring commute durations in Zip Code 92136 are 20 to 24 minutes (1,975 commuters, 21.9%), 15 to 19 minutes (1,509 commuters, 16.7%), and 30 to 34 minutes (1,509 commuters, 16.7%).
Commute Time
# Commuters
% Commuters
Less than 5 Minutes
83
0.9%
5 to 9 Minutes
771
8.5%
10 to 14 Minutes
1,077
11.9%
15 to 19 Minutes
1,509
16.7%
20 to 24 Minutes
1,975
21.9%
25 to 29 Minutes
511
5.7%
30 to 34 Minutes
1,509
16.7%
35 to 39 Minutes
250
2.8%
40 to 44 Minutes
228
2.5%
45 to 59 Minutes
738
8.2%
60 to 89 Minutes
269
3.0%
90 or more Minutes
116
1.3%
Commute Time by Sex in Zip Code 92136
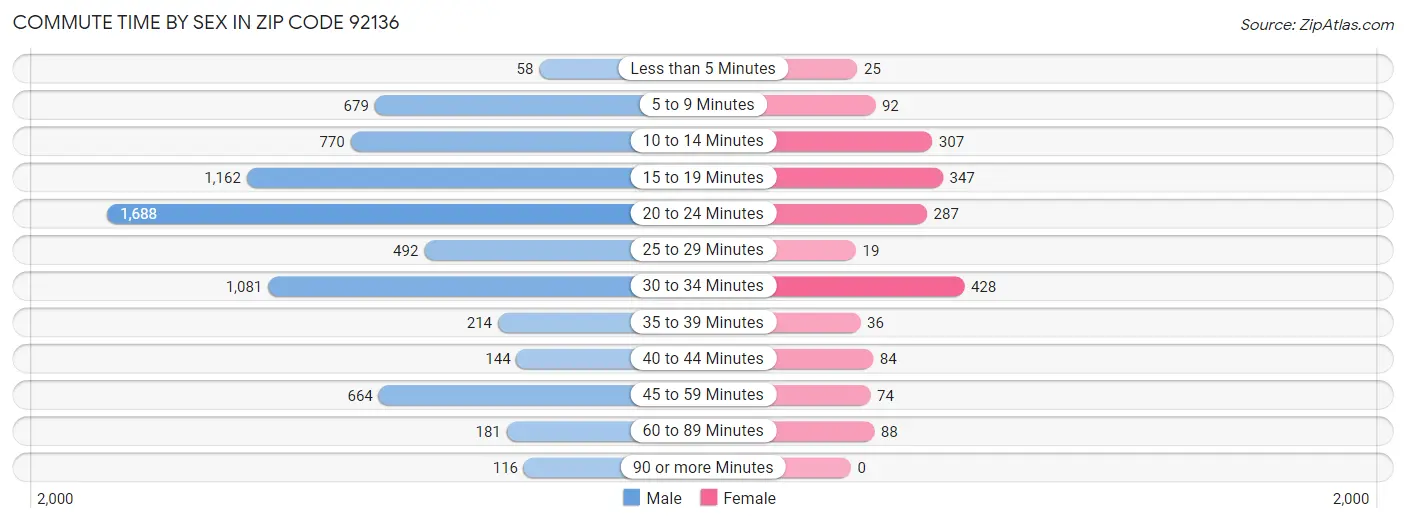
The most common commute times in Zip Code 92136 are 20 to 24 minutes (1,688 commuters, 23.3%) for males and 30 to 34 minutes (428 commuters, 23.9%) for females.
Commute Time
Male
Female
Less than 5 Minutes
58 (0.8%)
25 (1.4%)
5 to 9 Minutes
679 (9.4%)
92 (5.1%)
10 to 14 Minutes
770 (10.6%)
307 (17.2%)
15 to 19 Minutes
1,162 (16.0%)
347 (19.4%)
20 to 24 Minutes
1,688 (23.3%)
287 (16.1%)
25 to 29 Minutes
492 (6.8%)
19 (1.1%)
30 to 34 Minutes
1,081 (14.9%)
428 (23.9%)
35 to 39 Minutes
214 (2.9%)
36 (2.0%)
40 to 44 Minutes
144 (2.0%)
84 (4.7%)
45 to 59 Minutes
664 (9.2%)
74 (4.1%)
60 to 89 Minutes
181 (2.5%)
88 (4.9%)
90 or more Minutes
116 (1.6%)
0 (0.0%)
Time of Departure to Work by Sex in Zip Code 92136
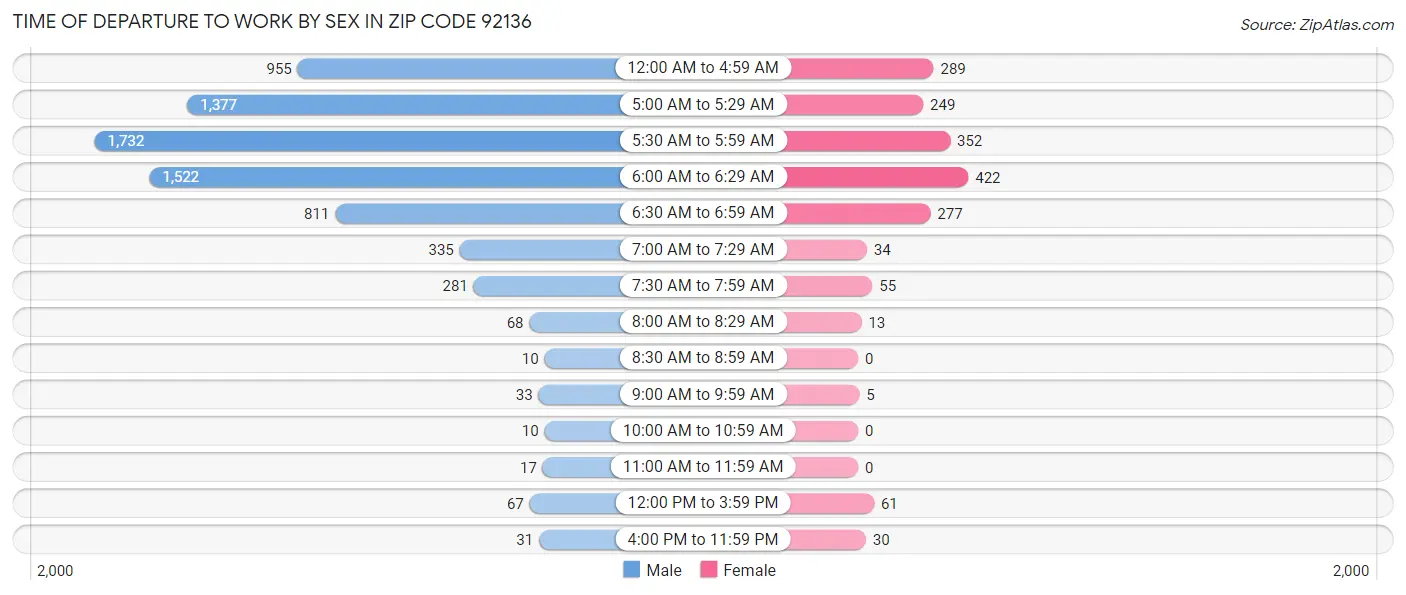
The most frequent times of departure to work in Zip Code 92136 are 5:30 AM to 5:59 AM (1,732, 23.9%) for males and 6:00 AM to 6:29 AM (422, 23.6%) for females.
Time of Departure
Male
Female
12:00 AM to 4:59 AM
955 (13.2%)
289 (16.2%)
5:00 AM to 5:29 AM
1,377 (19.0%)
249 (13.9%)
5:30 AM to 5:59 AM
1,732 (23.9%)
352 (19.7%)
6:00 AM to 6:29 AM
1,522 (21.0%)
422 (23.6%)
6:30 AM to 6:59 AM
811 (11.2%)
277 (15.5%)
7:00 AM to 7:29 AM
335 (4.6%)
34 (1.9%)
7:30 AM to 7:59 AM
281 (3.9%)
55 (3.1%)
8:00 AM to 8:29 AM
68 (0.9%)
13 (0.7%)
8:30 AM to 8:59 AM
10 (0.1%)
0 (0.0%)
9:00 AM to 9:59 AM
33 (0.5%)
5 (0.3%)
10:00 AM to 10:59 AM
10 (0.1%)
0 (0.0%)
11:00 AM to 11:59 AM
17 (0.2%)
0 (0.0%)
12:00 PM to 3:59 PM
67 (0.9%)
61 (3.4%)
4:00 PM to 11:59 PM
31 (0.4%)
30 (1.7%)
Total
7,249 (100.0%)
1,787 (100.0%)
Housing Occupancy in Zip Code 92136
Occupancy by Ownership in Zip Code 92136
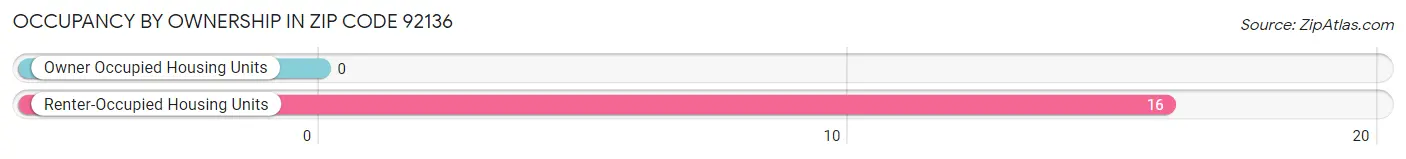
Of the total 16 dwellings in Zip Code 92136, owner-occupied units account for 0 (0.0%), while renter-occupied units make up 16 (100.0%).
Occupancy
# Housing Units
% Housing Units
Owner Occupied Housing Units
0
0.0%
Renter-Occupied Housing Units
16
100.0%
Total Occupied Housing Units
16
100.0%
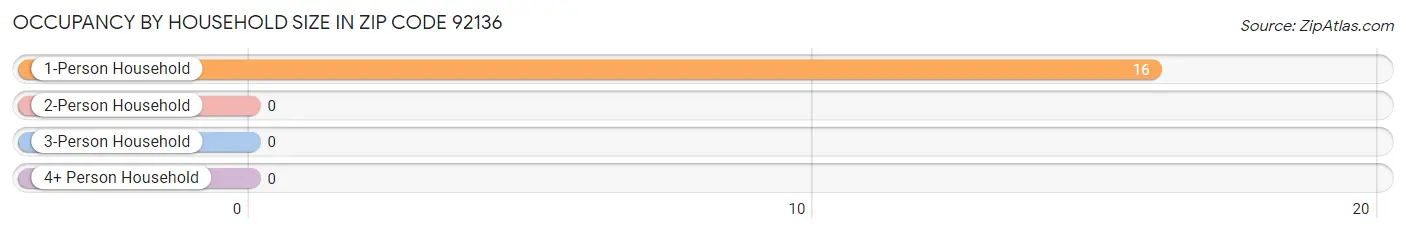
Occupancy by Household Size in Zip Code 92136
Household Size
# Housing Units
% Housing Units
1-Person Household
16
100.0%
2-Person Household
0
0.0%
3-Person Household
0
0.0%
4+ Person Household
0
0.0%
Total Housing Units
16
100.0%
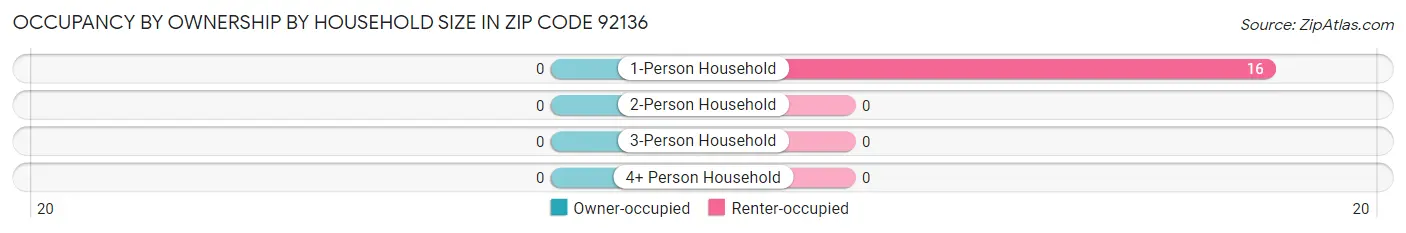
Occupancy by Ownership by Household Size in Zip Code 92136
Household Size
Owner-occupied
Renter-occupied
1-Person Household
0 (0.0%)
16 (100.0%)
2-Person Household
0 (0.0%)
0 (0.0%)
3-Person Household
0 (0.0%)
0 (0.0%)
4+ Person Household
0 (0.0%)
0 (0.0%)
Total Housing Units
0 (0.0%)
16 (100.0%)
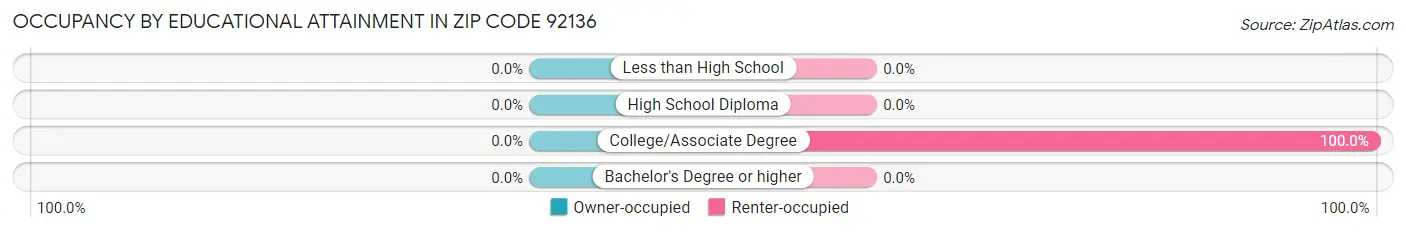
Occupancy by Educational Attainment in Zip Code 92136
Household Size
Owner-occupied
Renter-occupied
Less than High School
0 (0.0%)
0 (0.0%)
High School Diploma
0 (0.0%)
0 (0.0%)
College/Associate Degree
0 (0.0%)
16 (100.0%)
Bachelor's Degree or higher
0 (0.0%)
0 (0.0%)
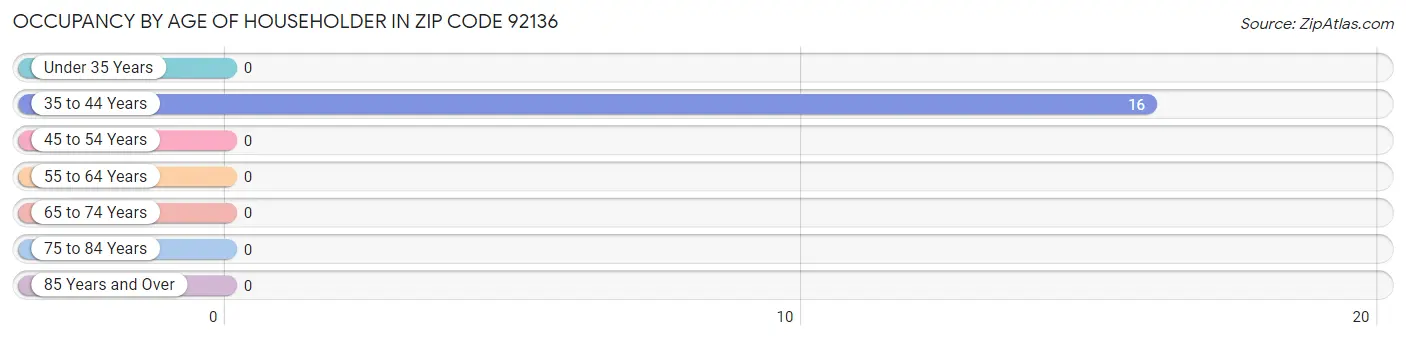
Occupancy by Age of Householder in Zip Code 92136
Age Bracket
# Households
% Households
Under 35 Years
0
0.0%
35 to 44 Years
16
100.0%
45 to 54 Years
0
0.0%
55 to 64 Years
0
0.0%
65 to 74 Years
0
0.0%
75 to 84 Years
0
0.0%
85 Years and Over
0
0.0%
Total
16
100.0%
Housing Finances in Zip Code 92136
Median Income by Occupancy in Zip Code 92136
Occupancy Type
# Households
Median Income
Owner-Occupied
0 (0.0%)
$0
Renter-Occupied
16 (100.0%)
$0
Average
16 (100.0%)
$0
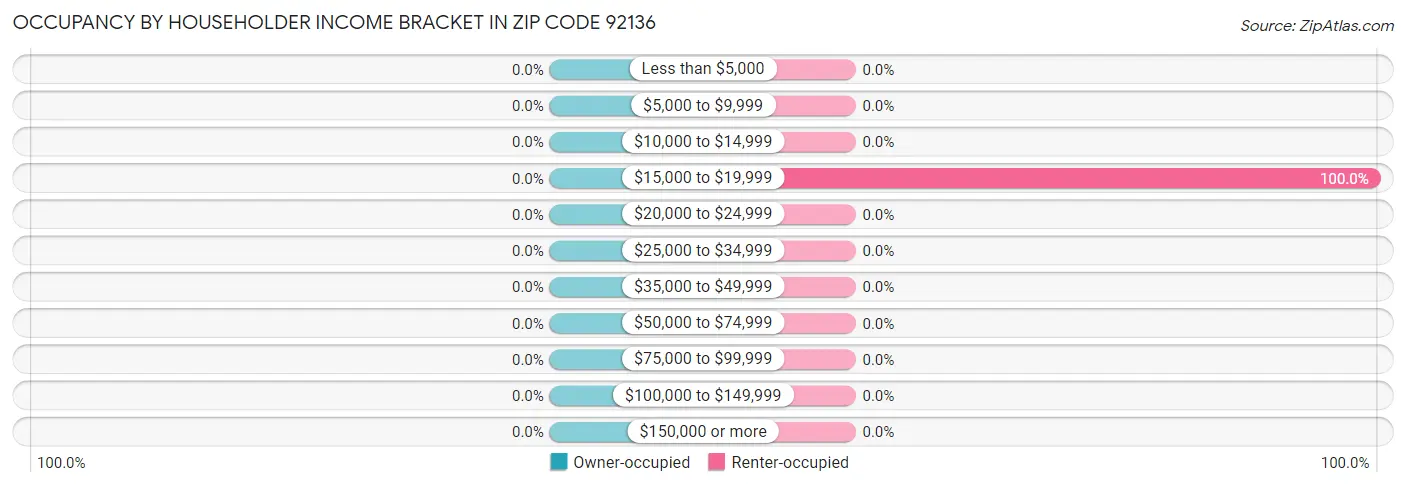
Occupancy by Householder Income Bracket in Zip Code 92136
Income Bracket
Owner-occupied
Renter-occupied
Less than $5,000
0 (0.0%)
0 (0.0%)
$5,000 to $9,999
0 (0.0%)
0 (0.0%)
$10,000 to $14,999
0 (0.0%)
0 (0.0%)
$15,000 to $19,999
0 (0.0%)
16 (100.0%)
$20,000 to $24,999
0 (0.0%)
0 (0.0%)
$25,000 to $34,999
0 (0.0%)
0 (0.0%)
$35,000 to $49,999
0 (0.0%)
0 (0.0%)
$50,000 to $74,999
0 (0.0%)
0 (0.0%)
$75,000 to $99,999
0 (0.0%)
0 (0.0%)
$100,000 to $149,999
0 (0.0%)
0 (0.0%)
$150,000 or more
0 (0.0%)
0 (0.0%)
Total
0 (0.0%)
16 (100.0%)
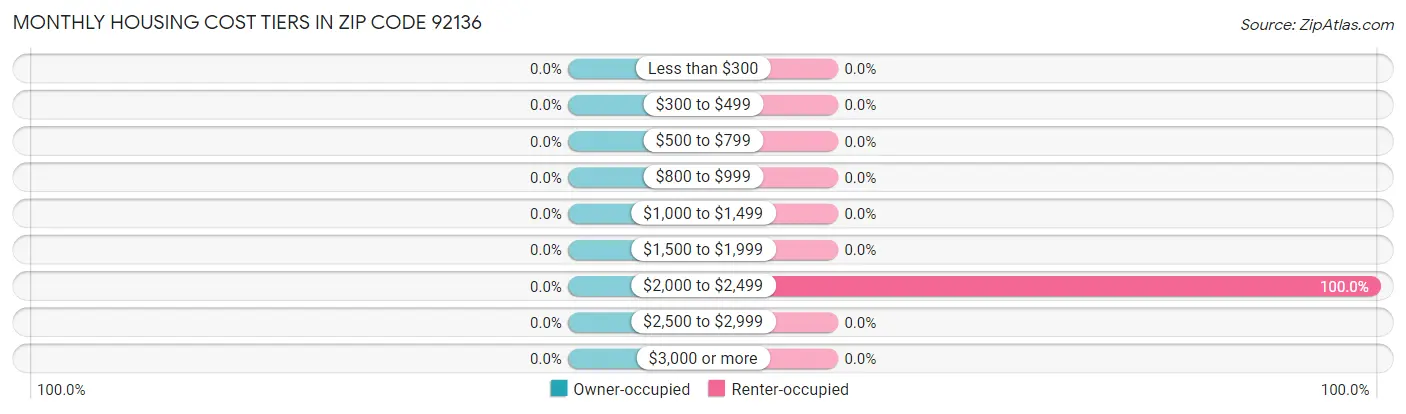
Monthly Housing Cost Tiers in Zip Code 92136
Monthly Cost
Owner-occupied
Renter-occupied
Less than $300
0 (0.0%)
0 (0.0%)
$300 to $499
0 (0.0%)
0 (0.0%)
$500 to $799
0 (0.0%)
0 (0.0%)
$800 to $999
0 (0.0%)
0 (0.0%)
$1,000 to $1,499
0 (0.0%)
0 (0.0%)
$1,500 to $1,999
0 (0.0%)
0 (0.0%)
$2,000 to $2,499
0 (0.0%)
16 (100.0%)
$2,500 to $2,999
0 (0.0%)
0 (0.0%)
$3,000 or more
0 (0.0%)
0 (0.0%)
Total
0 (0.0%)
16 (100.0%)
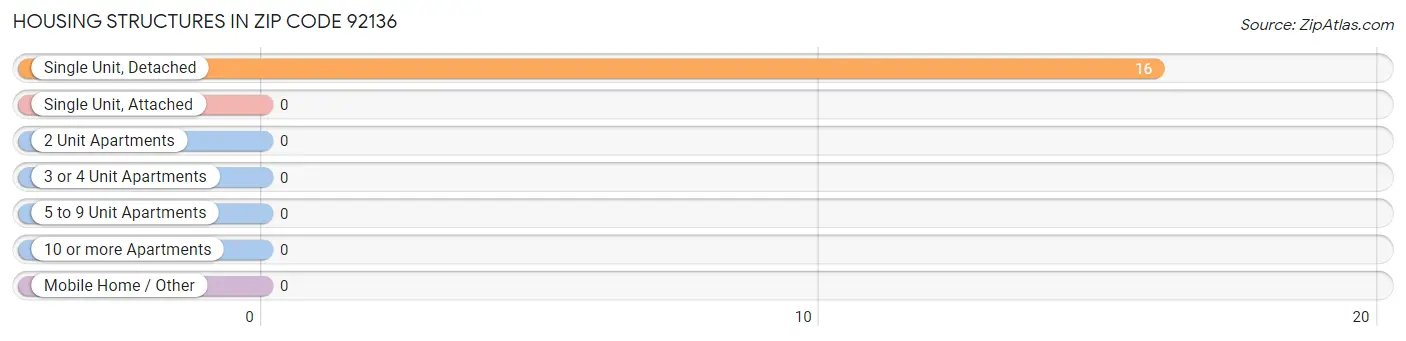
Physical Housing Characteristics in Zip Code 92136
Housing Structures in Zip Code 92136
Structure Type
# Housing Units
% Housing Units
Single Unit, Detached
16
100.0%
Single Unit, Attached
0
0.0%
2 Unit Apartments
0
0.0%
3 or 4 Unit Apartments
0
0.0%
5 to 9 Unit Apartments
0
0.0%
10 or more Apartments
0
0.0%
Mobile Home / Other
0
0.0%
Total
16
100.0%
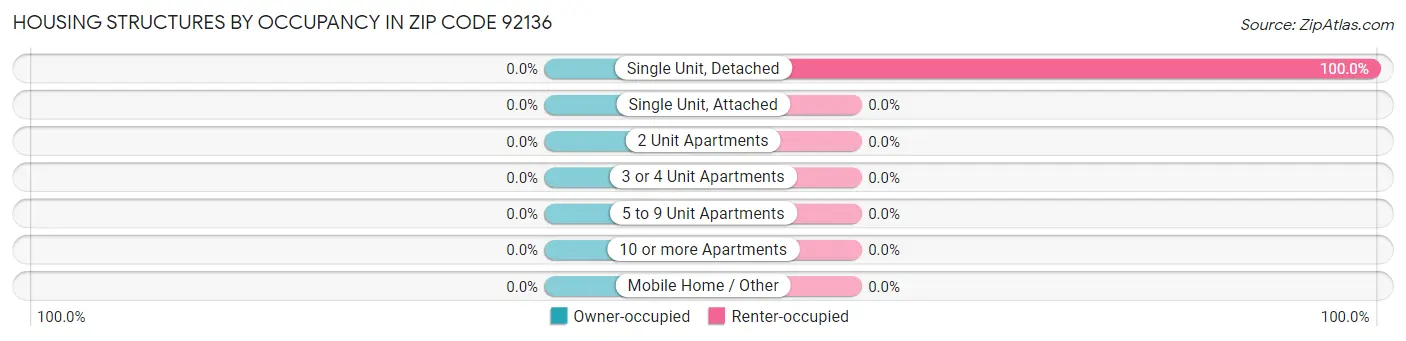
Housing Structures by Occupancy in Zip Code 92136
Structure Type
Owner-occupied
Renter-occupied
Single Unit, Detached
0 (0.0%)
16 (100.0%)
Single Unit, Attached
0 (0.0%)
0 (0.0%)
2 Unit Apartments
0 (0.0%)
0 (0.0%)
3 or 4 Unit Apartments
0 (0.0%)
0 (0.0%)
5 to 9 Unit Apartments
0 (0.0%)
0 (0.0%)
10 or more Apartments
0 (0.0%)
0 (0.0%)
Mobile Home / Other
0 (0.0%)
0 (0.0%)
Total
0 (0.0%)
16 (100.0%)
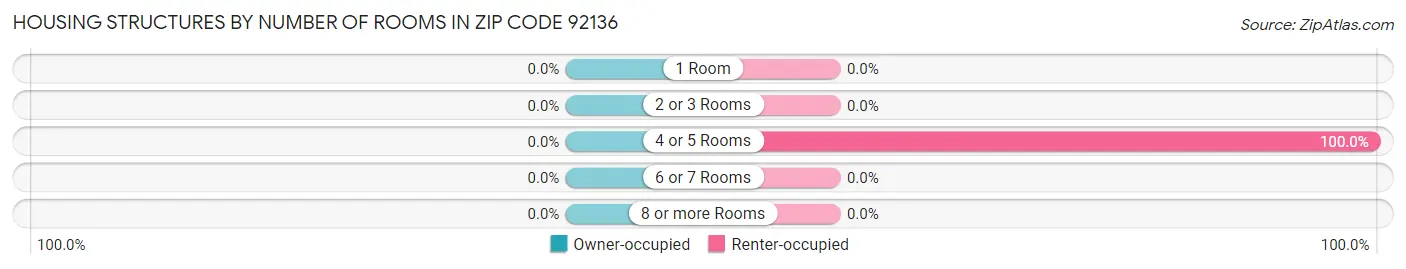
Housing Structures by Number of Rooms in Zip Code 92136
Number of Rooms
Owner-occupied
Renter-occupied
1 Room
0 (0.0%)
0 (0.0%)
2 or 3 Rooms
0 (0.0%)
0 (0.0%)
4 or 5 Rooms
0 (0.0%)
16 (100.0%)
6 or 7 Rooms
0 (0.0%)
0 (0.0%)
8 or more Rooms
0 (0.0%)
0 (0.0%)
Total
0 (0.0%)
16 (100.0%)
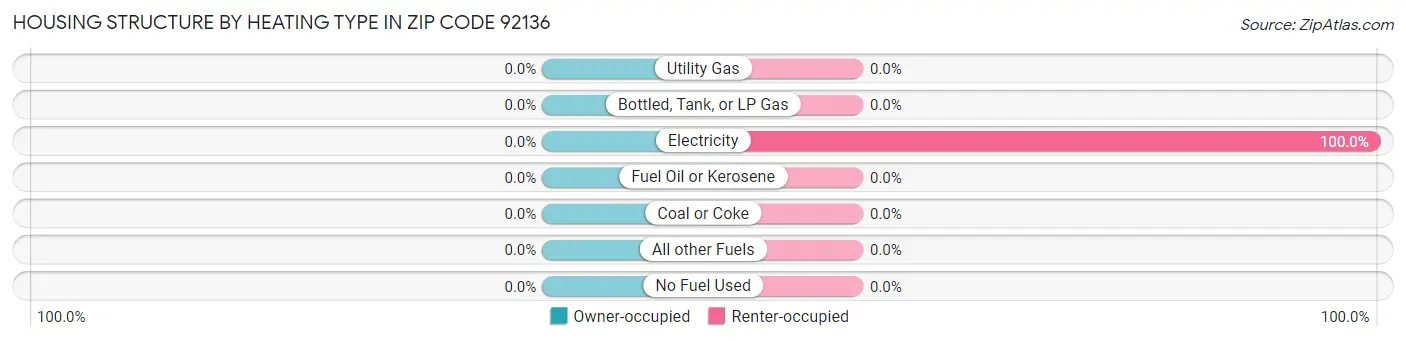
Housing Structure by Heating Type in Zip Code 92136
Heating Type
Owner-occupied
Renter-occupied
Utility Gas
0 (0.0%)
0 (0.0%)
Bottled, Tank, or LP Gas
0 (0.0%)
0 (0.0%)
Electricity
0 (0.0%)
16 (100.0%)
Fuel Oil or Kerosene
0 (0.0%)
0 (0.0%)
Coal or Coke
0 (0.0%)
0 (0.0%)
All other Fuels
0 (0.0%)
0 (0.0%)
No Fuel Used
0 (0.0%)
0 (0.0%)
Total
0 (0.0%)
16 (100.0%)
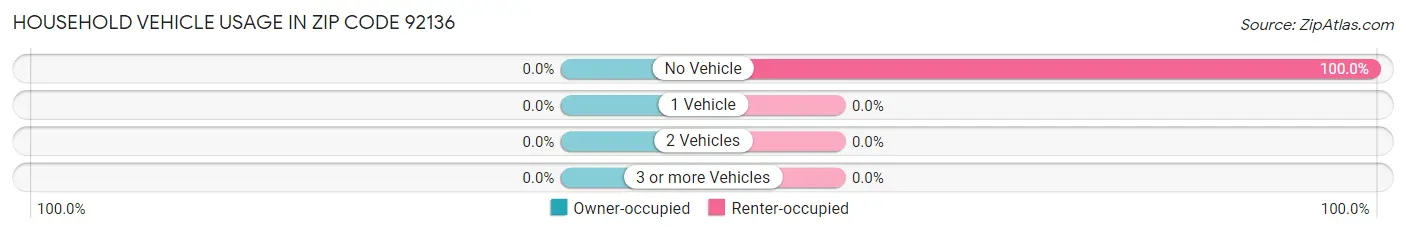
Household Vehicle Usage in Zip Code 92136
Vehicles per Household
Owner-occupied
Renter-occupied
No Vehicle
0 (0.0%)
16 (100.0%)
1 Vehicle
0 (0.0%)
0 (0.0%)
2 Vehicles
0 (0.0%)
0 (0.0%)
3 or more Vehicles
0 (0.0%)
0 (0.0%)
Total
0 (0.0%)
16 (100.0%)
Real Estate & Mortgages in Zip Code 92136
Real Estate and Mortgage Overview in Zip Code 92136
Characteristic
Without Mortgage
With Mortgage
Housing Units
0
0
Median Property Value
-
-
Median Household Income
-
-
Monthly Housing Costs
-
-
Real Estate Taxes
-
-
Property Value by Mortgage Status in Zip Code 92136
Property Value
Without Mortgage
With Mortgage
Less than $50,000
0 (0.0%)
0 (0.0%)
$50,000 to $99,999
0 (0.0%)
0 (0.0%)
$100,000 to $299,999
0 (0.0%)
0 (0.0%)
$300,000 to $499,999
0 (0.0%)
0 (0.0%)
$500,000 to $749,999
0 (0.0%)
0 (0.0%)
$750,000 to $999,999
0 (0.0%)
0 (0.0%)
$1,000,000 or more
0 (0.0%)
0 (0.0%)
Total
0 (0.0%)
0 (0.0%)
Household Income by Mortgage Status in Zip Code 92136
Household Income
Without Mortgage
With Mortgage
Less than $10,000
0 (0.0%)
0 (0.0%)
$10,000 to $24,999
0 (0.0%)
0 (0.0%)
$25,000 to $34,999
0 (0.0%)
0 (0.0%)
$35,000 to $49,999
0 (0.0%)
0 (0.0%)
$50,000 to $74,999
0 (0.0%)
0 (0.0%)
$75,000 to $99,999
0 (0.0%)
0 (0.0%)
$100,000 to $149,999
0 (0.0%)
0 (0.0%)
$150,000 or more
0 (0.0%)
0 (0.0%)
Total
0 (0.0%)
0 (0.0%)
Property Value to Household Income Ratio in Zip Code 92136
Value-to-Income Ratio
Without Mortgage
With Mortgage
Less than 2.0x
0 (0.0%)
0 (0.0%)
2.0x to 2.9x
0 (0.0%)
0 (0.0%)
3.0x to 3.9x
0 (0.0%)
0 (0.0%)
4.0x or more
0 (0.0%)
0 (0.0%)
Total
0 (0.0%)
0 (0.0%)
Real Estate Taxes by Mortgage Status in Zip Code 92136
Property Taxes
Without Mortgage
With Mortgage
Less than $800
0 (0.0%)
0 (0.0%)
$800 to $1,499
0 (0.0%)
0 (0.0%)
$800 to $1,499
0 (0.0%)
0 (0.0%)
Total
0 (0.0%)
0 (0.0%)
Health & Disability in Zip Code 92136
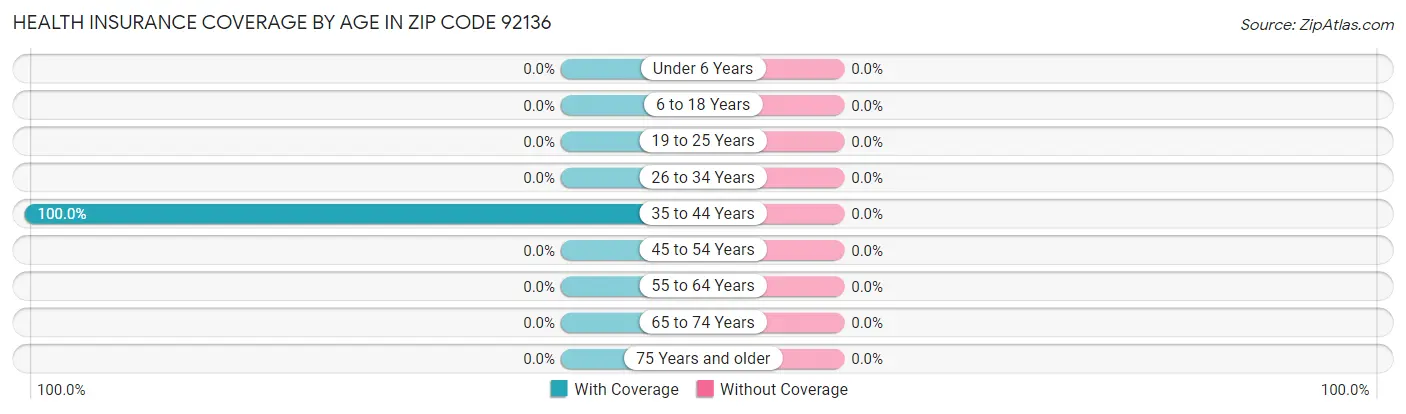
Health Insurance Coverage by Age in Zip Code 92136
Age Bracket
With Coverage
Without Coverage
Under 6 Years
0 (0.0%)
0 (0.0%)
6 to 18 Years
0 (0.0%)
0 (0.0%)
19 to 25 Years
0 (0.0%)
0 (0.0%)
26 to 34 Years
0 (0.0%)
0 (0.0%)
35 to 44 Years
16 (100.0%)
0 (0.0%)
45 to 54 Years
0 (0.0%)
0 (0.0%)
55 to 64 Years
0 (0.0%)
0 (0.0%)
65 to 74 Years
0 (0.0%)
0 (0.0%)
75 Years and older
0 (0.0%)
0 (0.0%)
Total
16 (100.0%)
0 (0.0%)
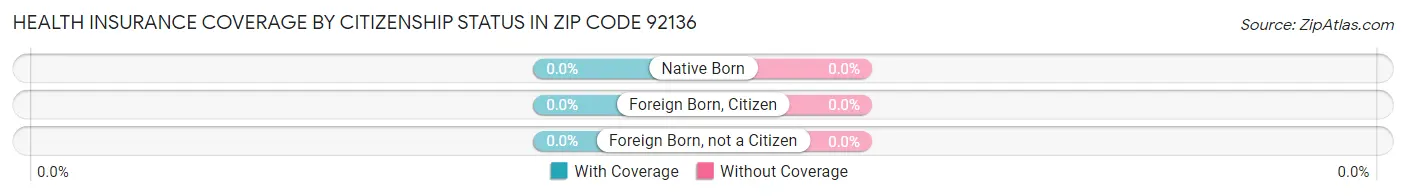
Health Insurance Coverage by Citizenship Status in Zip Code 92136
Citizenship Status
With Coverage
Without Coverage
Native Born
0 (0.0%)
0 (0.0%)
Foreign Born, Citizen
0 (0.0%)
0 (0.0%)
Foreign Born, not a Citizen
0 (0.0%)
0 (0.0%)
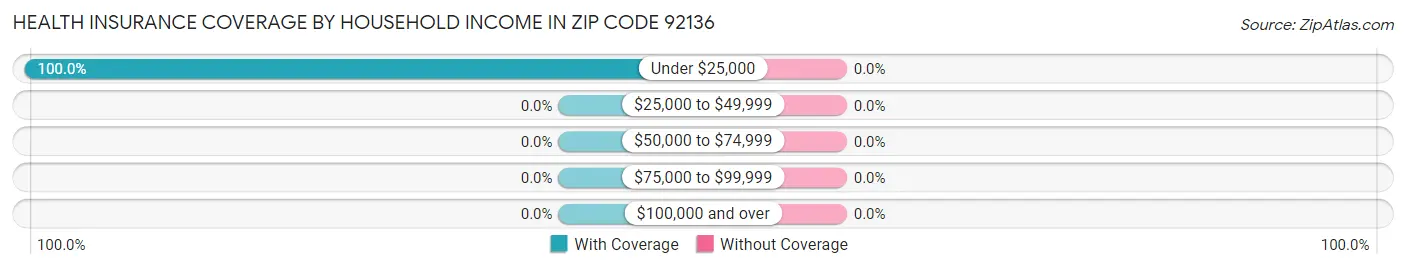
Health Insurance Coverage by Household Income in Zip Code 92136
Household Income
With Coverage
Without Coverage
Under $25,000
16 (100.0%)
0 (0.0%)
$25,000 to $49,999
0 (0.0%)
0 (0.0%)
$50,000 to $74,999
0 (0.0%)
0 (0.0%)
$75,000 to $99,999
0 (0.0%)
0 (0.0%)
$100,000 and over
0 (0.0%)
0 (0.0%)
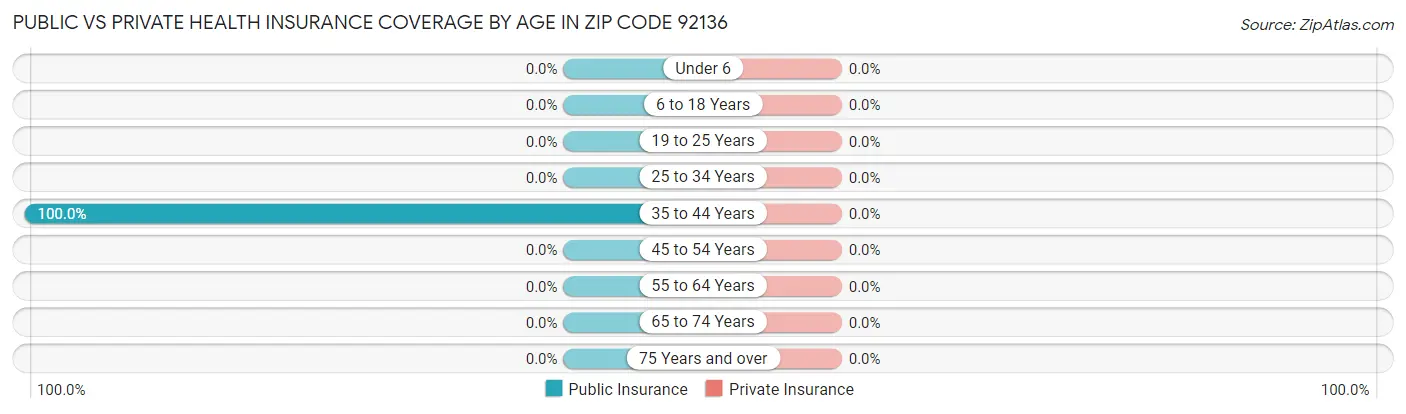
Public vs Private Health Insurance Coverage by Age in Zip Code 92136
Age Bracket
Public Insurance
Private Insurance
Under 6
0 (0.0%)
0 (0.0%)
6 to 18 Years
0 (0.0%)
0 (0.0%)
19 to 25 Years
0 (0.0%)
0 (0.0%)
25 to 34 Years
0 (0.0%)
0 (0.0%)
35 to 44 Years
16 (100.0%)
0 (0.0%)
45 to 54 Years
0 (0.0%)
0 (0.0%)
55 to 64 Years
0 (0.0%)
0 (0.0%)
65 to 74 Years
0 (0.0%)
0 (0.0%)
75 Years and over
0 (0.0%)
0 (0.0%)
Total
16 (100.0%)
0 (0.0%)
Disability Status by Sex by Age in Zip Code 92136
Age Bracket
Male
Female
Under 5 Years
0 (0.0%)
0 (0.0%)
5 to 17 Years
0 (0.0%)
0 (0.0%)
18 to 34 Years
0 (0.0%)
0 (0.0%)
35 to 64 Years
0 (0.0%)
0 (0.0%)
65 to 74 Years
0 (0.0%)
0 (0.0%)
75 Years and over
0 (0.0%)
0 (0.0%)
Disability Class by Sex by Age in Zip Code 92136
Disability Class: Hearing Difficulty
Age Bracket
Male
Female
Under 5 Years
0 (0.0%)
0 (0.0%)
5 to 17 Years
0 (0.0%)
0 (0.0%)
18 to 34 Years
0 (0.0%)
0 (0.0%)
35 to 64 Years
0 (0.0%)
0 (0.0%)
65 to 74 Years
0 (0.0%)
0 (0.0%)
75 Years and over
0 (0.0%)
0 (0.0%)
Disability Class: Vision Difficulty
Age Bracket
Male
Female
Under 5 Years
0 (0.0%)
0 (0.0%)
5 to 17 Years
0 (0.0%)
0 (0.0%)
18 to 34 Years
0 (0.0%)
0 (0.0%)
35 to 64 Years
0 (0.0%)
0 (0.0%)
65 to 74 Years
0 (0.0%)
0 (0.0%)
75 Years and over
0 (0.0%)
0 (0.0%)
Disability Class: Cognitive Difficulty
Age Bracket
Male
Female
5 to 17 Years
0 (0.0%)
0 (0.0%)
18 to 34 Years
0 (0.0%)
0 (0.0%)
35 to 64 Years
0 (0.0%)
0 (0.0%)
65 to 74 Years
0 (0.0%)
0 (0.0%)
75 Years and over
0 (0.0%)
0 (0.0%)
Disability Class: Ambulatory Difficulty
Age Bracket
Male
Female
5 to 17 Years
0 (0.0%)
0 (0.0%)
18 to 34 Years
0 (0.0%)
0 (0.0%)
35 to 64 Years
0 (0.0%)
0 (0.0%)
65 to 74 Years
0 (0.0%)
0 (0.0%)
75 Years and over
0 (0.0%)
0 (0.0%)
Disability Class: Self-Care Difficulty
Age Bracket
Male
Female
5 to 17 Years
0 (0.0%)
0 (0.0%)
18 to 34 Years
0 (0.0%)
0 (0.0%)
35 to 64 Years
0 (0.0%)
0 (0.0%)
65 to 74 Years
0 (0.0%)
0 (0.0%)
75 Years and over
0 (0.0%)
0 (0.0%)
Technology Access in Zip Code 92136
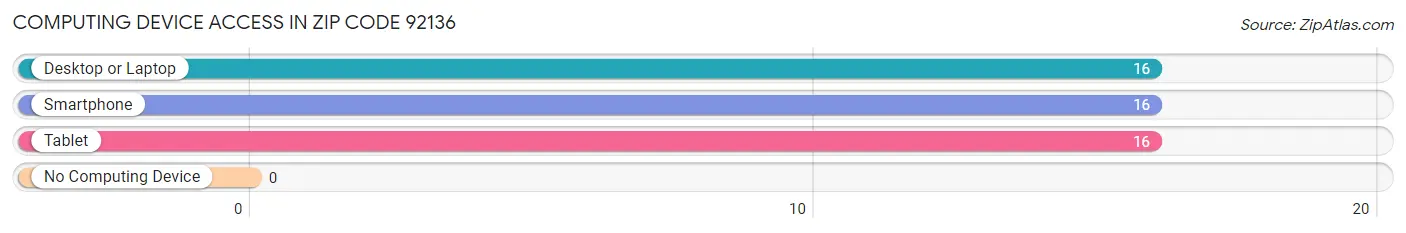
Computing Device Access in Zip Code 92136
Device Type
# Households
% Households
Desktop or Laptop
16
100.0%
Smartphone
16
100.0%
Tablet
16
100.0%
No Computing Device
0
0.0%
Total
16
100.0%
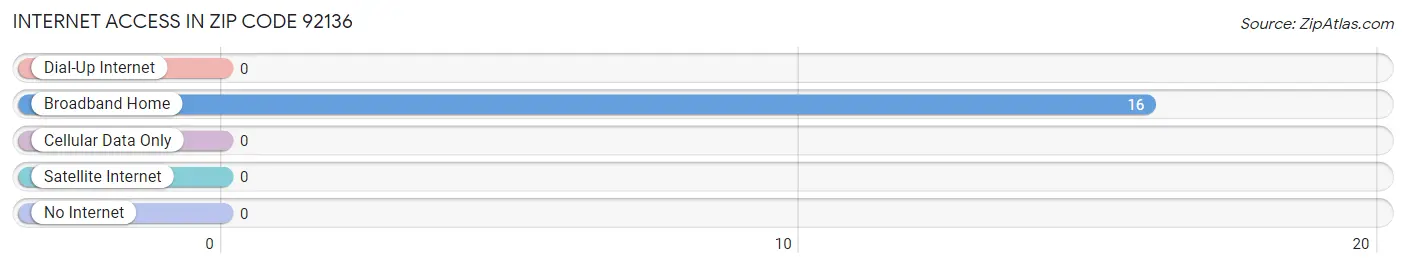
Internet Access in Zip Code 92136
Internet Type
# Households
% Households
Dial-Up Internet
0
0.0%
Broadband Home
16
100.0%
Cellular Data Only
0
0.0%
Satellite Internet
0
0.0%
No Internet
0
0.0%
Total
16
100.0%
Common Questions
What is Per Capita Income in Zip Code 92136?
Per Capita income in Zip Code 92136 is $43,344.
What is Income or Wage Gap in Zip Code 92136?
Income or Wage Gap in Zip Code 92136 is 1.2%.
Women in Zip Code 92136 earn 98.8 cents for every dollar earned by a man.
What is the Total Population of Zip Code 92136?
Total Population of Zip Code 92136 is 9,630.
What is the Total Male Population of Zip Code 92136?
Total Male Population of Zip Code 92136 is 7,641.
What is the Total Female Population of Zip Code 92136?
Total Female Population of Zip Code 92136 is 1,989.
What is the Ratio of Males per 100 Females in Zip Code 92136?
There are 384.16 Males per 100 Females in Zip Code 92136.
What is the Ratio of Females per 100 Males in Zip Code 92136?
There are 26.03 Females per 100 Males in Zip Code 92136.
What is the Median Population Age in Zip Code 92136?
Median Population Age in Zip Code 92136 is 24.2 Years.
How Large is the Labor Force in Zip Code 92136?
There are 9,582 People in the Labor Forcein in Zip Code 92136.
What is the Percentage of People in the Labor Force in Zip Code 92136?
99.5% of People are in the Labor Force in Zip Code 92136.
Report Title
Report Link
HTML Copy & Paste Link
Social Media
Copy and paste the folowing code into any webpage where you would like this interactive chart to display