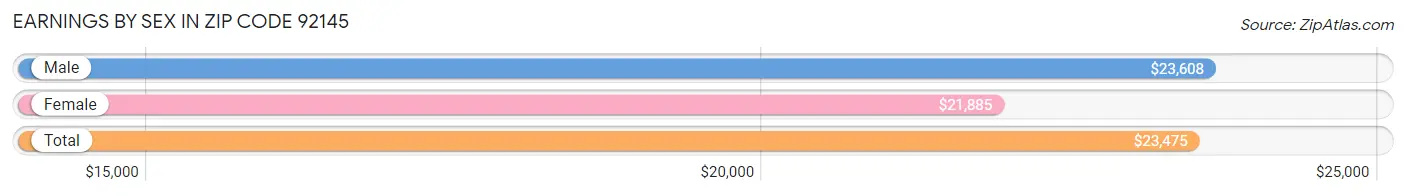
Average Earnings in Zip Code 92145 are $23,475, $23,608 for men and $21,885 for women, a difference of 7.3%.
Sex
Number
Average Earnings
Male
2,459 (89.1%)
$23,608
Female
302 (10.9%)
$21,885
Total
2,761 (100.0%)
$23,475
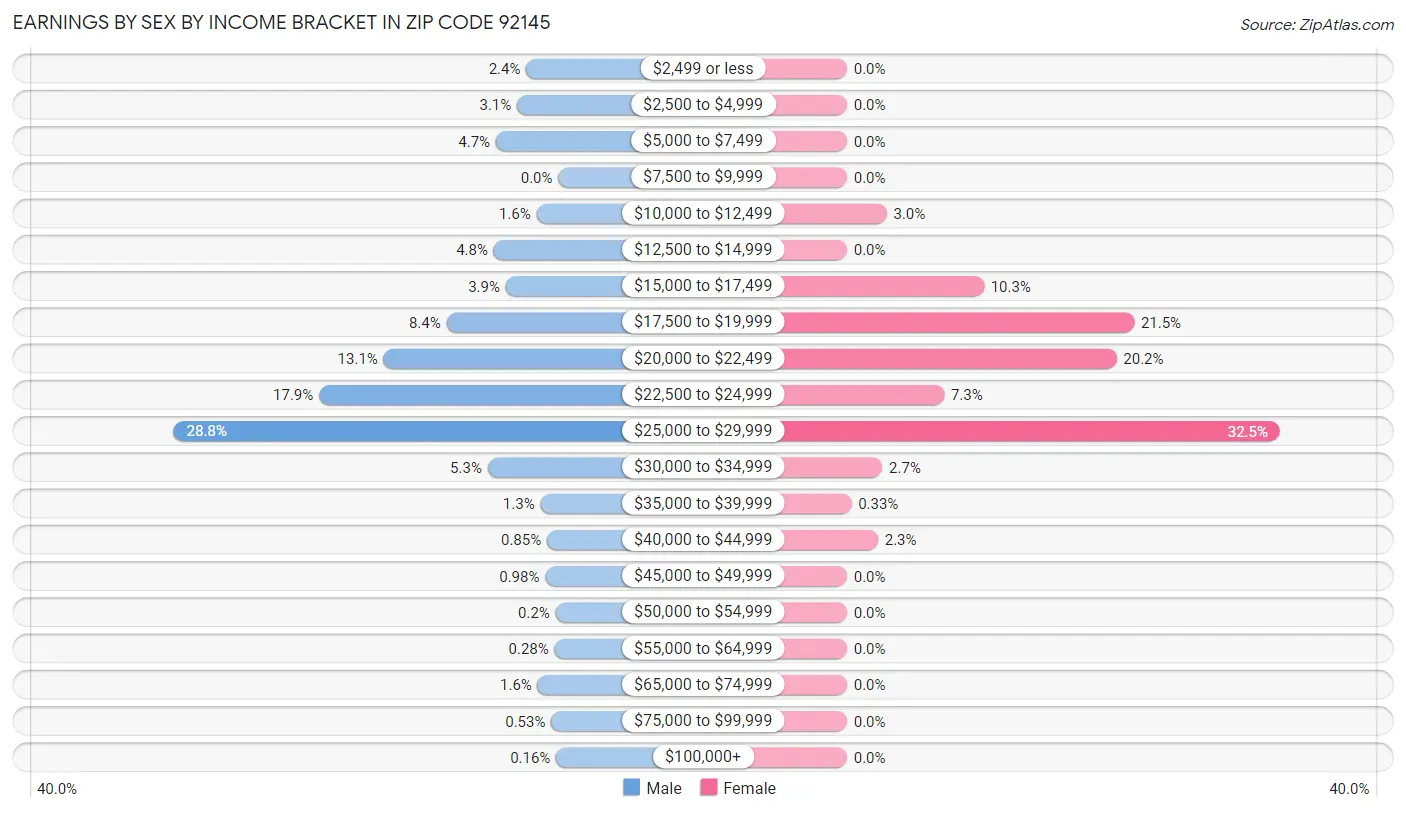
Earnings by Sex by Income Bracket in Zip Code 92145
The most common earnings brackets in Zip Code 92145 are $25,000 to $29,999 for men (709 | 28.8%) and $25,000 to $29,999 for women (98 | 32.5%).
Income
Male
Female
$2,499 or less
59 (2.4%)
0 (0.0%)
$2,500 to $4,999
76 (3.1%)
0 (0.0%)
$5,000 to $7,499
115 (4.7%)
0 (0.0%)
$7,500 to $9,999
0 (0.0%)
0 (0.0%)
$10,000 to $12,499
40 (1.6%)
9 (3.0%)
$12,500 to $14,999
119 (4.8%)
0 (0.0%)
$15,000 to $17,499
97 (3.9%)
31 (10.3%)
$17,500 to $19,999
206 (8.4%)
65 (21.5%)
$20,000 to $22,499
322 (13.1%)
61 (20.2%)
$22,500 to $24,999
441 (17.9%)
22 (7.3%)
$25,000 to $29,999
709 (28.8%)
98 (32.5%)
$30,000 to $34,999
130 (5.3%)
8 (2.6%)
$35,000 to $39,999
33 (1.3%)
1 (0.3%)
$40,000 to $44,999
21 (0.9%)
7 (2.3%)
$45,000 to $49,999
24 (1.0%)
0 (0.0%)
$50,000 to $54,999
5 (0.2%)
0 (0.0%)
$55,000 to $64,999
7 (0.3%)
0 (0.0%)
$65,000 to $74,999
38 (1.5%)
0 (0.0%)
$75,000 to $99,999
13 (0.5%)
0 (0.0%)
$100,000+
4 (0.2%)
0 (0.0%)
Total
2,459 (100.0%)
302 (100.0%)
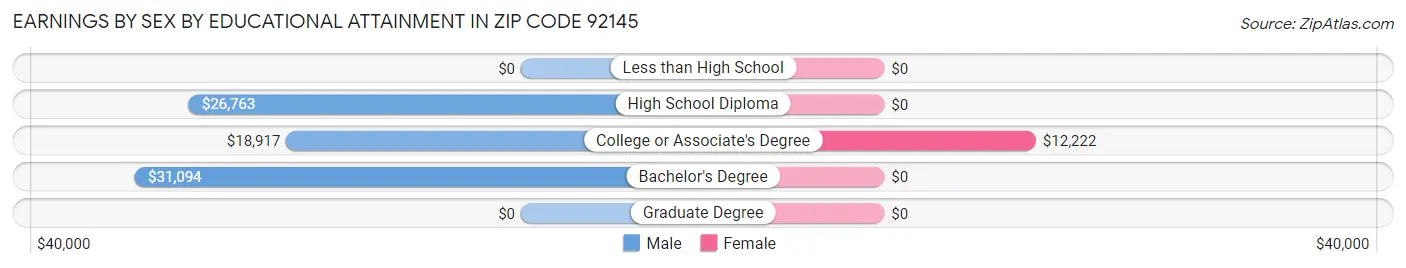
Earnings by Sex by Educational Attainment in Zip Code 92145
Average earnings in Zip Code 92145 are $25,095 for men and $19,750 for women, a difference of 21.3%. Men with an educational attainment of bachelor's degree enjoy the highest average annual earnings of $31,094, while those with college or associate's degree education earn the least with $18,917. Women with an educational attainment of college or associate's degree earn the most with the average annual earnings of $12,222, while those with college or associate's degree education have the smallest earnings of $12,222.
Educational Attainment
Male Income
Female Income
Less than High School
-
-
High School Diploma
$26,763
$0
College or Associate's Degree
$18,917
$12,222
Bachelor's Degree
$31,094
$0
Graduate Degree
-
-
Total
$25,095
$19,750
Family Income in Zip Code 92145
Family Income Brackets in Zip Code 92145
Income Bracket
# Families
% Families
Less than $10,000
0
0.0%
$10,000 to $14,999
0
0.0%
$15,000 to $24,999
0
0.0%
$25,000 to $34,999
0
0.0%
$35,000 to $49,999
0
0.0%
$50,000 to $74,999
0
0.0%
$75,000 to $99,999
0
0.0%
$100,000 to $149,999
0
0.0%
$150,000 to $199,999
0
0.0%
$200,000+
0
0.0%
Family Income by Famaliy Size in Zip Code 92145
Income Bracket
# Families
Median Income
2-Person Families
0 (0.0%)
$0
3-Person Families
0 (0.0%)
$0
4-Person Families
0 (0.0%)
$0
5-Person Families
0 (0.0%)
$0
6-Person Families
0 (0.0%)
$0
7+ Person Families
0 (0.0%)
$0
Total
0 (0.0%)
$0
Family Income by Number of Earners in Zip Code 92145
Number of Earners
# Families
Median Income
No Earners
0 (0.0%)
$0
1 Earner
0 (0.0%)
$0
2 Earners
0 (0.0%)
$0
3+ Earners
0 (0.0%)
$0
Total
0 (0.0%)
$0
Household Income in Zip Code 92145
Household Income Brackets in Zip Code 92145
Income Bracket
# Households
% Households
Less than $10,000
0
0.0%
$10,000 to $14,999
0
0.0%
$15,000 to $24,999
0
0.0%
$25,000 to $34,999
0
0.0%
$35,000 to $49,999
0
0.0%
$50,000 to $74,999
0
0.0%
$75,000 to $99,999
0
0.0%
$100,000 to $149,999
0
0.0%
$150,000 to $199,999
0
0.0%
$200,000+
0
0.0%
Household Income by Householder Age in Zip Code 92145
Income Bracket
# Households
Median Income
15 to 24 Years
0 (0.0%)
$0
25 to 44 Years
0 (0.0%)
$0
45 to 64 Years
0 (0.0%)
$0
65+ Years
0 (0.0%)
$0
Total
0 (0.0%)
$0
Poverty in Zip Code 92145
Income Below Poverty by Sex and Age in Zip Code 92145
Age Bracket
Male
Female
Under 5 Years
0 (0.0%)
0 (0.0%)
5 Years
0 (0.0%)
0 (0.0%)
6 to 11 Years
0 (0.0%)
0 (0.0%)
12 to 14 Years
0 (0.0%)
0 (0.0%)
15 Years
0 (0.0%)
0 (0.0%)
16 and 17 Years
0 (0.0%)
0 (0.0%)
18 to 24 Years
0 (0.0%)
0 (0.0%)
25 to 34 Years
0 (0.0%)
0 (0.0%)
35 to 44 Years
0 (0.0%)
0 (0.0%)
45 to 54 Years
0 (0.0%)
0 (0.0%)
55 to 64 Years
0 (0.0%)
0 (0.0%)
65 to 74 Years
0 (0.0%)
0 (0.0%)
75 Years and over
0 (0.0%)
0 (0.0%)
Total
0 (0.0%)
0 (0.0%)
Income Above Poverty by Sex and Age in Zip Code 92145
Age Bracket
Male
Female
Under 5 Years
0 (0.0%)
0 (0.0%)
5 Years
0 (0.0%)
0 (0.0%)
6 to 11 Years
0 (0.0%)
0 (0.0%)
12 to 14 Years
0 (0.0%)
0 (0.0%)
15 Years
0 (0.0%)
0 (0.0%)
16 and 17 Years
0 (0.0%)
0 (0.0%)
18 to 24 Years
0 (0.0%)
0 (0.0%)
25 to 34 Years
0 (0.0%)
0 (0.0%)
35 to 44 Years
0 (0.0%)
0 (0.0%)
45 to 54 Years
0 (0.0%)
0 (0.0%)
55 to 64 Years
0 (0.0%)
0 (0.0%)
65 to 74 Years
0 (0.0%)
0 (0.0%)
75 Years and over
0 (0.0%)
0 (0.0%)
Total
0 (0.0%)
0 (0.0%)
Income Below Poverty Among Married-Couple Families in Zip Code 92145
Children
Above Poverty
Below Poverty
No Children
0 (0.0%)
0 (0.0%)
1 or 2 Children
0 (0.0%)
0 (0.0%)
3 or 4 Children
0 (0.0%)
0 (0.0%)
5 or more Children
0 (0.0%)
0 (0.0%)
Total
0 (0.0%)
0 (0.0%)
Income Below Poverty Among Single-Parent Households in Zip Code 92145
Children
Single Father
Single Mother
No Children
0 (0.0%)
0 (0.0%)
1 or 2 Children
0 (0.0%)
0 (0.0%)
3 or 4 Children
0 (0.0%)
0 (0.0%)
5 or more Children
0 (0.0%)
0 (0.0%)
Total
0 (0.0%)
0 (0.0%)
Income Below Poverty Among Married-Couple vs Single-Parent Households in Zip Code 92145
Children
Married-Couple Families
Single-Parent Households
No Children
0 (0.0%)
0 (0.0%)
1 or 2 Children
0 (0.0%)
0 (0.0%)
3 or 4 Children
0 (0.0%)
0 (0.0%)
5 or more Children
0 (0.0%)
0 (0.0%)
Total
0 (0.0%)
0 (0.0%)
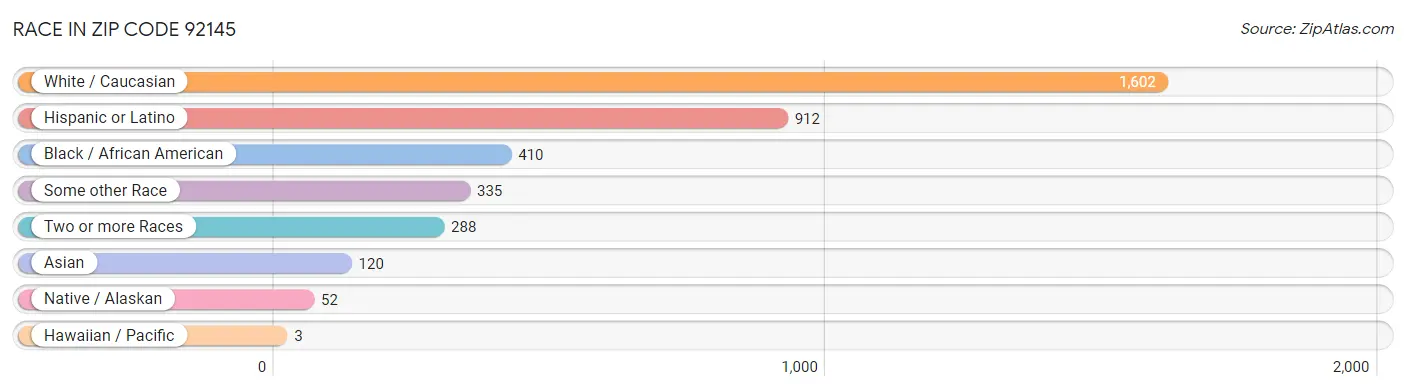
Race in Zip Code 92145
The most populous races in Zip Code 92145 are White / Caucasian (1,602 | 57.0%), Hispanic or Latino (912 | 32.5%), and Black / African American (410 | 14.6%).
Race
# Population
% Population
Asian
120
4.3%
Black / African American
410
14.6%
Hawaiian / Pacific
3
0.1%
Hispanic or Latino
912
32.5%
Native / Alaskan
52
1.8%
White / Caucasian
1,602
57.0%
Two or more Races
288
10.2%
Some other Race
335
11.9%
Total
2,810
100.0%
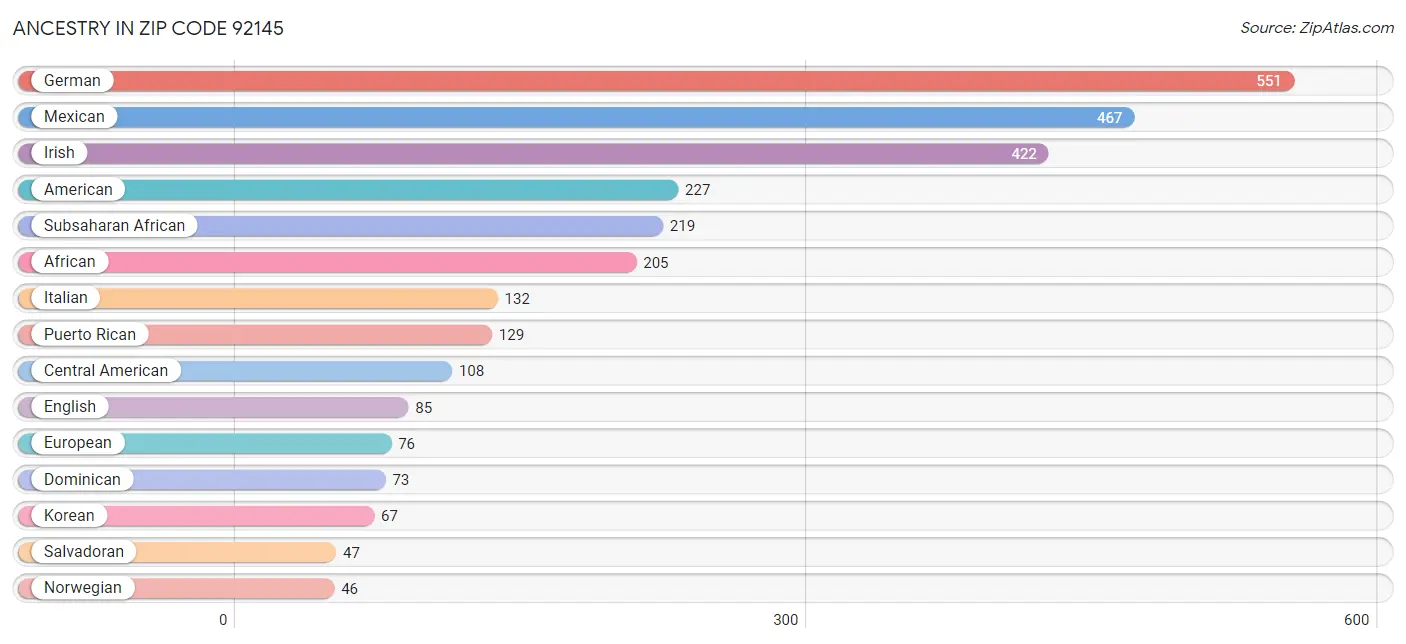
Ancestry in Zip Code 92145
The most populous ancestries reported in Zip Code 92145 are German (551 | 19.6%), Mexican (467 | 16.6%), Irish (422 | 15.0%), American (227 | 8.1%), and Subsaharan African (219 | 7.8%), together accounting for 67.1% of all Zip Code 92145 residents.
Ancestry
# Population
% Population
African
205
7.3%
American
227
8.1%
Arab
6
0.2%
Assyrian / Chaldean / Syriac
25
0.9%
Bangladeshi
4
0.1%
Belgian
9
0.3%
Bhutanese
4
0.1%
Blackfeet
5
0.2%
British
15
0.5%
Burmese
16
0.6%
Canadian
6
0.2%
Central American
108
3.8%
Colombian
1
0.0%
Costa Rican
28
1.0%
Cuban
36
1.3%
Dominican
73
2.6%
Dutch
11
0.4%
Ecuadorian
6
0.2%
English
85
3.0%
European
76
2.7%
Finnish
4
0.1%
French
26
0.9%
French Canadian
1
0.0%
German
551
19.6%
Ghanaian
5
0.2%
Greek
6
0.2%
Guatemalan
25
0.9%
Indian (Asian)
36
1.3%
Irish
422
15.0%
Italian
132
4.7%
Korean
67
2.4%
Lebanese
6
0.2%
Mexican
467
16.6%
Native Hawaiian
5
0.2%
Navajo
19
0.7%
Nicaraguan
4
0.1%
Nigerian
9
0.3%
Northern European
6
0.2%
Norwegian
46
1.6%
Panamanian
3
0.1%
Peruvian
27
1.0%
Polish
4
0.1%
Portuguese
3
0.1%
Puerto Rican
129
4.6%
Russian
6
0.2%
Salvadoran
47
1.7%
Scandinavian
32
1.1%
Scotch-Irish
5
0.2%
Scottish
42
1.5%
Slovene
5
0.2%
South American
34
1.2%
Spaniard
38
1.3%
Sri Lankan
8
0.3%
Subsaharan African
219
7.8%
Swedish
39
1.4%
Thai
11
0.4%
View All 56 Rows
Immigrants in Zip Code 92145
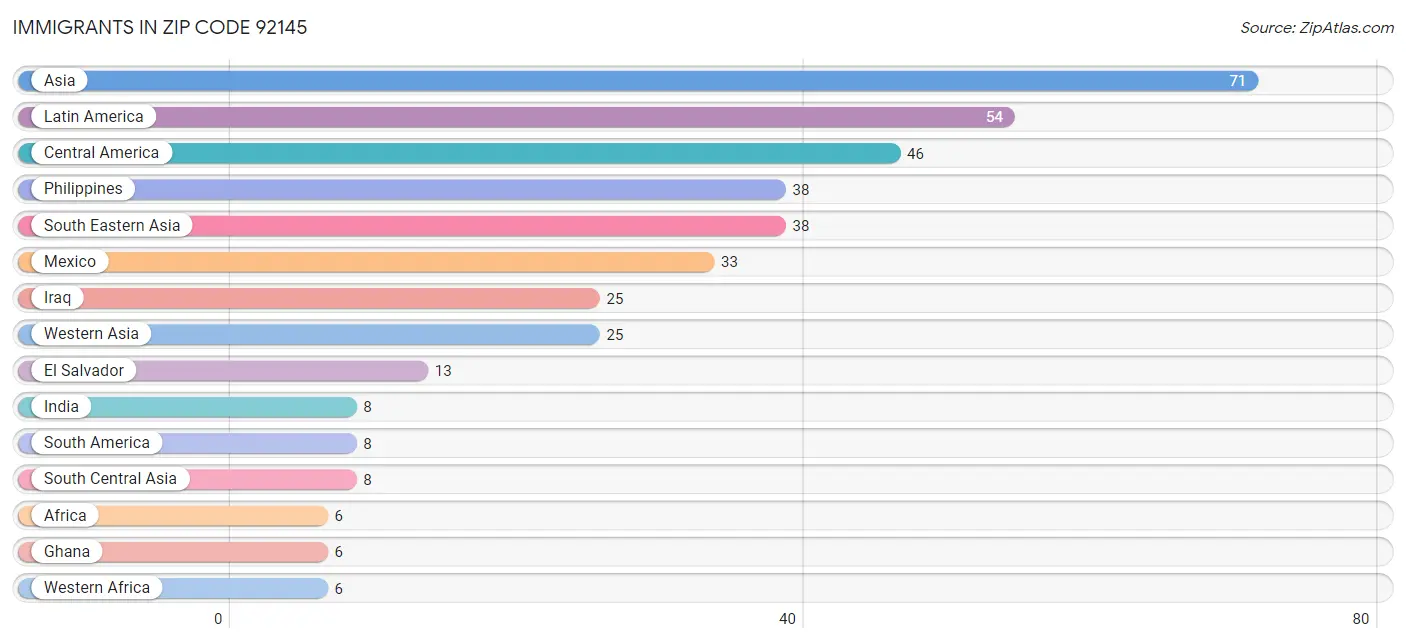
The most numerous immigrant groups reported in Zip Code 92145 came from Asia (71 | 2.5%), Latin America (54 | 1.9%), Central America (46 | 1.6%), Philippines (38 | 1.3%), and South Eastern Asia (38 | 1.3%), together accounting for 8.8% of all Zip Code 92145 residents.
Immigration Origin
# Population
% Population
Africa
6
0.2%
Asia
71
2.5%
Canada
3
0.1%
Central America
46
1.6%
Eastern Europe
2
0.1%
Ecuador
4
0.1%
El Salvador
13
0.5%
Europe
2
0.1%
Ghana
6
0.2%
India
8
0.3%
Iraq
25
0.9%
Latin America
54
1.9%
Mexico
33
1.2%
Peru
4
0.1%
Philippines
38
1.3%
Poland
2
0.1%
South America
8
0.3%
South Central Asia
8
0.3%
South Eastern Asia
38
1.3%
Western Africa
6
0.2%
Western Asia
25
0.9%
View All 21 Rows
Sex and Age in Zip Code 92145
Sex and Age in Zip Code 92145
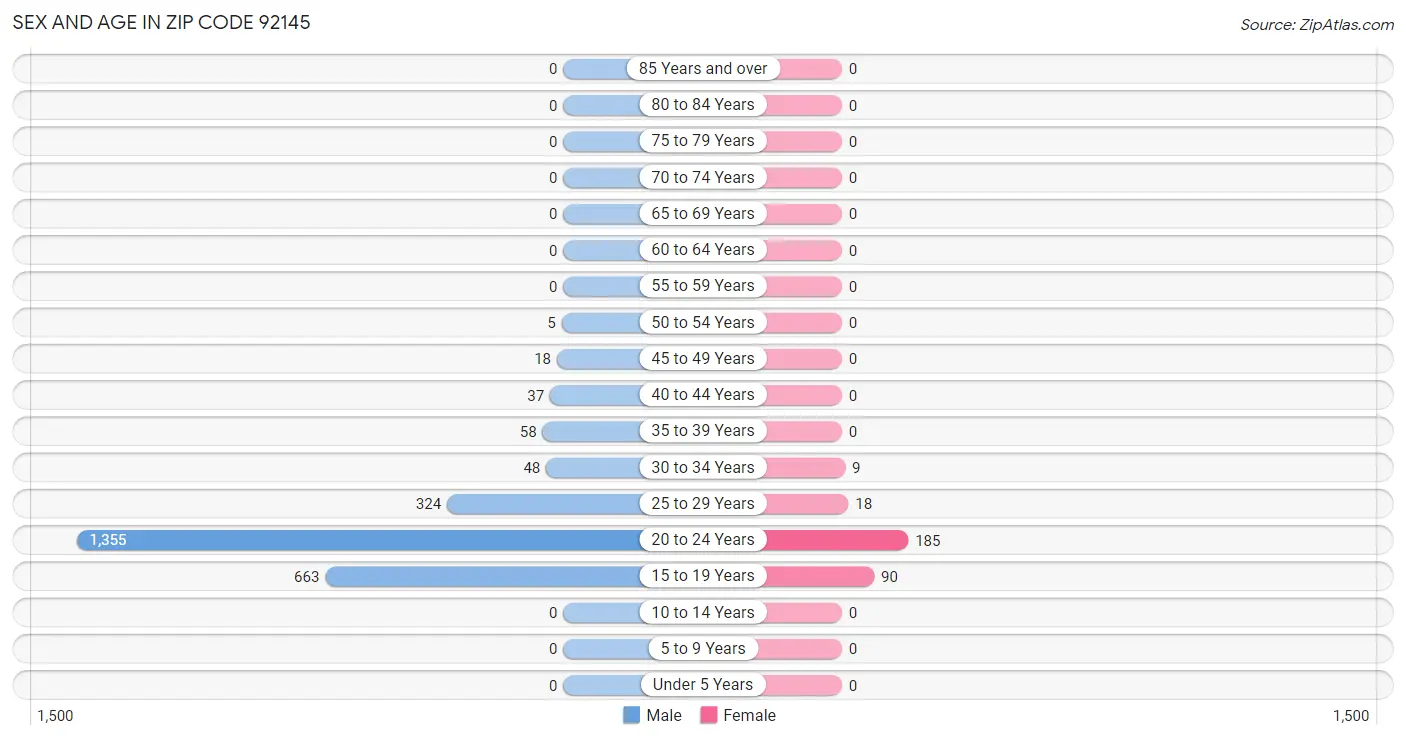
The most populous age groups in Zip Code 92145 are 20 to 24 Years (1,355 | 54.0%) for men and 20 to 24 Years (185 | 61.3%) for women.
Age Bracket
Male
Female
Under 5 Years
0 (0.0%)
0 (0.0%)
5 to 9 Years
0 (0.0%)
0 (0.0%)
10 to 14 Years
0 (0.0%)
0 (0.0%)
15 to 19 Years
663 (26.4%)
90 (29.8%)
20 to 24 Years
1,355 (54.0%)
185 (61.3%)
25 to 29 Years
324 (12.9%)
18 (6.0%)
30 to 34 Years
48 (1.9%)
9 (3.0%)
35 to 39 Years
58 (2.3%)
0 (0.0%)
40 to 44 Years
37 (1.5%)
0 (0.0%)
45 to 49 Years
18 (0.7%)
0 (0.0%)
50 to 54 Years
5 (0.2%)
0 (0.0%)
55 to 59 Years
0 (0.0%)
0 (0.0%)
60 to 64 Years
0 (0.0%)
0 (0.0%)
65 to 69 Years
0 (0.0%)
0 (0.0%)
70 to 74 Years
0 (0.0%)
0 (0.0%)
75 to 79 Years
0 (0.0%)
0 (0.0%)
80 to 84 Years
0 (0.0%)
0 (0.0%)
85 Years and over
0 (0.0%)
0 (0.0%)
Total
2,508 (100.0%)
302 (100.0%)
Families and Households in Zip Code 92145
Median Family Size in Zip Code 92145
Family Type
# Families
Family Size
Married-Couple
0 (0.0%)
-
Single Male/Father
0 (0.0%)
-
Single Female/Mother
0 (0.0%)
-
Total Families
0 (0.0%)
-
Median Household Size in Zip Code 92145
Household Type
# Households
Household Size
Married-Couple
0 (0.0%)
-
Single Male/Father
0 (0.0%)
-
Single Female/Mother
0 (0.0%)
-
Non-family
0 (0.0%)
-
Total Households
0 (0.0%)
-
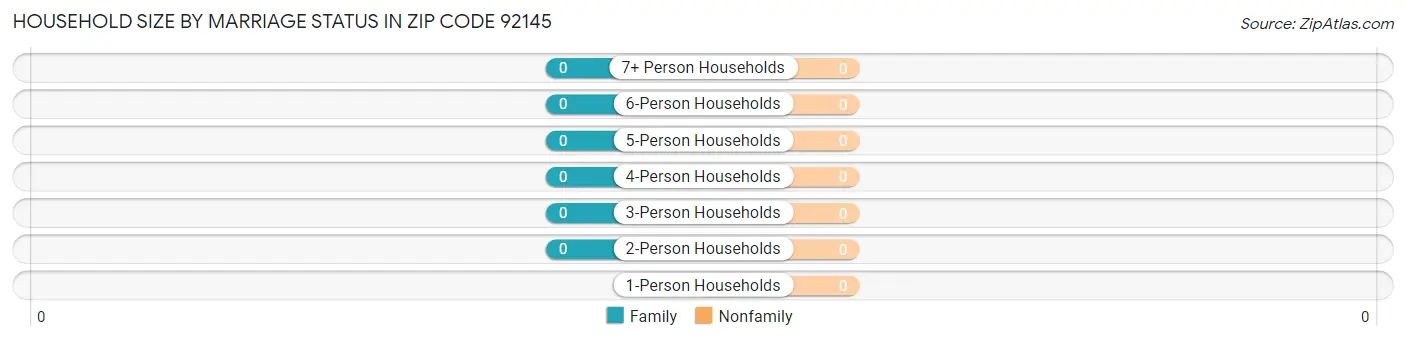
Household Size by Marriage Status in Zip Code 92145
Household Size
Family Households
Nonfamily Households
1-Person Households
-
0 (0.0%)
2-Person Households
0 (0.0%)
0 (0.0%)
3-Person Households
0 (0.0%)
0 (0.0%)
4-Person Households
0 (0.0%)
0 (0.0%)
5-Person Households
0 (0.0%)
0 (0.0%)
6-Person Households
0 (0.0%)
0 (0.0%)
7+ Person Households
0 (0.0%)
0 (0.0%)
Total
0 (0.0%)
0 (0.0%)
Female Fertility in Zip Code 92145
Fertility by Age in Zip Code 92145
Age Bracket
Women with Births
Births / 1,000 Women
15 to 19 years
0 (0.0%)
0.0
20 to 34 years
0 (0.0%)
0.0
35 to 50 years
0 (0.0%)
0.0
Total
0 (0.0%)
0.0
Fertility by Age by Marriage Status in Zip Code 92145
Age Bracket
Married
Unmarried
15 to 19 years
0 (0.0%)
0 (0.0%)
20 to 34 years
0 (0.0%)
0 (0.0%)
35 to 50 years
0 (0.0%)
0 (0.0%)
Total
0 (0.0%)
0 (0.0%)
Fertility by Education in Zip Code 92145
Educational Attainment
Women with Births
Births / 1,000 Women
Less than High School
0 (0.0%)
0.0
High School Diploma
0 (0.0%)
0.0
College or Associate's Degree
0 (0.0%)
0.0
Bachelor's Degree
0 (0.0%)
0.0
Graduate Degree
0 (0.0%)
0.0
Total
0 (0.0%)
0.0
Fertility by Education by Marriage Status in Zip Code 92145
Educational Attainment
Married
Unmarried
Less than High School
0 (0.0%)
0 (0.0%)
High School Diploma
0 (0.0%)
0 (0.0%)
College or Associate's Degree
0 (0.0%)
0 (0.0%)
Bachelor's Degree
0 (0.0%)
0 (0.0%)
Graduate Degree
0 (0.0%)
0 (0.0%)
Total
0 (0.0%)
0 (0.0%)
Employment Characteristics in Zip Code 92145
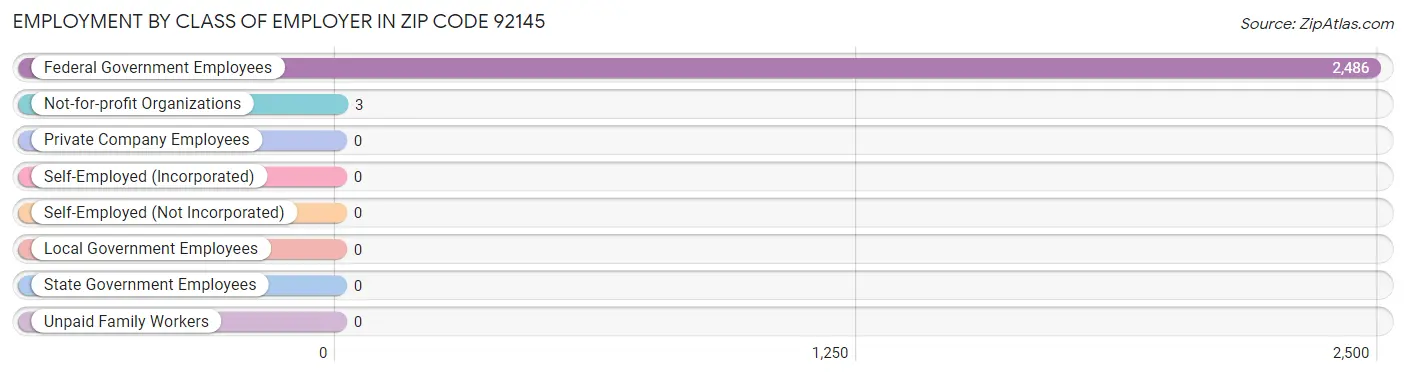
Employment by Class of Employer in Zip Code 92145
Among the 2,489 employed individuals in Zip Code 92145, federal government employees (2,486 | 99.9%), and not-for-profit organizations (3 | 0.1%) make up the most common classes of employment.
Employer Class
# Employees
% Employees
Private Company Employees
0
0.0%
Self-Employed (Incorporated)
0
0.0%
Self-Employed (Not Incorporated)
0
0.0%
Not-for-profit Organizations
3
0.1%
Local Government Employees
0
0.0%
State Government Employees
0
0.0%
Federal Government Employees
2,486
99.9%
Unpaid Family Workers
0
0.0%
Total
2,489
100.0%
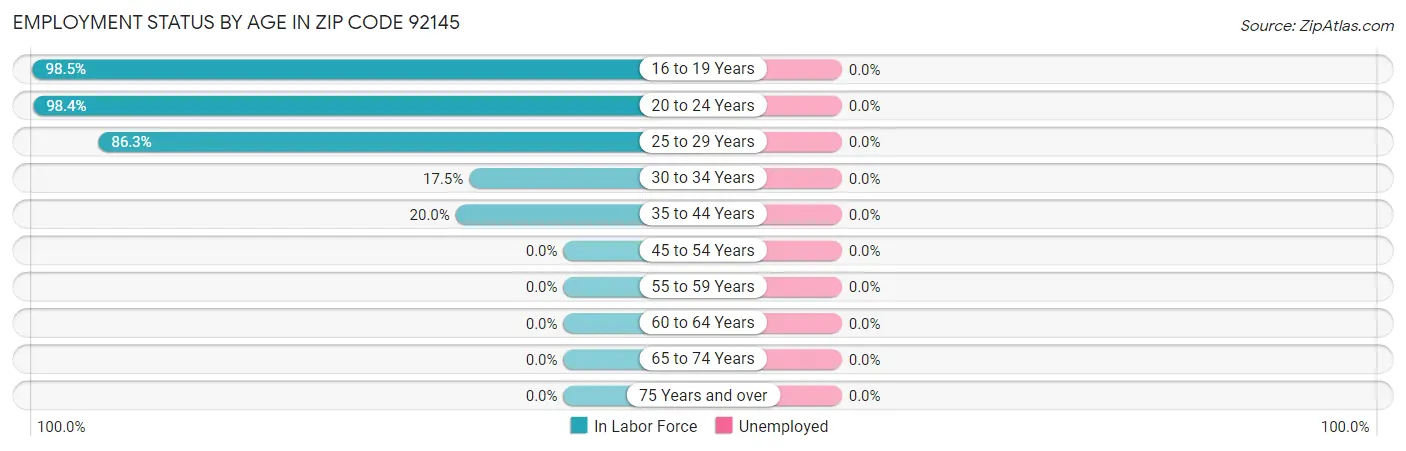
Employment Status by Age in Zip Code 92145
Age Bracket
In Labor Force
Unemployed
16 to 19 Years
742 (98.5%)
0 (0.0%)
20 to 24 Years
1,515 (98.4%)
0 (0.0%)
25 to 29 Years
295 (86.3%)
0 (0.0%)
30 to 34 Years
10 (17.5%)
0 (0.0%)
35 to 44 Years
19 (20.0%)
0 (0.0%)
45 to 54 Years
0 (0.0%)
0 (0.0%)
55 to 59 Years
0 (0.0%)
0 (0.0%)
60 to 64 Years
0 (0.0%)
0 (0.0%)
65 to 74 Years
0 (0.0%)
0 (0.0%)
75 Years and over
0 (0.0%)
0 (0.0%)
Total
2,582 (91.9%)
0 (0.0%)
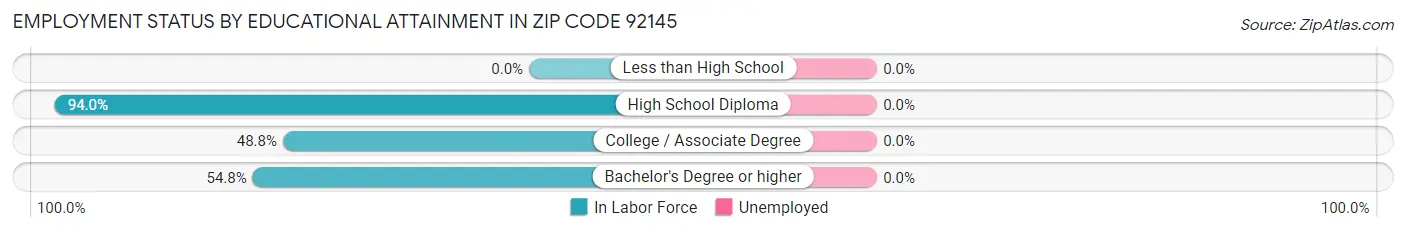
Employment Status by Educational Attainment in Zip Code 92145
Educational Attainment
In Labor Force
Unemployed
Less than High School
0 (0.0%)
0 (0.0%)
High School Diploma
140 (94.0%)
0 (0.0%)
College / Associate Degree
144 (48.8%)
0 (0.0%)
Bachelor's Degree or higher
40 (54.8%)
0 (0.0%)
Total
324 (62.7%)
0 (0.0%)
Employment Occupations by Sex in Zip Code 92145
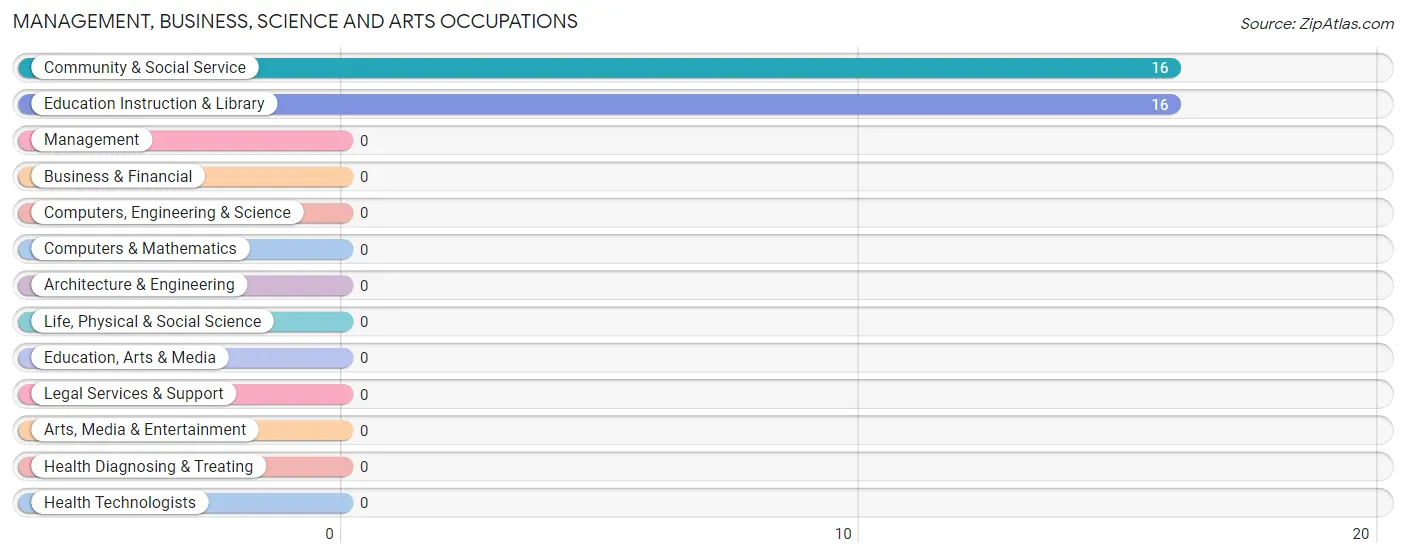
Management, Business, Science and Arts Occupations
The most common Management, Business, Science and Arts occupations in Zip Code 92145 are Community & Social Service (16 | 55.2%), and Education Instruction & Library (16 | 55.2%).
Management, Business, Science and Arts Occupations by Sex
Occupation
Male
Female
Management
0 (0.0%)
0 (0.0%)
Business & Financial
0 (0.0%)
0 (0.0%)
Computers, Engineering & Science
0 (0.0%)
0 (0.0%)
Computers & Mathematics
0 (0.0%)
0 (0.0%)
Architecture & Engineering
0 (0.0%)
0 (0.0%)
Life, Physical & Social Science
0 (0.0%)
0 (0.0%)
Community & Social Service
16 (100.0%)
0 (0.0%)
Education, Arts & Media
0 (0.0%)
0 (0.0%)
Legal Services & Support
0 (0.0%)
0 (0.0%)
Education Instruction & Library
16 (100.0%)
0 (0.0%)
Arts, Media & Entertainment
0 (0.0%)
0 (0.0%)
Health Diagnosing & Treating
0 (0.0%)
0 (0.0%)
Health Technologists
0 (0.0%)
0 (0.0%)
Total (Category)
16 (100.0%)
0 (0.0%)
Total (Overall)
29 (100.0%)
0 (0.0%)
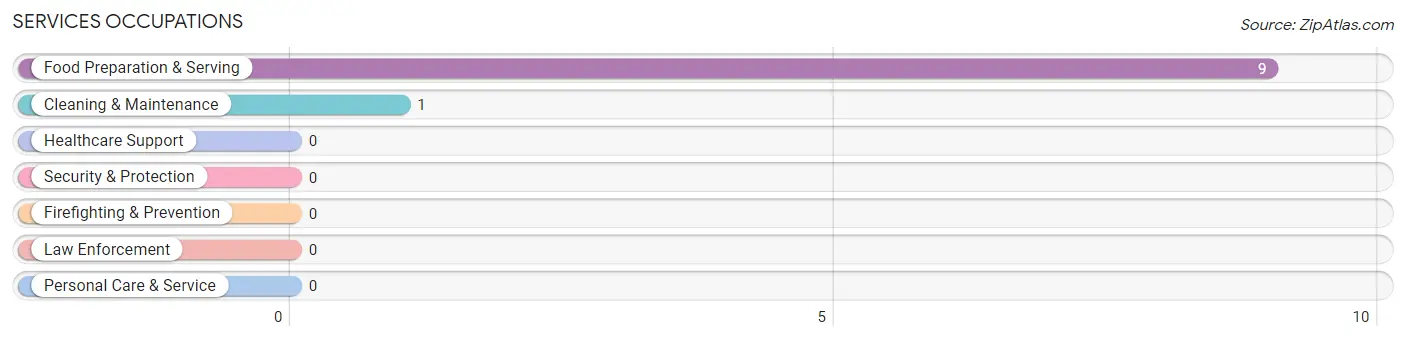
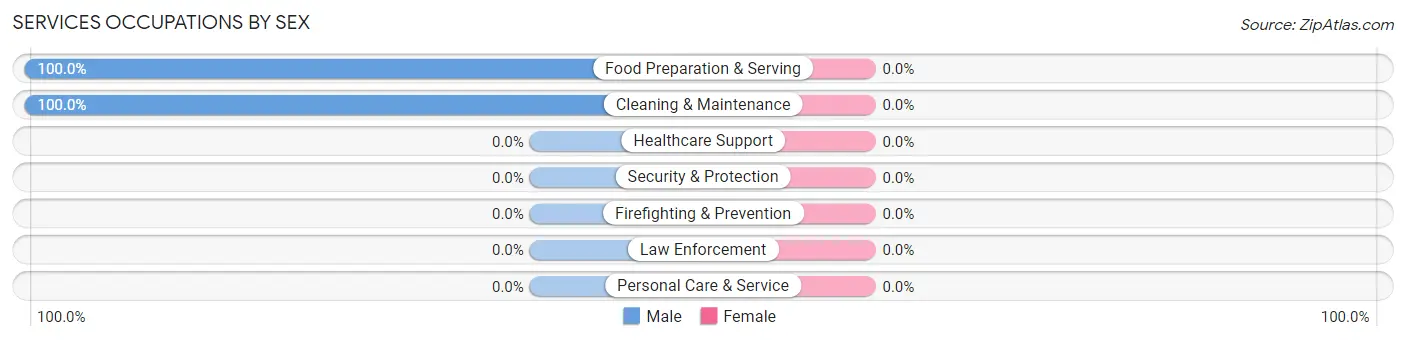
Services Occupations
The most common Services occupations in Zip Code 92145 are Food Preparation & Serving (9 | 31.0%), and Cleaning & Maintenance (1 | 3.5%).
Services Occupations by Sex
Occupation
Male
Female
Healthcare Support
0 (0.0%)
0 (0.0%)
Security & Protection
0 (0.0%)
0 (0.0%)
Firefighting & Prevention
0 (0.0%)
0 (0.0%)
Law Enforcement
0 (0.0%)
0 (0.0%)
Food Preparation & Serving
9 (100.0%)
0 (0.0%)
Cleaning & Maintenance
1 (100.0%)
0 (0.0%)
Personal Care & Service
0 (0.0%)
0 (0.0%)
Total (Category)
10 (100.0%)
0 (0.0%)
Total (Overall)
29 (100.0%)
0 (0.0%)
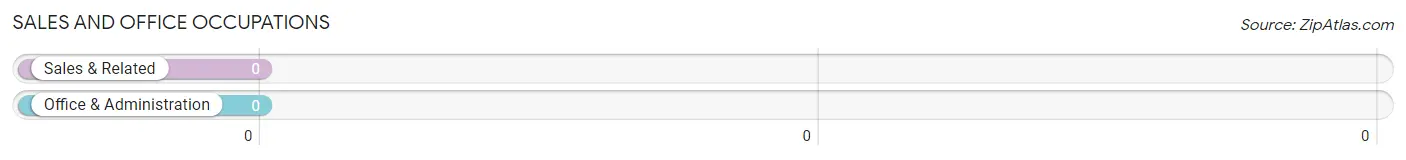
Sales and Office Occupations
Sales and Office Occupations by Sex
Occupation
Male
Female
Sales & Related
0 (0.0%)
0 (0.0%)
Office & Administration
0 (0.0%)
0 (0.0%)
Total (Category)
0 (0.0%)
0 (0.0%)
Total (Overall)
29 (100.0%)
0 (0.0%)
Natural Resources, Construction and Maintenance Occupations
Natural Resources, Construction and Maintenance Occupations by Sex
Occupation
Male
Female
Farming, Fishing & Forestry
0 (0.0%)
0 (0.0%)
Construction & Extraction
0 (0.0%)
0 (0.0%)
Installation, Maintenance & Repair
0 (0.0%)
0 (0.0%)
Total (Category)
0 (0.0%)
0 (0.0%)
Total (Overall)
29 (100.0%)
0 (0.0%)
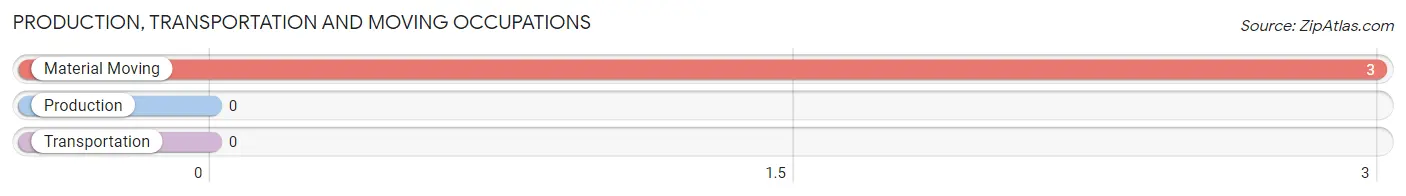
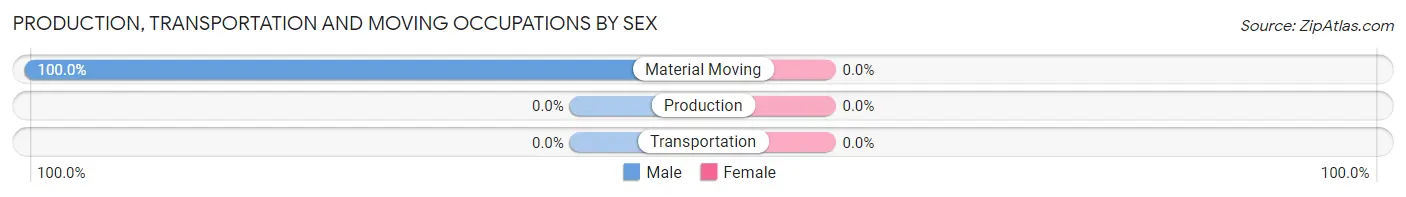
Production, Transportation and Moving Occupations
The most common Production, Transportation and Moving occupations in Zip Code 92145 are , and Material Moving (3 | 10.3%).
Production, Transportation and Moving Occupations by Sex
Occupation
Male
Female
Production
0 (0.0%)
0 (0.0%)
Transportation
0 (0.0%)
0 (0.0%)
Material Moving
3 (100.0%)
0 (0.0%)
Total (Category)
3 (100.0%)
0 (0.0%)
Total (Overall)
29 (100.0%)
0 (0.0%)
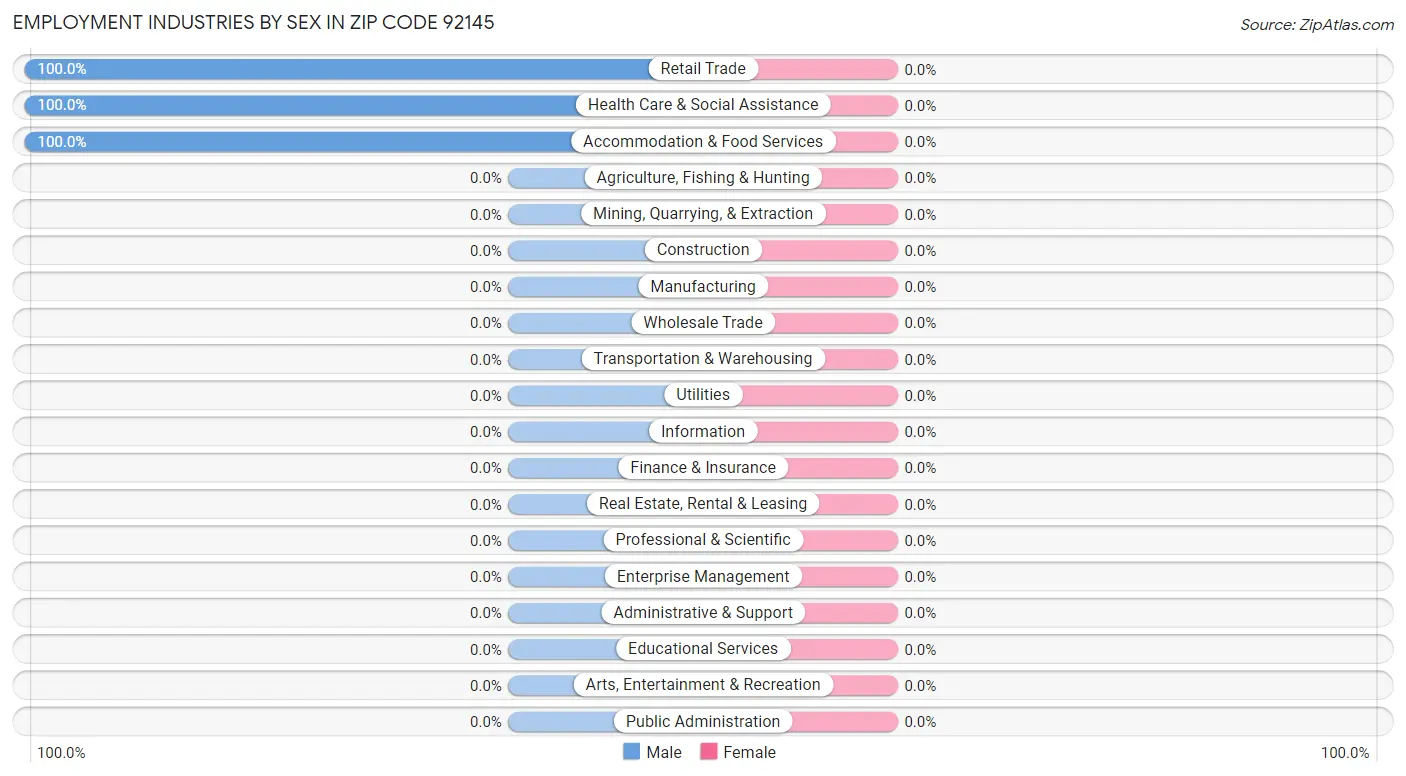
Employment Industries by Sex in Zip Code 92145
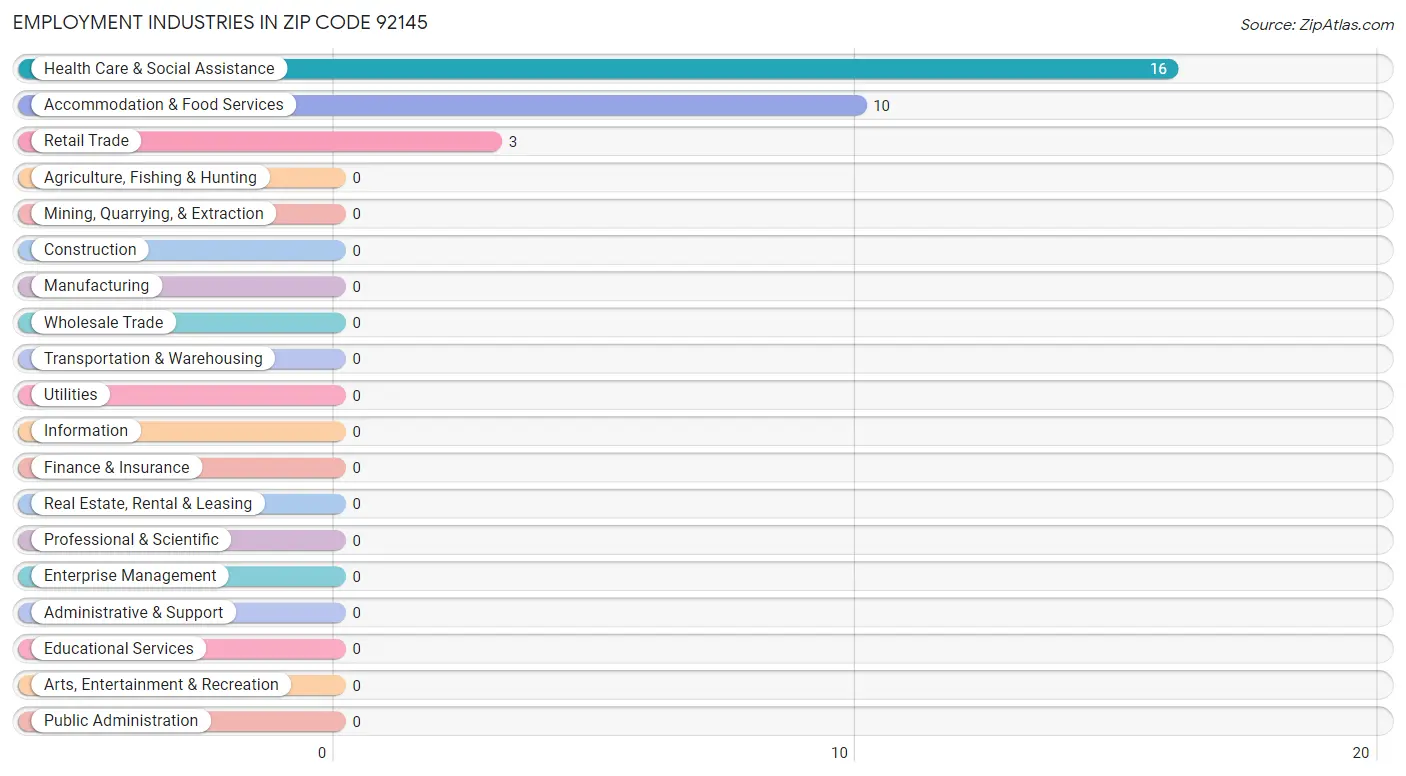
Employment Industries in Zip Code 92145
The major employment industries in Zip Code 92145 include Health Care & Social Assistance (16 | 55.2%), Accommodation & Food Services (10 | 34.5%), and Retail Trade (3 | 10.3%).
Employment Industries by Sex in Zip Code 92145
Industry
Male
Female
Agriculture, Fishing & Hunting
0 (0.0%)
0 (0.0%)
Mining, Quarrying, & Extraction
0 (0.0%)
0 (0.0%)
Construction
0 (0.0%)
0 (0.0%)
Manufacturing
0 (0.0%)
0 (0.0%)
Wholesale Trade
0 (0.0%)
0 (0.0%)
Retail Trade
3 (100.0%)
0 (0.0%)
Transportation & Warehousing
0 (0.0%)
0 (0.0%)
Utilities
0 (0.0%)
0 (0.0%)
Information
0 (0.0%)
0 (0.0%)
Finance & Insurance
0 (0.0%)
0 (0.0%)
Real Estate, Rental & Leasing
0 (0.0%)
0 (0.0%)
Professional & Scientific
0 (0.0%)
0 (0.0%)
Enterprise Management
0 (0.0%)
0 (0.0%)
Administrative & Support
0 (0.0%)
0 (0.0%)
Educational Services
0 (0.0%)
0 (0.0%)
Health Care & Social Assistance
16 (100.0%)
0 (0.0%)
Arts, Entertainment & Recreation
0 (0.0%)
0 (0.0%)
Accommodation & Food Services
10 (100.0%)
0 (0.0%)
Public Administration
0 (0.0%)
0 (0.0%)
Total
29 (100.0%)
0 (0.0%)
Education in Zip Code 92145
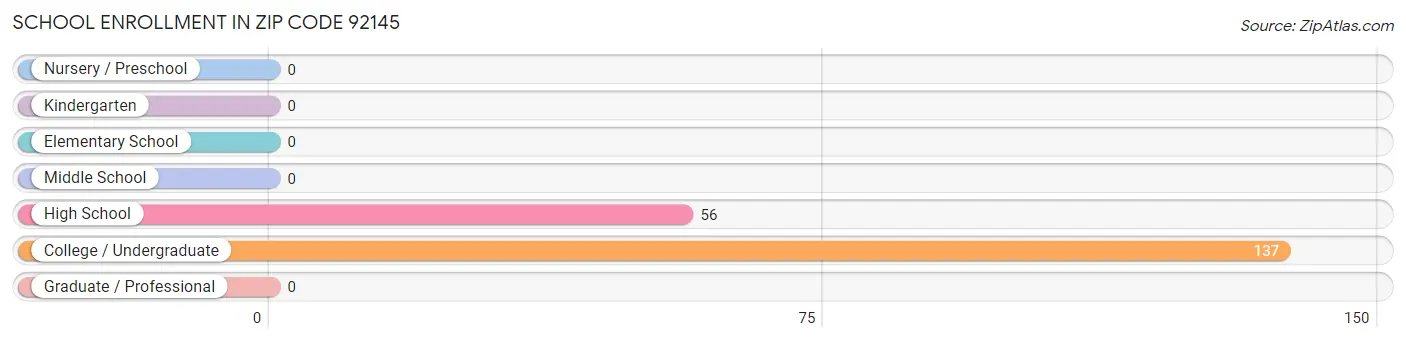
School Enrollment in Zip Code 92145
The most common levels of schooling among the 193 students in Zip Code 92145 are college / undergraduate (137 | 71.0%), and high school (56 | 29.0%).
School Level
# Students
% Students
Nursery / Preschool
0
0.0%
Kindergarten
0
0.0%
Elementary School
0
0.0%
Middle School
0
0.0%
High School
56
29.0%
College / Undergraduate
137
71.0%
Graduate / Professional
0
0.0%
Total
193
100.0%
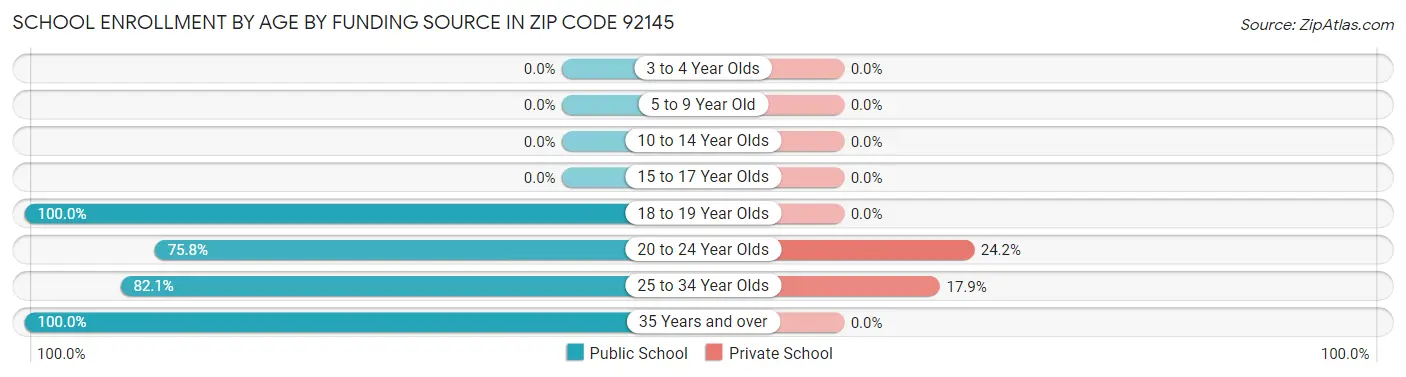
School Enrollment by Age by Funding Source in Zip Code 92145
Out of a total of 193 students who are enrolled in schools in Zip Code 92145, 13 (6.7%) attend a private institution, while the remaining 180 (93.3%) are enrolled in public schools. The age group of 20 to 24 year olds has the highest likelihood of being enrolled in private schools, with 8 (24.2% in the age bracket) enrolled. Conversely, the age group of 18 to 19 year olds has the lowest likelihood of being enrolled in a private school, with 72 (100.0% in the age bracket) attending a public institution.
Age Bracket
Public School
Private School
3 to 4 Year Olds
0 (0.0%)
0 (0.0%)
5 to 9 Year Old
0 (0.0%)
0 (0.0%)
10 to 14 Year Olds
0 (0.0%)
0 (0.0%)
15 to 17 Year Olds
0 (0.0%)
0 (0.0%)
18 to 19 Year Olds
72 (100.0%)
0 (0.0%)
20 to 24 Year Olds
25 (75.8%)
8 (24.2%)
25 to 34 Year Olds
23 (82.1%)
5 (17.9%)
35 Years and over
60 (100.0%)
0 (0.0%)
Total
180 (93.3%)
13 (6.7%)
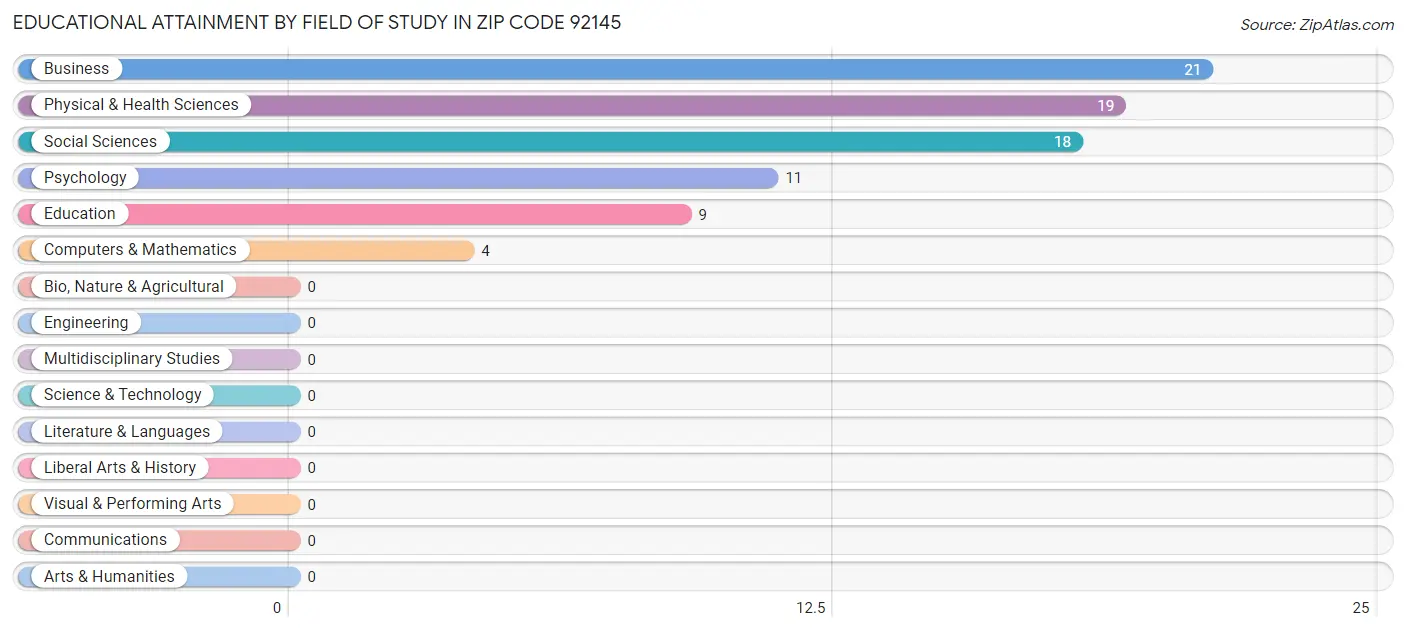
Educational Attainment by Field of Study in Zip Code 92145
Business (21 | 25.6%), physical & health sciences (19 | 23.2%), social sciences (18 | 22.0%), psychology (11 | 13.4%), and education (9 | 11.0%) are the most common fields of study among 82 individuals in Zip Code 92145 who have obtained a bachelor's degree or higher.
Field of Study
# Graduates
% Graduates
Computers & Mathematics
4
4.9%
Bio, Nature & Agricultural
0
0.0%
Physical & Health Sciences
19
23.2%
Psychology
11
13.4%
Social Sciences
18
22.0%
Engineering
0
0.0%
Multidisciplinary Studies
0
0.0%
Science & Technology
0
0.0%
Business
21
25.6%
Education
9
11.0%
Literature & Languages
0
0.0%
Liberal Arts & History
0
0.0%
Visual & Performing Arts
0
0.0%
Communications
0
0.0%
Arts & Humanities
0
0.0%
Total
82
100.0%
Transportation & Commute in Zip Code 92145
Vehicle Availability by Sex in Zip Code 92145
Vehicles Available
Male
Female
No Vehicle
0 (0.0%)
0 (0.0%)
1 Vehicle
0 (0.0%)
0 (0.0%)
2 Vehicles
0 (0.0%)
0 (0.0%)
3 Vehicles
0 (0.0%)
0 (0.0%)
4 Vehicles
0 (0.0%)
0 (0.0%)
5 or more Vehicles
0 (0.0%)
0 (0.0%)
Total
0 (0.0%)
0 (0.0%)
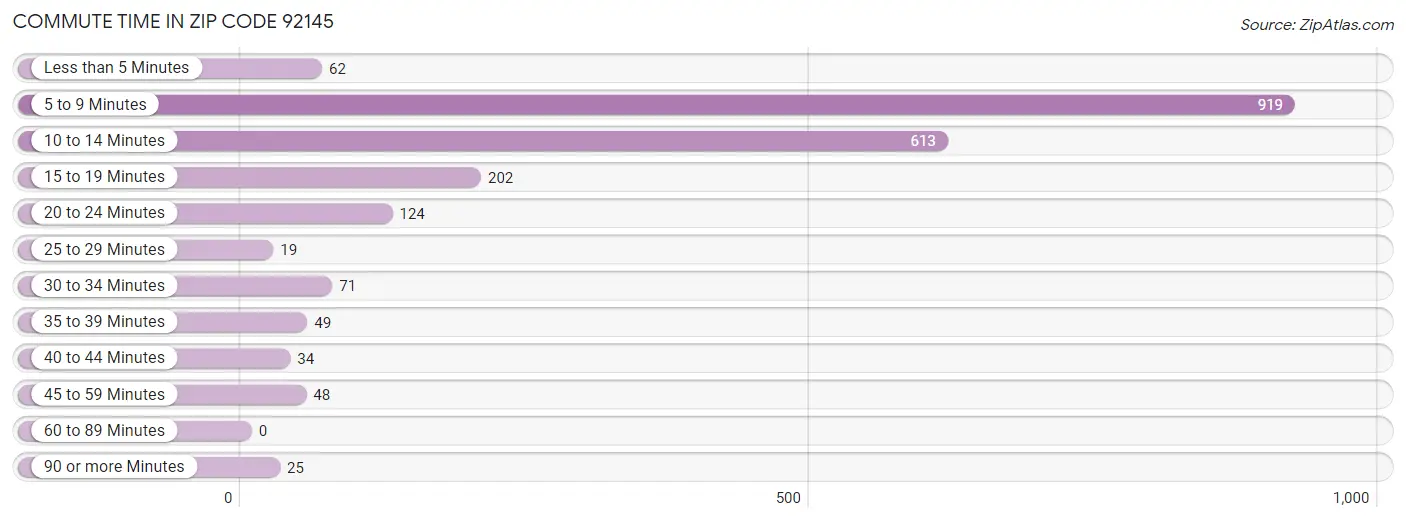
Commute Time in Zip Code 92145
The most frequently occuring commute durations in Zip Code 92145 are 5 to 9 minutes (919 commuters, 42.4%), 10 to 14 minutes (613 commuters, 28.3%), and 15 to 19 minutes (202 commuters, 9.3%).
Commute Time
# Commuters
% Commuters
Less than 5 Minutes
62
2.9%
5 to 9 Minutes
919
42.4%
10 to 14 Minutes
613
28.3%
15 to 19 Minutes
202
9.3%
20 to 24 Minutes
124
5.7%
25 to 29 Minutes
19
0.9%
30 to 34 Minutes
71
3.3%
35 to 39 Minutes
49
2.3%
40 to 44 Minutes
34
1.6%
45 to 59 Minutes
48
2.2%
60 to 89 Minutes
0
0.0%
90 or more Minutes
25
1.1%
Commute Time by Sex in Zip Code 92145
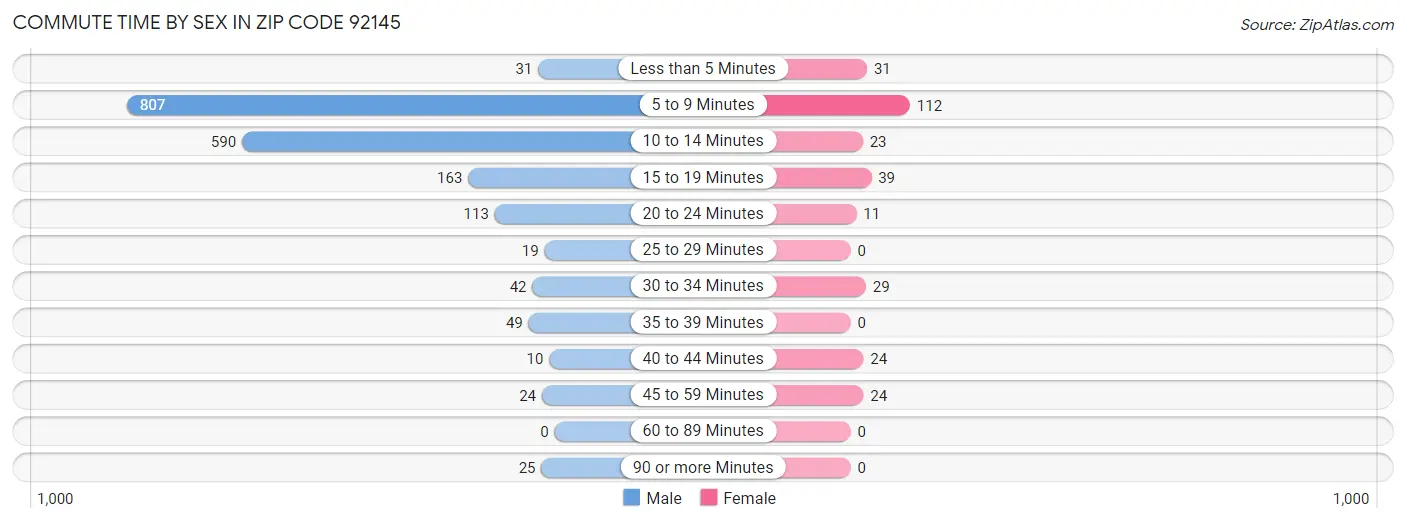
The most common commute times in Zip Code 92145 are 5 to 9 minutes (807 commuters, 43.1%) for males and 5 to 9 minutes (112 commuters, 38.2%) for females.
Commute Time
Male
Female
Less than 5 Minutes
31 (1.7%)
31 (10.6%)
5 to 9 Minutes
807 (43.1%)
112 (38.2%)
10 to 14 Minutes
590 (31.5%)
23 (7.9%)
15 to 19 Minutes
163 (8.7%)
39 (13.3%)
20 to 24 Minutes
113 (6.0%)
11 (3.7%)
25 to 29 Minutes
19 (1.0%)
0 (0.0%)
30 to 34 Minutes
42 (2.2%)
29 (9.9%)
35 to 39 Minutes
49 (2.6%)
0 (0.0%)
40 to 44 Minutes
10 (0.5%)
24 (8.2%)
45 to 59 Minutes
24 (1.3%)
24 (8.2%)
60 to 89 Minutes
0 (0.0%)
0 (0.0%)
90 or more Minutes
25 (1.3%)
0 (0.0%)
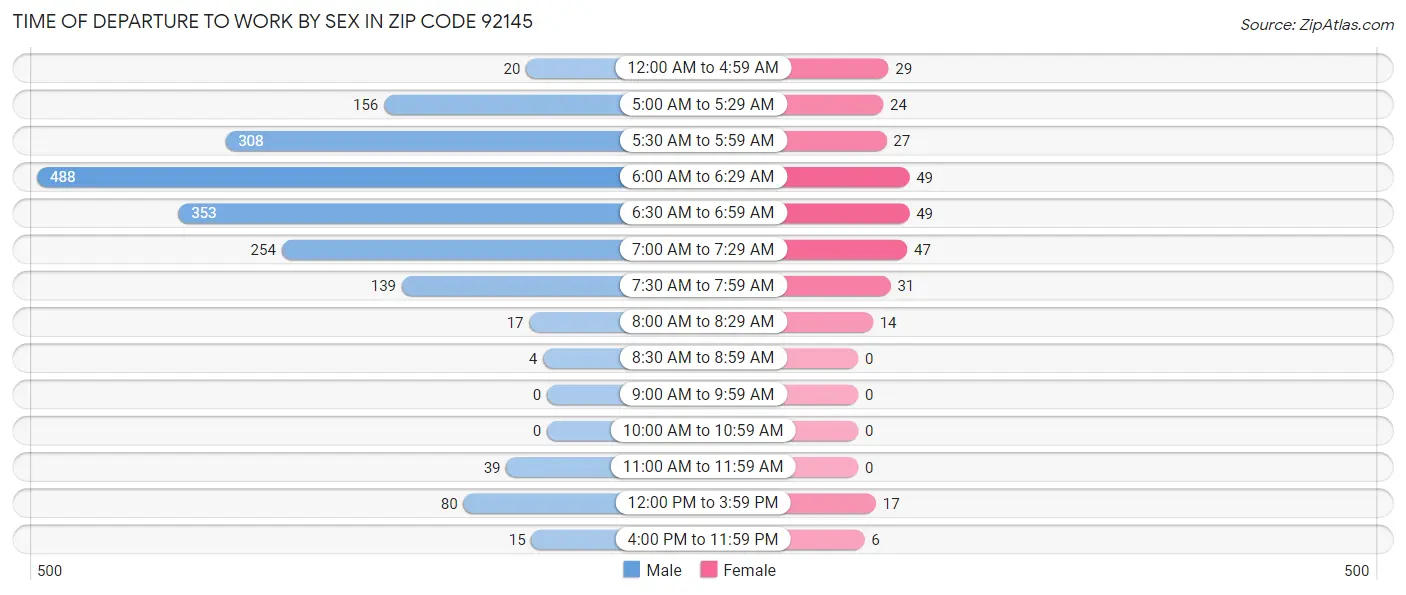
Time of Departure to Work by Sex in Zip Code 92145
The most frequent times of departure to work in Zip Code 92145 are 6:00 AM to 6:29 AM (488, 26.1%) for males and 6:00 AM to 6:29 AM (49, 16.7%) for females.
Time of Departure
Male
Female
12:00 AM to 4:59 AM
20 (1.1%)
29 (9.9%)
5:00 AM to 5:29 AM
156 (8.3%)
24 (8.2%)
5:30 AM to 5:59 AM
308 (16.4%)
27 (9.2%)
6:00 AM to 6:29 AM
488 (26.1%)
49 (16.7%)
6:30 AM to 6:59 AM
353 (18.9%)
49 (16.7%)
7:00 AM to 7:29 AM
254 (13.6%)
47 (16.0%)
7:30 AM to 7:59 AM
139 (7.4%)
31 (10.6%)
8:00 AM to 8:29 AM
17 (0.9%)
14 (4.8%)
8:30 AM to 8:59 AM
4 (0.2%)
0 (0.0%)
9:00 AM to 9:59 AM
0 (0.0%)
0 (0.0%)
10:00 AM to 10:59 AM
0 (0.0%)
0 (0.0%)
11:00 AM to 11:59 AM
39 (2.1%)
0 (0.0%)
12:00 PM to 3:59 PM
80 (4.3%)
17 (5.8%)
4:00 PM to 11:59 PM
15 (0.8%)
6 (2.1%)
Total
1,873 (100.0%)
293 (100.0%)
Housing Occupancy in Zip Code 92145
Occupancy by Ownership in Zip Code 92145
Occupancy
# Housing Units
% Housing Units
Owner Occupied Housing Units
0
0.0%
Renter-Occupied Housing Units
0
0.0%
Total Occupied Housing Units
0
0.0%
Occupancy by Household Size in Zip Code 92145
Household Size
# Housing Units
% Housing Units
1-Person Household
0
0.0%
2-Person Household
0
0.0%
3-Person Household
0
0.0%
4+ Person Household
0
0.0%
Total Housing Units
0
0.0%
Occupancy by Ownership by Household Size in Zip Code 92145
Household Size
Owner-occupied
Renter-occupied
1-Person Household
0 (0.0%)
0 (0.0%)
2-Person Household
0 (0.0%)
0 (0.0%)
3-Person Household
0 (0.0%)
0 (0.0%)
4+ Person Household
0 (0.0%)
0 (0.0%)
Total Housing Units
0 (0.0%)
0 (0.0%)
Occupancy by Educational Attainment in Zip Code 92145
Household Size
Owner-occupied
Renter-occupied
Less than High School
0 (0.0%)
0 (0.0%)
High School Diploma
0 (0.0%)
0 (0.0%)
College/Associate Degree
0 (0.0%)
0 (0.0%)
Bachelor's Degree or higher
0 (0.0%)
0 (0.0%)
Occupancy by Age of Householder in Zip Code 92145
Age Bracket
# Households
% Households
Under 35 Years
0
0.0%
35 to 44 Years
0
0.0%
45 to 54 Years
0
0.0%
55 to 64 Years
0
0.0%
65 to 74 Years
0
0.0%
75 to 84 Years
0
0.0%
85 Years and Over
0
0.0%
Total
0
0.0%
Housing Finances in Zip Code 92145
Median Income by Occupancy in Zip Code 92145
Occupancy Type
# Households
Median Income
Owner-Occupied
0 (0.0%)
$0
Renter-Occupied
0 (0.0%)
$0
Average
0 (0.0%)
$0
Occupancy by Householder Income Bracket in Zip Code 92145
Income Bracket
Owner-occupied
Renter-occupied
Less than $5,000
0 (0.0%)
0 (0.0%)
$5,000 to $9,999
0 (0.0%)
0 (0.0%)
$10,000 to $14,999
0 (0.0%)
0 (0.0%)
$15,000 to $19,999
0 (0.0%)
0 (0.0%)
$20,000 to $24,999
0 (0.0%)
0 (0.0%)
$25,000 to $34,999
0 (0.0%)
0 (0.0%)
$35,000 to $49,999
0 (0.0%)
0 (0.0%)
$50,000 to $74,999
0 (0.0%)
0 (0.0%)
$75,000 to $99,999
0 (0.0%)
0 (0.0%)
$100,000 to $149,999
0 (0.0%)
0 (0.0%)
$150,000 or more
0 (0.0%)
0 (0.0%)
Total
0 (0.0%)
0 (0.0%)
Monthly Housing Cost Tiers in Zip Code 92145
Monthly Cost
Owner-occupied
Renter-occupied
Less than $300
0 (0.0%)
0 (0.0%)
$300 to $499
0 (0.0%)
0 (0.0%)
$500 to $799
0 (0.0%)
0 (0.0%)
$800 to $999
0 (0.0%)
0 (0.0%)
$1,000 to $1,499
0 (0.0%)
0 (0.0%)
$1,500 to $1,999
0 (0.0%)
0 (0.0%)
$2,000 to $2,499
0 (0.0%)
0 (0.0%)
$2,500 to $2,999
0 (0.0%)
0 (0.0%)
$3,000 or more
0 (0.0%)
0 (0.0%)
Total
0 (0.0%)
0 (0.0%)
Physical Housing Characteristics in Zip Code 92145
Housing Structures in Zip Code 92145
Structure Type
# Housing Units
% Housing Units
Single Unit, Detached
0
0.0%
Single Unit, Attached
0
0.0%
2 Unit Apartments
0
0.0%
3 or 4 Unit Apartments
0
0.0%
5 to 9 Unit Apartments
0
0.0%
10 or more Apartments
0
0.0%
Mobile Home / Other
0
0.0%
Total
0
0.0%
Housing Structures by Occupancy in Zip Code 92145
Structure Type
Owner-occupied
Renter-occupied
Single Unit, Detached
0 (0.0%)
0 (0.0%)
Single Unit, Attached
0 (0.0%)
0 (0.0%)
2 Unit Apartments
0 (0.0%)
0 (0.0%)
3 or 4 Unit Apartments
0 (0.0%)
0 (0.0%)
5 to 9 Unit Apartments
0 (0.0%)
0 (0.0%)
10 or more Apartments
0 (0.0%)
0 (0.0%)
Mobile Home / Other
0 (0.0%)
0 (0.0%)
Total
0 (0.0%)
0 (0.0%)
Housing Structures by Number of Rooms in Zip Code 92145
Number of Rooms
Owner-occupied
Renter-occupied
1 Room
0 (0.0%)
0 (0.0%)
2 or 3 Rooms
0 (0.0%)
0 (0.0%)
4 or 5 Rooms
0 (0.0%)
0 (0.0%)
6 or 7 Rooms
0 (0.0%)
0 (0.0%)
8 or more Rooms
0 (0.0%)
0 (0.0%)
Total
0 (0.0%)
0 (0.0%)
Housing Structure by Heating Type in Zip Code 92145
Heating Type
Owner-occupied
Renter-occupied
Utility Gas
0 (0.0%)
0 (0.0%)
Bottled, Tank, or LP Gas
0 (0.0%)
0 (0.0%)
Electricity
0 (0.0%)
0 (0.0%)
Fuel Oil or Kerosene
0 (0.0%)
0 (0.0%)
Coal or Coke
0 (0.0%)
0 (0.0%)
All other Fuels
0 (0.0%)
0 (0.0%)
No Fuel Used
0 (0.0%)
0 (0.0%)
Total
0 (0.0%)
0 (0.0%)
Household Vehicle Usage in Zip Code 92145
Vehicles per Household
Owner-occupied
Renter-occupied
No Vehicle
0 (0.0%)
0 (0.0%)
1 Vehicle
0 (0.0%)
0 (0.0%)
2 Vehicles
0 (0.0%)
0 (0.0%)
3 or more Vehicles
0 (0.0%)
0 (0.0%)
Total
0 (0.0%)
0 (0.0%)
Real Estate & Mortgages in Zip Code 92145
Real Estate and Mortgage Overview in Zip Code 92145
Characteristic
Without Mortgage
With Mortgage
Housing Units
0
0
Median Property Value
-
-
Median Household Income
-
-
Monthly Housing Costs
-
-
Real Estate Taxes
-
-
Property Value by Mortgage Status in Zip Code 92145
Property Value
Without Mortgage
With Mortgage
Less than $50,000
0 (0.0%)
0 (0.0%)
$50,000 to $99,999
0 (0.0%)
0 (0.0%)
$100,000 to $299,999
0 (0.0%)
0 (0.0%)
$300,000 to $499,999
0 (0.0%)
0 (0.0%)
$500,000 to $749,999
0 (0.0%)
0 (0.0%)
$750,000 to $999,999
0 (0.0%)
0 (0.0%)
$1,000,000 or more
0 (0.0%)
0 (0.0%)
Total
0 (0.0%)
0 (0.0%)
Household Income by Mortgage Status in Zip Code 92145
Household Income
Without Mortgage
With Mortgage
Less than $10,000
0 (0.0%)
0 (0.0%)
$10,000 to $24,999
0 (0.0%)
0 (0.0%)
$25,000 to $34,999
0 (0.0%)
0 (0.0%)
$35,000 to $49,999
0 (0.0%)
0 (0.0%)
$50,000 to $74,999
0 (0.0%)
0 (0.0%)
$75,000 to $99,999
0 (0.0%)
0 (0.0%)
$100,000 to $149,999
0 (0.0%)
0 (0.0%)
$150,000 or more
0 (0.0%)
0 (0.0%)
Total
0 (0.0%)
0 (0.0%)
Property Value to Household Income Ratio in Zip Code 92145
Value-to-Income Ratio
Without Mortgage
With Mortgage
Less than 2.0x
0 (0.0%)
0 (0.0%)
2.0x to 2.9x
0 (0.0%)
0 (0.0%)
3.0x to 3.9x
0 (0.0%)
0 (0.0%)
4.0x or more
0 (0.0%)
0 (0.0%)
Total
0 (0.0%)
0 (0.0%)
Real Estate Taxes by Mortgage Status in Zip Code 92145
Property Taxes
Without Mortgage
With Mortgage
Less than $800
0 (0.0%)
0 (0.0%)
$800 to $1,499
0 (0.0%)
0 (0.0%)
$800 to $1,499
0 (0.0%)
0 (0.0%)
Total
0 (0.0%)
0 (0.0%)
Health & Disability in Zip Code 92145
Health Insurance Coverage by Age in Zip Code 92145
Age Bracket
With Coverage
Without Coverage
Under 6 Years
0 (0.0%)
0 (0.0%)
6 to 18 Years
0 (0.0%)
0 (0.0%)
19 to 25 Years
0 (0.0%)
0 (0.0%)
26 to 34 Years
0 (0.0%)
0 (0.0%)
35 to 44 Years
0 (0.0%)
0 (0.0%)
45 to 54 Years
0 (0.0%)
0 (0.0%)
55 to 64 Years
0 (0.0%)
0 (0.0%)
65 to 74 Years
0 (0.0%)
0 (0.0%)
75 Years and older
0 (0.0%)
0 (0.0%)
Total
0 (0.0%)
0 (0.0%)
Health Insurance Coverage by Citizenship Status in Zip Code 92145
Citizenship Status
With Coverage
Without Coverage
Native Born
0 (0.0%)
0 (0.0%)
Foreign Born, Citizen
0 (0.0%)
0 (0.0%)
Foreign Born, not a Citizen
0 (0.0%)
0 (0.0%)
Health Insurance Coverage by Household Income in Zip Code 92145
Household Income
With Coverage
Without Coverage
Under $25,000
0 (0.0%)
0 (0.0%)
$25,000 to $49,999
0 (0.0%)
0 (0.0%)
$50,000 to $74,999
0 (0.0%)
0 (0.0%)
$75,000 to $99,999
0 (0.0%)
0 (0.0%)
$100,000 and over
0 (0.0%)
0 (0.0%)
Public vs Private Health Insurance Coverage by Age in Zip Code 92145
Age Bracket
Public Insurance
Private Insurance
Under 6
0 (0.0%)
0 (0.0%)
6 to 18 Years
0 (0.0%)
0 (0.0%)
19 to 25 Years
0 (0.0%)
0 (0.0%)
25 to 34 Years
0 (0.0%)
0 (0.0%)
35 to 44 Years
0 (0.0%)
0 (0.0%)
45 to 54 Years
0 (0.0%)
0 (0.0%)
55 to 64 Years
0 (0.0%)
0 (0.0%)
65 to 74 Years
0 (0.0%)
0 (0.0%)
75 Years and over
0 (0.0%)
0 (0.0%)
Total
0 (0.0%)
0 (0.0%)
Disability Status by Sex by Age in Zip Code 92145
Age Bracket
Male
Female
Under 5 Years
0 (0.0%)
0 (0.0%)
5 to 17 Years
0 (0.0%)
0 (0.0%)
18 to 34 Years
0 (0.0%)
0 (0.0%)
35 to 64 Years
0 (0.0%)
0 (0.0%)
65 to 74 Years
0 (0.0%)
0 (0.0%)
75 Years and over
0 (0.0%)
0 (0.0%)
Disability Class by Sex by Age in Zip Code 92145
Disability Class: Hearing Difficulty
Age Bracket
Male
Female
Under 5 Years
0 (0.0%)
0 (0.0%)
5 to 17 Years
0 (0.0%)
0 (0.0%)
18 to 34 Years
0 (0.0%)
0 (0.0%)
35 to 64 Years
0 (0.0%)
0 (0.0%)
65 to 74 Years
0 (0.0%)
0 (0.0%)
75 Years and over
0 (0.0%)
0 (0.0%)
Disability Class: Vision Difficulty
Age Bracket
Male
Female
Under 5 Years
0 (0.0%)
0 (0.0%)
5 to 17 Years
0 (0.0%)
0 (0.0%)
18 to 34 Years
0 (0.0%)
0 (0.0%)
35 to 64 Years
0 (0.0%)
0 (0.0%)
65 to 74 Years
0 (0.0%)
0 (0.0%)
75 Years and over
0 (0.0%)
0 (0.0%)
Disability Class: Cognitive Difficulty
Age Bracket
Male
Female
5 to 17 Years
0 (0.0%)
0 (0.0%)
18 to 34 Years
0 (0.0%)
0 (0.0%)
35 to 64 Years
0 (0.0%)
0 (0.0%)
65 to 74 Years
0 (0.0%)
0 (0.0%)
75 Years and over
0 (0.0%)
0 (0.0%)
Disability Class: Ambulatory Difficulty
Age Bracket
Male
Female
5 to 17 Years
0 (0.0%)
0 (0.0%)
18 to 34 Years
0 (0.0%)
0 (0.0%)
35 to 64 Years
0 (0.0%)
0 (0.0%)
65 to 74 Years
0 (0.0%)
0 (0.0%)
75 Years and over
0 (0.0%)
0 (0.0%)
Disability Class: Self-Care Difficulty
Age Bracket
Male
Female
5 to 17 Years
0 (0.0%)
0 (0.0%)
18 to 34 Years
0 (0.0%)
0 (0.0%)
35 to 64 Years
0 (0.0%)
0 (0.0%)
65 to 74 Years
0 (0.0%)
0 (0.0%)
75 Years and over
0 (0.0%)
0 (0.0%)
Technology Access in Zip Code 92145
Computing Device Access in Zip Code 92145
Device Type
# Households
% Households
Desktop or Laptop
0
0.0%
Smartphone
0
0.0%
Tablet
0
0.0%
No Computing Device
0
0.0%
Total
0
0.0%
Internet Access in Zip Code 92145
Internet Type
# Households
% Households
Dial-Up Internet
0
0.0%
Broadband Home
0
0.0%
Cellular Data Only
0
0.0%
Satellite Internet
0
0.0%
No Internet
0
0.0%
Total
0
0.0%
Common Questions
What is Per Capita Income in Zip Code 92145?
Per Capita income in Zip Code 92145 is $23,297.
What is Income or Wage Gap in Zip Code 92145?
Income or Wage Gap in Zip Code 92145 is 7.3%.
Women in Zip Code 92145 earn 92.7 cents for every dollar earned by a man.
What is the Total Population of Zip Code 92145?
Total Population of Zip Code 92145 is 2,810.
What is the Total Male Population of Zip Code 92145?
Total Male Population of Zip Code 92145 is 2,508.
What is the Total Female Population of Zip Code 92145?
Total Female Population of Zip Code 92145 is 302.
What is the Ratio of Males per 100 Females in Zip Code 92145?
There are 830.46 Males per 100 Females in Zip Code 92145.
What is the Ratio of Females per 100 Males in Zip Code 92145?
There are 12.04 Females per 100 Males in Zip Code 92145.
What is the Median Population Age in Zip Code 92145?
Median Population Age in Zip Code 92145 is 21.7 Years.
How Large is the Labor Force in Zip Code 92145?
There are 2,582 People in the Labor Forcein in Zip Code 92145.
What is the Percentage of People in the Labor Force in Zip Code 92145?
91.9% of People are in the Labor Force in Zip Code 92145.
Report Title
Report Link
HTML Copy & Paste Link
Social Media
Copy and paste the folowing code into any webpage where you would like this interactive chart to display