San Benito County, CA Map & Demographics
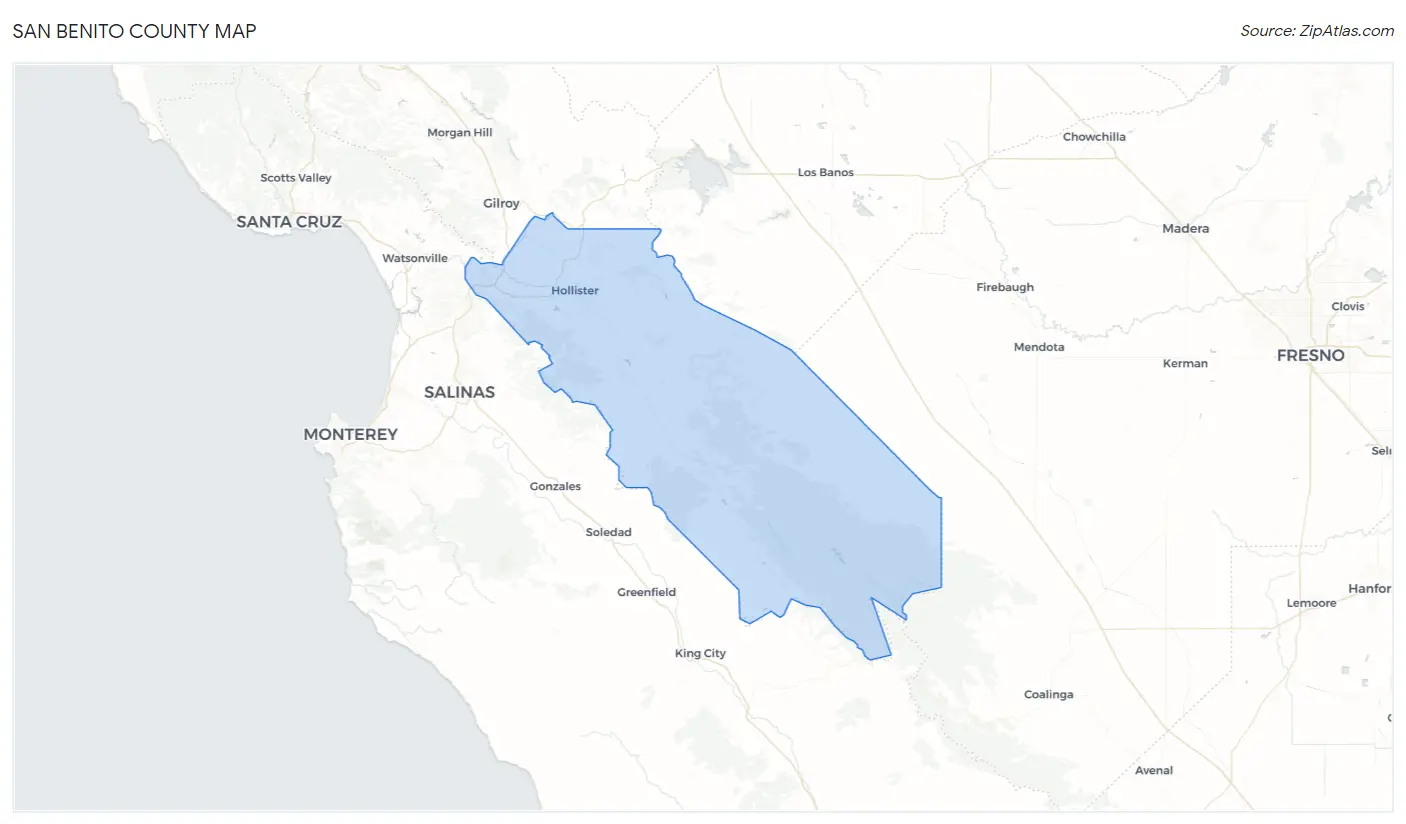
San Benito County Map
San Benito County Overview
$40,799
PER CAPITA INCOME
$112,958
AVG FAMILY INCOME
$104,451
AVG HOUSEHOLD INCOME
39.2%
WAGE / INCOME GAP [ % ]
60.8¢/ $1
WAGE / INCOME GAP [ $ ]
$11,236
FAMILY INCOME DEFICIT
0.41
INEQUALITY / GINI INDEX
64,753
TOTAL POPULATION
32,844
MALE POPULATION
31,909
FEMALE POPULATION
102.93
MALES / 100 FEMALES
97.15
FEMALES / 100 MALES
35.7
MEDIAN AGE
3.6
AVG FAMILY SIZE
3.2
AVG HOUSEHOLD SIZE
34,097
LABOR FORCE [ PEOPLE ]
68.0%
PERCENT IN LABOR FORCE
6.2%
UNEMPLOYMENT RATE
Income in San Benito County
Income Overview in San Benito County
Per Capita Income in San Benito County is $40,799, while median incomes of families and households are $112,958 and $104,451 respectively.
| Characteristic | Number | Measure |
| Per Capita Income | 64,753 | $40,799 |
| Median Family Income | 15,733 | $112,958 |
| Mean Family Income | 15,733 | $137,086 |
| Median Household Income | 19,852 | $104,451 |
| Mean Household Income | 19,852 | $129,829 |
| Income Deficit | 15,733 | $11,236 |
| Wage / Income Gap (%) | 64,753 | 39.23% |
| Wage / Income Gap ($) | 64,753 | 60.77¢ per $1 |
| Gini / Inequality Index | 64,753 | 0.41 |
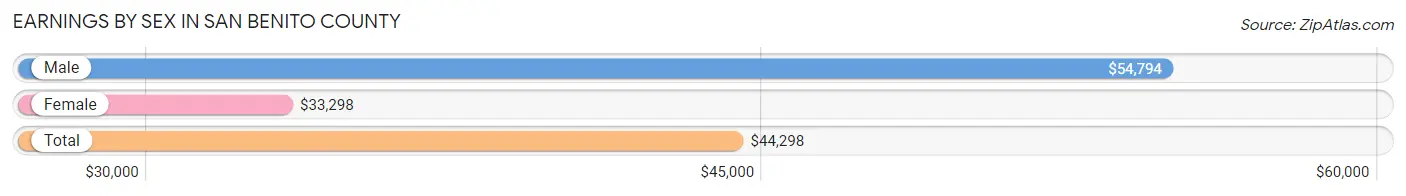
Earnings by Sex in San Benito County
Average Earnings in San Benito County are $44,298, $54,794 for men and $33,298 for women, a difference of 39.2%.
| Sex | Number | Average Earnings |
| Male | 19,470 (55.7%) | $54,794 |
| Female | 15,481 (44.3%) | $33,298 |
| Total | 34,951 (100.0%) | $44,298 |
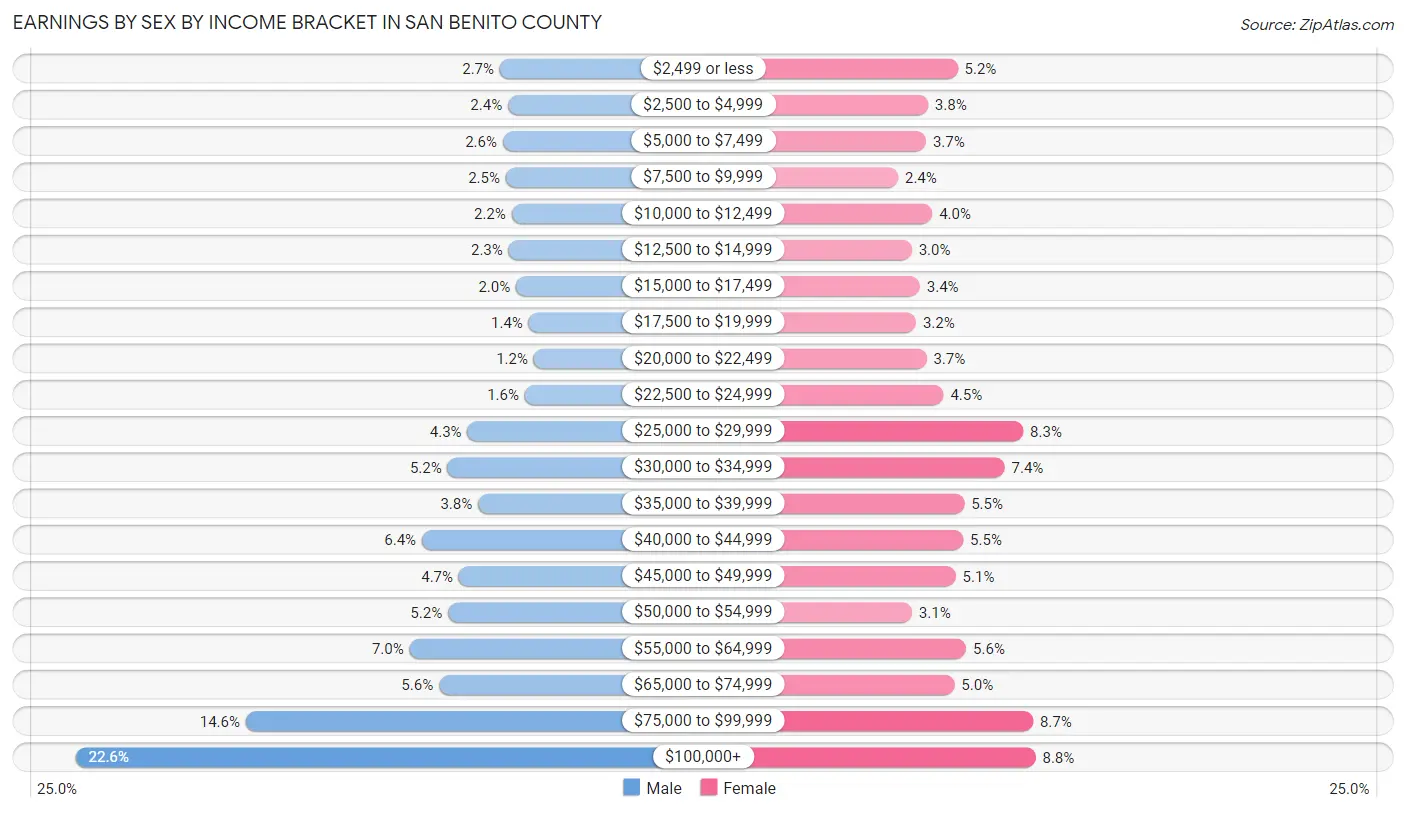
Earnings by Sex by Income Bracket in San Benito County
The most common earnings brackets in San Benito County are $100,000+ for men (4,403 | 22.6%) and $100,000+ for women (1,368 | 8.8%).
| Income | Male | Female |
| $2,499 or less | 534 (2.7%) | 803 (5.2%) |
| $2,500 to $4,999 | 459 (2.4%) | 589 (3.8%) |
| $5,000 to $7,499 | 506 (2.6%) | 575 (3.7%) |
| $7,500 to $9,999 | 478 (2.5%) | 372 (2.4%) |
| $10,000 to $12,499 | 427 (2.2%) | 619 (4.0%) |
| $12,500 to $14,999 | 453 (2.3%) | 471 (3.0%) |
| $15,000 to $17,499 | 385 (2.0%) | 529 (3.4%) |
| $17,500 to $19,999 | 270 (1.4%) | 501 (3.2%) |
| $20,000 to $22,499 | 224 (1.1%) | 578 (3.7%) |
| $22,500 to $24,999 | 305 (1.6%) | 702 (4.5%) |
| $25,000 to $29,999 | 829 (4.3%) | 1,279 (8.3%) |
| $30,000 to $34,999 | 1,011 (5.2%) | 1,144 (7.4%) |
| $35,000 to $39,999 | 732 (3.8%) | 851 (5.5%) |
| $40,000 to $44,999 | 1,244 (6.4%) | 844 (5.4%) |
| $45,000 to $49,999 | 907 (4.7%) | 789 (5.1%) |
| $50,000 to $54,999 | 1,007 (5.2%) | 472 (3.0%) |
| $55,000 to $64,999 | 1,357 (7.0%) | 865 (5.6%) |
| $65,000 to $74,999 | 1,088 (5.6%) | 780 (5.0%) |
| $75,000 to $99,999 | 2,851 (14.6%) | 1,350 (8.7%) |
| $100,000+ | 4,403 (22.6%) | 1,368 (8.8%) |
| Total | 19,470 (100.0%) | 15,481 (100.0%) |
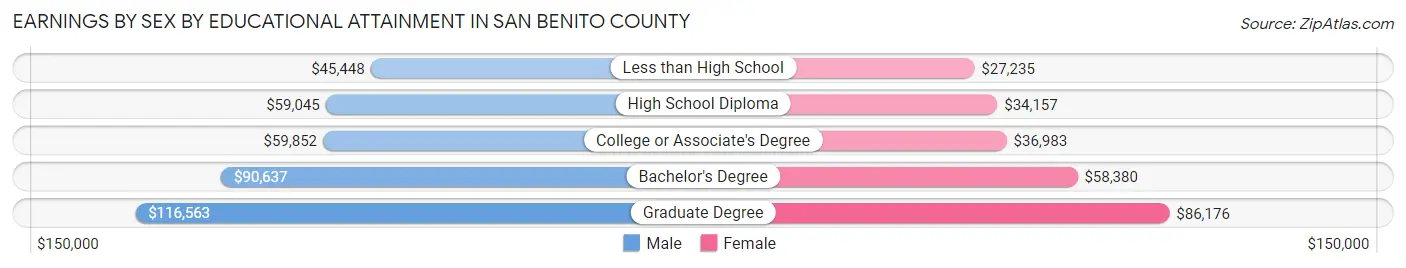
Earnings by Sex by Educational Attainment in San Benito County
Average earnings in San Benito County are $63,693 for men and $38,134 for women, a difference of 40.1%. Men with an educational attainment of graduate degree enjoy the highest average annual earnings of $116,563, while those with less than high school education earn the least with $45,448. Women with an educational attainment of graduate degree earn the most with the average annual earnings of $86,176, while those with less than high school education have the smallest earnings of $27,235.
| Educational Attainment | Male Income | Female Income |
| Less than High School | $45,448 | $27,235 |
| High School Diploma | $59,045 | $34,157 |
| College or Associate's Degree | $59,852 | $36,983 |
| Bachelor's Degree | $90,637 | $58,380 |
| Graduate Degree | $116,563 | $86,176 |
| Total | $63,693 | $38,134 |
Family Income in San Benito County
Family Income Brackets in San Benito County
According to the San Benito County family income data, there are 3,383 families falling into the $100,000 to $149,999 income range, which is the most common income bracket and makes up 21.5% of all families. Conversely, the $10,000 to $14,999 income bracket is the least frequent group with only 126 families (0.8%) belonging to this category.
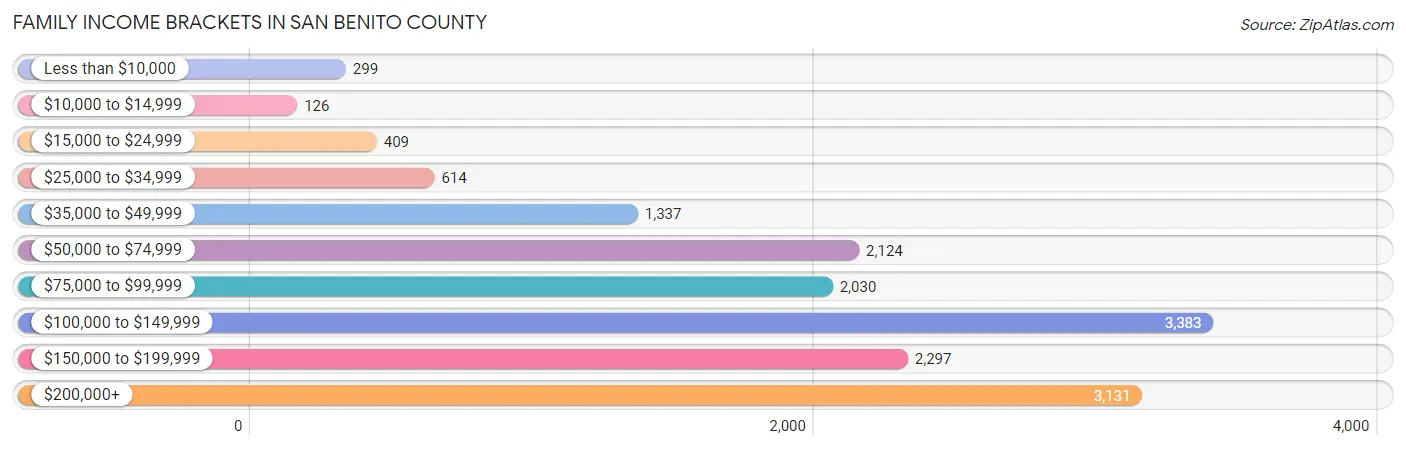
| Income Bracket | # Families | % Families |
| Less than $10,000 | 299 | 1.9% |
| $10,000 to $14,999 | 126 | 0.8% |
| $15,000 to $24,999 | 409 | 2.6% |
| $25,000 to $34,999 | 614 | 3.9% |
| $35,000 to $49,999 | 1,337 | 8.5% |
| $50,000 to $74,999 | 2,124 | 13.5% |
| $75,000 to $99,999 | 2,030 | 12.9% |
| $100,000 to $149,999 | 3,383 | 21.5% |
| $150,000 to $199,999 | 2,297 | 14.6% |
| $200,000+ | 3,131 | 19.9% |
Family Income by Famaliy Size in San Benito County
7+ person families (583 | 3.7%) account for the highest median family income in San Benito County with $177,528 per family, while 2-person families (5,218 | 33.2%) have the highest median income of $46,209 per family member.
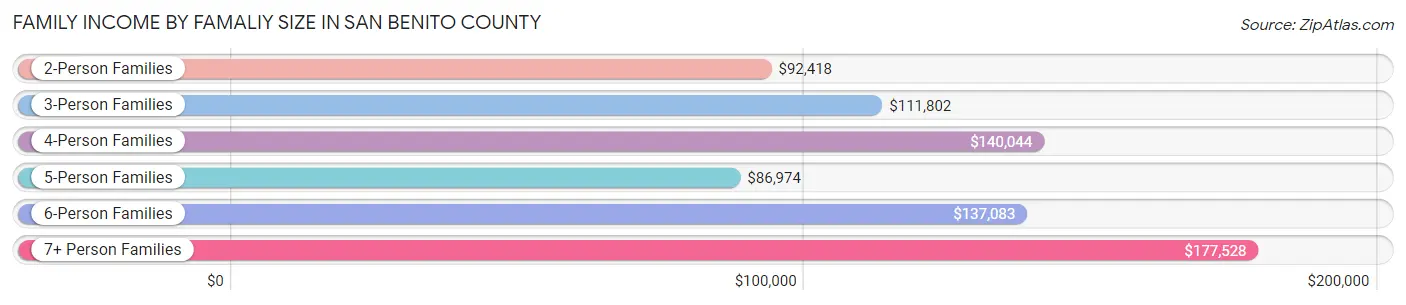
| Income Bracket | # Families | Median Income |
| 2-Person Families | 5,218 (33.2%) | $92,418 |
| 3-Person Families | 3,338 (21.2%) | $111,802 |
| 4-Person Families | 3,638 (23.1%) | $140,044 |
| 5-Person Families | 2,082 (13.2%) | $86,974 |
| 6-Person Families | 874 (5.6%) | $137,083 |
| 7+ Person Families | 583 (3.7%) | $177,528 |
| Total | 15,733 (100.0%) | $112,958 |
Family Income by Number of Earners in San Benito County
The median family income in San Benito County is $112,958, with families comprising 3+ earners (3,409) having the highest median family income of $172,159, while families with no earners (1,625) have the lowest median family income of $61,918, accounting for 21.7% and 10.3% of families, respectively.
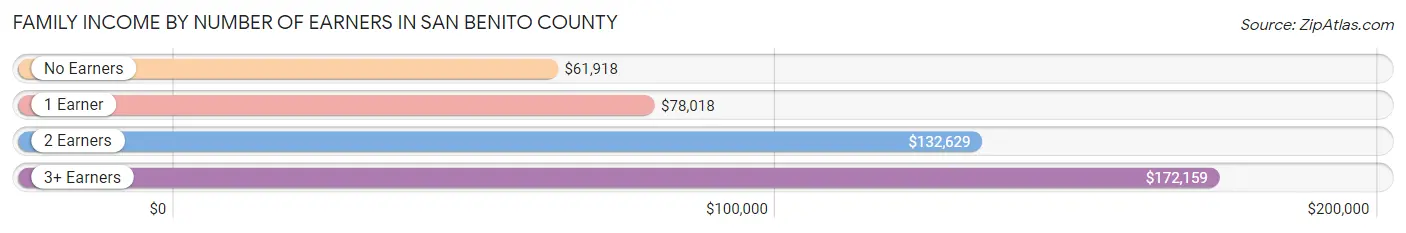
| Number of Earners | # Families | Median Income |
| No Earners | 1,625 (10.3%) | $61,918 |
| 1 Earner | 4,633 (29.4%) | $78,018 |
| 2 Earners | 6,066 (38.6%) | $132,629 |
| 3+ Earners | 3,409 (21.7%) | $172,159 |
| Total | 15,733 (100.0%) | $112,958 |
Household Income in San Benito County
Household Income Brackets in San Benito County
With 4,050 households falling in the category, the $100,000 to $149,999 income range is the most frequent in San Benito County, accounting for 20.4% of all households. In contrast, only 397 households (2.0%) fall into the $10,000 to $14,999 income bracket, making it the least populous group.
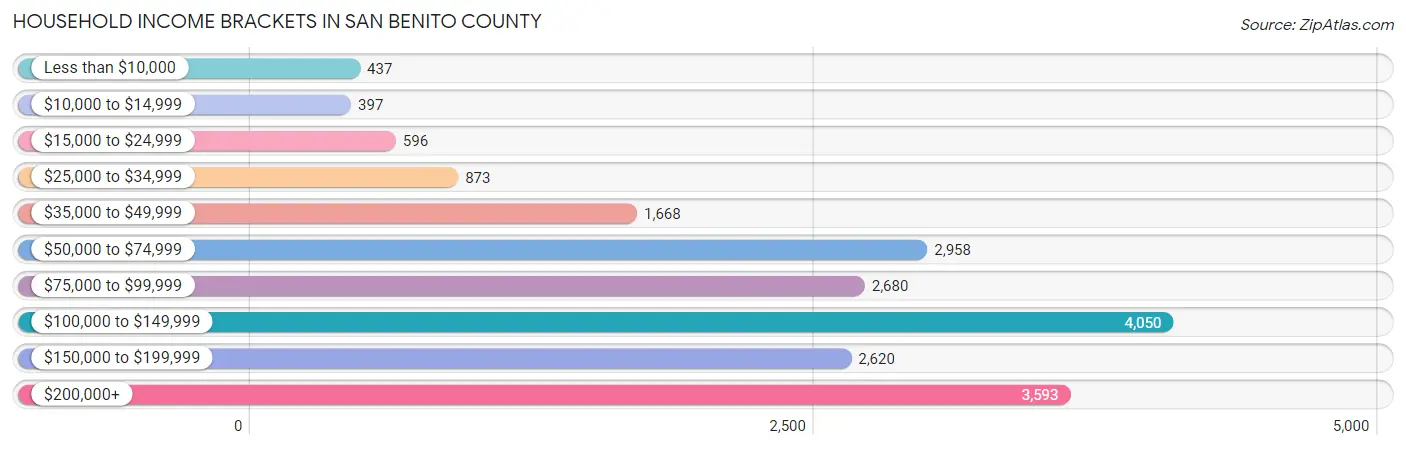
| Income Bracket | # Households | % Households |
| Less than $10,000 | 437 | 2.2% |
| $10,000 to $14,999 | 397 | 2.0% |
| $15,000 to $24,999 | 596 | 3.0% |
| $25,000 to $34,999 | 873 | 4.4% |
| $35,000 to $49,999 | 1,668 | 8.4% |
| $50,000 to $74,999 | 2,958 | 14.9% |
| $75,000 to $99,999 | 2,680 | 13.5% |
| $100,000 to $149,999 | 4,050 | 20.4% |
| $150,000 to $199,999 | 2,620 | 13.2% |
| $200,000+ | 3,593 | 18.1% |
Household Income by Householder Age in San Benito County
The median household income in San Benito County is $104,451, with the highest median household income of $126,304 found in the 45 to 64 years age bracket for the primary householder. A total of 8,286 households (41.7%) fall into this category. Meanwhile, the 15 to 24 years age bracket for the primary householder has the lowest median household income of $53,125, with 139 households (0.7%) in this group.
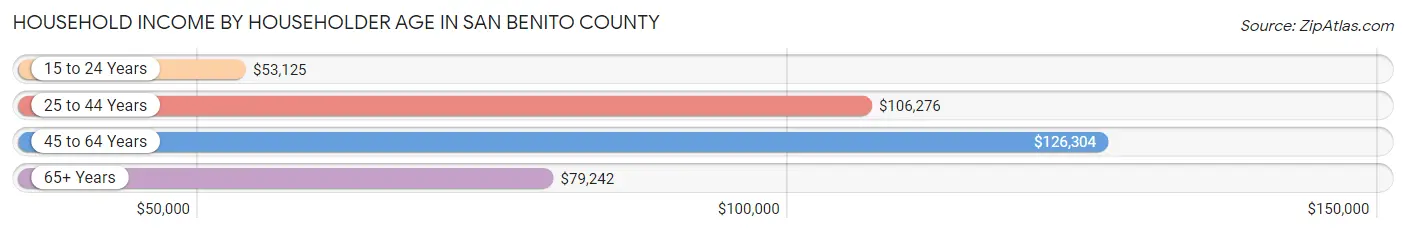
| Income Bracket | # Households | Median Income |
| 15 to 24 Years | 139 (0.7%) | $53,125 |
| 25 to 44 Years | 6,735 (33.9%) | $106,276 |
| 45 to 64 Years | 8,286 (41.7%) | $126,304 |
| 65+ Years | 4,692 (23.6%) | $79,242 |
| Total | 19,852 (100.0%) | $104,451 |
Poverty in San Benito County
Income Below Poverty by Sex and Age in San Benito County
With 6.3% poverty level for males and 8.7% for females among the residents of San Benito County, 15 year old males and 12 to 14 year old females are the most vulnerable to poverty, with 112 males (21.7%) and 217 females (14.2%) in their respective age groups living below the poverty level.
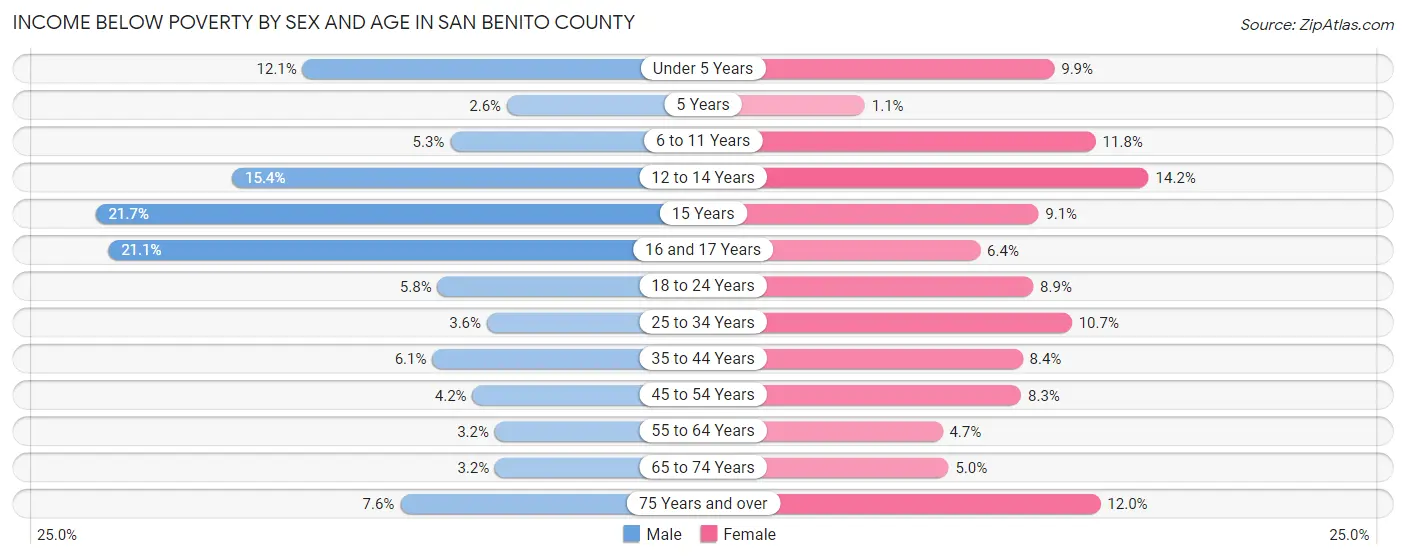
| Age Bracket | Male | Female |
| Under 5 Years | 237 (12.1%) | 193 (9.9%) |
| 5 Years | 9 (2.6%) | 5 (1.1%) |
| 6 to 11 Years | 149 (5.2%) | 305 (11.8%) |
| 12 to 14 Years | 240 (15.4%) | 217 (14.2%) |
| 15 Years | 112 (21.7%) | 50 (9.1%) |
| 16 and 17 Years | 212 (21.1%) | 55 (6.4%) |
| 18 to 24 Years | 180 (5.8%) | 257 (8.9%) |
| 25 to 34 Years | 166 (3.5%) | 457 (10.7%) |
| 35 to 44 Years | 283 (6.1%) | 360 (8.4%) |
| 45 to 54 Years | 177 (4.2%) | 329 (8.3%) |
| 55 to 64 Years | 124 (3.2%) | 178 (4.7%) |
| 65 to 74 Years | 83 (3.2%) | 130 (5.0%) |
| 75 Years and over | 100 (7.6%) | 224 (12.0%) |
| Total | 2,072 (6.3%) | 2,760 (8.7%) |
Income Above Poverty by Sex and Age in San Benito County
According to the poverty statistics in San Benito County, males aged 5 years and females aged 5 years are the age groups that are most secure financially, with 97.4% of males and 98.9% of females in these age groups living above the poverty line.
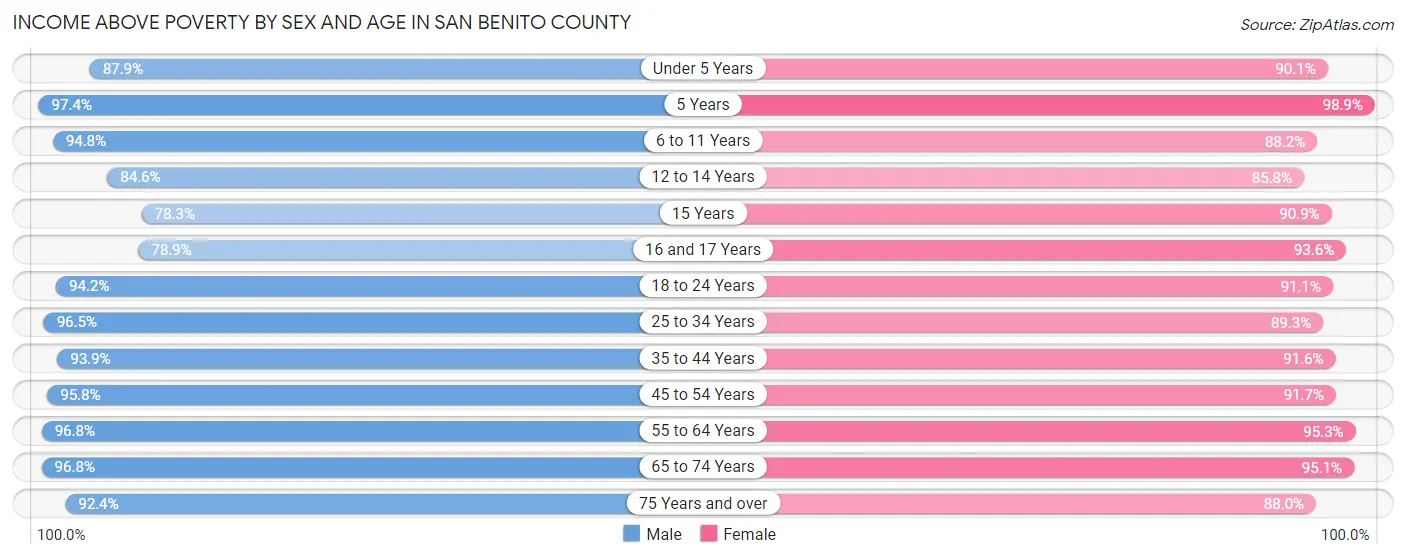
| Age Bracket | Male | Female |
| Under 5 Years | 1,721 (87.9%) | 1,765 (90.1%) |
| 5 Years | 335 (97.4%) | 464 (98.9%) |
| 6 to 11 Years | 2,689 (94.8%) | 2,284 (88.2%) |
| 12 to 14 Years | 1,321 (84.6%) | 1,307 (85.8%) |
| 15 Years | 404 (78.3%) | 498 (90.9%) |
| 16 and 17 Years | 792 (78.9%) | 802 (93.6%) |
| 18 to 24 Years | 2,904 (94.2%) | 2,636 (91.1%) |
| 25 to 34 Years | 4,512 (96.5%) | 3,825 (89.3%) |
| 35 to 44 Years | 4,373 (93.9%) | 3,931 (91.6%) |
| 45 to 54 Years | 4,020 (95.8%) | 3,626 (91.7%) |
| 55 to 64 Years | 3,770 (96.8%) | 3,637 (95.3%) |
| 65 to 74 Years | 2,533 (96.8%) | 2,495 (95.1%) |
| 75 Years and over | 1,221 (92.4%) | 1,642 (88.0%) |
| Total | 30,595 (93.7%) | 28,912 (91.3%) |
Income Below Poverty Among Married-Couple Families in San Benito County
The poverty statistics for married-couple families in San Benito County show that 3.7% or 439 of the total 11,726 families live below the poverty line. Families with 3 or 4 children have the highest poverty rate of 9.3%, comprising of 132 families. On the other hand, families with 5 or more children have the lowest poverty rate of 0.0%, which includes 0 families.
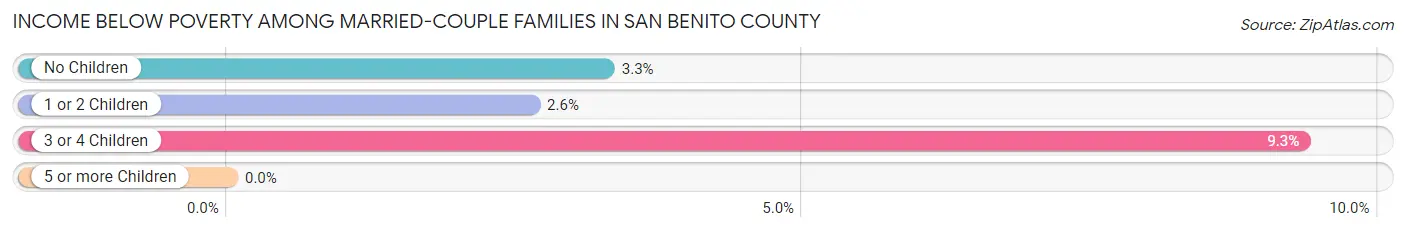
| Children | Above Poverty | Below Poverty |
| No Children | 5,716 (96.7%) | 194 (3.3%) |
| 1 or 2 Children | 4,182 (97.4%) | 113 (2.6%) |
| 3 or 4 Children | 1,282 (90.7%) | 132 (9.3%) |
| 5 or more Children | 107 (100.0%) | 0 (0.0%) |
| Total | 11,287 (96.3%) | 439 (3.7%) |
Income Below Poverty Among Single-Parent Households in San Benito County
According to the poverty data in San Benito County, 5.7% or 91 single-father households and 15.8% or 379 single-mother households are living below the poverty line. Among single-father households, those with 1 or 2 children have the highest poverty rate, with 81 households (10.7%) experiencing poverty. Likewise, among single-mother households, those with 5 or more children have the highest poverty rate, with 35 households (100.0%) falling below the poverty line.
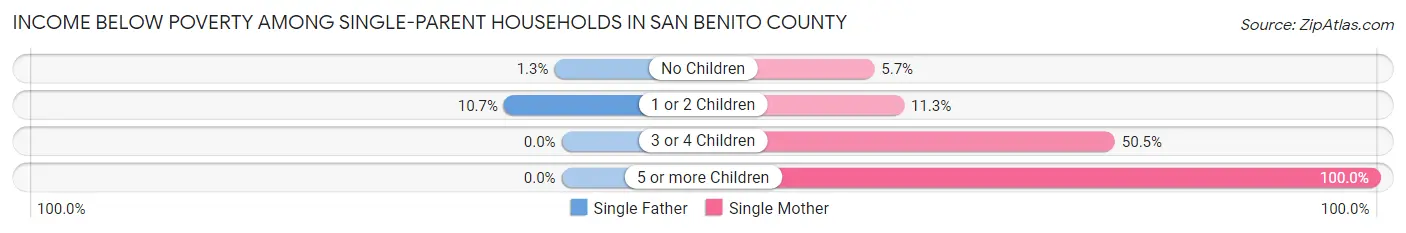
| Children | Single Father | Single Mother |
| No Children | 10 (1.3%) | 39 (5.7%) |
| 1 or 2 Children | 81 (10.7%) | 157 (11.3%) |
| 3 or 4 Children | 0 (0.0%) | 148 (50.5%) |
| 5 or more Children | 0 (0.0%) | 35 (100.0%) |
| Total | 91 (5.7%) | 379 (15.8%) |
Income Below Poverty Among Married-Couple vs Single-Parent Households in San Benito County
The poverty data for San Benito County shows that 439 of the married-couple family households (3.7%) and 470 of the single-parent households (11.7%) are living below the poverty level. Within the married-couple family households, those with 3 or 4 children have the highest poverty rate, with 132 households (9.3%) falling below the poverty line. Among the single-parent households, those with 5 or more children have the highest poverty rate, with 35 household (72.9%) living below poverty.
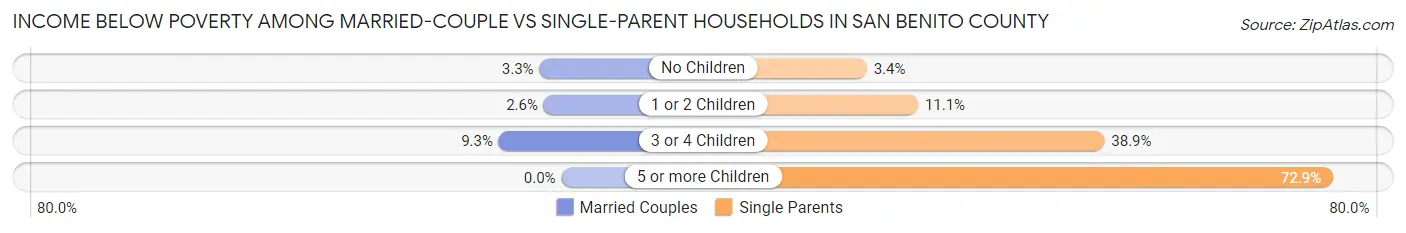
| Children | Married-Couple Families | Single-Parent Households |
| No Children | 194 (3.3%) | 49 (3.4%) |
| 1 or 2 Children | 113 (2.6%) | 238 (11.1%) |
| 3 or 4 Children | 132 (9.3%) | 148 (38.9%) |
| 5 or more Children | 0 (0.0%) | 35 (72.9%) |
| Total | 439 (3.7%) | 470 (11.7%) |
Race in San Benito County
The most populous races in San Benito County are Hispanic or Latino (39,768 | 61.4%), White / Caucasian (34,864 | 53.8%), and Two or more Races (17,413 | 26.9%).
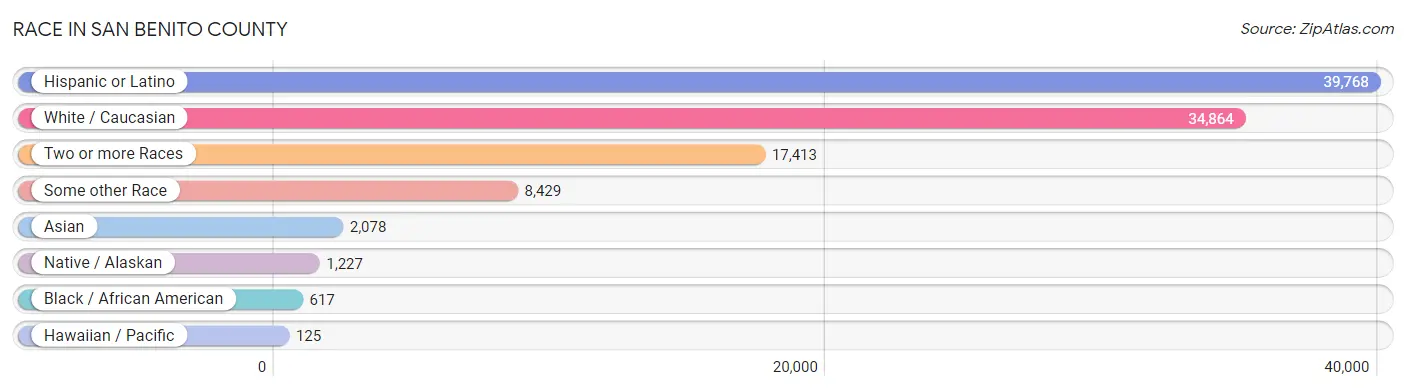
| Race | # Population | % Population |
| Asian | 2,078 | 3.2% |
| Black / African American | 617 | 0.9% |
| Hawaiian / Pacific | 125 | 0.2% |
| Hispanic or Latino | 39,768 | 61.4% |
| Native / Alaskan | 1,227 | 1.9% |
| White / Caucasian | 34,864 | 53.8% |
| Two or more Races | 17,413 | 26.9% |
| Some other Race | 8,429 | 13.0% |
| Total | 64,753 | 100.0% |
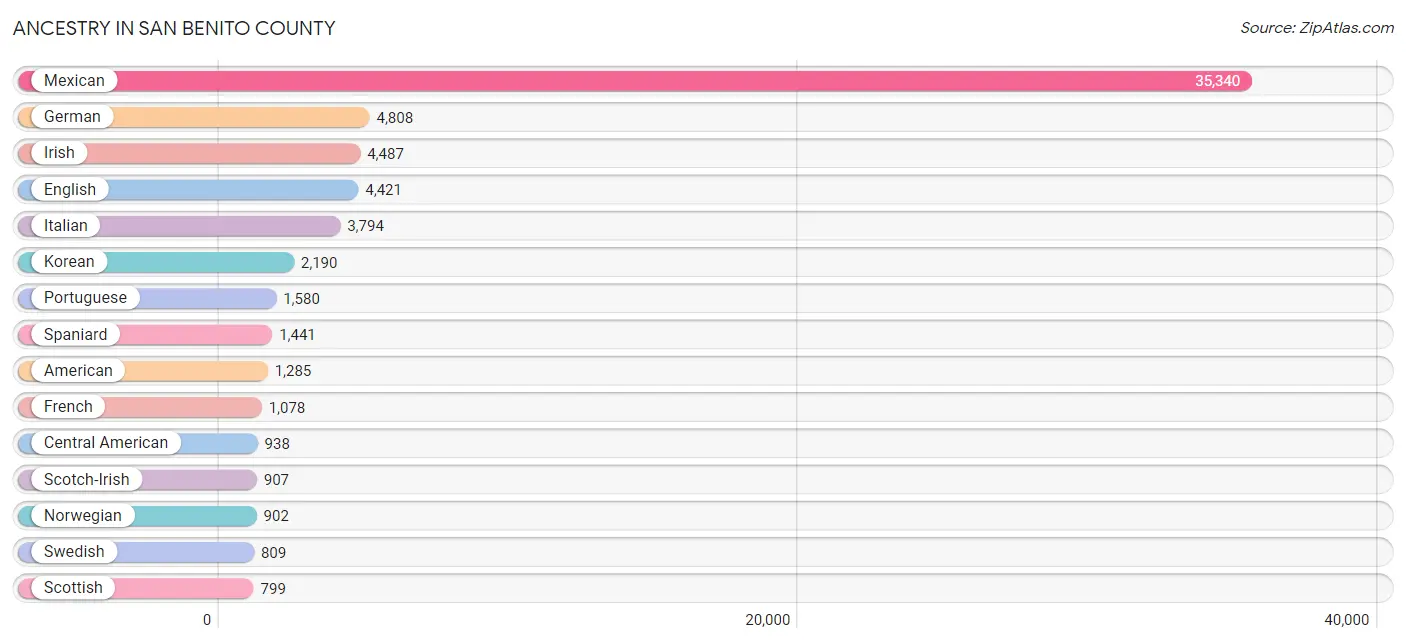
Ancestry in San Benito County
The most populous ancestries reported in San Benito County are Mexican (35,340 | 54.6%), German (4,808 | 7.4%), Irish (4,487 | 6.9%), English (4,421 | 6.8%), and Italian (3,794 | 5.9%), together accounting for 81.6% of all San Benito County residents.
| Ancestry | # Population | % Population |
| African | 5 | 0.0% |
| American | 1,285 | 2.0% |
| Apache | 236 | 0.4% |
| Arab | 127 | 0.2% |
| Argentinean | 31 | 0.1% |
| Armenian | 63 | 0.1% |
| Assyrian / Chaldean / Syriac | 30 | 0.1% |
| Australian | 5 | 0.0% |
| Austrian | 59 | 0.1% |
| Basque | 76 | 0.1% |
| Belgian | 16 | 0.0% |
| Bhutanese | 727 | 1.1% |
| Blackfeet | 46 | 0.1% |
| Bolivian | 83 | 0.1% |
| British | 231 | 0.4% |
| Burmese | 154 | 0.2% |
| Canadian | 37 | 0.1% |
| Cape Verdean | 10 | 0.0% |
| Central American | 938 | 1.5% |
| Central American Indian | 245 | 0.4% |
| Cherokee | 189 | 0.3% |
| Chickasaw | 20 | 0.0% |
| Chilean | 7 | 0.0% |
| Chippewa | 24 | 0.0% |
| Choctaw | 69 | 0.1% |
| Colombian | 61 | 0.1% |
| Costa Rican | 76 | 0.1% |
| Croatian | 48 | 0.1% |
| Cuban | 75 | 0.1% |
| Czech | 101 | 0.2% |
| Czechoslovakian | 68 | 0.1% |
| Danish | 278 | 0.4% |
| Dominican | 9 | 0.0% |
| Dutch | 418 | 0.6% |
| Eastern European | 183 | 0.3% |
| Ecuadorian | 37 | 0.1% |
| Egyptian | 71 | 0.1% |
| English | 4,421 | 6.8% |
| European | 789 | 1.2% |
| Filipino | 1 | 0.0% |
| Finnish | 123 | 0.2% |
| French | 1,078 | 1.7% |
| French Canadian | 235 | 0.4% |
| German | 4,808 | 7.4% |
| Greek | 112 | 0.2% |
| Guamanian / Chamorro | 49 | 0.1% |
| Guatemalan | 235 | 0.4% |
| Honduran | 180 | 0.3% |
| Hungarian | 94 | 0.2% |
| Indian (Asian) | 432 | 0.7% |
| Iranian | 49 | 0.1% |
| Irish | 4,487 | 6.9% |
| Iroquois | 46 | 0.1% |
| Italian | 3,794 | 5.9% |
| Jamaican | 2 | 0.0% |
| Japanese | 3 | 0.0% |
| Kenyan | 7 | 0.0% |
| Korean | 2,190 | 3.4% |
| Laotian | 14 | 0.0% |
| Lebanese | 49 | 0.1% |
| Lithuanian | 68 | 0.1% |
| Malaysian | 34 | 0.1% |
| Maltese | 12 | 0.0% |
| Mexican | 35,340 | 54.6% |
| Mexican American Indian | 455 | 0.7% |
| Native Hawaiian | 315 | 0.5% |
| New Zealander | 11 | 0.0% |
| Nigerian | 16 | 0.0% |
| Northern European | 102 | 0.2% |
| Norwegian | 902 | 1.4% |
| Ottawa | 31 | 0.1% |
| Panamanian | 22 | 0.0% |
| Peruvian | 71 | 0.1% |
| Polish | 599 | 0.9% |
| Portuguese | 1,580 | 2.4% |
| Potawatomi | 42 | 0.1% |
| Puerto Rican | 792 | 1.2% |
| Romanian | 23 | 0.0% |
| Russian | 197 | 0.3% |
| Salvadoran | 423 | 0.6% |
| Samoan | 1 | 0.0% |
| Scandinavian | 167 | 0.3% |
| Scotch-Irish | 907 | 1.4% |
| Scottish | 799 | 1.2% |
| Serbian | 47 | 0.1% |
| Sierra Leonean | 2 | 0.0% |
| Sioux | 14 | 0.0% |
| Slavic | 10 | 0.0% |
| Slovak | 59 | 0.1% |
| Slovene | 3 | 0.0% |
| South American | 419 | 0.6% |
| South American Indian | 10 | 0.0% |
| Spaniard | 1,441 | 2.2% |
| Spanish | 287 | 0.4% |
| Sri Lankan | 113 | 0.2% |
| Subsaharan African | 41 | 0.1% |
| Swedish | 809 | 1.3% |
| Swiss | 255 | 0.4% |
| Thai | 281 | 0.4% |
| Tongan | 15 | 0.0% |
| Trinidadian and Tobagonian | 19 | 0.0% |
| Ukrainian | 28 | 0.0% |
| Venezuelan | 129 | 0.2% |
| Welsh | 353 | 0.5% |
| West Indian | 3 | 0.0% |
| Yaqui | 10 | 0.0% |
| Yugoslavian | 4 | 0.0% | View All 107 Rows |
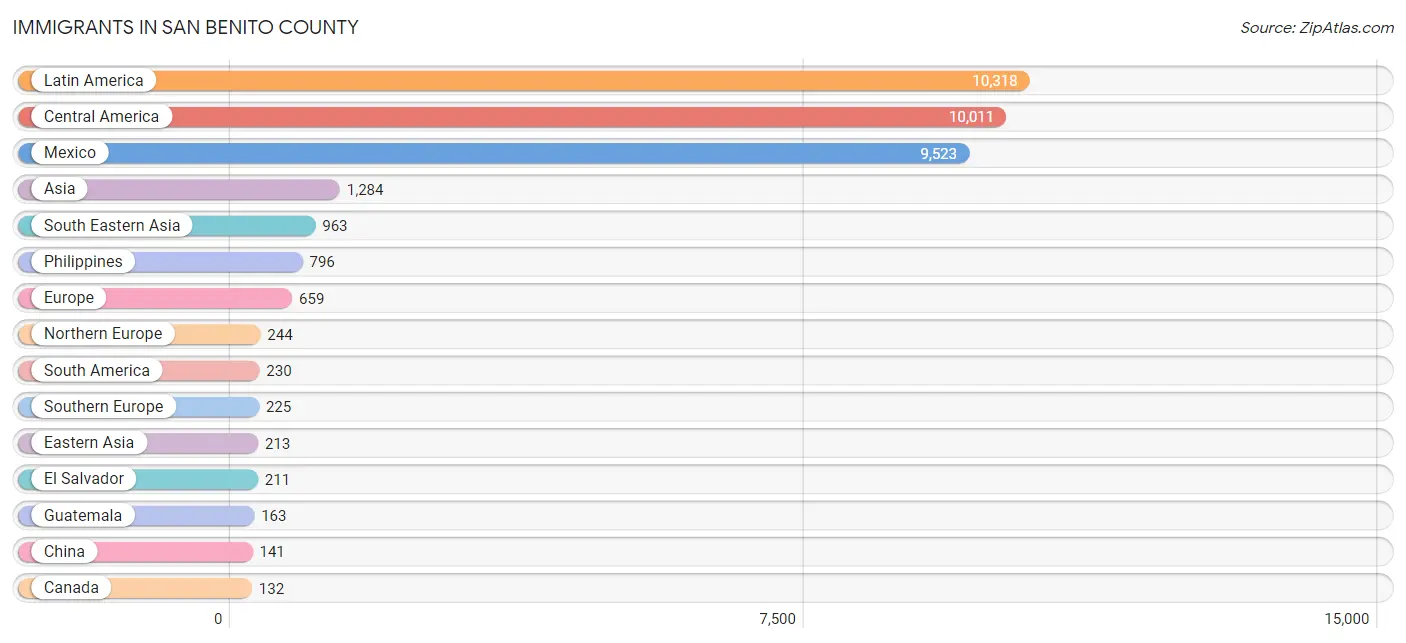
Immigrants in San Benito County
The most numerous immigrant groups reported in San Benito County came from Latin America (10,318 | 15.9%), Central America (10,011 | 15.5%), Mexico (9,523 | 14.7%), Asia (1,284 | 2.0%), and South Eastern Asia (963 | 1.5%), together accounting for 49.6% of all San Benito County residents.
| Immigration Origin | # Population | % Population |
| Africa | 90 | 0.1% |
| Argentina | 17 | 0.0% |
| Asia | 1,284 | 2.0% |
| Australia | 12 | 0.0% |
| Azores | 26 | 0.0% |
| Belgium | 9 | 0.0% |
| Canada | 132 | 0.2% |
| Caribbean | 77 | 0.1% |
| Central America | 10,011 | 15.5% |
| China | 141 | 0.2% |
| Colombia | 101 | 0.2% |
| Croatia | 33 | 0.1% |
| Cuba | 9 | 0.0% |
| Eastern Africa | 10 | 0.0% |
| Eastern Asia | 213 | 0.3% |
| Eastern Europe | 126 | 0.2% |
| Ecuador | 33 | 0.1% |
| Egypt | 71 | 0.1% |
| El Salvador | 211 | 0.3% |
| England | 96 | 0.2% |
| Europe | 659 | 1.0% |
| Fiji | 31 | 0.1% |
| Germany | 39 | 0.1% |
| Ghana | 4 | 0.0% |
| Guatemala | 163 | 0.3% |
| Honduras | 107 | 0.2% |
| Hong Kong | 23 | 0.0% |
| India | 66 | 0.1% |
| Indonesia | 14 | 0.0% |
| Iran | 13 | 0.0% |
| Ireland | 28 | 0.0% |
| Italy | 68 | 0.1% |
| Japan | 47 | 0.1% |
| Kenya | 7 | 0.0% |
| Korea | 25 | 0.0% |
| Laos | 34 | 0.1% |
| Latin America | 10,318 | 15.9% |
| Lebanon | 29 | 0.0% |
| Mexico | 9,523 | 14.7% |
| Netherlands | 16 | 0.0% |
| Northern Africa | 71 | 0.1% |
| Northern Europe | 244 | 0.4% |
| Norway | 17 | 0.0% |
| Oceania | 50 | 0.1% |
| Panama | 7 | 0.0% |
| Peru | 36 | 0.1% |
| Philippines | 796 | 1.2% |
| Poland | 22 | 0.0% |
| Portugal | 66 | 0.1% |
| Russia | 67 | 0.1% |
| Scotland | 47 | 0.1% |
| South Africa | 5 | 0.0% |
| South America | 230 | 0.4% |
| South Central Asia | 79 | 0.1% |
| South Eastern Asia | 963 | 1.5% |
| Southern Europe | 225 | 0.4% |
| Spain | 91 | 0.1% |
| Taiwan | 11 | 0.0% |
| Trinidad and Tobago | 68 | 0.1% |
| Ukraine | 4 | 0.0% |
| Venezuela | 43 | 0.1% |
| Vietnam | 119 | 0.2% |
| Western Africa | 4 | 0.0% |
| Western Asia | 29 | 0.0% |
| Western Europe | 64 | 0.1% | View All 65 Rows |
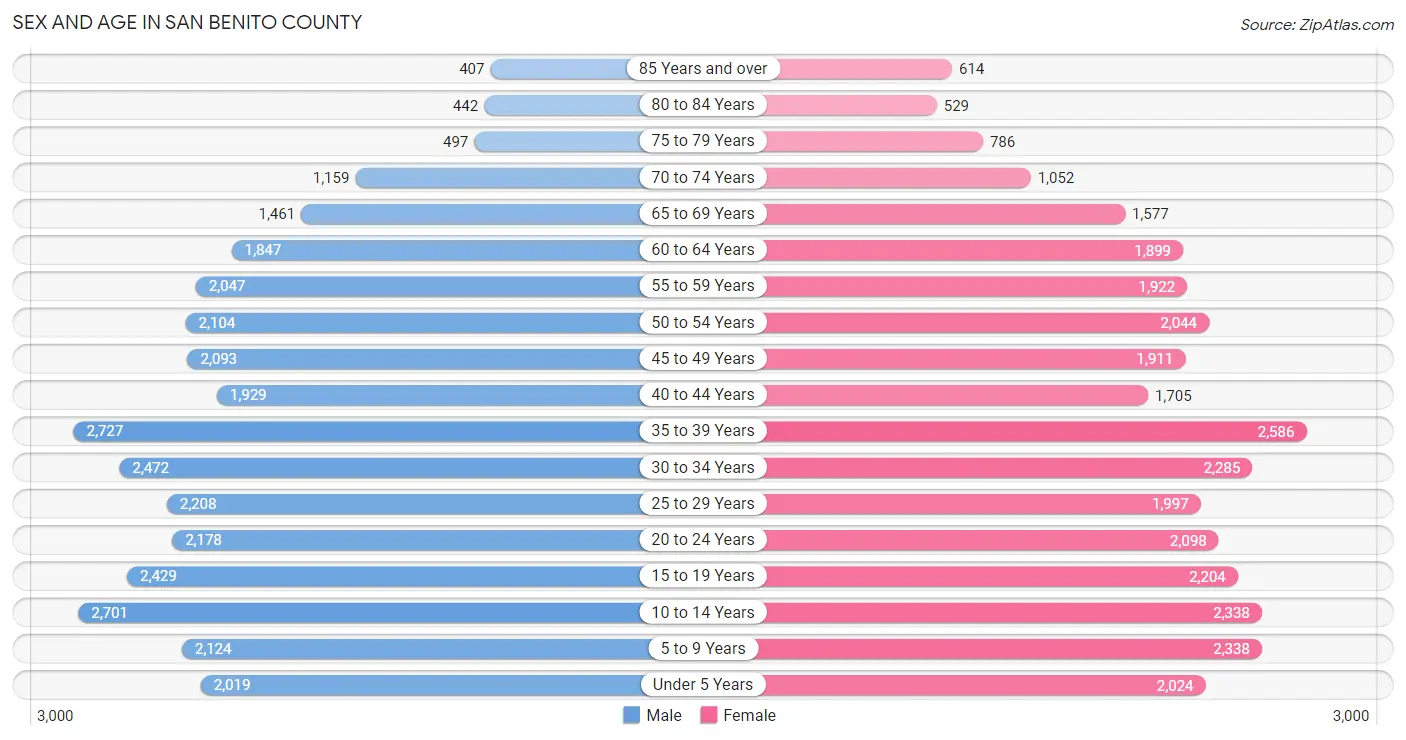
Sex and Age in San Benito County
Sex and Age in San Benito County
The most populous age groups in San Benito County are 35 to 39 Years (2,727 | 8.3%) for men and 35 to 39 Years (2,586 | 8.1%) for women.
| Age Bracket | Male | Female |
| Under 5 Years | 2,019 (6.1%) | 2,024 (6.3%) |
| 5 to 9 Years | 2,124 (6.5%) | 2,338 (7.3%) |
| 10 to 14 Years | 2,701 (8.2%) | 2,338 (7.3%) |
| 15 to 19 Years | 2,429 (7.4%) | 2,204 (6.9%) |
| 20 to 24 Years | 2,178 (6.6%) | 2,098 (6.6%) |
| 25 to 29 Years | 2,208 (6.7%) | 1,997 (6.3%) |
| 30 to 34 Years | 2,472 (7.5%) | 2,285 (7.2%) |
| 35 to 39 Years | 2,727 (8.3%) | 2,586 (8.1%) |
| 40 to 44 Years | 1,929 (5.9%) | 1,705 (5.3%) |
| 45 to 49 Years | 2,093 (6.4%) | 1,911 (6.0%) |
| 50 to 54 Years | 2,104 (6.4%) | 2,044 (6.4%) |
| 55 to 59 Years | 2,047 (6.2%) | 1,922 (6.0%) |
| 60 to 64 Years | 1,847 (5.6%) | 1,899 (5.9%) |
| 65 to 69 Years | 1,461 (4.4%) | 1,577 (4.9%) |
| 70 to 74 Years | 1,159 (3.5%) | 1,052 (3.3%) |
| 75 to 79 Years | 497 (1.5%) | 786 (2.5%) |
| 80 to 84 Years | 442 (1.3%) | 529 (1.7%) |
| 85 Years and over | 407 (1.2%) | 614 (1.9%) |
| Total | 32,844 (100.0%) | 31,909 (100.0%) |
Families and Households in San Benito County
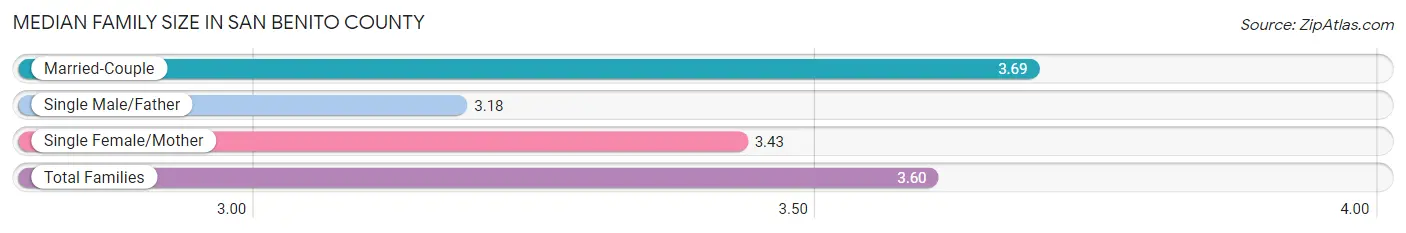
Median Family Size in San Benito County
The median family size in San Benito County is 3.60 persons per family, with married-couple families (11,726 | 74.5%) accounting for the largest median family size of 3.69 persons per family. On the other hand, single male/father families (1,601 | 10.2%) represent the smallest median family size with 3.18 persons per family.
| Family Type | # Families | Family Size |
| Married-Couple | 11,726 (74.5%) | 3.69 |
| Single Male/Father | 1,601 (10.2%) | 3.18 |
| Single Female/Mother | 2,406 (15.3%) | 3.43 |
| Total Families | 15,733 (100.0%) | 3.60 |
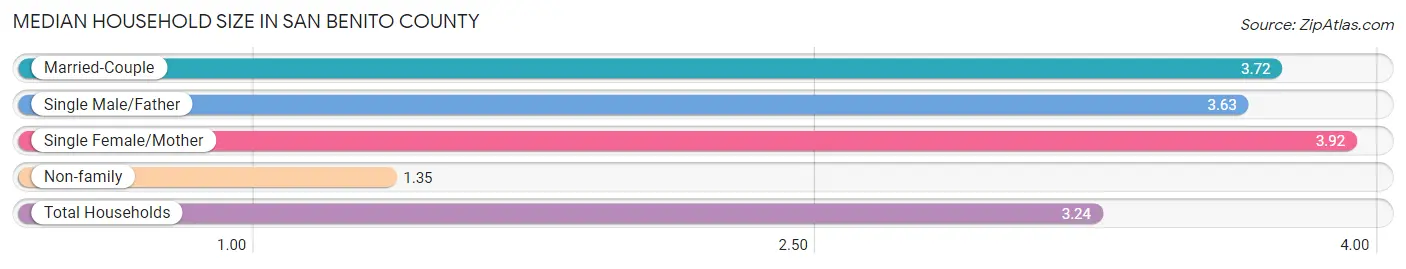
Median Household Size in San Benito County
The median household size in San Benito County is 3.24 persons per household, with single female/mother households (2,406 | 12.1%) accounting for the largest median household size of 3.92 persons per household. non-family households (4,119 | 20.7%) represent the smallest median household size with 1.35 persons per household.
| Household Type | # Households | Household Size |
| Married-Couple | 11,726 (59.1%) | 3.72 |
| Single Male/Father | 1,601 (8.1%) | 3.63 |
| Single Female/Mother | 2,406 (12.1%) | 3.92 |
| Non-family | 4,119 (20.7%) | 1.35 |
| Total Households | 19,852 (100.0%) | 3.24 |
Household Size by Marriage Status in San Benito County
Out of a total of 19,852 households in San Benito County, 15,733 (79.2%) are family households, while 4,119 (20.7%) are nonfamily households. The most numerous type of family households are 2-person households, comprising 4,519, and the most common type of nonfamily households are 1-person households, comprising 3,167.
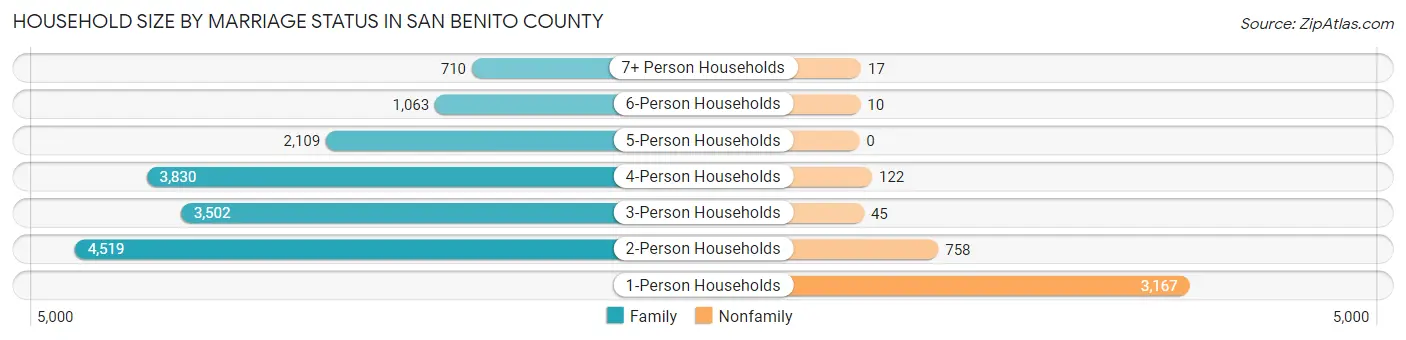
| Household Size | Family Households | Nonfamily Households |
| 1-Person Households | - | 3,167 (16.0%) |
| 2-Person Households | 4,519 (22.8%) | 758 (3.8%) |
| 3-Person Households | 3,502 (17.6%) | 45 (0.2%) |
| 4-Person Households | 3,830 (19.3%) | 122 (0.6%) |
| 5-Person Households | 2,109 (10.6%) | 0 (0.0%) |
| 6-Person Households | 1,063 (5.3%) | 10 (0.1%) |
| 7+ Person Households | 710 (3.6%) | 17 (0.1%) |
| Total | 15,733 (79.2%) | 4,119 (20.7%) |
Female Fertility in San Benito County
Fertility by Age in San Benito County
Average fertility rate in San Benito County is 59.0 births per 1,000 women. Women in the age bracket of 20 to 34 years have the highest fertility rate with 102.0 births per 1,000 women. Women in the age bracket of 20 to 34 years acount for 72.8% of all women with births.
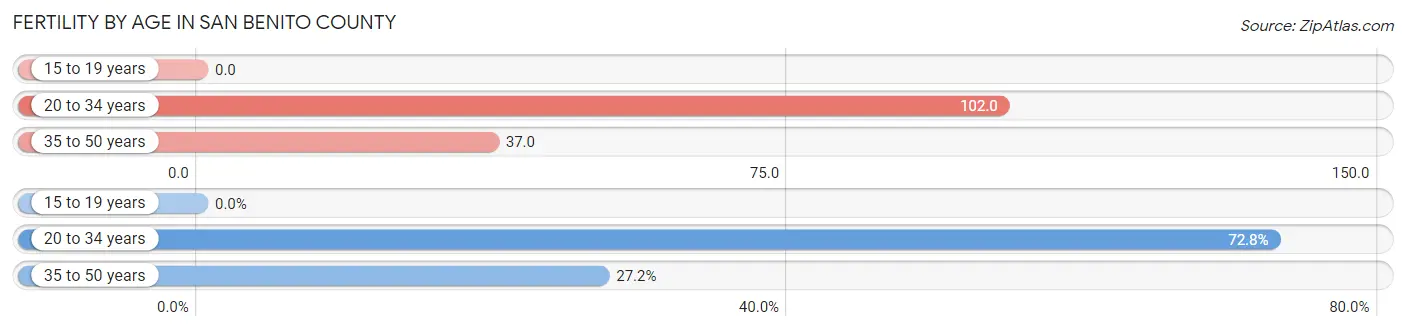
| Age Bracket | Women with Births | Births / 1,000 Women |
| 15 to 19 years | 0 (0.0%) | 0.0 |
| 20 to 34 years | 652 (72.8%) | 102.0 |
| 35 to 50 years | 244 (27.2%) | 37.0 |
| Total | 896 (100.0%) | 59.0 |
Fertility by Age by Marriage Status in San Benito County
74.8% of women with births (896) in San Benito County are married. The highest percentage of unmarried women with births falls into 20 to 34 years age bracket with 33.7% of them unmarried at the time of birth, while the lowest percentage of unmarried women with births belong to 35 to 50 years age bracket with 2.5% of them unmarried.
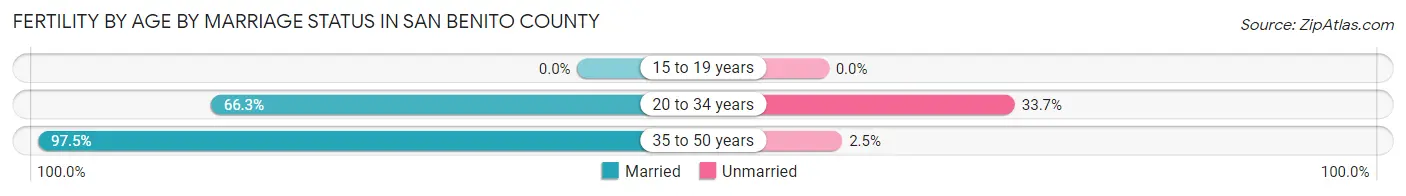
| Age Bracket | Married | Unmarried |
| 15 to 19 years | 0 (0.0%) | 0 (0.0%) |
| 20 to 34 years | 432 (66.3%) | 220 (33.7%) |
| 35 to 50 years | 238 (97.5%) | 6 (2.5%) |
| Total | 670 (74.8%) | 226 (25.2%) |
Fertility by Education in San Benito County
Average fertility rate in San Benito County is 59.0 births per 1,000 women. Women with the education attainment of graduate degree have the highest fertility rate of 87.0 births per 1,000 women, while women with the education attainment of less than high school have the lowest fertility at 5.0 births per 1,000 women. Women with the education attainment of college or associate's degree represent 36.0% of all women with births.
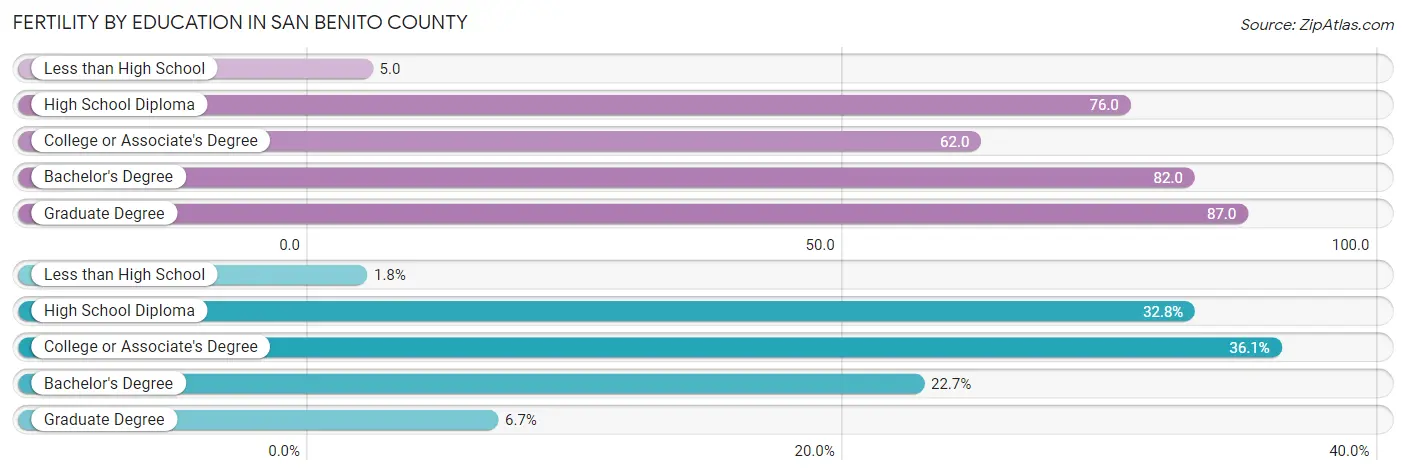
| Educational Attainment | Women with Births | Births / 1,000 Women |
| Less than High School | 16 (1.8%) | 5.0 |
| High School Diploma | 294 (32.8%) | 76.0 |
| College or Associate's Degree | 323 (36.0%) | 62.0 |
| Bachelor's Degree | 203 (22.7%) | 82.0 |
| Graduate Degree | 60 (6.7%) | 87.0 |
| Total | 896 (100.0%) | 59.0 |
Fertility by Education by Marriage Status in San Benito County
25.2% of women with births in San Benito County are unmarried. Women with the educational attainment of bachelor's degree are most likely to be married with 100.0% of them married at childbirth, while women with the educational attainment of less than high school are least likely to be married with 93.8% of them unmarried at childbirth.
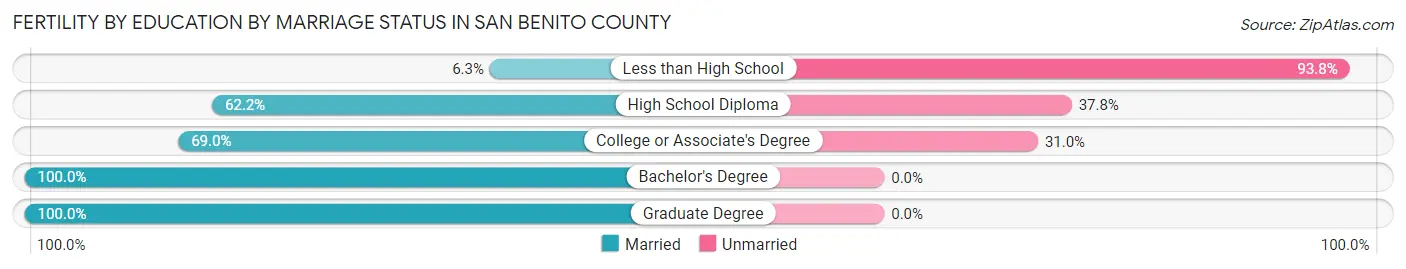
| Educational Attainment | Married | Unmarried |
| Less than High School | 1 (6.2%) | 15 (93.8%) |
| High School Diploma | 183 (62.2%) | 111 (37.8%) |
| College or Associate's Degree | 223 (69.0%) | 100 (31.0%) |
| Bachelor's Degree | 203 (100.0%) | 0 (0.0%) |
| Graduate Degree | 60 (100.0%) | 0 (0.0%) |
| Total | 670 (74.8%) | 226 (25.2%) |
Employment Characteristics in San Benito County
Employment by Class of Employer in San Benito County
Among the 30,710 employed individuals in San Benito County, private company employees (20,969 | 68.3%), local government employees (3,572 | 11.6%), and self-employed (not incorporated) (1,961 | 6.4%) make up the most common classes of employment.
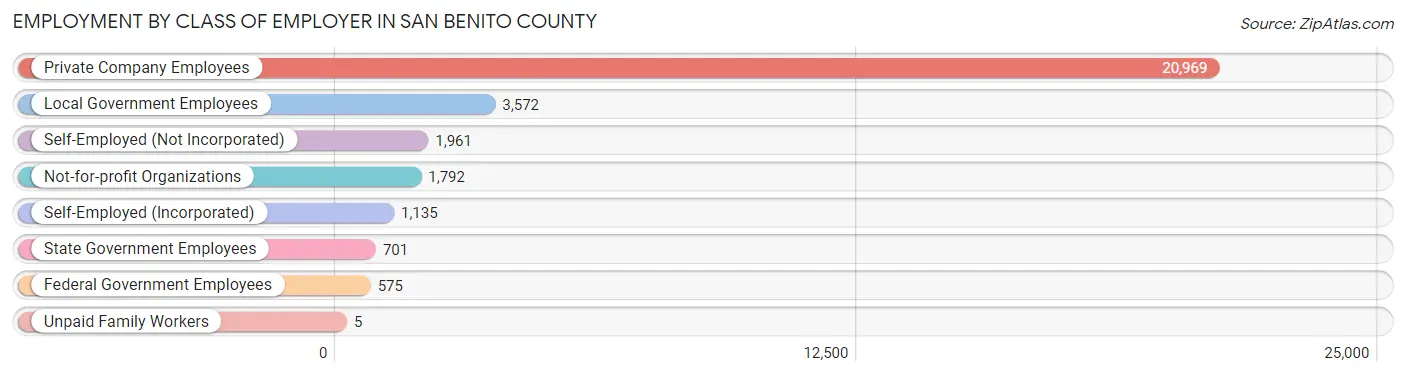
| Employer Class | # Employees | % Employees |
| Private Company Employees | 20,969 | 68.3% |
| Self-Employed (Incorporated) | 1,135 | 3.7% |
| Self-Employed (Not Incorporated) | 1,961 | 6.4% |
| Not-for-profit Organizations | 1,792 | 5.8% |
| Local Government Employees | 3,572 | 11.6% |
| State Government Employees | 701 | 2.3% |
| Federal Government Employees | 575 | 1.9% |
| Unpaid Family Workers | 5 | 0.0% |
| Total | 30,710 | 100.0% |
Employment Status by Age in San Benito County
According to the labor force statistics for San Benito County, out of the total population over 16 years of age (50,143), 68.0% or 34,097 individuals are in the labor force, with 6.2% or 2,114 of them unemployed. The age group with the highest labor force participation rate is 25 to 29 years, with 87.5% or 3,679 individuals in the labor force. Within the labor force, the 75 years and over age range has the highest percentage of unemployed individuals, with 11.7% or 23 of them being unemployed.
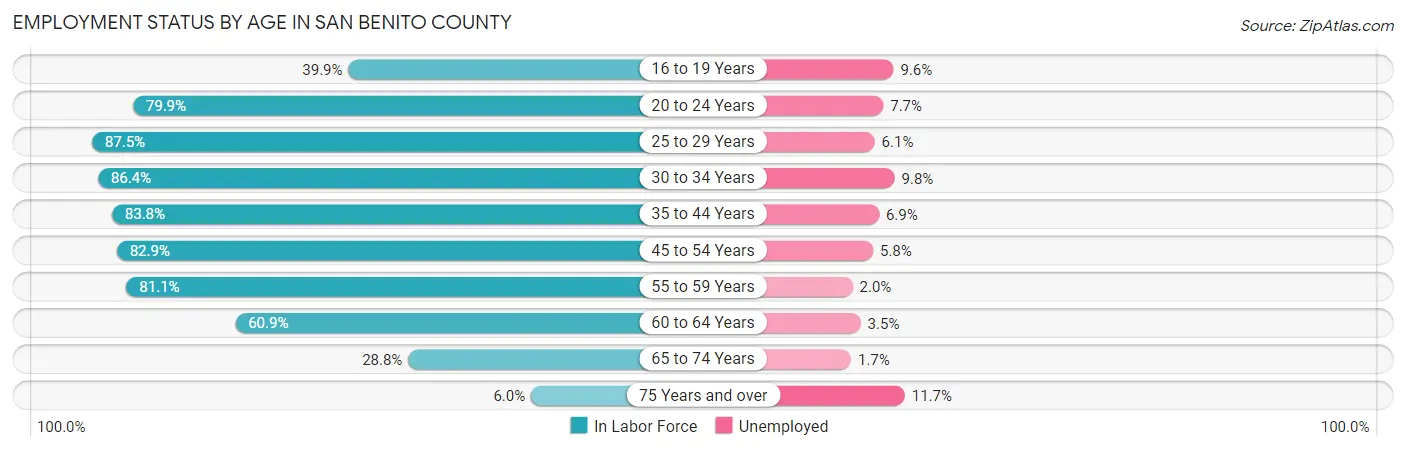
| Age Bracket | In Labor Force | Unemployed |
| 16 to 19 Years | 1,423 (39.9%) | 137 (9.6%) |
| 20 to 24 Years | 3,417 (79.9%) | 263 (7.7%) |
| 25 to 29 Years | 3,679 (87.5%) | 224 (6.1%) |
| 30 to 34 Years | 4,110 (86.4%) | 403 (9.8%) |
| 35 to 44 Years | 7,498 (83.8%) | 517 (6.9%) |
| 45 to 54 Years | 6,758 (82.9%) | 392 (5.8%) |
| 55 to 59 Years | 3,219 (81.1%) | 64 (2.0%) |
| 60 to 64 Years | 2,281 (60.9%) | 80 (3.5%) |
| 65 to 74 Years | 1,512 (28.8%) | 26 (1.7%) |
| 75 Years and over | 196 (6.0%) | 23 (11.7%) |
| Total | 34,097 (68.0%) | 2,114 (6.2%) |
Employment Status by Educational Attainment in San Benito County
According to labor force statistics for San Benito County, 81.6% of individuals (27,561) out of the total population between 25 and 64 years of age (33,776) are in the labor force, with 6.1% or 1,681 of them being unemployed. The group with the highest labor force participation rate are those with the educational attainment of bachelor's degree or higher, with 86.3% or 6,054 individuals in the labor force. Within the labor force, individuals with less than high school education have the highest percentage of unemployment, with 10.3% or 390 of them being unemployed.
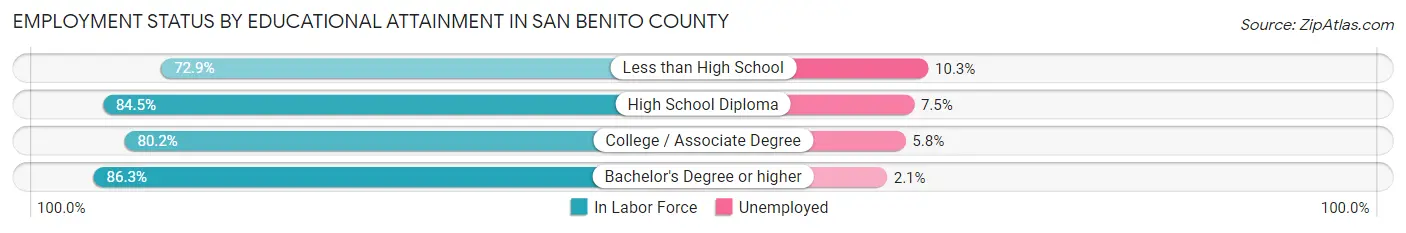
| Educational Attainment | In Labor Force | Unemployed |
| Less than High School | 3,788 (72.9%) | 535 (10.3%) |
| High School Diploma | 8,037 (84.5%) | 713 (7.5%) |
| College / Associate Degree | 9,667 (80.2%) | 699 (5.8%) |
| Bachelor's Degree or higher | 6,054 (86.3%) | 147 (2.1%) |
| Total | 27,561 (81.6%) | 2,060 (6.1%) |
Employment Occupations by Sex in San Benito County
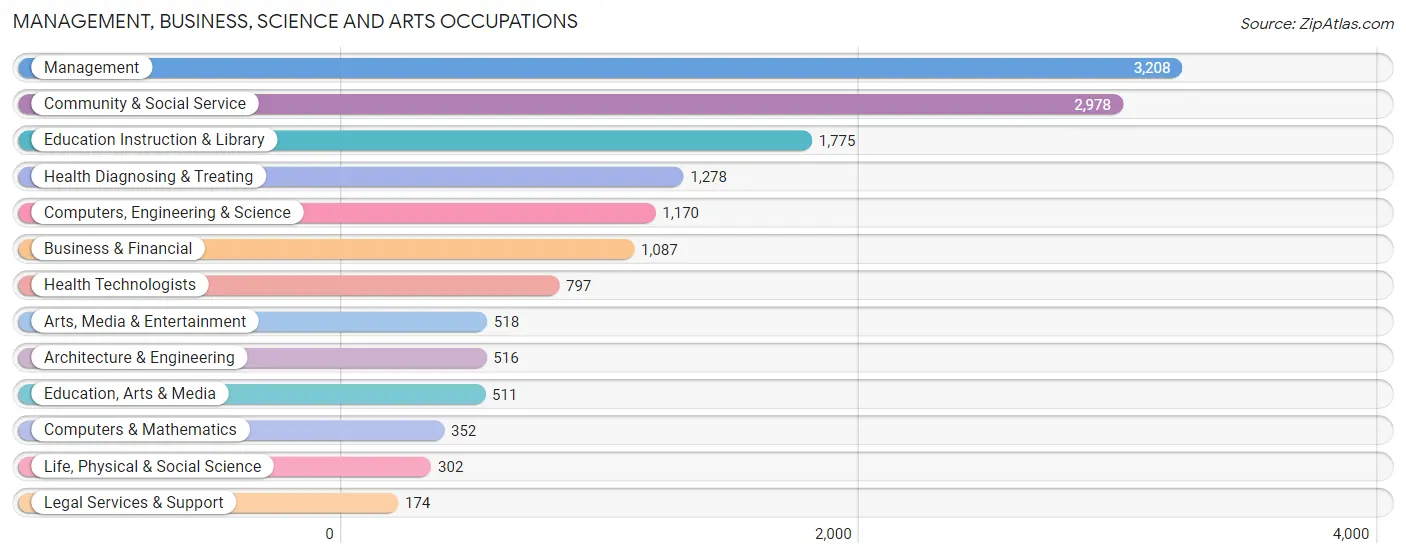
Management, Business, Science and Arts Occupations
The most common Management, Business, Science and Arts occupations in San Benito County are Management (3,208 | 10.1%), Community & Social Service (2,978 | 9.3%), Education Instruction & Library (1,775 | 5.6%), Health Diagnosing & Treating (1,278 | 4.0%), and Computers, Engineering & Science (1,170 | 3.7%).
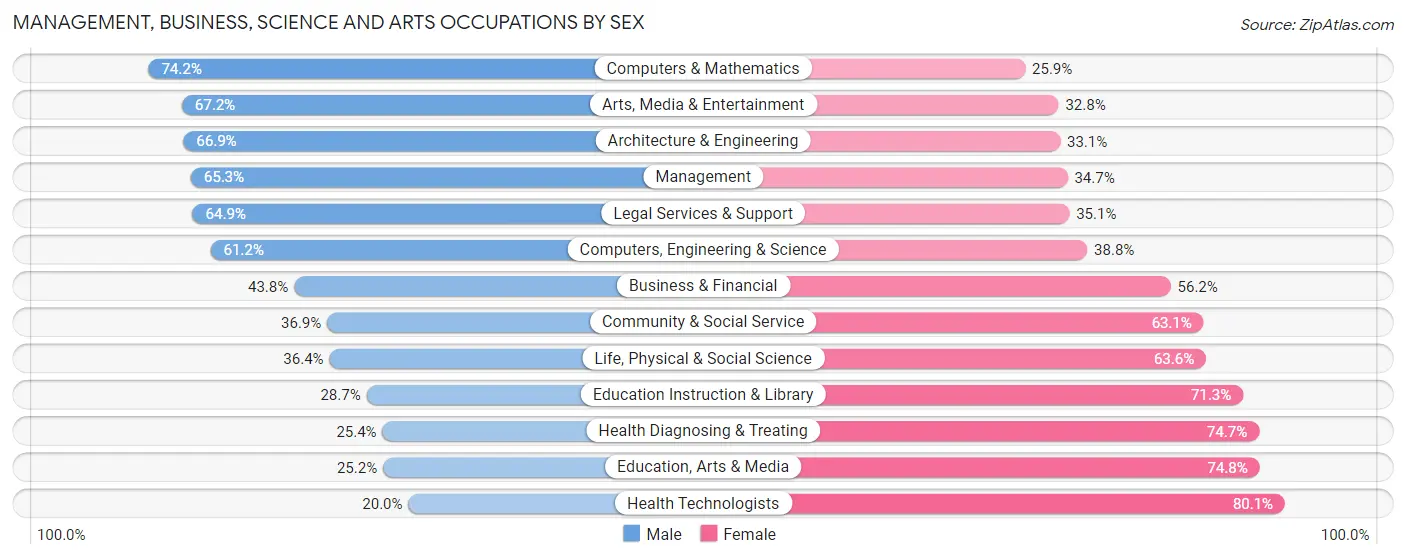
Management, Business, Science and Arts Occupations by Sex
Within the Management, Business, Science and Arts occupations in San Benito County, the most male-oriented occupations are Computers & Mathematics (74.2%), Arts, Media & Entertainment (67.2%), and Architecture & Engineering (66.9%), while the most female-oriented occupations are Health Technologists (80.0%), Education, Arts & Media (74.8%), and Health Diagnosing & Treating (74.7%).
| Occupation | Male | Female |
| Management | 2,095 (65.3%) | 1,113 (34.7%) |
| Business & Financial | 476 (43.8%) | 611 (56.2%) |
| Computers, Engineering & Science | 716 (61.2%) | 454 (38.8%) |
| Computers & Mathematics | 261 (74.2%) | 91 (25.9%) |
| Architecture & Engineering | 345 (66.9%) | 171 (33.1%) |
| Life, Physical & Social Science | 110 (36.4%) | 192 (63.6%) |
| Community & Social Service | 1,099 (36.9%) | 1,879 (63.1%) |
| Education, Arts & Media | 129 (25.2%) | 382 (74.8%) |
| Legal Services & Support | 113 (64.9%) | 61 (35.1%) |
| Education Instruction & Library | 509 (28.7%) | 1,266 (71.3%) |
| Arts, Media & Entertainment | 348 (67.2%) | 170 (32.8%) |
| Health Diagnosing & Treating | 324 (25.4%) | 954 (74.7%) |
| Health Technologists | 159 (20.0%) | 638 (80.0%) |
| Total (Category) | 4,710 (48.4%) | 5,011 (51.5%) |
| Total (Overall) | 17,825 (55.8%) | 14,103 (44.2%) |
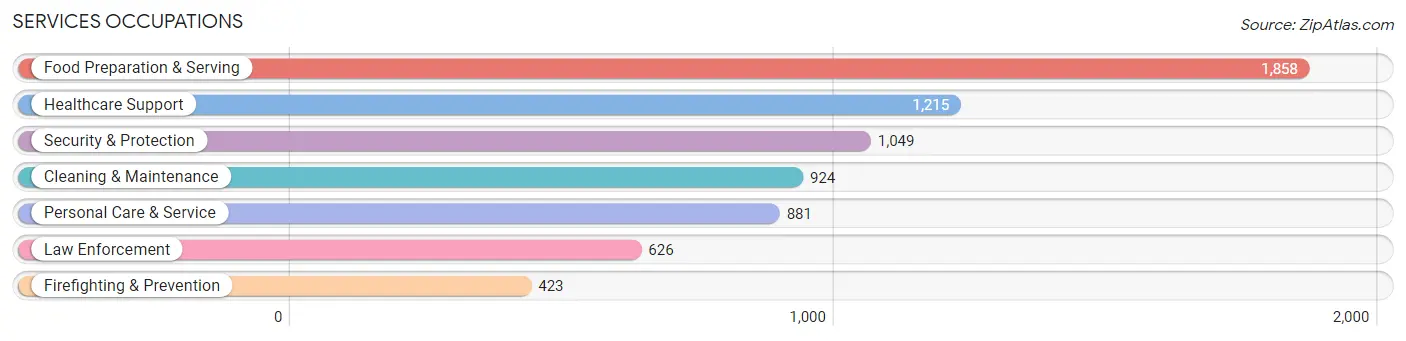
Services Occupations
The most common Services occupations in San Benito County are Food Preparation & Serving (1,858 | 5.8%), Healthcare Support (1,215 | 3.8%), Security & Protection (1,049 | 3.3%), Cleaning & Maintenance (924 | 2.9%), and Personal Care & Service (881 | 2.8%).
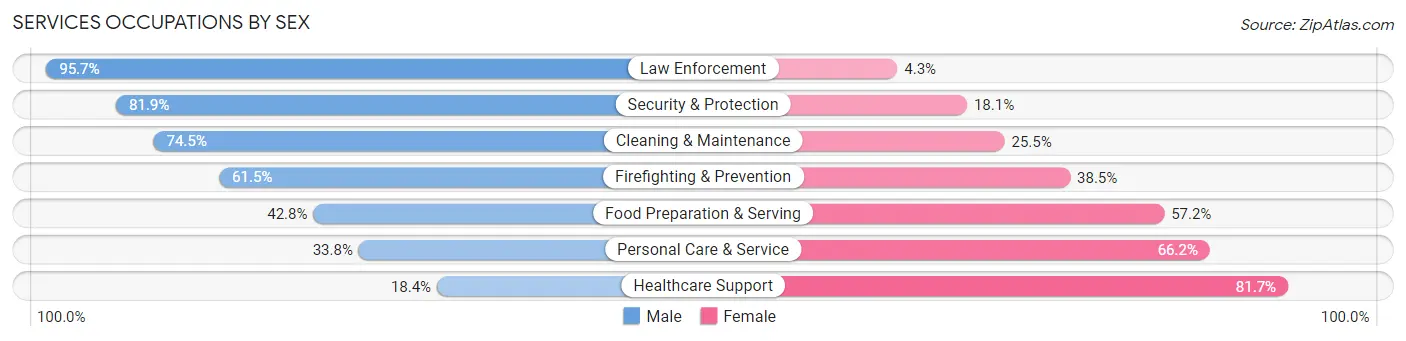
Services Occupations by Sex
Within the Services occupations in San Benito County, the most male-oriented occupations are Law Enforcement (95.7%), Security & Protection (81.9%), and Cleaning & Maintenance (74.5%), while the most female-oriented occupations are Healthcare Support (81.7%), Personal Care & Service (66.2%), and Food Preparation & Serving (57.2%).
| Occupation | Male | Female |
| Healthcare Support | 223 (18.3%) | 992 (81.7%) |
| Security & Protection | 859 (81.9%) | 190 (18.1%) |
| Firefighting & Prevention | 260 (61.5%) | 163 (38.5%) |
| Law Enforcement | 599 (95.7%) | 27 (4.3%) |
| Food Preparation & Serving | 796 (42.8%) | 1,062 (57.2%) |
| Cleaning & Maintenance | 688 (74.5%) | 236 (25.5%) |
| Personal Care & Service | 298 (33.8%) | 583 (66.2%) |
| Total (Category) | 2,864 (48.3%) | 3,063 (51.7%) |
| Total (Overall) | 17,825 (55.8%) | 14,103 (44.2%) |
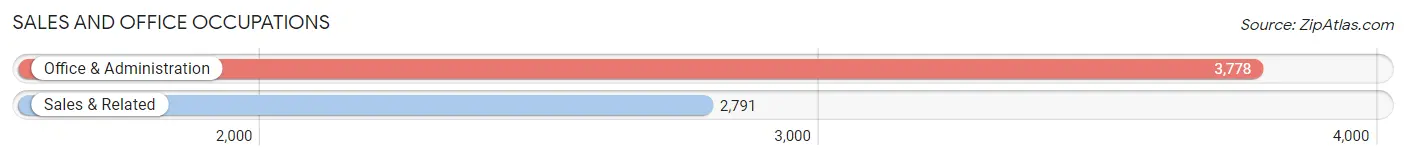
Sales and Office Occupations
The most common Sales and Office occupations in San Benito County are Office & Administration (3,778 | 11.8%), and Sales & Related (2,791 | 8.7%).
Sales and Office Occupations by Sex
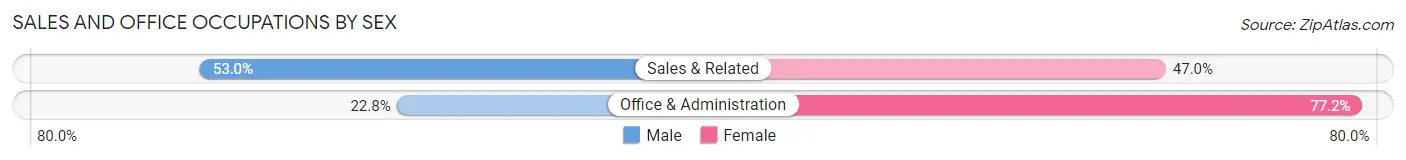
| Occupation | Male | Female |
| Sales & Related | 1,480 (53.0%) | 1,311 (47.0%) |
| Office & Administration | 861 (22.8%) | 2,917 (77.2%) |
| Total (Category) | 2,341 (35.6%) | 4,228 (64.4%) |
| Total (Overall) | 17,825 (55.8%) | 14,103 (44.2%) |
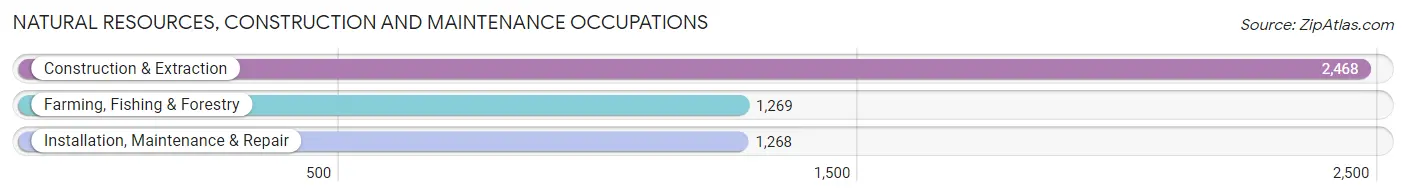
Natural Resources, Construction and Maintenance Occupations
The most common Natural Resources, Construction and Maintenance occupations in San Benito County are Construction & Extraction (2,468 | 7.7%), Farming, Fishing & Forestry (1,269 | 4.0%), and Installation, Maintenance & Repair (1,268 | 4.0%).
Natural Resources, Construction and Maintenance Occupations by Sex
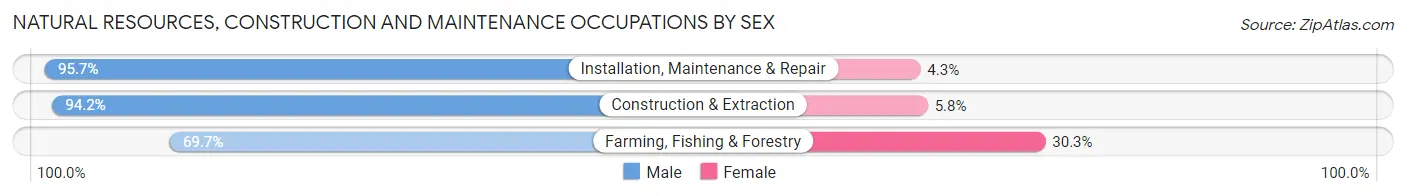
| Occupation | Male | Female |
| Farming, Fishing & Forestry | 885 (69.7%) | 384 (30.3%) |
| Construction & Extraction | 2,325 (94.2%) | 143 (5.8%) |
| Installation, Maintenance & Repair | 1,214 (95.7%) | 54 (4.3%) |
| Total (Category) | 4,424 (88.4%) | 581 (11.6%) |
| Total (Overall) | 17,825 (55.8%) | 14,103 (44.2%) |
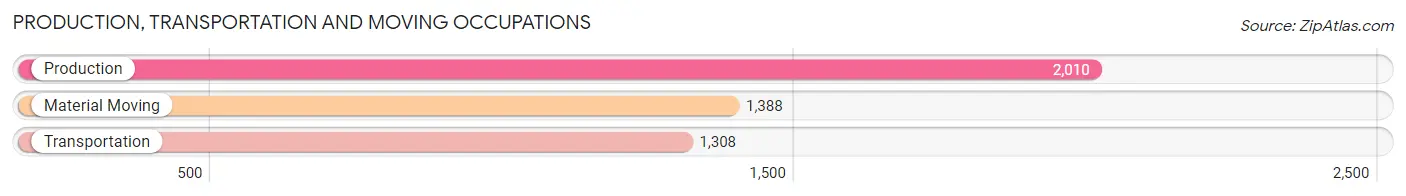
Production, Transportation and Moving Occupations
The most common Production, Transportation and Moving occupations in San Benito County are Production (2,010 | 6.3%), Material Moving (1,388 | 4.3%), and Transportation (1,308 | 4.1%).
Production, Transportation and Moving Occupations by Sex
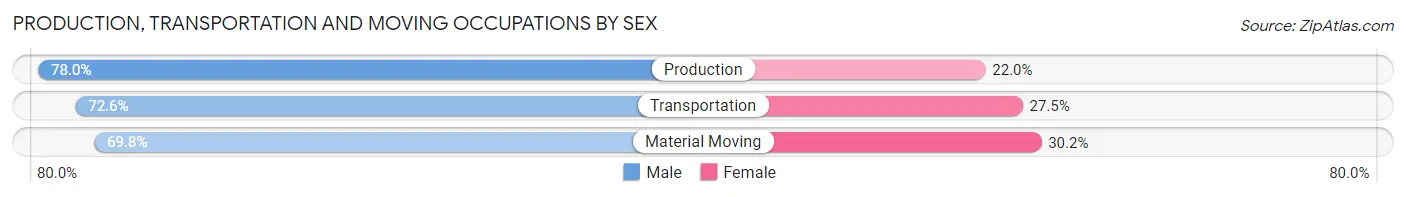
| Occupation | Male | Female |
| Production | 1,568 (78.0%) | 442 (22.0%) |
| Transportation | 949 (72.6%) | 359 (27.5%) |
| Material Moving | 969 (69.8%) | 419 (30.2%) |
| Total (Category) | 3,486 (74.1%) | 1,220 (25.9%) |
| Total (Overall) | 17,825 (55.8%) | 14,103 (44.2%) |
Employment Industries by Sex in San Benito County
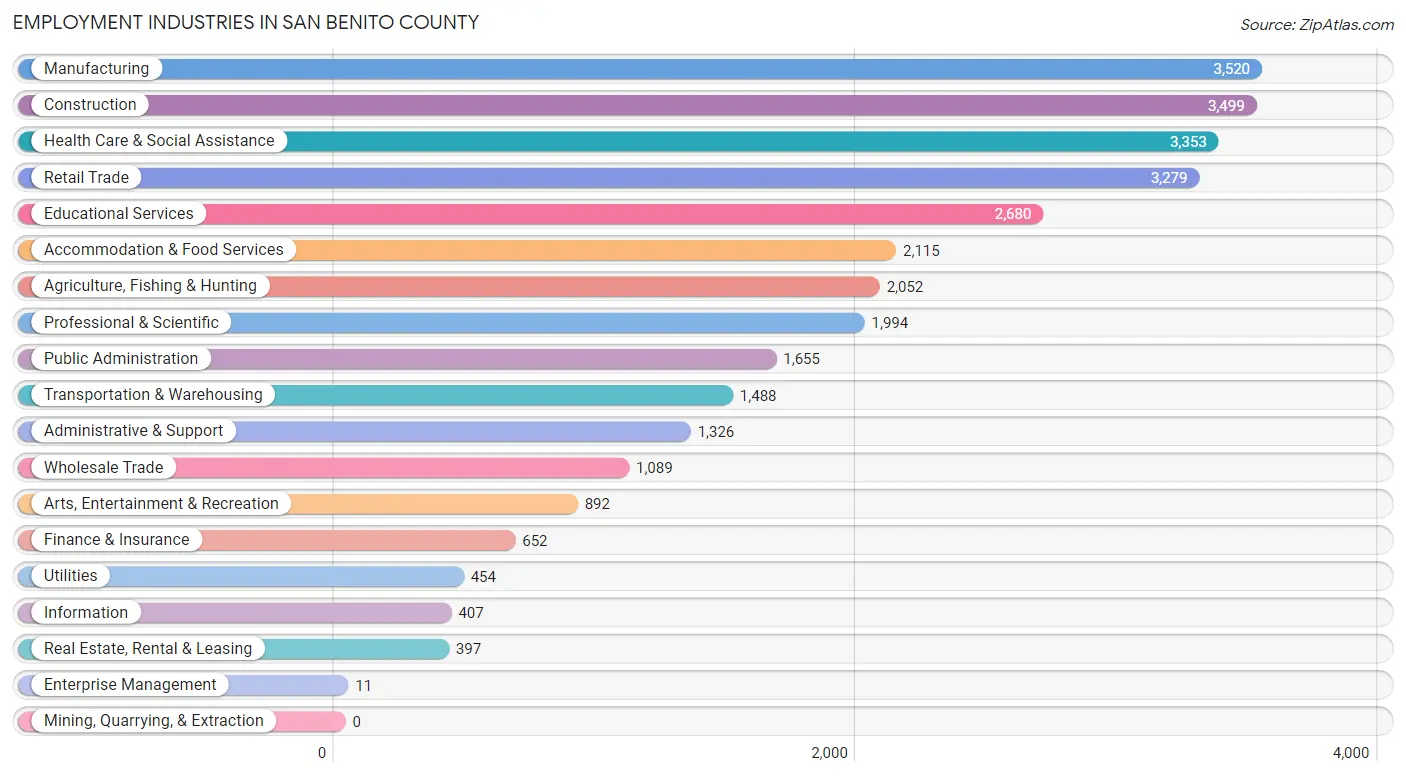
Employment Industries in San Benito County
The major employment industries in San Benito County include Manufacturing (3,520 | 11.0%), Construction (3,499 | 11.0%), Health Care & Social Assistance (3,353 | 10.5%), Retail Trade (3,279 | 10.3%), and Educational Services (2,680 | 8.4%).
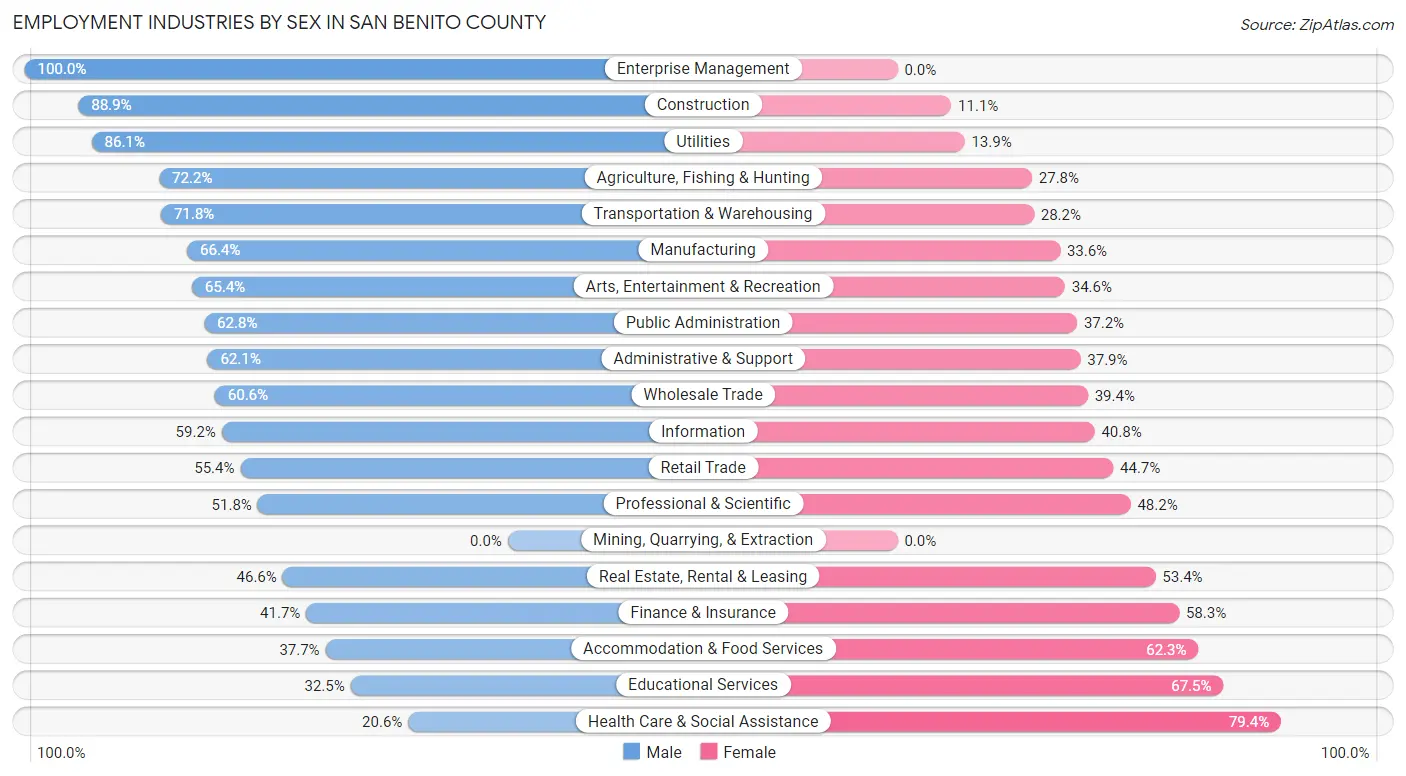
Employment Industries by Sex in San Benito County
The San Benito County industries that see more men than women are Enterprise Management (100.0%), Construction (88.9%), and Utilities (86.1%), whereas the industries that tend to have a higher number of women are Health Care & Social Assistance (79.4%), Educational Services (67.5%), and Accommodation & Food Services (62.3%).
| Industry | Male | Female |
| Agriculture, Fishing & Hunting | 1,481 (72.2%) | 571 (27.8%) |
| Mining, Quarrying, & Extraction | 0 (0.0%) | 0 (0.0%) |
| Construction | 3,110 (88.9%) | 389 (11.1%) |
| Manufacturing | 2,336 (66.4%) | 1,184 (33.6%) |
| Wholesale Trade | 660 (60.6%) | 429 (39.4%) |
| Retail Trade | 1,815 (55.3%) | 1,464 (44.7%) |
| Transportation & Warehousing | 1,068 (71.8%) | 420 (28.2%) |
| Utilities | 391 (86.1%) | 63 (13.9%) |
| Information | 241 (59.2%) | 166 (40.8%) |
| Finance & Insurance | 272 (41.7%) | 380 (58.3%) |
| Real Estate, Rental & Leasing | 185 (46.6%) | 212 (53.4%) |
| Professional & Scientific | 1,032 (51.8%) | 962 (48.2%) |
| Enterprise Management | 11 (100.0%) | 0 (0.0%) |
| Administrative & Support | 824 (62.1%) | 502 (37.9%) |
| Educational Services | 872 (32.5%) | 1,808 (67.5%) |
| Health Care & Social Assistance | 691 (20.6%) | 2,662 (79.4%) |
| Arts, Entertainment & Recreation | 583 (65.4%) | 309 (34.6%) |
| Accommodation & Food Services | 798 (37.7%) | 1,317 (62.3%) |
| Public Administration | 1,040 (62.8%) | 615 (37.2%) |
| Total | 17,825 (55.8%) | 14,103 (44.2%) |
Education in San Benito County
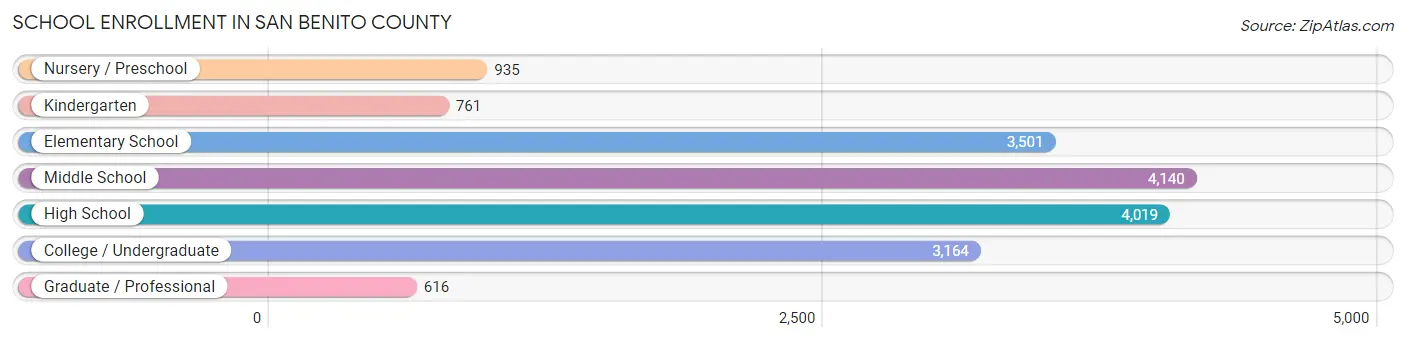
School Enrollment in San Benito County
The most common levels of schooling among the 17,136 students in San Benito County are middle school (4,140 | 24.2%), high school (4,019 | 23.4%), and elementary school (3,501 | 20.4%).
| School Level | # Students | % Students |
| Nursery / Preschool | 935 | 5.5% |
| Kindergarten | 761 | 4.4% |
| Elementary School | 3,501 | 20.4% |
| Middle School | 4,140 | 24.2% |
| High School | 4,019 | 23.4% |
| College / Undergraduate | 3,164 | 18.5% |
| Graduate / Professional | 616 | 3.6% |
| Total | 17,136 | 100.0% |
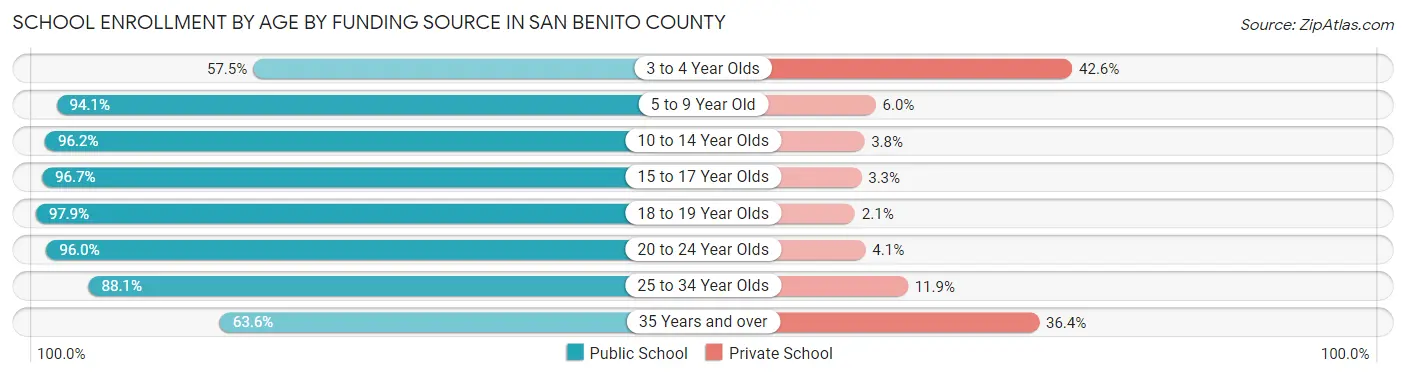
School Enrollment by Age by Funding Source in San Benito County
Out of a total of 17,136 students who are enrolled in schools in San Benito County, 1,268 (7.4%) attend a private institution, while the remaining 15,868 (92.6%) are enrolled in public schools. The age group of 3 to 4 year olds has the highest likelihood of being enrolled in private schools, with 280 (42.5% in the age bracket) enrolled. Conversely, the age group of 18 to 19 year olds has the lowest likelihood of being enrolled in a private school, with 937 (97.9% in the age bracket) attending a public institution.
| Age Bracket | Public School | Private School |
| 3 to 4 Year Olds | 378 (57.5%) | 280 (42.5%) |
| 5 to 9 Year Old | 3,998 (94.1%) | 253 (5.9%) |
| 10 to 14 Year Olds | 4,836 (96.2%) | 192 (3.8%) |
| 15 to 17 Year Olds | 2,797 (96.7%) | 95 (3.3%) |
| 18 to 19 Year Olds | 937 (97.9%) | 20 (2.1%) |
| 20 to 24 Year Olds | 1,563 (96.0%) | 66 (4.1%) |
| 25 to 34 Year Olds | 930 (88.1%) | 126 (11.9%) |
| 35 Years and over | 423 (63.6%) | 242 (36.4%) |
| Total | 15,868 (92.6%) | 1,268 (7.4%) |
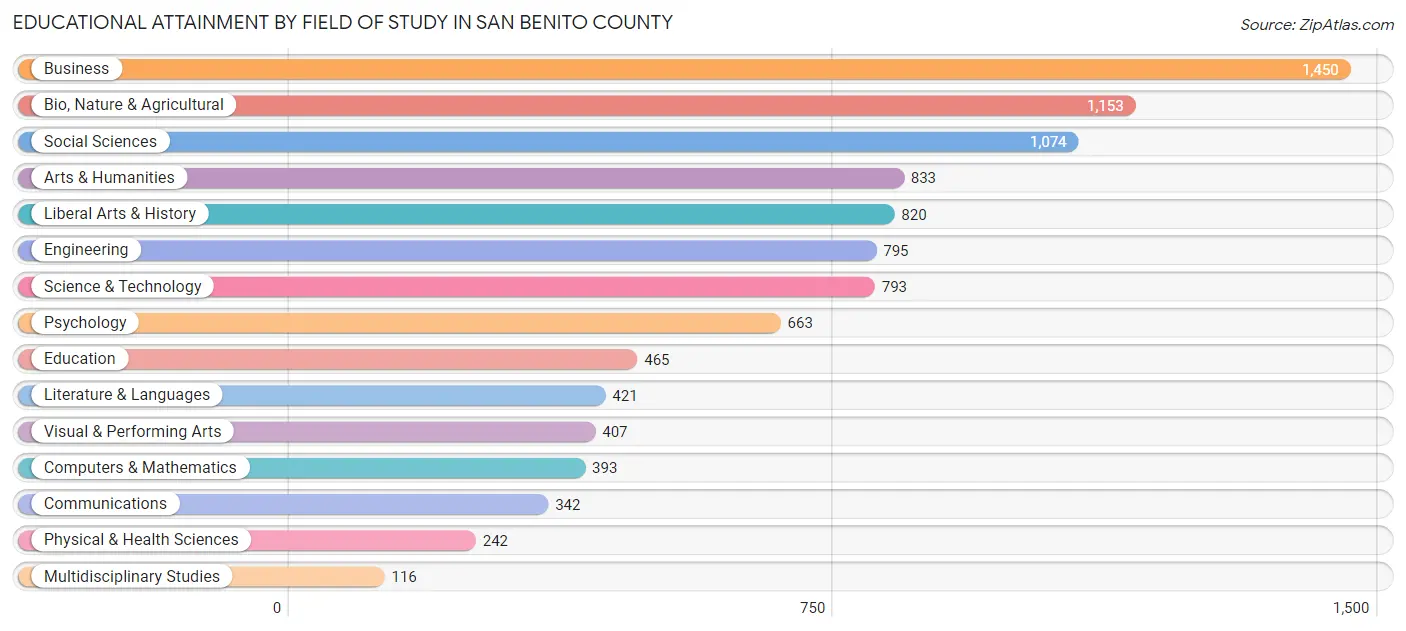
Educational Attainment by Field of Study in San Benito County
Business (1,450 | 14.5%), bio, nature & agricultural (1,153 | 11.6%), social sciences (1,074 | 10.8%), arts & humanities (833 | 8.4%), and liberal arts & history (820 | 8.2%) are the most common fields of study among 9,967 individuals in San Benito County who have obtained a bachelor's degree or higher.
| Field of Study | # Graduates | % Graduates |
| Computers & Mathematics | 393 | 3.9% |
| Bio, Nature & Agricultural | 1,153 | 11.6% |
| Physical & Health Sciences | 242 | 2.4% |
| Psychology | 663 | 6.7% |
| Social Sciences | 1,074 | 10.8% |
| Engineering | 795 | 8.0% |
| Multidisciplinary Studies | 116 | 1.2% |
| Science & Technology | 793 | 8.0% |
| Business | 1,450 | 14.5% |
| Education | 465 | 4.7% |
| Literature & Languages | 421 | 4.2% |
| Liberal Arts & History | 820 | 8.2% |
| Visual & Performing Arts | 407 | 4.1% |
| Communications | 342 | 3.4% |
| Arts & Humanities | 833 | 8.4% |
| Total | 9,967 | 100.0% |
Transportation & Commute in San Benito County
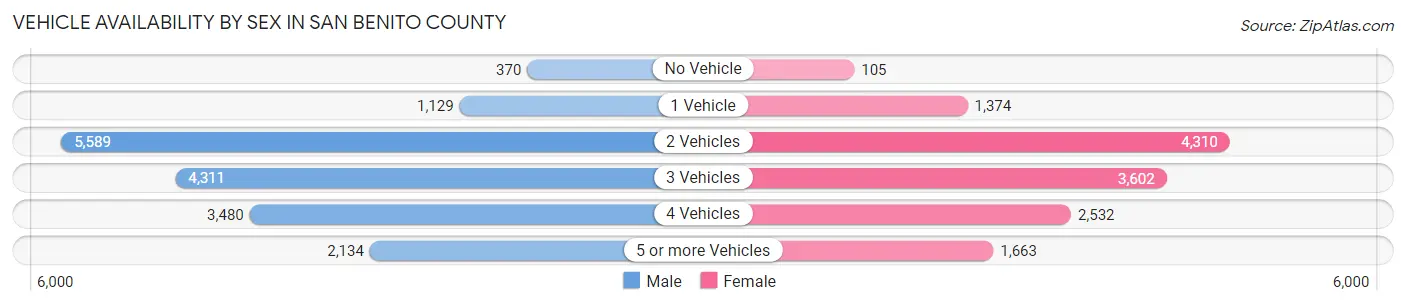
Vehicle Availability by Sex in San Benito County
The most prevalent vehicle ownership categories in San Benito County are males with 2 vehicles (5,589, accounting for 32.9%) and females with 2 vehicles (4,310, making up 41.1%).
| Vehicles Available | Male | Female |
| No Vehicle | 370 (2.2%) | 105 (0.8%) |
| 1 Vehicle | 1,129 (6.6%) | 1,374 (10.1%) |
| 2 Vehicles | 5,589 (32.9%) | 4,310 (31.7%) |
| 3 Vehicles | 4,311 (25.3%) | 3,602 (26.5%) |
| 4 Vehicles | 3,480 (20.4%) | 2,532 (18.6%) |
| 5 or more Vehicles | 2,134 (12.5%) | 1,663 (12.2%) |
| Total | 17,013 (100.0%) | 13,586 (100.0%) |
Commute Time in San Benito County
The most frequently occuring commute durations in San Benito County are 60 to 89 minutes (4,528 commuters, 16.2%), 5 to 9 minutes (3,690 commuters, 13.2%), and 10 to 14 minutes (3,481 commuters, 12.5%).
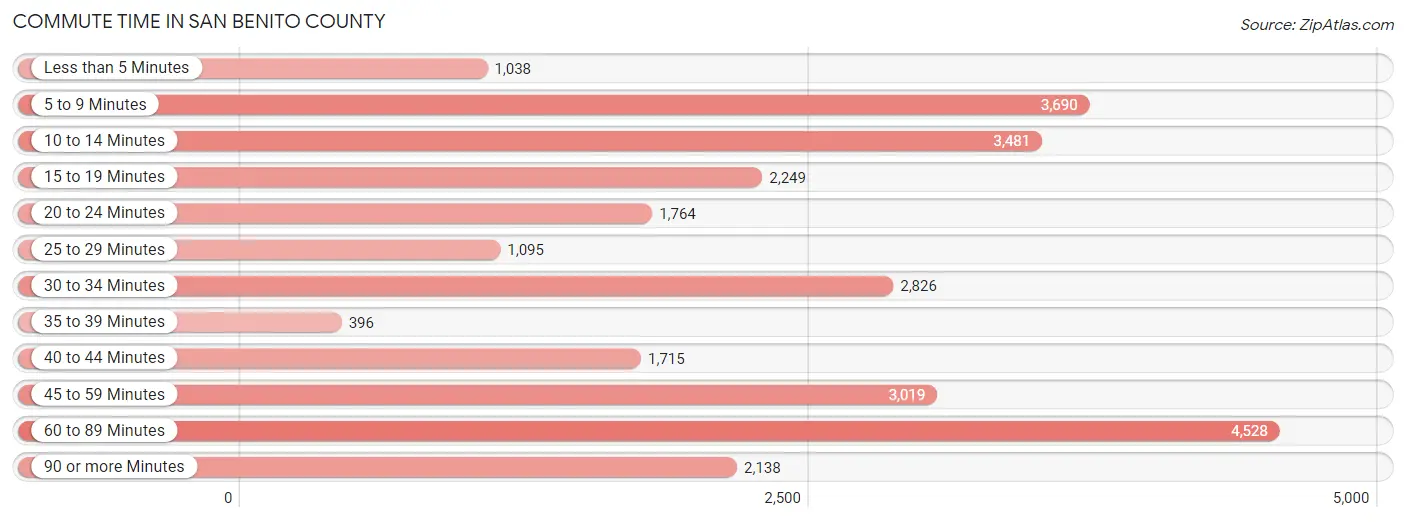
| Commute Time | # Commuters | % Commuters |
| Less than 5 Minutes | 1,038 | 3.7% |
| 5 to 9 Minutes | 3,690 | 13.2% |
| 10 to 14 Minutes | 3,481 | 12.5% |
| 15 to 19 Minutes | 2,249 | 8.1% |
| 20 to 24 Minutes | 1,764 | 6.3% |
| 25 to 29 Minutes | 1,095 | 3.9% |
| 30 to 34 Minutes | 2,826 | 10.1% |
| 35 to 39 Minutes | 396 | 1.4% |
| 40 to 44 Minutes | 1,715 | 6.1% |
| 45 to 59 Minutes | 3,019 | 10.8% |
| 60 to 89 Minutes | 4,528 | 16.2% |
| 90 or more Minutes | 2,138 | 7.6% |
Commute Time by Sex in San Benito County
The most common commute times in San Benito County are 60 to 89 minutes (3,040 commuters, 19.2%) for males and 5 to 9 minutes (1,981 commuters, 16.4%) for females.
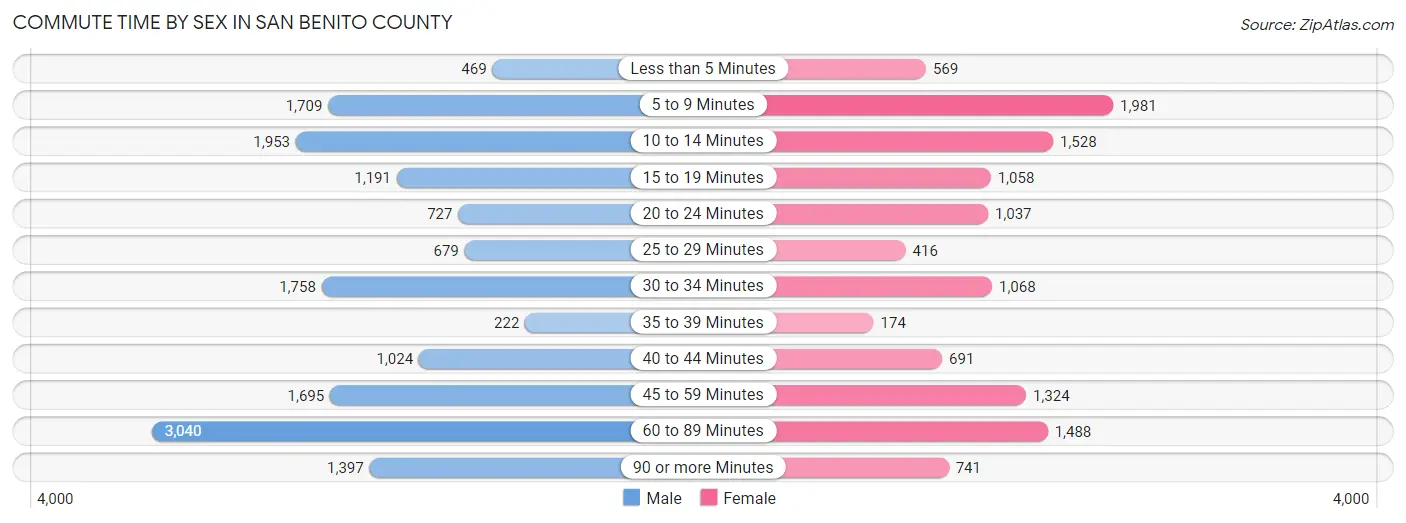
| Commute Time | Male | Female |
| Less than 5 Minutes | 469 (3.0%) | 569 (4.7%) |
| 5 to 9 Minutes | 1,709 (10.8%) | 1,981 (16.4%) |
| 10 to 14 Minutes | 1,953 (12.3%) | 1,528 (12.7%) |
| 15 to 19 Minutes | 1,191 (7.5%) | 1,058 (8.8%) |
| 20 to 24 Minutes | 727 (4.6%) | 1,037 (8.6%) |
| 25 to 29 Minutes | 679 (4.3%) | 416 (3.5%) |
| 30 to 34 Minutes | 1,758 (11.1%) | 1,068 (8.8%) |
| 35 to 39 Minutes | 222 (1.4%) | 174 (1.4%) |
| 40 to 44 Minutes | 1,024 (6.5%) | 691 (5.7%) |
| 45 to 59 Minutes | 1,695 (10.7%) | 1,324 (11.0%) |
| 60 to 89 Minutes | 3,040 (19.2%) | 1,488 (12.3%) |
| 90 or more Minutes | 1,397 (8.8%) | 741 (6.1%) |
Time of Departure to Work by Sex in San Benito County
The most frequent times of departure to work in San Benito County are 12:00 AM to 4:59 AM (2,456, 15.5%) for males and 7:00 AM to 7:29 AM (1,641, 13.6%) for females.
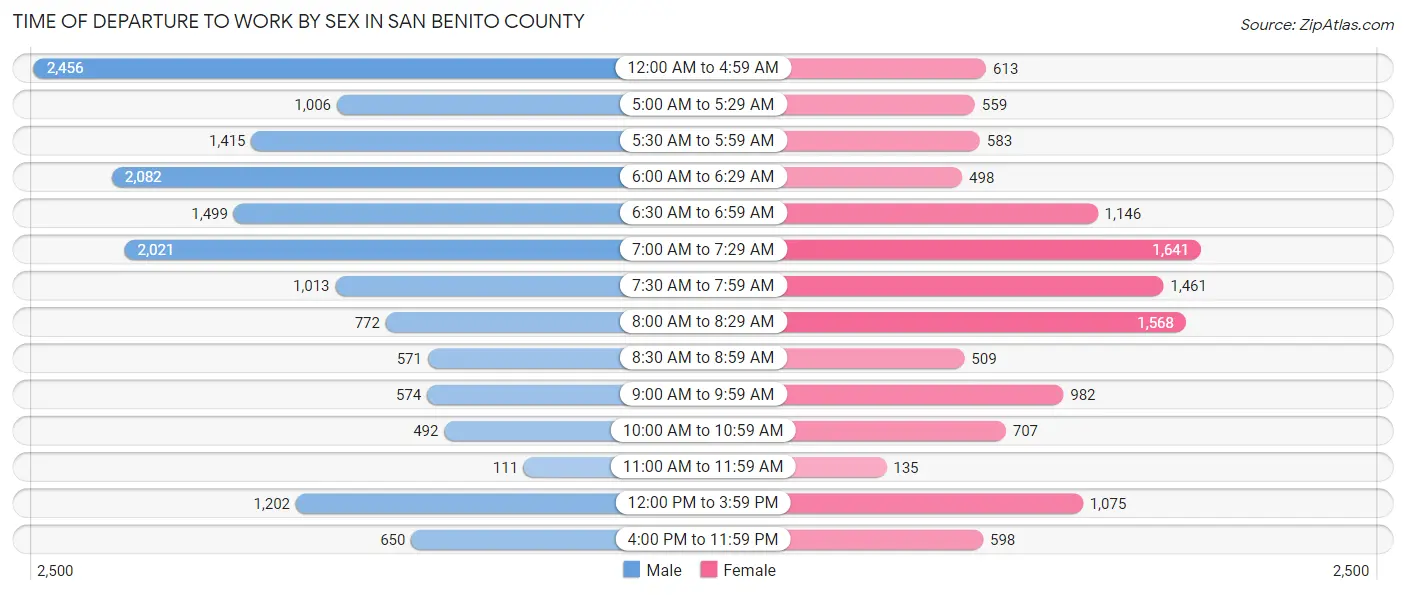
| Time of Departure | Male | Female |
| 12:00 AM to 4:59 AM | 2,456 (15.5%) | 613 (5.1%) |
| 5:00 AM to 5:29 AM | 1,006 (6.3%) | 559 (4.6%) |
| 5:30 AM to 5:59 AM | 1,415 (8.9%) | 583 (4.8%) |
| 6:00 AM to 6:29 AM | 2,082 (13.1%) | 498 (4.1%) |
| 6:30 AM to 6:59 AM | 1,499 (9.5%) | 1,146 (9.5%) |
| 7:00 AM to 7:29 AM | 2,021 (12.7%) | 1,641 (13.6%) |
| 7:30 AM to 7:59 AM | 1,013 (6.4%) | 1,461 (12.1%) |
| 8:00 AM to 8:29 AM | 772 (4.9%) | 1,568 (13.0%) |
| 8:30 AM to 8:59 AM | 571 (3.6%) | 509 (4.2%) |
| 9:00 AM to 9:59 AM | 574 (3.6%) | 982 (8.1%) |
| 10:00 AM to 10:59 AM | 492 (3.1%) | 707 (5.9%) |
| 11:00 AM to 11:59 AM | 111 (0.7%) | 135 (1.1%) |
| 12:00 PM to 3:59 PM | 1,202 (7.6%) | 1,075 (8.9%) |
| 4:00 PM to 11:59 PM | 650 (4.1%) | 598 (5.0%) |
| Total | 15,864 (100.0%) | 12,075 (100.0%) |
Housing Occupancy in San Benito County
Occupancy by Ownership in San Benito County
Of the total 19,852 dwellings in San Benito County, owner-occupied units account for 13,087 (65.9%), while renter-occupied units make up 6,765 (34.1%).
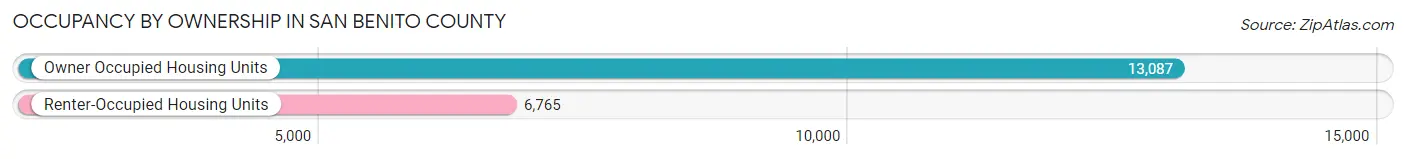
| Occupancy | # Housing Units | % Housing Units |
| Owner Occupied Housing Units | 13,087 | 65.9% |
| Renter-Occupied Housing Units | 6,765 | 34.1% |
| Total Occupied Housing Units | 19,852 | 100.0% |
Occupancy by Household Size in San Benito County
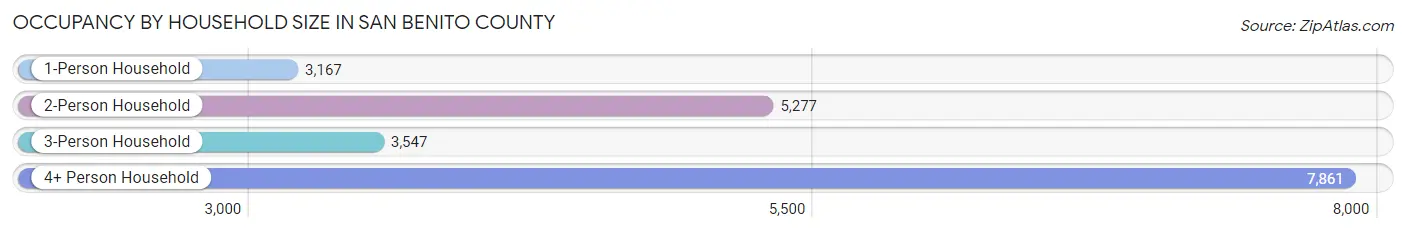
| Household Size | # Housing Units | % Housing Units |
| 1-Person Household | 3,167 | 16.0% |
| 2-Person Household | 5,277 | 26.6% |
| 3-Person Household | 3,547 | 17.9% |
| 4+ Person Household | 7,861 | 39.6% |
| Total Housing Units | 19,852 | 100.0% |
Occupancy by Ownership by Household Size in San Benito County
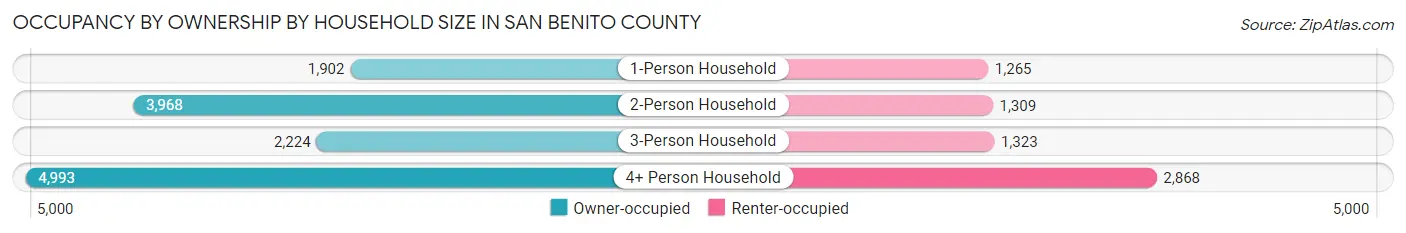
| Household Size | Owner-occupied | Renter-occupied |
| 1-Person Household | 1,902 (60.1%) | 1,265 (39.9%) |
| 2-Person Household | 3,968 (75.2%) | 1,309 (24.8%) |
| 3-Person Household | 2,224 (62.7%) | 1,323 (37.3%) |
| 4+ Person Household | 4,993 (63.5%) | 2,868 (36.5%) |
| Total Housing Units | 13,087 (65.9%) | 6,765 (34.1%) |
Occupancy by Educational Attainment in San Benito County
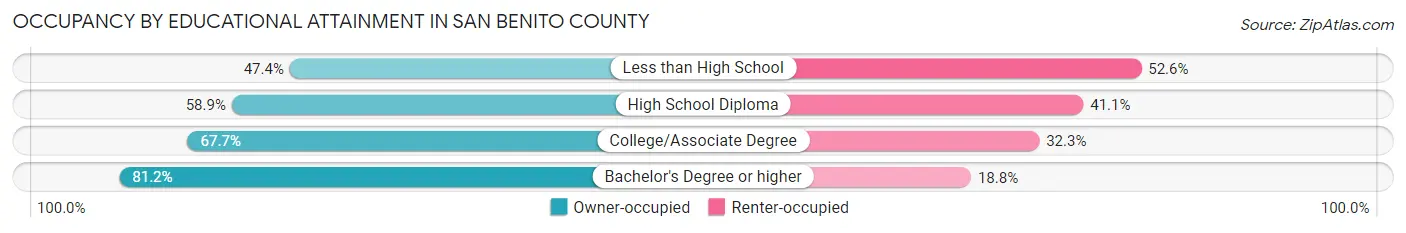
| Household Size | Owner-occupied | Renter-occupied |
| Less than High School | 1,262 (47.4%) | 1,399 (52.6%) |
| High School Diploma | 2,936 (58.9%) | 2,046 (41.1%) |
| College/Associate Degree | 5,127 (67.7%) | 2,449 (32.3%) |
| Bachelor's Degree or higher | 3,762 (81.2%) | 871 (18.8%) |
Occupancy by Age of Householder in San Benito County
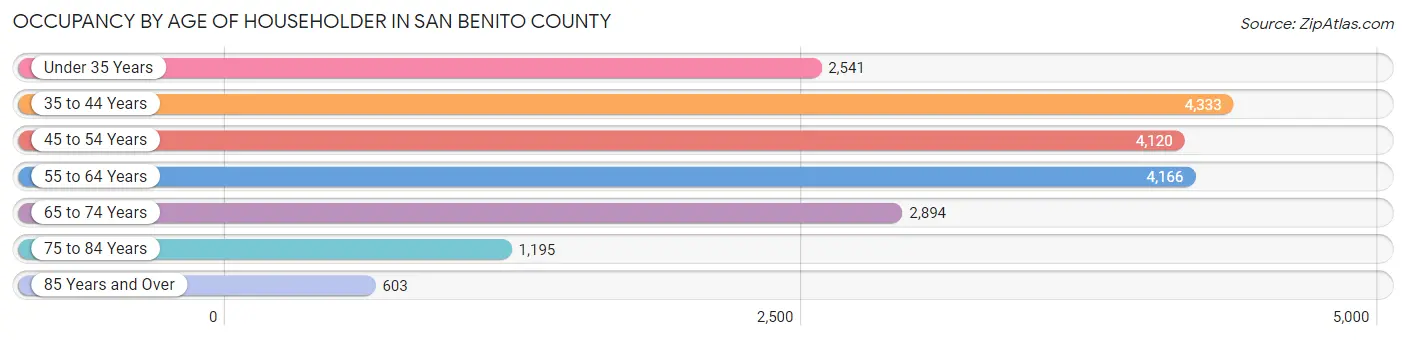
| Age Bracket | # Households | % Households |
| Under 35 Years | 2,541 | 12.8% |
| 35 to 44 Years | 4,333 | 21.8% |
| 45 to 54 Years | 4,120 | 20.7% |
| 55 to 64 Years | 4,166 | 21.0% |
| 65 to 74 Years | 2,894 | 14.6% |
| 75 to 84 Years | 1,195 | 6.0% |
| 85 Years and Over | 603 | 3.0% |
| Total | 19,852 | 100.0% |
Housing Finances in San Benito County
Median Income by Occupancy in San Benito County
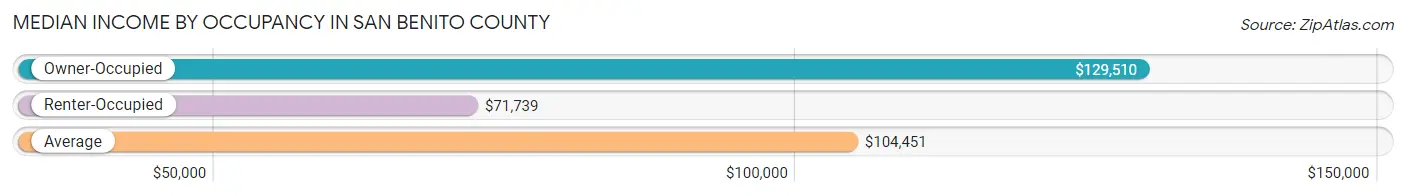
| Occupancy Type | # Households | Median Income |
| Owner-Occupied | 13,087 (65.9%) | $129,510 |
| Renter-Occupied | 6,765 (34.1%) | $71,739 |
| Average | 19,852 (100.0%) | $104,451 |
Occupancy by Householder Income Bracket in San Benito County
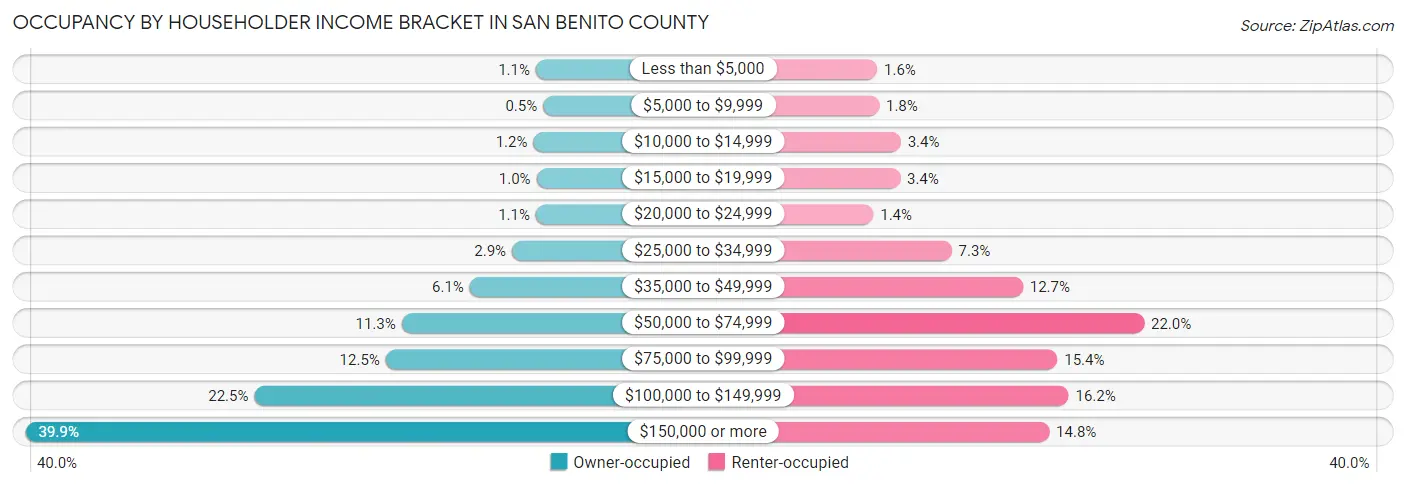
| Income Bracket | Owner-occupied | Renter-occupied |
| Less than $5,000 | 138 (1.1%) | 111 (1.6%) |
| $5,000 to $9,999 | 66 (0.5%) | 121 (1.8%) |
| $10,000 to $14,999 | 162 (1.2%) | 233 (3.4%) |
| $15,000 to $19,999 | 131 (1.0%) | 229 (3.4%) |
| $20,000 to $24,999 | 138 (1.1%) | 91 (1.3%) |
| $25,000 to $34,999 | 375 (2.9%) | 495 (7.3%) |
| $35,000 to $49,999 | 797 (6.1%) | 862 (12.7%) |
| $50,000 to $74,999 | 1,476 (11.3%) | 1,487 (22.0%) |
| $75,000 to $99,999 | 1,634 (12.5%) | 1,040 (15.4%) |
| $100,000 to $149,999 | 2,945 (22.5%) | 1,098 (16.2%) |
| $150,000 or more | 5,225 (39.9%) | 998 (14.7%) |
| Total | 13,087 (100.0%) | 6,765 (100.0%) |
Monthly Housing Cost Tiers in San Benito County
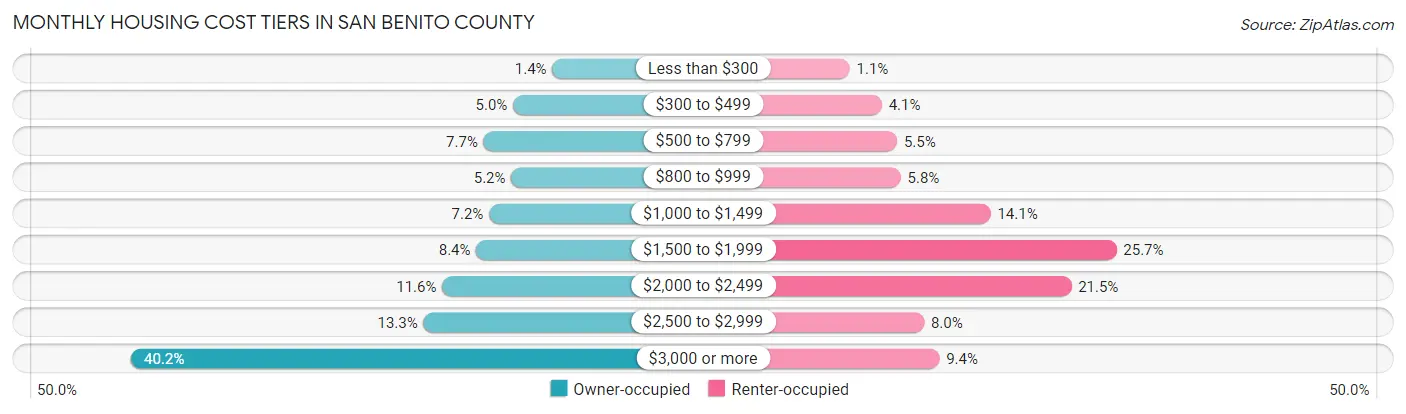
| Monthly Cost | Owner-occupied | Renter-occupied |
| Less than $300 | 184 (1.4%) | 76 (1.1%) |
| $300 to $499 | 657 (5.0%) | 276 (4.1%) |
| $500 to $799 | 1,012 (7.7%) | 371 (5.5%) |
| $800 to $999 | 679 (5.2%) | 394 (5.8%) |
| $1,000 to $1,499 | 946 (7.2%) | 953 (14.1%) |
| $1,500 to $1,999 | 1,101 (8.4%) | 1,737 (25.7%) |
| $2,000 to $2,499 | 1,511 (11.6%) | 1,456 (21.5%) |
| $2,500 to $2,999 | 1,736 (13.3%) | 539 (8.0%) |
| $3,000 or more | 5,261 (40.2%) | 634 (9.4%) |
| Total | 13,087 (100.0%) | 6,765 (100.0%) |
Physical Housing Characteristics in San Benito County
Housing Structures in San Benito County
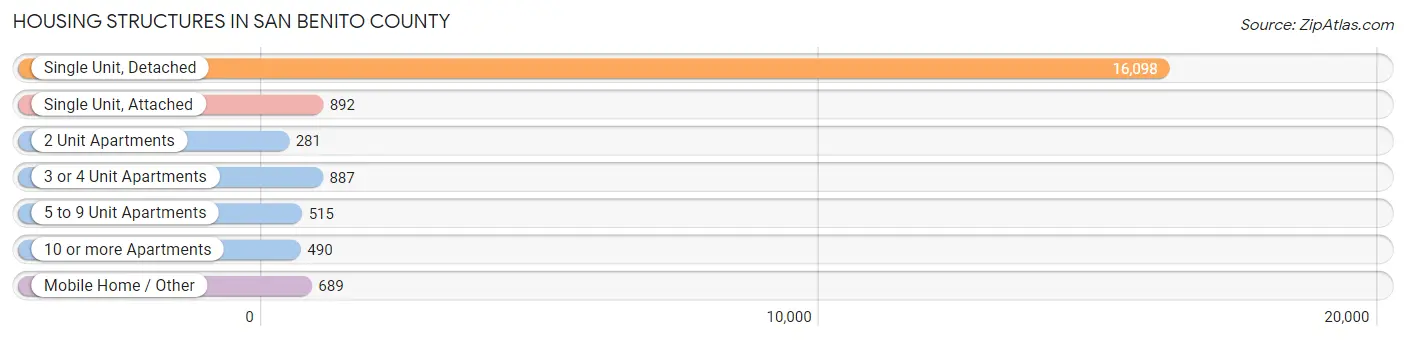
| Structure Type | # Housing Units | % Housing Units |
| Single Unit, Detached | 16,098 | 81.1% |
| Single Unit, Attached | 892 | 4.5% |
| 2 Unit Apartments | 281 | 1.4% |
| 3 or 4 Unit Apartments | 887 | 4.5% |
| 5 to 9 Unit Apartments | 515 | 2.6% |
| 10 or more Apartments | 490 | 2.5% |
| Mobile Home / Other | 689 | 3.5% |
| Total | 19,852 | 100.0% |
Housing Structures by Occupancy in San Benito County
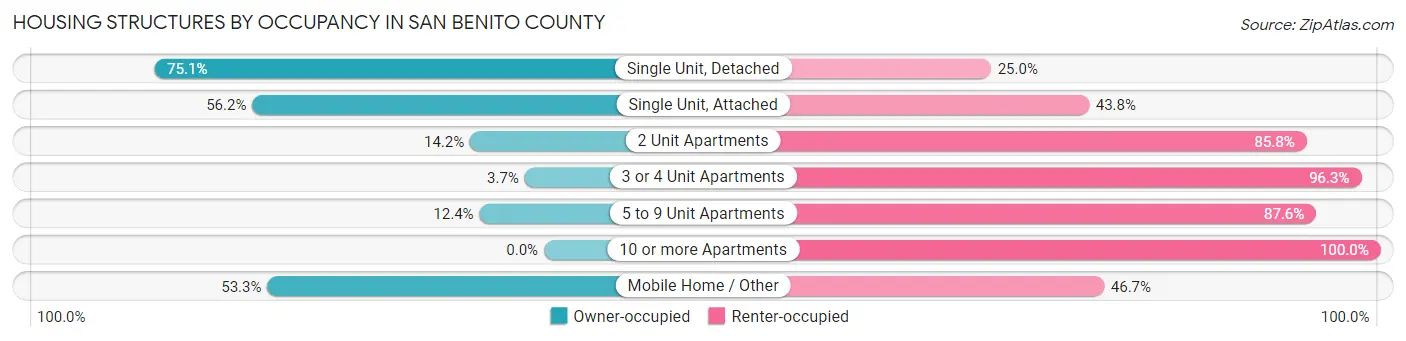
| Structure Type | Owner-occupied | Renter-occupied |
| Single Unit, Detached | 12,082 (75.0%) | 4,016 (24.9%) |
| Single Unit, Attached | 501 (56.2%) | 391 (43.8%) |
| 2 Unit Apartments | 40 (14.2%) | 241 (85.8%) |
| 3 or 4 Unit Apartments | 33 (3.7%) | 854 (96.3%) |
| 5 to 9 Unit Apartments | 64 (12.4%) | 451 (87.6%) |
| 10 or more Apartments | 0 (0.0%) | 490 (100.0%) |
| Mobile Home / Other | 367 (53.3%) | 322 (46.7%) |
| Total | 13,087 (65.9%) | 6,765 (34.1%) |
Housing Structures by Number of Rooms in San Benito County
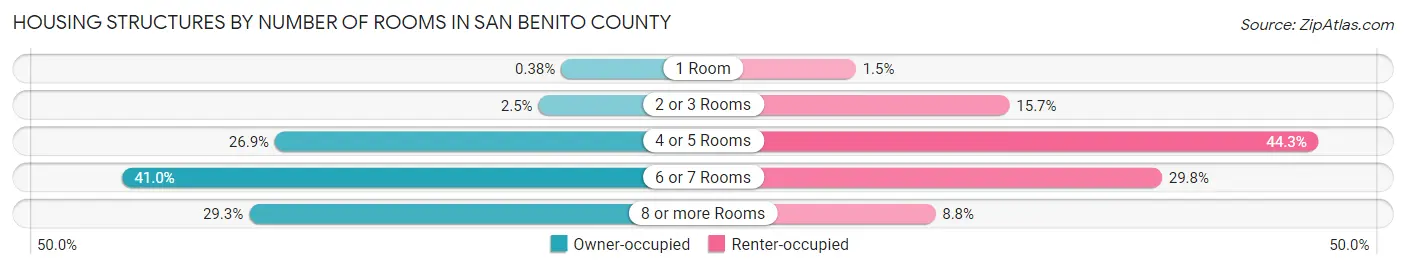
| Number of Rooms | Owner-occupied | Renter-occupied |
| 1 Room | 50 (0.4%) | 99 (1.5%) |
| 2 or 3 Rooms | 324 (2.5%) | 1,060 (15.7%) |
| 4 or 5 Rooms | 3,514 (26.9%) | 2,995 (44.3%) |
| 6 or 7 Rooms | 5,371 (41.0%) | 2,014 (29.8%) |
| 8 or more Rooms | 3,828 (29.2%) | 597 (8.8%) |
| Total | 13,087 (100.0%) | 6,765 (100.0%) |
Housing Structure by Heating Type in San Benito County
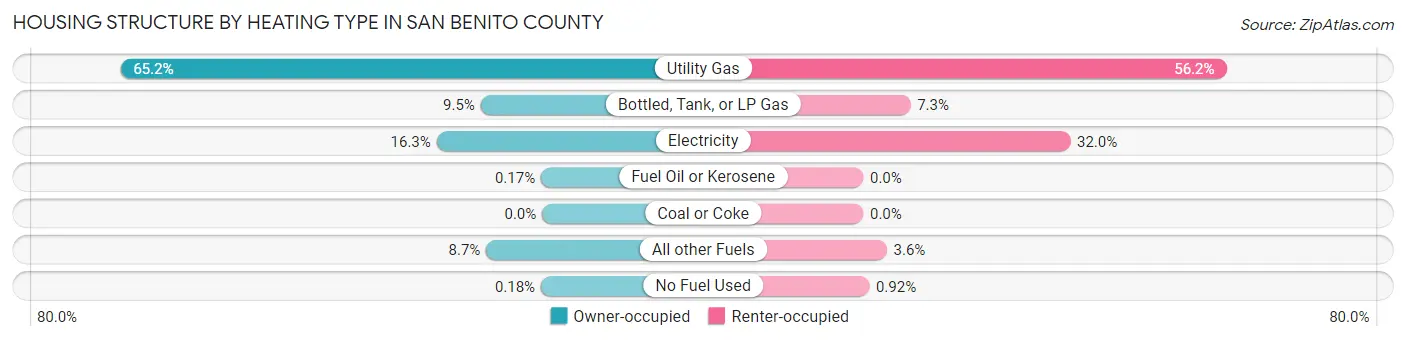
| Heating Type | Owner-occupied | Renter-occupied |
| Utility Gas | 8,534 (65.2%) | 3,799 (56.2%) |
| Bottled, Tank, or LP Gas | 1,242 (9.5%) | 493 (7.3%) |
| Electricity | 2,134 (16.3%) | 2,165 (32.0%) |
| Fuel Oil or Kerosene | 22 (0.2%) | 0 (0.0%) |
| Coal or Coke | 0 (0.0%) | 0 (0.0%) |
| All other Fuels | 1,132 (8.6%) | 246 (3.6%) |
| No Fuel Used | 23 (0.2%) | 62 (0.9%) |
| Total | 13,087 (100.0%) | 6,765 (100.0%) |
Household Vehicle Usage in San Benito County
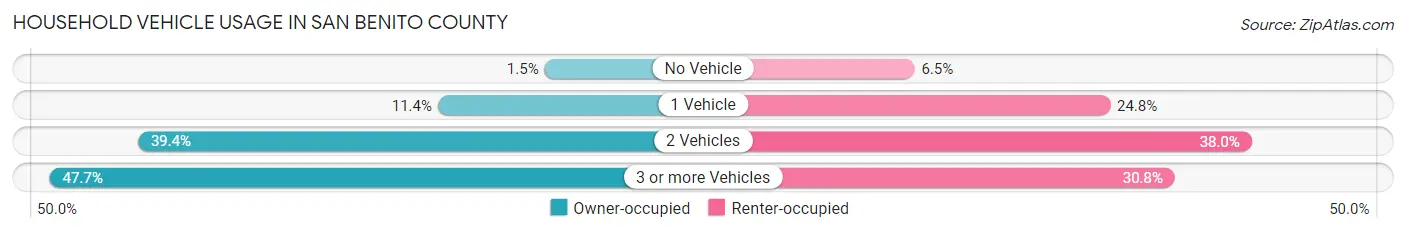
| Vehicles per Household | Owner-occupied | Renter-occupied |
| No Vehicle | 192 (1.5%) | 439 (6.5%) |
| 1 Vehicle | 1,496 (11.4%) | 1,674 (24.7%) |
| 2 Vehicles | 5,161 (39.4%) | 2,569 (38.0%) |
| 3 or more Vehicles | 6,238 (47.7%) | 2,083 (30.8%) |
| Total | 13,087 (100.0%) | 6,765 (100.0%) |
Real Estate & Mortgages in San Benito County
Real Estate and Mortgage Overview in San Benito County
| Characteristic | Without Mortgage | With Mortgage |
| Housing Units | 3,331 | 9,756 |
| Median Property Value | $678,100 | $709,900 |
| Median Household Income | $82,736 | $4,355 |
| Monthly Housing Costs | $802 | $5,250 |
| Real Estate Taxes | $3,914 | $58 |
Property Value by Mortgage Status in San Benito County
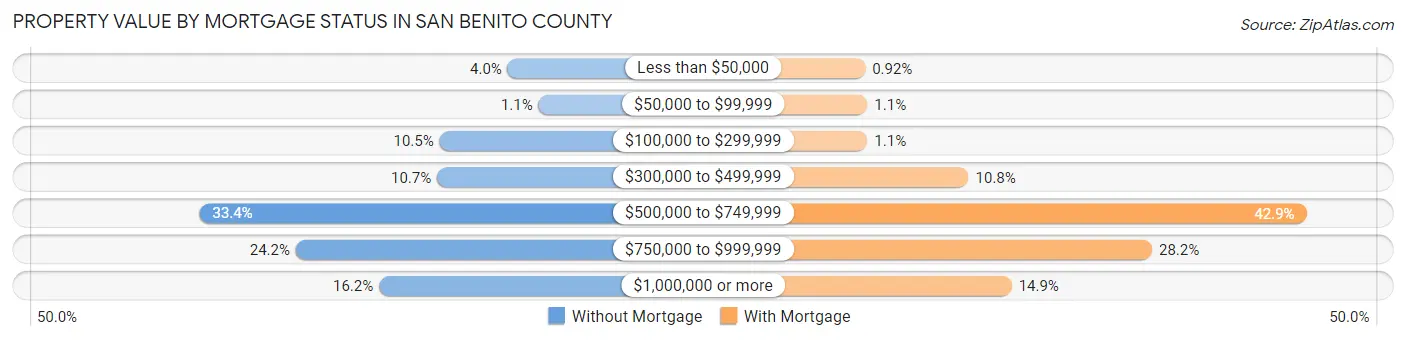
| Property Value | Without Mortgage | With Mortgage |
| Less than $50,000 | 133 (4.0%) | 90 (0.9%) |
| $50,000 to $99,999 | 35 (1.1%) | 110 (1.1%) |
| $100,000 to $299,999 | 349 (10.5%) | 110 (1.1%) |
| $300,000 to $499,999 | 357 (10.7%) | 1,051 (10.8%) |
| $500,000 to $749,999 | 1,111 (33.4%) | 4,189 (42.9%) |
| $750,000 to $999,999 | 805 (24.2%) | 2,755 (28.2%) |
| $1,000,000 or more | 541 (16.2%) | 1,451 (14.9%) |
| Total | 3,331 (100.0%) | 9,756 (100.0%) |
Household Income by Mortgage Status in San Benito County
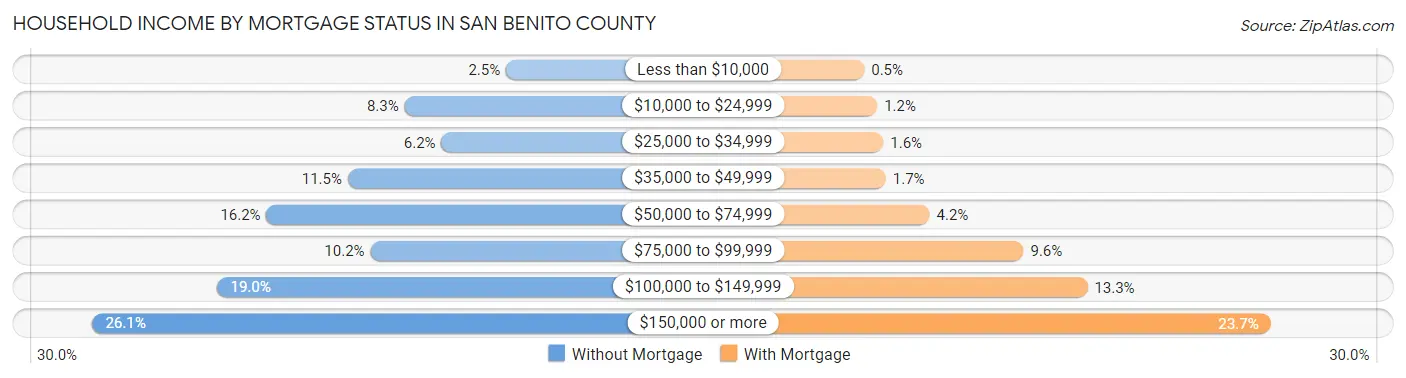
| Household Income | Without Mortgage | With Mortgage |
| Less than $10,000 | 83 (2.5%) | 49 (0.5%) |
| $10,000 to $24,999 | 276 (8.3%) | 121 (1.2%) |
| $25,000 to $34,999 | 206 (6.2%) | 155 (1.6%) |
| $35,000 to $49,999 | 384 (11.5%) | 169 (1.7%) |
| $50,000 to $74,999 | 539 (16.2%) | 413 (4.2%) |
| $75,000 to $99,999 | 341 (10.2%) | 937 (9.6%) |
| $100,000 to $149,999 | 632 (19.0%) | 1,293 (13.3%) |
| $150,000 or more | 870 (26.1%) | 2,313 (23.7%) |
| Total | 3,331 (100.0%) | 9,756 (100.0%) |
Property Value to Household Income Ratio in San Benito County
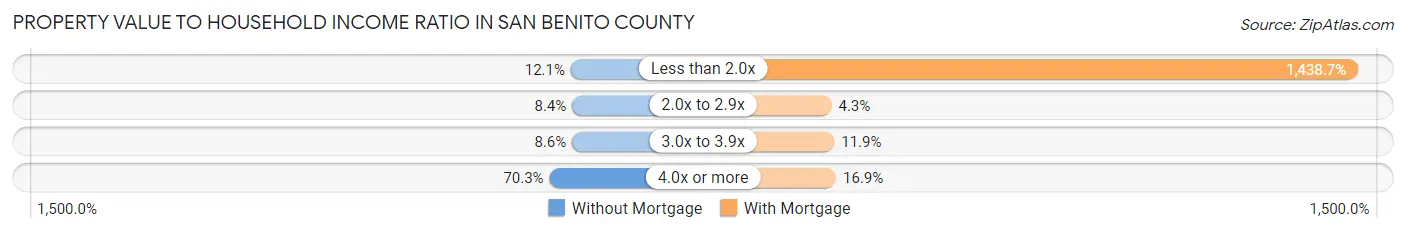
| Value-to-Income Ratio | Without Mortgage | With Mortgage |
| Less than 2.0x | 403 (12.1%) | 140,363 (1,438.7%) |
| 2.0x to 2.9x | 281 (8.4%) | 420 (4.3%) |
| 3.0x to 3.9x | 287 (8.6%) | 1,156 (11.8%) |
| 4.0x or more | 2,341 (70.3%) | 1,648 (16.9%) |
| Total | 3,331 (100.0%) | 9,756 (100.0%) |
Real Estate Taxes by Mortgage Status in San Benito County
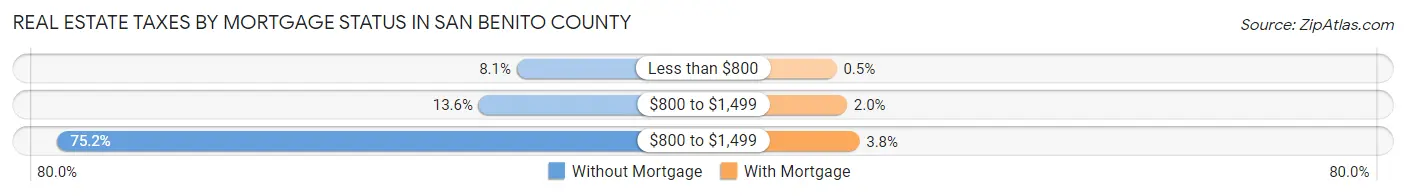
| Property Taxes | Without Mortgage | With Mortgage |
| Less than $800 | 269 (8.1%) | 49 (0.5%) |
| $800 to $1,499 | 454 (13.6%) | 197 (2.0%) |
| $800 to $1,499 | 2,505 (75.2%) | 374 (3.8%) |
| Total | 3,331 (100.0%) | 9,756 (100.0%) |
Health & Disability in San Benito County
Health Insurance Coverage by Age in San Benito County
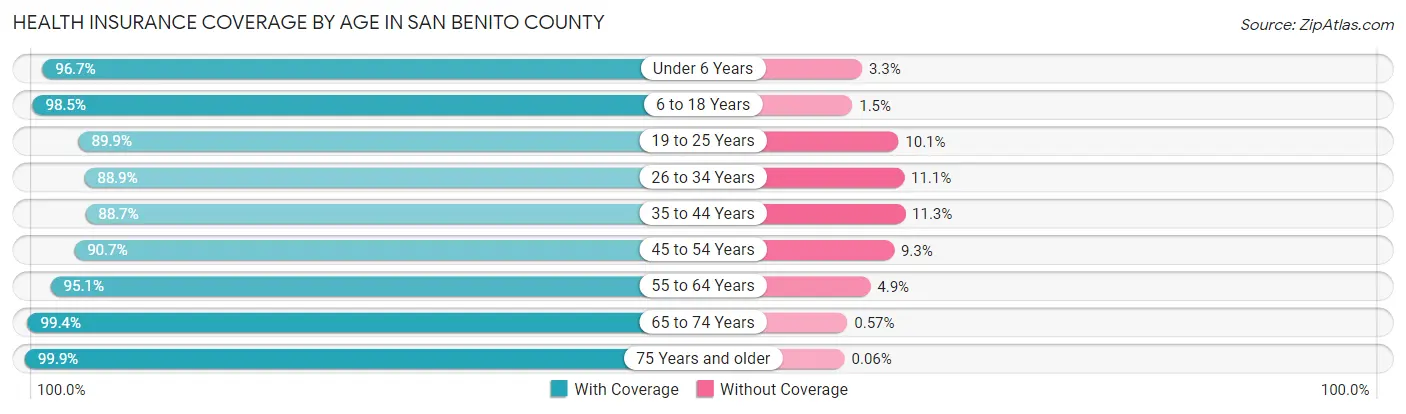
| Age Bracket | With Coverage | Without Coverage |
| Under 6 Years | 4,712 (96.7%) | 161 (3.3%) |
| 6 to 18 Years | 12,241 (98.5%) | 185 (1.5%) |
| 19 to 25 Years | 5,462 (89.9%) | 612 (10.1%) |
| 26 to 34 Years | 7,118 (88.9%) | 892 (11.1%) |
| 35 to 44 Years | 7,914 (88.7%) | 1,012 (11.3%) |
| 45 to 54 Years | 7,397 (90.7%) | 755 (9.3%) |
| 55 to 64 Years | 7,334 (95.1%) | 375 (4.9%) |
| 65 to 74 Years | 5,211 (99.4%) | 30 (0.6%) |
| 75 Years and older | 3,185 (99.9%) | 2 (0.1%) |
| Total | 60,574 (93.8%) | 4,024 (6.2%) |
Health Insurance Coverage by Citizenship Status in San Benito County
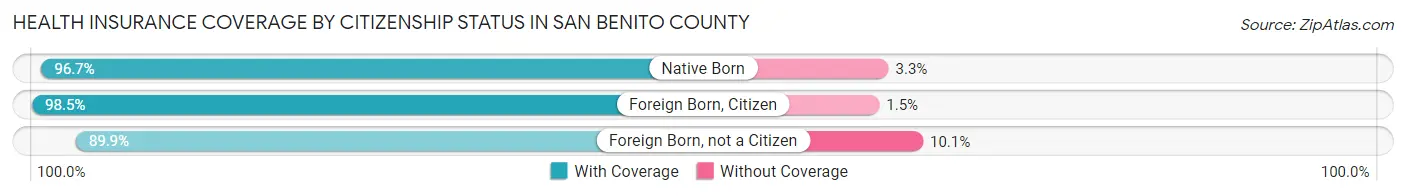
| Citizenship Status | With Coverage | Without Coverage |
| Native Born | 4,712 (96.7%) | 161 (3.3%) |
| Foreign Born, Citizen | 12,241 (98.5%) | 185 (1.5%) |
| Foreign Born, not a Citizen | 5,462 (89.9%) | 612 (10.1%) |
Health Insurance Coverage by Household Income in San Benito County
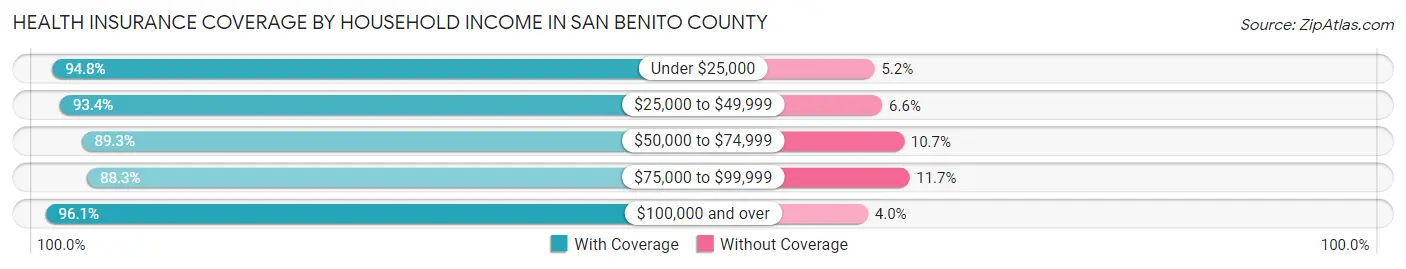
| Household Income | With Coverage | Without Coverage |
| Under $25,000 | 2,601 (94.8%) | 142 (5.2%) |
| $25,000 to $49,999 | 6,120 (93.4%) | 434 (6.6%) |
| $50,000 to $74,999 | 7,663 (89.3%) | 916 (10.7%) |
| $75,000 to $99,999 | 7,539 (88.3%) | 1,000 (11.7%) |
| $100,000 and over | 36,442 (96.1%) | 1,497 (4.0%) |
Public vs Private Health Insurance Coverage by Age in San Benito County
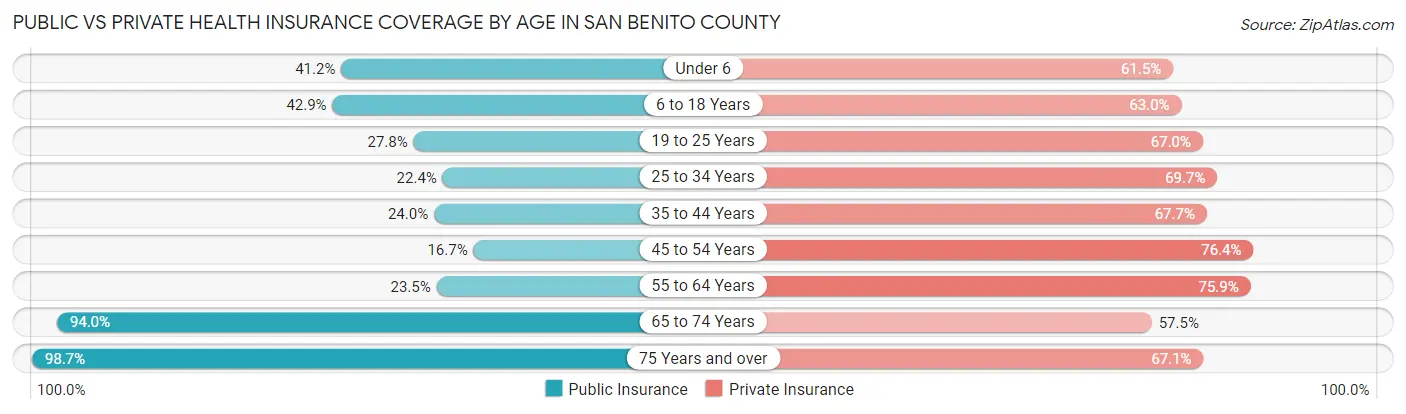
| Age Bracket | Public Insurance | Private Insurance |
| Under 6 | 2,009 (41.2%) | 2,997 (61.5%) |
| 6 to 18 Years | 5,326 (42.9%) | 7,833 (63.0%) |
| 19 to 25 Years | 1,689 (27.8%) | 4,070 (67.0%) |
| 25 to 34 Years | 1,794 (22.4%) | 5,581 (69.7%) |
| 35 to 44 Years | 2,143 (24.0%) | 6,046 (67.7%) |
| 45 to 54 Years | 1,360 (16.7%) | 6,227 (76.4%) |
| 55 to 64 Years | 1,815 (23.5%) | 5,848 (75.9%) |
| 65 to 74 Years | 4,927 (94.0%) | 3,015 (57.5%) |
| 75 Years and over | 3,144 (98.7%) | 2,139 (67.1%) |
| Total | 24,207 (37.5%) | 43,756 (67.7%) |
Disability Status by Sex by Age in San Benito County
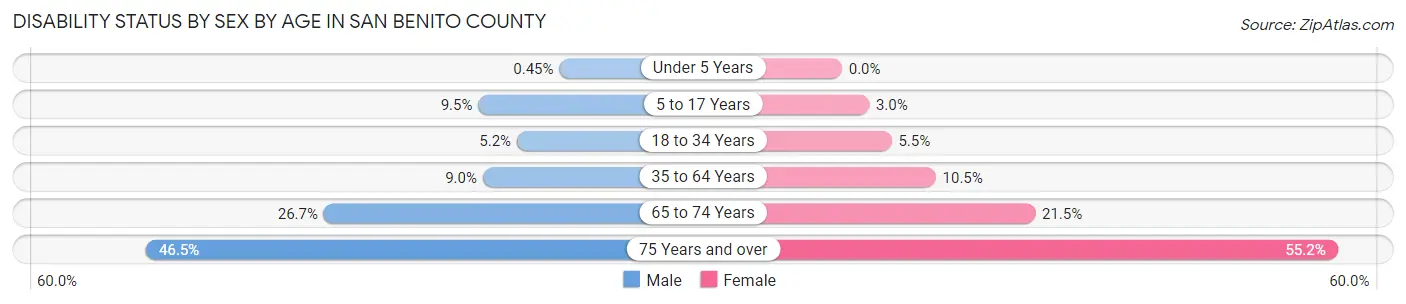
| Age Bracket | Male | Female |
| Under 5 Years | 9 (0.4%) | 0 (0.0%) |
| 5 to 17 Years | 601 (9.5%) | 184 (3.0%) |
| 18 to 34 Years | 400 (5.2%) | 397 (5.5%) |
| 35 to 64 Years | 1,141 (9.0%) | 1,260 (10.4%) |
| 65 to 74 Years | 698 (26.7%) | 565 (21.5%) |
| 75 Years and over | 614 (46.5%) | 1,030 (55.2%) |
Disability Class by Sex by Age in San Benito County
Disability Class: Hearing Difficulty
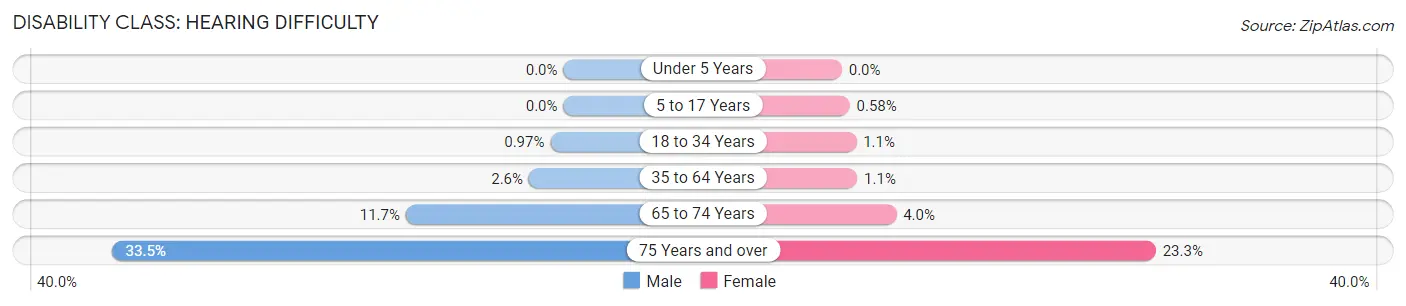
| Age Bracket | Male | Female |
| Under 5 Years | 0 (0.0%) | 0 (0.0%) |
| 5 to 17 Years | 0 (0.0%) | 35 (0.6%) |
| 18 to 34 Years | 75 (1.0%) | 77 (1.1%) |
| 35 to 64 Years | 326 (2.6%) | 137 (1.1%) |
| 65 to 74 Years | 306 (11.7%) | 106 (4.0%) |
| 75 Years and over | 442 (33.5%) | 435 (23.3%) |
Disability Class: Vision Difficulty
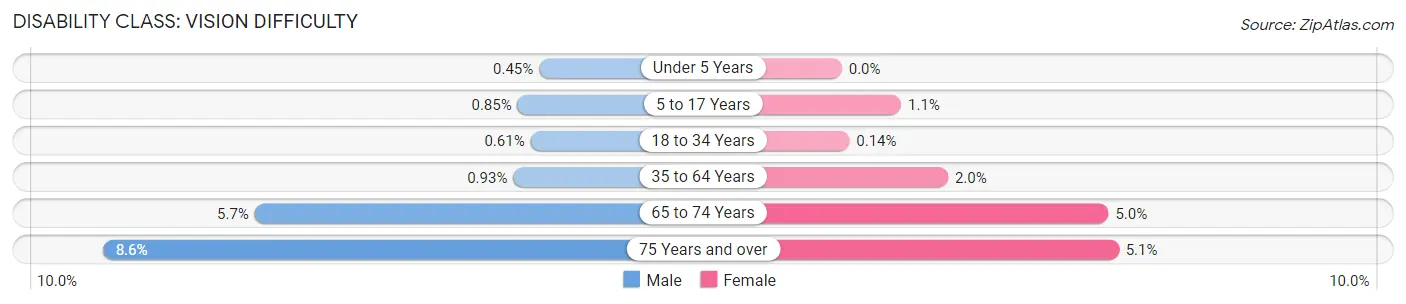
| Age Bracket | Male | Female |
| Under 5 Years | 9 (0.4%) | 0 (0.0%) |
| 5 to 17 Years | 54 (0.9%) | 67 (1.1%) |
| 18 to 34 Years | 47 (0.6%) | 10 (0.1%) |
| 35 to 64 Years | 118 (0.9%) | 238 (2.0%) |
| 65 to 74 Years | 150 (5.7%) | 130 (5.0%) |
| 75 Years and over | 113 (8.6%) | 96 (5.1%) |
Disability Class: Cognitive Difficulty
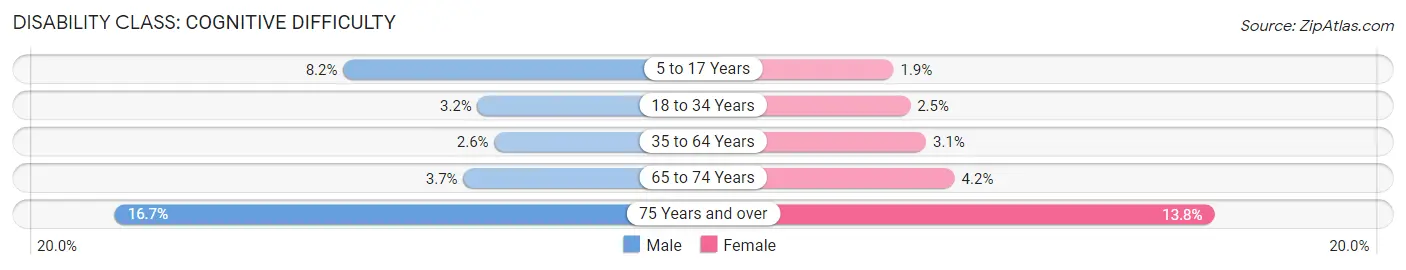
| Age Bracket | Male | Female |
| 5 to 17 Years | 518 (8.2%) | 117 (1.9%) |
| 18 to 34 Years | 246 (3.2%) | 182 (2.5%) |
| 35 to 64 Years | 326 (2.6%) | 378 (3.1%) |
| 65 to 74 Years | 97 (3.7%) | 110 (4.2%) |
| 75 Years and over | 220 (16.7%) | 258 (13.8%) |
Disability Class: Ambulatory Difficulty
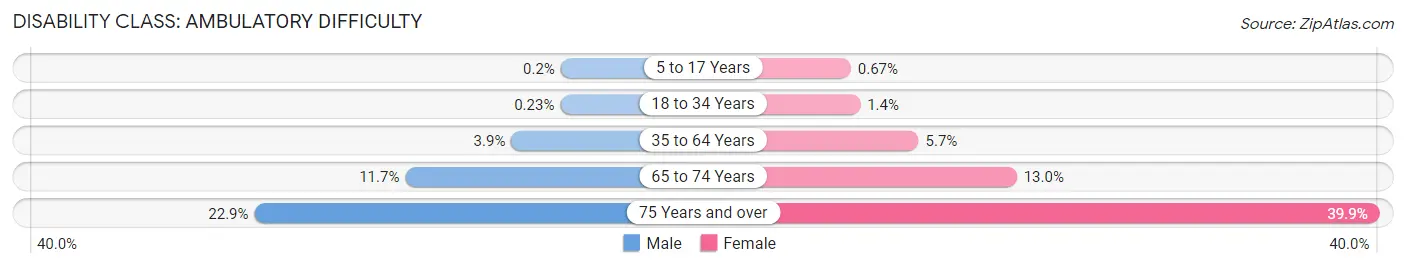
| Age Bracket | Male | Female |
| 5 to 17 Years | 13 (0.2%) | 41 (0.7%) |
| 18 to 34 Years | 18 (0.2%) | 98 (1.4%) |
| 35 to 64 Years | 493 (3.9%) | 687 (5.7%) |
| 65 to 74 Years | 307 (11.7%) | 341 (13.0%) |
| 75 Years and over | 303 (22.9%) | 745 (39.9%) |
Disability Class: Self-Care Difficulty
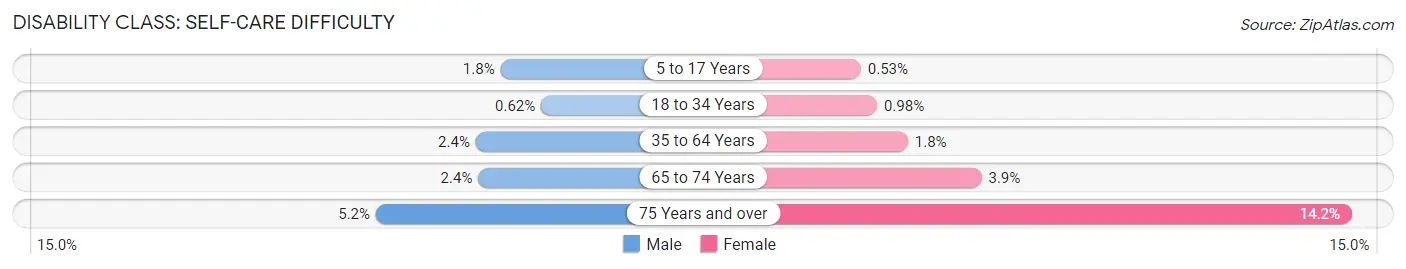
| Age Bracket | Male | Female |
| 5 to 17 Years | 111 (1.8%) | 32 (0.5%) |
| 18 to 34 Years | 48 (0.6%) | 70 (1.0%) |
| 35 to 64 Years | 310 (2.4%) | 222 (1.8%) |
| 65 to 74 Years | 62 (2.4%) | 102 (3.9%) |
| 75 Years and over | 69 (5.2%) | 265 (14.2%) |
Technology Access in San Benito County
Computing Device Access in San Benito County
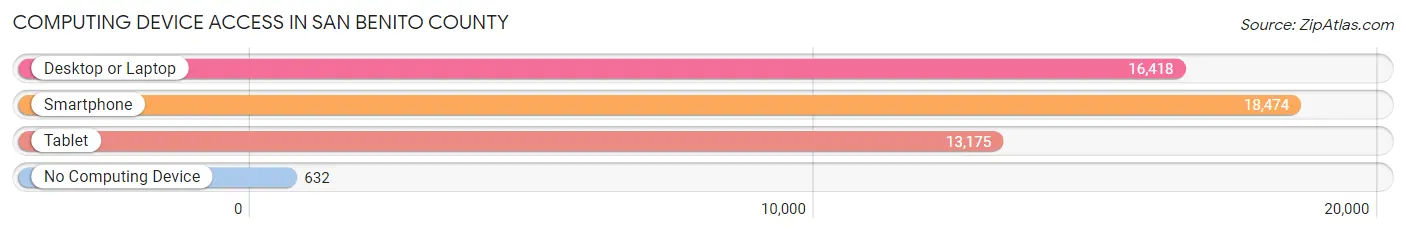
| Device Type | # Households | % Households |
| Desktop or Laptop | 16,418 | 82.7% |
| Smartphone | 18,474 | 93.1% |
| Tablet | 13,175 | 66.4% |
| No Computing Device | 632 | 3.2% |
| Total | 19,852 | 100.0% |
Internet Access in San Benito County
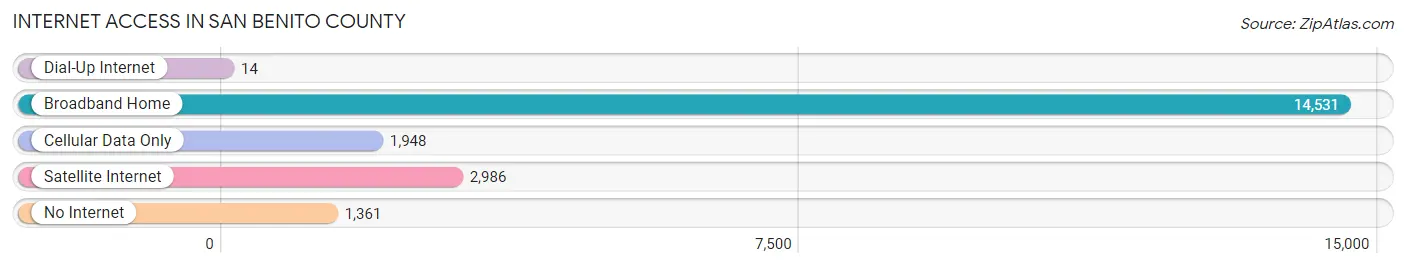
| Internet Type | # Households | % Households |
| Dial-Up Internet | 14 | 0.1% |
| Broadband Home | 14,531 | 73.2% |
| Cellular Data Only | 1,948 | 9.8% |
| Satellite Internet | 2,986 | 15.0% |
| No Internet | 1,361 | 6.9% |
| Total | 19,852 | 100.0% |
San Benito County Summary
San Benito County is located in the Central Coast region of California, and is bordered by Santa Clara County to the north, Monterey County to the south, and Fresno County to the east. The county seat is Hollister, and the county has a total area of 1,390 square miles. San Benito County is part of the Salinas Valley, and is known for its agricultural production, particularly of garlic, lettuce, and strawberries.
History
San Benito County was formed in 1874 from parts of Monterey and Fresno Counties. The county was named after the San Benito River, which was named by Spanish explorers in 1772. The area was originally inhabited by the Ohlone people, and was later settled by Spanish missionaries in the late 1700s. The area was part of the Mexican province of Alta California until 1848, when it became part of the United States after the Mexican-American War.
In the late 1800s, the county experienced a population boom due to the Gold Rush, and the area became known for its agricultural production. The county was also home to several large ranches, including the San Benito Ranch, which was owned by the Hearst family.
Geography
San Benito County is located in the Central Coast region of California, and is bordered by Santa Clara County to the north, Monterey County to the south, and Fresno County to the east. The county has a total area of 1,390 square miles, and is part of the Salinas Valley. The county is home to several mountain ranges, including the Gabilan Range, the Diablo Range, and the Santa Lucia Range. The county is also home to several rivers, including the San Benito River, the Pajaro River, and the Salinas River.
Economy
San Benito County is known for its agricultural production, particularly of garlic, lettuce, and strawberries. The county is also home to several wineries, and is a popular destination for wine tasting. The county is also home to several large ranches, including the San Benito Ranch, which is owned by the Hearst family.
The county is also home to several manufacturing companies, including the Hollister-based company, San Benito Foods. The company produces a variety of food products, including salsa, sauces, and dressings.
Demographics
As of the 2010 census, San Benito County had a population of 55,269. The population was 54.3% White, 1.7% African American, 0.7% Native American, 2.3% Asian, 0.1% Pacific Islander, 37.2% from other races, and 3.7% from two or more races. Hispanic or Latino of any race were 58.2% of the population.
The median household income in the county was $60,945, and the median family income was $68,945. The per capita income was $25,945. About 14.2% of the population was below the poverty line.
Common Questions
What is Per Capita Income in San Benito County?
Per Capita income in San Benito County is $40,799.
What is the Median Family Income in San Benito County?
Median Family Income in San Benito County is $112,958.
What is the Median Household income in San Benito County?
Median Household Income in San Benito County is $104,451.
What is Income or Wage Gap in San Benito County?
Income or Wage Gap in San Benito County is 39.2%.
Women in San Benito County earn 60.8 cents for every dollar earned by a man.
What is Family Income Deficit in San Benito County?
Family Income Deficit in San Benito County is $11,236.
Families that are below poverty line in San Benito County earn $11,236 less on average than the poverty threshold level.
What is Inequality or Gini Index in San Benito County?
Inequality or Gini Index in San Benito County is 0.41.
What is the Total Population of San Benito County?
Total Population of San Benito County is 64,753.
What is the Total Male Population of San Benito County?
Total Male Population of San Benito County is 32,844.
What is the Total Female Population of San Benito County?
Total Female Population of San Benito County is 31,909.
What is the Ratio of Males per 100 Females in San Benito County?
There are 102.93 Males per 100 Females in San Benito County.
What is the Ratio of Females per 100 Males in San Benito County?
There are 97.15 Females per 100 Males in San Benito County.
What is the Median Population Age in San Benito County?
Median Population Age in San Benito County is 35.7 Years.
What is the Average Family Size in San Benito County
Average Family Size in San Benito County is 3.6 People.
What is the Average Household Size in San Benito County
Average Household Size in San Benito County is 3.2 People.
How Large is the Labor Force in San Benito County?
There are 34,097 People in the Labor Forcein in San Benito County.
What is the Percentage of People in the Labor Force in San Benito County?
68.0% of People are in the Labor Force in San Benito County.
What is the Unemployment Rate in San Benito County?
Unemployment Rate in San Benito County is 6.2%.