Monterey County, CA Map & Demographics
Monterey County Map
Monterey County Overview
$37,741
PER CAPITA INCOME
$97,004
AVG FAMILY INCOME
$91,043
AVG HOUSEHOLD INCOME
21.0%
WAGE / INCOME GAP [ % ]
79.0¢/ $1
WAGE / INCOME GAP [ $ ]
$10,678
FAMILY INCOME DEFICIT
0.46
INEQUALITY / GINI INDEX
437,609
TOTAL POPULATION
223,186
MALE POPULATION
214,423
FEMALE POPULATION
104.09
MALES / 100 FEMALES
96.07
FEMALES / 100 MALES
35.1
MEDIAN AGE
3.7
AVG FAMILY SIZE
3.2
AVG HOUSEHOLD SIZE
204,112
LABOR FORCE [ PEOPLE ]
60.6%
PERCENT IN LABOR FORCE
5.3%
UNEMPLOYMENT RATE
Income in Monterey County
Income Overview in Monterey County
Per Capita Income in Monterey County is $37,741, while median incomes of families and households are $97,004 and $91,043 respectively.
| Characteristic | Number | Measure |
| Per Capita Income | 437,609 | $37,741 |
| Median Family Income | 95,629 | $97,004 |
| Mean Family Income | 95,629 | $130,259 |
| Median Household Income | 130,973 | $91,043 |
| Mean Household Income | 130,973 | $123,405 |
| Income Deficit | 95,629 | $10,678 |
| Wage / Income Gap (%) | 437,609 | 21.03% |
| Wage / Income Gap ($) | 437,609 | 78.97¢ per $1 |
| Gini / Inequality Index | 437,609 | 0.46 |
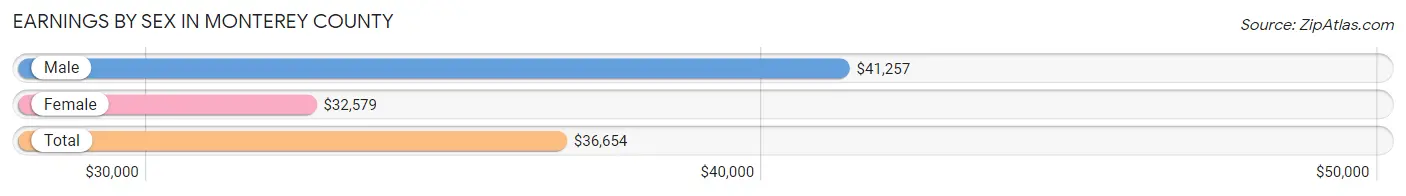
Earnings by Sex in Monterey County
Average Earnings in Monterey County are $36,654, $41,257 for men and $32,579 for women, a difference of 21.0%.
| Sex | Number | Average Earnings |
| Male | 122,635 (55.6%) | $41,257 |
| Female | 97,767 (44.4%) | $32,579 |
| Total | 220,402 (100.0%) | $36,654 |
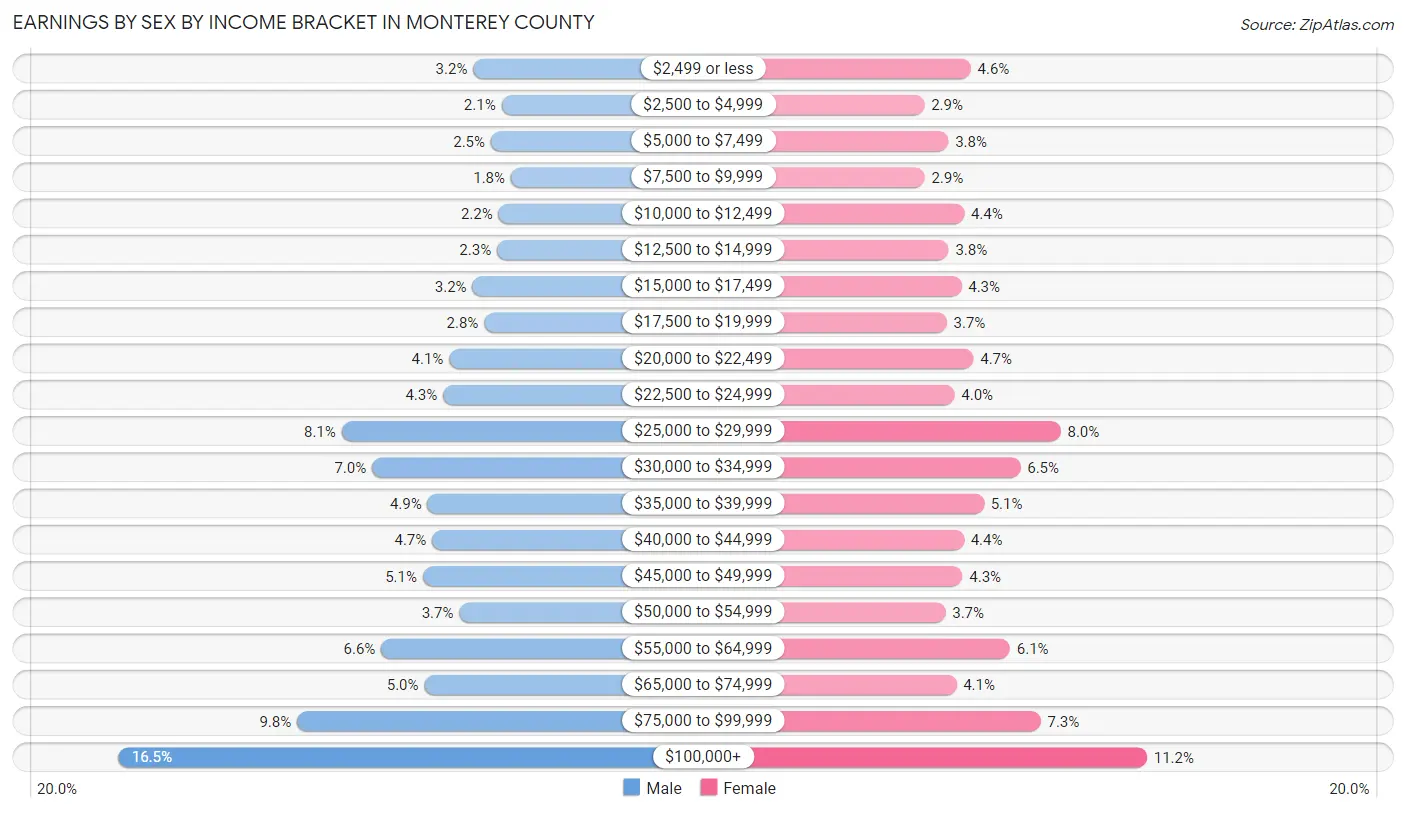
Earnings by Sex by Income Bracket in Monterey County
The most common earnings brackets in Monterey County are $100,000+ for men (20,195 | 16.5%) and $100,000+ for women (10,992 | 11.2%).
| Income | Male | Female |
| $2,499 or less | 3,911 (3.2%) | 4,535 (4.6%) |
| $2,500 to $4,999 | 2,610 (2.1%) | 2,833 (2.9%) |
| $5,000 to $7,499 | 3,108 (2.5%) | 3,717 (3.8%) |
| $7,500 to $9,999 | 2,179 (1.8%) | 2,848 (2.9%) |
| $10,000 to $12,499 | 2,741 (2.2%) | 4,291 (4.4%) |
| $12,500 to $14,999 | 2,818 (2.3%) | 3,722 (3.8%) |
| $15,000 to $17,499 | 3,944 (3.2%) | 4,192 (4.3%) |
| $17,500 to $19,999 | 3,407 (2.8%) | 3,656 (3.7%) |
| $20,000 to $22,499 | 5,014 (4.1%) | 4,633 (4.7%) |
| $22,500 to $24,999 | 5,300 (4.3%) | 3,944 (4.0%) |
| $25,000 to $29,999 | 9,954 (8.1%) | 7,832 (8.0%) |
| $30,000 to $34,999 | 8,555 (7.0%) | 6,350 (6.5%) |
| $35,000 to $39,999 | 6,015 (4.9%) | 5,017 (5.1%) |
| $40,000 to $44,999 | 5,805 (4.7%) | 4,282 (4.4%) |
| $45,000 to $49,999 | 6,228 (5.1%) | 4,233 (4.3%) |
| $50,000 to $54,999 | 4,548 (3.7%) | 3,605 (3.7%) |
| $55,000 to $64,999 | 8,139 (6.6%) | 5,977 (6.1%) |
| $65,000 to $74,999 | 6,160 (5.0%) | 4,010 (4.1%) |
| $75,000 to $99,999 | 12,004 (9.8%) | 7,098 (7.3%) |
| $100,000+ | 20,195 (16.5%) | 10,992 (11.2%) |
| Total | 122,635 (100.0%) | 97,767 (100.0%) |
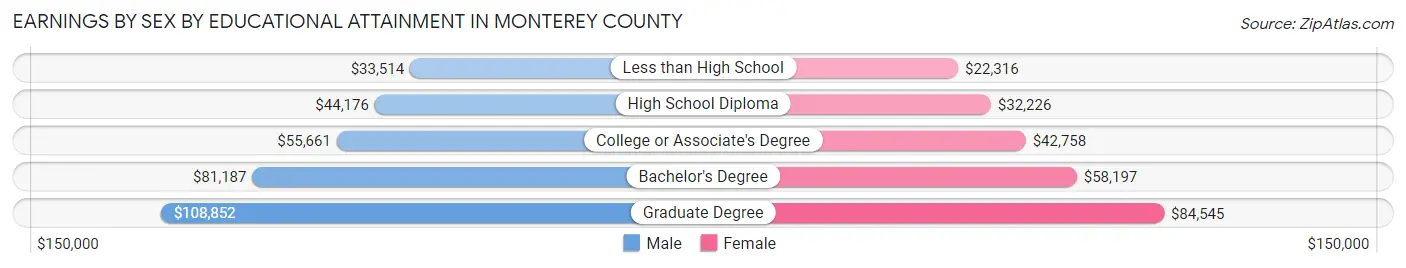
Earnings by Sex by Educational Attainment in Monterey County
Average earnings in Monterey County are $47,172 for men and $37,833 for women, a difference of 19.8%. Men with an educational attainment of graduate degree enjoy the highest average annual earnings of $108,852, while those with less than high school education earn the least with $33,514. Women with an educational attainment of graduate degree earn the most with the average annual earnings of $84,545, while those with less than high school education have the smallest earnings of $22,316.
| Educational Attainment | Male Income | Female Income |
| Less than High School | $33,514 | $22,316 |
| High School Diploma | $44,176 | $32,226 |
| College or Associate's Degree | $55,661 | $42,758 |
| Bachelor's Degree | $81,187 | $58,197 |
| Graduate Degree | $108,852 | $84,545 |
| Total | $47,172 | $37,833 |
Family Income in Monterey County
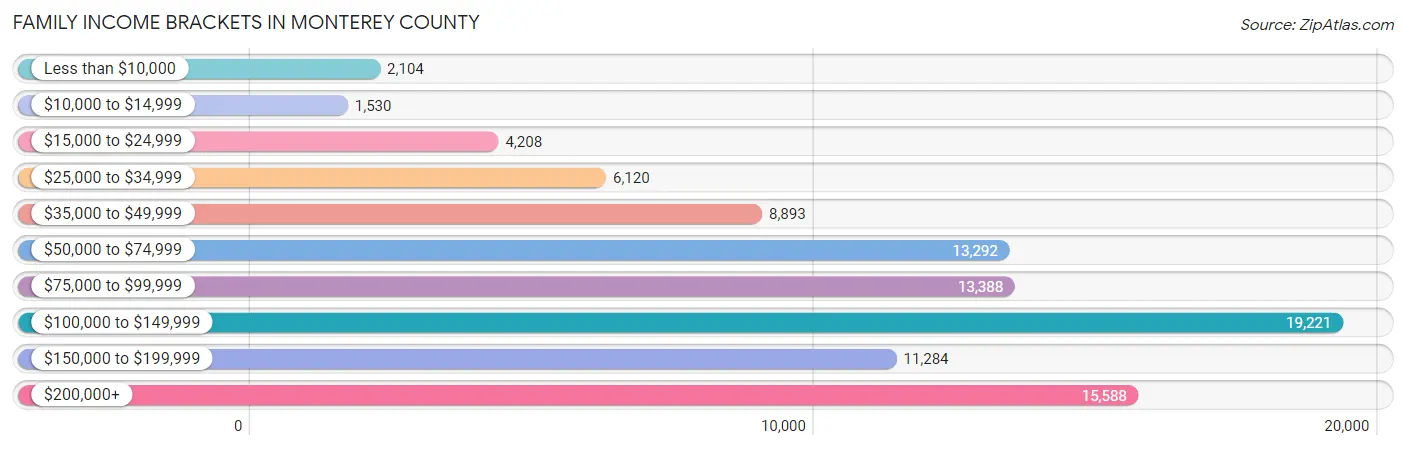
Family Income Brackets in Monterey County
According to the Monterey County family income data, there are 19,221 families falling into the $100,000 to $149,999 income range, which is the most common income bracket and makes up 20.1% of all families. Conversely, the $10,000 to $14,999 income bracket is the least frequent group with only 1,530 families (1.6%) belonging to this category.
| Income Bracket | # Families | % Families |
| Less than $10,000 | 2,104 | 2.2% |
| $10,000 to $14,999 | 1,530 | 1.6% |
| $15,000 to $24,999 | 4,208 | 4.4% |
| $25,000 to $34,999 | 6,120 | 6.4% |
| $35,000 to $49,999 | 8,893 | 9.3% |
| $50,000 to $74,999 | 13,292 | 13.9% |
| $75,000 to $99,999 | 13,388 | 14.0% |
| $100,000 to $149,999 | 19,221 | 20.1% |
| $150,000 to $199,999 | 11,284 | 11.8% |
| $200,000+ | 15,588 | 16.3% |
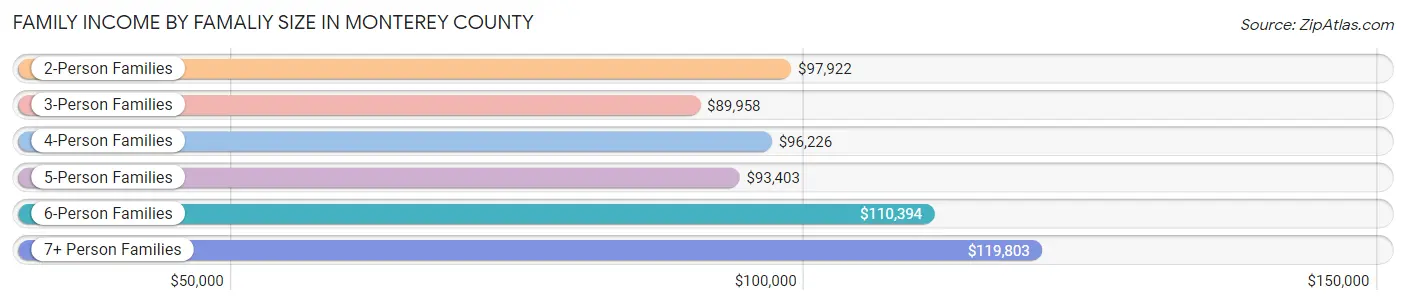
Family Income by Famaliy Size in Monterey County
7+ person families (4,955 | 5.2%) account for the highest median family income in Monterey County with $119,803 per family, while 2-person families (33,909 | 35.5%) have the highest median income of $48,961 per family member.
| Income Bracket | # Families | Median Income |
| 2-Person Families | 33,909 (35.5%) | $97,922 |
| 3-Person Families | 19,011 (19.9%) | $89,958 |
| 4-Person Families | 19,864 (20.8%) | $96,226 |
| 5-Person Families | 11,698 (12.2%) | $93,403 |
| 6-Person Families | 6,192 (6.5%) | $110,394 |
| 7+ Person Families | 4,955 (5.2%) | $119,803 |
| Total | 95,629 (100.0%) | $97,004 |
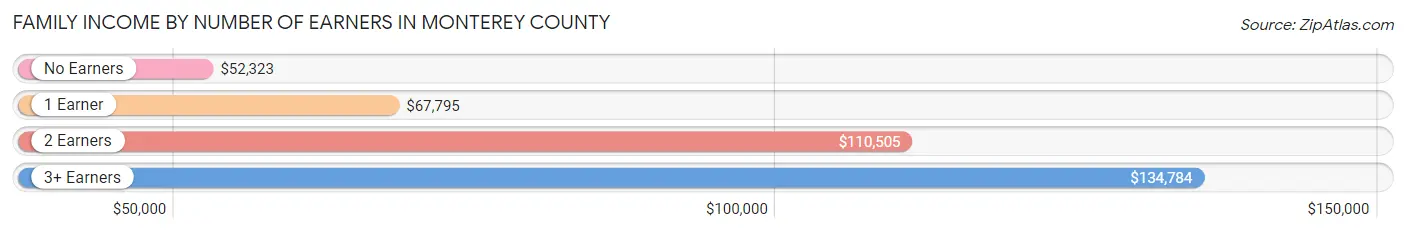
Family Income by Number of Earners in Monterey County
The median family income in Monterey County is $97,004, with families comprising 3+ earners (18,354) having the highest median family income of $134,784, while families with no earners (11,282) have the lowest median family income of $52,323, accounting for 19.2% and 11.8% of families, respectively.
| Number of Earners | # Families | Median Income |
| No Earners | 11,282 (11.8%) | $52,323 |
| 1 Earner | 30,465 (31.9%) | $67,795 |
| 2 Earners | 35,528 (37.1%) | $110,505 |
| 3+ Earners | 18,354 (19.2%) | $134,784 |
| Total | 95,629 (100.0%) | $97,004 |
Household Income in Monterey County
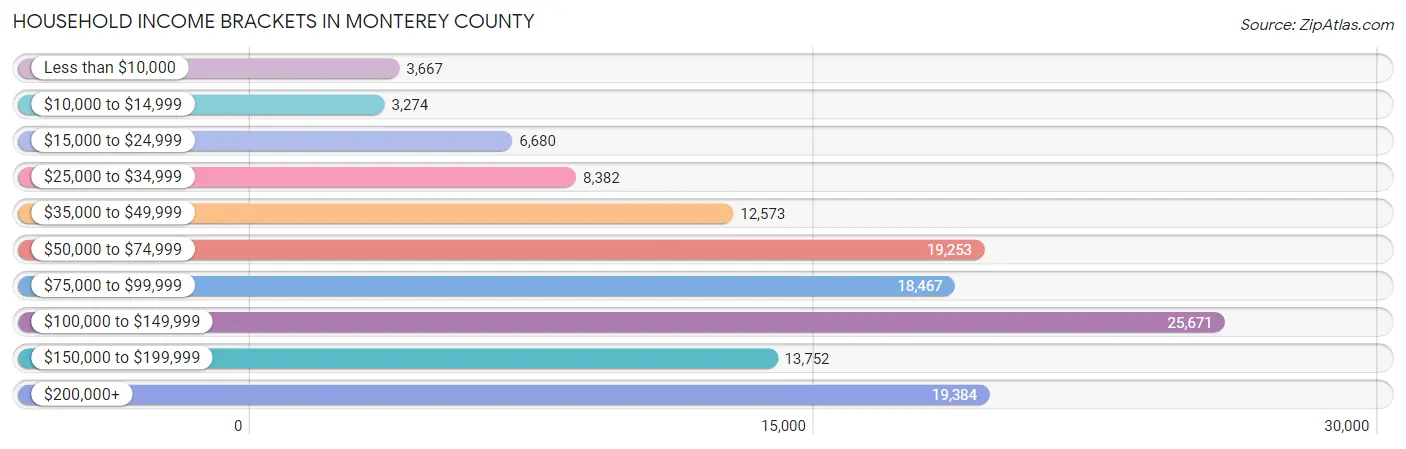
Household Income Brackets in Monterey County
With 25,671 households falling in the category, the $100,000 to $149,999 income range is the most frequent in Monterey County, accounting for 19.6% of all households. In contrast, only 3,274 households (2.5%) fall into the $10,000 to $14,999 income bracket, making it the least populous group.
| Income Bracket | # Households | % Households |
| Less than $10,000 | 3,667 | 2.8% |
| $10,000 to $14,999 | 3,274 | 2.5% |
| $15,000 to $24,999 | 6,680 | 5.1% |
| $25,000 to $34,999 | 8,382 | 6.4% |
| $35,000 to $49,999 | 12,573 | 9.6% |
| $50,000 to $74,999 | 19,253 | 14.7% |
| $75,000 to $99,999 | 18,467 | 14.1% |
| $100,000 to $149,999 | 25,671 | 19.6% |
| $150,000 to $199,999 | 13,752 | 10.5% |
| $200,000+ | 19,384 | 14.8% |
Household Income by Householder Age in Monterey County
The median household income in Monterey County is $91,043, with the highest median household income of $109,231 found in the 45 to 64 years age bracket for the primary householder. A total of 48,714 households (37.2%) fall into this category. Meanwhile, the 15 to 24 years age bracket for the primary householder has the lowest median household income of $50,971, with 3,717 households (2.8%) in this group.
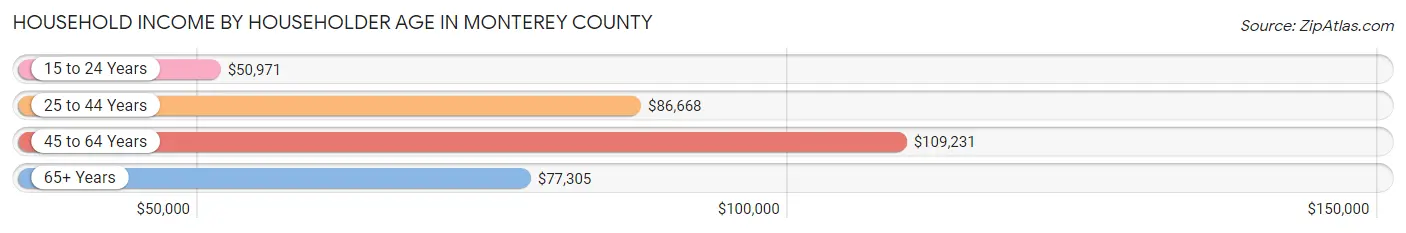
| Income Bracket | # Households | Median Income |
| 15 to 24 Years | 3,717 (2.8%) | $50,971 |
| 25 to 44 Years | 43,226 (33.0%) | $86,668 |
| 45 to 64 Years | 48,714 (37.2%) | $109,231 |
| 65+ Years | 35,316 (27.0%) | $77,305 |
| Total | 130,973 (100.0%) | $91,043 |
Poverty in Monterey County
Income Below Poverty by Sex and Age in Monterey County
With 11.3% poverty level for males and 13.4% for females among the residents of Monterey County, 5 year old males and 15 year old females are the most vulnerable to poverty, with 669 males (22.4%) and 784 females (22.2%) in their respective age groups living below the poverty level.
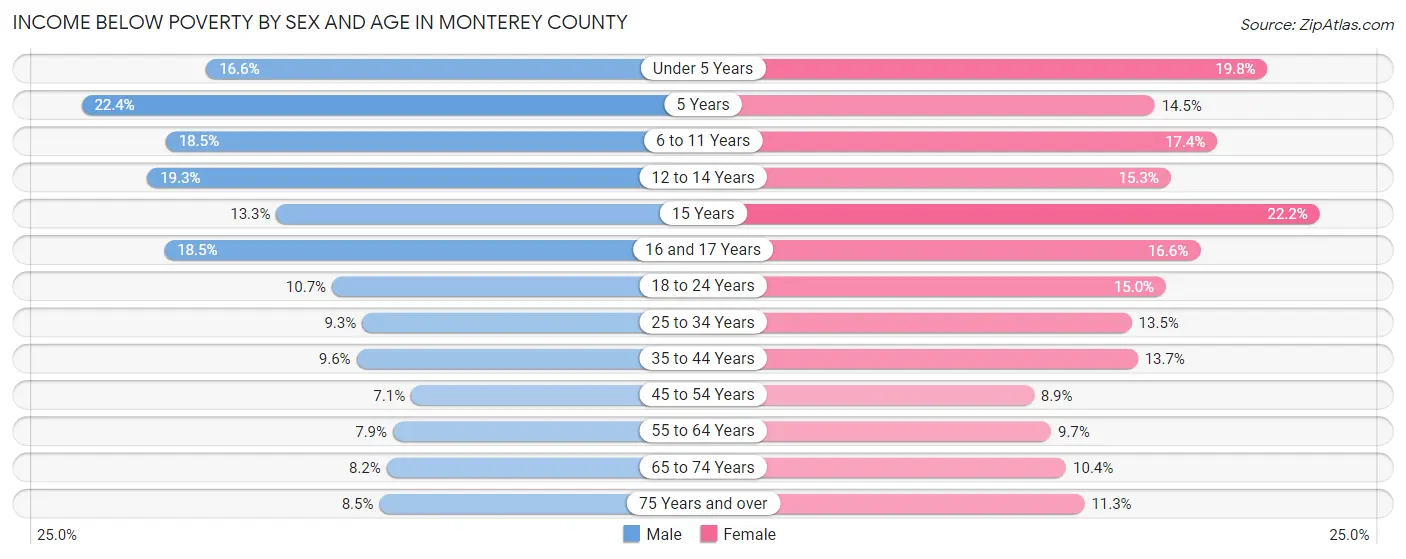
| Age Bracket | Male | Female |
| Under 5 Years | 2,418 (16.6%) | 2,770 (19.8%) |
| 5 Years | 669 (22.4%) | 416 (14.5%) |
| 6 to 11 Years | 3,508 (18.4%) | 3,223 (17.4%) |
| 12 to 14 Years | 2,012 (19.3%) | 1,478 (15.3%) |
| 15 Years | 440 (13.3%) | 784 (22.2%) |
| 16 and 17 Years | 1,140 (18.5%) | 982 (16.6%) |
| 18 to 24 Years | 2,114 (10.7%) | 2,982 (15.0%) |
| 25 to 34 Years | 2,716 (9.3%) | 3,799 (13.5%) |
| 35 to 44 Years | 2,779 (9.6%) | 3,685 (13.7%) |
| 45 to 54 Years | 1,797 (7.1%) | 2,147 (8.9%) |
| 55 to 64 Years | 1,796 (7.9%) | 2,344 (9.7%) |
| 65 to 74 Years | 1,428 (8.2%) | 1,955 (10.4%) |
| 75 Years and over | 912 (8.5%) | 1,619 (11.3%) |
| Total | 23,729 (11.3%) | 28,184 (13.4%) |
Income Above Poverty by Sex and Age in Monterey County
According to the poverty statistics in Monterey County, males aged 45 to 54 years and females aged 45 to 54 years are the age groups that are most secure financially, with 92.9% of males and 91.1% of females in these age groups living above the poverty line.
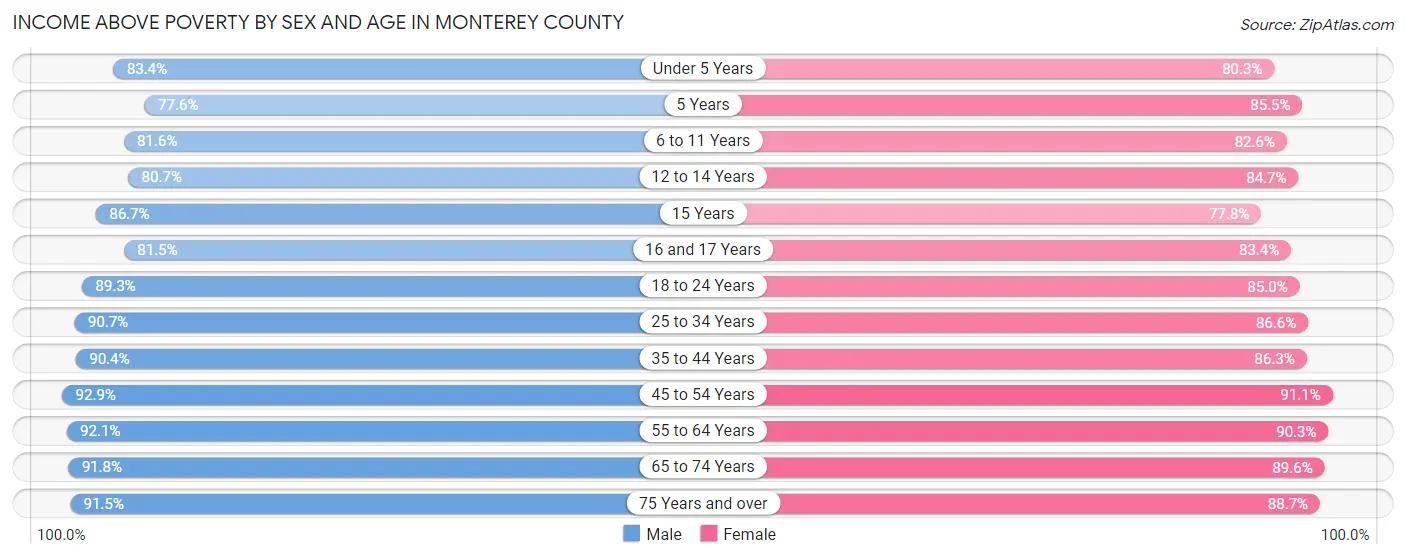
| Age Bracket | Male | Female |
| Under 5 Years | 12,178 (83.4%) | 11,253 (80.2%) |
| 5 Years | 2,323 (77.6%) | 2,449 (85.5%) |
| 6 to 11 Years | 15,501 (81.6%) | 15,274 (82.6%) |
| 12 to 14 Years | 8,407 (80.7%) | 8,207 (84.7%) |
| 15 Years | 2,864 (86.7%) | 2,752 (77.8%) |
| 16 and 17 Years | 5,017 (81.5%) | 4,928 (83.4%) |
| 18 to 24 Years | 17,575 (89.3%) | 16,841 (85.0%) |
| 25 to 34 Years | 26,359 (90.7%) | 24,449 (86.6%) |
| 35 to 44 Years | 26,160 (90.4%) | 23,153 (86.3%) |
| 45 to 54 Years | 23,622 (92.9%) | 21,953 (91.1%) |
| 55 to 64 Years | 20,916 (92.1%) | 21,805 (90.3%) |
| 65 to 74 Years | 15,995 (91.8%) | 16,829 (89.6%) |
| 75 Years and over | 9,767 (91.5%) | 12,754 (88.7%) |
| Total | 186,684 (88.7%) | 182,647 (86.6%) |
Income Below Poverty Among Married-Couple Families in Monterey County
The poverty statistics for married-couple families in Monterey County show that 5.2% or 3,601 of the total 69,021 families live below the poverty line. Families with 5 or more children have the highest poverty rate of 25.9%, comprising of 211 families. On the other hand, families with no children have the lowest poverty rate of 3.8%, which includes 1,380 families.
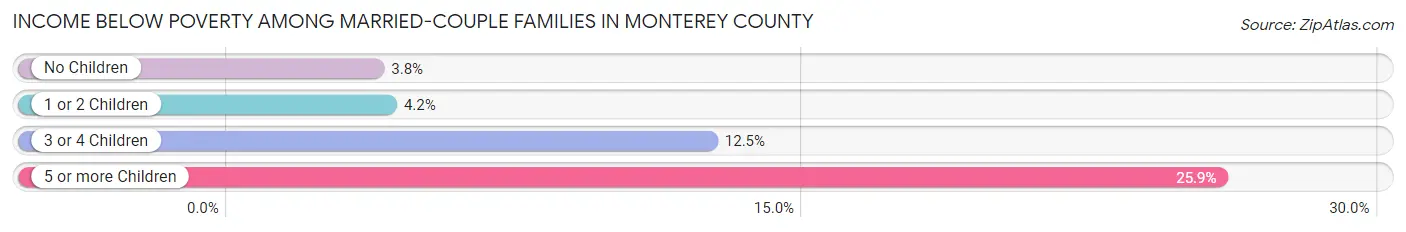
| Children | Above Poverty | Below Poverty |
| No Children | 34,770 (96.2%) | 1,380 (3.8%) |
| 1 or 2 Children | 22,944 (95.9%) | 993 (4.2%) |
| 3 or 4 Children | 7,101 (87.5%) | 1,017 (12.5%) |
| 5 or more Children | 605 (74.1%) | 211 (25.9%) |
| Total | 65,420 (94.8%) | 3,601 (5.2%) |
Income Below Poverty Among Single-Parent Households in Monterey County
According to the poverty data in Monterey County, 10.8% or 959 single-father households and 22.8% or 4,037 single-mother households are living below the poverty line. Among single-father households, those with 3 or 4 children have the highest poverty rate, with 311 households (25.4%) experiencing poverty. Likewise, among single-mother households, those with 3 or 4 children have the highest poverty rate, with 1,678 households (57.5%) falling below the poverty line.
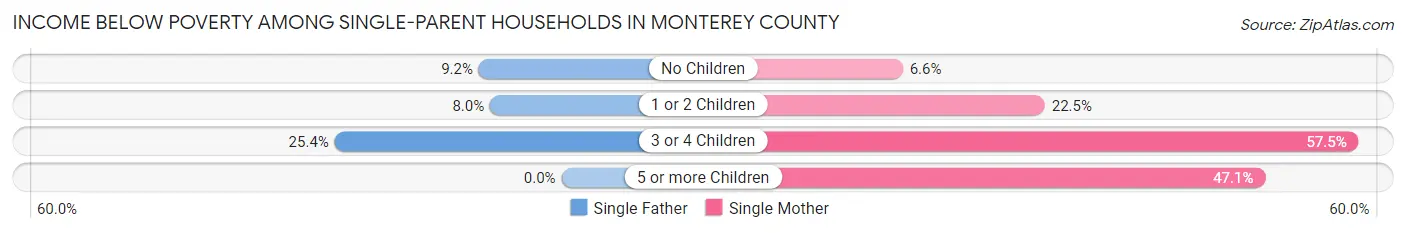
| Children | Single Father | Single Mother |
| No Children | 327 (9.2%) | 454 (6.6%) |
| 1 or 2 Children | 321 (8.0%) | 1,677 (22.5%) |
| 3 or 4 Children | 311 (25.4%) | 1,678 (57.5%) |
| 5 or more Children | 0 (0.0%) | 228 (47.1%) |
| Total | 959 (10.8%) | 4,037 (22.8%) |
Income Below Poverty Among Married-Couple vs Single-Parent Households in Monterey County
The poverty data for Monterey County shows that 3,601 of the married-couple family households (5.2%) and 4,996 of the single-parent households (18.8%) are living below the poverty level. Within the married-couple family households, those with 5 or more children have the highest poverty rate, with 211 households (25.9%) falling below the poverty line. Among the single-parent households, those with 3 or 4 children have the highest poverty rate, with 1,989 household (48.0%) living below poverty.
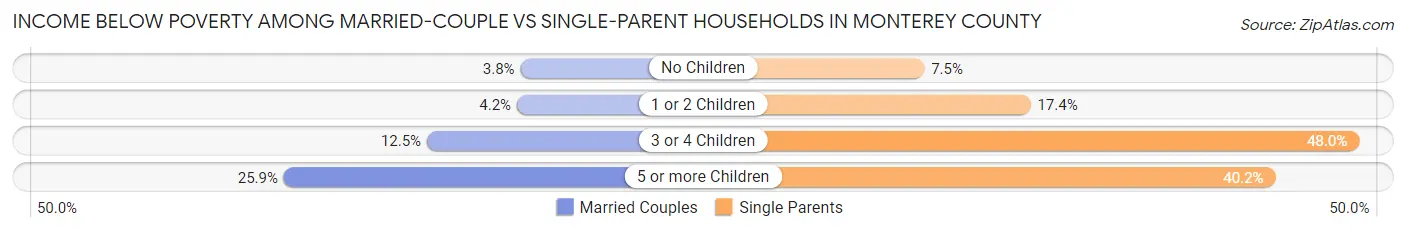
| Children | Married-Couple Families | Single-Parent Households |
| No Children | 1,380 (3.8%) | 781 (7.5%) |
| 1 or 2 Children | 993 (4.2%) | 1,998 (17.4%) |
| 3 or 4 Children | 1,017 (12.5%) | 1,989 (48.0%) |
| 5 or more Children | 211 (25.9%) | 228 (40.2%) |
| Total | 3,601 (5.2%) | 4,996 (18.8%) |
Race in Monterey County
The most populous races in Monterey County are Hispanic or Latino (261,954 | 59.9%), Some other Race (174,515 | 39.9%), and White / Caucasian (173,937 | 39.8%).
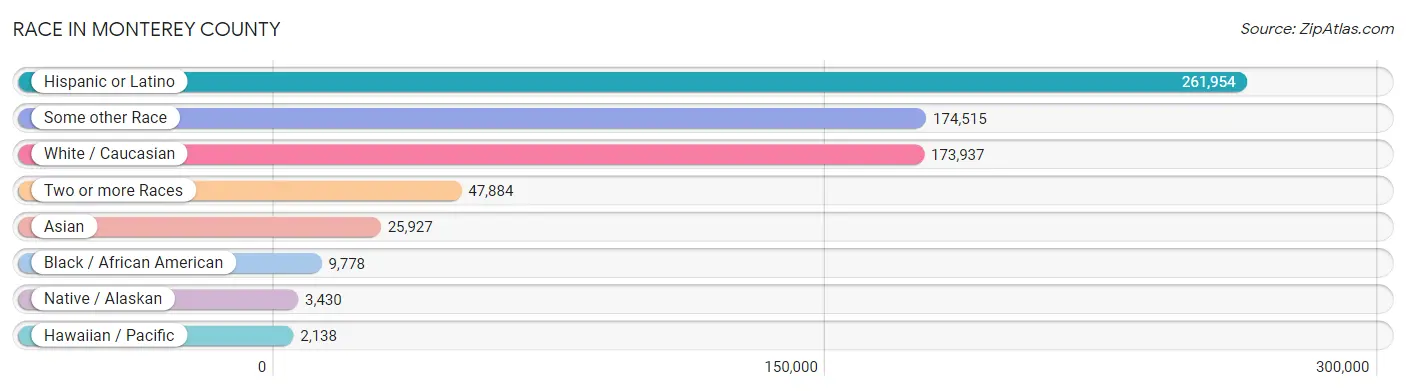
| Race | # Population | % Population |
| Asian | 25,927 | 5.9% |
| Black / African American | 9,778 | 2.2% |
| Hawaiian / Pacific | 2,138 | 0.5% |
| Hispanic or Latino | 261,954 | 59.9% |
| Native / Alaskan | 3,430 | 0.8% |
| White / Caucasian | 173,937 | 39.8% |
| Two or more Races | 47,884 | 10.9% |
| Some other Race | 174,515 | 39.9% |
| Total | 437,609 | 100.0% |
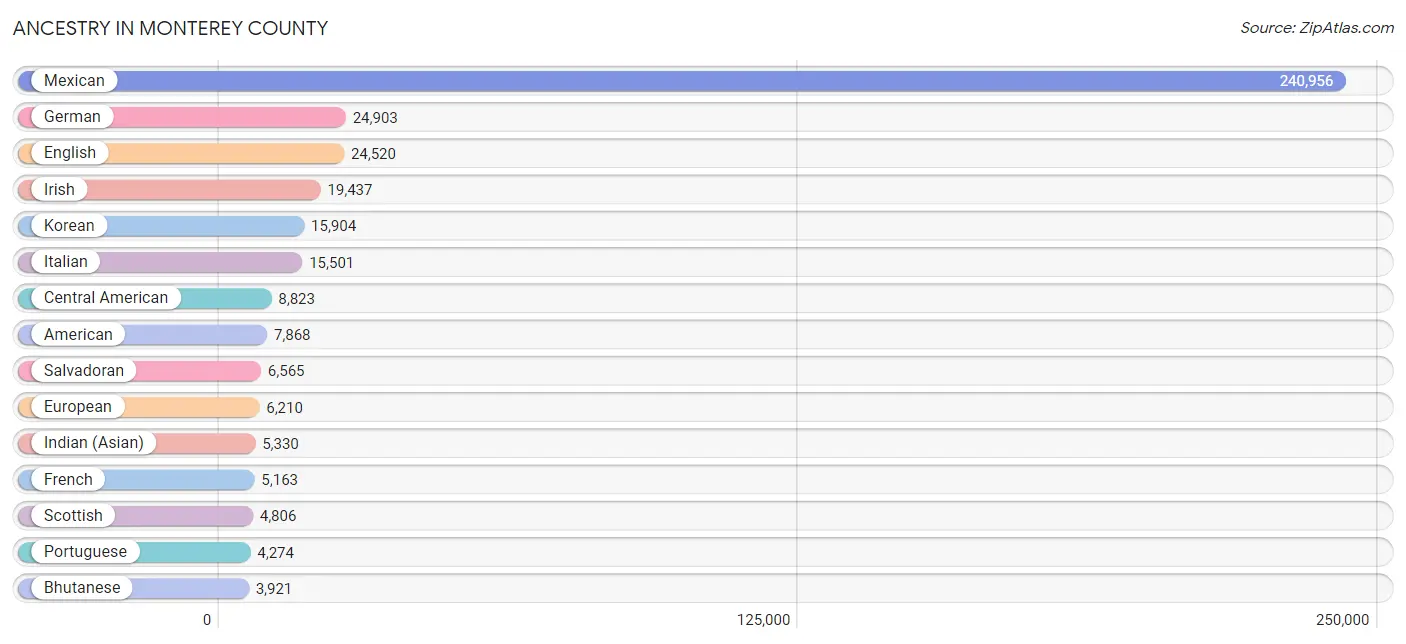
Ancestry in Monterey County
The most populous ancestries reported in Monterey County are Mexican (240,956 | 55.1%), German (24,903 | 5.7%), English (24,520 | 5.6%), Irish (19,437 | 4.4%), and Korean (15,904 | 3.6%), together accounting for 74.4% of all Monterey County residents.
| Ancestry | # Population | % Population |
| Afghan | 263 | 0.1% |
| African | 1,303 | 0.3% |
| Alaska Native | 37 | 0.0% |
| Albanian | 88 | 0.0% |
| Alsatian | 29 | 0.0% |
| American | 7,868 | 1.8% |
| Apache | 375 | 0.1% |
| Arab | 2,016 | 0.5% |
| Arapaho | 16 | 0.0% |
| Argentinean | 986 | 0.2% |
| Armenian | 600 | 0.1% |
| Assyrian / Chaldean / Syriac | 25 | 0.0% |
| Australian | 65 | 0.0% |
| Austrian | 488 | 0.1% |
| Bahamian | 2 | 0.0% |
| Bangladeshi | 75 | 0.0% |
| Barbadian | 3 | 0.0% |
| Basque | 82 | 0.0% |
| Belgian | 188 | 0.0% |
| Belizean | 33 | 0.0% |
| Bhutanese | 3,921 | 0.9% |
| Blackfeet | 485 | 0.1% |
| Bolivian | 16 | 0.0% |
| Brazilian | 205 | 0.1% |
| British | 1,591 | 0.4% |
| Bulgarian | 73 | 0.0% |
| Burmese | 3,121 | 0.7% |
| Cambodian | 78 | 0.0% |
| Canadian | 340 | 0.1% |
| Cape Verdean | 63 | 0.0% |
| Carpatho Rusyn | 5 | 0.0% |
| Celtic | 72 | 0.0% |
| Central American | 8,823 | 2.0% |
| Central American Indian | 235 | 0.1% |
| Cherokee | 1,234 | 0.3% |
| Chickasaw | 54 | 0.0% |
| Chilean | 169 | 0.0% |
| Chippewa | 4 | 0.0% |
| Choctaw | 475 | 0.1% |
| Colombian | 326 | 0.1% |
| Comanche | 22 | 0.0% |
| Costa Rican | 30 | 0.0% |
| Cree | 29 | 0.0% |
| Creek | 41 | 0.0% |
| Croatian | 457 | 0.1% |
| Cuban | 814 | 0.2% |
| Czech | 804 | 0.2% |
| Czechoslovakian | 128 | 0.0% |
| Danish | 1,695 | 0.4% |
| Dominican | 119 | 0.0% |
| Dutch | 2,299 | 0.5% |
| Eastern European | 915 | 0.2% |
| Ecuadorian | 305 | 0.1% |
| Egyptian | 361 | 0.1% |
| English | 24,520 | 5.6% |
| Estonian | 27 | 0.0% |
| Ethiopian | 20 | 0.0% |
| European | 6,210 | 1.4% |
| Filipino | 318 | 0.1% |
| Finnish | 359 | 0.1% |
| French | 5,163 | 1.2% |
| French American Indian | 37 | 0.0% |
| French Canadian | 838 | 0.2% |
| German | 24,903 | 5.7% |
| German Russian | 89 | 0.0% |
| Greek | 746 | 0.2% |
| Guamanian / Chamorro | 769 | 0.2% |
| Guatemalan | 1,140 | 0.3% |
| Haitian | 156 | 0.0% |
| Hmong | 18 | 0.0% |
| Honduran | 670 | 0.2% |
| Hopi | 77 | 0.0% |
| Hungarian | 811 | 0.2% |
| Icelander | 94 | 0.0% |
| Indian (Asian) | 5,330 | 1.2% |
| Indonesian | 124 | 0.0% |
| Inupiat | 33 | 0.0% |
| Iranian | 453 | 0.1% |
| Iraqi | 131 | 0.0% |
| Irish | 19,437 | 4.4% |
| Israeli | 32 | 0.0% |
| Italian | 15,501 | 3.5% |
| Jamaican | 124 | 0.0% |
| Japanese | 65 | 0.0% |
| Jordanian | 26 | 0.0% |
| Kiowa | 52 | 0.0% |
| Korean | 15,904 | 3.6% |
| Laotian | 111 | 0.0% |
| Latvian | 25 | 0.0% |
| Lebanese | 431 | 0.1% |
| Lithuanian | 209 | 0.1% |
| Luxembourger | 13 | 0.0% |
| Macedonian | 9 | 0.0% |
| Malaysian | 38 | 0.0% |
| Maltese | 17 | 0.0% |
| Mexican | 240,956 | 55.1% |
| Mexican American Indian | 2,580 | 0.6% |
| Mongolian | 21 | 0.0% |
| Moroccan | 8 | 0.0% |
| Native Hawaiian | 1,333 | 0.3% |
| Navajo | 162 | 0.0% |
| New Zealander | 59 | 0.0% |
| Nicaraguan | 277 | 0.1% |
| Nigerian | 211 | 0.1% |
| Northern European | 705 | 0.2% |
| Norwegian | 2,711 | 0.6% |
| Okinawan | 43 | 0.0% |
| Osage | 31 | 0.0% |
| Paiute | 76 | 0.0% |
| Pakistani | 476 | 0.1% |
| Palestinian | 84 | 0.0% |
| Panamanian | 134 | 0.0% |
| Paraguayan | 69 | 0.0% |
| Pennsylvania German | 21 | 0.0% |
| Peruvian | 495 | 0.1% |
| Pima | 11 | 0.0% |
| Polish | 3,422 | 0.8% |
| Portuguese | 4,274 | 1.0% |
| Potawatomi | 44 | 0.0% |
| Pueblo | 59 | 0.0% |
| Puerto Rican | 3,000 | 0.7% |
| Romanian | 247 | 0.1% |
| Russian | 2,083 | 0.5% |
| Salvadoran | 6,565 | 1.5% |
| Samoan | 851 | 0.2% |
| Scandinavian | 845 | 0.2% |
| Scotch-Irish | 1,905 | 0.4% |
| Scottish | 4,806 | 1.1% |
| Serbian | 210 | 0.1% |
| Shoshone | 42 | 0.0% |
| Sioux | 153 | 0.0% |
| Slavic | 25 | 0.0% |
| Slovak | 448 | 0.1% |
| Slovene | 85 | 0.0% |
| Somali | 20 | 0.0% |
| South African | 116 | 0.0% |
| South American | 2,645 | 0.6% |
| Spaniard | 1,266 | 0.3% |
| Spanish | 1,710 | 0.4% |
| Spanish American Indian | 23 | 0.0% |
| Sri Lankan | 2,243 | 0.5% |
| Subsaharan African | 1,792 | 0.4% |
| Sudanese | 12 | 0.0% |
| Swedish | 2,633 | 0.6% |
| Swiss | 2,100 | 0.5% |
| Syrian | 225 | 0.1% |
| Thai | 2,862 | 0.6% |
| Tlingit-Haida | 26 | 0.0% |
| Tohono O'Odham | 10 | 0.0% |
| Tongan | 430 | 0.1% |
| Trinidadian and Tobagonian | 13 | 0.0% |
| Turkish | 138 | 0.0% |
| Ukrainian | 618 | 0.1% |
| Uruguayan | 169 | 0.0% |
| Ute | 50 | 0.0% |
| Venezuelan | 110 | 0.0% |
| Vietnamese | 112 | 0.0% |
| Welsh | 1,281 | 0.3% |
| West Indian | 34 | 0.0% |
| Yaqui | 344 | 0.1% |
| Yugoslavian | 147 | 0.0% |
| Yup'ik | 14 | 0.0% | View All 162 Rows |
Immigrants in Monterey County
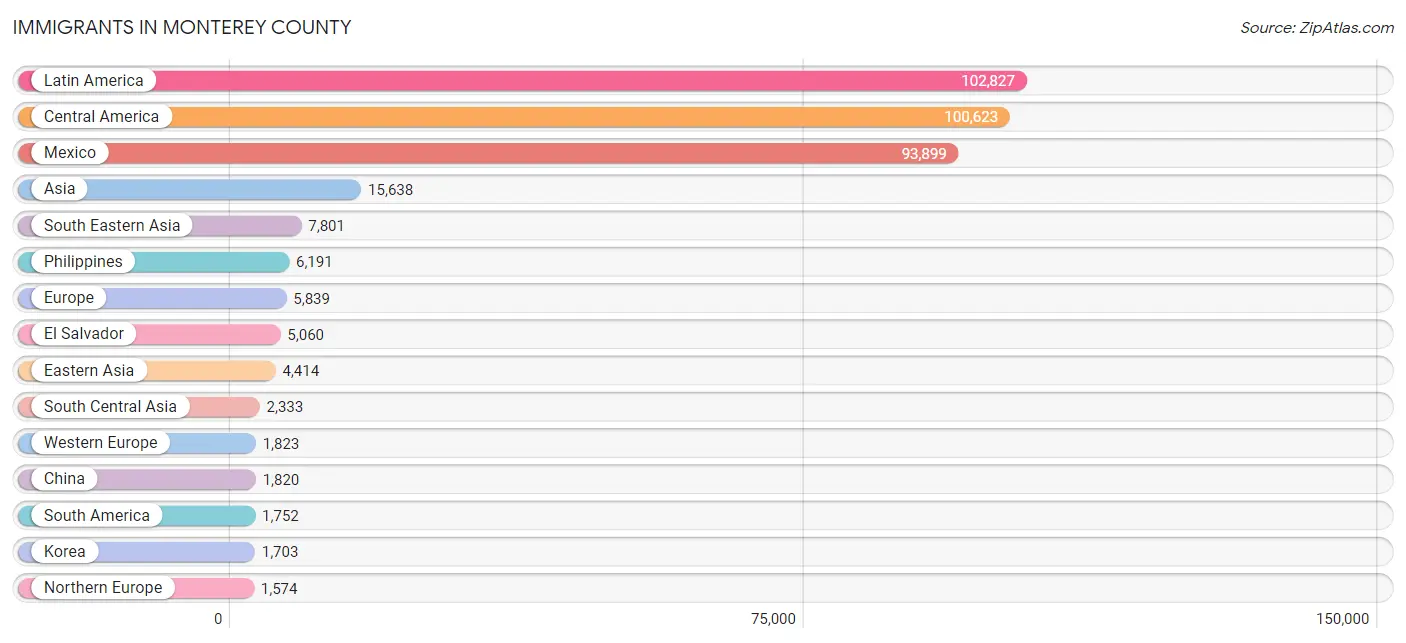
The most numerous immigrant groups reported in Monterey County came from Latin America (102,827 | 23.5%), Central America (100,623 | 23.0%), Mexico (93,899 | 21.5%), Asia (15,638 | 3.6%), and South Eastern Asia (7,801 | 1.8%), together accounting for 73.3% of all Monterey County residents.
| Immigration Origin | # Population | % Population |
| Afghanistan | 222 | 0.1% |
| Africa | 633 | 0.1% |
| Argentina | 259 | 0.1% |
| Armenia | 16 | 0.0% |
| Asia | 15,638 | 3.6% |
| Australia | 97 | 0.0% |
| Austria | 85 | 0.0% |
| Azores | 121 | 0.0% |
| Bangladesh | 82 | 0.0% |
| Barbados | 5 | 0.0% |
| Belarus | 62 | 0.0% |
| Belgium | 13 | 0.0% |
| Belize | 33 | 0.0% |
| Bosnia and Herzegovina | 19 | 0.0% |
| Brazil | 343 | 0.1% |
| Bulgaria | 28 | 0.0% |
| Cambodia | 53 | 0.0% |
| Canada | 785 | 0.2% |
| Caribbean | 452 | 0.1% |
| Central America | 100,623 | 23.0% |
| Chile | 149 | 0.0% |
| China | 1,820 | 0.4% |
| Colombia | 354 | 0.1% |
| Costa Rica | 28 | 0.0% |
| Croatia | 14 | 0.0% |
| Cuba | 113 | 0.0% |
| Czechoslovakia | 174 | 0.0% |
| Denmark | 3 | 0.0% |
| Dominica | 42 | 0.0% |
| Dominican Republic | 77 | 0.0% |
| Eastern Africa | 67 | 0.0% |
| Eastern Asia | 4,414 | 1.0% |
| Eastern Europe | 1,540 | 0.4% |
| Ecuador | 118 | 0.0% |
| Egypt | 275 | 0.1% |
| El Salvador | 5,060 | 1.2% |
| England | 670 | 0.2% |
| Ethiopia | 20 | 0.0% |
| Europe | 5,839 | 1.3% |
| Fiji | 443 | 0.1% |
| France | 241 | 0.1% |
| Germany | 1,225 | 0.3% |
| Ghana | 11 | 0.0% |
| Greece | 37 | 0.0% |
| Guatemala | 783 | 0.2% |
| Guyana | 31 | 0.0% |
| Haiti | 19 | 0.0% |
| Honduras | 537 | 0.1% |
| Hong Kong | 87 | 0.0% |
| Hungary | 111 | 0.0% |
| India | 1,388 | 0.3% |
| Indonesia | 95 | 0.0% |
| Iran | 382 | 0.1% |
| Iraq | 154 | 0.0% |
| Ireland | 102 | 0.0% |
| Israel | 106 | 0.0% |
| Italy | 303 | 0.1% |
| Jamaica | 99 | 0.0% |
| Japan | 787 | 0.2% |
| Jordan | 54 | 0.0% |
| Kazakhstan | 13 | 0.0% |
| Kenya | 12 | 0.0% |
| Korea | 1,703 | 0.4% |
| Kuwait | 58 | 0.0% |
| Laos | 43 | 0.0% |
| Latin America | 102,827 | 23.5% |
| Latvia | 11 | 0.0% |
| Lebanon | 128 | 0.0% |
| Malaysia | 21 | 0.0% |
| Mexico | 93,899 | 21.5% |
| Micronesia | 20 | 0.0% |
| Moldova | 44 | 0.0% |
| Morocco | 8 | 0.0% |
| Nepal | 111 | 0.0% |
| Netherlands | 237 | 0.1% |
| Nicaragua | 224 | 0.1% |
| Nigeria | 31 | 0.0% |
| Northern Africa | 363 | 0.1% |
| Northern Europe | 1,574 | 0.4% |
| Norway | 51 | 0.0% |
| Oceania | 840 | 0.2% |
| Pakistan | 91 | 0.0% |
| Panama | 59 | 0.0% |
| Peru | 385 | 0.1% |
| Philippines | 6,191 | 1.4% |
| Poland | 103 | 0.0% |
| Portugal | 379 | 0.1% |
| Romania | 194 | 0.0% |
| Russia | 343 | 0.1% |
| Scotland | 159 | 0.0% |
| Senegal | 4 | 0.0% |
| Serbia | 55 | 0.0% |
| Singapore | 143 | 0.0% |
| South Africa | 70 | 0.0% |
| South America | 1,752 | 0.4% |
| South Central Asia | 2,333 | 0.5% |
| South Eastern Asia | 7,801 | 1.8% |
| Southern Europe | 902 | 0.2% |
| Spain | 183 | 0.0% |
| Sri Lanka | 20 | 0.0% |
| Sudan | 12 | 0.0% |
| Sweden | 198 | 0.1% |
| Switzerland | 22 | 0.0% |
| Syria | 224 | 0.1% |
| Taiwan | 217 | 0.1% |
| Thailand | 331 | 0.1% |
| Trinidad and Tobago | 97 | 0.0% |
| Turkey | 51 | 0.0% |
| Uganda | 10 | 0.0% |
| Ukraine | 245 | 0.1% |
| Uruguay | 13 | 0.0% |
| Uzbekistan | 24 | 0.0% |
| Venezuela | 60 | 0.0% |
| Vietnam | 880 | 0.2% |
| Western Africa | 86 | 0.0% |
| Western Asia | 1,005 | 0.2% |
| Western Europe | 1,823 | 0.4% |
| Yemen | 150 | 0.0% |
| Zimbabwe | 12 | 0.0% | View All 119 Rows |
Sex and Age in Monterey County
Sex and Age in Monterey County
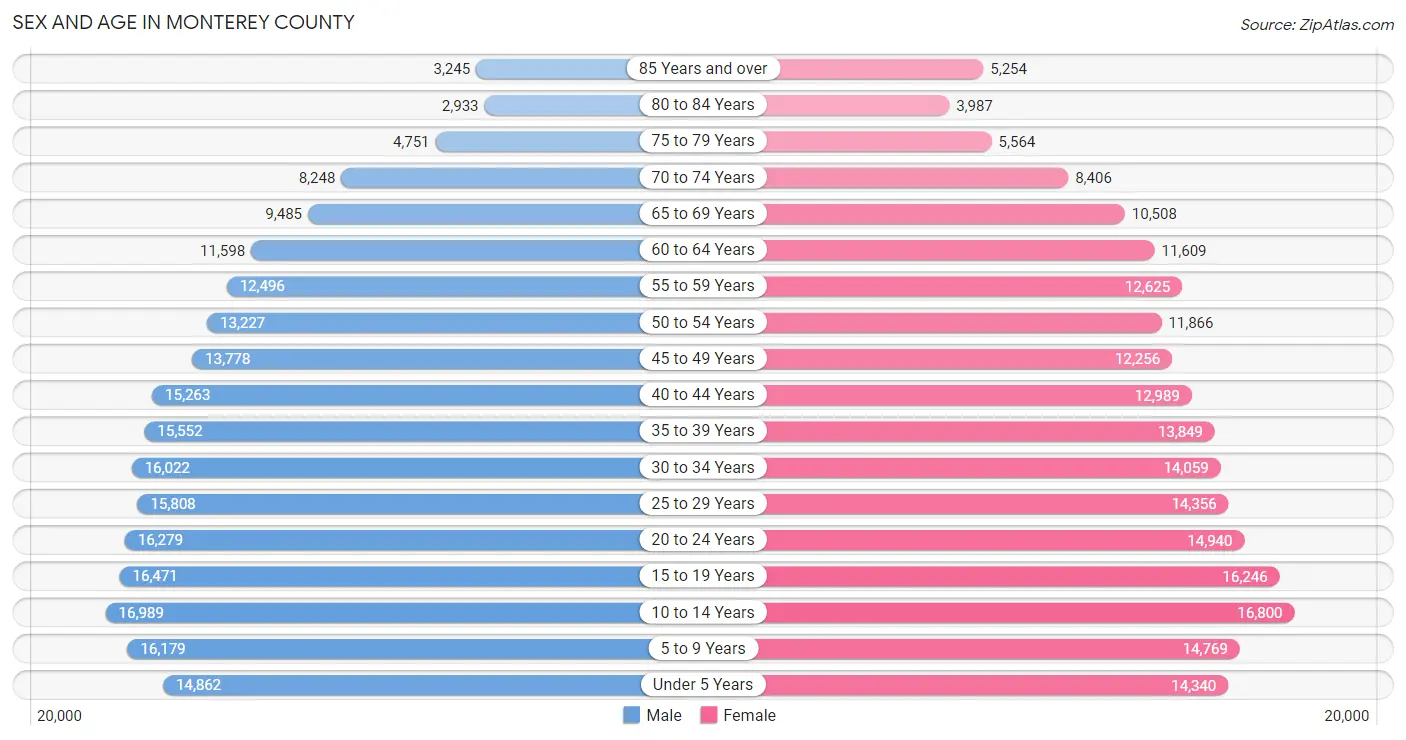
The most populous age groups in Monterey County are 10 to 14 Years (16,989 | 7.6%) for men and 10 to 14 Years (16,800 | 7.8%) for women.
| Age Bracket | Male | Female |
| Under 5 Years | 14,862 (6.7%) | 14,340 (6.7%) |
| 5 to 9 Years | 16,179 (7.2%) | 14,769 (6.9%) |
| 10 to 14 Years | 16,989 (7.6%) | 16,800 (7.8%) |
| 15 to 19 Years | 16,471 (7.4%) | 16,246 (7.6%) |
| 20 to 24 Years | 16,279 (7.3%) | 14,940 (7.0%) |
| 25 to 29 Years | 15,808 (7.1%) | 14,356 (6.7%) |
| 30 to 34 Years | 16,022 (7.2%) | 14,059 (6.6%) |
| 35 to 39 Years | 15,552 (7.0%) | 13,849 (6.5%) |
| 40 to 44 Years | 15,263 (6.8%) | 12,989 (6.1%) |
| 45 to 49 Years | 13,778 (6.2%) | 12,256 (5.7%) |
| 50 to 54 Years | 13,227 (5.9%) | 11,866 (5.5%) |
| 55 to 59 Years | 12,496 (5.6%) | 12,625 (5.9%) |
| 60 to 64 Years | 11,598 (5.2%) | 11,609 (5.4%) |
| 65 to 69 Years | 9,485 (4.3%) | 10,508 (4.9%) |
| 70 to 74 Years | 8,248 (3.7%) | 8,406 (3.9%) |
| 75 to 79 Years | 4,751 (2.1%) | 5,564 (2.6%) |
| 80 to 84 Years | 2,933 (1.3%) | 3,987 (1.9%) |
| 85 Years and over | 3,245 (1.5%) | 5,254 (2.5%) |
| Total | 223,186 (100.0%) | 214,423 (100.0%) |
Families and Households in Monterey County
Median Family Size in Monterey County
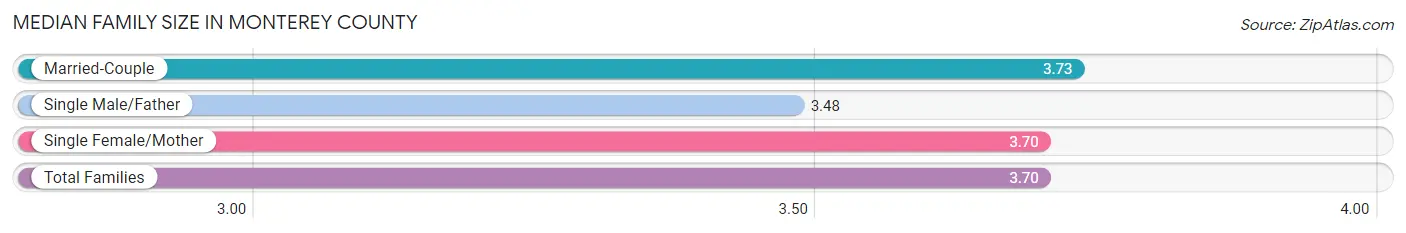
The median family size in Monterey County is 3.70 persons per family, with married-couple families (69,021 | 72.2%) accounting for the largest median family size of 3.73 persons per family. On the other hand, single male/father families (8,871 | 9.3%) represent the smallest median family size with 3.48 persons per family.
| Family Type | # Families | Family Size |
| Married-Couple | 69,021 (72.2%) | 3.73 |
| Single Male/Father | 8,871 (9.3%) | 3.48 |
| Single Female/Mother | 17,737 (18.5%) | 3.70 |
| Total Families | 95,629 (100.0%) | 3.70 |
Median Household Size in Monterey County
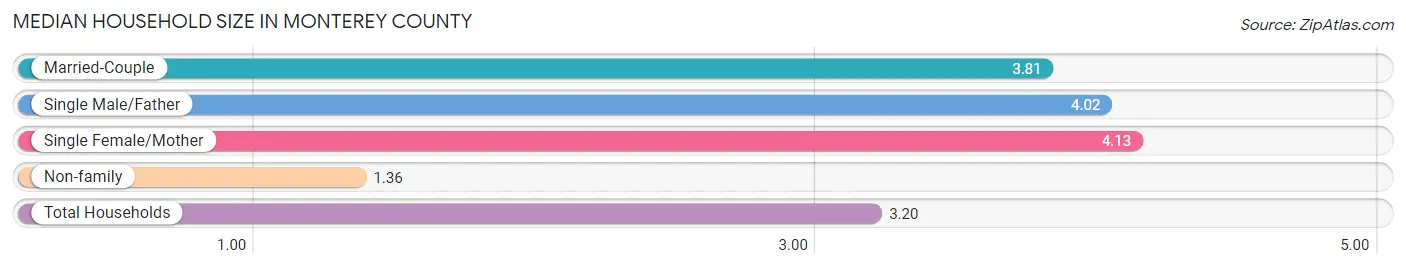
The median household size in Monterey County is 3.20 persons per household, with single female/mother households (17,737 | 13.5%) accounting for the largest median household size of 4.13 persons per household. non-family households (35,344 | 27.0%) represent the smallest median household size with 1.36 persons per household.
| Household Type | # Households | Household Size |
| Married-Couple | 69,021 (52.7%) | 3.81 |
| Single Male/Father | 8,871 (6.8%) | 4.02 |
| Single Female/Mother | 17,737 (13.5%) | 4.13 |
| Non-family | 35,344 (27.0%) | 1.36 |
| Total Households | 130,973 (100.0%) | 3.20 |
Household Size by Marriage Status in Monterey County
Out of a total of 130,973 households in Monterey County, 95,629 (73.0%) are family households, while 35,344 (27.0%) are nonfamily households. The most numerous type of family households are 2-person households, comprising 30,486, and the most common type of nonfamily households are 1-person households, comprising 26,693.
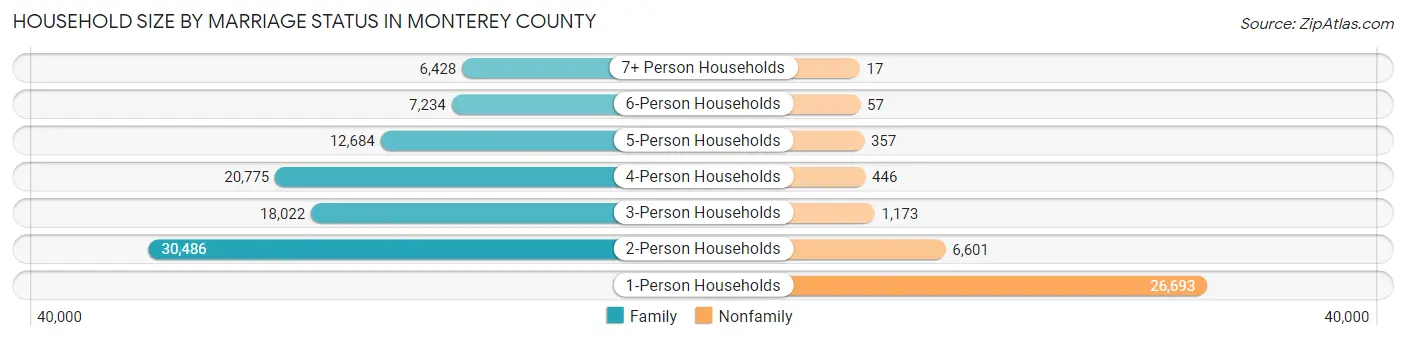
| Household Size | Family Households | Nonfamily Households |
| 1-Person Households | - | 26,693 (20.4%) |
| 2-Person Households | 30,486 (23.3%) | 6,601 (5.0%) |
| 3-Person Households | 18,022 (13.8%) | 1,173 (0.9%) |
| 4-Person Households | 20,775 (15.9%) | 446 (0.3%) |
| 5-Person Households | 12,684 (9.7%) | 357 (0.3%) |
| 6-Person Households | 7,234 (5.5%) | 57 (0.0%) |
| 7+ Person Households | 6,428 (4.9%) | 17 (0.0%) |
| Total | 95,629 (73.0%) | 35,344 (27.0%) |
Female Fertility in Monterey County
Fertility by Age in Monterey County
Average fertility rate in Monterey County is 43.0 births per 1,000 women. Women in the age bracket of 20 to 34 years have the highest fertility rate with 63.0 births per 1,000 women. Women in the age bracket of 20 to 34 years acount for 62.0% of all women with births.
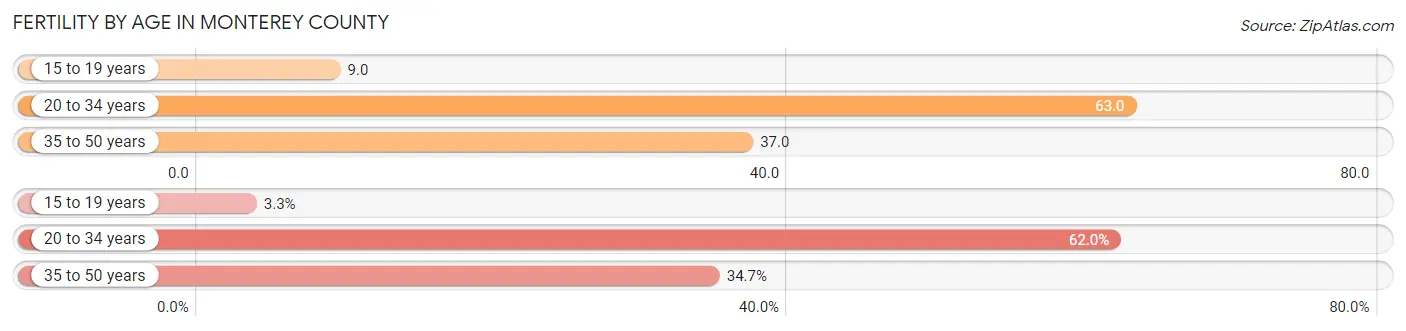
| Age Bracket | Women with Births | Births / 1,000 Women |
| 15 to 19 years | 145 (3.3%) | 9.0 |
| 20 to 34 years | 2,717 (62.0%) | 63.0 |
| 35 to 50 years | 1,523 (34.7%) | 37.0 |
| Total | 4,385 (100.0%) | 43.0 |
Fertility by Age by Marriage Status in Monterey County
73.5% of women with births (4,385) in Monterey County are married. The highest percentage of unmarried women with births falls into 15 to 19 years age bracket with 86.2% of them unmarried at the time of birth, while the lowest percentage of unmarried women with births belong to 35 to 50 years age bracket with 13.1% of them unmarried.
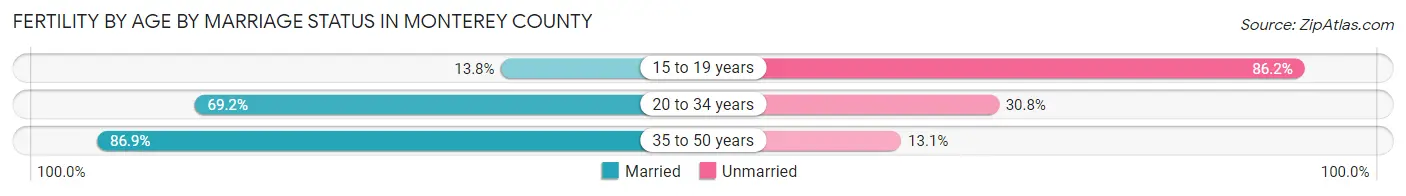
| Age Bracket | Married | Unmarried |
| 15 to 19 years | 20 (13.8%) | 125 (86.2%) |
| 20 to 34 years | 1,880 (69.2%) | 837 (30.8%) |
| 35 to 50 years | 1,323 (86.9%) | 200 (13.1%) |
| Total | 3,223 (73.5%) | 1,162 (26.5%) |
Fertility by Education in Monterey County
Average fertility rate in Monterey County is 43.0 births per 1,000 women. Women with the education attainment of bachelor's degree have the highest fertility rate of 51.0 births per 1,000 women, while women with the education attainment of less than high school have the lowest fertility at 35.0 births per 1,000 women. Women with the education attainment of college or associate's degree represent 31.7% of all women with births.
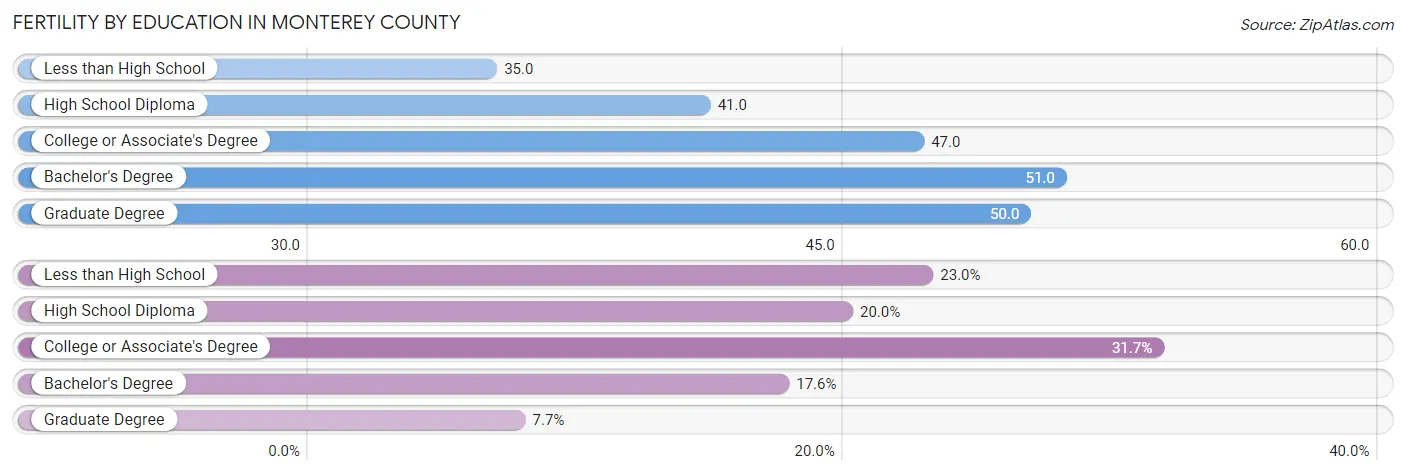
| Educational Attainment | Women with Births | Births / 1,000 Women |
| Less than High School | 1,009 (23.0%) | 35.0 |
| High School Diploma | 877 (20.0%) | 41.0 |
| College or Associate's Degree | 1,388 (31.7%) | 47.0 |
| Bachelor's Degree | 772 (17.6%) | 51.0 |
| Graduate Degree | 339 (7.7%) | 50.0 |
| Total | 4,385 (100.0%) | 43.0 |
Fertility by Education by Marriage Status in Monterey County
26.5% of women with births in Monterey County are unmarried. Women with the educational attainment of graduate degree are most likely to be married with 90.6% of them married at childbirth, while women with the educational attainment of high school diploma are least likely to be married with 41.0% of them unmarried at childbirth.
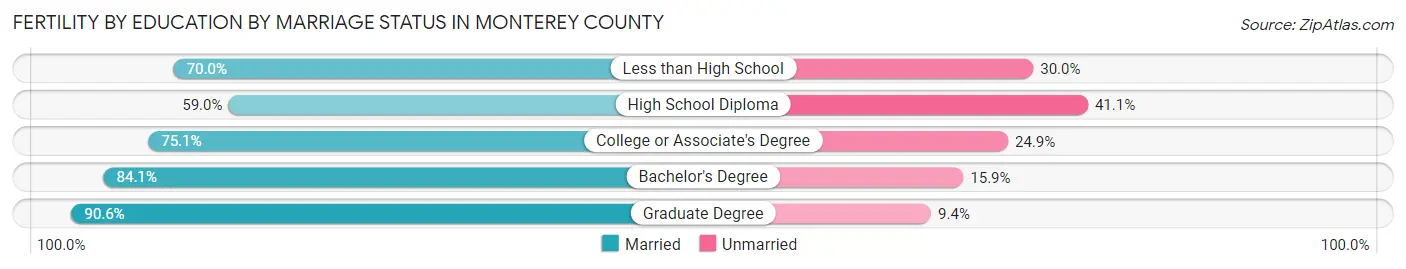
| Educational Attainment | Married | Unmarried |
| Less than High School | 706 (70.0%) | 303 (30.0%) |
| High School Diploma | 517 (59.0%) | 360 (41.0%) |
| College or Associate's Degree | 1,042 (75.1%) | 346 (24.9%) |
| Bachelor's Degree | 649 (84.1%) | 123 (15.9%) |
| Graduate Degree | 307 (90.6%) | 32 (9.4%) |
| Total | 3,223 (73.5%) | 1,162 (26.5%) |
Employment Characteristics in Monterey County
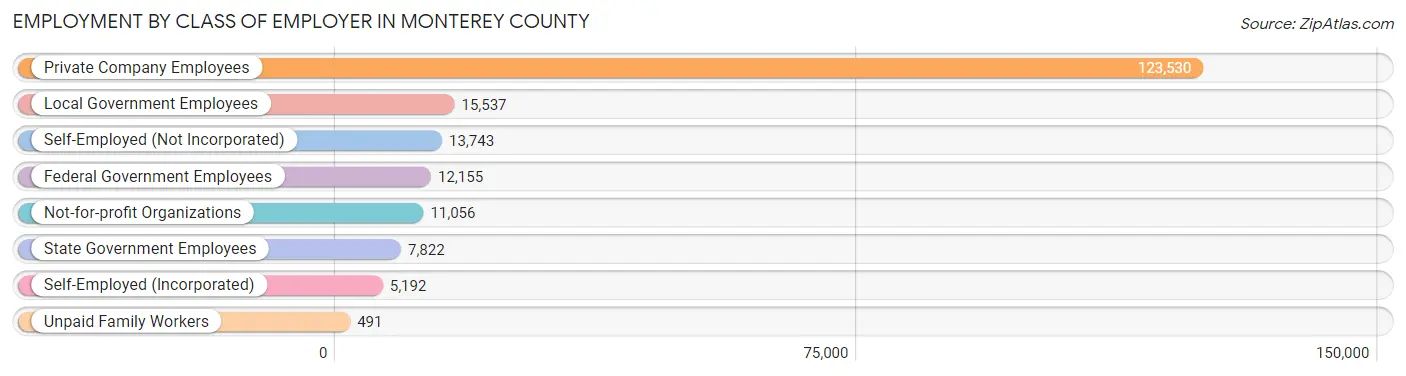
Employment by Class of Employer in Monterey County
Among the 189,526 employed individuals in Monterey County, private company employees (123,530 | 65.2%), local government employees (15,537 | 8.2%), and self-employed (not incorporated) (13,743 | 7.2%) make up the most common classes of employment.
| Employer Class | # Employees | % Employees |
| Private Company Employees | 123,530 | 65.2% |
| Self-Employed (Incorporated) | 5,192 | 2.7% |
| Self-Employed (Not Incorporated) | 13,743 | 7.2% |
| Not-for-profit Organizations | 11,056 | 5.8% |
| Local Government Employees | 15,537 | 8.2% |
| State Government Employees | 7,822 | 4.1% |
| Federal Government Employees | 12,155 | 6.4% |
| Unpaid Family Workers | 491 | 0.3% |
| Total | 189,526 | 100.0% |
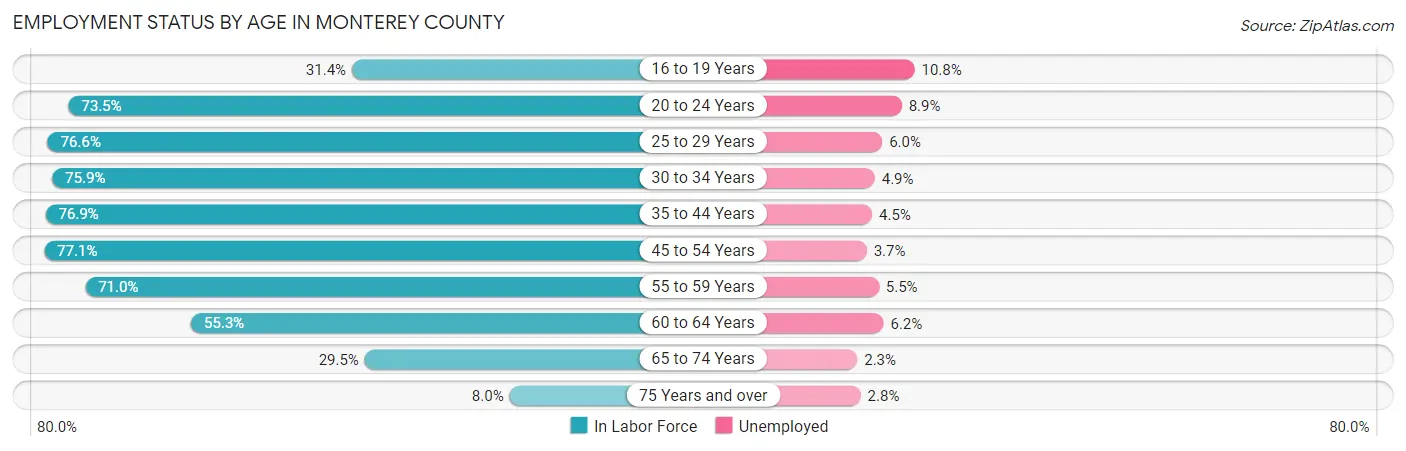
Employment Status by Age in Monterey County
According to the labor force statistics for Monterey County, out of the total population over 16 years of age (336,819), 60.6% or 204,112 individuals are in the labor force, with 5.3% or 10,818 of them unemployed. The age group with the highest labor force participation rate is 45 to 54 years, with 77.1% or 39,419 individuals in the labor force. Within the labor force, the 16 to 19 years age range has the highest percentage of unemployed individuals, with 10.8% or 877 of them being unemployed.
| Age Bracket | In Labor Force | Unemployed |
| 16 to 19 Years | 8,122 (31.4%) | 877 (10.8%) |
| 20 to 24 Years | 22,946 (73.5%) | 2,042 (8.9%) |
| 25 to 29 Years | 23,106 (76.6%) | 1,386 (6.0%) |
| 30 to 34 Years | 22,831 (75.9%) | 1,119 (4.9%) |
| 35 to 44 Years | 44,335 (76.9%) | 1,995 (4.5%) |
| 45 to 54 Years | 39,419 (77.1%) | 1,459 (3.7%) |
| 55 to 59 Years | 17,836 (71.0%) | 981 (5.5%) |
| 60 to 64 Years | 12,833 (55.3%) | 796 (6.2%) |
| 65 to 74 Years | 10,811 (29.5%) | 249 (2.3%) |
| 75 Years and over | 2,059 (8.0%) | 58 (2.8%) |
| Total | 204,112 (60.6%) | 10,818 (5.3%) |
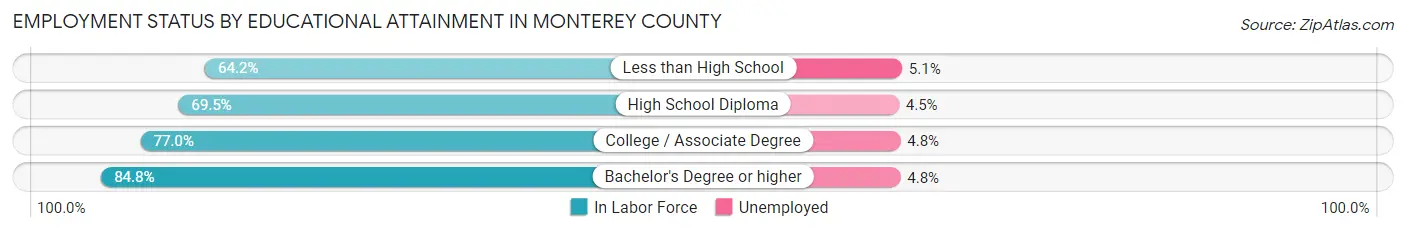
Employment Status by Educational Attainment in Monterey County
According to labor force statistics for Monterey County, 73.8% of individuals (160,407) out of the total population between 25 and 64 years of age (217,353) are in the labor force, with 4.8% or 7,700 of them being unemployed. The group with the highest labor force participation rate are those with the educational attainment of bachelor's degree or higher, with 84.8% or 46,025 individuals in the labor force. Within the labor force, individuals with less than high school education have the highest percentage of unemployment, with 5.1% or 1,990 of them being unemployed.
| Educational Attainment | In Labor Force | Unemployed |
| Less than High School | 39,014 (64.2%) | 3,099 (5.1%) |
| High School Diploma | 32,356 (69.5%) | 2,095 (4.5%) |
| College / Associate Degree | 42,931 (77.0%) | 2,676 (4.8%) |
| Bachelor's Degree or higher | 46,025 (84.8%) | 2,605 (4.8%) |
| Total | 160,407 (73.8%) | 10,433 (4.8%) |
Employment Occupations by Sex in Monterey County
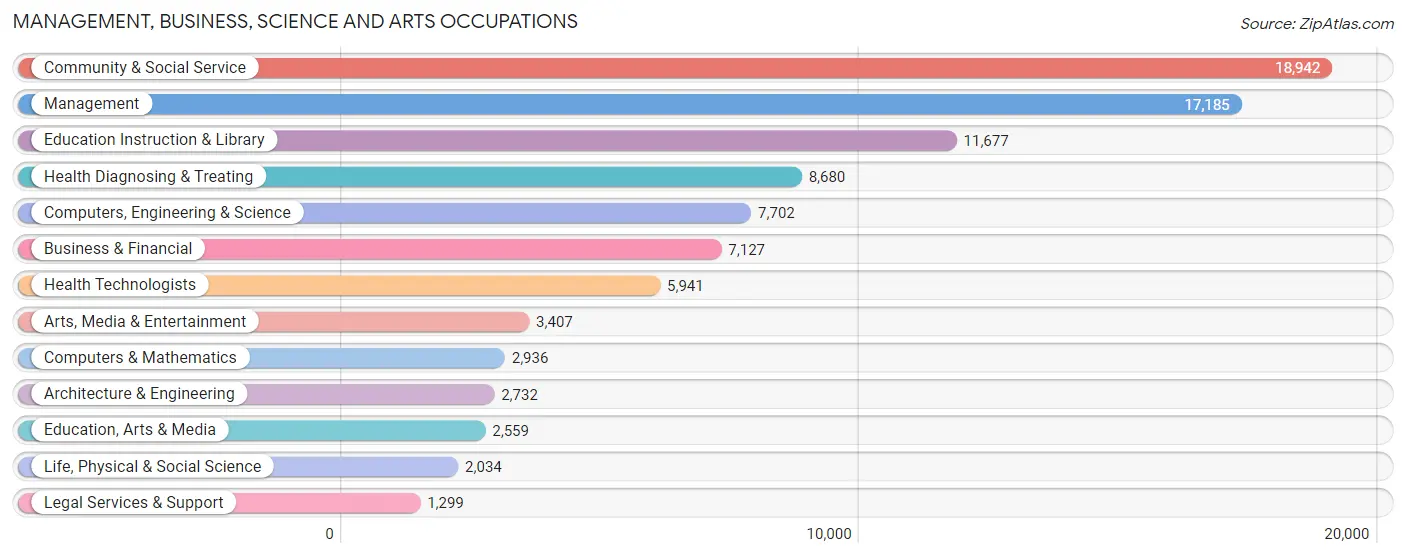
Management, Business, Science and Arts Occupations
The most common Management, Business, Science and Arts occupations in Monterey County are Community & Social Service (18,942 | 10.1%), Management (17,185 | 9.2%), Education Instruction & Library (11,677 | 6.2%), Health Diagnosing & Treating (8,680 | 4.6%), and Computers, Engineering & Science (7,702 | 4.1%).
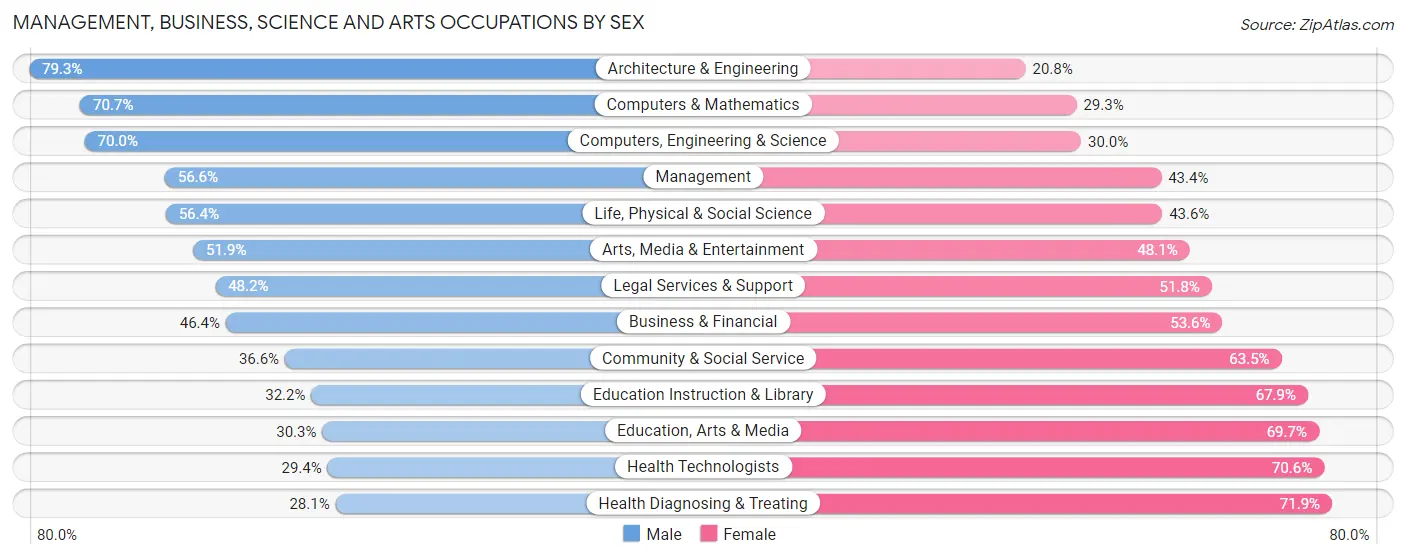
Management, Business, Science and Arts Occupations by Sex
Within the Management, Business, Science and Arts occupations in Monterey County, the most male-oriented occupations are Architecture & Engineering (79.2%), Computers & Mathematics (70.7%), and Computers, Engineering & Science (70.0%), while the most female-oriented occupations are Health Diagnosing & Treating (71.9%), Health Technologists (70.6%), and Education, Arts & Media (69.7%).
| Occupation | Male | Female |
| Management | 9,726 (56.6%) | 7,459 (43.4%) |
| Business & Financial | 3,308 (46.4%) | 3,819 (53.6%) |
| Computers, Engineering & Science | 5,390 (70.0%) | 2,312 (30.0%) |
| Computers & Mathematics | 2,077 (70.7%) | 859 (29.3%) |
| Architecture & Engineering | 2,165 (79.2%) | 567 (20.7%) |
| Life, Physical & Social Science | 1,148 (56.4%) | 886 (43.6%) |
| Community & Social Service | 6,924 (36.5%) | 12,018 (63.4%) |
| Education, Arts & Media | 776 (30.3%) | 1,783 (69.7%) |
| Legal Services & Support | 626 (48.2%) | 673 (51.8%) |
| Education Instruction & Library | 3,754 (32.2%) | 7,923 (67.8%) |
| Arts, Media & Entertainment | 1,768 (51.9%) | 1,639 (48.1%) |
| Health Diagnosing & Treating | 2,441 (28.1%) | 6,239 (71.9%) |
| Health Technologists | 1,749 (29.4%) | 4,192 (70.6%) |
| Total (Category) | 27,789 (46.6%) | 31,847 (53.4%) |
| Total (Overall) | 103,264 (55.1%) | 84,238 (44.9%) |
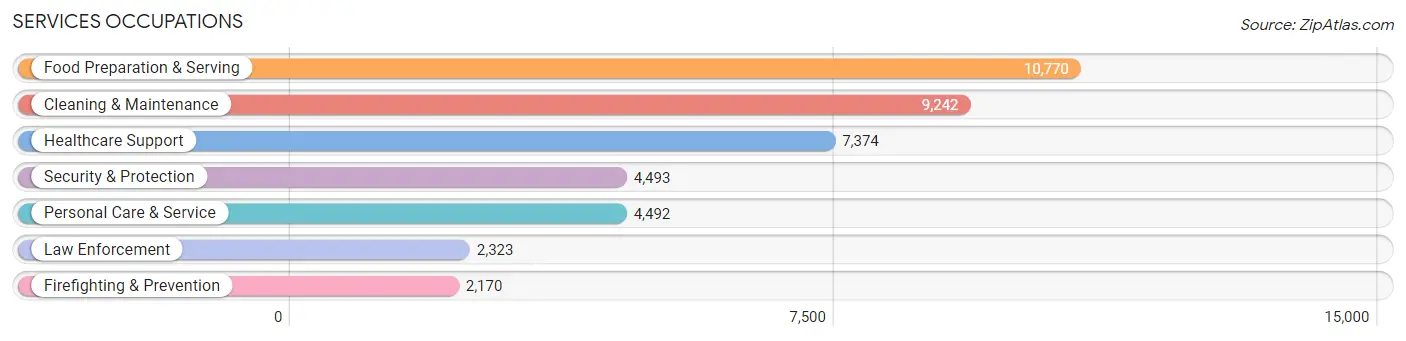
Services Occupations
The most common Services occupations in Monterey County are Food Preparation & Serving (10,770 | 5.7%), Cleaning & Maintenance (9,242 | 4.9%), Healthcare Support (7,374 | 3.9%), Security & Protection (4,493 | 2.4%), and Personal Care & Service (4,492 | 2.4%).
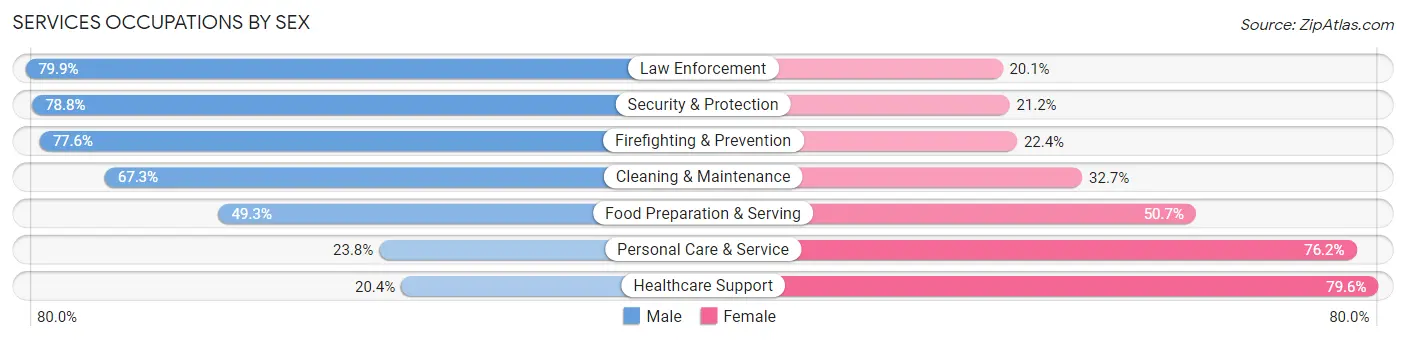
Services Occupations by Sex
Within the Services occupations in Monterey County, the most male-oriented occupations are Law Enforcement (79.9%), Security & Protection (78.8%), and Firefighting & Prevention (77.6%), while the most female-oriented occupations are Healthcare Support (79.6%), Personal Care & Service (76.2%), and Food Preparation & Serving (50.7%).
| Occupation | Male | Female |
| Healthcare Support | 1,501 (20.4%) | 5,873 (79.6%) |
| Security & Protection | 3,540 (78.8%) | 953 (21.2%) |
| Firefighting & Prevention | 1,684 (77.6%) | 486 (22.4%) |
| Law Enforcement | 1,856 (79.9%) | 467 (20.1%) |
| Food Preparation & Serving | 5,307 (49.3%) | 5,463 (50.7%) |
| Cleaning & Maintenance | 6,218 (67.3%) | 3,024 (32.7%) |
| Personal Care & Service | 1,071 (23.8%) | 3,421 (76.2%) |
| Total (Category) | 17,637 (48.5%) | 18,734 (51.5%) |
| Total (Overall) | 103,264 (55.1%) | 84,238 (44.9%) |
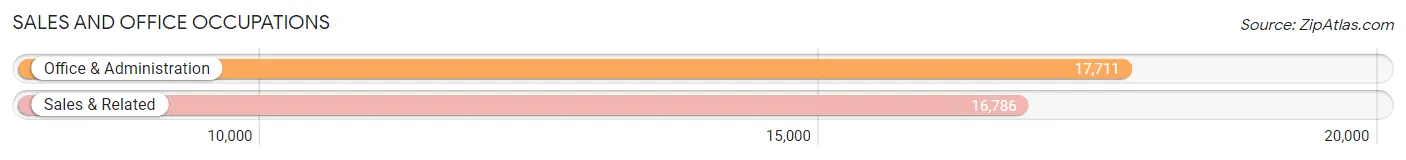
Sales and Office Occupations
The most common Sales and Office occupations in Monterey County are Office & Administration (17,711 | 9.5%), and Sales & Related (16,786 | 8.9%).
Sales and Office Occupations by Sex
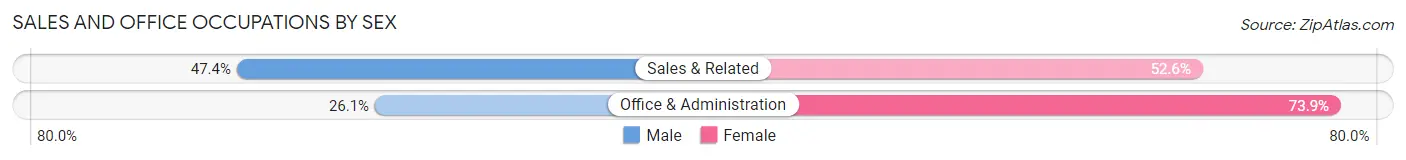
| Occupation | Male | Female |
| Sales & Related | 7,950 (47.4%) | 8,836 (52.6%) |
| Office & Administration | 4,623 (26.1%) | 13,088 (73.9%) |
| Total (Category) | 12,573 (36.4%) | 21,924 (63.5%) |
| Total (Overall) | 103,264 (55.1%) | 84,238 (44.9%) |
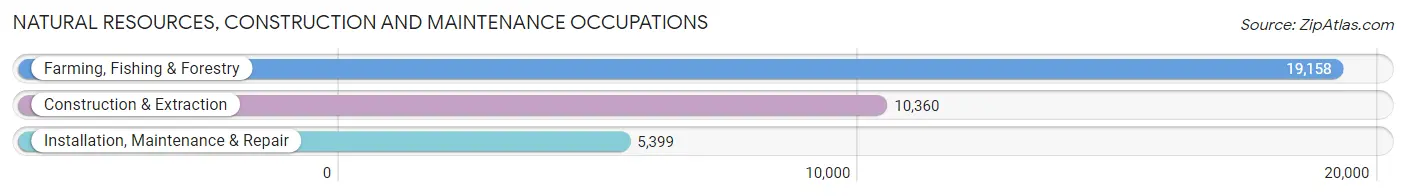
Natural Resources, Construction and Maintenance Occupations
The most common Natural Resources, Construction and Maintenance occupations in Monterey County are Farming, Fishing & Forestry (19,158 | 10.2%), Construction & Extraction (10,360 | 5.5%), and Installation, Maintenance & Repair (5,399 | 2.9%).
Natural Resources, Construction and Maintenance Occupations by Sex
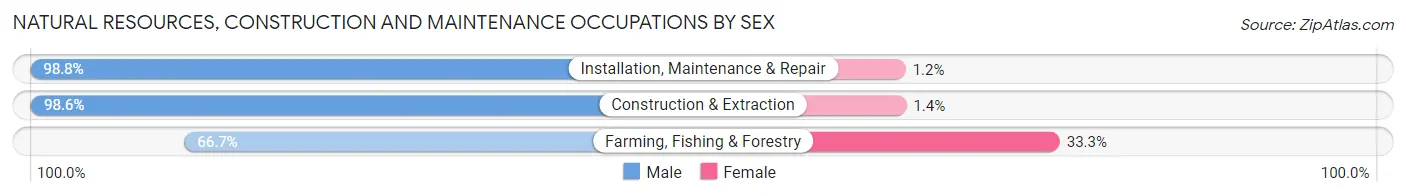
| Occupation | Male | Female |
| Farming, Fishing & Forestry | 12,787 (66.7%) | 6,371 (33.3%) |
| Construction & Extraction | 10,219 (98.6%) | 141 (1.4%) |
| Installation, Maintenance & Repair | 5,334 (98.8%) | 65 (1.2%) |
| Total (Category) | 28,340 (81.2%) | 6,577 (18.8%) |
| Total (Overall) | 103,264 (55.1%) | 84,238 (44.9%) |
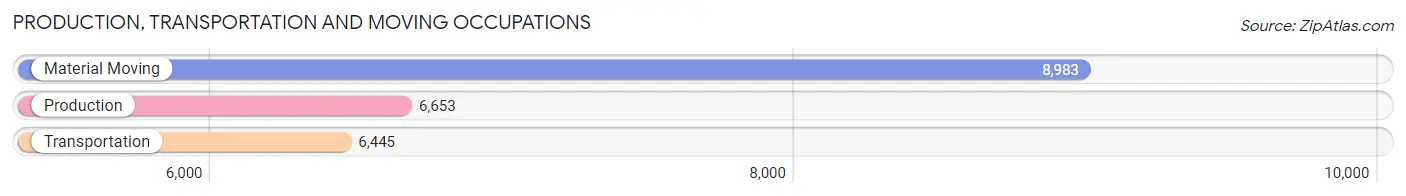
Production, Transportation and Moving Occupations
The most common Production, Transportation and Moving occupations in Monterey County are Material Moving (8,983 | 4.8%), Production (6,653 | 3.5%), and Transportation (6,445 | 3.4%).
Production, Transportation and Moving Occupations by Sex
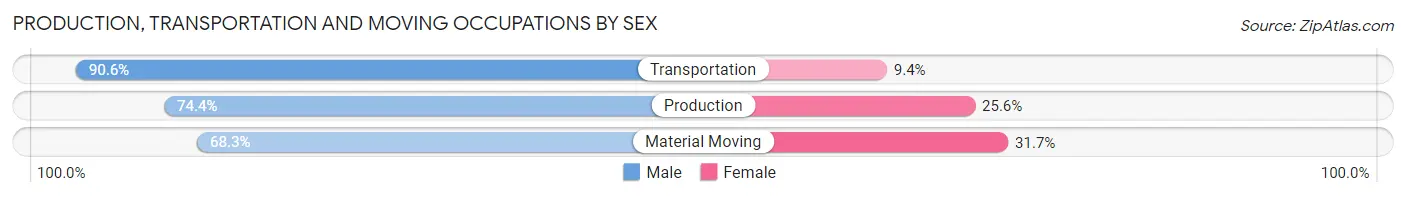
| Occupation | Male | Female |
| Production | 4,949 (74.4%) | 1,704 (25.6%) |
| Transportation | 5,838 (90.6%) | 607 (9.4%) |
| Material Moving | 6,138 (68.3%) | 2,845 (31.7%) |
| Total (Category) | 16,925 (76.6%) | 5,156 (23.4%) |
| Total (Overall) | 103,264 (55.1%) | 84,238 (44.9%) |
Employment Industries by Sex in Monterey County
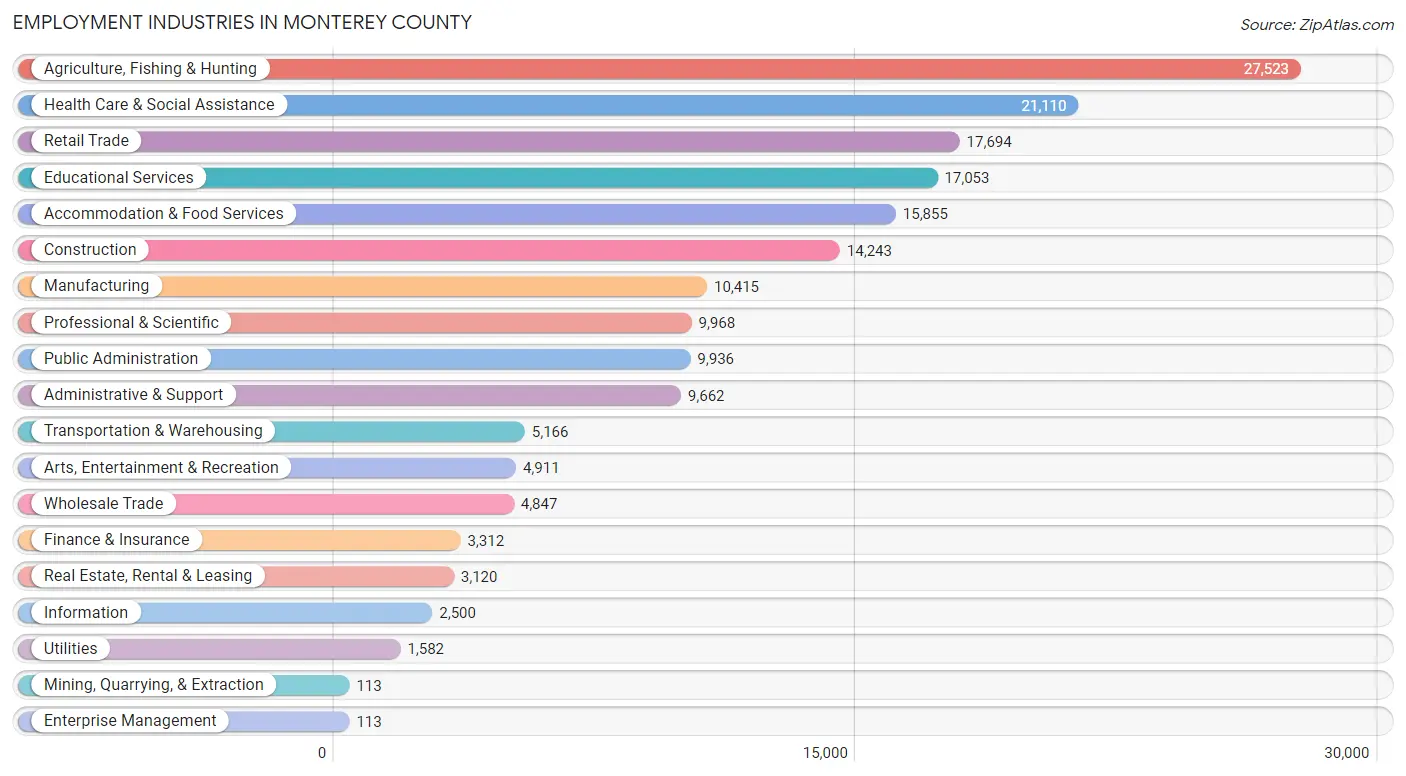
Employment Industries in Monterey County
The major employment industries in Monterey County include Agriculture, Fishing & Hunting (27,523 | 14.7%), Health Care & Social Assistance (21,110 | 11.3%), Retail Trade (17,694 | 9.4%), Educational Services (17,053 | 9.1%), and Accommodation & Food Services (15,855 | 8.5%).
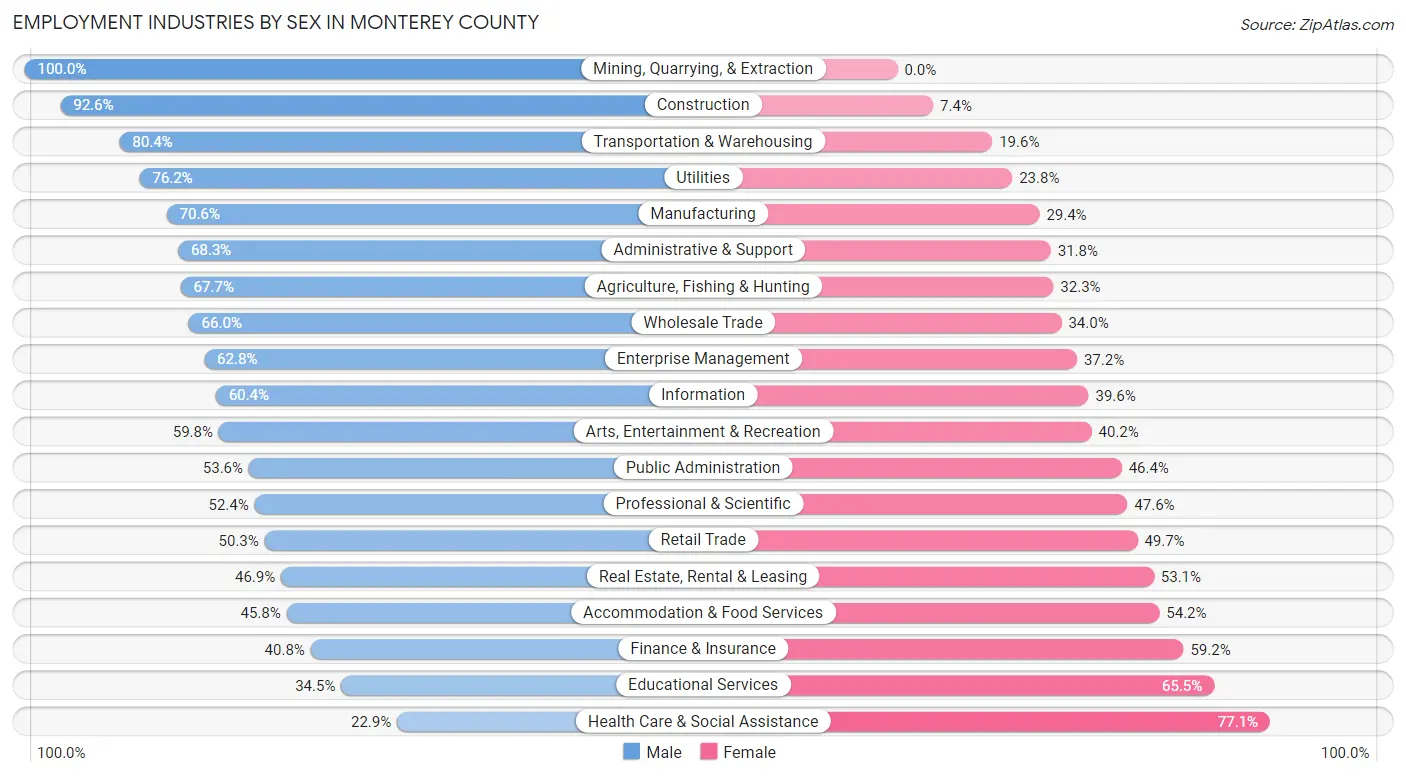
Employment Industries by Sex in Monterey County
The Monterey County industries that see more men than women are Mining, Quarrying, & Extraction (100.0%), Construction (92.6%), and Transportation & Warehousing (80.4%), whereas the industries that tend to have a higher number of women are Health Care & Social Assistance (77.1%), Educational Services (65.5%), and Finance & Insurance (59.2%).
| Industry | Male | Female |
| Agriculture, Fishing & Hunting | 18,637 (67.7%) | 8,886 (32.3%) |
| Mining, Quarrying, & Extraction | 113 (100.0%) | 0 (0.0%) |
| Construction | 13,189 (92.6%) | 1,054 (7.4%) |
| Manufacturing | 7,353 (70.6%) | 3,062 (29.4%) |
| Wholesale Trade | 3,201 (66.0%) | 1,646 (34.0%) |
| Retail Trade | 8,904 (50.3%) | 8,790 (49.7%) |
| Transportation & Warehousing | 4,152 (80.4%) | 1,014 (19.6%) |
| Utilities | 1,206 (76.2%) | 376 (23.8%) |
| Information | 1,511 (60.4%) | 989 (39.6%) |
| Finance & Insurance | 1,351 (40.8%) | 1,961 (59.2%) |
| Real Estate, Rental & Leasing | 1,464 (46.9%) | 1,656 (53.1%) |
| Professional & Scientific | 5,223 (52.4%) | 4,745 (47.6%) |
| Enterprise Management | 71 (62.8%) | 42 (37.2%) |
| Administrative & Support | 6,594 (68.2%) | 3,068 (31.8%) |
| Educational Services | 5,876 (34.5%) | 11,177 (65.5%) |
| Health Care & Social Assistance | 4,836 (22.9%) | 16,274 (77.1%) |
| Arts, Entertainment & Recreation | 2,937 (59.8%) | 1,974 (40.2%) |
| Accommodation & Food Services | 7,258 (45.8%) | 8,597 (54.2%) |
| Public Administration | 5,324 (53.6%) | 4,612 (46.4%) |
| Total | 103,264 (55.1%) | 84,238 (44.9%) |
Education in Monterey County
School Enrollment in Monterey County
The most common levels of schooling among the 121,319 students in Monterey County are high school (28,696 | 23.6%), college / undergraduate (25,841 | 21.3%), and middle school (24,814 | 20.4%).
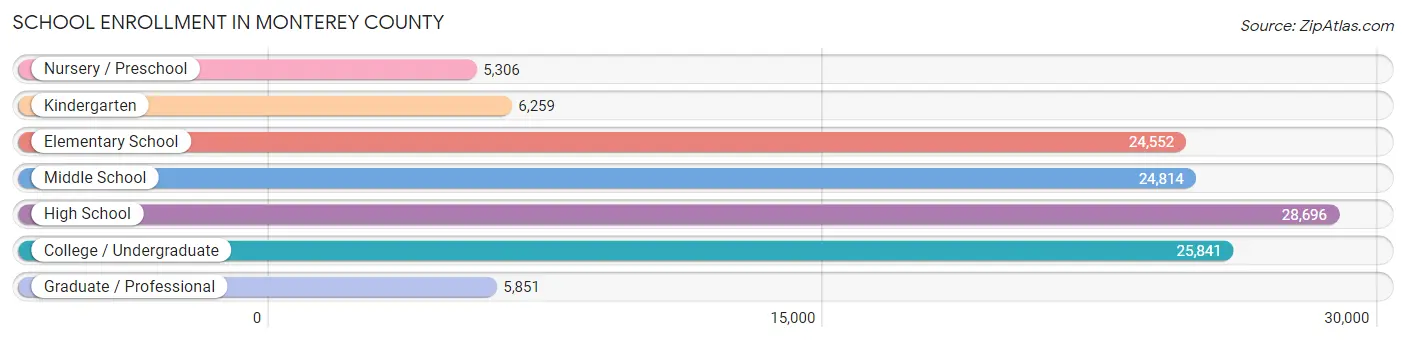
| School Level | # Students | % Students |
| Nursery / Preschool | 5,306 | 4.4% |
| Kindergarten | 6,259 | 5.2% |
| Elementary School | 24,552 | 20.2% |
| Middle School | 24,814 | 20.4% |
| High School | 28,696 | 23.6% |
| College / Undergraduate | 25,841 | 21.3% |
| Graduate / Professional | 5,851 | 4.8% |
| Total | 121,319 | 100.0% |
School Enrollment by Age by Funding Source in Monterey County
Out of a total of 121,319 students who are enrolled in schools in Monterey County, 11,283 (9.3%) attend a private institution, while the remaining 110,036 (90.7%) are enrolled in public schools. The age group of 25 to 34 year olds has the highest likelihood of being enrolled in private schools, with 1,943 (25.6% in the age bracket) enrolled. Conversely, the age group of 5 to 9 year old has the lowest likelihood of being enrolled in a private school, with 27,788 (95.0% in the age bracket) attending a public institution.
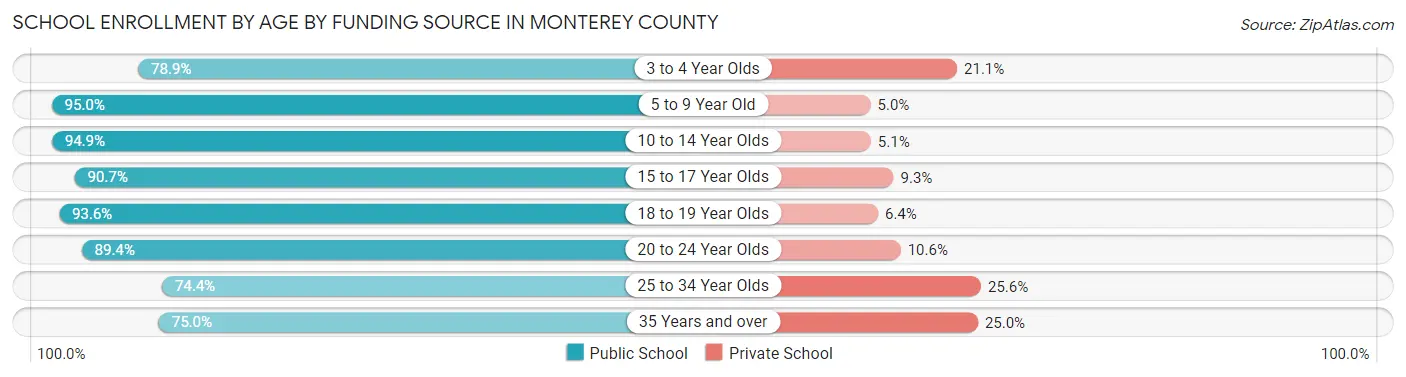
| Age Bracket | Public School | Private School |
| 3 to 4 Year Olds | 3,407 (78.9%) | 913 (21.1%) |
| 5 to 9 Year Old | 27,788 (95.0%) | 1,469 (5.0%) |
| 10 to 14 Year Olds | 31,696 (94.9%) | 1,693 (5.1%) |
| 15 to 17 Year Olds | 16,819 (90.7%) | 1,724 (9.3%) |
| 18 to 19 Year Olds | 8,785 (93.6%) | 601 (6.4%) |
| 20 to 24 Year Olds | 11,158 (89.4%) | 1,327 (10.6%) |
| 25 to 34 Year Olds | 5,651 (74.4%) | 1,943 (25.6%) |
| 35 Years and over | 4,758 (75.0%) | 1,587 (25.0%) |
| Total | 110,036 (90.7%) | 11,283 (9.3%) |
Educational Attainment by Field of Study in Monterey County
Business (11,230 | 13.8%), social sciences (8,827 | 10.8%), bio, nature & agricultural (7,501 | 9.2%), liberal arts & history (7,167 | 8.8%), and science & technology (6,552 | 8.0%) are the most common fields of study among 81,569 individuals in Monterey County who have obtained a bachelor's degree or higher.
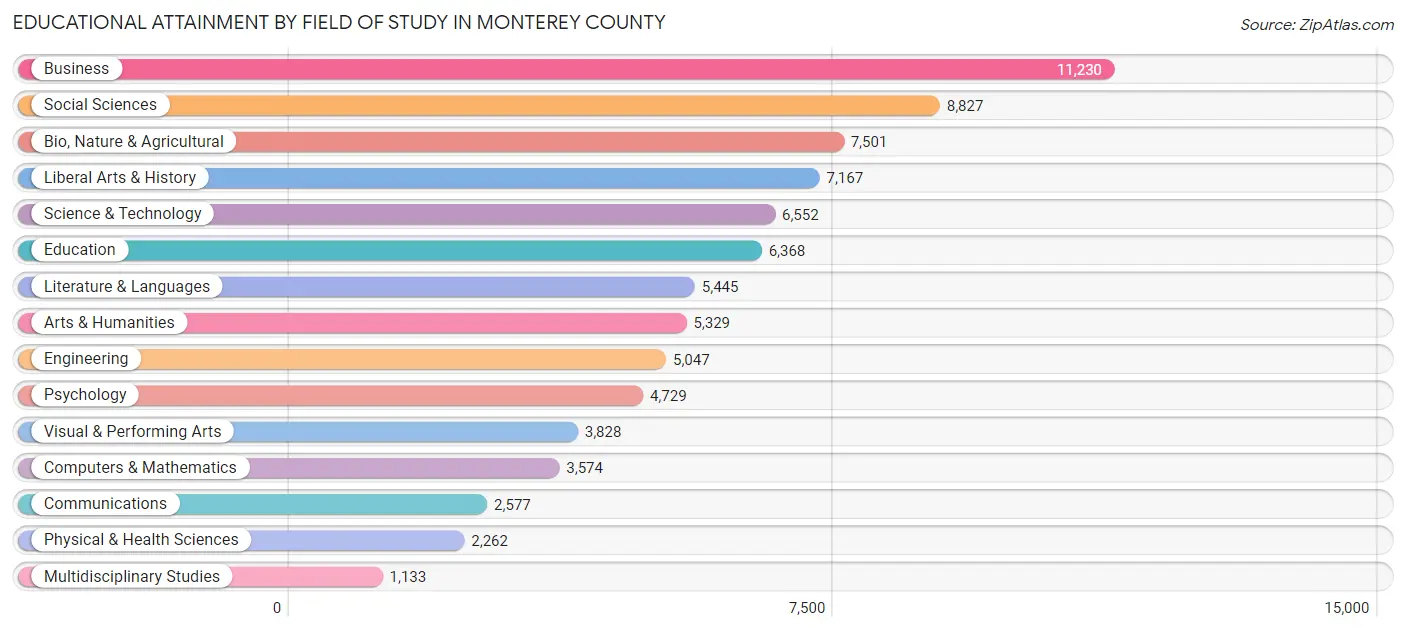
| Field of Study | # Graduates | % Graduates |
| Computers & Mathematics | 3,574 | 4.4% |
| Bio, Nature & Agricultural | 7,501 | 9.2% |
| Physical & Health Sciences | 2,262 | 2.8% |
| Psychology | 4,729 | 5.8% |
| Social Sciences | 8,827 | 10.8% |
| Engineering | 5,047 | 6.2% |
| Multidisciplinary Studies | 1,133 | 1.4% |
| Science & Technology | 6,552 | 8.0% |
| Business | 11,230 | 13.8% |
| Education | 6,368 | 7.8% |
| Literature & Languages | 5,445 | 6.7% |
| Liberal Arts & History | 7,167 | 8.8% |
| Visual & Performing Arts | 3,828 | 4.7% |
| Communications | 2,577 | 3.2% |
| Arts & Humanities | 5,329 | 6.5% |
| Total | 81,569 | 100.0% |
Transportation & Commute in Monterey County
Vehicle Availability by Sex in Monterey County
The most prevalent vehicle ownership categories in Monterey County are males with 2 vehicles (38,013, accounting for 36.9%) and females with 2 vehicles (28,263, making up 46.8%).
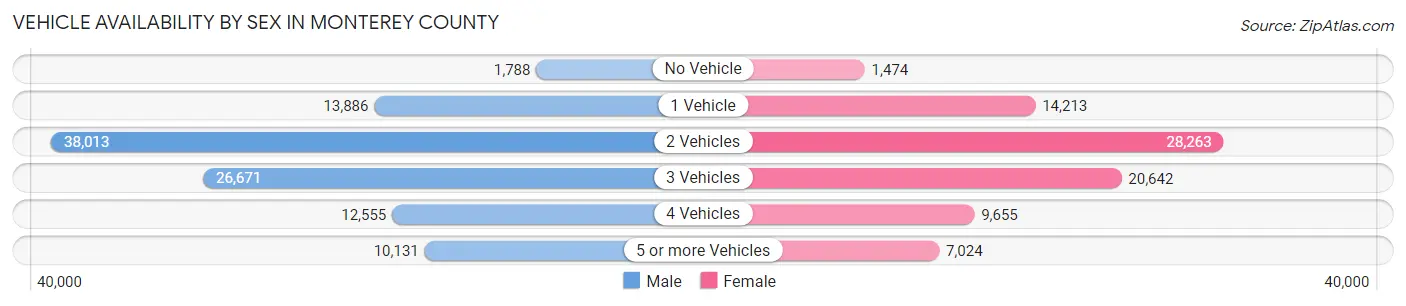
| Vehicles Available | Male | Female |
| No Vehicle | 1,788 (1.7%) | 1,474 (1.8%) |
| 1 Vehicle | 13,886 (13.5%) | 14,213 (17.5%) |
| 2 Vehicles | 38,013 (36.9%) | 28,263 (34.8%) |
| 3 Vehicles | 26,671 (25.9%) | 20,642 (25.4%) |
| 4 Vehicles | 12,555 (12.2%) | 9,655 (11.9%) |
| 5 or more Vehicles | 10,131 (9.8%) | 7,024 (8.6%) |
| Total | 103,044 (100.0%) | 81,271 (100.0%) |
Commute Time in Monterey County
The most frequently occuring commute durations in Monterey County are 20 to 24 minutes (39,659 commuters, 22.9%), 15 to 19 minutes (30,703 commuters, 17.7%), and 10 to 14 minutes (22,677 commuters, 13.1%).
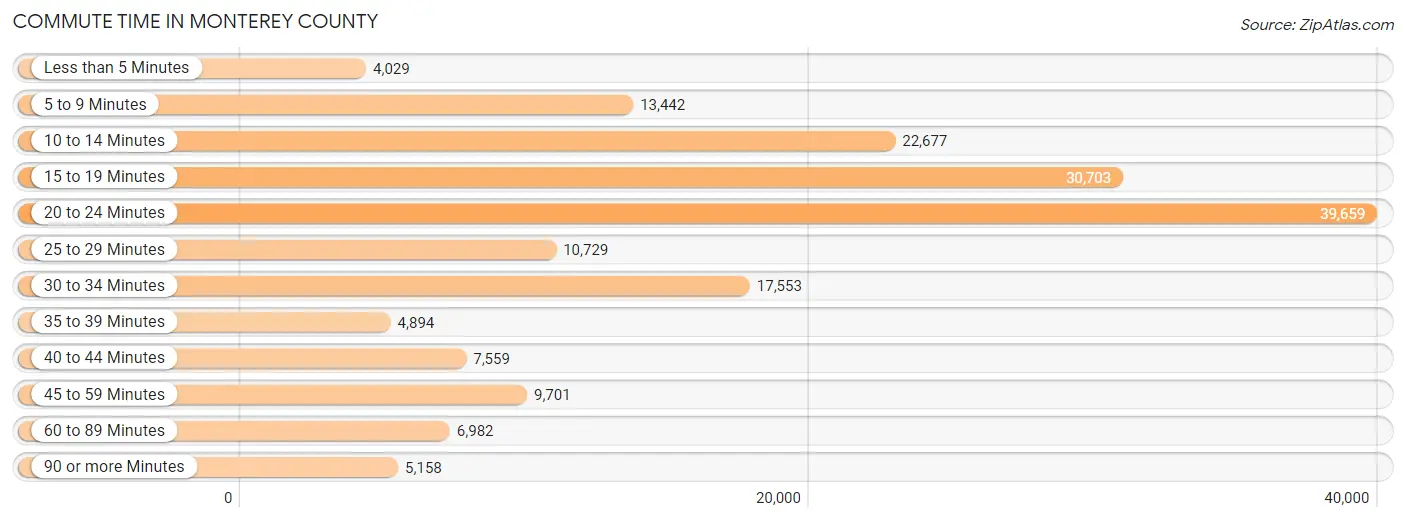
| Commute Time | # Commuters | % Commuters |
| Less than 5 Minutes | 4,029 | 2.3% |
| 5 to 9 Minutes | 13,442 | 7.8% |
| 10 to 14 Minutes | 22,677 | 13.1% |
| 15 to 19 Minutes | 30,703 | 17.7% |
| 20 to 24 Minutes | 39,659 | 22.9% |
| 25 to 29 Minutes | 10,729 | 6.2% |
| 30 to 34 Minutes | 17,553 | 10.1% |
| 35 to 39 Minutes | 4,894 | 2.8% |
| 40 to 44 Minutes | 7,559 | 4.4% |
| 45 to 59 Minutes | 9,701 | 5.6% |
| 60 to 89 Minutes | 6,982 | 4.0% |
| 90 or more Minutes | 5,158 | 3.0% |
Commute Time by Sex in Monterey County
The most common commute times in Monterey County are 20 to 24 minutes (23,471 commuters, 23.9%) for males and 20 to 24 minutes (16,188 commuters, 21.6%) for females.
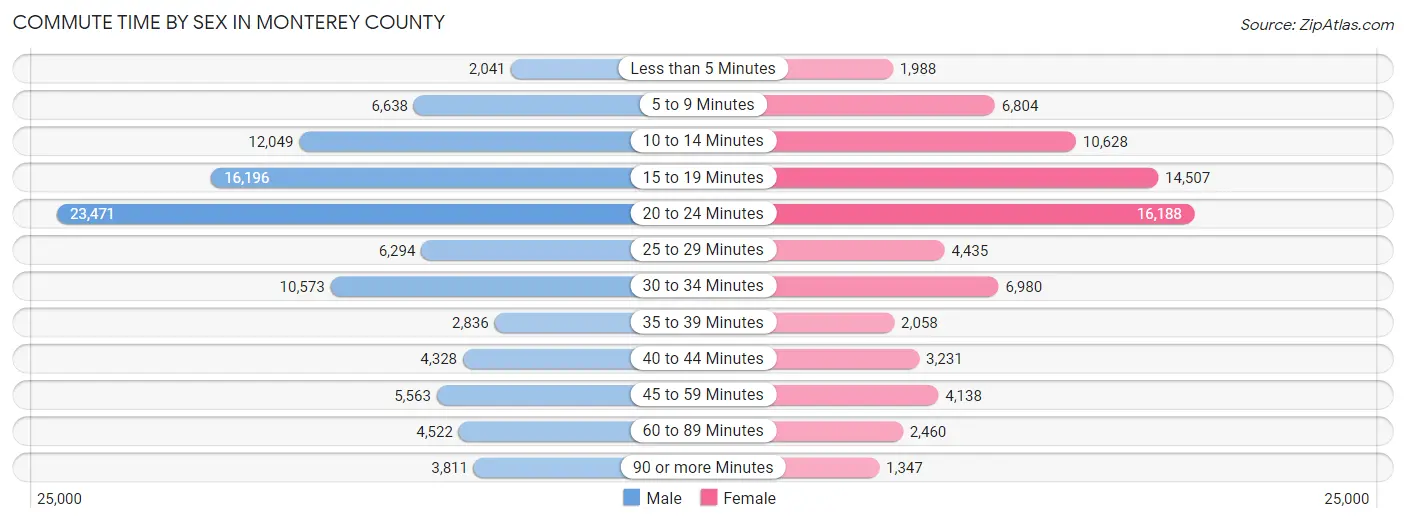
| Commute Time | Male | Female |
| Less than 5 Minutes | 2,041 (2.1%) | 1,988 (2.7%) |
| 5 to 9 Minutes | 6,638 (6.8%) | 6,804 (9.1%) |
| 10 to 14 Minutes | 12,049 (12.2%) | 10,628 (14.2%) |
| 15 to 19 Minutes | 16,196 (16.5%) | 14,507 (19.4%) |
| 20 to 24 Minutes | 23,471 (23.9%) | 16,188 (21.6%) |
| 25 to 29 Minutes | 6,294 (6.4%) | 4,435 (5.9%) |
| 30 to 34 Minutes | 10,573 (10.7%) | 6,980 (9.3%) |
| 35 to 39 Minutes | 2,836 (2.9%) | 2,058 (2.8%) |
| 40 to 44 Minutes | 4,328 (4.4%) | 3,231 (4.3%) |
| 45 to 59 Minutes | 5,563 (5.7%) | 4,138 (5.5%) |
| 60 to 89 Minutes | 4,522 (4.6%) | 2,460 (3.3%) |
| 90 or more Minutes | 3,811 (3.9%) | 1,347 (1.8%) |
Time of Departure to Work by Sex in Monterey County
The most frequent times of departure to work in Monterey County are 7:00 AM to 7:29 AM (19,347, 19.7%) for males and 7:00 AM to 7:29 AM (13,317, 17.8%) for females.
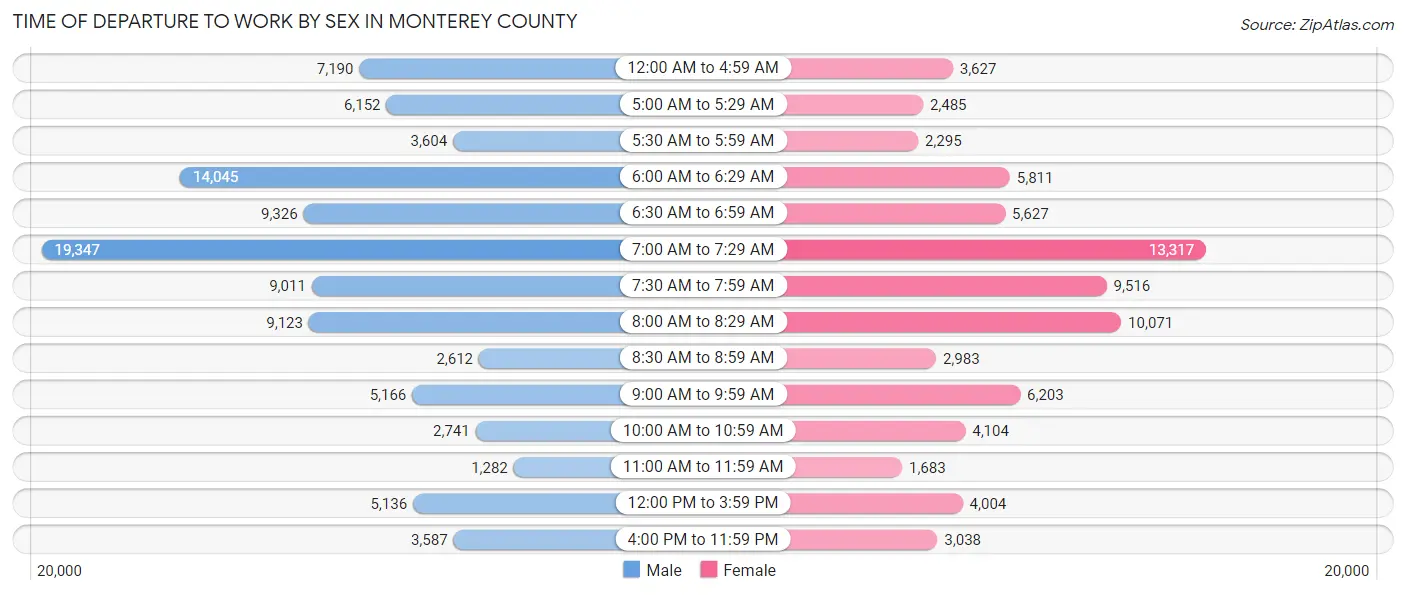
| Time of Departure | Male | Female |
| 12:00 AM to 4:59 AM | 7,190 (7.3%) | 3,627 (4.9%) |
| 5:00 AM to 5:29 AM | 6,152 (6.3%) | 2,485 (3.3%) |
| 5:30 AM to 5:59 AM | 3,604 (3.7%) | 2,295 (3.1%) |
| 6:00 AM to 6:29 AM | 14,045 (14.3%) | 5,811 (7.8%) |
| 6:30 AM to 6:59 AM | 9,326 (9.5%) | 5,627 (7.5%) |
| 7:00 AM to 7:29 AM | 19,347 (19.7%) | 13,317 (17.8%) |
| 7:30 AM to 7:59 AM | 9,011 (9.2%) | 9,516 (12.7%) |
| 8:00 AM to 8:29 AM | 9,123 (9.3%) | 10,071 (13.5%) |
| 8:30 AM to 8:59 AM | 2,612 (2.7%) | 2,983 (4.0%) |
| 9:00 AM to 9:59 AM | 5,166 (5.2%) | 6,203 (8.3%) |
| 10:00 AM to 10:59 AM | 2,741 (2.8%) | 4,104 (5.5%) |
| 11:00 AM to 11:59 AM | 1,282 (1.3%) | 1,683 (2.2%) |
| 12:00 PM to 3:59 PM | 5,136 (5.2%) | 4,004 (5.4%) |
| 4:00 PM to 11:59 PM | 3,587 (3.6%) | 3,038 (4.1%) |
| Total | 98,322 (100.0%) | 74,764 (100.0%) |
Housing Occupancy in Monterey County
Occupancy by Ownership in Monterey County
Of the total 130,973 dwellings in Monterey County, owner-occupied units account for 68,359 (52.2%), while renter-occupied units make up 62,614 (47.8%).
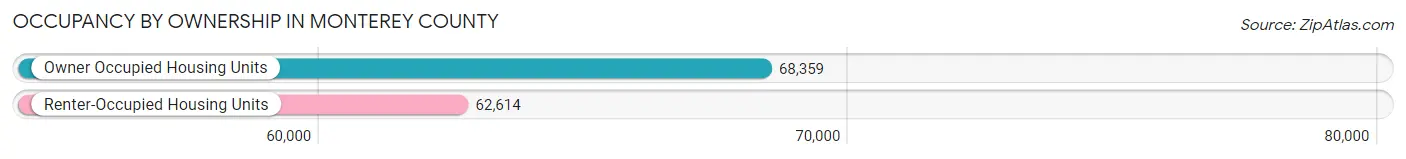
| Occupancy | # Housing Units | % Housing Units |
| Owner Occupied Housing Units | 68,359 | 52.2% |
| Renter-Occupied Housing Units | 62,614 | 47.8% |
| Total Occupied Housing Units | 130,973 | 100.0% |
Occupancy by Household Size in Monterey County
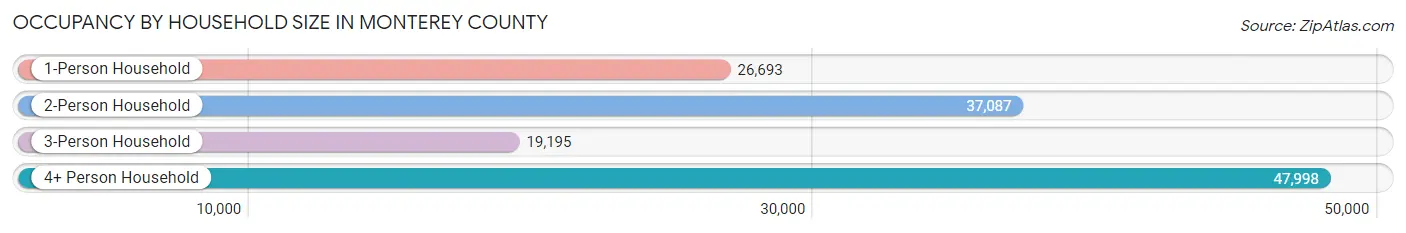
| Household Size | # Housing Units | % Housing Units |
| 1-Person Household | 26,693 | 20.4% |
| 2-Person Household | 37,087 | 28.3% |
| 3-Person Household | 19,195 | 14.7% |
| 4+ Person Household | 47,998 | 36.6% |
| Total Housing Units | 130,973 | 100.0% |
Occupancy by Ownership by Household Size in Monterey County
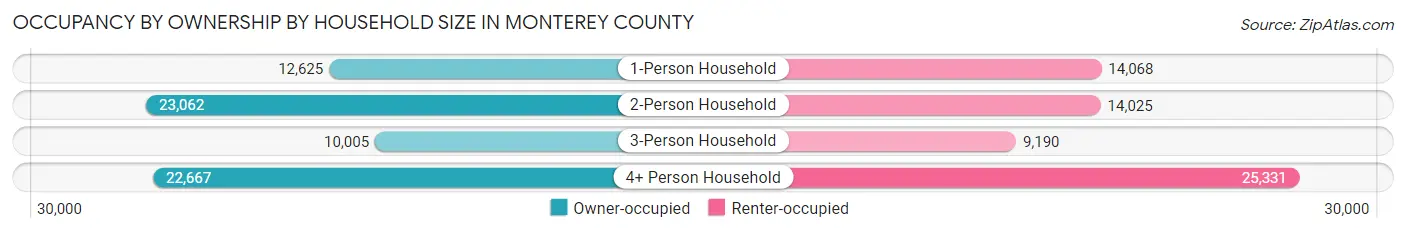
| Household Size | Owner-occupied | Renter-occupied |
| 1-Person Household | 12,625 (47.3%) | 14,068 (52.7%) |
| 2-Person Household | 23,062 (62.2%) | 14,025 (37.8%) |
| 3-Person Household | 10,005 (52.1%) | 9,190 (47.9%) |
| 4+ Person Household | 22,667 (47.2%) | 25,331 (52.8%) |
| Total Housing Units | 68,359 (52.2%) | 62,614 (47.8%) |
Occupancy by Educational Attainment in Monterey County
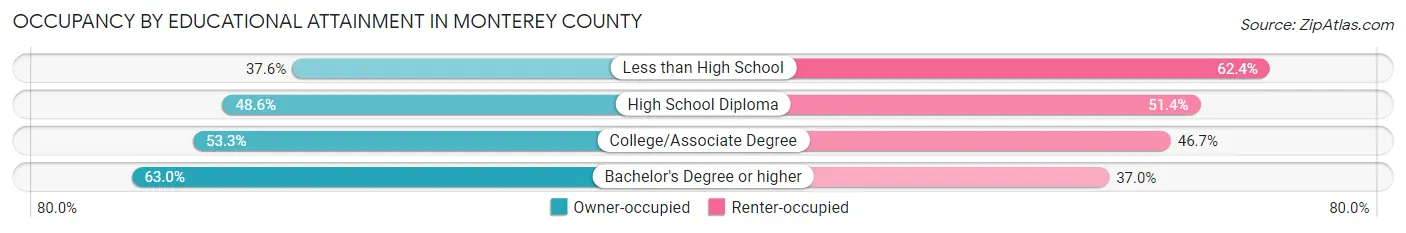
| Household Size | Owner-occupied | Renter-occupied |
| Less than High School | 11,020 (37.6%) | 18,298 (62.4%) |
| High School Diploma | 10,337 (48.6%) | 10,941 (51.4%) |
| College/Associate Degree | 20,004 (53.3%) | 17,548 (46.7%) |
| Bachelor's Degree or higher | 26,998 (63.0%) | 15,827 (37.0%) |
Occupancy by Age of Householder in Monterey County
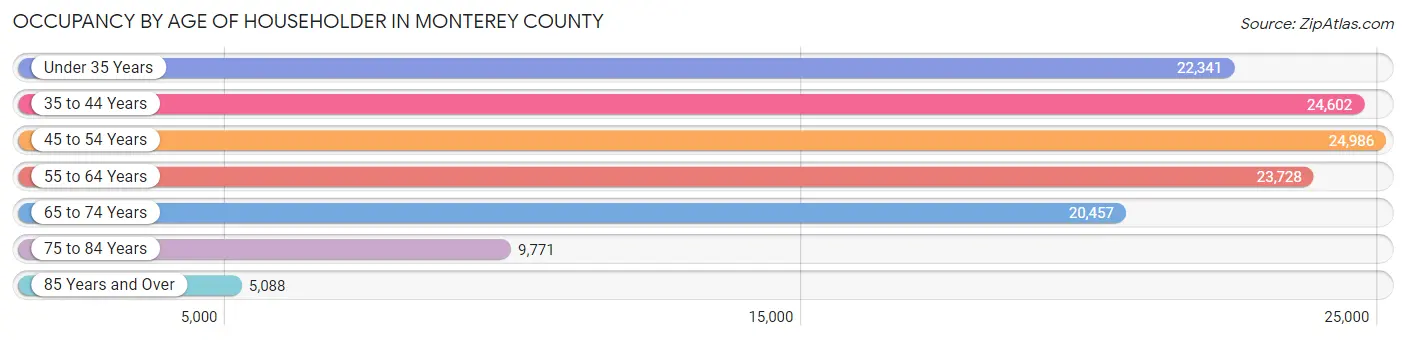
| Age Bracket | # Households | % Households |
| Under 35 Years | 22,341 | 17.1% |
| 35 to 44 Years | 24,602 | 18.8% |
| 45 to 54 Years | 24,986 | 19.1% |
| 55 to 64 Years | 23,728 | 18.1% |
| 65 to 74 Years | 20,457 | 15.6% |
| 75 to 84 Years | 9,771 | 7.5% |
| 85 Years and Over | 5,088 | 3.9% |
| Total | 130,973 | 100.0% |
Housing Finances in Monterey County
Median Income by Occupancy in Monterey County
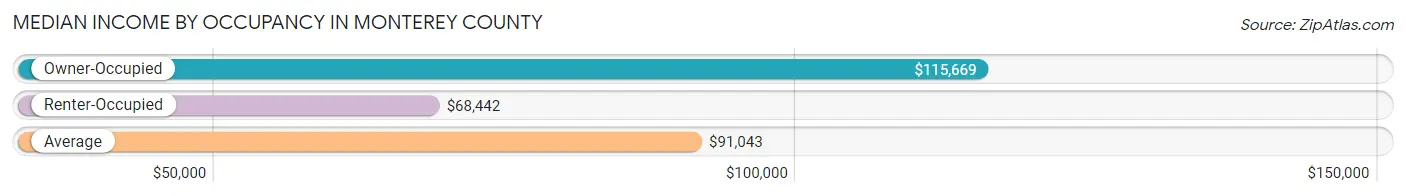
| Occupancy Type | # Households | Median Income |
| Owner-Occupied | 68,359 (52.2%) | $115,669 |
| Renter-Occupied | 62,614 (47.8%) | $68,442 |
| Average | 130,973 (100.0%) | $91,043 |
Occupancy by Householder Income Bracket in Monterey County
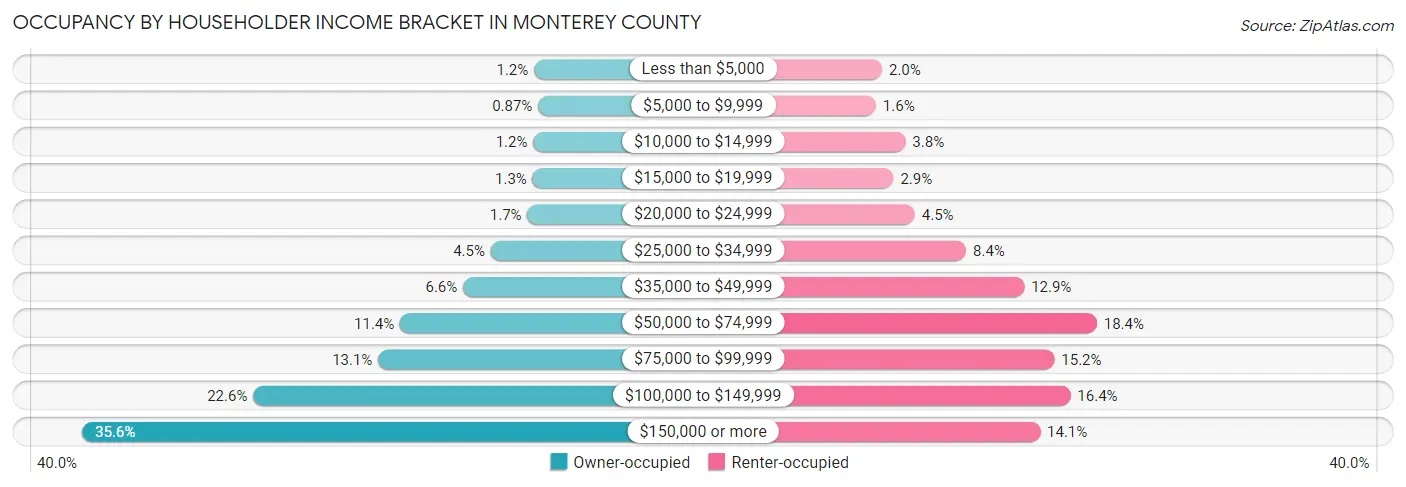
| Income Bracket | Owner-occupied | Renter-occupied |
| Less than $5,000 | 804 (1.2%) | 1,262 (2.0%) |
| $5,000 to $9,999 | 594 (0.9%) | 971 (1.5%) |
| $10,000 to $14,999 | 850 (1.2%) | 2,377 (3.8%) |
| $15,000 to $19,999 | 883 (1.3%) | 1,807 (2.9%) |
| $20,000 to $24,999 | 1,158 (1.7%) | 2,831 (4.5%) |
| $25,000 to $34,999 | 3,061 (4.5%) | 5,269 (8.4%) |
| $35,000 to $49,999 | 4,506 (6.6%) | 8,046 (12.9%) |
| $50,000 to $74,999 | 7,785 (11.4%) | 11,509 (18.4%) |
| $75,000 to $99,999 | 8,928 (13.1%) | 9,487 (15.1%) |
| $100,000 to $149,999 | 15,438 (22.6%) | 10,251 (16.4%) |
| $150,000 or more | 24,352 (35.6%) | 8,804 (14.1%) |
| Total | 68,359 (100.0%) | 62,614 (100.0%) |
Monthly Housing Cost Tiers in Monterey County
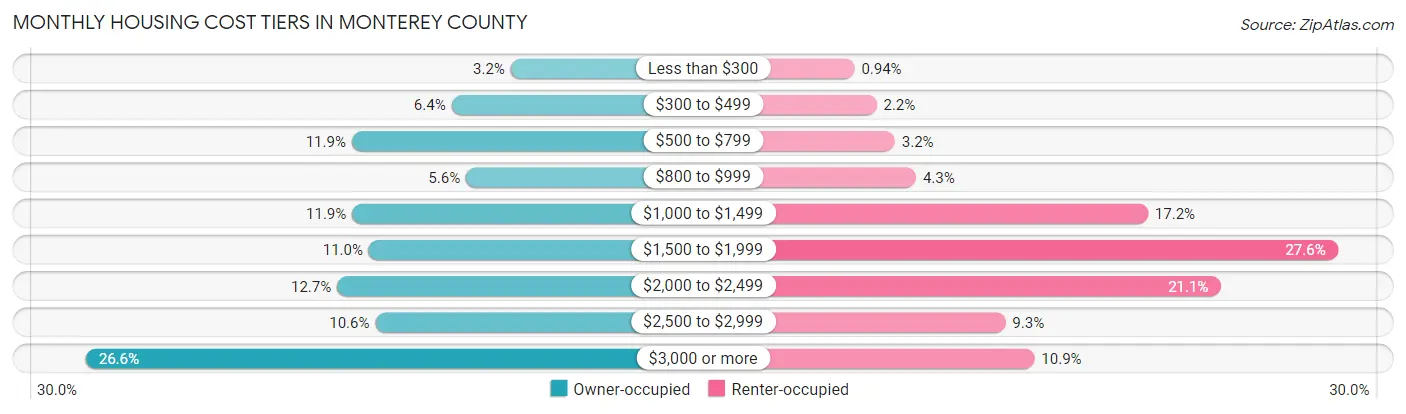
| Monthly Cost | Owner-occupied | Renter-occupied |
| Less than $300 | 2,155 (3.2%) | 590 (0.9%) |
| $300 to $499 | 4,388 (6.4%) | 1,351 (2.2%) |
| $500 to $799 | 8,152 (11.9%) | 1,983 (3.2%) |
| $800 to $999 | 3,844 (5.6%) | 2,716 (4.3%) |
| $1,000 to $1,499 | 8,140 (11.9%) | 10,739 (17.2%) |
| $1,500 to $1,999 | 7,512 (11.0%) | 17,296 (27.6%) |
| $2,000 to $2,499 | 8,709 (12.7%) | 13,239 (21.1%) |
| $2,500 to $2,999 | 7,265 (10.6%) | 5,809 (9.3%) |
| $3,000 or more | 18,194 (26.6%) | 6,811 (10.9%) |
| Total | 68,359 (100.0%) | 62,614 (100.0%) |
Physical Housing Characteristics in Monterey County
Housing Structures in Monterey County
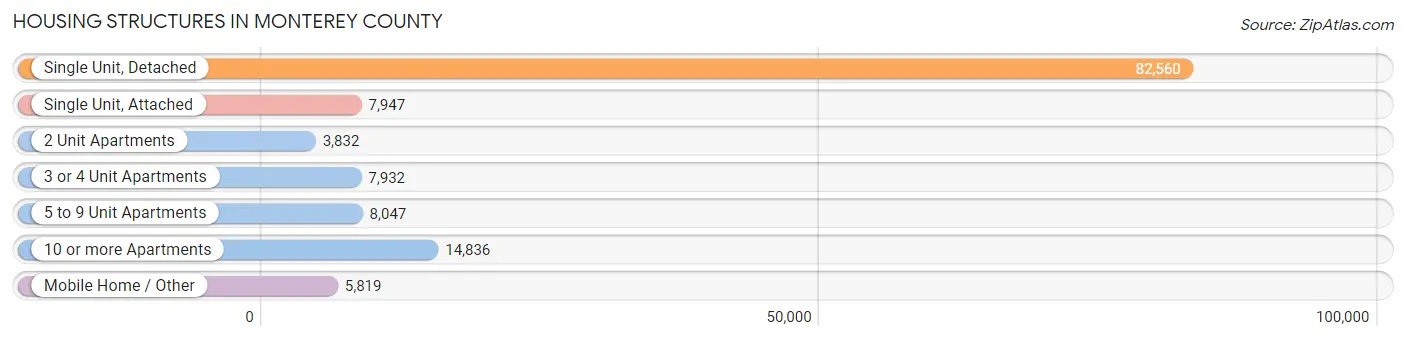
| Structure Type | # Housing Units | % Housing Units |
| Single Unit, Detached | 82,560 | 63.0% |
| Single Unit, Attached | 7,947 | 6.1% |
| 2 Unit Apartments | 3,832 | 2.9% |
| 3 or 4 Unit Apartments | 7,932 | 6.1% |
| 5 to 9 Unit Apartments | 8,047 | 6.1% |
| 10 or more Apartments | 14,836 | 11.3% |
| Mobile Home / Other | 5,819 | 4.4% |
| Total | 130,973 | 100.0% |
Housing Structures by Occupancy in Monterey County
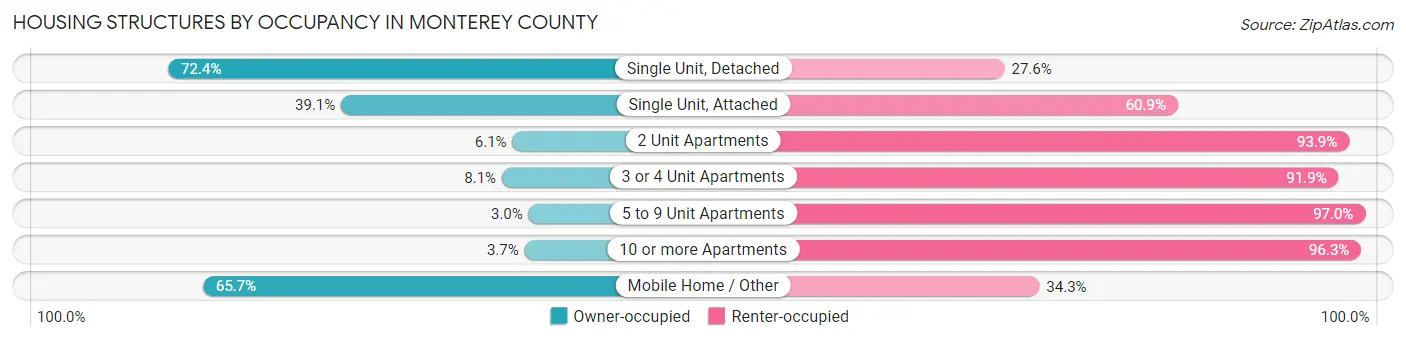
| Structure Type | Owner-occupied | Renter-occupied |
| Single Unit, Detached | 59,765 (72.4%) | 22,795 (27.6%) |
| Single Unit, Attached | 3,104 (39.1%) | 4,843 (60.9%) |
| 2 Unit Apartments | 233 (6.1%) | 3,599 (93.9%) |
| 3 or 4 Unit Apartments | 642 (8.1%) | 7,290 (91.9%) |
| 5 to 9 Unit Apartments | 238 (3.0%) | 7,809 (97.0%) |
| 10 or more Apartments | 555 (3.7%) | 14,281 (96.3%) |
| Mobile Home / Other | 3,822 (65.7%) | 1,997 (34.3%) |
| Total | 68,359 (52.2%) | 62,614 (47.8%) |
Housing Structures by Number of Rooms in Monterey County
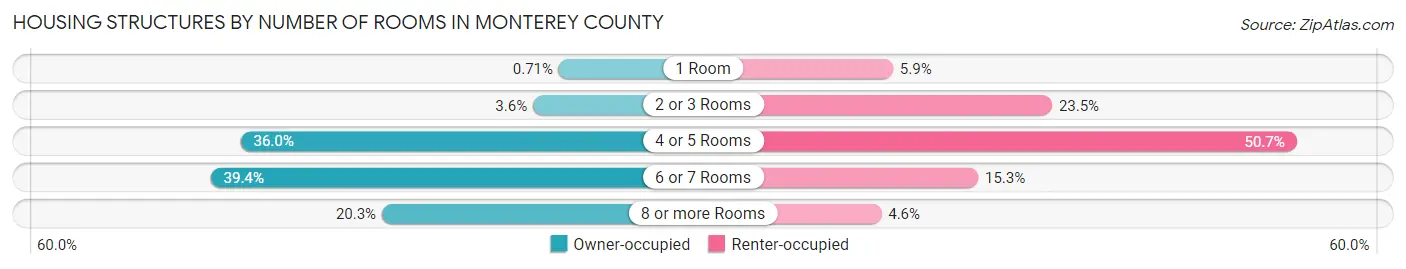
| Number of Rooms | Owner-occupied | Renter-occupied |
| 1 Room | 482 (0.7%) | 3,679 (5.9%) |
| 2 or 3 Rooms | 2,450 (3.6%) | 14,735 (23.5%) |
| 4 or 5 Rooms | 24,627 (36.0%) | 31,730 (50.7%) |
| 6 or 7 Rooms | 26,896 (39.4%) | 9,599 (15.3%) |
| 8 or more Rooms | 13,904 (20.3%) | 2,871 (4.6%) |
| Total | 68,359 (100.0%) | 62,614 (100.0%) |
Housing Structure by Heating Type in Monterey County
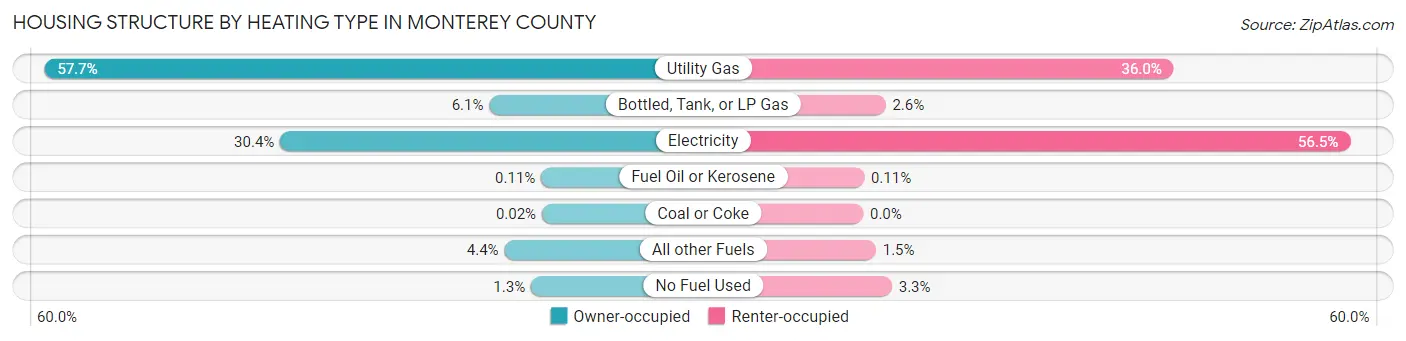
| Heating Type | Owner-occupied | Renter-occupied |
| Utility Gas | 39,453 (57.7%) | 22,545 (36.0%) |
| Bottled, Tank, or LP Gas | 4,183 (6.1%) | 1,627 (2.6%) |
| Electricity | 20,759 (30.4%) | 35,358 (56.5%) |
| Fuel Oil or Kerosene | 75 (0.1%) | 71 (0.1%) |
| Coal or Coke | 17 (0.0%) | 0 (0.0%) |
| All other Fuels | 2,990 (4.4%) | 929 (1.5%) |
| No Fuel Used | 882 (1.3%) | 2,084 (3.3%) |
| Total | 68,359 (100.0%) | 62,614 (100.0%) |
Household Vehicle Usage in Monterey County
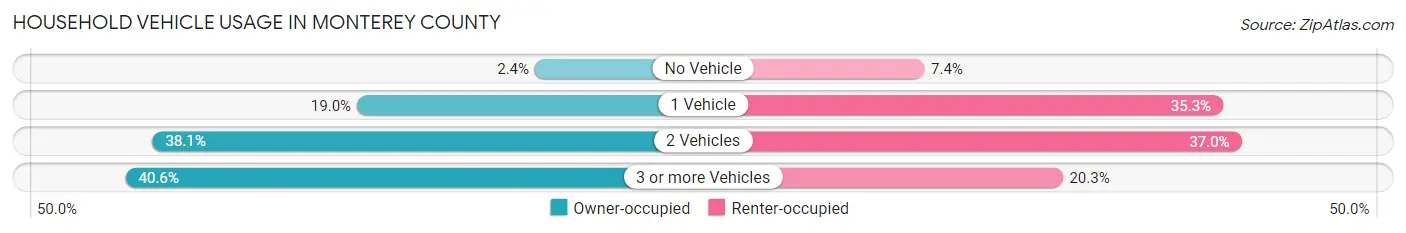
| Vehicles per Household | Owner-occupied | Renter-occupied |
| No Vehicle | 1,623 (2.4%) | 4,630 (7.4%) |
| 1 Vehicle | 12,977 (19.0%) | 22,090 (35.3%) |
| 2 Vehicles | 26,018 (38.1%) | 23,176 (37.0%) |
| 3 or more Vehicles | 27,741 (40.6%) | 12,718 (20.3%) |
| Total | 68,359 (100.0%) | 62,614 (100.0%) |
Real Estate & Mortgages in Monterey County
Real Estate and Mortgage Overview in Monterey County
| Characteristic | Without Mortgage | With Mortgage |
| Housing Units | 23,921 | 44,438 |
| Median Property Value | $666,500 | $689,900 |
| Median Household Income | $90,426 | $18,350 |
| Monthly Housing Costs | $710 | $17,443 |
| Real Estate Taxes | $3,335 | $647 |
Property Value by Mortgage Status in Monterey County
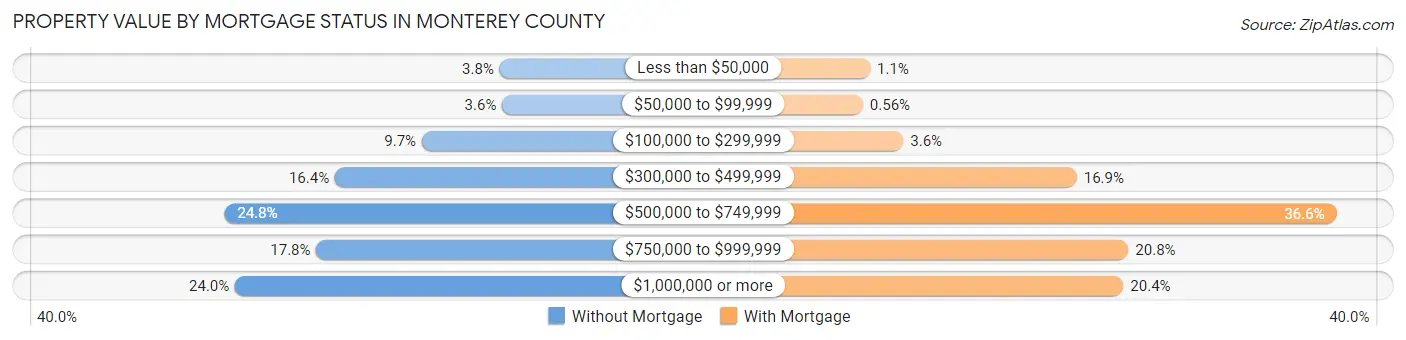
| Property Value | Without Mortgage | With Mortgage |
| Less than $50,000 | 908 (3.8%) | 495 (1.1%) |
| $50,000 to $99,999 | 864 (3.6%) | 248 (0.6%) |
| $100,000 to $299,999 | 2,328 (9.7%) | 1,618 (3.6%) |
| $300,000 to $499,999 | 3,912 (16.4%) | 7,492 (16.9%) |
| $500,000 to $749,999 | 5,928 (24.8%) | 16,280 (36.6%) |
| $750,000 to $999,999 | 4,250 (17.8%) | 9,237 (20.8%) |
| $1,000,000 or more | 5,731 (24.0%) | 9,068 (20.4%) |
| Total | 23,921 (100.0%) | 44,438 (100.0%) |
Household Income by Mortgage Status in Monterey County
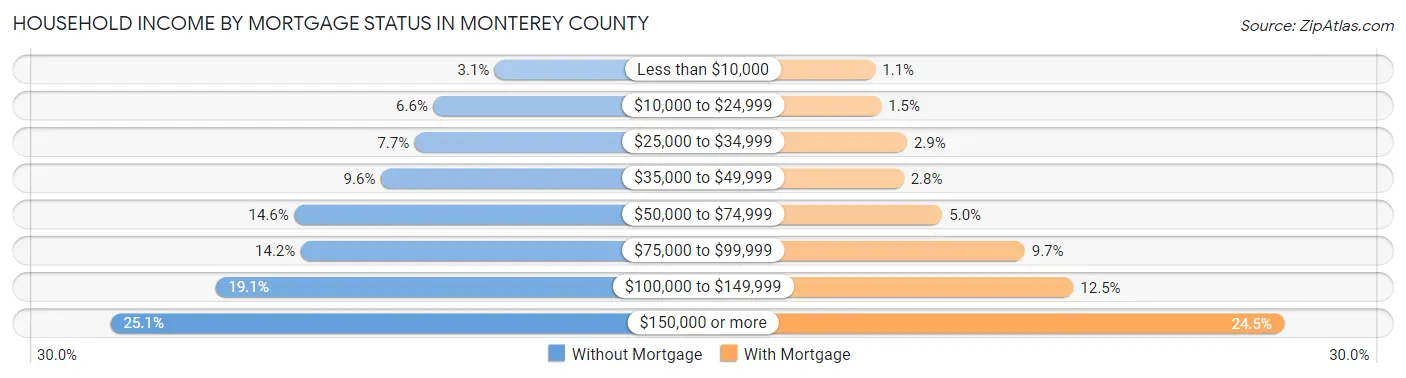
| Household Income | Without Mortgage | With Mortgage |
| Less than $10,000 | 745 (3.1%) | 503 (1.1%) |
| $10,000 to $24,999 | 1,584 (6.6%) | 653 (1.5%) |
| $25,000 to $34,999 | 1,840 (7.7%) | 1,307 (2.9%) |
| $35,000 to $49,999 | 2,302 (9.6%) | 1,221 (2.8%) |
| $50,000 to $74,999 | 3,486 (14.6%) | 2,204 (5.0%) |
| $75,000 to $99,999 | 3,396 (14.2%) | 4,299 (9.7%) |
| $100,000 to $149,999 | 4,566 (19.1%) | 5,532 (12.4%) |
| $150,000 or more | 6,002 (25.1%) | 10,872 (24.5%) |
| Total | 23,921 (100.0%) | 44,438 (100.0%) |
Property Value to Household Income Ratio in Monterey County
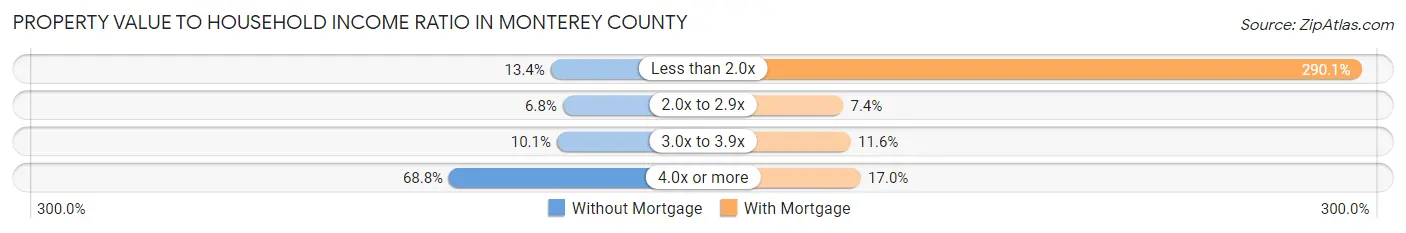
| Value-to-Income Ratio | Without Mortgage | With Mortgage |
| Less than 2.0x | 3,208 (13.4%) | 128,901 (290.1%) |
| 2.0x to 2.9x | 1,626 (6.8%) | 3,296 (7.4%) |
| 3.0x to 3.9x | 2,406 (10.1%) | 5,141 (11.6%) |
| 4.0x or more | 16,458 (68.8%) | 7,558 (17.0%) |
| Total | 23,921 (100.0%) | 44,438 (100.0%) |
Real Estate Taxes by Mortgage Status in Monterey County
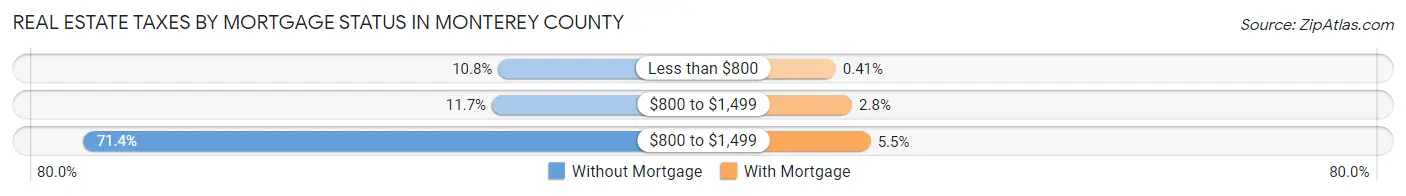
| Property Taxes | Without Mortgage | With Mortgage |
| Less than $800 | 2,583 (10.8%) | 182 (0.4%) |
| $800 to $1,499 | 2,803 (11.7%) | 1,241 (2.8%) |
| $800 to $1,499 | 17,069 (71.4%) | 2,449 (5.5%) |
| Total | 23,921 (100.0%) | 44,438 (100.0%) |
Health & Disability in Monterey County
Health Insurance Coverage by Age in Monterey County
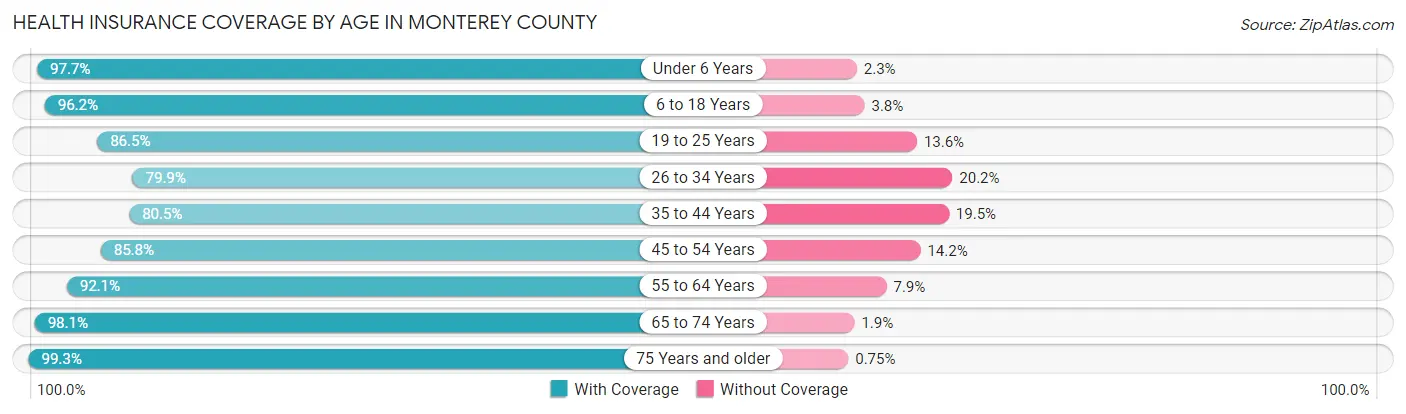
| Age Bracket | With Coverage | Without Coverage |
| Under 6 Years | 34,299 (97.7%) | 823 (2.3%) |
| 6 to 18 Years | 80,955 (96.2%) | 3,171 (3.8%) |
| 19 to 25 Years | 34,600 (86.5%) | 5,425 (13.6%) |
| 26 to 34 Years | 40,593 (79.8%) | 10,242 (20.2%) |
| 35 to 44 Years | 44,453 (80.5%) | 10,775 (19.5%) |
| 45 to 54 Years | 42,381 (85.8%) | 7,018 (14.2%) |
| 55 to 64 Years | 43,164 (92.1%) | 3,691 (7.9%) |
| 65 to 74 Years | 35,518 (98.1%) | 689 (1.9%) |
| 75 Years and older | 24,864 (99.3%) | 188 (0.7%) |
| Total | 380,827 (90.1%) | 42,022 (9.9%) |
Health Insurance Coverage by Citizenship Status in Monterey County
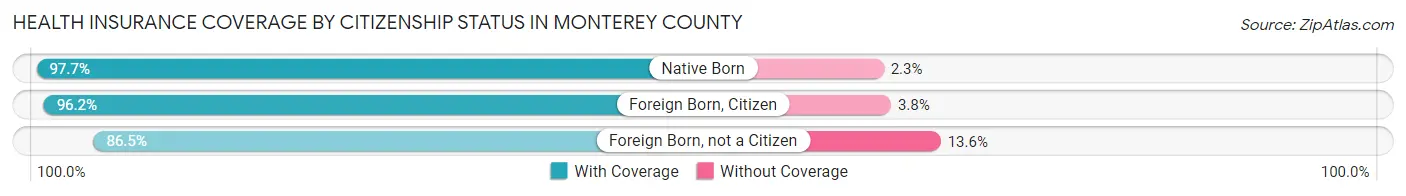
| Citizenship Status | With Coverage | Without Coverage |
| Native Born | 34,299 (97.7%) | 823 (2.3%) |
| Foreign Born, Citizen | 80,955 (96.2%) | 3,171 (3.8%) |
| Foreign Born, not a Citizen | 34,600 (86.5%) | 5,425 (13.6%) |
Health Insurance Coverage by Household Income in Monterey County
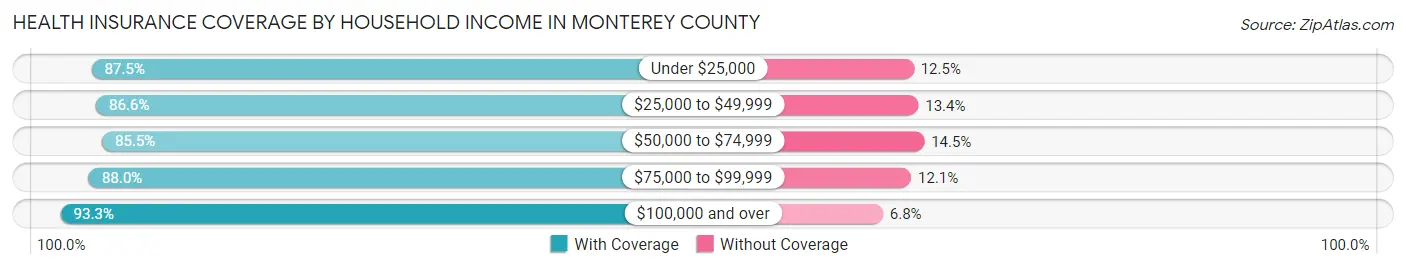
| Household Income | With Coverage | Without Coverage |
| Under $25,000 | 25,439 (87.5%) | 3,647 (12.5%) |
| $25,000 to $49,999 | 50,472 (86.6%) | 7,804 (13.4%) |
| $50,000 to $74,999 | 53,084 (85.5%) | 9,000 (14.5%) |
| $75,000 to $99,999 | 52,340 (87.9%) | 7,173 (12.0%) |
| $100,000 and over | 194,278 (93.2%) | 14,062 (6.8%) |
Public vs Private Health Insurance Coverage by Age in Monterey County
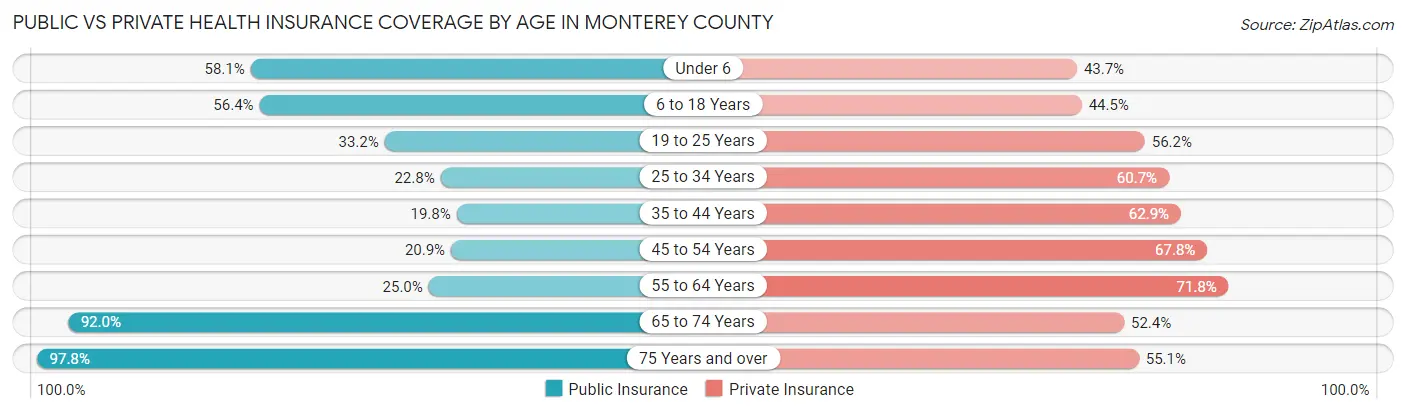
| Age Bracket | Public Insurance | Private Insurance |
| Under 6 | 20,392 (58.1%) | 15,330 (43.6%) |
| 6 to 18 Years | 47,467 (56.4%) | 37,461 (44.5%) |
| 19 to 25 Years | 13,285 (33.2%) | 22,511 (56.2%) |
| 25 to 34 Years | 11,593 (22.8%) | 30,864 (60.7%) |
| 35 to 44 Years | 10,954 (19.8%) | 34,761 (62.9%) |
| 45 to 54 Years | 10,306 (20.9%) | 33,497 (67.8%) |
| 55 to 64 Years | 11,719 (25.0%) | 33,644 (71.8%) |
| 65 to 74 Years | 33,306 (92.0%) | 18,968 (52.4%) |
| 75 Years and over | 24,490 (97.8%) | 13,811 (55.1%) |
| Total | 183,512 (43.4%) | 240,847 (57.0%) |
Disability Status by Sex by Age in Monterey County
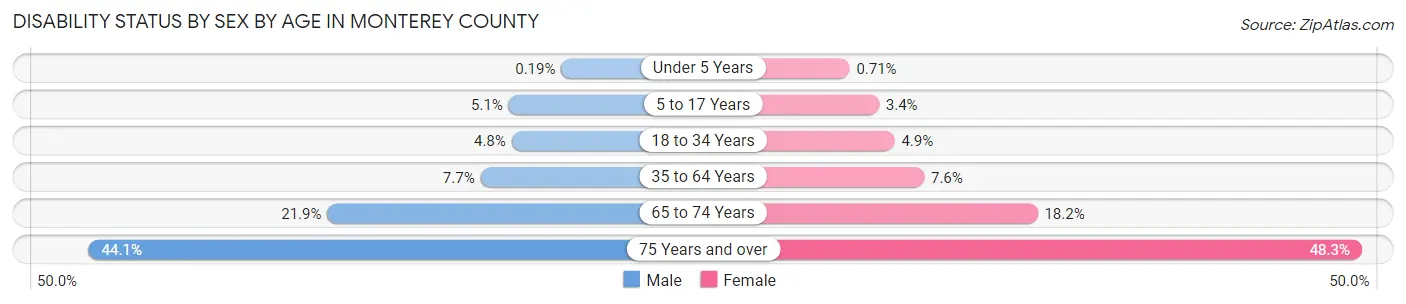
| Age Bracket | Male | Female |
| Under 5 Years | 28 (0.2%) | 102 (0.7%) |
| 5 to 17 Years | 2,160 (5.1%) | 1,413 (3.4%) |
| 18 to 34 Years | 2,307 (4.8%) | 2,404 (4.9%) |
| 35 to 64 Years | 5,883 (7.7%) | 5,717 (7.6%) |
| 65 to 74 Years | 3,817 (21.9%) | 3,412 (18.2%) |
| 75 Years and over | 4,704 (44.1%) | 6,935 (48.2%) |
Disability Class by Sex by Age in Monterey County
Disability Class: Hearing Difficulty
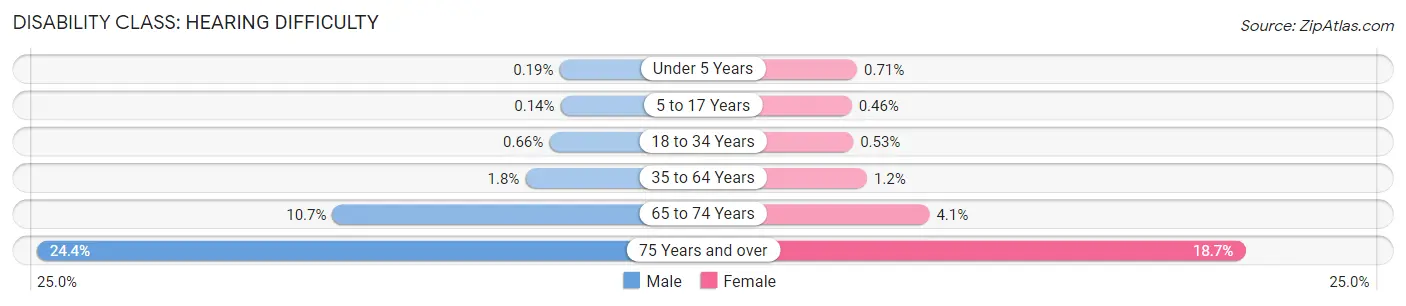
| Age Bracket | Male | Female |
| Under 5 Years | 28 (0.2%) | 102 (0.7%) |
| 5 to 17 Years | 61 (0.1%) | 189 (0.5%) |
| 18 to 34 Years | 316 (0.7%) | 259 (0.5%) |
| 35 to 64 Years | 1,354 (1.8%) | 879 (1.2%) |
| 65 to 74 Years | 1,867 (10.7%) | 764 (4.1%) |
| 75 Years and over | 2,609 (24.4%) | 2,689 (18.7%) |
Disability Class: Vision Difficulty
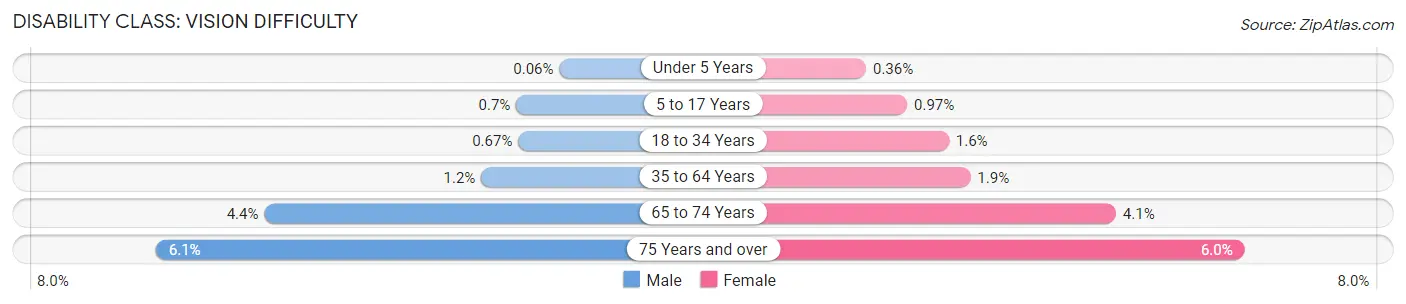
| Age Bracket | Male | Female |
| Under 5 Years | 9 (0.1%) | 52 (0.4%) |
| 5 to 17 Years | 297 (0.7%) | 396 (1.0%) |
| 18 to 34 Years | 323 (0.7%) | 784 (1.6%) |
| 35 to 64 Years | 937 (1.2%) | 1,432 (1.9%) |
| 65 to 74 Years | 773 (4.4%) | 764 (4.1%) |
| 75 Years and over | 646 (6.0%) | 860 (6.0%) |
Disability Class: Cognitive Difficulty
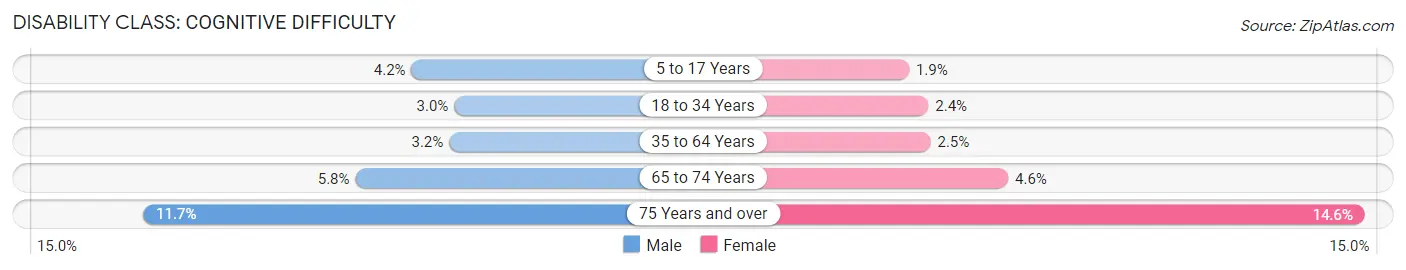
| Age Bracket | Male | Female |
| 5 to 17 Years | 1,801 (4.2%) | 769 (1.9%) |
| 18 to 34 Years | 1,463 (3.0%) | 1,185 (2.4%) |
| 35 to 64 Years | 2,433 (3.2%) | 1,850 (2.5%) |
| 65 to 74 Years | 1,009 (5.8%) | 869 (4.6%) |
| 75 Years and over | 1,249 (11.7%) | 2,093 (14.6%) |
Disability Class: Ambulatory Difficulty
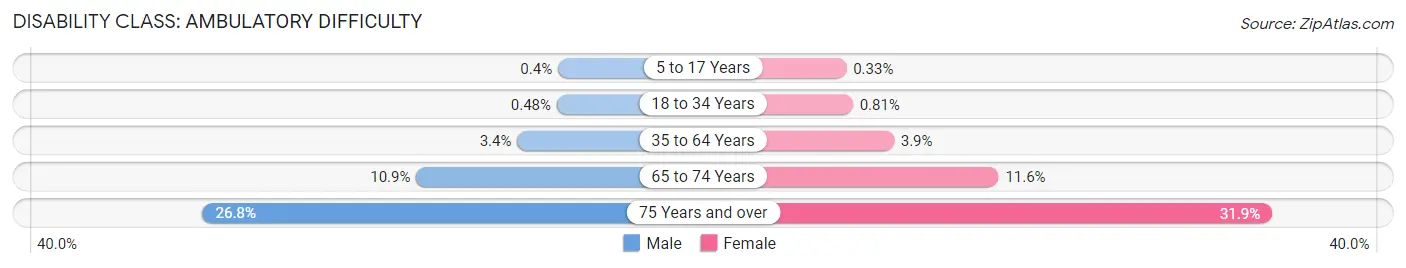
| Age Bracket | Male | Female |
| 5 to 17 Years | 169 (0.4%) | 134 (0.3%) |
| 18 to 34 Years | 232 (0.5%) | 400 (0.8%) |
| 35 to 64 Years | 2,616 (3.4%) | 2,896 (3.9%) |
| 65 to 74 Years | 1,902 (10.9%) | 2,184 (11.6%) |
| 75 Years and over | 2,860 (26.8%) | 4,591 (31.9%) |
Disability Class: Self-Care Difficulty
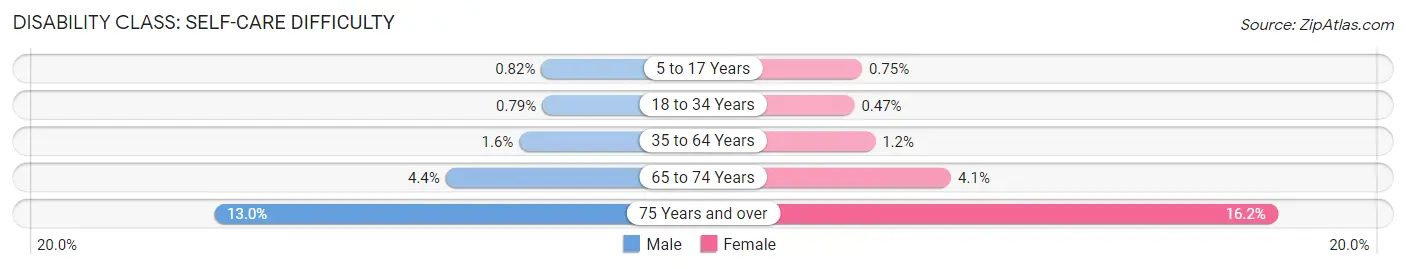
| Age Bracket | Male | Female |
| 5 to 17 Years | 350 (0.8%) | 306 (0.7%) |
| 18 to 34 Years | 379 (0.8%) | 232 (0.5%) |
| 35 to 64 Years | 1,254 (1.6%) | 926 (1.2%) |
| 65 to 74 Years | 762 (4.4%) | 762 (4.1%) |
| 75 Years and over | 1,385 (13.0%) | 2,326 (16.2%) |
Technology Access in Monterey County
Computing Device Access in Monterey County
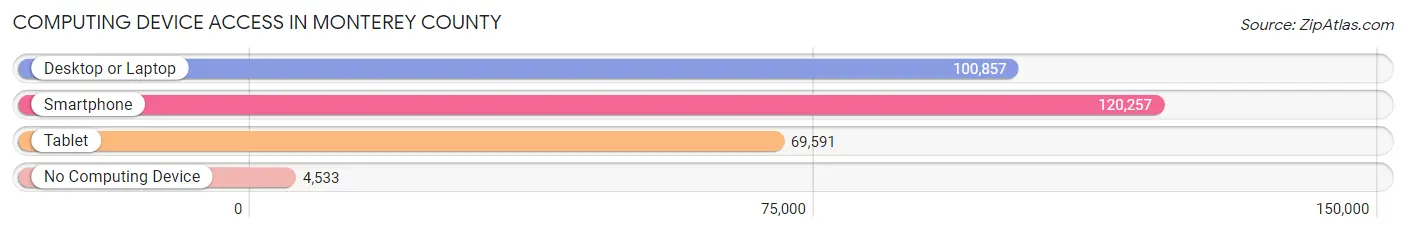
| Device Type | # Households | % Households |
| Desktop or Laptop | 100,857 | 77.0% |
| Smartphone | 120,257 | 91.8% |
| Tablet | 69,591 | 53.1% |
| No Computing Device | 4,533 | 3.5% |
| Total | 130,973 | 100.0% |
Internet Access in Monterey County
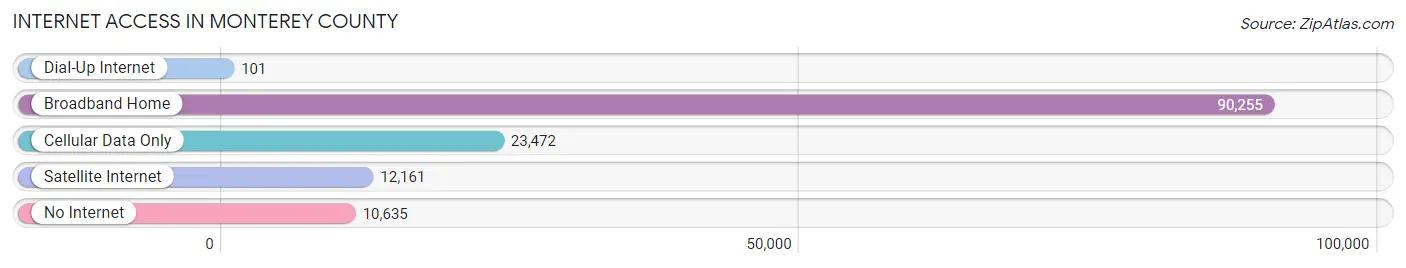
| Internet Type | # Households | % Households |
| Dial-Up Internet | 101 | 0.1% |
| Broadband Home | 90,255 | 68.9% |
| Cellular Data Only | 23,472 | 17.9% |
| Satellite Internet | 12,161 | 9.3% |
| No Internet | 10,635 | 8.1% |
| Total | 130,973 | 100.0% |
Monterey County Summary
Monterey County is a county located on the Central Coast of California, south of San Francisco and north of Los Angeles. It is bordered by San Benito County to the north, Santa Cruz County to the northwest, San Luis Obispo County to the east, and Santa Barbara County to the south. The county seat is Salinas, the largest city in the county.
History
The area that is now Monterey County was first inhabited by Native Americans, including the Ohlone, Esselen, and Salinan tribes. The first European to explore the area was Juan Rodríguez Cabrillo, who sailed up the California coast in 1542. The area was later explored by Spanish explorer Sebastián Vizcaíno in 1602.
In 1770, the Spanish established the Presidio of Monterey, which was the first European settlement in the area. The area was part of the Spanish Empire until 1821, when Mexico gained independence. In 1846, the area became part of the United States after the Mexican-American War.
In 1850, Monterey County was established as one of the original 27 counties of California. The county was named after the city of Monterey, which was the capital of Alta California from 1777 to 1846.
Geography
Monterey County covers an area of 3,771 square miles and is located on the Central Coast of California. It is bordered by San Benito County to the north, Santa Cruz County to the northwest, San Luis Obispo County to the east, and Santa Barbara County to the south.
The county is divided into two distinct regions: the coastal region and the inland region. The coastal region is characterized by rugged cliffs, rocky shorelines, and sandy beaches. The inland region is characterized by rolling hills, oak woodlands, and agricultural valleys.
The highest point in the county is Junipero Serra Peak, which is 5,862 feet above sea level. The lowest point is the Pacific Ocean, which is at sea level.
Economy
The economy of Monterey County is largely based on agriculture, tourism, and technology. Agriculture is the largest industry in the county, with crops such as lettuce, strawberries, and broccoli being grown in the Salinas Valley. Tourism is also a major industry, with visitors coming to the area to enjoy the beaches, wineries, and other attractions. Technology is also a growing industry, with many tech companies locating in the county.
Demographics
As of the 2010 census, the population of Monterey County was 415,057. The racial makeup of the county was 68.2% White, 3.3% African American, 0.7% Native American, 8.4% Asian, 0.3% Pacific Islander, and 17.3% from other races. Hispanic or Latino of any race were 44.2% of the population.
The median household income in the county was $60,817, and the median family income was $71,817. The per capita income was $30,817. About 13.2% of the population was below the poverty line.
Common Questions
What is Per Capita Income in Monterey County?
Per Capita income in Monterey County is $37,741.
What is the Median Family Income in Monterey County?
Median Family Income in Monterey County is $97,004.
What is the Median Household income in Monterey County?
Median Household Income in Monterey County is $91,043.
What is Income or Wage Gap in Monterey County?
Income or Wage Gap in Monterey County is 21.0%.
Women in Monterey County earn 79.0 cents for every dollar earned by a man.
What is Family Income Deficit in Monterey County?
Family Income Deficit in Monterey County is $10,678.
Families that are below poverty line in Monterey County earn $10,678 less on average than the poverty threshold level.
What is Inequality or Gini Index in Monterey County?
Inequality or Gini Index in Monterey County is 0.46.
What is the Total Population of Monterey County?
Total Population of Monterey County is 437,609.
What is the Total Male Population of Monterey County?
Total Male Population of Monterey County is 223,186.
What is the Total Female Population of Monterey County?
Total Female Population of Monterey County is 214,423.
What is the Ratio of Males per 100 Females in Monterey County?
There are 104.09 Males per 100 Females in Monterey County.
What is the Ratio of Females per 100 Males in Monterey County?
There are 96.07 Females per 100 Males in Monterey County.
What is the Median Population Age in Monterey County?
Median Population Age in Monterey County is 35.1 Years.
What is the Average Family Size in Monterey County
Average Family Size in Monterey County is 3.7 People.
What is the Average Household Size in Monterey County
Average Household Size in Monterey County is 3.2 People.
How Large is the Labor Force in Monterey County?
There are 204,112 People in the Labor Forcein in Monterey County.
What is the Percentage of People in the Labor Force in Monterey County?
60.6% of People are in the Labor Force in Monterey County.
What is the Unemployment Rate in Monterey County?
Unemployment Rate in Monterey County is 5.3%.