Fresno County, CA Map & Demographics
Fresno County Map
Fresno County Overview
$30,130
PER CAPITA INCOME
$76,092
AVG FAMILY INCOME
$67,756
AVG HOUSEHOLD INCOME
20.8%
WAGE / INCOME GAP [ % ]
79.2¢/ $1
WAGE / INCOME GAP [ $ ]
$11,737
FAMILY INCOME DEFICIT
0.47
INEQUALITY / GINI INDEX
1,008,280
TOTAL POPULATION
506,526
MALE POPULATION
501,754
FEMALE POPULATION
100.95
MALES / 100 FEMALES
99.06
FEMALES / 100 MALES
32.8
MEDIAN AGE
3.7
AVG FAMILY SIZE
3.1
AVG HOUSEHOLD SIZE
464,277
LABOR FORCE [ PEOPLE ]
61.3%
PERCENT IN LABOR FORCE
8.6%
UNEMPLOYMENT RATE
Income in Fresno County
Income Overview in Fresno County
Per Capita Income in Fresno County is $30,130, while median incomes of families and households are $76,092 and $67,756 respectively.
| Characteristic | Number | Measure |
| Per Capita Income | 1,008,280 | $30,130 |
| Median Family Income | 227,263 | $76,092 |
| Mean Family Income | 227,263 | $101,621 |
| Median Household Income | 318,322 | $67,756 |
| Mean Household Income | 318,322 | $91,924 |
| Income Deficit | 227,263 | $11,737 |
| Wage / Income Gap (%) | 1,008,280 | 20.81% |
| Wage / Income Gap ($) | 1,008,280 | 79.19¢ per $1 |
| Gini / Inequality Index | 1,008,280 | 0.47 |
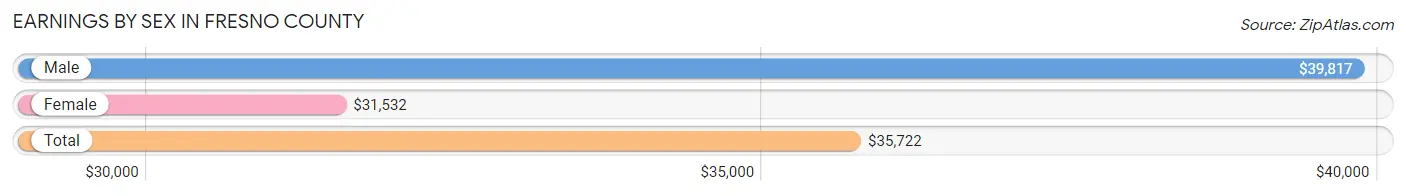
Earnings by Sex in Fresno County
Average Earnings in Fresno County are $35,722, $39,817 for men and $31,532 for women, a difference of 20.8%.
| Sex | Number | Average Earnings |
| Male | 257,148 (54.3%) | $39,817 |
| Female | 216,056 (45.7%) | $31,532 |
| Total | 473,204 (100.0%) | $35,722 |
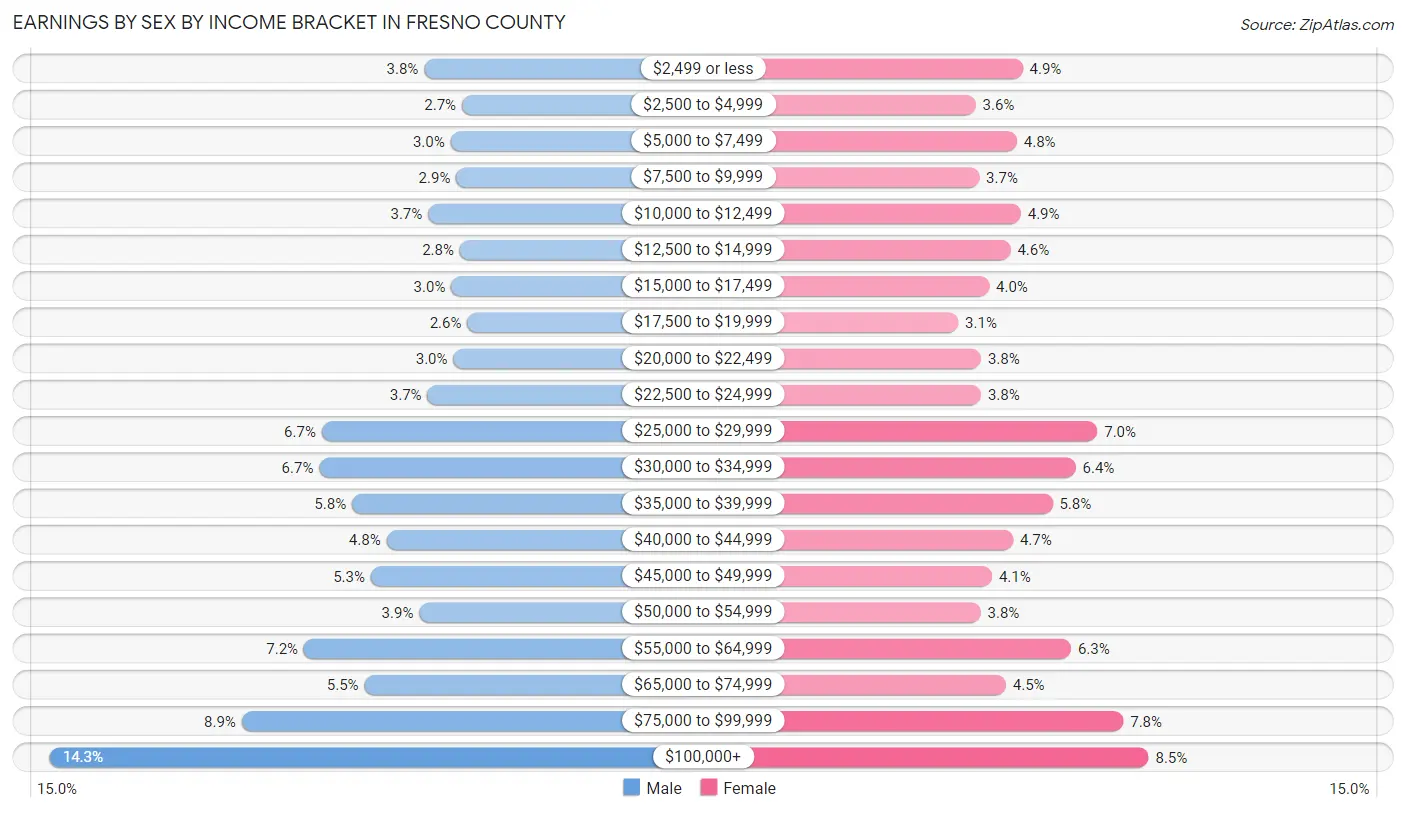
Earnings by Sex by Income Bracket in Fresno County
The most common earnings brackets in Fresno County are $100,000+ for men (36,758 | 14.3%) and $100,000+ for women (18,318 | 8.5%).
| Income | Male | Female |
| $2,499 or less | 9,705 (3.8%) | 10,679 (4.9%) |
| $2,500 to $4,999 | 6,970 (2.7%) | 7,827 (3.6%) |
| $5,000 to $7,499 | 7,800 (3.0%) | 10,325 (4.8%) |
| $7,500 to $9,999 | 7,378 (2.9%) | 8,043 (3.7%) |
| $10,000 to $12,499 | 9,418 (3.7%) | 10,560 (4.9%) |
| $12,500 to $14,999 | 7,135 (2.8%) | 9,946 (4.6%) |
| $15,000 to $17,499 | 7,739 (3.0%) | 8,638 (4.0%) |
| $17,500 to $19,999 | 6,586 (2.6%) | 6,767 (3.1%) |
| $20,000 to $22,499 | 7,594 (2.9%) | 8,155 (3.8%) |
| $22,500 to $24,999 | 9,457 (3.7%) | 8,148 (3.8%) |
| $25,000 to $29,999 | 17,107 (6.7%) | 15,212 (7.0%) |
| $30,000 to $34,999 | 17,285 (6.7%) | 13,884 (6.4%) |
| $35,000 to $39,999 | 14,910 (5.8%) | 12,492 (5.8%) |
| $40,000 to $44,999 | 12,412 (4.8%) | 10,083 (4.7%) |
| $45,000 to $49,999 | 13,561 (5.3%) | 8,819 (4.1%) |
| $50,000 to $54,999 | 10,043 (3.9%) | 8,128 (3.8%) |
| $55,000 to $64,999 | 18,393 (7.1%) | 13,606 (6.3%) |
| $65,000 to $74,999 | 14,004 (5.4%) | 9,649 (4.5%) |
| $75,000 to $99,999 | 22,893 (8.9%) | 16,777 (7.8%) |
| $100,000+ | 36,758 (14.3%) | 18,318 (8.5%) |
| Total | 257,148 (100.0%) | 216,056 (100.0%) |
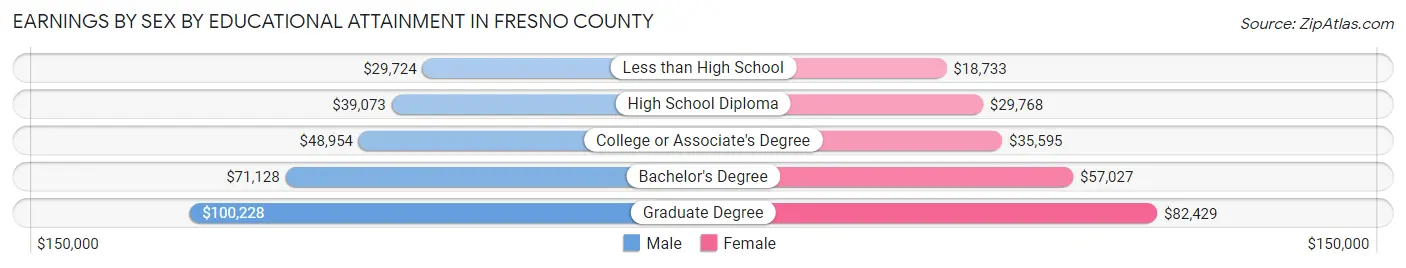
Earnings by Sex by Educational Attainment in Fresno County
Average earnings in Fresno County are $45,627 for men and $36,252 for women, a difference of 20.5%. Men with an educational attainment of graduate degree enjoy the highest average annual earnings of $100,228, while those with less than high school education earn the least with $29,724. Women with an educational attainment of graduate degree earn the most with the average annual earnings of $82,429, while those with less than high school education have the smallest earnings of $18,733.
| Educational Attainment | Male Income | Female Income |
| Less than High School | $29,724 | $18,733 |
| High School Diploma | $39,073 | $29,768 |
| College or Associate's Degree | $48,954 | $35,595 |
| Bachelor's Degree | $71,128 | $57,027 |
| Graduate Degree | $100,228 | $82,429 |
| Total | $45,627 | $36,252 |
Family Income in Fresno County
Family Income Brackets in Fresno County
According to the Fresno County family income data, there are 39,544 families falling into the $100,000 to $149,999 income range, which is the most common income bracket and makes up 17.4% of all families. Conversely, the $10,000 to $14,999 income bracket is the least frequent group with only 6,591 families (2.9%) belonging to this category.
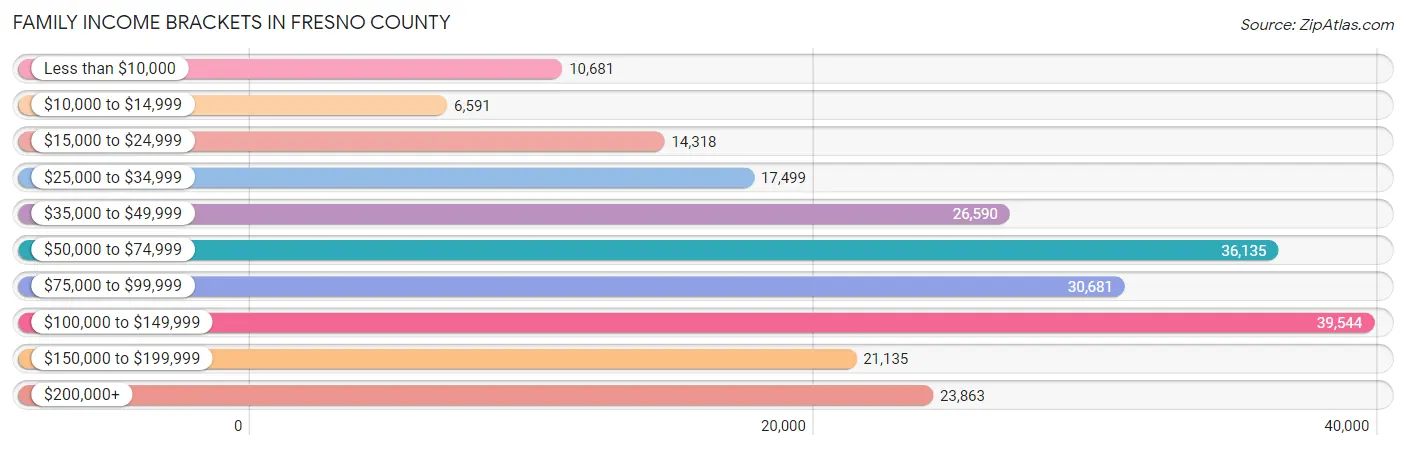
| Income Bracket | # Families | % Families |
| Less than $10,000 | 10,681 | 4.7% |
| $10,000 to $14,999 | 6,591 | 2.9% |
| $15,000 to $24,999 | 14,318 | 6.3% |
| $25,000 to $34,999 | 17,499 | 7.7% |
| $35,000 to $49,999 | 26,590 | 11.7% |
| $50,000 to $74,999 | 36,135 | 15.9% |
| $75,000 to $99,999 | 30,681 | 13.5% |
| $100,000 to $149,999 | 39,544 | 17.4% |
| $150,000 to $199,999 | 21,135 | 9.3% |
| $200,000+ | 23,863 | 10.5% |
Family Income by Famaliy Size in Fresno County
4-person families (43,384 | 19.1%) account for the highest median family income in Fresno County with $88,197 per family, while 2-person families (81,031 | 35.7%) have the highest median income of $35,694 per family member.
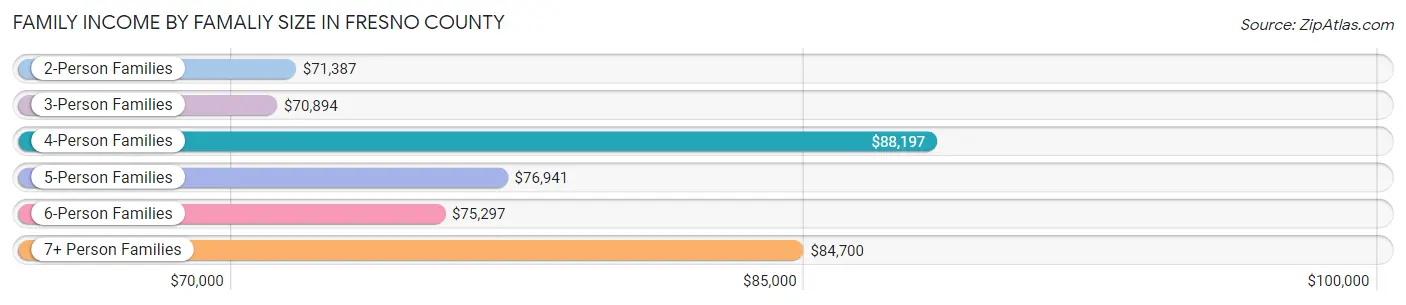
| Income Bracket | # Families | Median Income |
| 2-Person Families | 81,031 (35.7%) | $71,387 |
| 3-Person Families | 50,914 (22.4%) | $70,894 |
| 4-Person Families | 43,384 (19.1%) | $88,197 |
| 5-Person Families | 28,705 (12.6%) | $76,941 |
| 6-Person Families | 13,478 (5.9%) | $75,297 |
| 7+ Person Families | 9,751 (4.3%) | $84,700 |
| Total | 227,263 (100.0%) | $76,092 |
Family Income by Number of Earners in Fresno County
The median family income in Fresno County is $76,092, with families comprising 3+ earners (30,419) having the highest median family income of $124,535, while families with no earners (30,140) have the lowest median family income of $28,003, accounting for 13.4% and 13.3% of families, respectively.
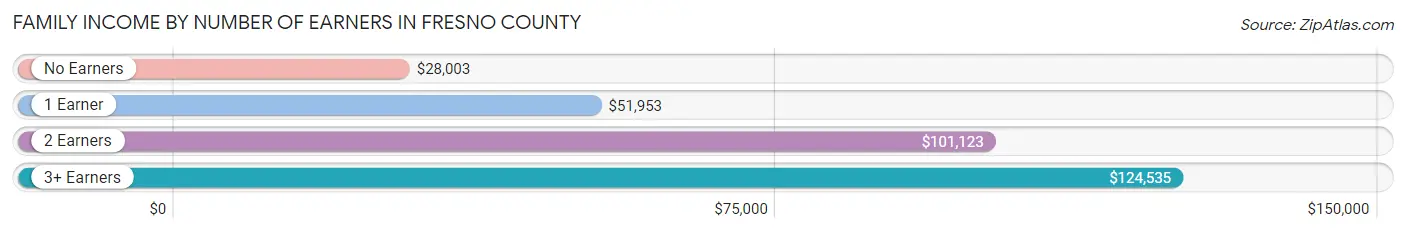
| Number of Earners | # Families | Median Income |
| No Earners | 30,140 (13.3%) | $28,003 |
| 1 Earner | 80,770 (35.5%) | $51,953 |
| 2 Earners | 85,934 (37.8%) | $101,123 |
| 3+ Earners | 30,419 (13.4%) | $124,535 |
| Total | 227,263 (100.0%) | $76,092 |
Household Income in Fresno County
Household Income Brackets in Fresno County
With 51,886 households falling in the category, the $100,000 to $149,999 income range is the most frequent in Fresno County, accounting for 16.3% of all households. In contrast, only 14,324 households (4.5%) fall into the $10,000 to $14,999 income bracket, making it the least populous group.
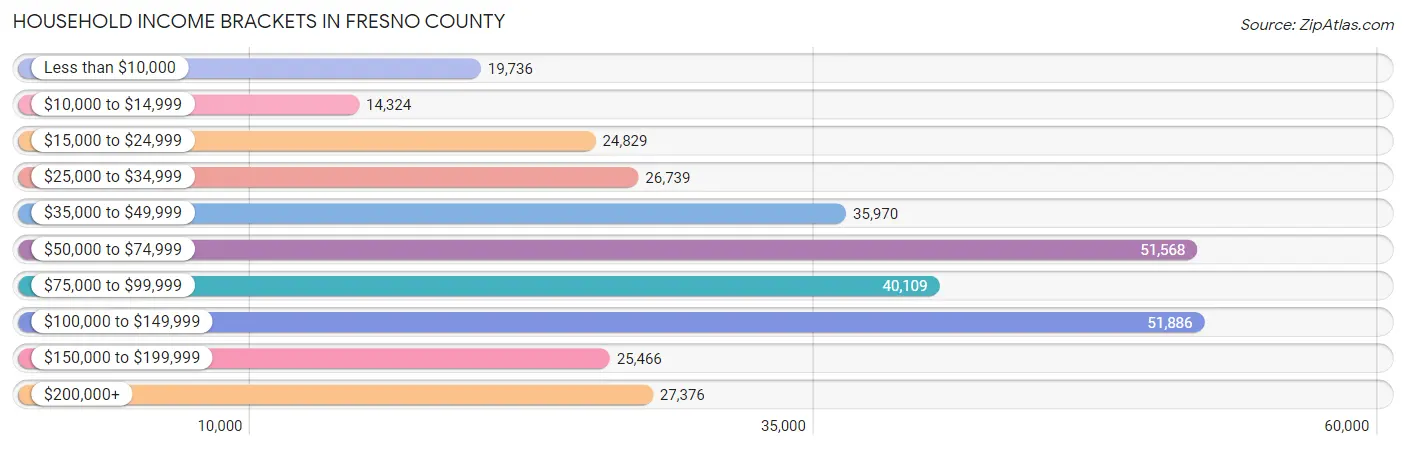
| Income Bracket | # Households | % Households |
| Less than $10,000 | 19,736 | 6.2% |
| $10,000 to $14,999 | 14,324 | 4.5% |
| $15,000 to $24,999 | 24,829 | 7.8% |
| $25,000 to $34,999 | 26,739 | 8.4% |
| $35,000 to $49,999 | 35,970 | 11.3% |
| $50,000 to $74,999 | 51,568 | 16.2% |
| $75,000 to $99,999 | 40,109 | 12.6% |
| $100,000 to $149,999 | 51,886 | 16.3% |
| $150,000 to $199,999 | 25,466 | 8.0% |
| $200,000+ | 27,376 | 8.6% |
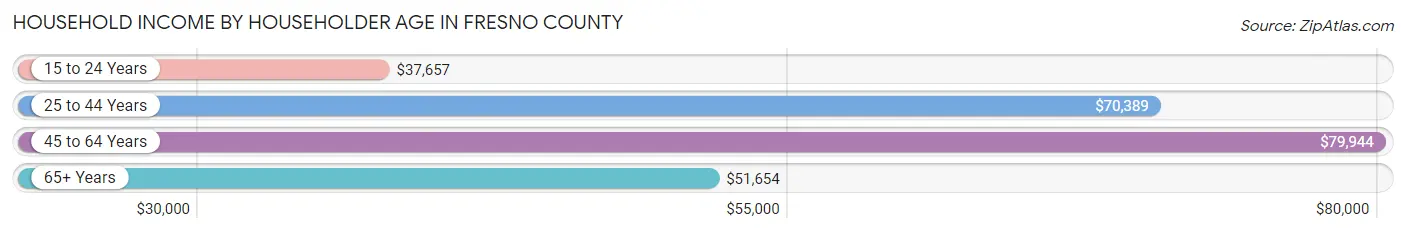
Household Income by Householder Age in Fresno County
The median household income in Fresno County is $67,756, with the highest median household income of $79,944 found in the 45 to 64 years age bracket for the primary householder. A total of 113,181 households (35.6%) fall into this category. Meanwhile, the 15 to 24 years age bracket for the primary householder has the lowest median household income of $37,657, with 12,150 households (3.8%) in this group.
| Income Bracket | # Households | Median Income |
| 15 to 24 Years | 12,150 (3.8%) | $37,657 |
| 25 to 44 Years | 119,889 (37.7%) | $70,389 |
| 45 to 64 Years | 113,181 (35.6%) | $79,944 |
| 65+ Years | 73,102 (23.0%) | $51,654 |
| Total | 318,322 (100.0%) | $67,756 |
Poverty in Fresno County
Income Below Poverty by Sex and Age in Fresno County
With 18.2% poverty level for males and 20.9% for females among the residents of Fresno County, 6 to 11 year old males and 5 year old females are the most vulnerable to poverty, with 13,898 males (28.6%) and 2,150 females (31.7%) in their respective age groups living below the poverty level.
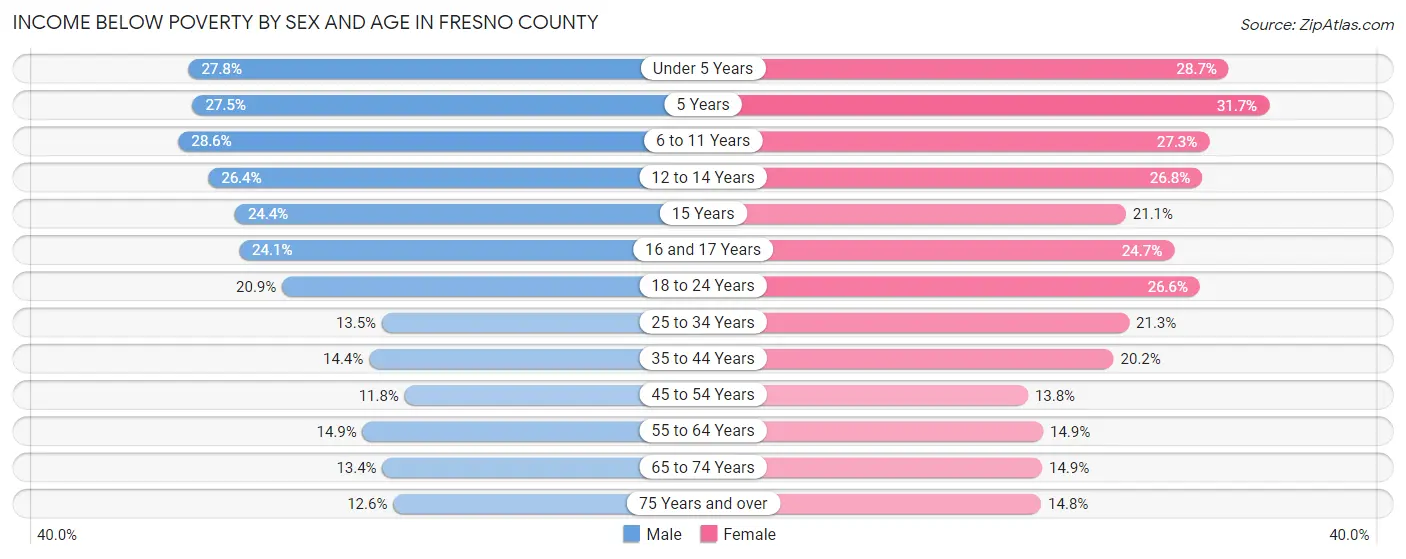
| Age Bracket | Male | Female |
| Under 5 Years | 10,037 (27.8%) | 10,025 (28.7%) |
| 5 Years | 2,417 (27.5%) | 2,150 (31.7%) |
| 6 to 11 Years | 13,898 (28.6%) | 12,772 (27.3%) |
| 12 to 14 Years | 6,399 (26.4%) | 6,478 (26.8%) |
| 15 Years | 1,845 (24.4%) | 1,606 (21.1%) |
| 16 and 17 Years | 3,985 (24.1%) | 3,797 (24.7%) |
| 18 to 24 Years | 10,419 (20.9%) | 12,761 (26.6%) |
| 25 to 34 Years | 10,201 (13.5%) | 15,726 (21.3%) |
| 35 to 44 Years | 9,434 (14.4%) | 12,931 (20.2%) |
| 45 to 54 Years | 6,533 (11.8%) | 7,492 (13.8%) |
| 55 to 64 Years | 7,604 (14.9%) | 7,858 (14.9%) |
| 65 to 74 Years | 4,707 (13.4%) | 5,766 (14.9%) |
| 75 Years and over | 2,592 (12.6%) | 4,242 (14.8%) |
| Total | 90,071 (18.2%) | 103,604 (20.9%) |
Income Above Poverty by Sex and Age in Fresno County
According to the poverty statistics in Fresno County, males aged 45 to 54 years and females aged 45 to 54 years are the age groups that are most secure financially, with 88.2% of males and 86.2% of females in these age groups living above the poverty line.
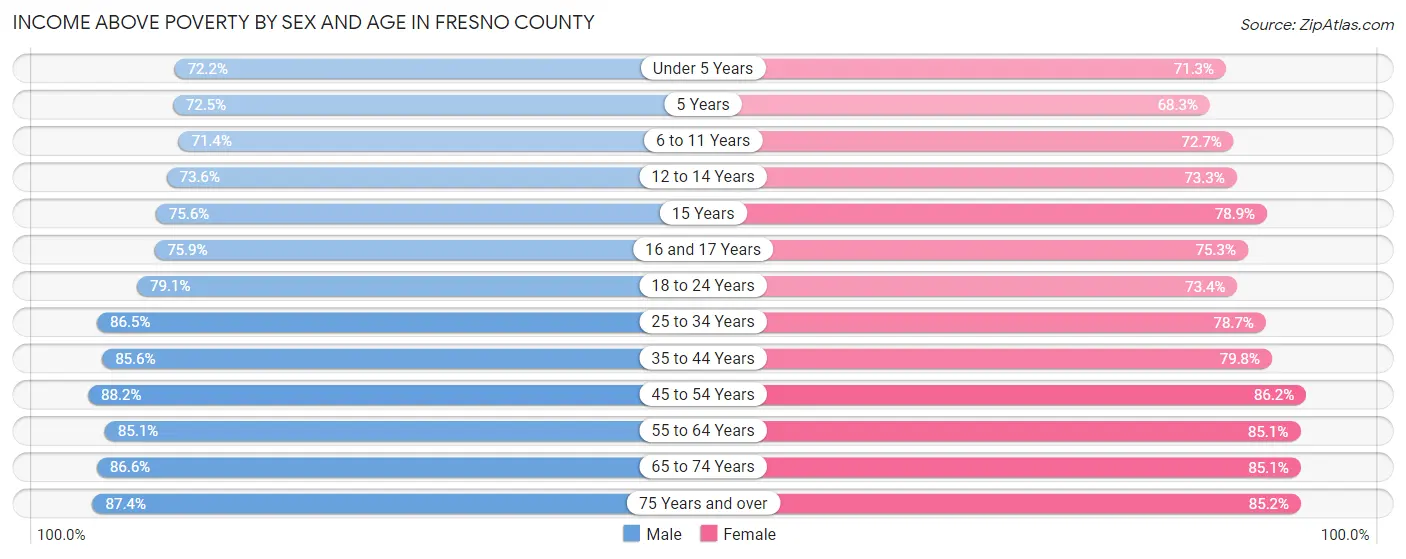
| Age Bracket | Male | Female |
| Under 5 Years | 26,031 (72.2%) | 24,886 (71.3%) |
| 5 Years | 6,363 (72.5%) | 4,630 (68.3%) |
| 6 to 11 Years | 34,729 (71.4%) | 34,055 (72.7%) |
| 12 to 14 Years | 17,880 (73.6%) | 17,740 (73.3%) |
| 15 Years | 5,723 (75.6%) | 6,009 (78.9%) |
| 16 and 17 Years | 12,570 (75.9%) | 11,601 (75.3%) |
| 18 to 24 Years | 39,475 (79.1%) | 35,256 (73.4%) |
| 25 to 34 Years | 65,521 (86.5%) | 58,009 (78.7%) |
| 35 to 44 Years | 56,010 (85.6%) | 51,143 (79.8%) |
| 45 to 54 Years | 48,917 (88.2%) | 46,738 (86.2%) |
| 55 to 64 Years | 43,402 (85.1%) | 44,742 (85.1%) |
| 65 to 74 Years | 30,353 (86.6%) | 33,005 (85.1%) |
| 75 Years and over | 17,930 (87.4%) | 24,428 (85.2%) |
| Total | 404,904 (81.8%) | 392,242 (79.1%) |
Income Below Poverty Among Married-Couple Families in Fresno County
The poverty statistics for married-couple families in Fresno County show that 9.4% or 13,985 of the total 149,206 families live below the poverty line. Families with 5 or more children have the highest poverty rate of 37.5%, comprising of 910 families. On the other hand, families with no children have the lowest poverty rate of 5.4%, which includes 3,989 families.
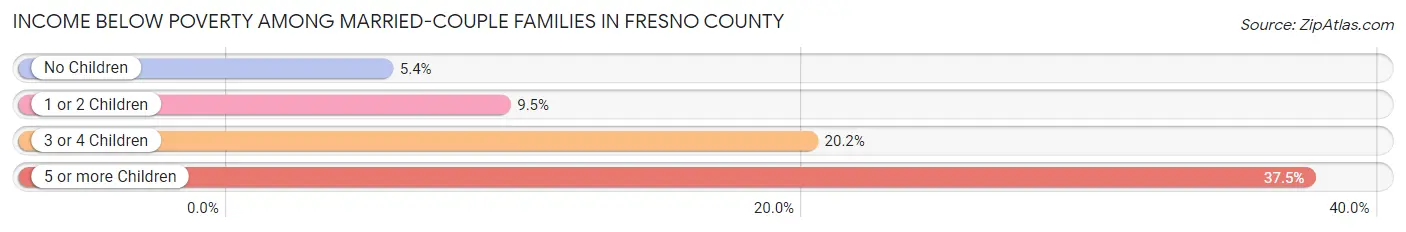
| Children | Above Poverty | Below Poverty |
| No Children | 69,951 (94.6%) | 3,989 (5.4%) |
| 1 or 2 Children | 47,479 (90.5%) | 4,970 (9.5%) |
| 3 or 4 Children | 16,277 (79.8%) | 4,116 (20.2%) |
| 5 or more Children | 1,514 (62.5%) | 910 (37.5%) |
| Total | 135,221 (90.6%) | 13,985 (9.4%) |
Income Below Poverty Among Single-Parent Households in Fresno County
According to the poverty data in Fresno County, 16.3% or 4,095 single-father households and 32.2% or 17,016 single-mother households are living below the poverty line. Among single-father households, those with 5 or more children have the highest poverty rate, with 258 households (54.0%) experiencing poverty. Likewise, among single-mother households, those with 5 or more children have the highest poverty rate, with 1,063 households (77.8%) falling below the poverty line.
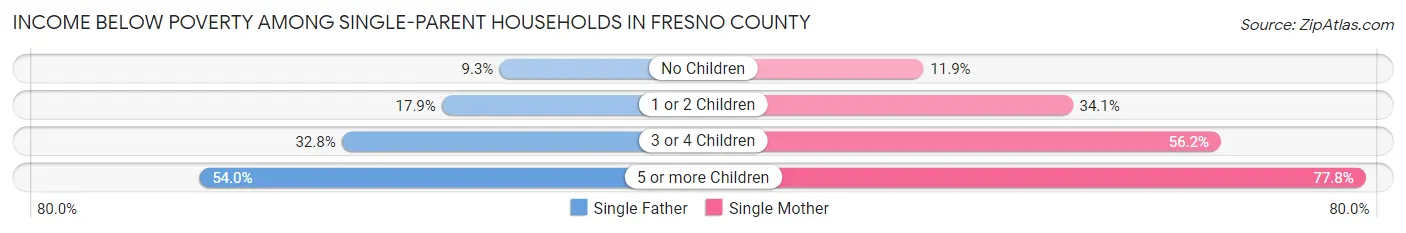
| Children | Single Father | Single Mother |
| No Children | 1,038 (9.3%) | 1,929 (11.9%) |
| 1 or 2 Children | 1,953 (17.9%) | 8,951 (34.1%) |
| 3 or 4 Children | 846 (32.8%) | 5,073 (56.2%) |
| 5 or more Children | 258 (54.0%) | 1,063 (77.8%) |
| Total | 4,095 (16.3%) | 17,016 (32.2%) |
Income Below Poverty Among Married-Couple vs Single-Parent Households in Fresno County
The poverty data for Fresno County shows that 13,985 of the married-couple family households (9.4%) and 21,111 of the single-parent households (27.1%) are living below the poverty level. Within the married-couple family households, those with 5 or more children have the highest poverty rate, with 910 households (37.5%) falling below the poverty line. Among the single-parent households, those with 5 or more children have the highest poverty rate, with 1,321 household (71.6%) living below poverty.
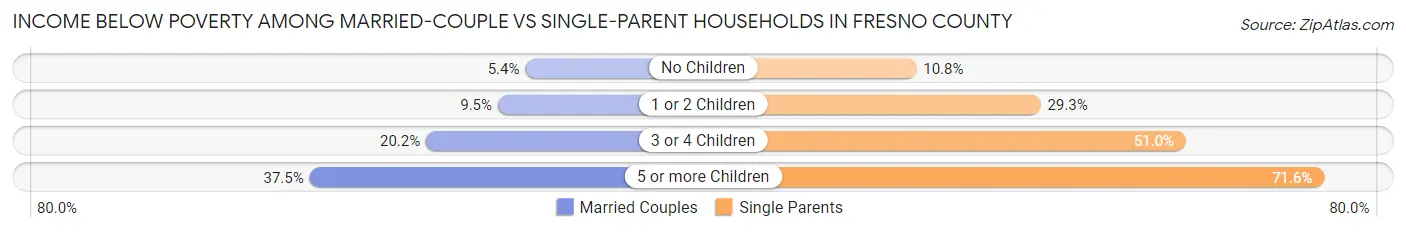
| Children | Married-Couple Families | Single-Parent Households |
| No Children | 3,989 (5.4%) | 2,967 (10.8%) |
| 1 or 2 Children | 4,970 (9.5%) | 10,904 (29.3%) |
| 3 or 4 Children | 4,116 (20.2%) | 5,919 (51.0%) |
| 5 or more Children | 910 (37.5%) | 1,321 (71.6%) |
| Total | 13,985 (9.4%) | 21,111 (27.1%) |
Race in Fresno County
The most populous races in Fresno County are Hispanic or Latino (546,774 | 54.2%), White / Caucasian (483,826 | 48.0%), and Some other Race (182,307 | 18.1%).
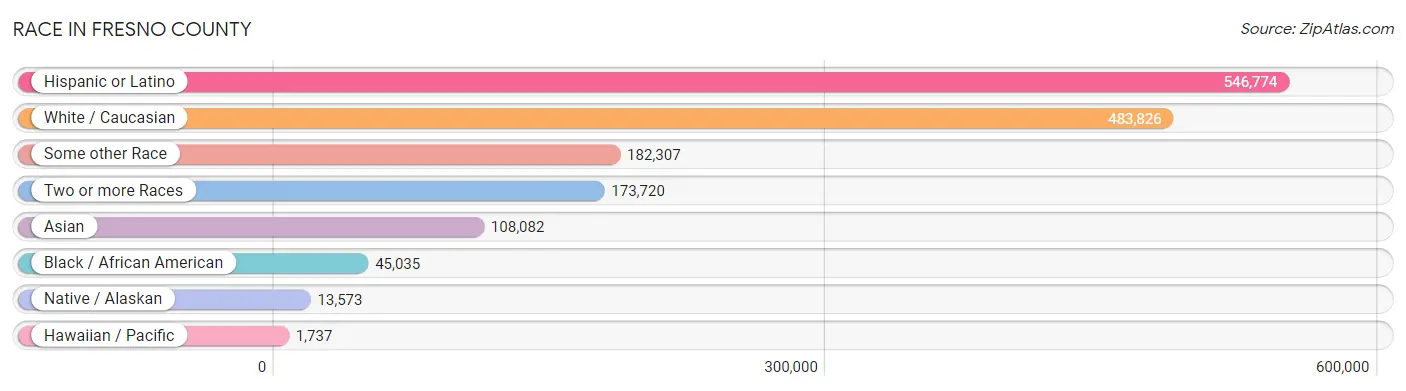
| Race | # Population | % Population |
| Asian | 108,082 | 10.7% |
| Black / African American | 45,035 | 4.5% |
| Hawaiian / Pacific | 1,737 | 0.2% |
| Hispanic or Latino | 546,774 | 54.2% |
| Native / Alaskan | 13,573 | 1.3% |
| White / Caucasian | 483,826 | 48.0% |
| Two or more Races | 173,720 | 17.2% |
| Some other Race | 182,307 | 18.1% |
| Total | 1,008,280 | 100.0% |
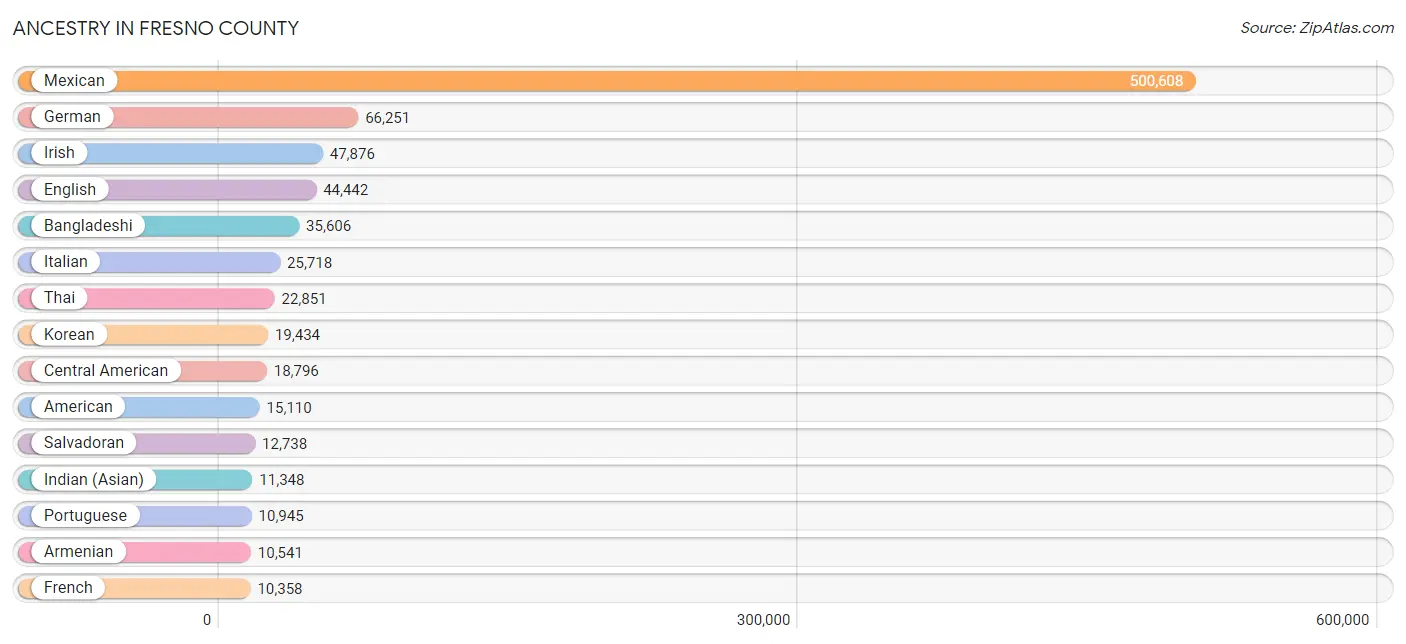
Ancestry in Fresno County
The most populous ancestries reported in Fresno County are Mexican (500,608 | 49.6%), German (66,251 | 6.6%), Irish (47,876 | 4.8%), English (44,442 | 4.4%), and Bangladeshi (35,606 | 3.5%), together accounting for 68.9% of all Fresno County residents.
| Ancestry | # Population | % Population |
| Afghan | 644 | 0.1% |
| African | 3,018 | 0.3% |
| Albanian | 6 | 0.0% |
| Aleut | 17 | 0.0% |
| American | 15,110 | 1.5% |
| Apache | 1,401 | 0.1% |
| Arab | 7,850 | 0.8% |
| Arapaho | 40 | 0.0% |
| Argentinean | 227 | 0.0% |
| Armenian | 10,541 | 1.1% |
| Assyrian / Chaldean / Syriac | 518 | 0.1% |
| Australian | 252 | 0.0% |
| Austrian | 461 | 0.1% |
| Bahamian | 11 | 0.0% |
| Bangladeshi | 35,606 | 3.5% |
| Barbadian | 27 | 0.0% |
| Basque | 1,216 | 0.1% |
| Belgian | 229 | 0.0% |
| Belizean | 3 | 0.0% |
| Bhutanese | 6,823 | 0.7% |
| Blackfeet | 1,015 | 0.1% |
| Bolivian | 477 | 0.1% |
| Brazilian | 165 | 0.0% |
| British | 3,343 | 0.3% |
| British West Indian | 6 | 0.0% |
| Bulgarian | 101 | 0.0% |
| Burmese | 3,036 | 0.3% |
| Canadian | 1,005 | 0.1% |
| Cape Verdean | 62 | 0.0% |
| Carpatho Rusyn | 14 | 0.0% |
| Celtic | 191 | 0.0% |
| Central American | 18,796 | 1.9% |
| Central American Indian | 1,258 | 0.1% |
| Cherokee | 3,132 | 0.3% |
| Cheyenne | 85 | 0.0% |
| Chickasaw | 312 | 0.0% |
| Chilean | 322 | 0.0% |
| Chinese | 81 | 0.0% |
| Chippewa | 199 | 0.0% |
| Choctaw | 1,304 | 0.1% |
| Colombian | 739 | 0.1% |
| Comanche | 140 | 0.0% |
| Costa Rican | 312 | 0.0% |
| Cree | 11 | 0.0% |
| Creek | 280 | 0.0% |
| Croatian | 583 | 0.1% |
| Crow | 105 | 0.0% |
| Cuban | 1,118 | 0.1% |
| Czech | 1,578 | 0.2% |
| Czechoslovakian | 341 | 0.0% |
| Danish | 4,210 | 0.4% |
| Delaware | 63 | 0.0% |
| Dominican | 194 | 0.0% |
| Dutch | 6,586 | 0.6% |
| Dutch West Indian | 24 | 0.0% |
| Eastern European | 684 | 0.1% |
| Ecuadorian | 534 | 0.1% |
| Egyptian | 502 | 0.1% |
| English | 44,442 | 4.4% |
| Estonian | 23 | 0.0% |
| Ethiopian | 452 | 0.0% |
| European | 8,384 | 0.8% |
| Fijian | 4 | 0.0% |
| Filipino | 231 | 0.0% |
| Finnish | 659 | 0.1% |
| French | 10,358 | 1.0% |
| French American Indian | 114 | 0.0% |
| French Canadian | 987 | 0.1% |
| German | 66,251 | 6.6% |
| German Russian | 128 | 0.0% |
| Ghanaian | 91 | 0.0% |
| Greek | 1,889 | 0.2% |
| Guamanian / Chamorro | 757 | 0.1% |
| Guatemalan | 3,037 | 0.3% |
| Guyanese | 12 | 0.0% |
| Haitian | 128 | 0.0% |
| Honduran | 1,741 | 0.2% |
| Hopi | 126 | 0.0% |
| Hungarian | 927 | 0.1% |
| Icelander | 11 | 0.0% |
| Indian (Asian) | 11,348 | 1.1% |
| Indonesian | 353 | 0.0% |
| Inupiat | 110 | 0.0% |
| Iranian | 1,173 | 0.1% |
| Iraqi | 315 | 0.0% |
| Irish | 47,876 | 4.8% |
| Iroquois | 118 | 0.0% |
| Israeli | 117 | 0.0% |
| Italian | 25,718 | 2.5% |
| Jamaican | 220 | 0.0% |
| Japanese | 7,567 | 0.7% |
| Jordanian | 373 | 0.0% |
| Kenyan | 71 | 0.0% |
| Korean | 19,434 | 1.9% |
| Laotian | 853 | 0.1% |
| Latvian | 110 | 0.0% |
| Lebanese | 917 | 0.1% |
| Liberian | 7 | 0.0% |
| Lithuanian | 227 | 0.0% |
| Lumbee | 54 | 0.0% |
| Luxembourger | 21 | 0.0% |
| Macedonian | 55 | 0.0% |
| Malaysian | 8,188 | 0.8% |
| Maltese | 21 | 0.0% |
| Mexican | 500,608 | 49.6% |
| Mexican American Indian | 4,795 | 0.5% |
| Mongolian | 31 | 0.0% |
| Moroccan | 99 | 0.0% |
| Native Hawaiian | 1,344 | 0.1% |
| Navajo | 874 | 0.1% |
| Nepalese | 144 | 0.0% |
| New Zealander | 95 | 0.0% |
| Nicaraguan | 817 | 0.1% |
| Nigerian | 720 | 0.1% |
| Northern European | 934 | 0.1% |
| Norwegian | 5,518 | 0.5% |
| Okinawan | 6 | 0.0% |
| Osage | 59 | 0.0% |
| Ottawa | 25 | 0.0% |
| Paiute | 25 | 0.0% |
| Pakistani | 1,004 | 0.1% |
| Palestinian | 271 | 0.0% |
| Panamanian | 129 | 0.0% |
| Pennsylvania German | 170 | 0.0% |
| Peruvian | 835 | 0.1% |
| Pima | 49 | 0.0% |
| Polish | 3,456 | 0.3% |
| Portuguese | 10,945 | 1.1% |
| Potawatomi | 61 | 0.0% |
| Pueblo | 64 | 0.0% |
| Puerto Rican | 4,735 | 0.5% |
| Puget Sound Salish | 553 | 0.1% |
| Romanian | 326 | 0.0% |
| Russian | 3,494 | 0.4% |
| Salvadoran | 12,738 | 1.3% |
| Samoan | 1,185 | 0.1% |
| Scandinavian | 1,832 | 0.2% |
| Scotch-Irish | 4,564 | 0.4% |
| Scottish | 8,167 | 0.8% |
| Seminole | 73 | 0.0% |
| Serbian | 571 | 0.1% |
| Shoshone | 34 | 0.0% |
| Sierra Leonean | 58 | 0.0% |
| Sioux | 526 | 0.1% |
| Slavic | 178 | 0.0% |
| Slovak | 116 | 0.0% |
| Slovene | 98 | 0.0% |
| Somali | 24 | 0.0% |
| South African | 108 | 0.0% |
| South American | 3,266 | 0.3% |
| South American Indian | 40 | 0.0% |
| Spaniard | 5,396 | 0.5% |
| Spanish | 2,452 | 0.2% |
| Spanish American | 376 | 0.0% |
| Spanish American Indian | 140 | 0.0% |
| Sri Lankan | 5,572 | 0.5% |
| Subsaharan African | 5,033 | 0.5% |
| Sudanese | 123 | 0.0% |
| Swedish | 7,067 | 0.7% |
| Swiss | 1,488 | 0.2% |
| Syrian | 1,136 | 0.1% |
| Taiwanese | 16 | 0.0% |
| Thai | 22,851 | 2.3% |
| Tohono O'Odham | 307 | 0.0% |
| Tongan | 369 | 0.0% |
| Trinidadian and Tobagonian | 81 | 0.0% |
| Turkish | 135 | 0.0% |
| Ugandan | 116 | 0.0% |
| Ukrainian | 1,069 | 0.1% |
| Uruguayan | 36 | 0.0% |
| Venezuelan | 96 | 0.0% |
| Vietnamese | 70 | 0.0% |
| Welsh | 2,240 | 0.2% |
| West Indian | 93 | 0.0% |
| Yaqui | 1,396 | 0.1% |
| Yugoslavian | 280 | 0.0% |
| Yuman | 35 | 0.0% |
| Yup'ik | 99 | 0.0% |
| Zimbabwean | 20 | 0.0% | View All 179 Rows |
Immigrants in Fresno County
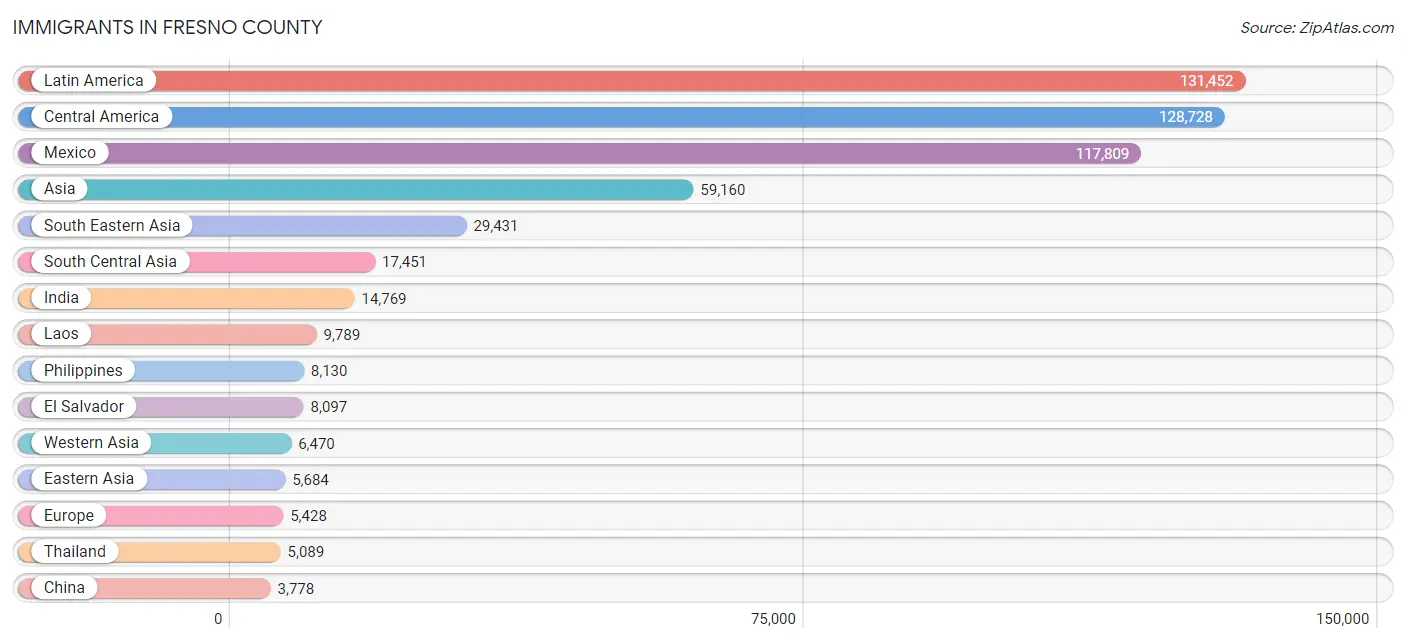
The most numerous immigrant groups reported in Fresno County came from Latin America (131,452 | 13.0%), Central America (128,728 | 12.8%), Mexico (117,809 | 11.7%), Asia (59,160 | 5.9%), and South Eastern Asia (29,431 | 2.9%), together accounting for 46.3% of all Fresno County residents.
| Immigration Origin | # Population | % Population |
| Afghanistan | 703 | 0.1% |
| Africa | 2,577 | 0.3% |
| Albania | 6 | 0.0% |
| Argentina | 154 | 0.0% |
| Armenia | 1,570 | 0.2% |
| Asia | 59,160 | 5.9% |
| Australia | 142 | 0.0% |
| Austria | 65 | 0.0% |
| Azores | 166 | 0.0% |
| Bangladesh | 14 | 0.0% |
| Barbados | 13 | 0.0% |
| Belarus | 9 | 0.0% |
| Belgium | 94 | 0.0% |
| Belize | 32 | 0.0% |
| Bolivia | 235 | 0.0% |
| Bosnia and Herzegovina | 10 | 0.0% |
| Brazil | 276 | 0.0% |
| Bulgaria | 4 | 0.0% |
| Cambodia | 1,862 | 0.2% |
| Cameroon | 5 | 0.0% |
| Canada | 1,363 | 0.1% |
| Caribbean | 522 | 0.1% |
| Central America | 128,728 | 12.8% |
| Chile | 113 | 0.0% |
| China | 3,778 | 0.4% |
| Colombia | 473 | 0.1% |
| Costa Rica | 132 | 0.0% |
| Croatia | 47 | 0.0% |
| Cuba | 216 | 0.0% |
| Czechoslovakia | 46 | 0.0% |
| Denmark | 16 | 0.0% |
| Dominica | 6 | 0.0% |
| Dominican Republic | 34 | 0.0% |
| Eastern Africa | 639 | 0.1% |
| Eastern Asia | 5,684 | 0.6% |
| Eastern Europe | 1,223 | 0.1% |
| Ecuador | 203 | 0.0% |
| Egypt | 617 | 0.1% |
| El Salvador | 8,097 | 0.8% |
| England | 506 | 0.1% |
| Eritrea | 17 | 0.0% |
| Ethiopia | 388 | 0.0% |
| Europe | 5,428 | 0.5% |
| Fiji | 242 | 0.0% |
| France | 320 | 0.0% |
| Germany | 642 | 0.1% |
| Ghana | 135 | 0.0% |
| Greece | 185 | 0.0% |
| Guatemala | 1,535 | 0.2% |
| Guyana | 11 | 0.0% |
| Haiti | 53 | 0.0% |
| Honduras | 731 | 0.1% |
| Hong Kong | 470 | 0.1% |
| Hungary | 8 | 0.0% |
| India | 14,769 | 1.5% |
| Indonesia | 761 | 0.1% |
| Iran | 735 | 0.1% |
| Iraq | 256 | 0.0% |
| Ireland | 22 | 0.0% |
| Israel | 155 | 0.0% |
| Italy | 210 | 0.0% |
| Jamaica | 101 | 0.0% |
| Japan | 492 | 0.1% |
| Jordan | 582 | 0.1% |
| Kazakhstan | 51 | 0.0% |
| Kenya | 71 | 0.0% |
| Korea | 1,414 | 0.1% |
| Kuwait | 127 | 0.0% |
| Laos | 9,789 | 1.0% |
| Latin America | 131,452 | 13.0% |
| Latvia | 25 | 0.0% |
| Lebanon | 414 | 0.0% |
| Liberia | 49 | 0.0% |
| Malaysia | 442 | 0.0% |
| Mexico | 117,809 | 11.7% |
| Micronesia | 12 | 0.0% |
| Middle Africa | 40 | 0.0% |
| Moldova | 64 | 0.0% |
| Morocco | 30 | 0.0% |
| Nepal | 97 | 0.0% |
| Netherlands | 166 | 0.0% |
| Nicaragua | 300 | 0.0% |
| Nigeria | 495 | 0.1% |
| North Macedonia | 45 | 0.0% |
| Northern Africa | 705 | 0.1% |
| Northern Europe | 1,314 | 0.1% |
| Norway | 55 | 0.0% |
| Oceania | 788 | 0.1% |
| Pakistan | 912 | 0.1% |
| Panama | 80 | 0.0% |
| Peru | 449 | 0.0% |
| Philippines | 8,130 | 0.8% |
| Poland | 25 | 0.0% |
| Portugal | 446 | 0.0% |
| Romania | 110 | 0.0% |
| Russia | 297 | 0.0% |
| Saudi Arabia | 80 | 0.0% |
| Scotland | 83 | 0.0% |
| Sierra Leone | 44 | 0.0% |
| Singapore | 15 | 0.0% |
| Somalia | 4 | 0.0% |
| South Africa | 84 | 0.0% |
| South America | 2,202 | 0.2% |
| South Central Asia | 17,451 | 1.7% |
| South Eastern Asia | 29,431 | 2.9% |
| Southern Europe | 1,526 | 0.2% |
| Spain | 685 | 0.1% |
| Sri Lanka | 170 | 0.0% |
| Sudan | 37 | 0.0% |
| Sweden | 46 | 0.0% |
| Switzerland | 54 | 0.0% |
| Syria | 1,093 | 0.1% |
| Taiwan | 344 | 0.0% |
| Thailand | 5,089 | 0.5% |
| Trinidad and Tobago | 99 | 0.0% |
| Turkey | 100 | 0.0% |
| Uganda | 126 | 0.0% |
| Ukraine | 462 | 0.1% |
| Uruguay | 23 | 0.0% |
| Venezuela | 204 | 0.0% |
| Vietnam | 3,035 | 0.3% |
| Western Africa | 753 | 0.1% |
| Western Asia | 6,470 | 0.6% |
| Western Europe | 1,341 | 0.1% |
| Yemen | 1,647 | 0.2% |
| Zaire | 35 | 0.0% |
| Zimbabwe | 20 | 0.0% | View All 127 Rows |
Sex and Age in Fresno County
Sex and Age in Fresno County
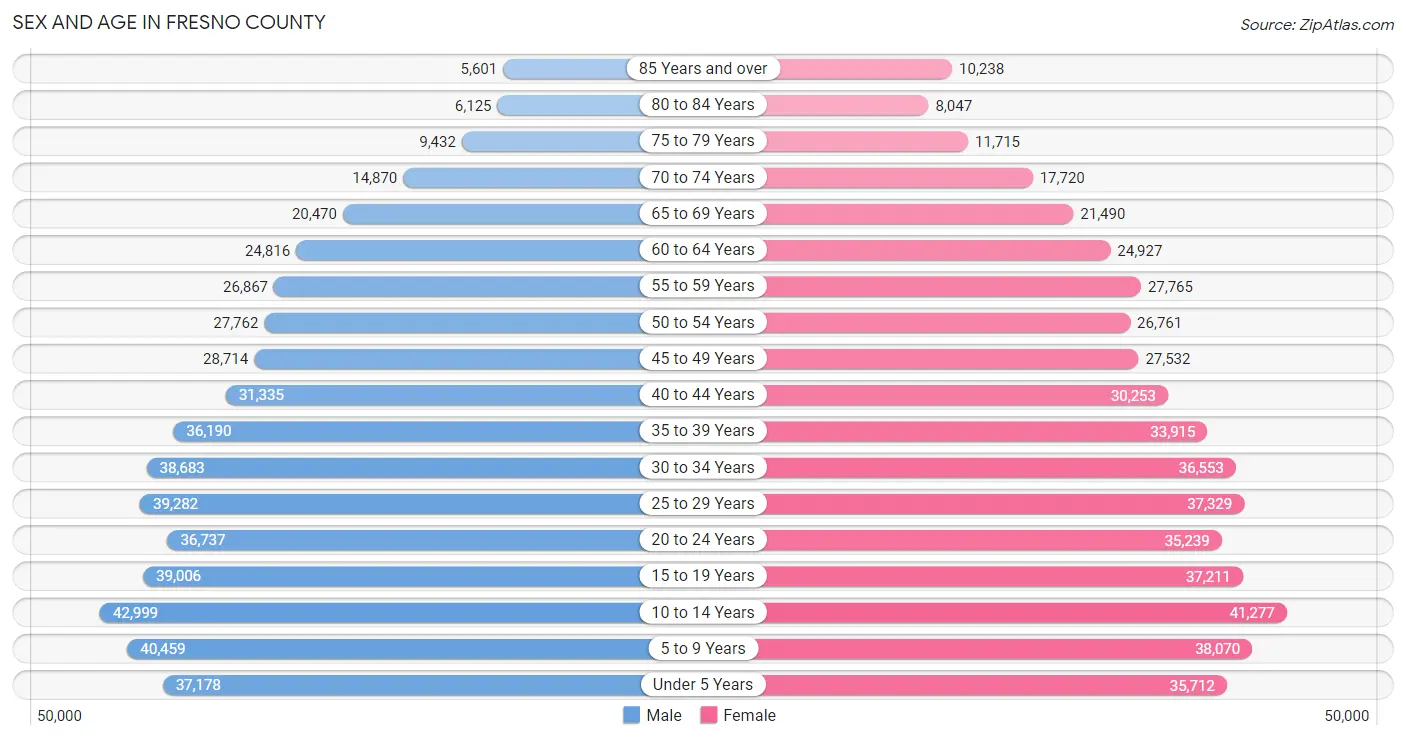
The most populous age groups in Fresno County are 10 to 14 Years (42,999 | 8.5%) for men and 10 to 14 Years (41,277 | 8.2%) for women.
| Age Bracket | Male | Female |
| Under 5 Years | 37,178 (7.3%) | 35,712 (7.1%) |
| 5 to 9 Years | 40,459 (8.0%) | 38,070 (7.6%) |
| 10 to 14 Years | 42,999 (8.5%) | 41,277 (8.2%) |
| 15 to 19 Years | 39,006 (7.7%) | 37,211 (7.4%) |
| 20 to 24 Years | 36,737 (7.2%) | 35,239 (7.0%) |
| 25 to 29 Years | 39,282 (7.8%) | 37,329 (7.4%) |
| 30 to 34 Years | 38,683 (7.6%) | 36,553 (7.3%) |
| 35 to 39 Years | 36,190 (7.1%) | 33,915 (6.8%) |
| 40 to 44 Years | 31,335 (6.2%) | 30,253 (6.0%) |
| 45 to 49 Years | 28,714 (5.7%) | 27,532 (5.5%) |
| 50 to 54 Years | 27,762 (5.5%) | 26,761 (5.3%) |
| 55 to 59 Years | 26,867 (5.3%) | 27,765 (5.5%) |
| 60 to 64 Years | 24,816 (4.9%) | 24,927 (5.0%) |
| 65 to 69 Years | 20,470 (4.0%) | 21,490 (4.3%) |
| 70 to 74 Years | 14,870 (2.9%) | 17,720 (3.5%) |
| 75 to 79 Years | 9,432 (1.9%) | 11,715 (2.3%) |
| 80 to 84 Years | 6,125 (1.2%) | 8,047 (1.6%) |
| 85 Years and over | 5,601 (1.1%) | 10,238 (2.0%) |
| Total | 506,526 (100.0%) | 501,754 (100.0%) |
Families and Households in Fresno County
Median Family Size in Fresno County
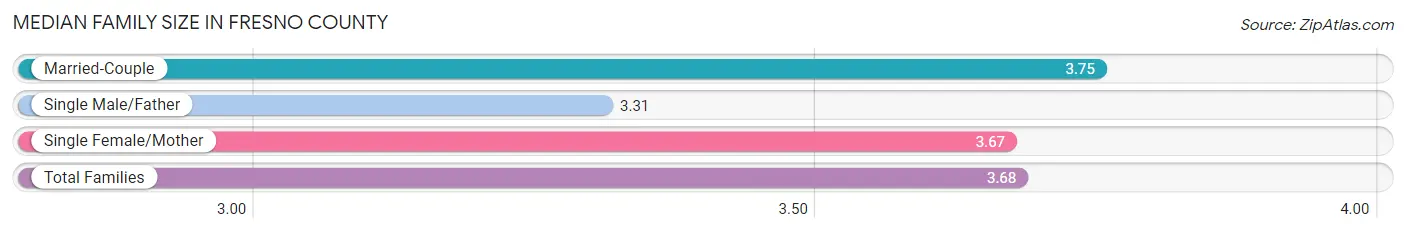
The median family size in Fresno County is 3.68 persons per family, with married-couple families (149,206 | 65.6%) accounting for the largest median family size of 3.75 persons per family. On the other hand, single male/father families (25,176 | 11.1%) represent the smallest median family size with 3.31 persons per family.
| Family Type | # Families | Family Size |
| Married-Couple | 149,206 (65.6%) | 3.75 |
| Single Male/Father | 25,176 (11.1%) | 3.31 |
| Single Female/Mother | 52,881 (23.3%) | 3.67 |
| Total Families | 227,263 (100.0%) | 3.68 |
Median Household Size in Fresno County
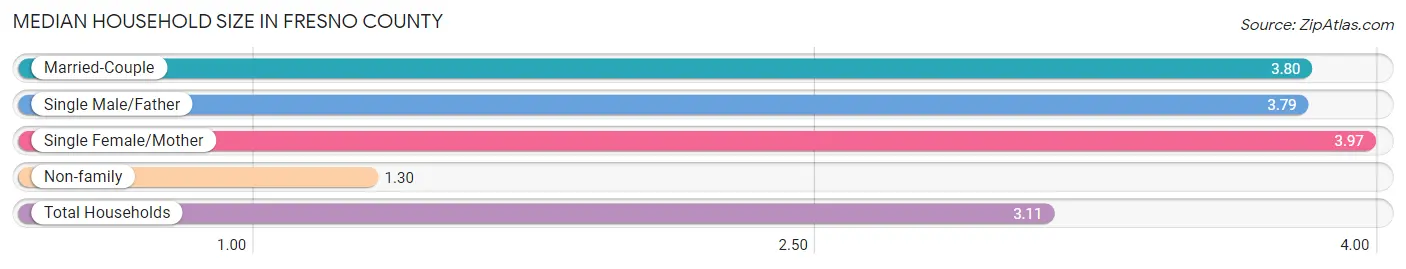
The median household size in Fresno County is 3.11 persons per household, with single female/mother households (52,881 | 16.6%) accounting for the largest median household size of 3.97 persons per household. non-family households (91,059 | 28.6%) represent the smallest median household size with 1.30 persons per household.
| Household Type | # Households | Household Size |
| Married-Couple | 149,206 (46.9%) | 3.80 |
| Single Male/Father | 25,176 (7.9%) | 3.79 |
| Single Female/Mother | 52,881 (16.6%) | 3.97 |
| Non-family | 91,059 (28.6%) | 1.30 |
| Total Households | 318,322 (100.0%) | 3.11 |
Household Size by Marriage Status in Fresno County
Out of a total of 318,322 households in Fresno County, 227,263 (71.4%) are family households, while 91,059 (28.6%) are nonfamily households. The most numerous type of family households are 2-person households, comprising 72,135, and the most common type of nonfamily households are 1-person households, comprising 72,718.
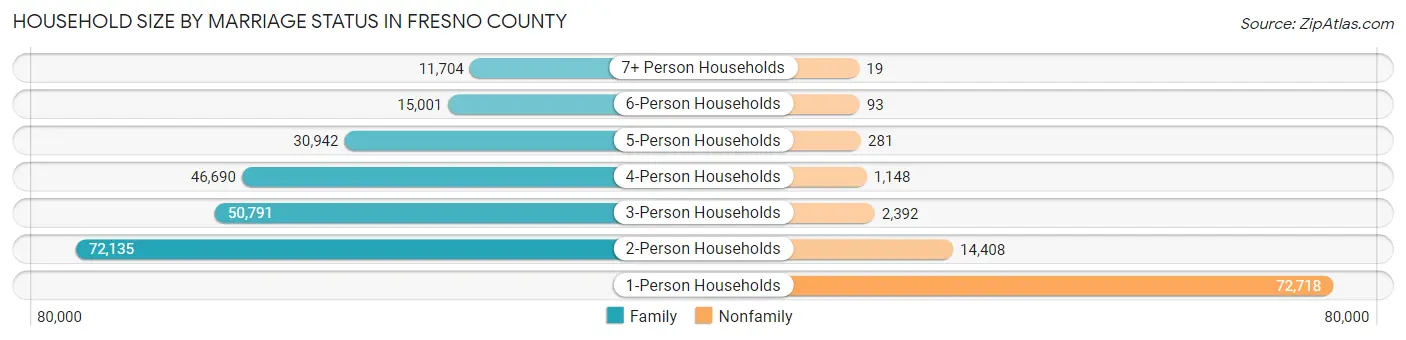
| Household Size | Family Households | Nonfamily Households |
| 1-Person Households | - | 72,718 (22.8%) |
| 2-Person Households | 72,135 (22.7%) | 14,408 (4.5%) |
| 3-Person Households | 50,791 (16.0%) | 2,392 (0.7%) |
| 4-Person Households | 46,690 (14.7%) | 1,148 (0.4%) |
| 5-Person Households | 30,942 (9.7%) | 281 (0.1%) |
| 6-Person Households | 15,001 (4.7%) | 93 (0.0%) |
| 7+ Person Households | 11,704 (3.7%) | 19 (0.0%) |
| Total | 227,263 (71.4%) | 91,059 (28.6%) |
Female Fertility in Fresno County
Fertility by Age in Fresno County
Average fertility rate in Fresno County is 57.0 births per 1,000 women. Women in the age bracket of 20 to 34 years have the highest fertility rate with 94.0 births per 1,000 women. Women in the age bracket of 20 to 34 years acount for 73.7% of all women with births.
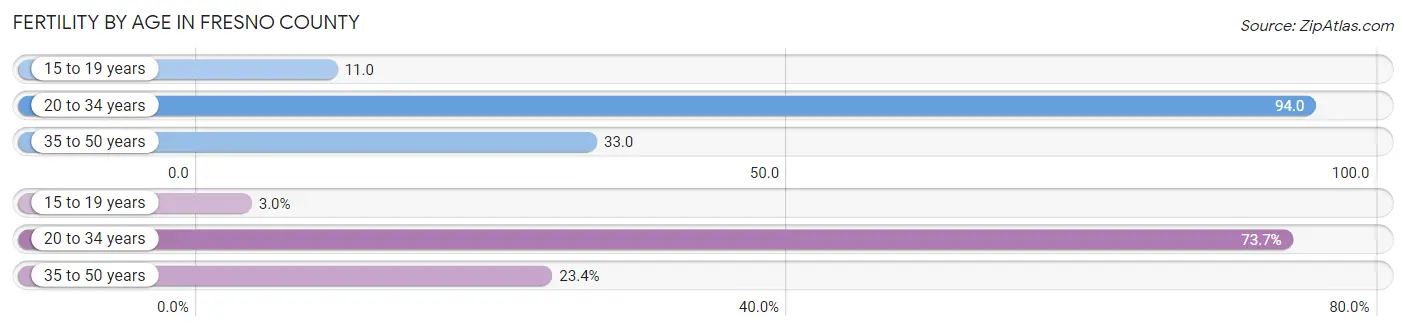
| Age Bracket | Women with Births | Births / 1,000 Women |
| 15 to 19 years | 412 (3.0%) | 11.0 |
| 20 to 34 years | 10,208 (73.7%) | 94.0 |
| 35 to 50 years | 3,239 (23.4%) | 33.0 |
| Total | 13,859 (100.0%) | 57.0 |
Fertility by Age by Marriage Status in Fresno County
63.5% of women with births (13,859) in Fresno County are married. The highest percentage of unmarried women with births falls into 15 to 19 years age bracket with 89.6% of them unmarried at the time of birth, while the lowest percentage of unmarried women with births belong to 35 to 50 years age bracket with 24.9% of them unmarried.
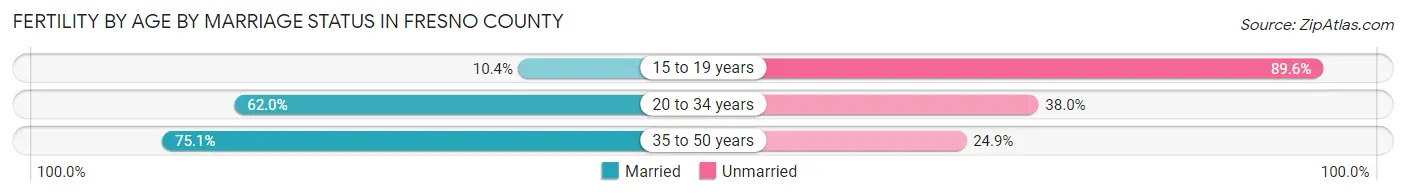
| Age Bracket | Married | Unmarried |
| 15 to 19 years | 43 (10.4%) | 369 (89.6%) |
| 20 to 34 years | 6,329 (62.0%) | 3,879 (38.0%) |
| 35 to 50 years | 2,432 (75.1%) | 807 (24.9%) |
| Total | 8,800 (63.5%) | 5,059 (36.5%) |
Fertility by Education in Fresno County
Average fertility rate in Fresno County is 57.0 births per 1,000 women. Women with the education attainment of high school diploma have the highest fertility rate of 74.0 births per 1,000 women, while women with the education attainment of less than high school have the lowest fertility at 37.0 births per 1,000 women. Women with the education attainment of college or associate's degree represent 32.0% of all women with births.
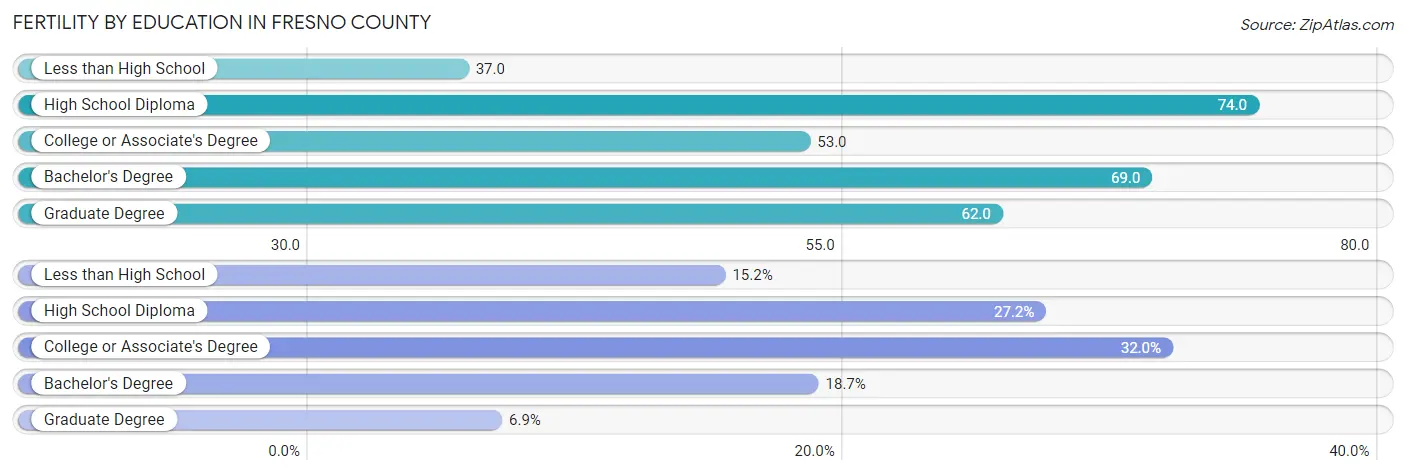
| Educational Attainment | Women with Births | Births / 1,000 Women |
| Less than High School | 2,110 (15.2%) | 37.0 |
| High School Diploma | 3,774 (27.2%) | 74.0 |
| College or Associate's Degree | 4,432 (32.0%) | 53.0 |
| Bachelor's Degree | 2,593 (18.7%) | 69.0 |
| Graduate Degree | 950 (6.9%) | 62.0 |
| Total | 13,859 (100.0%) | 57.0 |
Fertility by Education by Marriage Status in Fresno County
36.5% of women with births in Fresno County are unmarried. Women with the educational attainment of graduate degree are most likely to be married with 96.6% of them married at childbirth, while women with the educational attainment of less than high school are least likely to be married with 50.6% of them unmarried at childbirth.
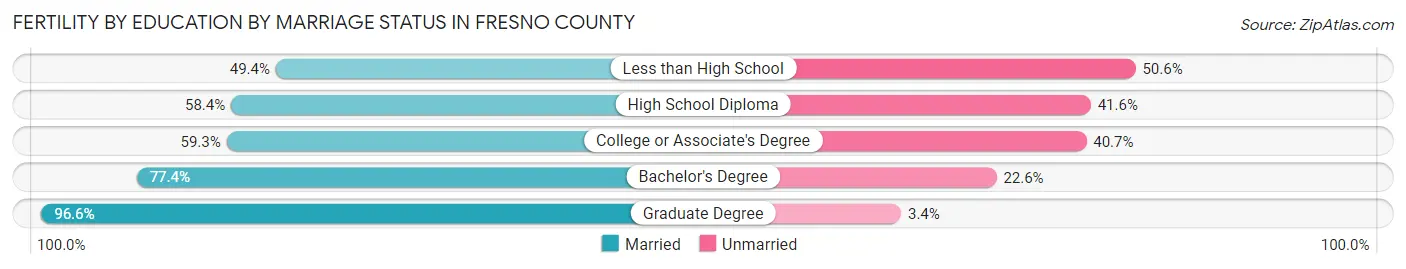
| Educational Attainment | Married | Unmarried |
| Less than High School | 1,042 (49.4%) | 1,068 (50.6%) |
| High School Diploma | 2,204 (58.4%) | 1,570 (41.6%) |
| College or Associate's Degree | 2,628 (59.3%) | 1,804 (40.7%) |
| Bachelor's Degree | 2,007 (77.4%) | 586 (22.6%) |
| Graduate Degree | 918 (96.6%) | 32 (3.4%) |
| Total | 8,800 (63.5%) | 5,059 (36.5%) |
Employment Characteristics in Fresno County
Employment by Class of Employer in Fresno County
Among the 411,511 employed individuals in Fresno County, private company employees (266,449 | 64.7%), local government employees (45,024 | 10.9%), and not-for-profit organizations (30,914 | 7.5%) make up the most common classes of employment.
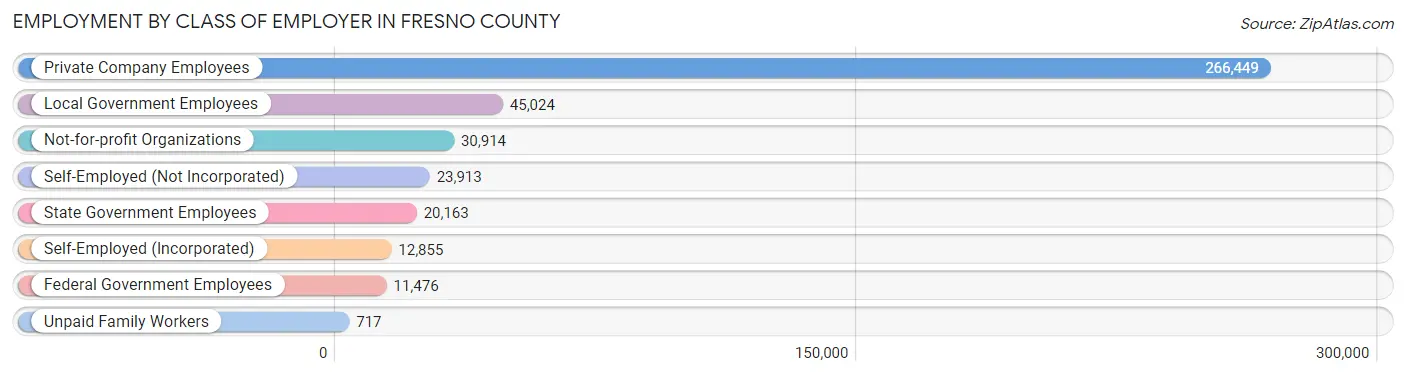
| Employer Class | # Employees | % Employees |
| Private Company Employees | 266,449 | 64.7% |
| Self-Employed (Incorporated) | 12,855 | 3.1% |
| Self-Employed (Not Incorporated) | 23,913 | 5.8% |
| Not-for-profit Organizations | 30,914 | 7.5% |
| Local Government Employees | 45,024 | 10.9% |
| State Government Employees | 20,163 | 4.9% |
| Federal Government Employees | 11,476 | 2.8% |
| Unpaid Family Workers | 717 | 0.2% |
| Total | 411,511 | 100.0% |
Employment Status by Age in Fresno County
According to the labor force statistics for Fresno County, out of the total population over 16 years of age (757,385), 61.3% or 464,277 individuals are in the labor force, with 8.6% or 39,928 of them unemployed. The age group with the highest labor force participation rate is 35 to 44 years, with 79.6% or 104,828 individuals in the labor force. Within the labor force, the 16 to 19 years age range has the highest percentage of unemployed individuals, with 24.7% or 4,250 of them being unemployed.
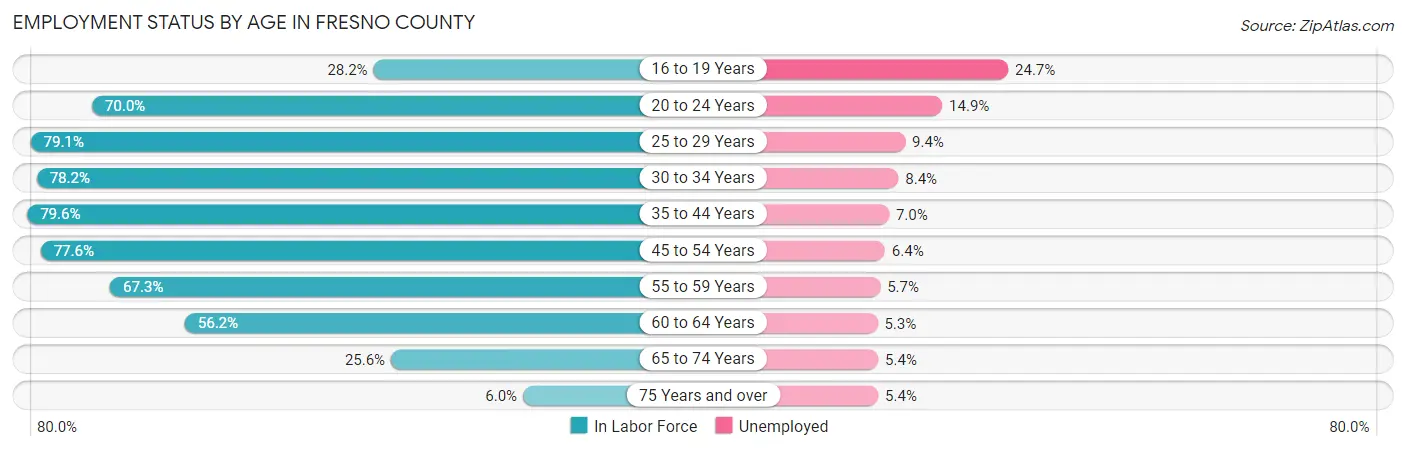
| Age Bracket | In Labor Force | Unemployed |
| 16 to 19 Years | 17,207 (28.2%) | 4,250 (24.7%) |
| 20 to 24 Years | 50,383 (70.0%) | 7,507 (14.9%) |
| 25 to 29 Years | 60,599 (79.1%) | 5,696 (9.4%) |
| 30 to 34 Years | 58,835 (78.2%) | 4,942 (8.4%) |
| 35 to 44 Years | 104,828 (79.6%) | 7,338 (7.0%) |
| 45 to 54 Years | 85,957 (77.6%) | 5,501 (6.4%) |
| 55 to 59 Years | 36,767 (67.3%) | 2,096 (5.7%) |
| 60 to 64 Years | 27,956 (56.2%) | 1,482 (5.3%) |
| 65 to 74 Years | 19,085 (25.6%) | 1,031 (5.4%) |
| 75 Years and over | 3,069 (6.0%) | 166 (5.4%) |
| Total | 464,277 (61.3%) | 39,928 (8.6%) |
Employment Status by Educational Attainment in Fresno County
According to labor force statistics for Fresno County, 75.2% of individuals (375,010) out of the total population between 25 and 64 years of age (498,684) are in the labor force, with 7.2% or 27,001 of them being unemployed. The group with the highest labor force participation rate are those with the educational attainment of bachelor's degree or higher, with 86.9% or 100,307 individuals in the labor force. Within the labor force, individuals with less than high school education have the highest percentage of unemployment, with 10.9% or 7,424 of them being unemployed.
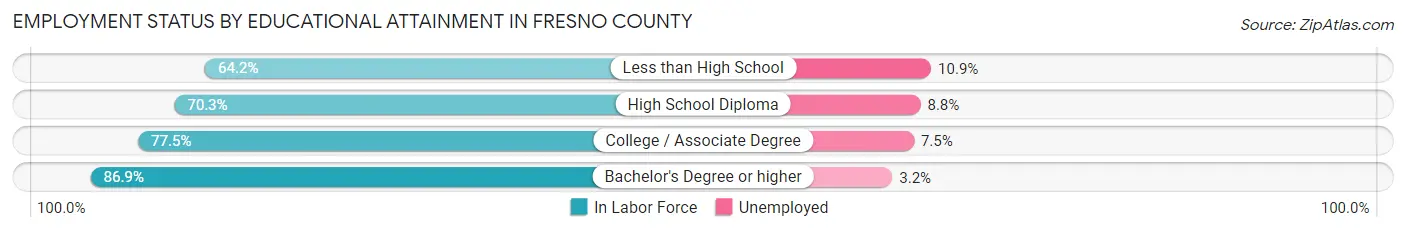
| Educational Attainment | In Labor Force | Unemployed |
| Less than High School | 68,106 (64.2%) | 11,563 (10.9%) |
| High School Diploma | 81,087 (70.3%) | 10,150 (8.8%) |
| College / Associate Degree | 125,417 (77.5%) | 12,137 (7.5%) |
| Bachelor's Degree or higher | 100,307 (86.9%) | 3,694 (3.2%) |
| Total | 375,010 (75.2%) | 35,905 (7.2%) |
Employment Occupations by Sex in Fresno County
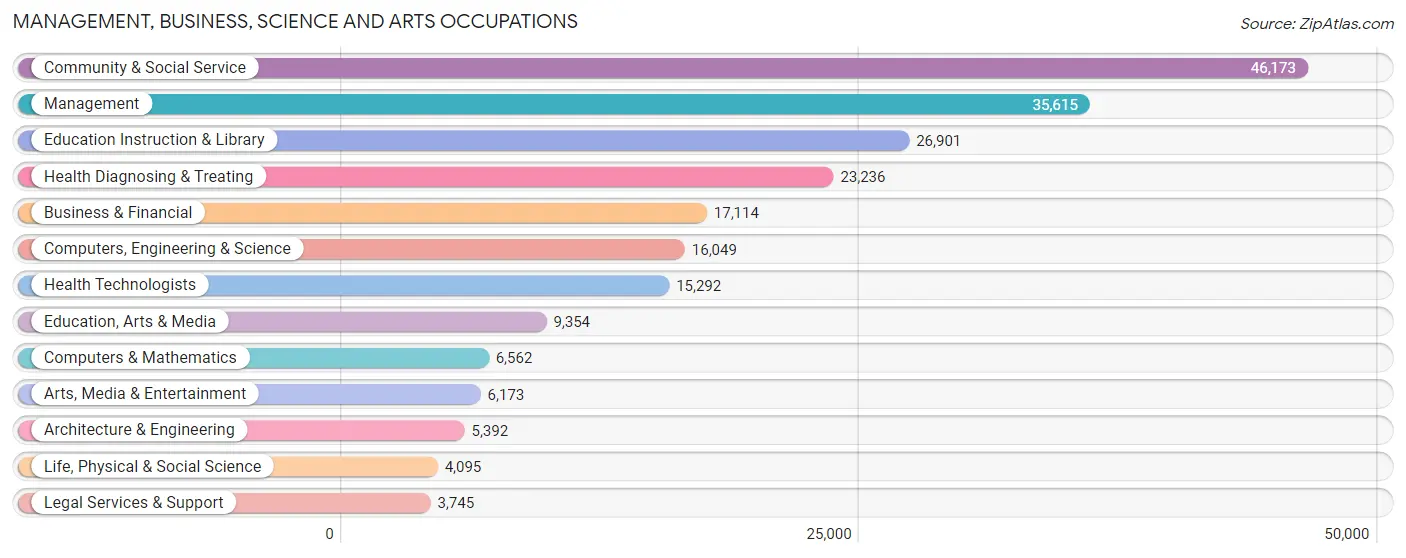
Management, Business, Science and Arts Occupations
The most common Management, Business, Science and Arts occupations in Fresno County are Community & Social Service (46,173 | 10.9%), Management (35,615 | 8.4%), Education Instruction & Library (26,901 | 6.4%), Health Diagnosing & Treating (23,236 | 5.5%), and Business & Financial (17,114 | 4.0%).
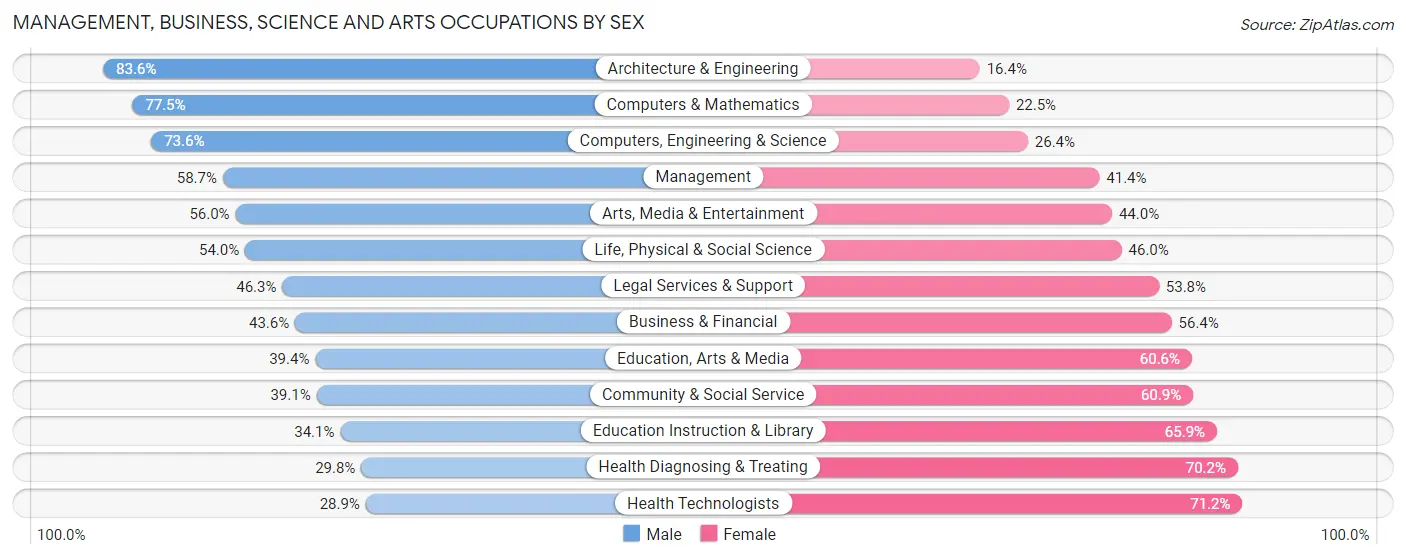
Management, Business, Science and Arts Occupations by Sex
Within the Management, Business, Science and Arts occupations in Fresno County, the most male-oriented occupations are Architecture & Engineering (83.6%), Computers & Mathematics (77.5%), and Computers, Engineering & Science (73.6%), while the most female-oriented occupations are Health Technologists (71.2%), Health Diagnosing & Treating (70.2%), and Education Instruction & Library (65.9%).
| Occupation | Male | Female |
| Management | 20,888 (58.7%) | 14,727 (41.3%) |
| Business & Financial | 7,458 (43.6%) | 9,656 (56.4%) |
| Computers, Engineering & Science | 11,807 (73.6%) | 4,242 (26.4%) |
| Computers & Mathematics | 5,087 (77.5%) | 1,475 (22.5%) |
| Architecture & Engineering | 4,508 (83.6%) | 884 (16.4%) |
| Life, Physical & Social Science | 2,212 (54.0%) | 1,883 (46.0%) |
| Community & Social Service | 18,058 (39.1%) | 28,115 (60.9%) |
| Education, Arts & Media | 3,683 (39.4%) | 5,671 (60.6%) |
| Legal Services & Support | 1,732 (46.3%) | 2,013 (53.7%) |
| Education Instruction & Library | 9,185 (34.1%) | 17,716 (65.9%) |
| Arts, Media & Entertainment | 3,458 (56.0%) | 2,715 (44.0%) |
| Health Diagnosing & Treating | 6,919 (29.8%) | 16,317 (70.2%) |
| Health Technologists | 4,411 (28.8%) | 10,881 (71.2%) |
| Total (Category) | 65,130 (47.1%) | 73,057 (52.9%) |
| Total (Overall) | 231,419 (54.7%) | 191,980 (45.3%) |
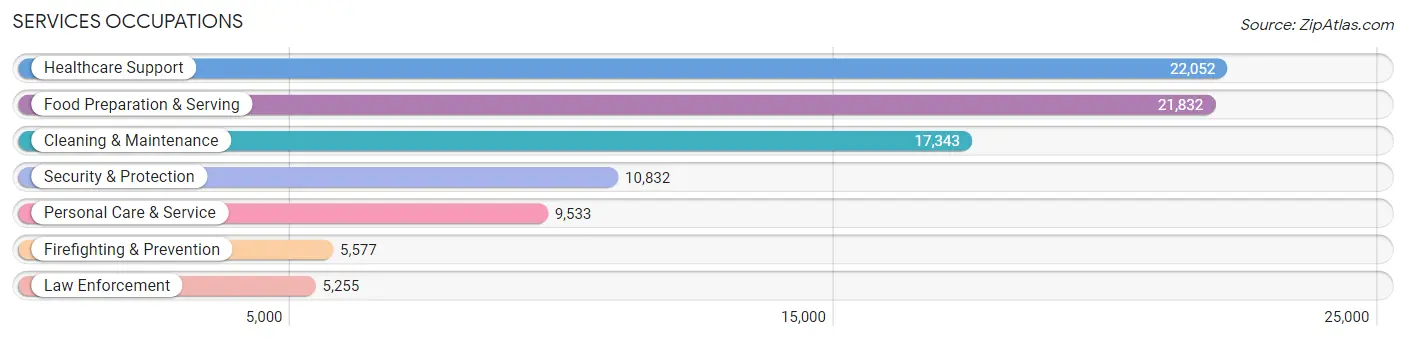
Services Occupations
The most common Services occupations in Fresno County are Healthcare Support (22,052 | 5.2%), Food Preparation & Serving (21,832 | 5.2%), Cleaning & Maintenance (17,343 | 4.1%), Security & Protection (10,832 | 2.6%), and Personal Care & Service (9,533 | 2.2%).
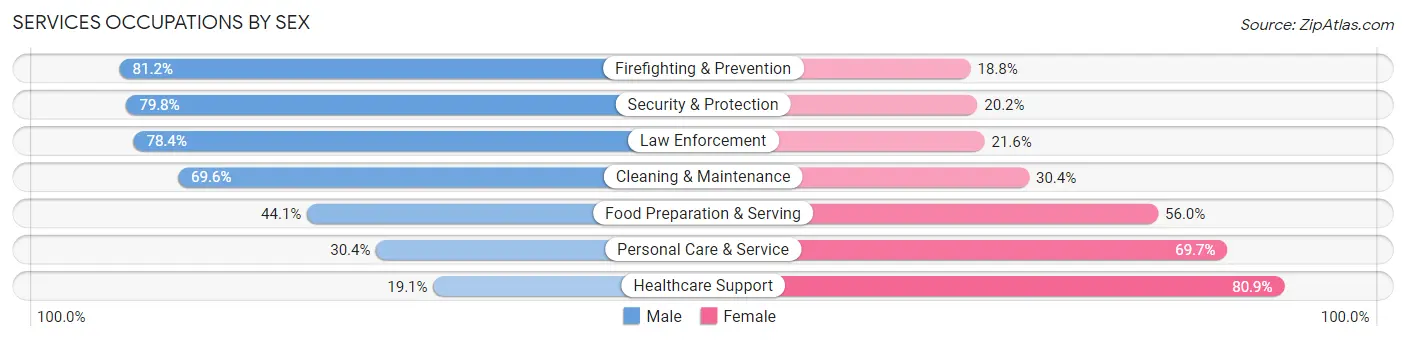
Services Occupations by Sex
Within the Services occupations in Fresno County, the most male-oriented occupations are Firefighting & Prevention (81.2%), Security & Protection (79.8%), and Law Enforcement (78.4%), while the most female-oriented occupations are Healthcare Support (80.9%), Personal Care & Service (69.7%), and Food Preparation & Serving (55.9%).
| Occupation | Male | Female |
| Healthcare Support | 4,203 (19.1%) | 17,849 (80.9%) |
| Security & Protection | 8,648 (79.8%) | 2,184 (20.2%) |
| Firefighting & Prevention | 4,527 (81.2%) | 1,050 (18.8%) |
| Law Enforcement | 4,121 (78.4%) | 1,134 (21.6%) |
| Food Preparation & Serving | 9,617 (44.1%) | 12,215 (55.9%) |
| Cleaning & Maintenance | 12,073 (69.6%) | 5,270 (30.4%) |
| Personal Care & Service | 2,893 (30.3%) | 6,640 (69.7%) |
| Total (Category) | 37,434 (45.9%) | 44,158 (54.1%) |
| Total (Overall) | 231,419 (54.7%) | 191,980 (45.3%) |
Sales and Office Occupations
The most common Sales and Office occupations in Fresno County are Office & Administration (45,238 | 10.7%), and Sales & Related (39,729 | 9.4%).
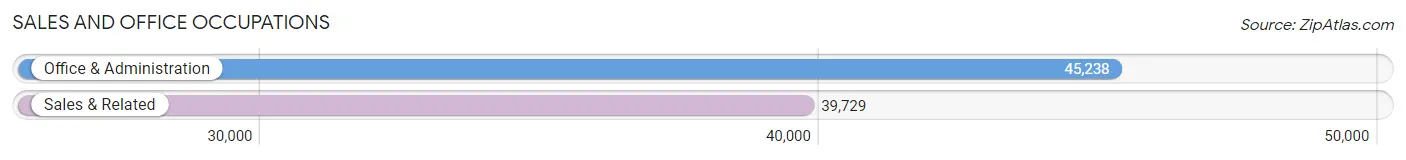
Sales and Office Occupations by Sex
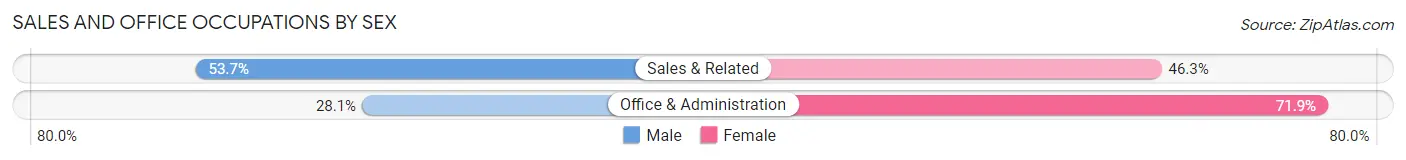
| Occupation | Male | Female |
| Sales & Related | 21,332 (53.7%) | 18,397 (46.3%) |
| Office & Administration | 12,711 (28.1%) | 32,527 (71.9%) |
| Total (Category) | 34,043 (40.1%) | 50,924 (59.9%) |
| Total (Overall) | 231,419 (54.7%) | 191,980 (45.3%) |
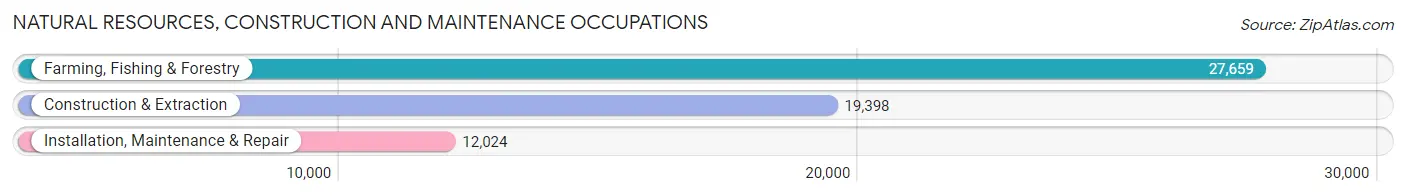
Natural Resources, Construction and Maintenance Occupations
The most common Natural Resources, Construction and Maintenance occupations in Fresno County are Farming, Fishing & Forestry (27,659 | 6.5%), Construction & Extraction (19,398 | 4.6%), and Installation, Maintenance & Repair (12,024 | 2.8%).
Natural Resources, Construction and Maintenance Occupations by Sex
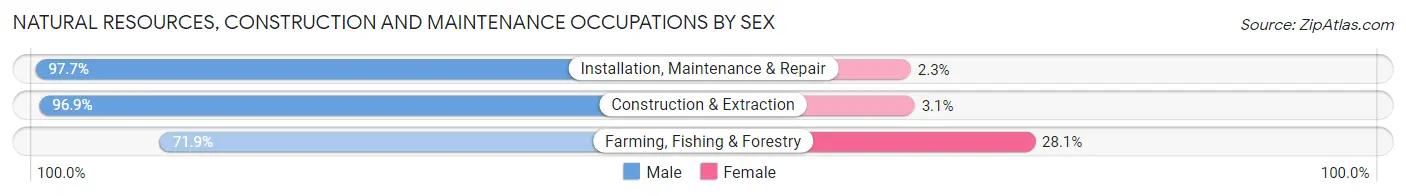
| Occupation | Male | Female |
| Farming, Fishing & Forestry | 19,879 (71.9%) | 7,780 (28.1%) |
| Construction & Extraction | 18,800 (96.9%) | 598 (3.1%) |
| Installation, Maintenance & Repair | 11,751 (97.7%) | 273 (2.3%) |
| Total (Category) | 50,430 (85.4%) | 8,651 (14.6%) |
| Total (Overall) | 231,419 (54.7%) | 191,980 (45.3%) |
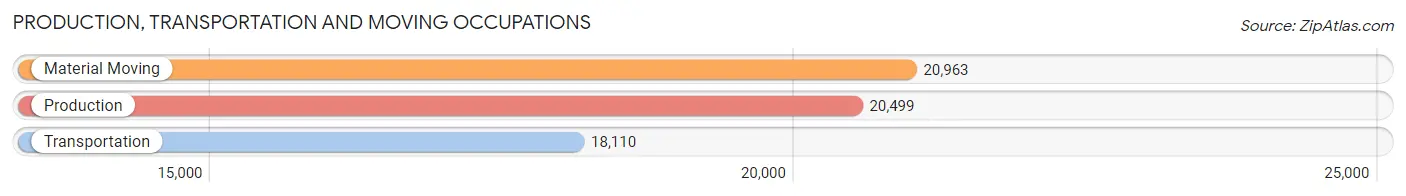
Production, Transportation and Moving Occupations
The most common Production, Transportation and Moving occupations in Fresno County are Material Moving (20,963 | 5.0%), Production (20,499 | 4.8%), and Transportation (18,110 | 4.3%).
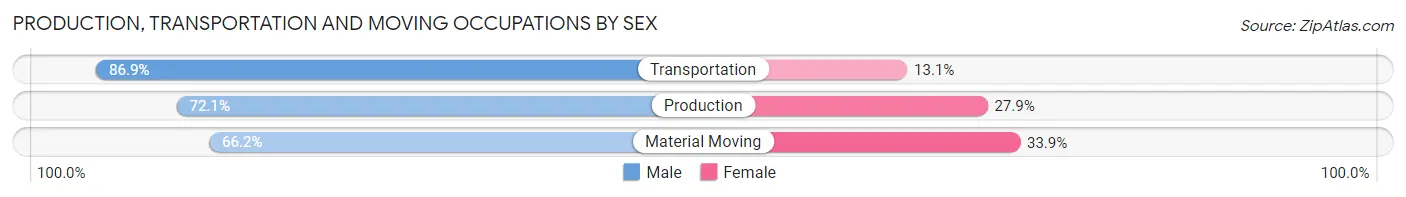
Production, Transportation and Moving Occupations by Sex
| Occupation | Male | Female |
| Production | 14,784 (72.1%) | 5,715 (27.9%) |
| Transportation | 15,731 (86.9%) | 2,379 (13.1%) |
| Material Moving | 13,867 (66.1%) | 7,096 (33.9%) |
| Total (Category) | 44,382 (74.5%) | 15,190 (25.5%) |
| Total (Overall) | 231,419 (54.7%) | 191,980 (45.3%) |
Employment Industries by Sex in Fresno County
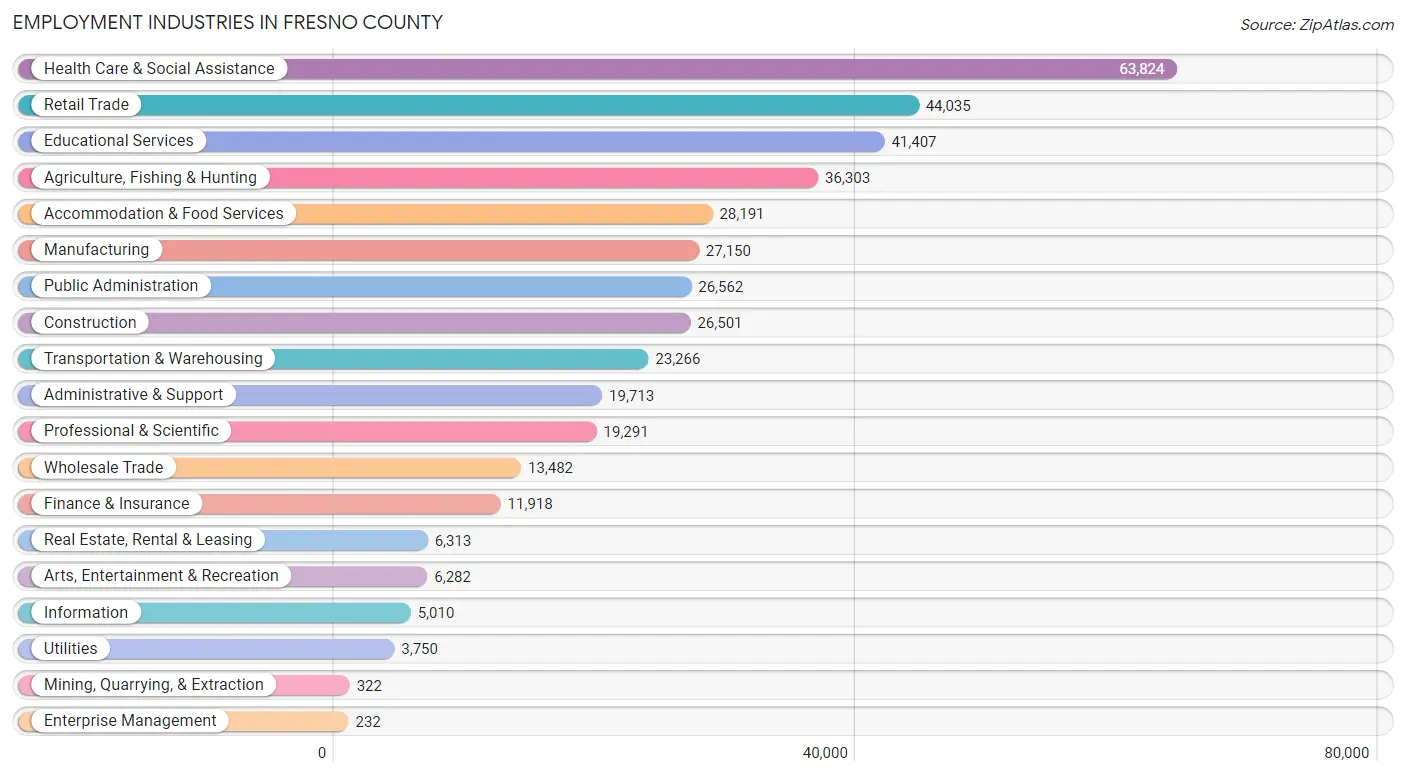
Employment Industries in Fresno County
The major employment industries in Fresno County include Health Care & Social Assistance (63,824 | 15.1%), Retail Trade (44,035 | 10.4%), Educational Services (41,407 | 9.8%), Agriculture, Fishing & Hunting (36,303 | 8.6%), and Accommodation & Food Services (28,191 | 6.7%).
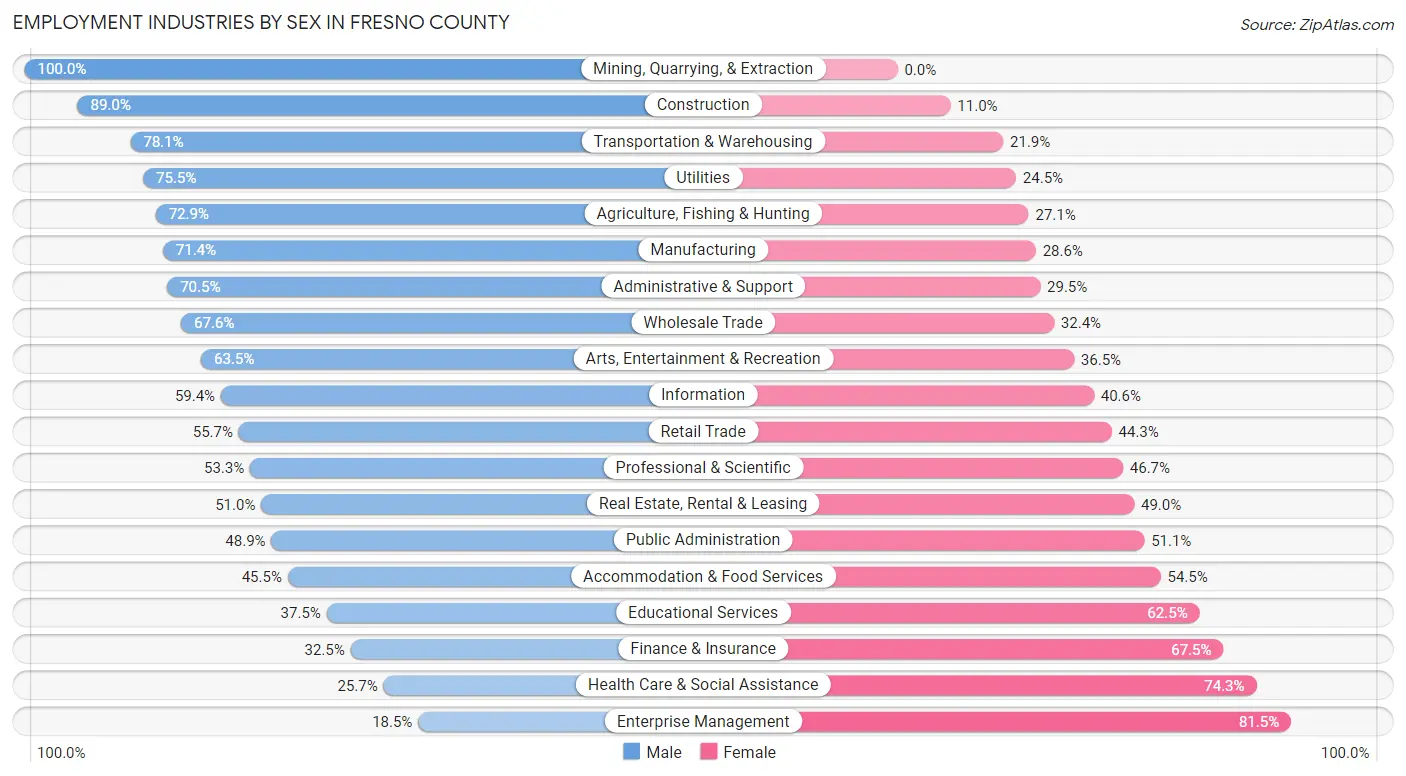
Employment Industries by Sex in Fresno County
The Fresno County industries that see more men than women are Mining, Quarrying, & Extraction (100.0%), Construction (89.0%), and Transportation & Warehousing (78.1%), whereas the industries that tend to have a higher number of women are Enterprise Management (81.5%), Health Care & Social Assistance (74.3%), and Finance & Insurance (67.5%).
| Industry | Male | Female |
| Agriculture, Fishing & Hunting | 26,449 (72.9%) | 9,854 (27.1%) |
| Mining, Quarrying, & Extraction | 322 (100.0%) | 0 (0.0%) |
| Construction | 23,593 (89.0%) | 2,908 (11.0%) |
| Manufacturing | 19,381 (71.4%) | 7,769 (28.6%) |
| Wholesale Trade | 9,115 (67.6%) | 4,367 (32.4%) |
| Retail Trade | 24,511 (55.7%) | 19,524 (44.3%) |
| Transportation & Warehousing | 18,176 (78.1%) | 5,090 (21.9%) |
| Utilities | 2,830 (75.5%) | 920 (24.5%) |
| Information | 2,974 (59.4%) | 2,036 (40.6%) |
| Finance & Insurance | 3,878 (32.5%) | 8,040 (67.5%) |
| Real Estate, Rental & Leasing | 3,221 (51.0%) | 3,092 (49.0%) |
| Professional & Scientific | 10,290 (53.3%) | 9,001 (46.7%) |
| Enterprise Management | 43 (18.5%) | 189 (81.5%) |
| Administrative & Support | 13,891 (70.5%) | 5,822 (29.5%) |
| Educational Services | 15,520 (37.5%) | 25,887 (62.5%) |
| Health Care & Social Assistance | 16,411 (25.7%) | 47,413 (74.3%) |
| Arts, Entertainment & Recreation | 3,987 (63.5%) | 2,295 (36.5%) |
| Accommodation & Food Services | 12,835 (45.5%) | 15,356 (54.5%) |
| Public Administration | 12,993 (48.9%) | 13,569 (51.1%) |
| Total | 231,419 (54.7%) | 191,980 (45.3%) |
Education in Fresno County
School Enrollment in Fresno County
The most common levels of schooling among the 298,774 students in Fresno County are high school (65,780 | 22.0%), middle school (65,292 | 21.8%), and college / undergraduate (63,689 | 21.3%).
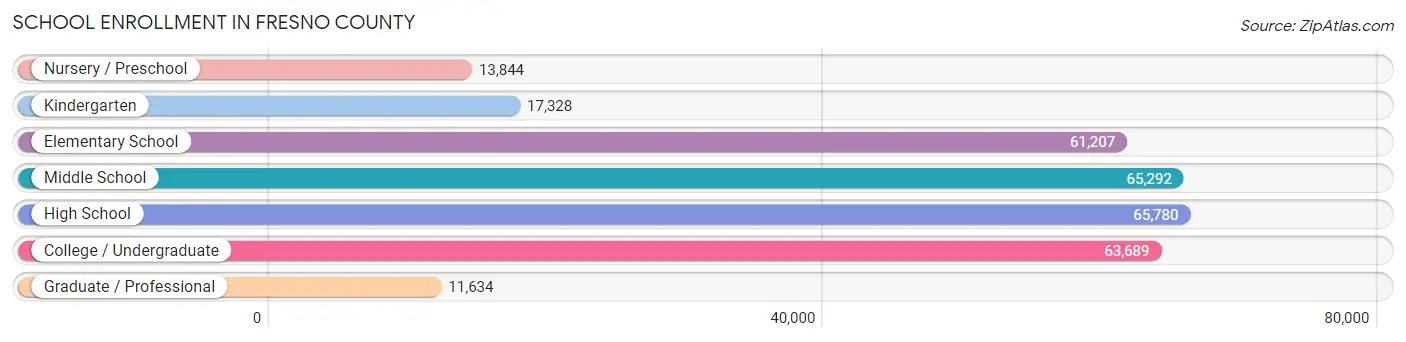
| School Level | # Students | % Students |
| Nursery / Preschool | 13,844 | 4.6% |
| Kindergarten | 17,328 | 5.8% |
| Elementary School | 61,207 | 20.5% |
| Middle School | 65,292 | 21.8% |
| High School | 65,780 | 22.0% |
| College / Undergraduate | 63,689 | 21.3% |
| Graduate / Professional | 11,634 | 3.9% |
| Total | 298,774 | 100.0% |
School Enrollment by Age by Funding Source in Fresno County
Out of a total of 298,774 students who are enrolled in schools in Fresno County, 24,201 (8.1%) attend a private institution, while the remaining 274,573 (91.9%) are enrolled in public schools. The age group of 35 years and over has the highest likelihood of being enrolled in private schools, with 3,220 (21.9% in the age bracket) enrolled. Conversely, the age group of 15 to 17 year olds has the lowest likelihood of being enrolled in a private school, with 43,531 (95.7% in the age bracket) attending a public institution.
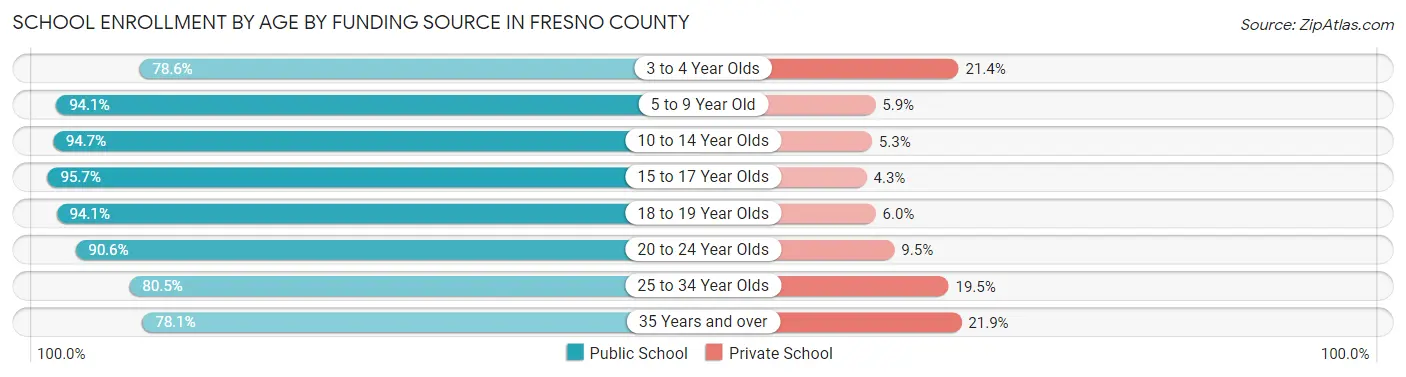
| Age Bracket | Public School | Private School |
| 3 to 4 Year Olds | 8,930 (78.6%) | 2,431 (21.4%) |
| 5 to 9 Year Old | 69,463 (94.1%) | 4,354 (5.9%) |
| 10 to 14 Year Olds | 78,232 (94.7%) | 4,343 (5.3%) |
| 15 to 17 Year Olds | 43,531 (95.7%) | 1,941 (4.3%) |
| 18 to 19 Year Olds | 19,873 (94.1%) | 1,258 (5.9%) |
| 20 to 24 Year Olds | 26,991 (90.5%) | 2,818 (9.5%) |
| 25 to 34 Year Olds | 16,036 (80.5%) | 3,891 (19.5%) |
| 35 Years and over | 11,462 (78.1%) | 3,220 (21.9%) |
| Total | 274,573 (91.9%) | 24,201 (8.1%) |
Educational Attainment by Field of Study in Fresno County
Business (26,131 | 16.8%), science & technology (18,415 | 11.8%), education (14,072 | 9.1%), social sciences (13,728 | 8.8%), and liberal arts & history (13,544 | 8.7%) are the most common fields of study among 155,354 individuals in Fresno County who have obtained a bachelor's degree or higher.
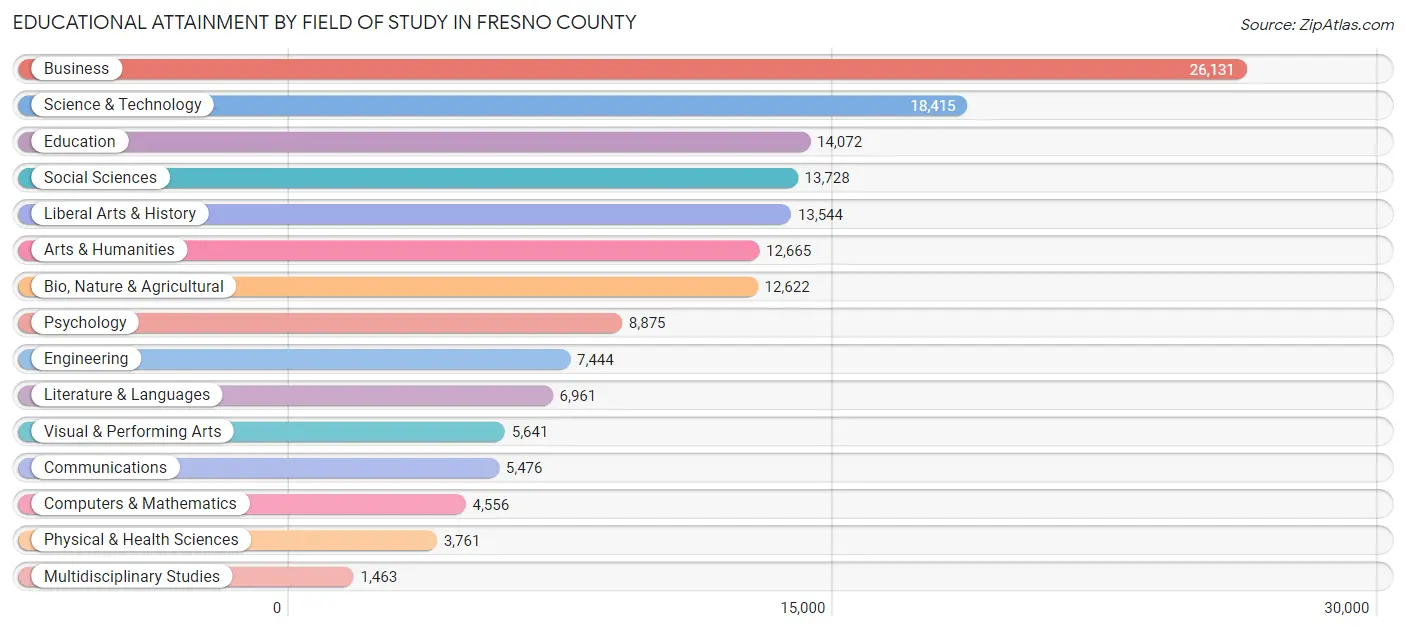
| Field of Study | # Graduates | % Graduates |
| Computers & Mathematics | 4,556 | 2.9% |
| Bio, Nature & Agricultural | 12,622 | 8.1% |
| Physical & Health Sciences | 3,761 | 2.4% |
| Psychology | 8,875 | 5.7% |
| Social Sciences | 13,728 | 8.8% |
| Engineering | 7,444 | 4.8% |
| Multidisciplinary Studies | 1,463 | 0.9% |
| Science & Technology | 18,415 | 11.8% |
| Business | 26,131 | 16.8% |
| Education | 14,072 | 9.1% |
| Literature & Languages | 6,961 | 4.5% |
| Liberal Arts & History | 13,544 | 8.7% |
| Visual & Performing Arts | 5,641 | 3.6% |
| Communications | 5,476 | 3.5% |
| Arts & Humanities | 12,665 | 8.2% |
| Total | 155,354 | 100.0% |
Transportation & Commute in Fresno County
Vehicle Availability by Sex in Fresno County
The most prevalent vehicle ownership categories in Fresno County are males with 2 vehicles (87,470, accounting for 38.8%) and females with 2 vehicles (70,927, making up 47.5%).
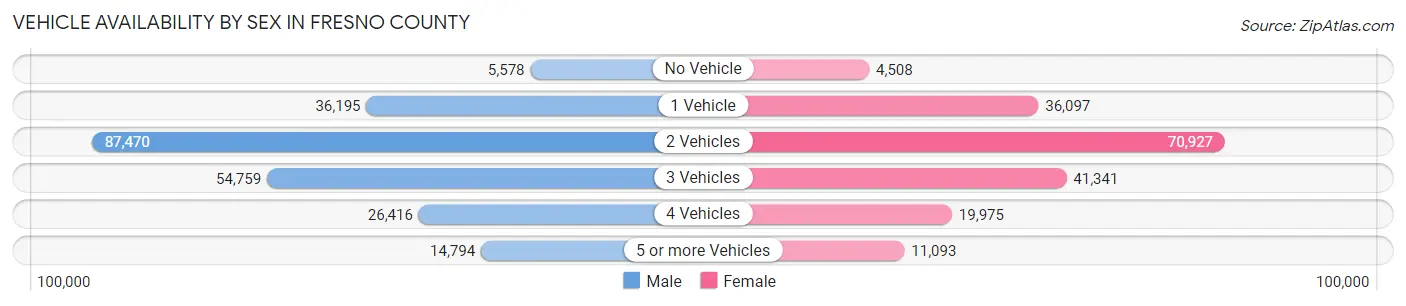
| Vehicles Available | Male | Female |
| No Vehicle | 5,578 (2.5%) | 4,508 (2.5%) |
| 1 Vehicle | 36,195 (16.1%) | 36,097 (19.6%) |
| 2 Vehicles | 87,470 (38.8%) | 70,927 (38.6%) |
| 3 Vehicles | 54,759 (24.3%) | 41,341 (22.5%) |
| 4 Vehicles | 26,416 (11.7%) | 19,975 (10.9%) |
| 5 or more Vehicles | 14,794 (6.6%) | 11,093 (6.0%) |
| Total | 225,212 (100.0%) | 183,941 (100.0%) |
Commute Time in Fresno County
The most frequently occuring commute durations in Fresno County are 15 to 19 minutes (74,716 commuters, 19.8%), 20 to 24 minutes (71,759 commuters, 19.0%), and 10 to 14 minutes (52,481 commuters, 13.9%).
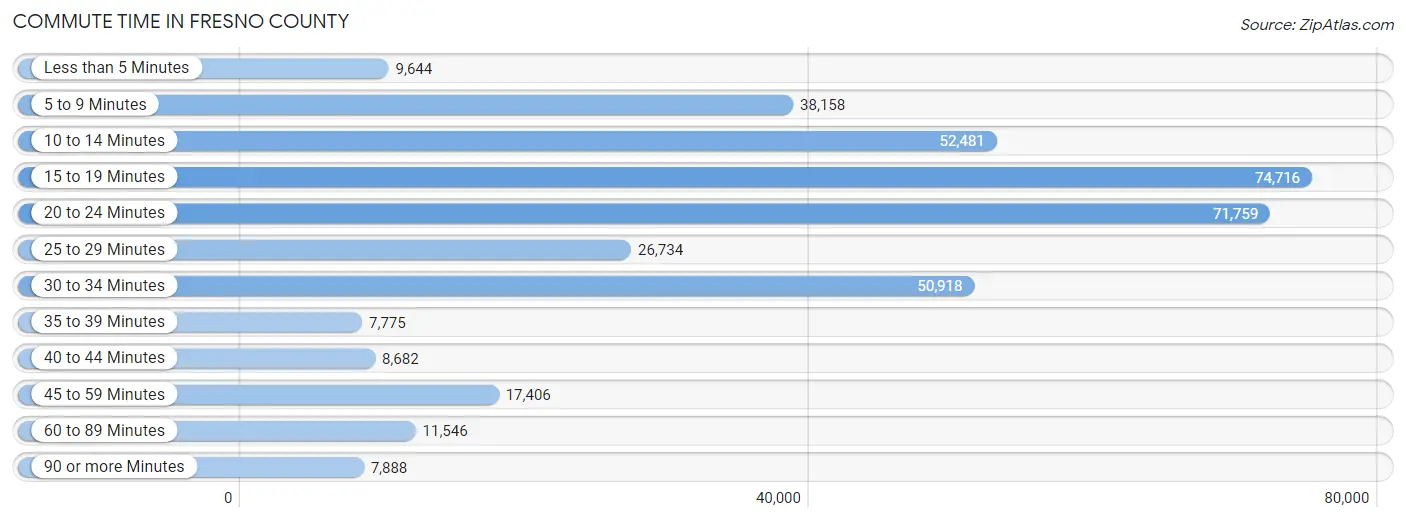
| Commute Time | # Commuters | % Commuters |
| Less than 5 Minutes | 9,644 | 2.5% |
| 5 to 9 Minutes | 38,158 | 10.1% |
| 10 to 14 Minutes | 52,481 | 13.9% |
| 15 to 19 Minutes | 74,716 | 19.8% |
| 20 to 24 Minutes | 71,759 | 19.0% |
| 25 to 29 Minutes | 26,734 | 7.1% |
| 30 to 34 Minutes | 50,918 | 13.5% |
| 35 to 39 Minutes | 7,775 | 2.1% |
| 40 to 44 Minutes | 8,682 | 2.3% |
| 45 to 59 Minutes | 17,406 | 4.6% |
| 60 to 89 Minutes | 11,546 | 3.1% |
| 90 or more Minutes | 7,888 | 2.1% |
Commute Time by Sex in Fresno County
The most common commute times in Fresno County are 20 to 24 minutes (40,964 commuters, 19.4%) for males and 15 to 19 minutes (34,624 commuters, 20.8%) for females.
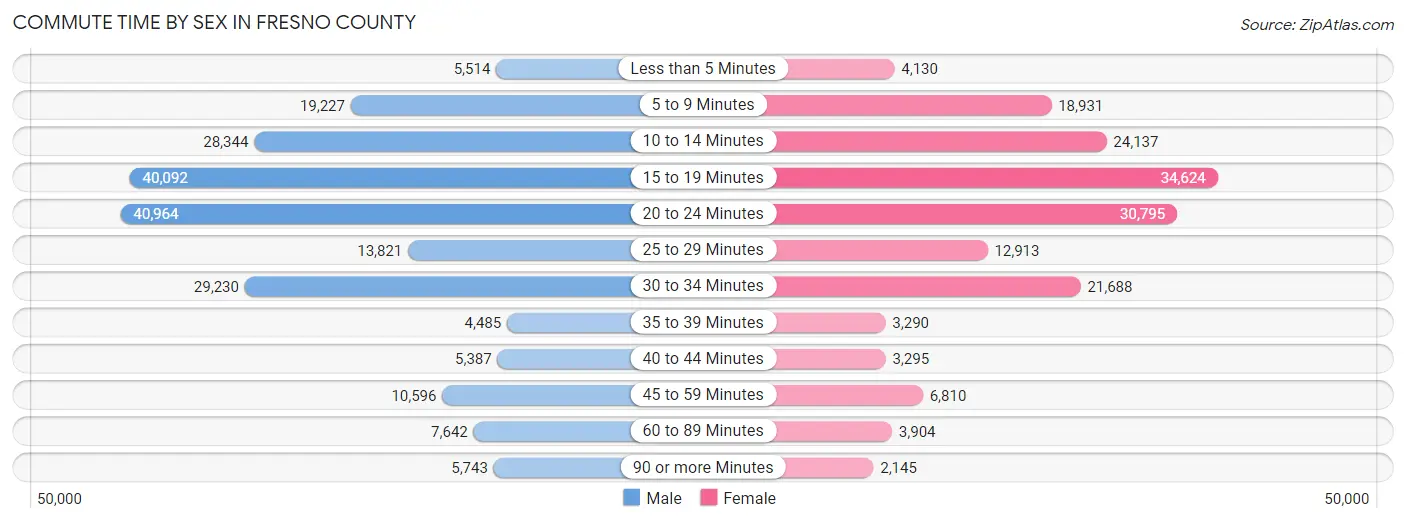
| Commute Time | Male | Female |
| Less than 5 Minutes | 5,514 (2.6%) | 4,130 (2.5%) |
| 5 to 9 Minutes | 19,227 (9.1%) | 18,931 (11.4%) |
| 10 to 14 Minutes | 28,344 (13.4%) | 24,137 (14.5%) |
| 15 to 19 Minutes | 40,092 (19.0%) | 34,624 (20.8%) |
| 20 to 24 Minutes | 40,964 (19.4%) | 30,795 (18.5%) |
| 25 to 29 Minutes | 13,821 (6.6%) | 12,913 (7.7%) |
| 30 to 34 Minutes | 29,230 (13.9%) | 21,688 (13.0%) |
| 35 to 39 Minutes | 4,485 (2.1%) | 3,290 (2.0%) |
| 40 to 44 Minutes | 5,387 (2.5%) | 3,295 (2.0%) |
| 45 to 59 Minutes | 10,596 (5.0%) | 6,810 (4.1%) |
| 60 to 89 Minutes | 7,642 (3.6%) | 3,904 (2.3%) |
| 90 or more Minutes | 5,743 (2.7%) | 2,145 (1.3%) |
Time of Departure to Work by Sex in Fresno County
The most frequent times of departure to work in Fresno County are 7:00 AM to 7:29 AM (32,445, 15.4%) for males and 7:00 AM to 7:29 AM (31,470, 18.9%) for females.
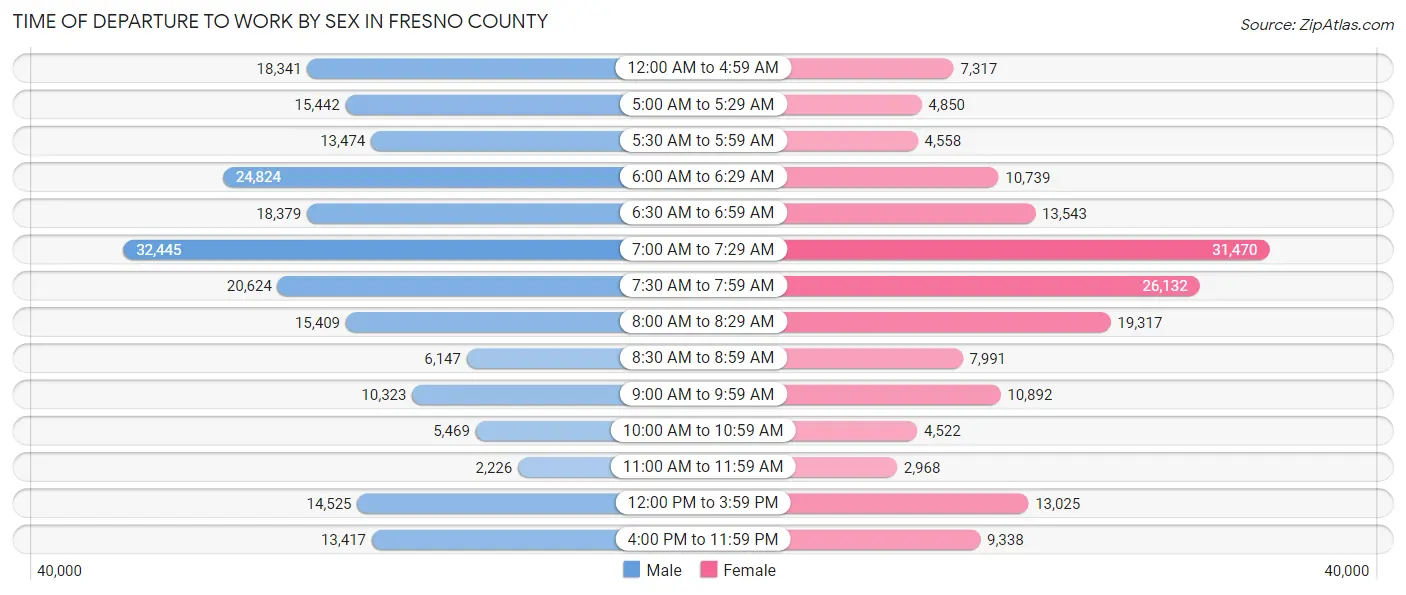
| Time of Departure | Male | Female |
| 12:00 AM to 4:59 AM | 18,341 (8.7%) | 7,317 (4.4%) |
| 5:00 AM to 5:29 AM | 15,442 (7.3%) | 4,850 (2.9%) |
| 5:30 AM to 5:59 AM | 13,474 (6.4%) | 4,558 (2.7%) |
| 6:00 AM to 6:29 AM | 24,824 (11.8%) | 10,739 (6.4%) |
| 6:30 AM to 6:59 AM | 18,379 (8.7%) | 13,543 (8.1%) |
| 7:00 AM to 7:29 AM | 32,445 (15.4%) | 31,470 (18.9%) |
| 7:30 AM to 7:59 AM | 20,624 (9.8%) | 26,132 (15.7%) |
| 8:00 AM to 8:29 AM | 15,409 (7.3%) | 19,317 (11.6%) |
| 8:30 AM to 8:59 AM | 6,147 (2.9%) | 7,991 (4.8%) |
| 9:00 AM to 9:59 AM | 10,323 (4.9%) | 10,892 (6.5%) |
| 10:00 AM to 10:59 AM | 5,469 (2.6%) | 4,522 (2.7%) |
| 11:00 AM to 11:59 AM | 2,226 (1.1%) | 2,968 (1.8%) |
| 12:00 PM to 3:59 PM | 14,525 (6.9%) | 13,025 (7.8%) |
| 4:00 PM to 11:59 PM | 13,417 (6.4%) | 9,338 (5.6%) |
| Total | 211,045 (100.0%) | 166,662 (100.0%) |
Housing Occupancy in Fresno County
Occupancy by Ownership in Fresno County
Of the total 318,322 dwellings in Fresno County, owner-occupied units account for 172,455 (54.2%), while renter-occupied units make up 145,867 (45.8%).
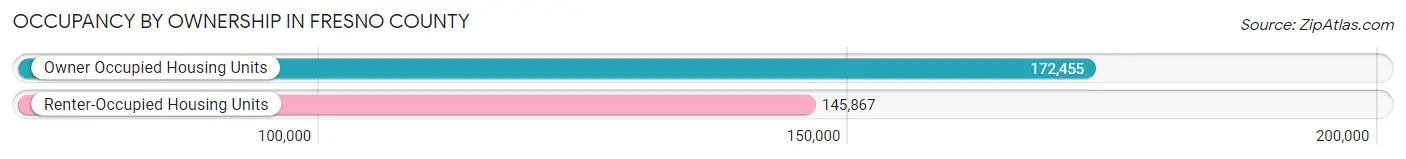
| Occupancy | # Housing Units | % Housing Units |
| Owner Occupied Housing Units | 172,455 | 54.2% |
| Renter-Occupied Housing Units | 145,867 | 45.8% |
| Total Occupied Housing Units | 318,322 | 100.0% |
Occupancy by Household Size in Fresno County
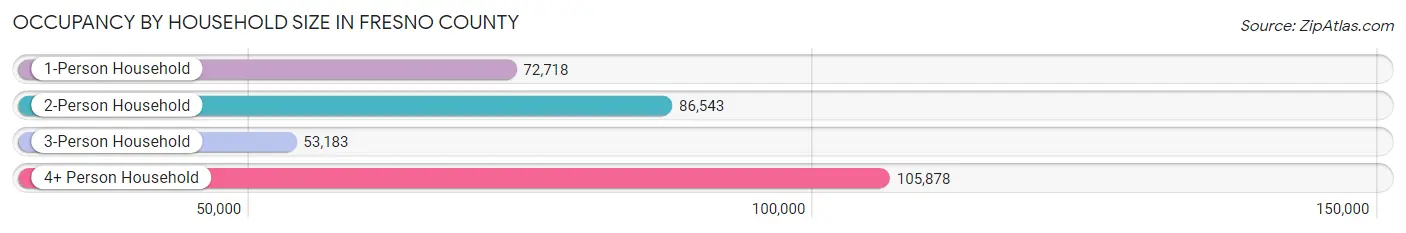
| Household Size | # Housing Units | % Housing Units |
| 1-Person Household | 72,718 | 22.8% |
| 2-Person Household | 86,543 | 27.2% |
| 3-Person Household | 53,183 | 16.7% |
| 4+ Person Household | 105,878 | 33.3% |
| Total Housing Units | 318,322 | 100.0% |
Occupancy by Ownership by Household Size in Fresno County
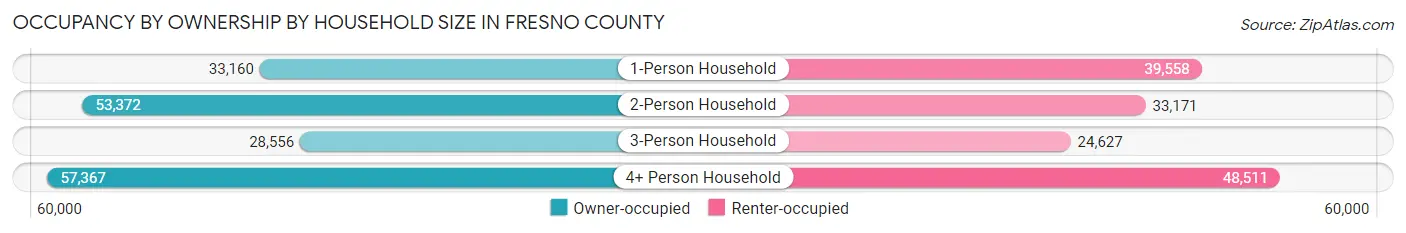
| Household Size | Owner-occupied | Renter-occupied |
| 1-Person Household | 33,160 (45.6%) | 39,558 (54.4%) |
| 2-Person Household | 53,372 (61.7%) | 33,171 (38.3%) |
| 3-Person Household | 28,556 (53.7%) | 24,627 (46.3%) |
| 4+ Person Household | 57,367 (54.2%) | 48,511 (45.8%) |
| Total Housing Units | 172,455 (54.2%) | 145,867 (45.8%) |
Occupancy by Educational Attainment in Fresno County
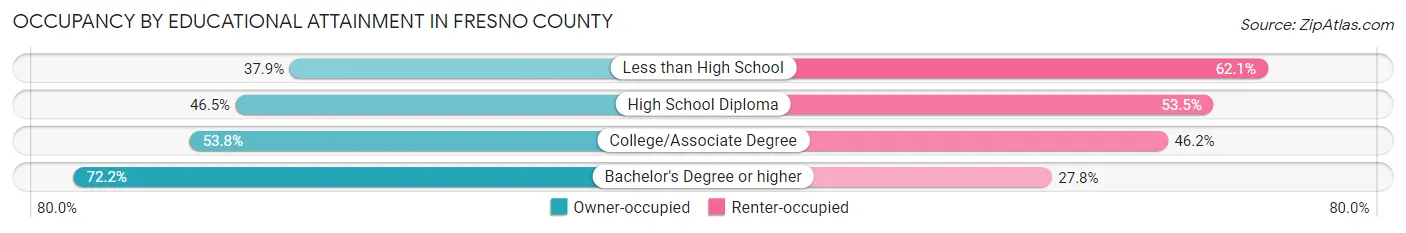
| Household Size | Owner-occupied | Renter-occupied |
| Less than High School | 22,488 (37.9%) | 36,847 (62.1%) |
| High School Diploma | 29,915 (46.5%) | 34,441 (53.5%) |
| College/Associate Degree | 59,907 (53.8%) | 51,434 (46.2%) |
| Bachelor's Degree or higher | 60,145 (72.2%) | 23,145 (27.8%) |
Occupancy by Age of Householder in Fresno County
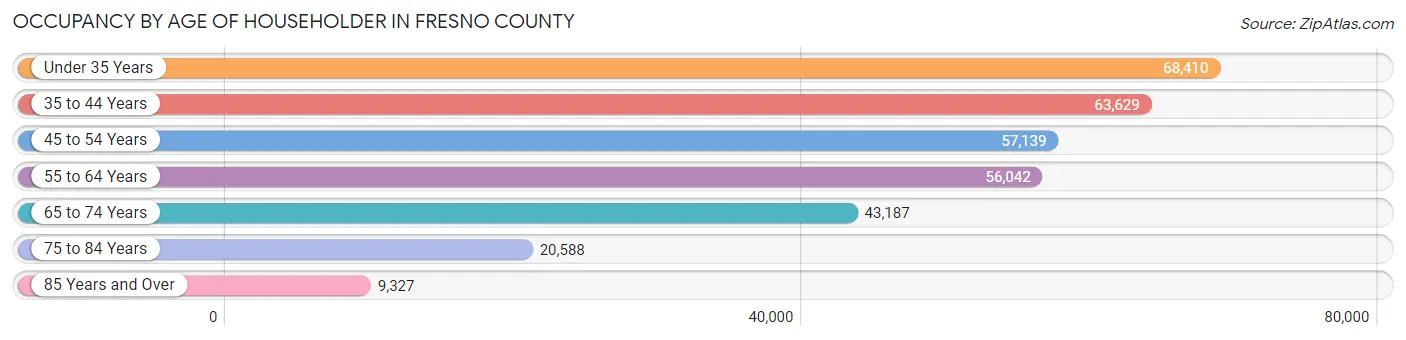
| Age Bracket | # Households | % Households |
| Under 35 Years | 68,410 | 21.5% |
| 35 to 44 Years | 63,629 | 20.0% |
| 45 to 54 Years | 57,139 | 17.9% |
| 55 to 64 Years | 56,042 | 17.6% |
| 65 to 74 Years | 43,187 | 13.6% |
| 75 to 84 Years | 20,588 | 6.5% |
| 85 Years and Over | 9,327 | 2.9% |
| Total | 318,322 | 100.0% |
Housing Finances in Fresno County
Median Income by Occupancy in Fresno County
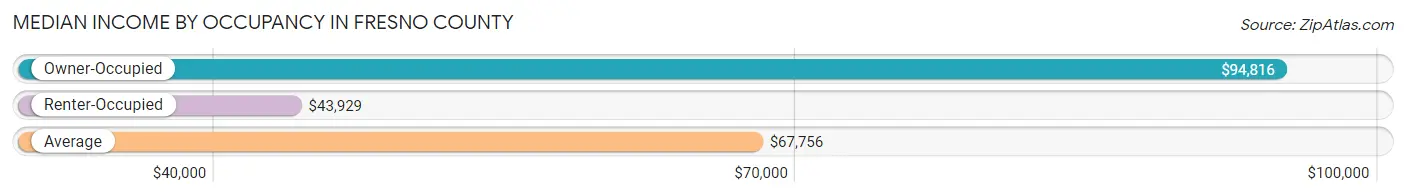
| Occupancy Type | # Households | Median Income |
| Owner-Occupied | 172,455 (54.2%) | $94,816 |
| Renter-Occupied | 145,867 (45.8%) | $43,929 |
| Average | 318,322 (100.0%) | $67,756 |
Occupancy by Householder Income Bracket in Fresno County
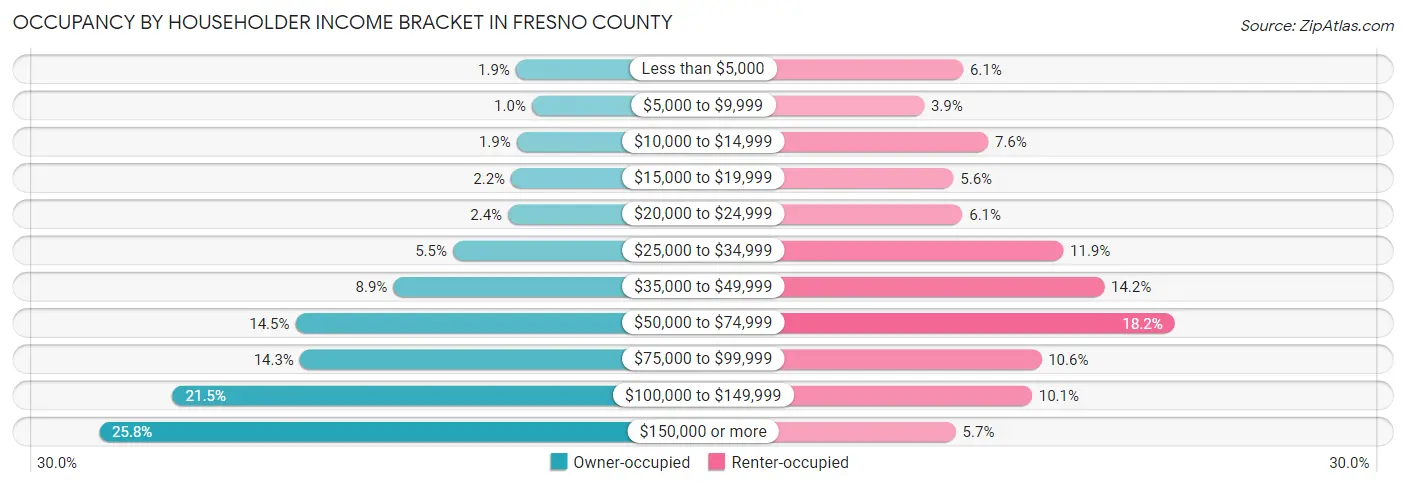
| Income Bracket | Owner-occupied | Renter-occupied |
| Less than $5,000 | 3,341 (1.9%) | 8,949 (6.1%) |
| $5,000 to $9,999 | 1,755 (1.0%) | 5,706 (3.9%) |
| $10,000 to $14,999 | 3,255 (1.9%) | 11,038 (7.6%) |
| $15,000 to $19,999 | 3,814 (2.2%) | 8,150 (5.6%) |
| $20,000 to $24,999 | 4,110 (2.4%) | 8,898 (6.1%) |
| $25,000 to $34,999 | 9,537 (5.5%) | 17,304 (11.9%) |
| $35,000 to $49,999 | 15,413 (8.9%) | 20,706 (14.2%) |
| $50,000 to $74,999 | 25,058 (14.5%) | 26,598 (18.2%) |
| $75,000 to $99,999 | 24,626 (14.3%) | 15,478 (10.6%) |
| $100,000 to $149,999 | 37,147 (21.5%) | 14,690 (10.1%) |
| $150,000 or more | 44,399 (25.8%) | 8,350 (5.7%) |
| Total | 172,455 (100.0%) | 145,867 (100.0%) |
Monthly Housing Cost Tiers in Fresno County
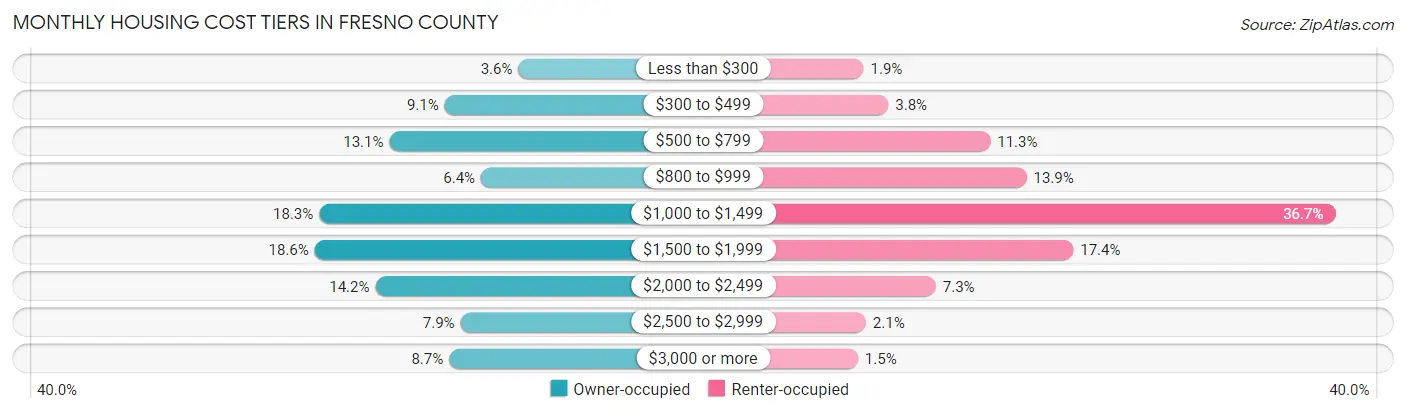
| Monthly Cost | Owner-occupied | Renter-occupied |
| Less than $300 | 6,279 (3.6%) | 2,820 (1.9%) |
| $300 to $499 | 15,644 (9.1%) | 5,463 (3.7%) |
| $500 to $799 | 22,668 (13.1%) | 16,418 (11.3%) |
| $800 to $999 | 11,020 (6.4%) | 20,326 (13.9%) |
| $1,000 to $1,499 | 31,573 (18.3%) | 53,468 (36.7%) |
| $1,500 to $1,999 | 32,140 (18.6%) | 25,330 (17.4%) |
| $2,000 to $2,499 | 24,441 (14.2%) | 10,580 (7.2%) |
| $2,500 to $2,999 | 13,618 (7.9%) | 3,064 (2.1%) |
| $3,000 or more | 15,072 (8.7%) | 2,198 (1.5%) |
| Total | 172,455 (100.0%) | 145,867 (100.0%) |
Physical Housing Characteristics in Fresno County
Housing Structures in Fresno County
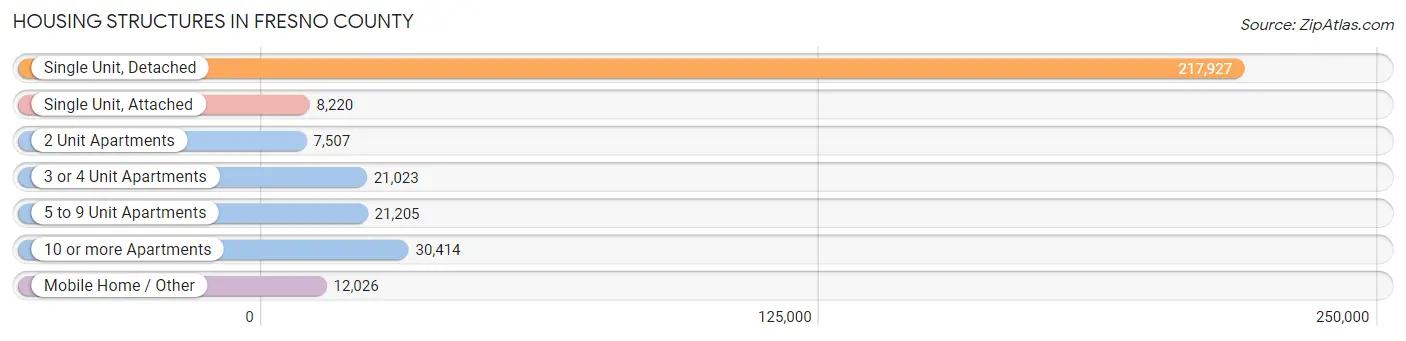
| Structure Type | # Housing Units | % Housing Units |
| Single Unit, Detached | 217,927 | 68.5% |
| Single Unit, Attached | 8,220 | 2.6% |
| 2 Unit Apartments | 7,507 | 2.4% |
| 3 or 4 Unit Apartments | 21,023 | 6.6% |
| 5 to 9 Unit Apartments | 21,205 | 6.7% |
| 10 or more Apartments | 30,414 | 9.6% |
| Mobile Home / Other | 12,026 | 3.8% |
| Total | 318,322 | 100.0% |
Housing Structures by Occupancy in Fresno County
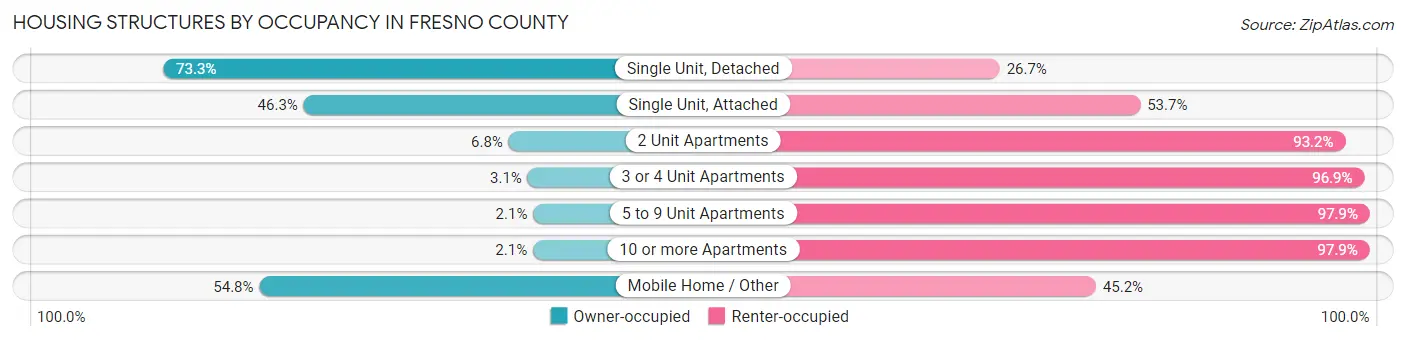
| Structure Type | Owner-occupied | Renter-occupied |
| Single Unit, Detached | 159,810 (73.3%) | 58,117 (26.7%) |
| Single Unit, Attached | 3,803 (46.3%) | 4,417 (53.7%) |
| 2 Unit Apartments | 510 (6.8%) | 6,997 (93.2%) |
| 3 or 4 Unit Apartments | 660 (3.1%) | 20,363 (96.9%) |
| 5 to 9 Unit Apartments | 440 (2.1%) | 20,765 (97.9%) |
| 10 or more Apartments | 642 (2.1%) | 29,772 (97.9%) |
| Mobile Home / Other | 6,590 (54.8%) | 5,436 (45.2%) |
| Total | 172,455 (54.2%) | 145,867 (45.8%) |
Housing Structures by Number of Rooms in Fresno County
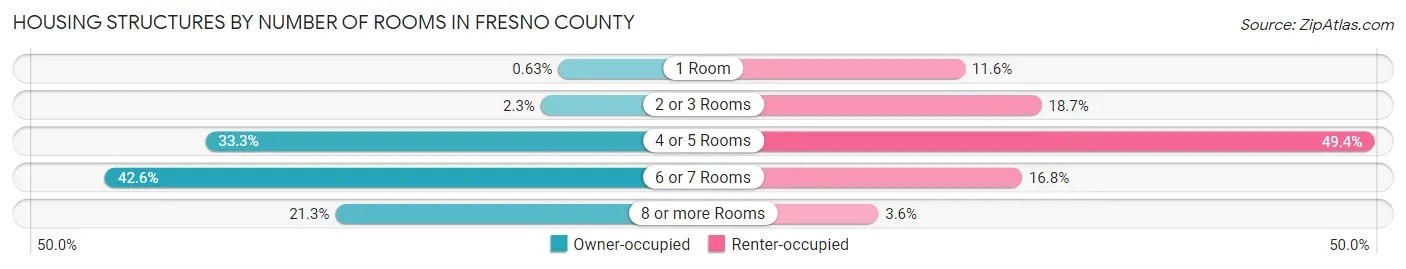
| Number of Rooms | Owner-occupied | Renter-occupied |
| 1 Room | 1,080 (0.6%) | 16,875 (11.6%) |
| 2 or 3 Rooms | 3,920 (2.3%) | 27,210 (18.6%) |
| 4 or 5 Rooms | 57,400 (33.3%) | 72,037 (49.4%) |
| 6 or 7 Rooms | 73,372 (42.5%) | 24,561 (16.8%) |
| 8 or more Rooms | 36,683 (21.3%) | 5,184 (3.5%) |
| Total | 172,455 (100.0%) | 145,867 (100.0%) |
Housing Structure by Heating Type in Fresno County
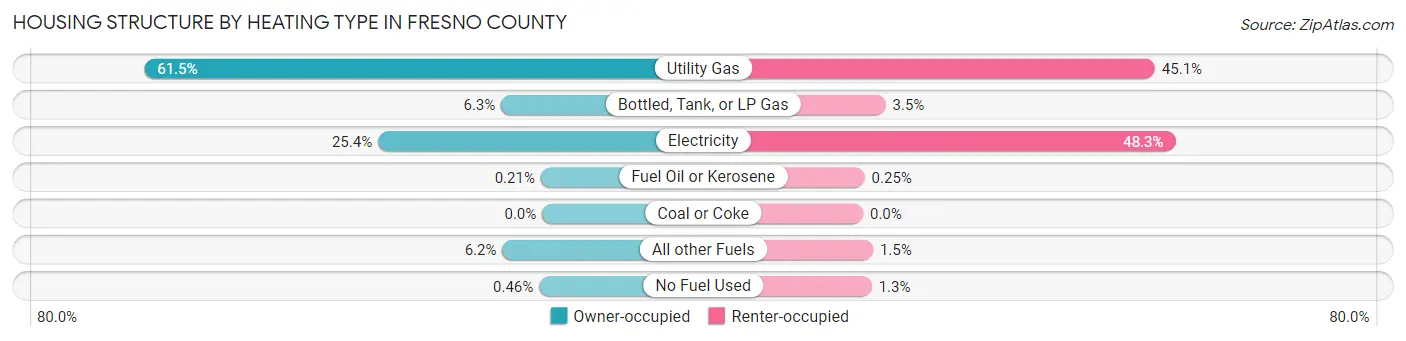
| Heating Type | Owner-occupied | Renter-occupied |
| Utility Gas | 106,037 (61.5%) | 65,811 (45.1%) |
| Bottled, Tank, or LP Gas | 10,929 (6.3%) | 5,095 (3.5%) |
| Electricity | 43,744 (25.4%) | 70,404 (48.3%) |
| Fuel Oil or Kerosene | 355 (0.2%) | 370 (0.3%) |
| Coal or Coke | 0 (0.0%) | 0 (0.0%) |
| All other Fuels | 10,603 (6.1%) | 2,236 (1.5%) |
| No Fuel Used | 787 (0.5%) | 1,951 (1.3%) |
| Total | 172,455 (100.0%) | 145,867 (100.0%) |
Household Vehicle Usage in Fresno County
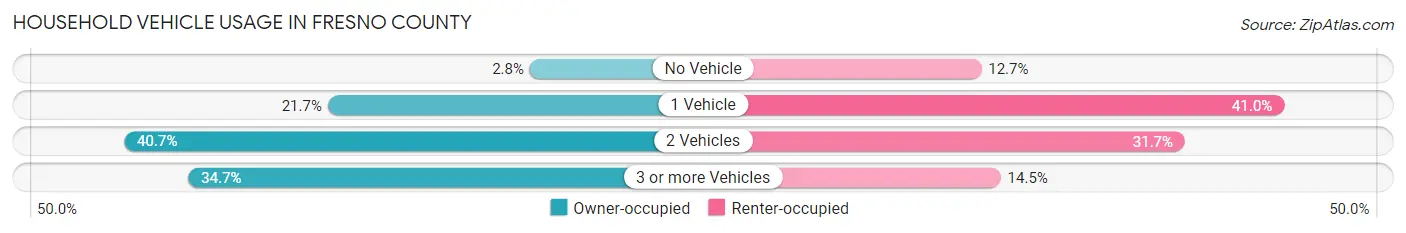
| Vehicles per Household | Owner-occupied | Renter-occupied |
| No Vehicle | 4,906 (2.8%) | 18,575 (12.7%) |
| 1 Vehicle | 37,428 (21.7%) | 59,806 (41.0%) |
| 2 Vehicles | 70,229 (40.7%) | 46,280 (31.7%) |
| 3 or more Vehicles | 59,892 (34.7%) | 21,206 (14.5%) |
| Total | 172,455 (100.0%) | 145,867 (100.0%) |
Real Estate & Mortgages in Fresno County
Real Estate and Mortgage Overview in Fresno County
| Characteristic | Without Mortgage | With Mortgage |
| Housing Units | 54,792 | 117,663 |
| Median Property Value | $317,500 | $345,900 |
| Median Household Income | $74,265 | $33,866 |
| Monthly Housing Costs | $591 | $14,951 |
| Real Estate Taxes | $2,184 | $2,978 |
Property Value by Mortgage Status in Fresno County
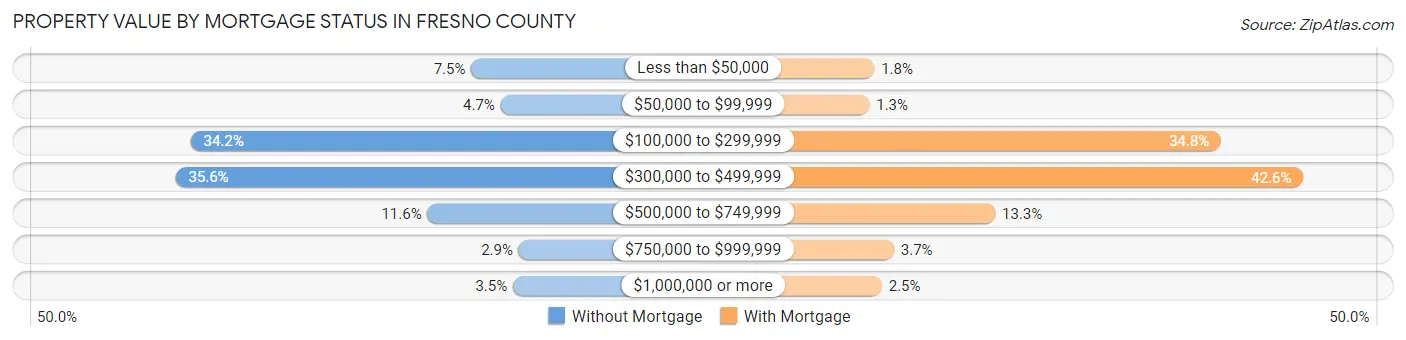
| Property Value | Without Mortgage | With Mortgage |
| Less than $50,000 | 4,088 (7.5%) | 2,090 (1.8%) |
| $50,000 to $99,999 | 2,555 (4.7%) | 1,543 (1.3%) |
| $100,000 to $299,999 | 18,736 (34.2%) | 40,976 (34.8%) |
| $300,000 to $499,999 | 19,525 (35.6%) | 50,174 (42.6%) |
| $500,000 to $749,999 | 6,373 (11.6%) | 15,636 (13.3%) |
| $750,000 to $999,999 | 1,607 (2.9%) | 4,300 (3.6%) |
| $1,000,000 or more | 1,908 (3.5%) | 2,944 (2.5%) |
| Total | 54,792 (100.0%) | 117,663 (100.0%) |
Household Income by Mortgage Status in Fresno County
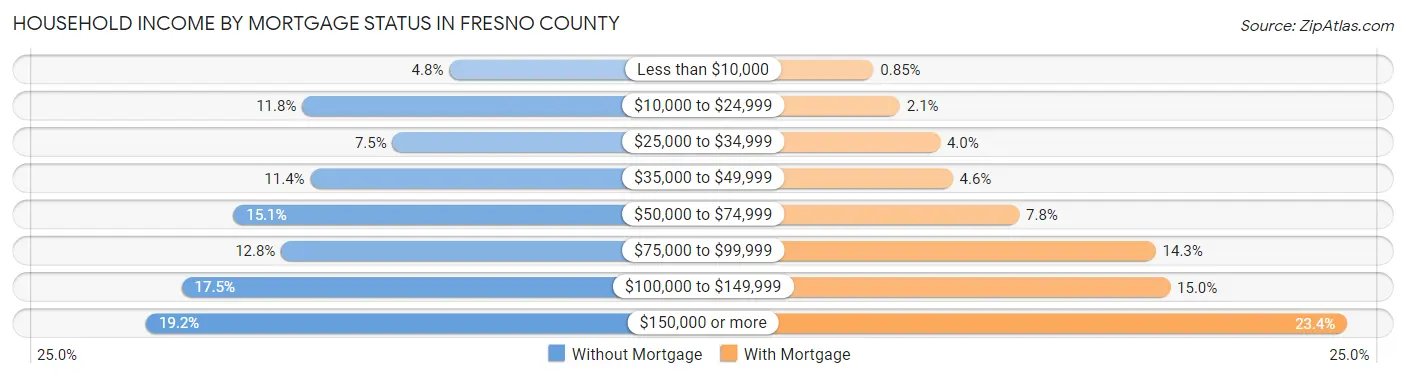
| Household Income | Without Mortgage | With Mortgage |
| Less than $10,000 | 2,618 (4.8%) | 1,001 (0.9%) |
| $10,000 to $24,999 | 6,454 (11.8%) | 2,478 (2.1%) |
| $25,000 to $34,999 | 4,097 (7.5%) | 4,725 (4.0%) |
| $35,000 to $49,999 | 6,243 (11.4%) | 5,440 (4.6%) |
| $50,000 to $74,999 | 8,249 (15.1%) | 9,170 (7.8%) |
| $75,000 to $99,999 | 7,000 (12.8%) | 16,809 (14.3%) |
| $100,000 to $149,999 | 9,598 (17.5%) | 17,626 (15.0%) |
| $150,000 or more | 10,533 (19.2%) | 27,549 (23.4%) |
| Total | 54,792 (100.0%) | 117,663 (100.0%) |
Property Value to Household Income Ratio in Fresno County
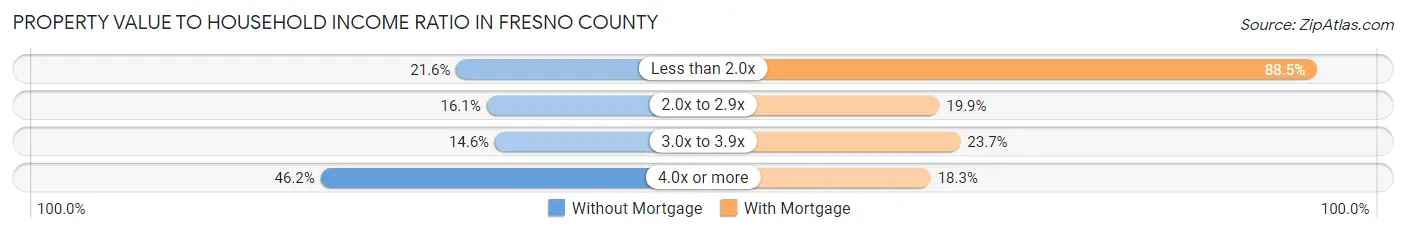
| Value-to-Income Ratio | Without Mortgage | With Mortgage |
| Less than 2.0x | 11,828 (21.6%) | 104,074 (88.4%) |
| 2.0x to 2.9x | 8,829 (16.1%) | 23,391 (19.9%) |
| 3.0x to 3.9x | 7,989 (14.6%) | 27,892 (23.7%) |
| 4.0x or more | 25,338 (46.2%) | 21,547 (18.3%) |
| Total | 54,792 (100.0%) | 117,663 (100.0%) |
Real Estate Taxes by Mortgage Status in Fresno County
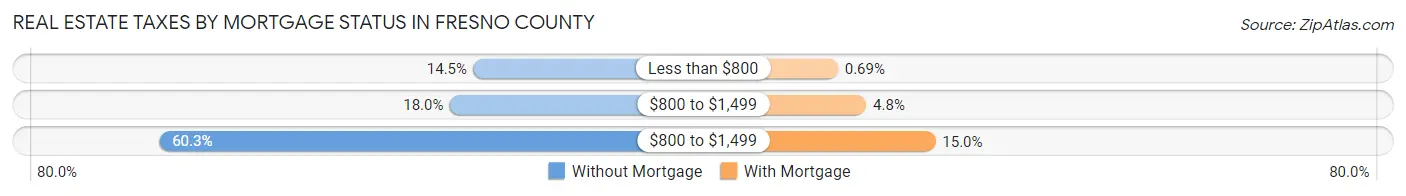
| Property Taxes | Without Mortgage | With Mortgage |
| Less than $800 | 7,943 (14.5%) | 807 (0.7%) |
| $800 to $1,499 | 9,833 (17.9%) | 5,692 (4.8%) |
| $800 to $1,499 | 33,053 (60.3%) | 17,591 (14.9%) |
| Total | 54,792 (100.0%) | 117,663 (100.0%) |
Health & Disability in Fresno County
Health Insurance Coverage by Age in Fresno County
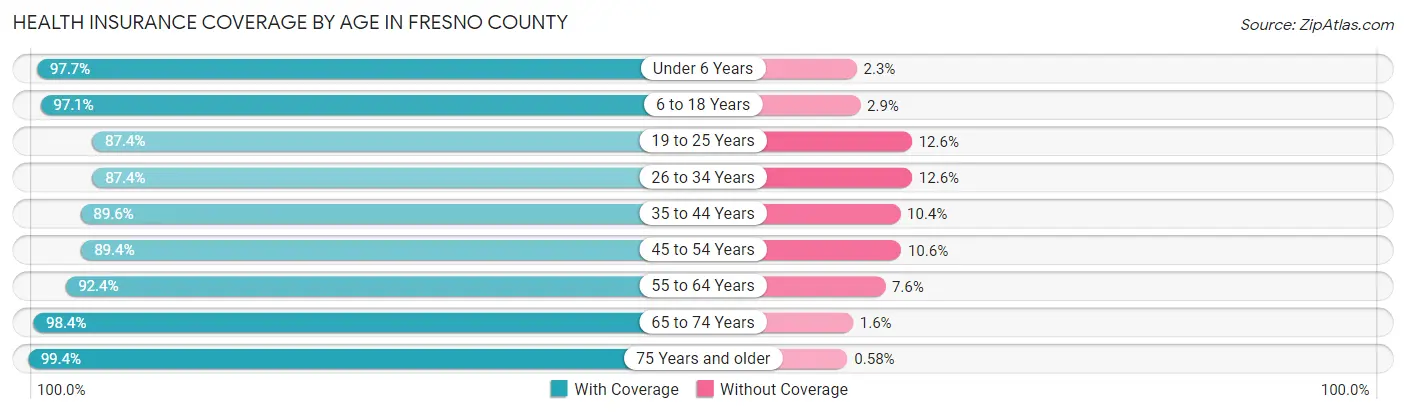
| Age Bracket | With Coverage | Without Coverage |
| Under 6 Years | 86,621 (97.7%) | 2,029 (2.3%) |
| 6 to 18 Years | 203,988 (97.1%) | 6,183 (2.9%) |
| 19 to 25 Years | 87,063 (87.4%) | 12,525 (12.6%) |
| 26 to 34 Years | 116,485 (87.4%) | 16,804 (12.6%) |
| 35 to 44 Years | 115,675 (89.6%) | 13,435 (10.4%) |
| 45 to 54 Years | 98,006 (89.4%) | 11,586 (10.6%) |
| 55 to 64 Years | 95,744 (92.4%) | 7,851 (7.6%) |
| 65 to 74 Years | 72,658 (98.4%) | 1,173 (1.6%) |
| 75 Years and older | 48,905 (99.4%) | 287 (0.6%) |
| Total | 925,145 (92.8%) | 71,873 (7.2%) |
Health Insurance Coverage by Citizenship Status in Fresno County
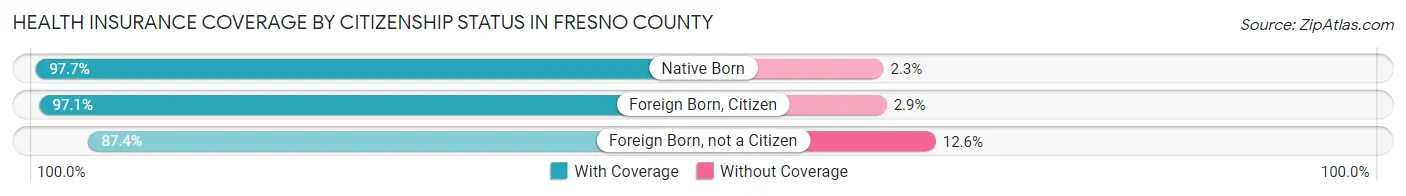
| Citizenship Status | With Coverage | Without Coverage |
| Native Born | 86,621 (97.7%) | 2,029 (2.3%) |
| Foreign Born, Citizen | 203,988 (97.1%) | 6,183 (2.9%) |
| Foreign Born, not a Citizen | 87,063 (87.4%) | 12,525 (12.6%) |
Health Insurance Coverage by Household Income in Fresno County
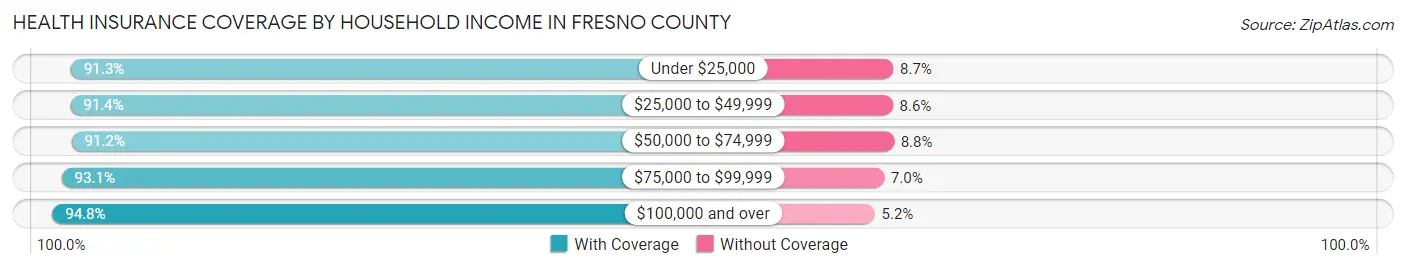
| Household Income | With Coverage | Without Coverage |
| Under $25,000 | 120,859 (91.3%) | 11,482 (8.7%) |
| $25,000 to $49,999 | 169,826 (91.4%) | 15,941 (8.6%) |
| $50,000 to $74,999 | 146,666 (91.2%) | 14,128 (8.8%) |
| $75,000 to $99,999 | 126,534 (93.0%) | 9,456 (7.0%) |
| $100,000 and over | 353,934 (94.8%) | 19,471 (5.2%) |
Public vs Private Health Insurance Coverage by Age in Fresno County
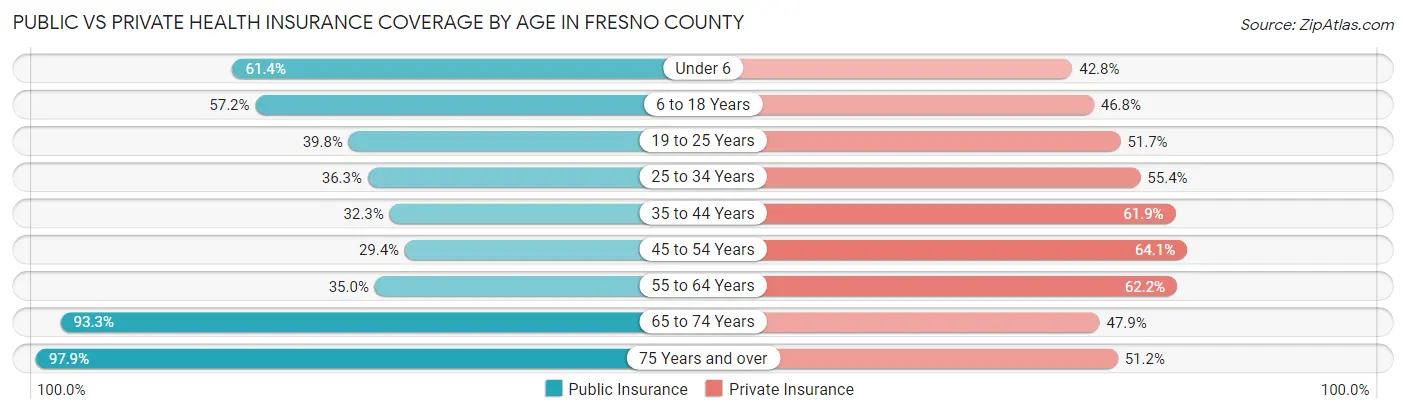
| Age Bracket | Public Insurance | Private Insurance |
| Under 6 | 54,418 (61.4%) | 37,930 (42.8%) |
| 6 to 18 Years | 120,146 (57.2%) | 98,287 (46.8%) |
| 19 to 25 Years | 39,676 (39.8%) | 51,502 (51.7%) |
| 25 to 34 Years | 48,368 (36.3%) | 73,888 (55.4%) |
| 35 to 44 Years | 41,661 (32.3%) | 79,945 (61.9%) |
| 45 to 54 Years | 32,224 (29.4%) | 70,213 (64.1%) |
| 55 to 64 Years | 36,272 (35.0%) | 64,436 (62.2%) |
| 65 to 74 Years | 68,895 (93.3%) | 35,331 (47.8%) |
| 75 Years and over | 48,162 (97.9%) | 25,197 (51.2%) |
| Total | 489,822 (49.1%) | 536,729 (53.8%) |
Disability Status by Sex by Age in Fresno County
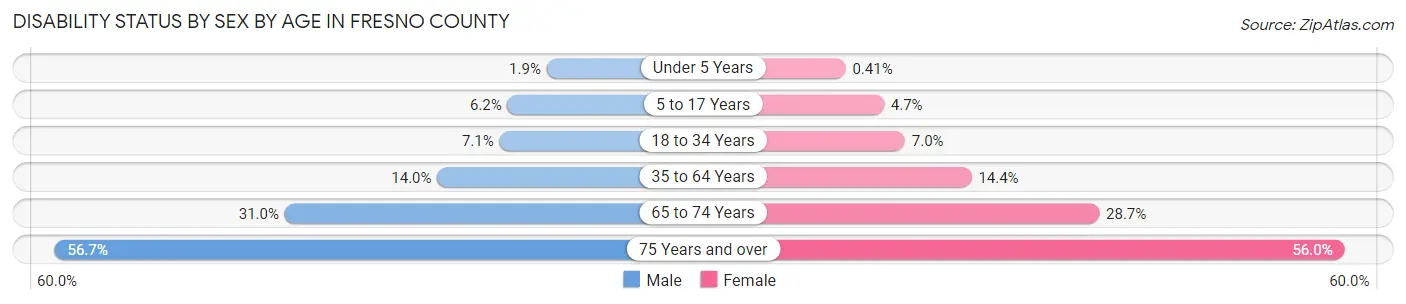
| Age Bracket | Male | Female |
| Under 5 Years | 686 (1.8%) | 148 (0.4%) |
| 5 to 17 Years | 6,684 (6.2%) | 4,796 (4.7%) |
| 18 to 34 Years | 8,963 (7.1%) | 8,627 (7.0%) |
| 35 to 64 Years | 24,057 (14.0%) | 24,669 (14.4%) |
| 65 to 74 Years | 10,874 (31.0%) | 11,111 (28.7%) |
| 75 Years and over | 11,627 (56.7%) | 16,050 (56.0%) |
Disability Class by Sex by Age in Fresno County
Disability Class: Hearing Difficulty
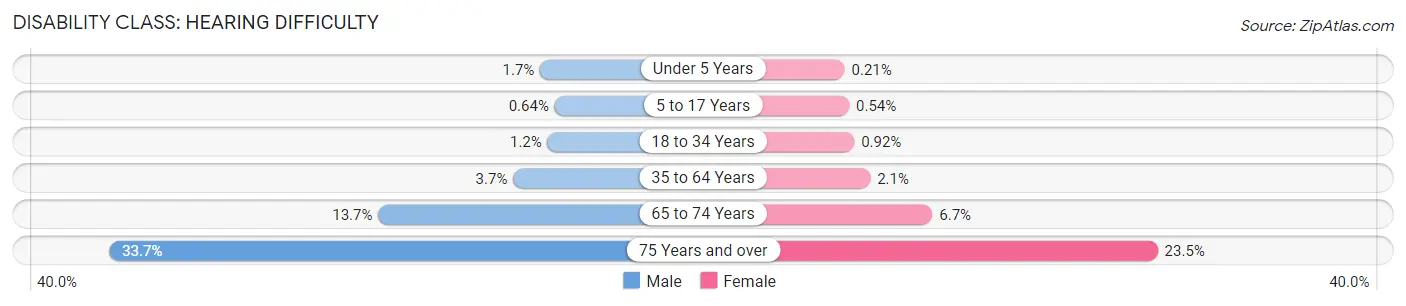
| Age Bracket | Male | Female |
| Under 5 Years | 639 (1.7%) | 76 (0.2%) |
| 5 to 17 Years | 686 (0.6%) | 556 (0.5%) |
| 18 to 34 Years | 1,475 (1.2%) | 1,136 (0.9%) |
| 35 to 64 Years | 6,383 (3.7%) | 3,602 (2.1%) |
| 65 to 74 Years | 4,817 (13.7%) | 2,606 (6.7%) |
| 75 Years and over | 6,921 (33.7%) | 6,722 (23.4%) |
Disability Class: Vision Difficulty
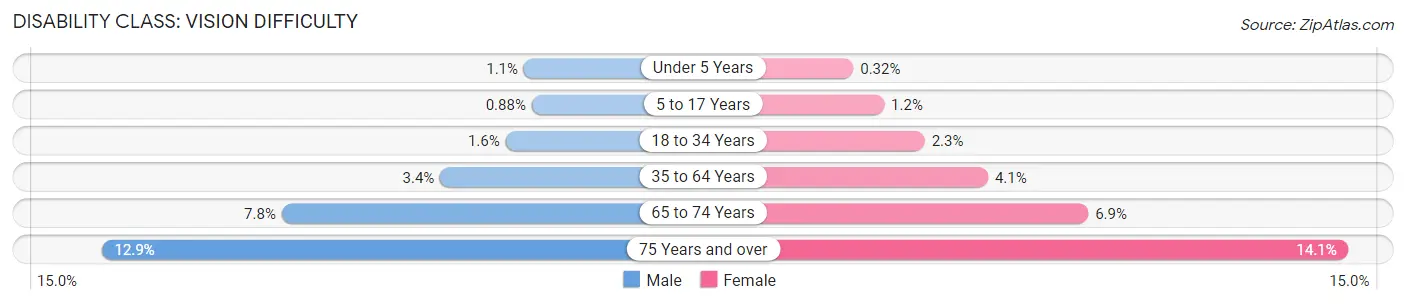
| Age Bracket | Male | Female |
| Under 5 Years | 409 (1.1%) | 114 (0.3%) |
| 5 to 17 Years | 945 (0.9%) | 1,206 (1.2%) |
| 18 to 34 Years | 2,029 (1.6%) | 2,843 (2.3%) |
| 35 to 64 Years | 5,876 (3.4%) | 6,957 (4.1%) |
| 65 to 74 Years | 2,749 (7.8%) | 2,659 (6.9%) |
| 75 Years and over | 2,639 (12.9%) | 4,046 (14.1%) |
Disability Class: Cognitive Difficulty
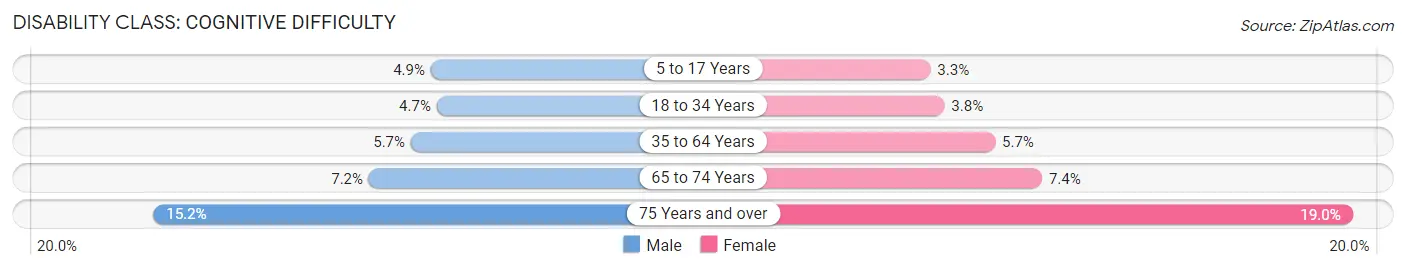
| Age Bracket | Male | Female |
| 5 to 17 Years | 5,291 (4.9%) | 3,367 (3.3%) |
| 18 to 34 Years | 5,927 (4.7%) | 4,677 (3.8%) |
| 35 to 64 Years | 9,697 (5.7%) | 9,728 (5.7%) |
| 65 to 74 Years | 2,533 (7.2%) | 2,879 (7.4%) |
| 75 Years and over | 3,124 (15.2%) | 5,437 (19.0%) |
Disability Class: Ambulatory Difficulty
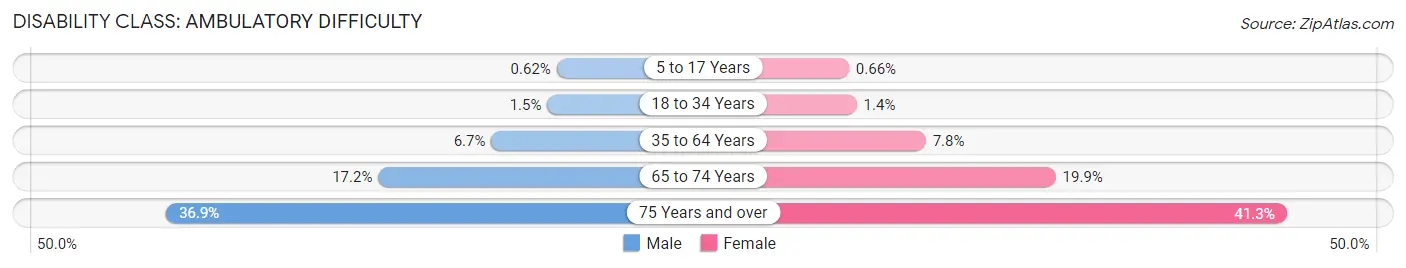
| Age Bracket | Male | Female |
| 5 to 17 Years | 670 (0.6%) | 677 (0.7%) |
| 18 to 34 Years | 1,877 (1.5%) | 1,692 (1.4%) |
| 35 to 64 Years | 11,475 (6.7%) | 13,301 (7.8%) |
| 65 to 74 Years | 6,023 (17.2%) | 7,696 (19.9%) |
| 75 Years and over | 7,568 (36.9%) | 11,833 (41.3%) |
Disability Class: Self-Care Difficulty
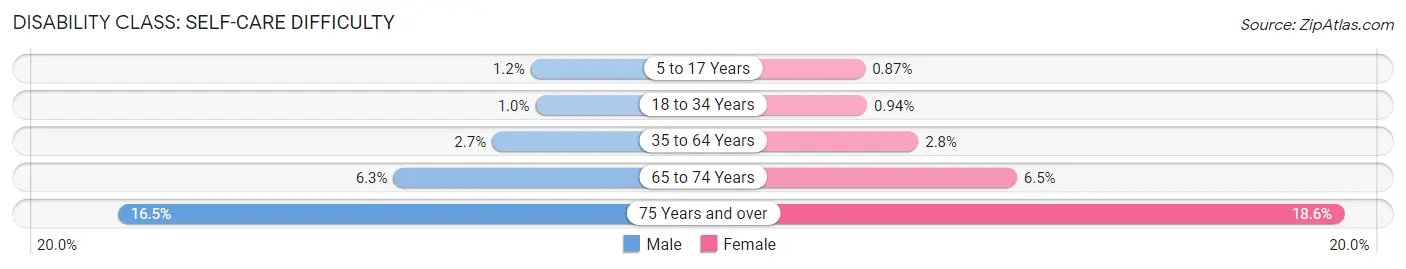
| Age Bracket | Male | Female |
| 5 to 17 Years | 1,307 (1.2%) | 887 (0.9%) |
| 18 to 34 Years | 1,316 (1.0%) | 1,150 (0.9%) |
| 35 to 64 Years | 4,541 (2.6%) | 4,852 (2.8%) |
| 65 to 74 Years | 2,214 (6.3%) | 2,520 (6.5%) |
| 75 Years and over | 3,395 (16.5%) | 5,344 (18.6%) |
Technology Access in Fresno County
Computing Device Access in Fresno County
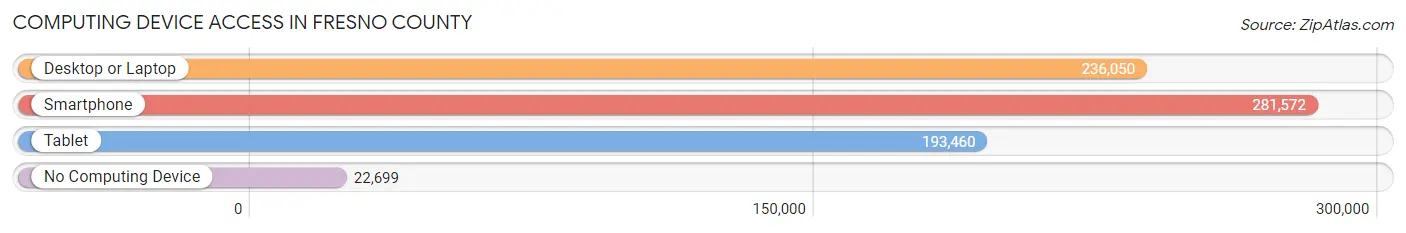
| Device Type | # Households | % Households |
| Desktop or Laptop | 236,050 | 74.2% |
| Smartphone | 281,572 | 88.5% |
| Tablet | 193,460 | 60.8% |
| No Computing Device | 22,699 | 7.1% |
| Total | 318,322 | 100.0% |
Internet Access in Fresno County
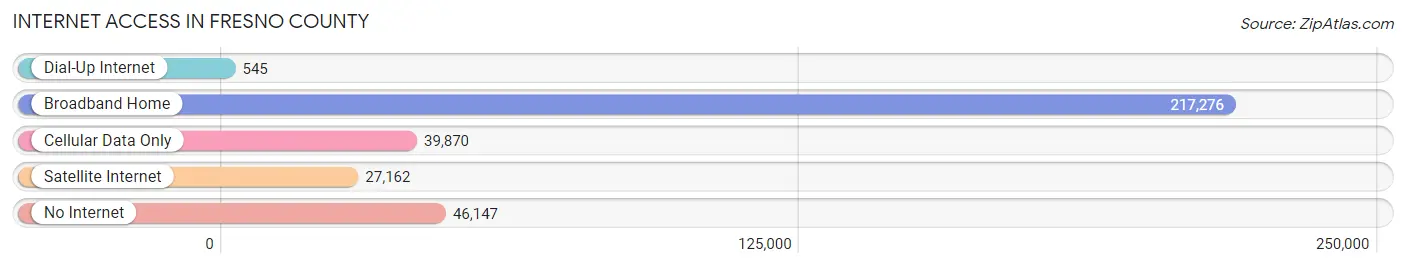
| Internet Type | # Households | % Households |
| Dial-Up Internet | 545 | 0.2% |
| Broadband Home | 217,276 | 68.3% |
| Cellular Data Only | 39,870 | 12.5% |
| Satellite Internet | 27,162 | 8.5% |
| No Internet | 46,147 | 14.5% |
| Total | 318,322 | 100.0% |
Fresno County Summary
Fresno County is located in the Central Valley of California, and is the fifth most populous county in the state. It is bordered by Madera, Kings, Tulare, and Kern counties. Fresno County covers an area of 6,011 square miles, making it the largest county in California by area. The county seat is Fresno, the largest city in the county.
History
Fresno County was established in 1856, and was named after the Spanish word for ash tree. The county was formed from parts of Mariposa, Merced, and Tulare counties. The first county seat was Millerton, but it was moved to Fresno in 1874.
Fresno County was an agricultural powerhouse in the early 20th century, with the county producing more than half of the state’s agricultural output. The county was also home to a large number of migrant workers, many of whom were of Mexican descent.
In the 1950s, Fresno County experienced a population boom, as people moved to the area for jobs in the agricultural and manufacturing industries. This population growth led to the development of many new cities and towns in the county.
Geography
Fresno County is located in the Central Valley of California, and is bordered by Madera, Kings, Tulare, and Kern counties. The county covers an area of 6,011 square miles, making it the largest county in California by area.
The county is divided into two distinct regions: the San Joaquin Valley and the Sierra Nevada Mountains. The San Joaquin Valley is a flat, fertile plain that is home to most of the county’s population and agricultural production. The Sierra Nevada Mountains are located in the eastern part of the county, and are home to several national parks and forests.
The county is home to several rivers, including the Kings, San Joaquin, and Kaweah rivers. The Kings River is the largest river in the county, and is a major source of irrigation for the county’s agricultural production.
Economy
Fresno County has a diverse economy, with agriculture, manufacturing, and services being the main economic drivers. Agriculture is the largest industry in the county, with the county producing more than half of the state’s agricultural output. The county is home to a large number of farms, and is a major producer of fruits, vegetables, and nuts.
Manufacturing is also an important part of the county’s economy, with the county being home to several large manufacturing companies. The county is also home to a large number of service-based businesses, including healthcare, education, and retail.
Demographics
As of the 2010 census, Fresno County had a population of 930,450. The population is racially and ethnically diverse, with the largest racial group being White (47.2%), followed by Hispanic or Latino (43.3%), Asian (5.2%), and African American (2.7%).
The median household income in the county is $50,817, and the median home value is $223,400. The poverty rate in the county is 22.3%, and the unemployment rate is 8.2%.
Conclusion
Fresno County is located in the Central Valley of California, and is the fifth most populous county in the state. It is bordered by Madera, Kings, Tulare, and Kern counties, and covers an area of 6,011 square miles. The county has a diverse economy, with agriculture, manufacturing, and services being the main economic drivers. The population is racially and ethnically diverse, with the largest racial group being White. The median household income in the county is $50,817, and the median home value is $223,400.
Common Questions
What is Per Capita Income in Fresno County?
Per Capita income in Fresno County is $30,130.
What is the Median Family Income in Fresno County?
Median Family Income in Fresno County is $76,092.
What is the Median Household income in Fresno County?
Median Household Income in Fresno County is $67,756.
What is Income or Wage Gap in Fresno County?
Income or Wage Gap in Fresno County is 20.8%.
Women in Fresno County earn 79.2 cents for every dollar earned by a man.
What is Family Income Deficit in Fresno County?
Family Income Deficit in Fresno County is $11,737.
Families that are below poverty line in Fresno County earn $11,737 less on average than the poverty threshold level.
What is Inequality or Gini Index in Fresno County?
Inequality or Gini Index in Fresno County is 0.47.
What is the Total Population of Fresno County?
Total Population of Fresno County is 1,008,280.
What is the Total Male Population of Fresno County?
Total Male Population of Fresno County is 506,526.
What is the Total Female Population of Fresno County?
Total Female Population of Fresno County is 501,754.
What is the Ratio of Males per 100 Females in Fresno County?
There are 100.95 Males per 100 Females in Fresno County.
What is the Ratio of Females per 100 Males in Fresno County?
There are 99.06 Females per 100 Males in Fresno County.
What is the Median Population Age in Fresno County?
Median Population Age in Fresno County is 32.8 Years.
What is the Average Family Size in Fresno County
Average Family Size in Fresno County is 3.7 People.
What is the Average Household Size in Fresno County
Average Household Size in Fresno County is 3.1 People.
How Large is the Labor Force in Fresno County?
There are 464,277 People in the Labor Forcein in Fresno County.
What is the Percentage of People in the Labor Force in Fresno County?
61.3% of People are in the Labor Force in Fresno County.
What is the Unemployment Rate in Fresno County?
Unemployment Rate in Fresno County is 8.6%.