Area Code 209 Map & Demographics
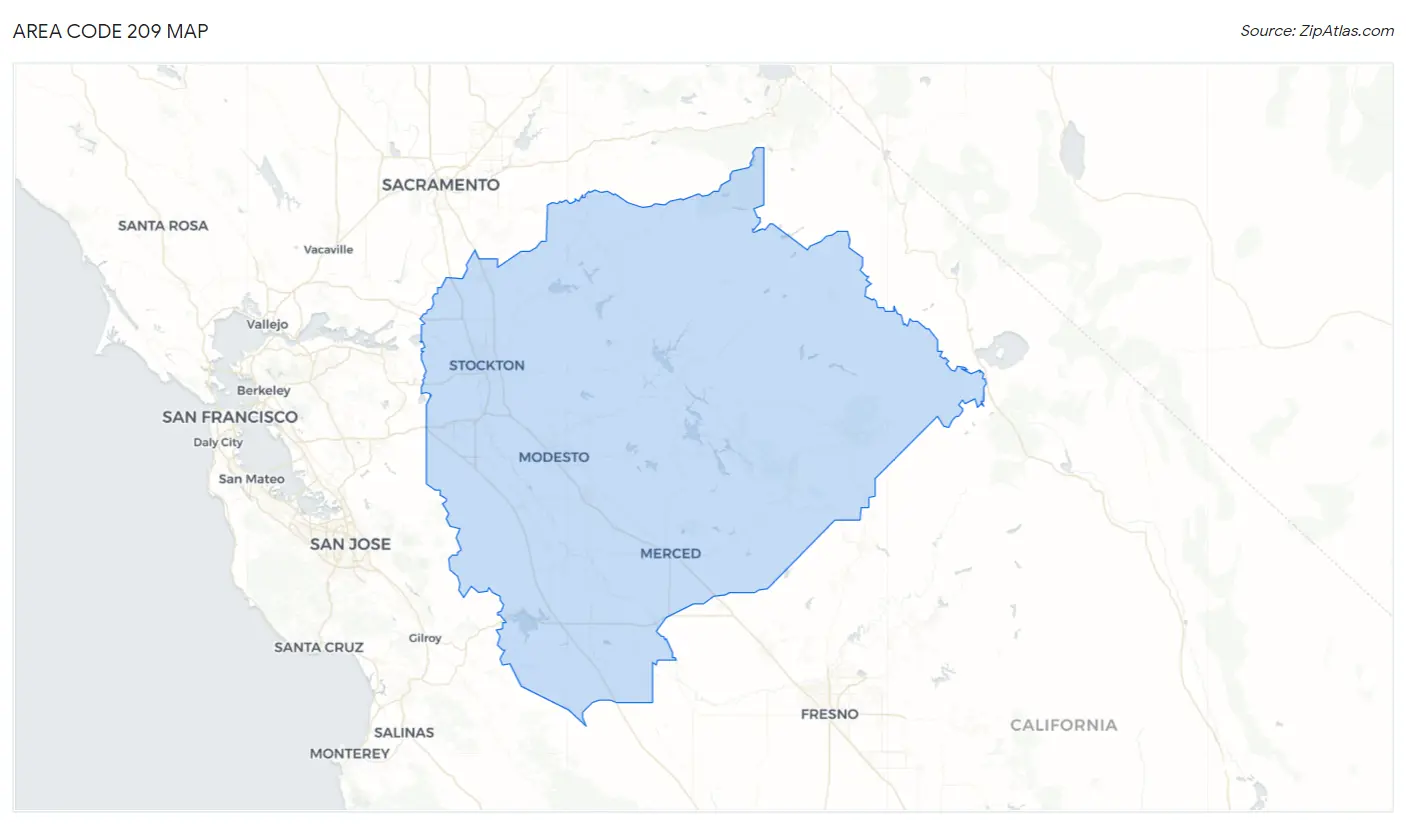
Area Code 209 Map
Area Code 209 Overview
$35,075
PER CAPITA INCOME
$87,586
AVG FAMILY INCOME
$76,664
AVG HOUSEHOLD INCOME
33.5%
WAGE / INCOME GAP [ % ]
66.5¢/ $1
WAGE / INCOME GAP [ $ ]
$11,158
FAMILY INCOME DEFICIT
53.48
INEQUALITY / GINI INDEX
1,850,257
TOTAL POPULATION
933,587
MALE POPULATION
916,670
FEMALE POPULATION
101.85
MALES / 100 FEMALES
98.19
FEMALES / 100 MALES
40.8
MEDIAN AGE
3.4
AVG FAMILY SIZE
2.9
AVG HOUSEHOLD SIZE
799,457
LABOR FORCE [ PEOPLE ]
56.2%
PERCENT IN LABOR FORCE
9.6%
UNEMPLOYMENT RATE
Income in Area Code 209
Income Overview in Area Code 209
Per Capita Income in Area Code 209 is $35,075, while median incomes of families and households are $87,586 and $76,664 respectively.
| Characteristic | Number | Measure |
| Per Capita Income | 1,850,257 | $35,075 |
| Median Family Income | 428,857 | $87,586 |
| Mean Family Income | 428,857 | $13,239,640 |
| Median Household Income | 584,566 | $76,664 |
| Mean Household Income | 584,566 | $11,931,448 |
| Income Deficit | 428,857 | $11,158 |
| Wage / Income Gap (%) | 1,850,257 | 33.55% |
| Wage / Income Gap ($) | 1,850,257 | 66.45¢ per $1 |
| Gini / Inequality Index | 1,850,257 | 53.48 |
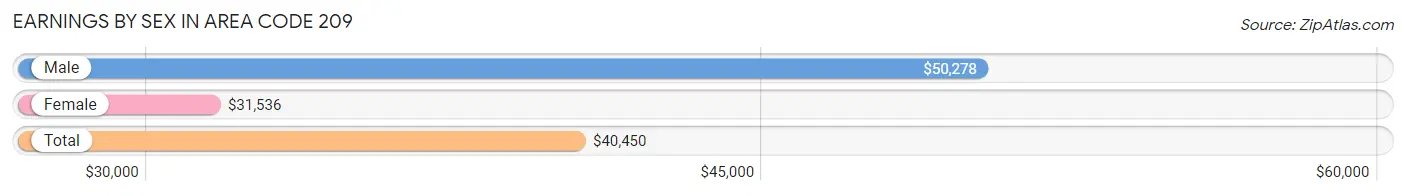
Earnings by Sex in Area Code 209
Average Earnings in Area Code 209 are $40,450, $50,278 for men and $31,536 for women, a difference of 37.3%.
| Sex | Number | Average Earnings |
| Male | 480,832 (55.4%) | $50,278 |
| Female | 387,024 (44.6%) | $31,536 |
| Total | 867,856 (100.0%) | $40,450 |
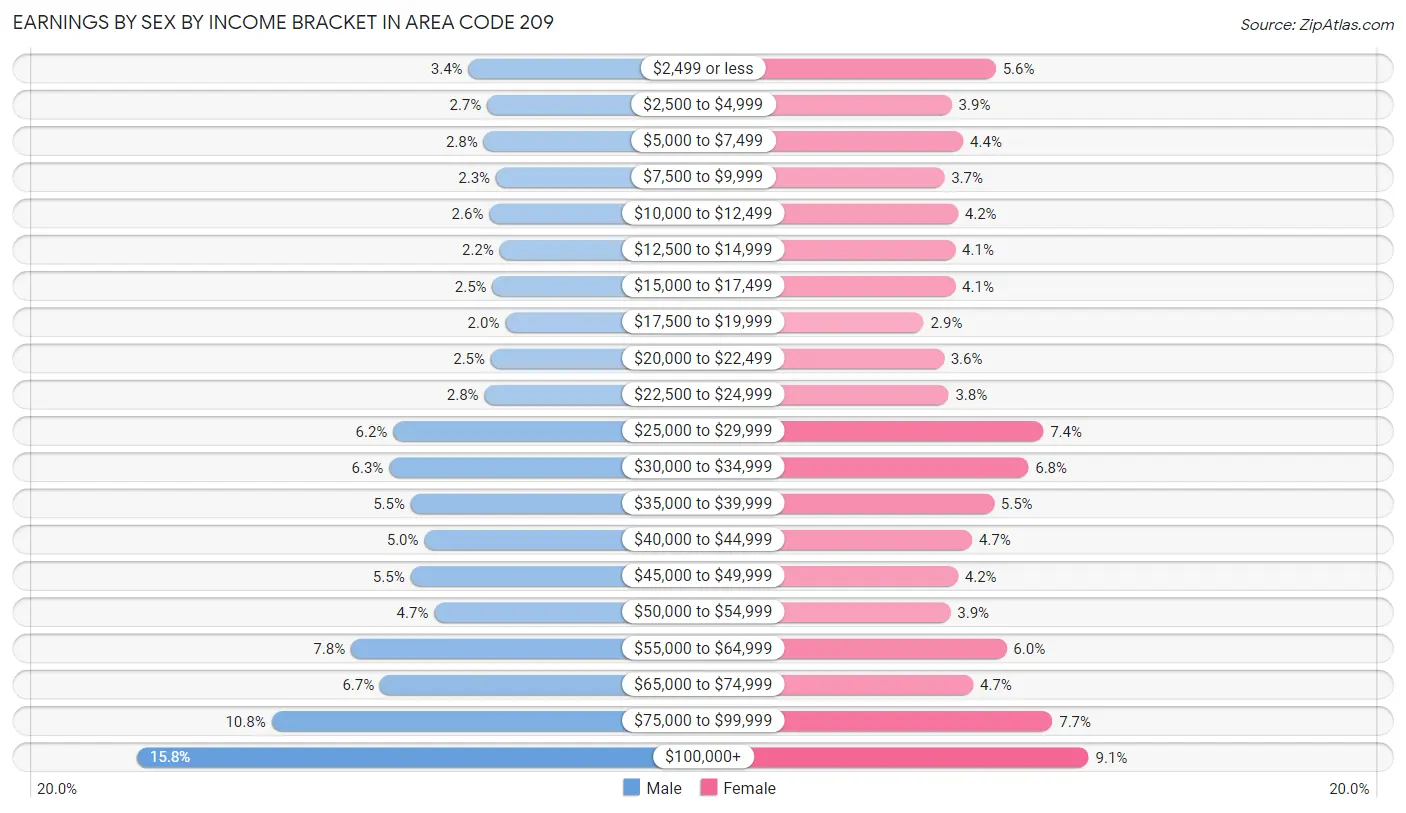
Earnings by Sex by Income Bracket in Area Code 209
The most common earnings brackets in Area Code 209 are $100,000+ for men (75,900 | 15.8%) and $100,000+ for women (35,049 | 9.1%).
| Income | Male | Female |
| $2,499 or less | 16,206 (3.4%) | 21,609 (5.6%) |
| $2,500 to $4,999 | 12,815 (2.7%) | 15,200 (3.9%) |
| $5,000 to $7,499 | 13,450 (2.8%) | 16,892 (4.4%) |
| $7,500 to $9,999 | 11,267 (2.3%) | 14,113 (3.6%) |
| $10,000 to $12,499 | 12,468 (2.6%) | 16,089 (4.2%) |
| $12,500 to $14,999 | 10,582 (2.2%) | 15,698 (4.1%) |
| $15,000 to $17,499 | 11,873 (2.5%) | 15,711 (4.1%) |
| $17,500 to $19,999 | 9,589 (2.0%) | 11,160 (2.9%) |
| $20,000 to $22,499 | 12,151 (2.5%) | 14,064 (3.6%) |
| $22,500 to $24,999 | 13,339 (2.8%) | 14,746 (3.8%) |
| $25,000 to $29,999 | 29,745 (6.2%) | 28,496 (7.4%) |
| $30,000 to $34,999 | 30,462 (6.3%) | 26,336 (6.8%) |
| $35,000 to $39,999 | 26,574 (5.5%) | 21,334 (5.5%) |
| $40,000 to $44,999 | 24,161 (5.0%) | 18,164 (4.7%) |
| $45,000 to $49,999 | 26,657 (5.5%) | 16,106 (4.2%) |
| $50,000 to $54,999 | 22,379 (4.6%) | 15,012 (3.9%) |
| $55,000 to $64,999 | 37,367 (7.8%) | 23,135 (6.0%) |
| $65,000 to $74,999 | 32,141 (6.7%) | 18,317 (4.7%) |
| $75,000 to $99,999 | 51,706 (10.7%) | 29,793 (7.7%) |
| $100,000+ | 75,900 (15.8%) | 35,049 (9.1%) |
| Total | 480,832 (100.0%) | 387,024 (100.0%) |
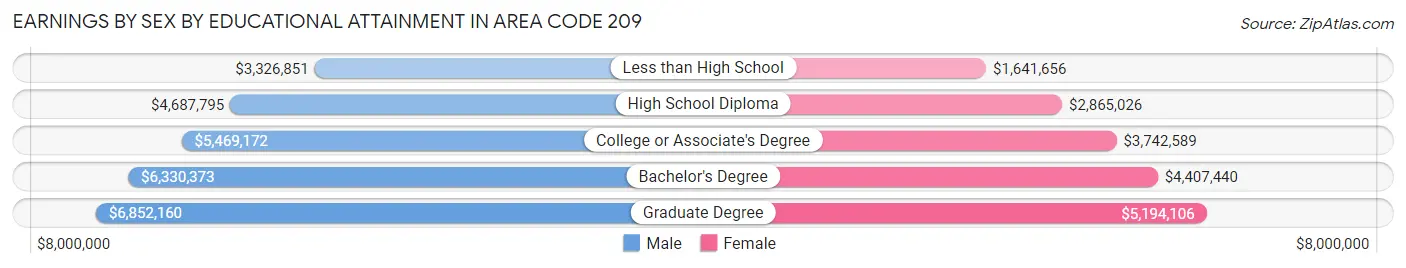
Earnings by Sex by Educational Attainment in Area Code 209
Average earnings in Area Code 209 are $6,462,069 for men and $3,901,830 for women, a difference of 39.6%. Men with an educational attainment of graduate degree enjoy the highest average annual earnings of $6,852,160, while those with less than high school education earn the least with $3,326,851. Women with an educational attainment of graduate degree earn the most with the average annual earnings of $5,194,106, while those with less than high school education have the smallest earnings of $1,641,656.
| Educational Attainment | Male Income | Female Income |
| Less than High School | $3,326,851 | $1,641,656 |
| High School Diploma | $4,687,795 | $2,865,026 |
| College or Associate's Degree | $5,469,172 | $3,742,589 |
| Bachelor's Degree | $6,330,373 | $4,407,440 |
| Graduate Degree | $6,852,160 | $5,194,106 |
| Total | $6,462,069 | $3,901,830 |
Family Income in Area Code 209
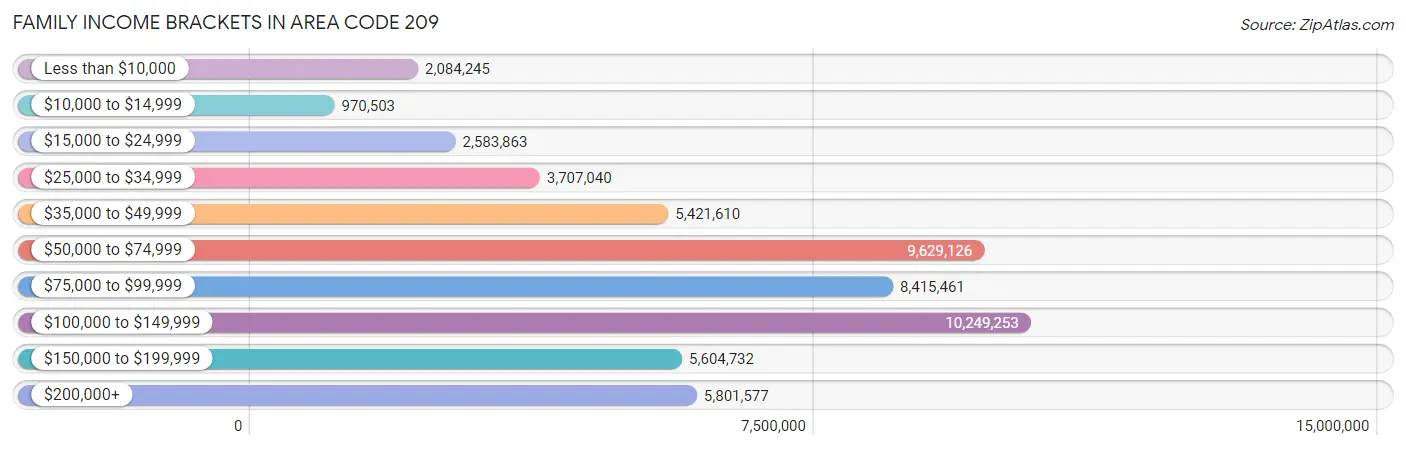
Family Income Brackets in Area Code 209
According to the Area Code 209 family income data, there are 10,249,253 families falling into the $100,000 to $149,999 income range, which is the most common income bracket and makes up 2,389.9% of all families. Conversely, the $10,000 to $14,999 income bracket is the least frequent group with only 970,503 families (226.3%) belonging to this category.
| Income Bracket | # Families | % Families |
| Less than $10,000 | 2,084,245 | 486.0% |
| $10,000 to $14,999 | 970,503 | 226.3% |
| $15,000 to $24,999 | 2,583,863 | 602.5% |
| $25,000 to $34,999 | 3,707,040 | 864.4% |
| $35,000 to $49,999 | 5,421,610 | 1,264.2% |
| $50,000 to $74,999 | 9,629,126 | 2,245.3% |
| $75,000 to $99,999 | 8,415,461 | 1,962.3% |
| $100,000 to $149,999 | 10,249,253 | 2,389.9% |
| $150,000 to $199,999 | 5,604,732 | 1,306.9% |
| $200,000+ | 5,801,577 | 1,352.8% |
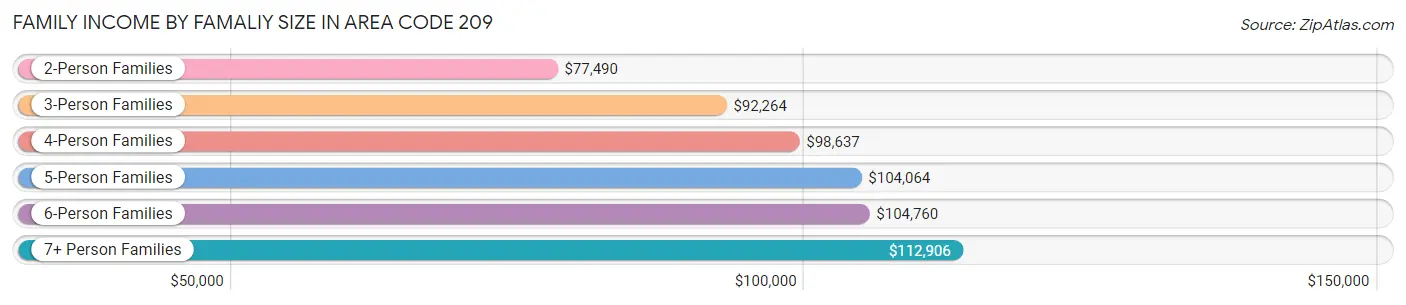
Family Income by Famaliy Size in Area Code 209
7+ person families (17,865 | 4.2%) account for the highest median family income in Area Code 209 with $112,906 per family, while 2-person families (160,432 | 37.4%) have the highest median income of $38,745 per family member.
| Income Bracket | # Families | Median Income |
| 2-Person Families | 160,432 (37.4%) | $77,490 |
| 3-Person Families | 91,637 (21.4%) | $92,264 |
| 4-Person Families | 83,352 (19.4%) | $98,637 |
| 5-Person Families | 53,127 (12.4%) | $104,064 |
| 6-Person Families | 22,444 (5.2%) | $104,760 |
| 7+ Person Families | 17,865 (4.2%) | $112,906 |
| Total | 428,857 (100.0%) | $87,586 |
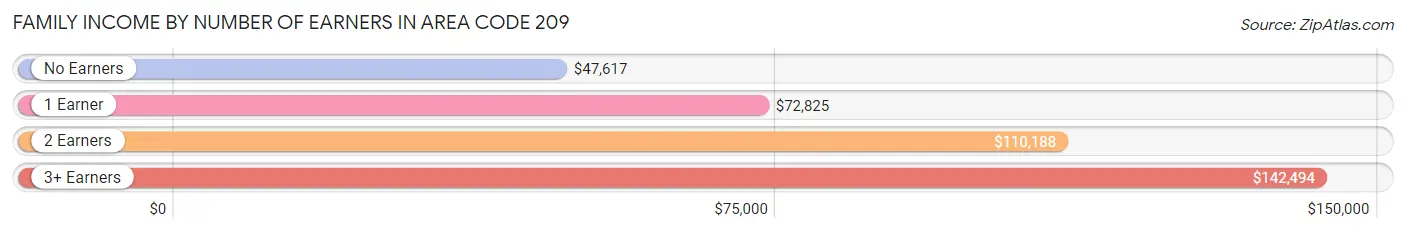
Family Income by Number of Earners in Area Code 209
The median family income in Area Code 209 is $87,586, with families comprising 3+ earners (62,575) having the highest median family income of $142,494, while families with no earners (61,875) have the lowest median family income of $47,617, accounting for 14.6% and 14.4% of families, respectively.
| Number of Earners | # Families | Median Income |
| No Earners | 61,875 (14.4%) | $47,617 |
| 1 Earner | 149,140 (34.8%) | $72,825 |
| 2 Earners | 155,267 (36.2%) | $110,188 |
| 3+ Earners | 62,575 (14.6%) | $142,494 |
| Total | 428,857 (100.0%) | $87,586 |
Household Income in Area Code 209
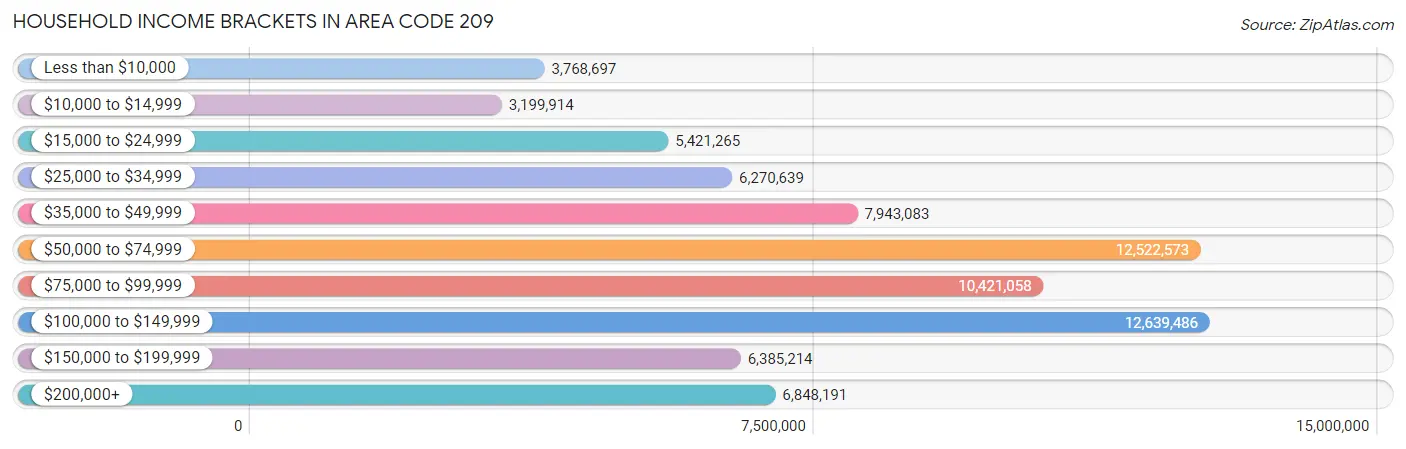
Household Income Brackets in Area Code 209
With 12,639,486 households falling in the category, the $100,000 to $149,999 income range is the most frequent in Area Code 209, accounting for 2,162.2% of all households. In contrast, only 3,199,914 households (547.4%) fall into the $10,000 to $14,999 income bracket, making it the least populous group.
| Income Bracket | # Households | % Households |
| Less than $10,000 | 3,768,697 | 644.7% |
| $10,000 to $14,999 | 3,199,914 | 547.4% |
| $15,000 to $24,999 | 5,421,265 | 927.4% |
| $25,000 to $34,999 | 6,270,639 | 1,072.7% |
| $35,000 to $49,999 | 7,943,083 | 1,358.8% |
| $50,000 to $74,999 | 12,522,573 | 2,142.2% |
| $75,000 to $99,999 | 10,421,058 | 1,782.7% |
| $100,000 to $149,999 | 12,639,486 | 2,162.2% |
| $150,000 to $199,999 | 6,385,214 | 1,092.3% |
| $200,000+ | 6,848,191 | 1,171.5% |
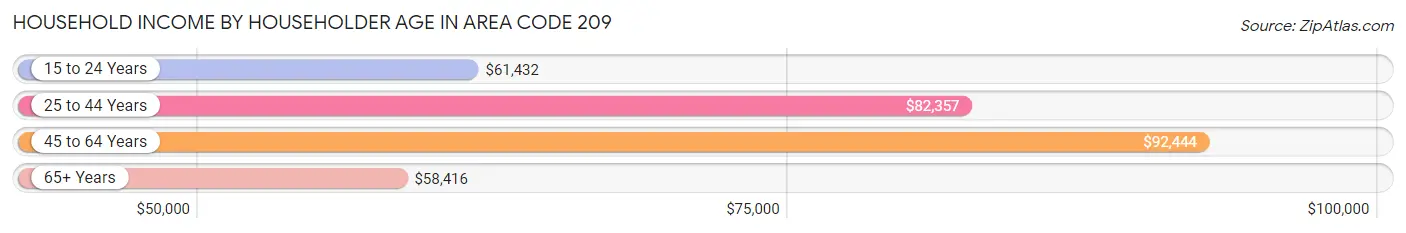
Household Income by Householder Age in Area Code 209
The median household income in Area Code 209 is $76,664, with the highest median household income of $92,444 found in the 45 to 64 years age bracket for the primary householder. A total of 220,194 households (37.7%) fall into this category. Meanwhile, the 65+ years age bracket for the primary householder has the lowest median household income of $58,416, with 147,497 households (25.2%) in this group.
| Income Bracket | # Households | Median Income |
| 15 to 24 Years | 15,240 (2.6%) | $61,432 |
| 25 to 44 Years | 201,635 (34.5%) | $82,357 |
| 45 to 64 Years | 220,194 (37.7%) | $92,444 |
| 65+ Years | 147,497 (25.2%) | $58,416 |
| Total | 584,566 (100.0%) | $76,664 |
Poverty in Area Code 209
Income Below Poverty by Sex and Age in Area Code 209
With 13.0% poverty level for males and 15.5% for females among the residents of Area Code 209, 5 year old males and under 5 year old females are the most vulnerable to poverty, with 2,835 males (21.8%) and 12,135 females (20.9%) in their respective age groups living below the poverty level.
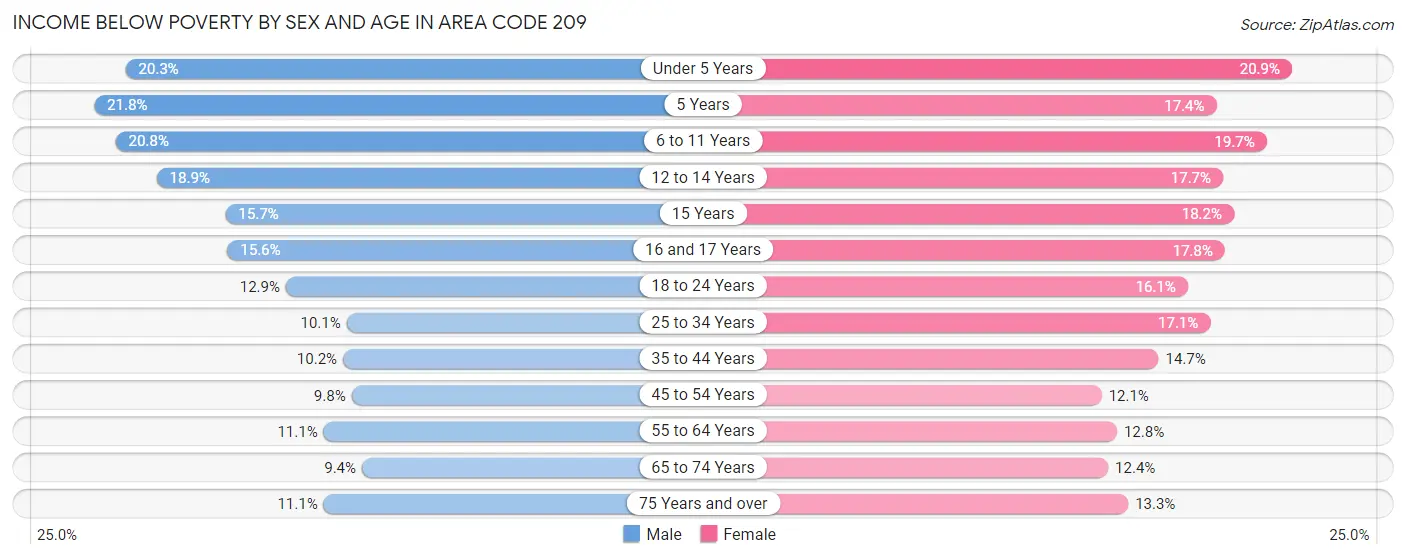
| Age Bracket | Male | Female |
| Under 5 Years | 12,519 (20.3%) | 12,135 (20.9%) |
| 5 Years | 2,835 (21.8%) | 1,883 (17.4%) |
| 6 to 11 Years | 17,067 (20.8%) | 15,296 (19.7%) |
| 12 to 14 Years | 8,270 (18.9%) | 7,665 (17.7%) |
| 15 Years | 2,287 (15.7%) | 2,544 (18.2%) |
| 16 and 17 Years | 4,473 (15.6%) | 4,832 (17.8%) |
| 18 to 24 Years | 11,516 (12.9%) | 13,246 (16.1%) |
| 25 to 34 Years | 12,988 (10.1%) | 21,028 (17.1%) |
| 35 to 44 Years | 12,369 (10.2%) | 17,155 (14.7%) |
| 45 to 54 Years | 10,574 (9.8%) | 12,838 (12.1%) |
| 55 to 64 Years | 11,517 (11.1%) | 13,531 (12.8%) |
| 65 to 74 Years | 6,680 (9.3%) | 9,985 (12.4%) |
| 75 Years and over | 4,822 (11.1%) | 7,815 (13.3%) |
| Total | 117,917 (13.0%) | 139,953 (15.5%) |
Income Above Poverty by Sex and Age in Area Code 209
According to the poverty statistics in Area Code 209, males aged 65 to 74 years and females aged 45 to 54 years are the age groups that are most secure financially, with 90.6% of males and 87.9% of females in these age groups living above the poverty line.
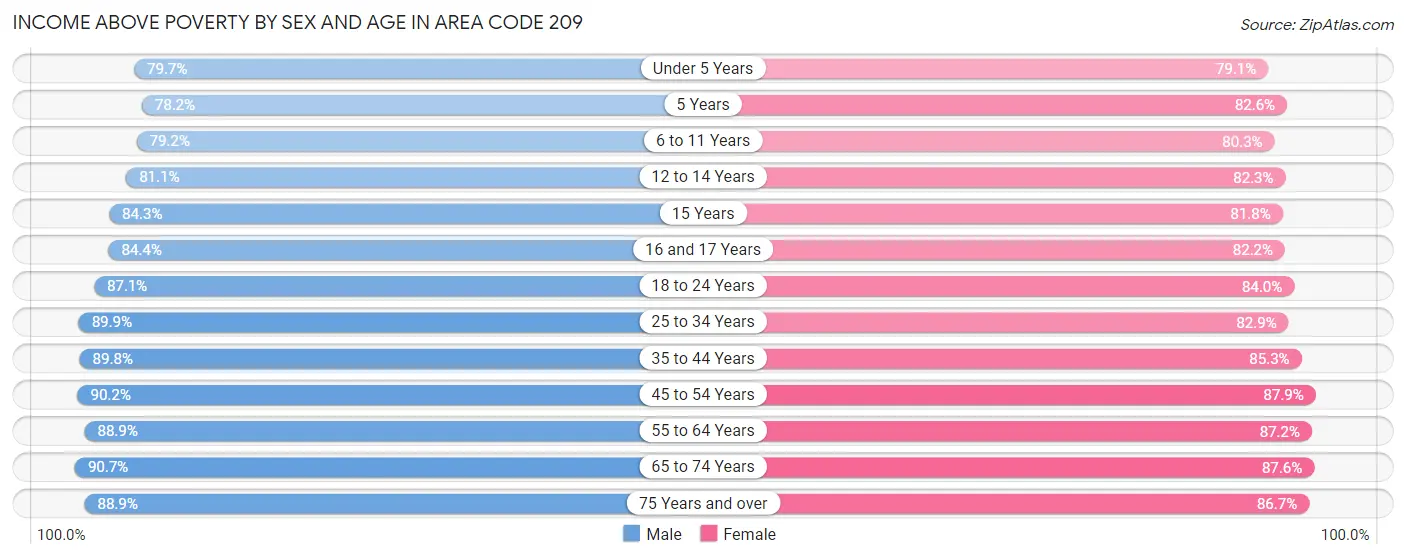
| Age Bracket | Male | Female |
| Under 5 Years | 49,080 (79.7%) | 45,982 (79.1%) |
| 5 Years | 10,189 (78.2%) | 8,951 (82.6%) |
| 6 to 11 Years | 65,077 (79.2%) | 62,317 (80.3%) |
| 12 to 14 Years | 35,567 (81.1%) | 35,690 (82.3%) |
| 15 Years | 12,302 (84.3%) | 11,441 (81.8%) |
| 16 and 17 Years | 24,223 (84.4%) | 22,365 (82.2%) |
| 18 to 24 Years | 77,902 (87.1%) | 69,266 (84.0%) |
| 25 to 34 Years | 116,102 (89.9%) | 102,009 (82.9%) |
| 35 to 44 Years | 108,533 (89.8%) | 99,516 (85.3%) |
| 45 to 54 Years | 97,018 (90.2%) | 93,656 (87.9%) |
| 55 to 64 Years | 91,957 (88.9%) | 92,418 (87.2%) |
| 65 to 74 Years | 64,744 (90.6%) | 70,790 (87.6%) |
| 75 Years and over | 38,521 (88.9%) | 51,008 (86.7%) |
| Total | 791,215 (87.0%) | 765,409 (84.5%) |
Income Below Poverty Among Married-Couple Families in Area Code 209
The poverty statistics for married-couple families in Area Code 209 show that 6.6% or 19,455 of the total 296,460 families live below the poverty line. Families with 5 or more children have the highest poverty rate of 24.1%, comprising of 976 families. On the other hand, families with no children have the lowest poverty rate of 4.5%, which includes 6,795 families.
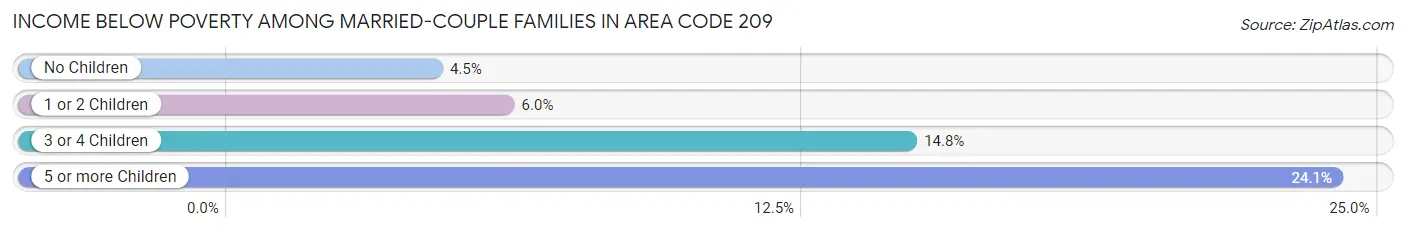
| Children | Above Poverty | Below Poverty |
| No Children | 145,629 (95.5%) | 6,795 (4.5%) |
| 1 or 2 Children | 96,631 (94.0%) | 6,192 (6.0%) |
| 3 or 4 Children | 31,665 (85.2%) | 5,492 (14.8%) |
| 5 or more Children | 3,080 (75.9%) | 976 (24.1%) |
| Total | 277,005 (93.4%) | 19,455 (6.6%) |
Income Below Poverty Among Single-Parent Households in Area Code 209
According to the poverty data in Area Code 209, 12.1% or 5,583 single-father households and 25.7% or 22,230 single-mother households are living below the poverty line. Among single-father households, those with 5 or more children have the highest poverty rate, with 165 households (36.5%) experiencing poverty. Likewise, among single-mother households, those with 5 or more children have the highest poverty rate, with 871 households (70.9%) falling below the poverty line.
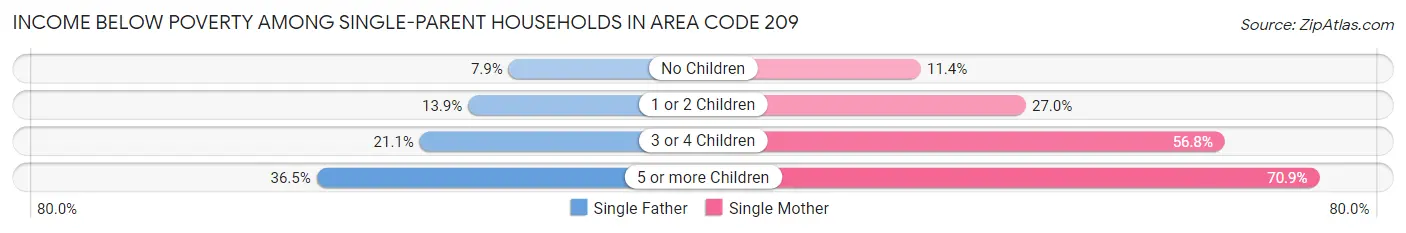
| Children | Single Father | Single Mother |
| No Children | 1,637 (7.9%) | 3,509 (11.4%) |
| 1 or 2 Children | 2,790 (13.9%) | 11,842 (27.0%) |
| 3 or 4 Children | 991 (21.1%) | 6,008 (56.8%) |
| 5 or more Children | 165 (36.5%) | 871 (70.9%) |
| Total | 5,583 (12.1%) | 22,230 (25.7%) |
Income Below Poverty Among Married-Couple vs Single-Parent Households in Area Code 209
The poverty data for Area Code 209 shows that 19,455 of the married-couple family households (6.6%) and 27,813 of the single-parent households (21.0%) are living below the poverty level. Within the married-couple family households, those with 5 or more children have the highest poverty rate, with 976 households (24.1%) falling below the poverty line. Among the single-parent households, those with 5 or more children have the highest poverty rate, with 1,036 household (61.6%) living below poverty.
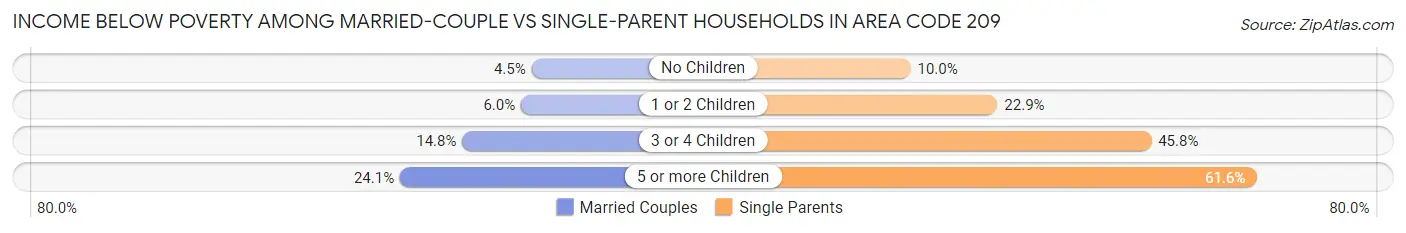
| Children | Married-Couple Families | Single-Parent Households |
| No Children | 6,795 (4.5%) | 5,146 (10.0%) |
| 1 or 2 Children | 6,192 (6.0%) | 14,632 (22.9%) |
| 3 or 4 Children | 5,492 (14.8%) | 6,999 (45.8%) |
| 5 or more Children | 976 (24.1%) | 1,036 (61.6%) |
| Total | 19,455 (6.6%) | 27,813 (21.0%) |
Race in Area Code 209
The most populous races in Area Code 209 are White / Caucasian (931,419 | 50.3%), Hispanic or Latino (844,513 | 45.6%), and Some other Race (305,543 | 16.5%).
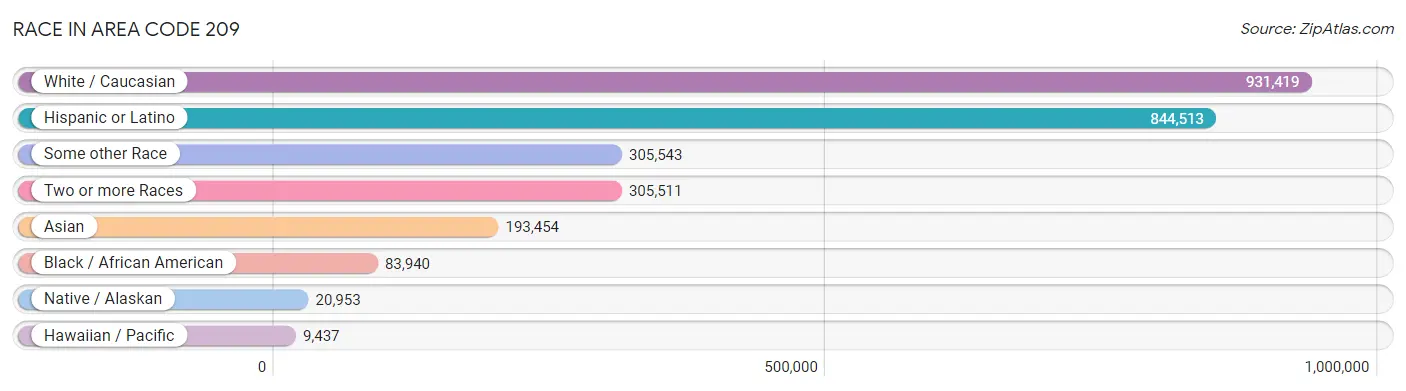
| Race | # Population | % Population |
| Asian | 193,454 | 10.5% |
| Black / African American | 83,940 | 4.5% |
| Hawaiian / Pacific | 9,437 | 0.5% |
| Hispanic or Latino | 844,513 | 45.6% |
| Native / Alaskan | 20,953 | 1.1% |
| White / Caucasian | 931,419 | 50.3% |
| Two or more Races | 305,511 | 16.5% |
| Some other Race | 305,543 | 16.5% |
| Total | 1,850,257 | 100.0% |
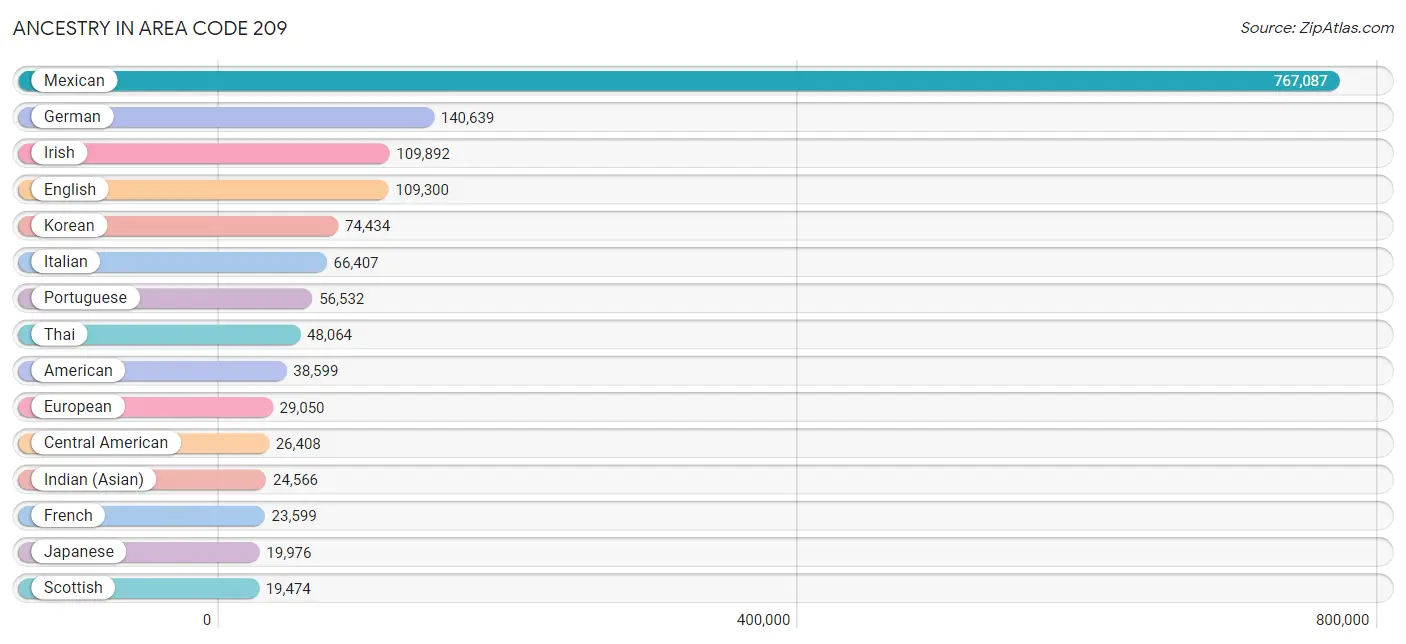
Ancestry in Area Code 209
The most populous ancestries reported in Area Code 209 are Mexican (767,087 | 41.5%), German (140,639 | 7.6%), Irish (109,892 | 5.9%), English (109,300 | 5.9%), and Korean (74,434 | 4.0%), together accounting for 64.9% of all Area Code 209 residents.
| Ancestry | # Population | % Population |
| Afghan | 5,110 | 0.3% |
| African | 8,714 | 0.5% |
| Alaska Native | 15 | 0.0% |
| Alaskan Athabascan | 98 | 0.0% |
| Albanian | 106 | 0.0% |
| Aleut | 33 | 0.0% |
| Alsatian | 50 | 0.0% |
| American | 38,599 | 2.1% |
| Apache | 2,924 | 0.2% |
| Arab | 9,813 | 0.5% |
| Arapaho | 6 | 0.0% |
| Argentinean | 755 | 0.0% |
| Armenian | 1,427 | 0.1% |
| Assyrian / Chaldean / Syriac | 5,797 | 0.3% |
| Australian | 698 | 0.0% |
| Austrian | 1,677 | 0.1% |
| Bangladeshi | 15,299 | 0.8% |
| Barbadian | 53 | 0.0% |
| Basque | 720 | 0.0% |
| Belgian | 815 | 0.0% |
| Belizean | 90 | 0.0% |
| Bhutanese | 10,912 | 0.6% |
| Blackfeet | 1,740 | 0.1% |
| Bolivian | 240 | 0.0% |
| Brazilian | 946 | 0.1% |
| British | 5,857 | 0.3% |
| British West Indian | 31 | 0.0% |
| Bulgarian | 34 | 0.0% |
| Burmese | 4,596 | 0.3% |
| Cajun | 95 | 0.0% |
| Cambodian | 61 | 0.0% |
| Canadian | 1,591 | 0.1% |
| Cape Verdean | 97 | 0.0% |
| Celtic | 152 | 0.0% |
| Central American | 26,408 | 1.4% |
| Central American Indian | 2,748 | 0.2% |
| Cherokee | 9,592 | 0.5% |
| Cheyenne | 173 | 0.0% |
| Chickasaw | 514 | 0.0% |
| Chilean | 685 | 0.0% |
| Chinese | 16 | 0.0% |
| Chippewa | 602 | 0.0% |
| Choctaw | 2,103 | 0.1% |
| Colombian | 1,791 | 0.1% |
| Colville | 9 | 0.0% |
| Comanche | 180 | 0.0% |
| Costa Rican | 571 | 0.0% |
| Cree | 51 | 0.0% |
| Creek | 453 | 0.0% |
| Croatian | 1,196 | 0.1% |
| Crow | 155 | 0.0% |
| Cuban | 2,089 | 0.1% |
| Czech | 2,011 | 0.1% |
| Czechoslovakian | 1,009 | 0.1% |
| Danish | 6,873 | 0.4% |
| Delaware | 21 | 0.0% |
| Dominican | 317 | 0.0% |
| Dutch | 17,637 | 0.9% |
| Dutch West Indian | 124 | 0.0% |
| Eastern European | 2,092 | 0.1% |
| Ecuadorian | 760 | 0.0% |
| Egyptian | 435 | 0.0% |
| English | 109,300 | 5.9% |
| Estonian | 193 | 0.0% |
| Ethiopian | 736 | 0.0% |
| European | 29,050 | 1.6% |
| Fijian | 34 | 0.0% |
| Filipino | 1,083 | 0.1% |
| Finnish | 1,564 | 0.1% |
| French | 23,599 | 1.3% |
| French American Indian | 104 | 0.0% |
| French Canadian | 3,358 | 0.2% |
| German | 140,639 | 7.6% |
| German Russian | 145 | 0.0% |
| Ghanaian | 419 | 0.0% |
| Greek | 5,965 | 0.3% |
| Guamanian / Chamorro | 2,724 | 0.2% |
| Guatemalan | 6,529 | 0.4% |
| Guyanese | 32 | 0.0% |
| Haitian | 188 | 0.0% |
| Honduran | 1,810 | 0.1% |
| Hopi | 286 | 0.0% |
| Houma | 18 | 0.0% |
| Hungarian | 2,142 | 0.1% |
| Icelander | 236 | 0.0% |
| Indian (Asian) | 24,566 | 1.3% |
| Indonesian | 468 | 0.0% |
| Inupiat | 75 | 0.0% |
| Iranian | 2,727 | 0.2% |
| Iraqi | 903 | 0.1% |
| Irish | 109,892 | 5.9% |
| Iroquois | 327 | 0.0% |
| Israeli | 179 | 0.0% |
| Italian | 66,407 | 3.6% |
| Jamaican | 782 | 0.0% |
| Japanese | 19,976 | 1.1% |
| Jordanian | 243 | 0.0% |
| Kenyan | 265 | 0.0% |
| Kiowa | 5 | 0.0% |
| Korean | 74,434 | 4.0% |
| Laotian | 758 | 0.0% |
| Latvian | 115 | 0.0% |
| Lebanese | 1,730 | 0.1% |
| Liberian | 570 | 0.0% |
| Lithuanian | 609 | 0.0% |
| Lumbee | 34 | 0.0% |
| Luxembourger | 24 | 0.0% |
| Macedonian | 17 | 0.0% |
| Malaysian | 6,712 | 0.4% |
| Maltese | 228 | 0.0% |
| Mexican | 767,087 | 41.5% |
| Mexican American Indian | 8,170 | 0.4% |
| Mongolian | 10 | 0.0% |
| Moroccan | 28 | 0.0% |
| Native Hawaiian | 5,719 | 0.3% |
| Navajo | 1,316 | 0.1% |
| Nepalese | 967 | 0.1% |
| New Zealander | 95 | 0.0% |
| Nicaraguan | 3,887 | 0.2% |
| Nigerian | 2,652 | 0.1% |
| Northern European | 2,263 | 0.1% |
| Norwegian | 14,184 | 0.8% |
| Osage | 111 | 0.0% |
| Ottawa | 36 | 0.0% |
| Paiute | 338 | 0.0% |
| Pakistani | 2,346 | 0.1% |
| Palestinian | 954 | 0.1% |
| Panamanian | 580 | 0.0% |
| Paraguayan | 2 | 0.0% |
| Pennsylvania German | 215 | 0.0% |
| Peruvian | 2,932 | 0.2% |
| Pima | 214 | 0.0% |
| Polish | 11,648 | 0.6% |
| Portuguese | 56,532 | 3.1% |
| Potawatomi | 187 | 0.0% |
| Pueblo | 364 | 0.0% |
| Puerto Rican | 11,141 | 0.6% |
| Puget Sound Salish | 72 | 0.0% |
| Romanian | 656 | 0.0% |
| Russian | 6,693 | 0.4% |
| Salvadoran | 12,913 | 0.7% |
| Samoan | 3,534 | 0.2% |
| Scandinavian | 4,102 | 0.2% |
| Scotch-Irish | 10,047 | 0.5% |
| Scottish | 19,474 | 1.1% |
| Seminole | 335 | 0.0% |
| Serbian | 244 | 0.0% |
| Shoshone | 199 | 0.0% |
| Sierra Leonean | 31 | 0.0% |
| Sioux | 1,356 | 0.1% |
| Slavic | 464 | 0.0% |
| Slovak | 338 | 0.0% |
| Slovene | 106 | 0.0% |
| Somali | 18 | 0.0% |
| South African | 122 | 0.0% |
| South American | 7,872 | 0.4% |
| South American Indian | 164 | 0.0% |
| Soviet Union | 13 | 0.0% |
| Spaniard | 9,458 | 0.5% |
| Spanish | 8,825 | 0.5% |
| Spanish American | 138 | 0.0% |
| Spanish American Indian | 91 | 0.0% |
| Sri Lankan | 13,811 | 0.7% |
| Subsaharan African | 14,213 | 0.8% |
| Sudanese | 3 | 0.0% |
| Swedish | 15,594 | 0.8% |
| Swiss | 4,240 | 0.2% |
| Syrian | 892 | 0.1% |
| Taiwanese | 35 | 0.0% |
| Thai | 48,064 | 2.6% |
| Tlingit-Haida | 76 | 0.0% |
| Tohono O'Odham | 220 | 0.0% |
| Tongan | 1,219 | 0.1% |
| Trinidadian and Tobagonian | 176 | 0.0% |
| Tsimshian | 3 | 0.0% |
| Turkish | 358 | 0.0% |
| U.S. Virgin Islander | 46 | 0.0% |
| Ukrainian | 1,668 | 0.1% |
| Uruguayan | 192 | 0.0% |
| Ute | 47 | 0.0% |
| Venezuelan | 509 | 0.0% |
| Vietnamese | 83 | 0.0% |
| Welsh | 7,445 | 0.4% |
| West Indian | 206 | 0.0% |
| Yakama | 6 | 0.0% |
| Yaqui | 1,271 | 0.1% |
| Yugoslavian | 874 | 0.1% |
| Yuman | 23 | 0.0% |
| Yup'ik | 20 | 0.0% |
| Zimbabwean | 3 | 0.0% | View All 190 Rows |
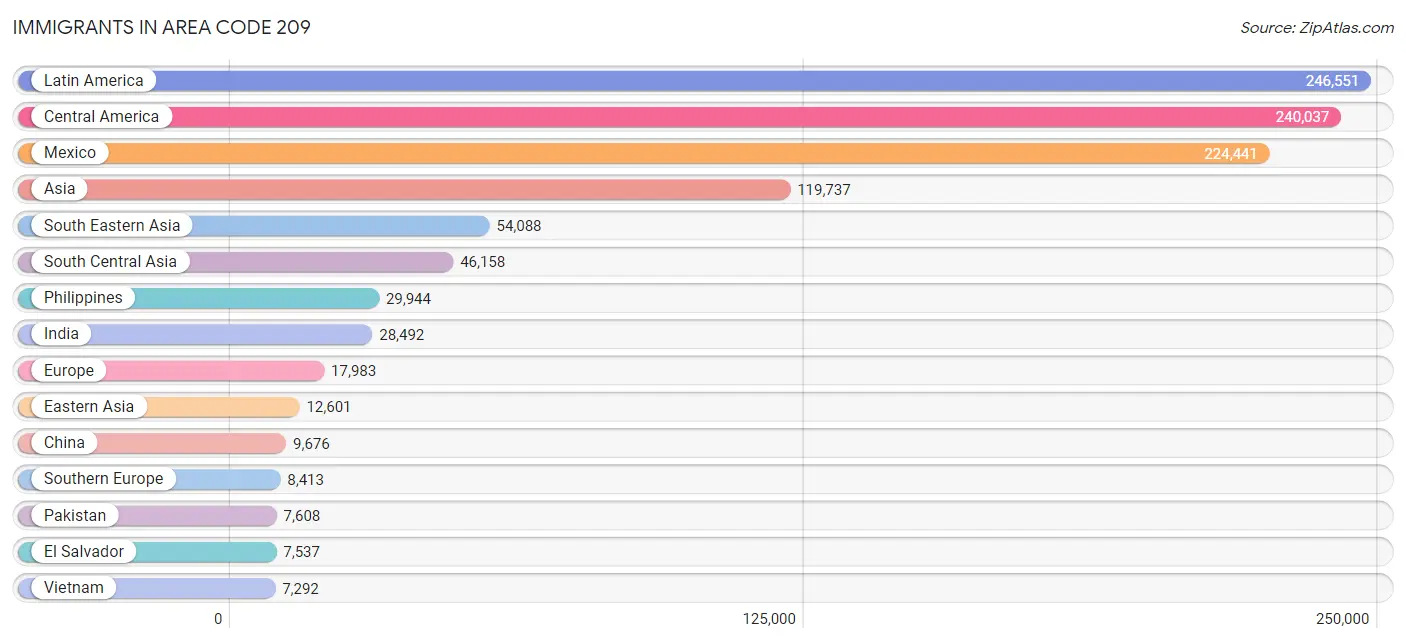
Immigrants in Area Code 209
The most numerous immigrant groups reported in Area Code 209 came from Latin America (246,551 | 13.3%), Central America (240,037 | 13.0%), Mexico (224,441 | 12.1%), Asia (119,737 | 6.5%), and South Eastern Asia (54,088 | 2.9%), together accounting for 47.8% of all Area Code 209 residents.
| Immigration Origin | # Population | % Population |
| Afghanistan | 5,216 | 0.3% |
| Africa | 5,229 | 0.3% |
| Albania | 10 | 0.0% |
| Argentina | 591 | 0.0% |
| Armenia | 80 | 0.0% |
| Asia | 119,737 | 6.5% |
| Australia | 561 | 0.0% |
| Austria | 76 | 0.0% |
| Azores | 3,923 | 0.2% |
| Bangladesh | 194 | 0.0% |
| Barbados | 147 | 0.0% |
| Belarus | 48 | 0.0% |
| Belgium | 28 | 0.0% |
| Belize | 22 | 0.0% |
| Bolivia | 113 | 0.0% |
| Bosnia and Herzegovina | 38 | 0.0% |
| Brazil | 667 | 0.0% |
| Bulgaria | 106 | 0.0% |
| Cambodia | 6,114 | 0.3% |
| Cameroon | 113 | 0.0% |
| Canada | 2,498 | 0.1% |
| Caribbean | 1,214 | 0.1% |
| Central America | 240,037 | 13.0% |
| Chile | 269 | 0.0% |
| China | 9,676 | 0.5% |
| Colombia | 709 | 0.0% |
| Costa Rica | 525 | 0.0% |
| Croatia | 87 | 0.0% |
| Cuba | 465 | 0.0% |
| Czechoslovakia | 118 | 0.0% |
| Denmark | 79 | 0.0% |
| Dominica | 19 | 0.0% |
| Dominican Republic | 93 | 0.0% |
| Eastern Africa | 889 | 0.1% |
| Eastern Asia | 12,601 | 0.7% |
| Eastern Europe | 2,930 | 0.2% |
| Ecuador | 176 | 0.0% |
| Egypt | 278 | 0.0% |
| El Salvador | 7,537 | 0.4% |
| England | 1,776 | 0.1% |
| Eritrea | 25 | 0.0% |
| Ethiopia | 281 | 0.0% |
| Europe | 17,983 | 1.0% |
| Fiji | 4,175 | 0.2% |
| France | 657 | 0.0% |
| Germany | 1,576 | 0.1% |
| Ghana | 628 | 0.0% |
| Greece | 327 | 0.0% |
| Guatemala | 4,335 | 0.2% |
| Haiti | 17 | 0.0% |
| Honduras | 1,268 | 0.1% |
| Hong Kong | 869 | 0.1% |
| Hungary | 190 | 0.0% |
| India | 28,492 | 1.5% |
| Indonesia | 478 | 0.0% |
| Iran | 4,237 | 0.2% |
| Iraq | 2,256 | 0.1% |
| Ireland | 297 | 0.0% |
| Israel | 239 | 0.0% |
| Italy | 616 | 0.0% |
| Jamaica | 259 | 0.0% |
| Japan | 968 | 0.1% |
| Jordan | 322 | 0.0% |
| Kazakhstan | 55 | 0.0% |
| Kenya | 329 | 0.0% |
| Korea | 1,935 | 0.1% |
| Kuwait | 131 | 0.0% |
| Laos | 5,244 | 0.3% |
| Latin America | 246,551 | 13.3% |
| Latvia | 77 | 0.0% |
| Lebanon | 405 | 0.0% |
| Liberia | 370 | 0.0% |
| Malaysia | 186 | 0.0% |
| Mexico | 224,441 | 12.1% |
| Micronesia | 21 | 0.0% |
| Middle Africa | 388 | 0.0% |
| Moldova | 7 | 0.0% |
| Morocco | 51 | 0.0% |
| Nepal | 78 | 0.0% |
| Netherlands | 788 | 0.0% |
| Nicaragua | 1,532 | 0.1% |
| Nigeria | 1,472 | 0.1% |
| Northern Africa | 784 | 0.0% |
| Northern Europe | 3,400 | 0.2% |
| Norway | 41 | 0.0% |
| Oceania | 6,109 | 0.3% |
| Pakistan | 7,608 | 0.4% |
| Panama | 270 | 0.0% |
| Peru | 2,183 | 0.1% |
| Philippines | 29,944 | 1.6% |
| Poland | 389 | 0.0% |
| Portugal | 7,142 | 0.4% |
| Romania | 307 | 0.0% |
| Russia | 839 | 0.1% |
| Saudi Arabia | 40 | 0.0% |
| Scotland | 183 | 0.0% |
| Serbia | 14 | 0.0% |
| Sierra Leone | 182 | 0.0% |
| Singapore | 122 | 0.0% |
| Somalia | 18 | 0.0% |
| South Africa | 211 | 0.0% |
| South America | 5,300 | 0.3% |
| South Central Asia | 46,158 | 2.5% |
| South Eastern Asia | 54,088 | 2.9% |
| Southern Europe | 8,413 | 0.4% |
| Spain | 320 | 0.0% |
| Sri Lanka | 261 | 0.0% |
| Sudan | 303 | 0.0% |
| Sweden | 269 | 0.0% |
| Switzerland | 115 | 0.0% |
| Syria | 792 | 0.0% |
| Taiwan | 1,672 | 0.1% |
| Thailand | 4,110 | 0.2% |
| Trinidad and Tobago | 152 | 0.0% |
| Turkey | 165 | 0.0% |
| Uganda | 18 | 0.0% |
| Ukraine | 494 | 0.0% |
| Uruguay | 92 | 0.0% |
| Uzbekistan | 17 | 0.0% |
| Venezuela | 324 | 0.0% |
| Vietnam | 7,292 | 0.4% |
| West Indies | 31 | 0.0% |
| Western Africa | 2,747 | 0.2% |
| Western Asia | 5,977 | 0.3% |
| Western Europe | 3,240 | 0.2% |
| Yemen | 1,420 | 0.1% |
| Zaire | 43 | 0.0% |
| Zimbabwe | 3 | 0.0% | View All 128 Rows |
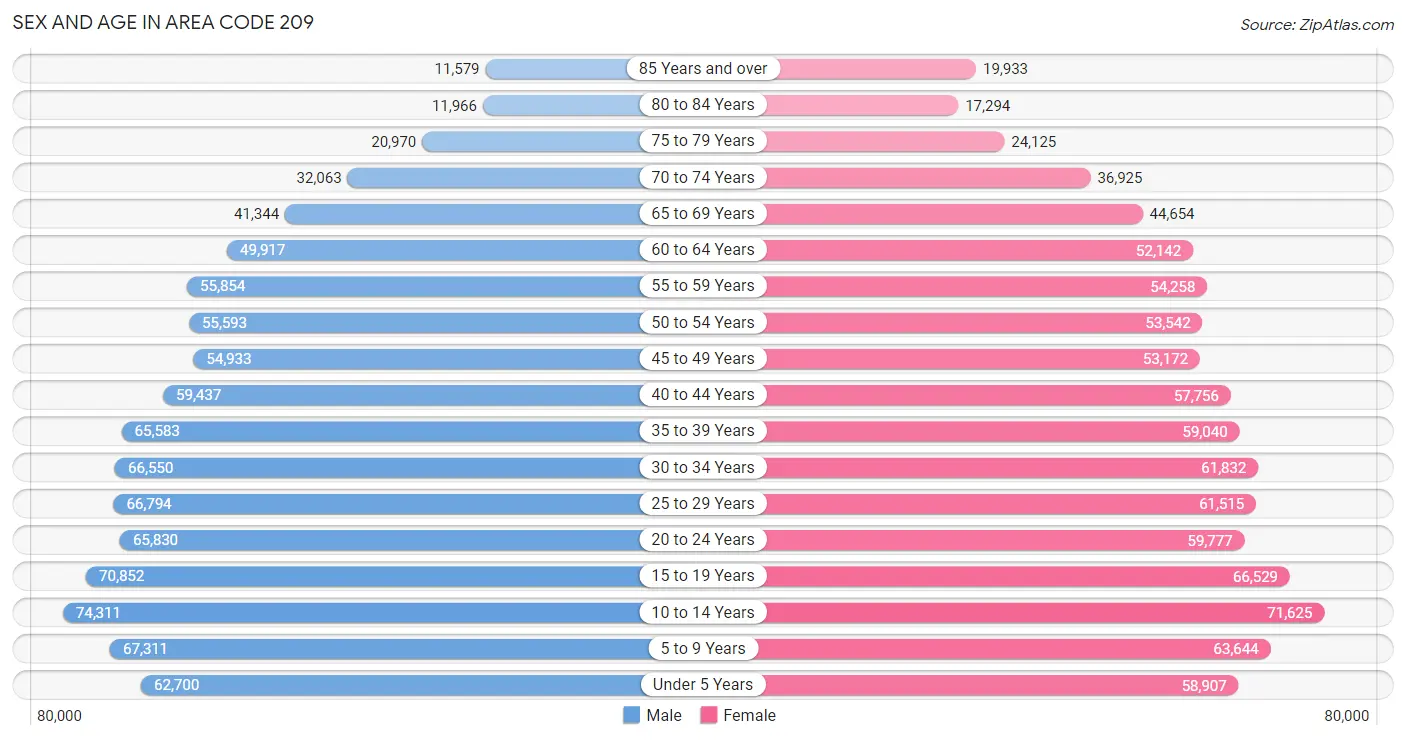
Sex and Age in Area Code 209
Sex and Age in Area Code 209
The most populous age groups in Area Code 209 are 10 to 14 Years (74,311 | 8.0%) for men and 10 to 14 Years (71,625 | 7.8%) for women.
| Age Bracket | Male | Female |
| Under 5 Years | 62,700 (6.7%) | 58,907 (6.4%) |
| 5 to 9 Years | 67,311 (7.2%) | 63,644 (6.9%) |
| 10 to 14 Years | 74,311 (8.0%) | 71,625 (7.8%) |
| 15 to 19 Years | 70,852 (7.6%) | 66,529 (7.3%) |
| 20 to 24 Years | 65,830 (7.0%) | 59,777 (6.5%) |
| 25 to 29 Years | 66,794 (7.1%) | 61,515 (6.7%) |
| 30 to 34 Years | 66,550 (7.1%) | 61,832 (6.8%) |
| 35 to 39 Years | 65,583 (7.0%) | 59,040 (6.4%) |
| 40 to 44 Years | 59,437 (6.4%) | 57,756 (6.3%) |
| 45 to 49 Years | 54,933 (5.9%) | 53,172 (5.8%) |
| 50 to 54 Years | 55,593 (5.9%) | 53,542 (5.8%) |
| 55 to 59 Years | 55,854 (6.0%) | 54,258 (5.9%) |
| 60 to 64 Years | 49,917 (5.3%) | 52,142 (5.7%) |
| 65 to 69 Years | 41,344 (4.4%) | 44,654 (4.9%) |
| 70 to 74 Years | 32,063 (3.4%) | 36,925 (4.0%) |
| 75 to 79 Years | 20,970 (2.2%) | 24,125 (2.6%) |
| 80 to 84 Years | 11,966 (1.3%) | 17,294 (1.9%) |
| 85 Years and over | 11,579 (1.2%) | 19,933 (2.2%) |
| Total | 933,587 (100.0%) | 916,670 (100.0%) |
Families and Households in Area Code 209
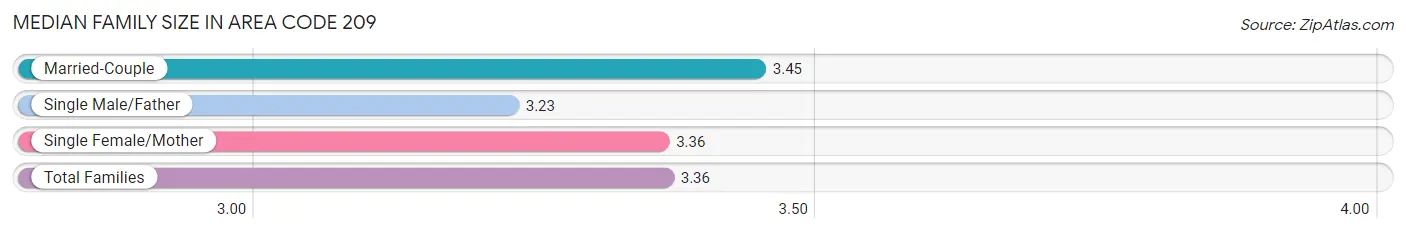
Median Family Size in Area Code 209
The median family size in Area Code 209 is 3.36 persons per family, with married-couple families (296,460 | 69.1%) accounting for the largest median family size of 3.4462 persons per family. On the other hand, single male/father families (45,942 | 10.7%) represent the smallest median family size with 3.23 persons per family.
| Family Type | # Families | Family Size |
| Married-Couple | 296,460 (69.1%) | 3.45 |
| Single Male/Father | 45,942 (10.7%) | 3.23 |
| Single Female/Mother | 86,455 (20.2%) | 3.36 |
| Total Families | 428,857 (100.0%) | 3.36 |
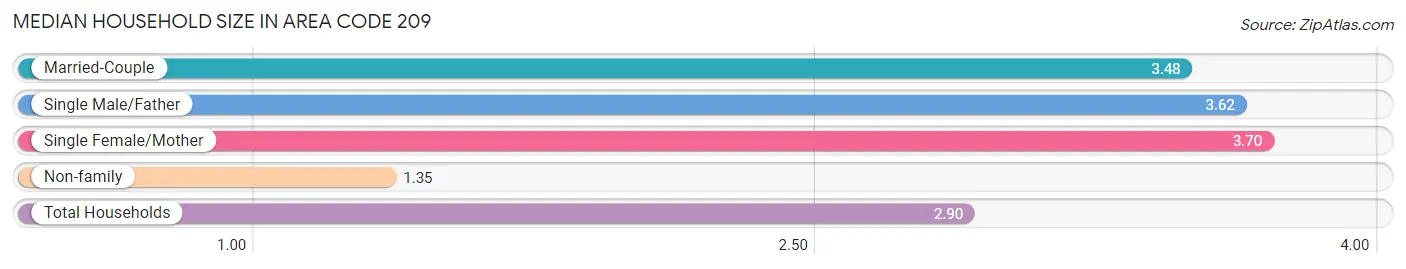
Median Household Size in Area Code 209
The median household size in Area Code 209 is 2.90 persons per household, with single female/mother households (86,455 | 14.8%) accounting for the largest median household size of 3.69815 persons per household. non-family households (155,709 | 26.6%) represent the smallest median household size with 1.35 persons per household.
| Household Type | # Households | Household Size |
| Married-Couple | 296,460 (50.7%) | 3.48 |
| Single Male/Father | 45,942 (7.9%) | 3.62 |
| Single Female/Mother | 86,455 (14.8%) | 3.70 |
| Non-family | 155,709 (26.6%) | 1.35 |
| Total Households | 584,566 (100.0%) | 2.90 |
Household Size by Marriage Status in Area Code 209
Out of a total of 584,566 households in Area Code 209, 428,857 (73.4%) are family households, while 155,709 (26.6%) are nonfamily households. The most numerous type of family households are 2-person households, comprising 144,868, and the most common type of nonfamily households are 1-person households, comprising 124,492.
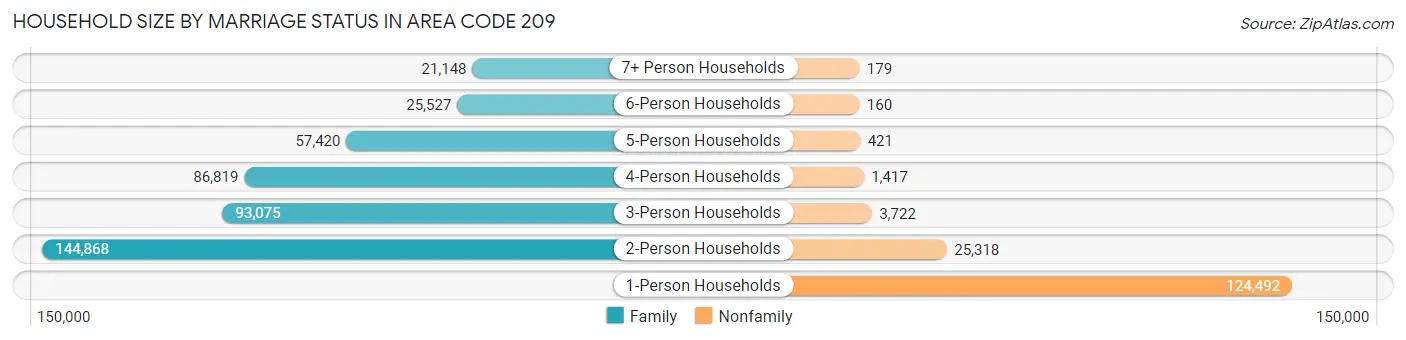
| Household Size | Family Households | Nonfamily Households |
| 1-Person Households | - | 124,492 (21.3%) |
| 2-Person Households | 144,868 (24.8%) | 25,318 (4.3%) |
| 3-Person Households | 93,075 (15.9%) | 3,722 (0.6%) |
| 4-Person Households | 86,819 (14.8%) | 1,417 (0.2%) |
| 5-Person Households | 57,420 (9.8%) | 421 (0.1%) |
| 6-Person Households | 25,527 (4.4%) | 160 (0.0%) |
| 7+ Person Households | 21,148 (3.6%) | 179 (0.0%) |
| Total | 428,857 (73.4%) | 155,709 (26.6%) |
Female Fertility in Area Code 209
Fertility by Age in Area Code 209
Average fertility rate in Area Code 209 is 71.9 births per 1,000 women. Women in the age bracket of 20 to 34 years have the highest fertility rate with 125.7 births per 1,000 women. Women in the age bracket of 20 to 34 years acount for 74.3% of all women with births.
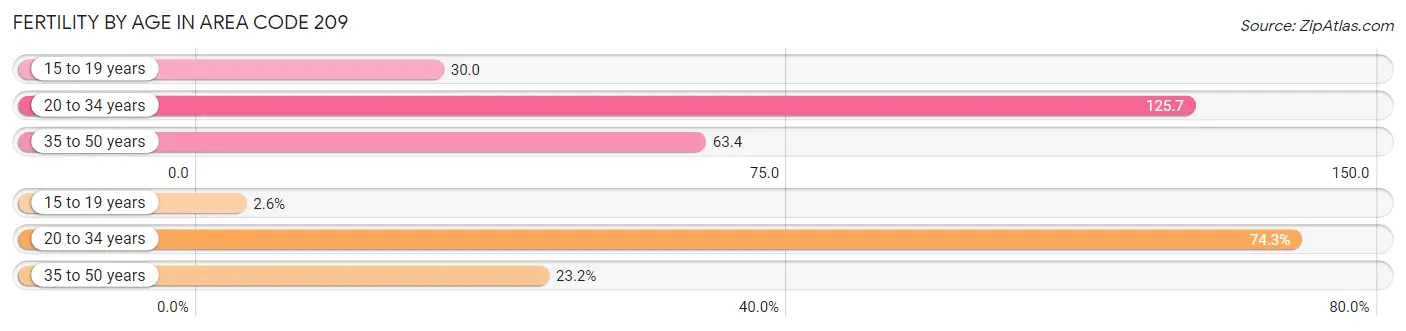
| Age Bracket | Women with Births | Births / 1,000 Women |
| 15 to 19 years | 606 (2.6%) | 30.0 |
| 20 to 34 years | 17,297 (74.3%) | 125.7 |
| 35 to 50 years | 5,392 (23.2%) | 63.4 |
| Total | 23,295 (100.0%) | 71.9 |
Fertility by Age by Marriage Status in Area Code 209
58.5% of women with births (23,295) in Area Code 209 are married. The highest percentage of unmarried women with births falls into 15 to 19 years age bracket with 95.2% of them unmarried at the time of birth, while the lowest percentage of unmarried women with births belong to 35 to 50 years age bracket with 40.8% of them unmarried.
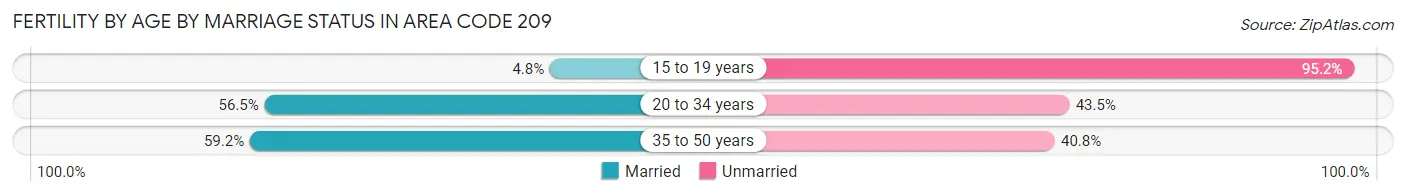
| Age Bracket | Married | Unmarried |
| 15 to 19 years | 29 (4.8%) | 577 (95.2%) |
| 20 to 34 years | 9,774 (56.5%) | 7,523 (43.5%) |
| 35 to 50 years | 3,190 (59.2%) | 2,202 (40.8%) |
| Total | 13,628 (58.5%) | 9,667 (41.5%) |
Fertility by Education in Area Code 209
Average fertility rate in Area Code 209 is 71.9 births per 1,000 women. Women with the education attainment of graduate degree have the highest fertility rate of 212.8 births per 1,000 women, while women with the education attainment of less than high school have the lowest fertility at 47.1 births per 1,000 women. Women with the education attainment of college or associate's degree represent 37.9% of all women with births.
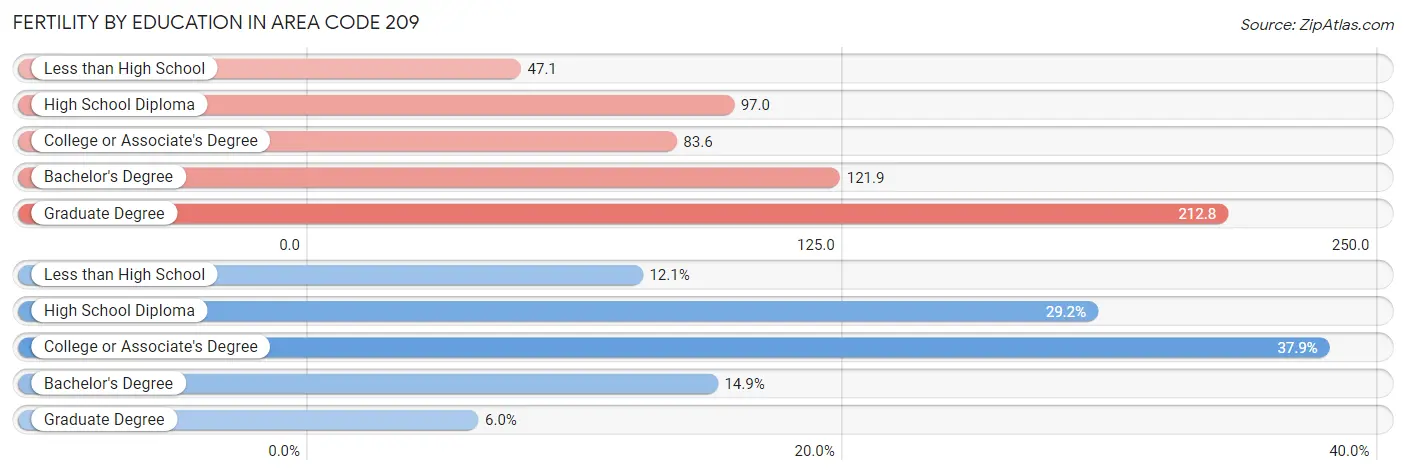
| Educational Attainment | Women with Births | Births / 1,000 Women |
| Less than High School | 2,821 (12.1%) | 47.1 |
| High School Diploma | 6,795 (29.2%) | 97.0 |
| College or Associate's Degree | 8,818 (37.9%) | 83.6 |
| Bachelor's Degree | 3,476 (14.9%) | 121.9 |
| Graduate Degree | 1,385 (5.9%) | 212.8 |
| Total | 23,295 (100.0%) | 71.9 |
Fertility by Education by Marriage Status in Area Code 209
41.5% of women with births in Area Code 209 are unmarried. Women with the educational attainment of college or associate's degree are most likely to be married with 54.5% of them married at childbirth, while women with the educational attainment of less than high school are least likely to be married with 63.1% of them unmarried at childbirth.
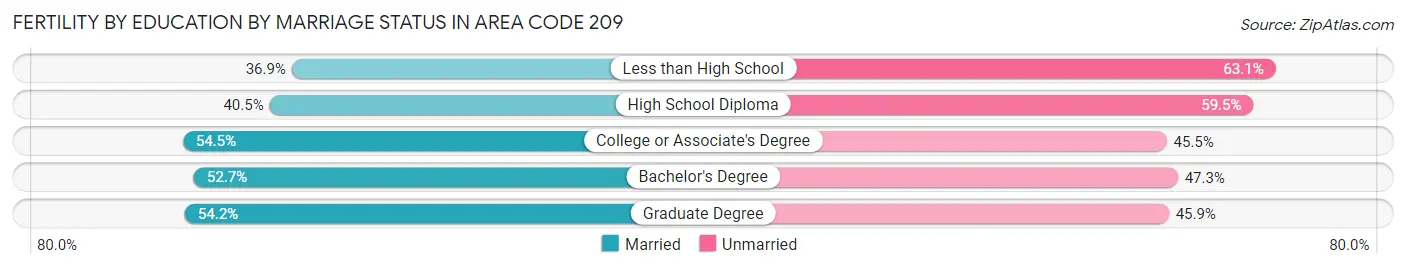
| Educational Attainment | Married | Unmarried |
| Less than High School | 1,042 (36.9%) | 1,779 (63.1%) |
| High School Diploma | 2,753 (40.5%) | 4,042 (59.5%) |
| College or Associate's Degree | 4,805 (54.5%) | 4,013 (45.5%) |
| Bachelor's Degree | 1,832 (52.7%) | 1,644 (47.3%) |
| Graduate Degree | 750 (54.1%) | 635 (45.9%) |
| Total | 13,628 (58.5%) | 9,667 (41.5%) |
Employment Characteristics in Area Code 209
Employment by Class of Employer in Area Code 209
Among the 751,713 employed individuals in Area Code 209, private company employees (516,507 | 68.7%), local government employees (71,730 | 9.5%), and self-employed (not incorporated) (49,103 | 6.5%) make up the most common classes of employment.
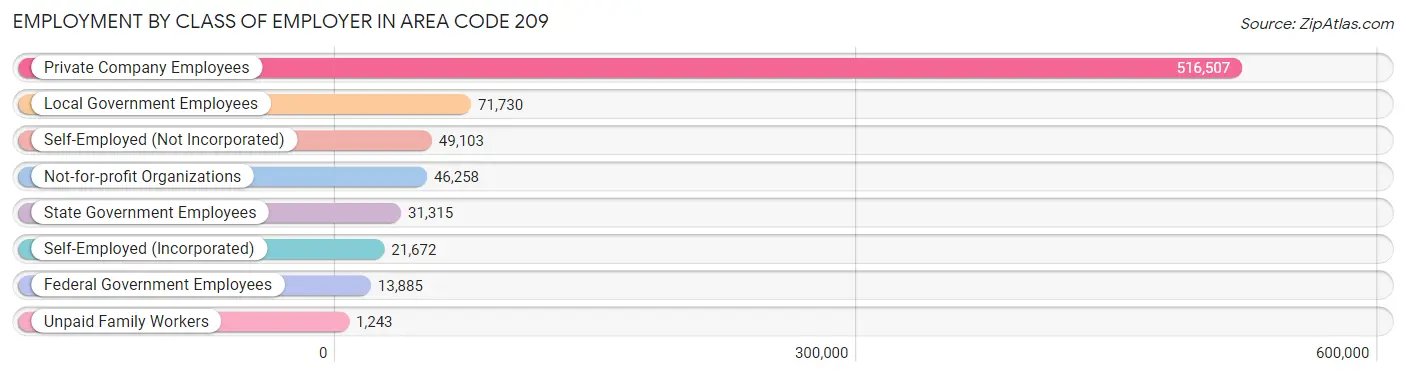
| Employer Class | # Employees | % Employees |
| Private Company Employees | 516,507 | 68.7% |
| Self-Employed (Incorporated) | 21,672 | 2.9% |
| Self-Employed (Not Incorporated) | 49,103 | 6.5% |
| Not-for-profit Organizations | 46,258 | 6.1% |
| Local Government Employees | 71,730 | 9.5% |
| State Government Employees | 31,315 | 4.2% |
| Federal Government Employees | 13,885 | 1.8% |
| Unpaid Family Workers | 1,243 | 0.2% |
| Total | 751,713 | 100.0% |
Employment Status by Age in Area Code 209
According to the labor force statistics for Area Code 209, out of the total population over 16 years of age (1,423,105), 56.2% or 799,500 individuals are in the labor force, with 9.6% or 76,832 of them unemployed. The age group with the highest labor force participation rate is 25 to 29 years, with 78.8% or 101,069 individuals in the labor force. Within the labor force, the 16 to 19 years age range has the highest percentage of unemployed individuals, with 1,933.7% or 815,325 of them being unemployed.
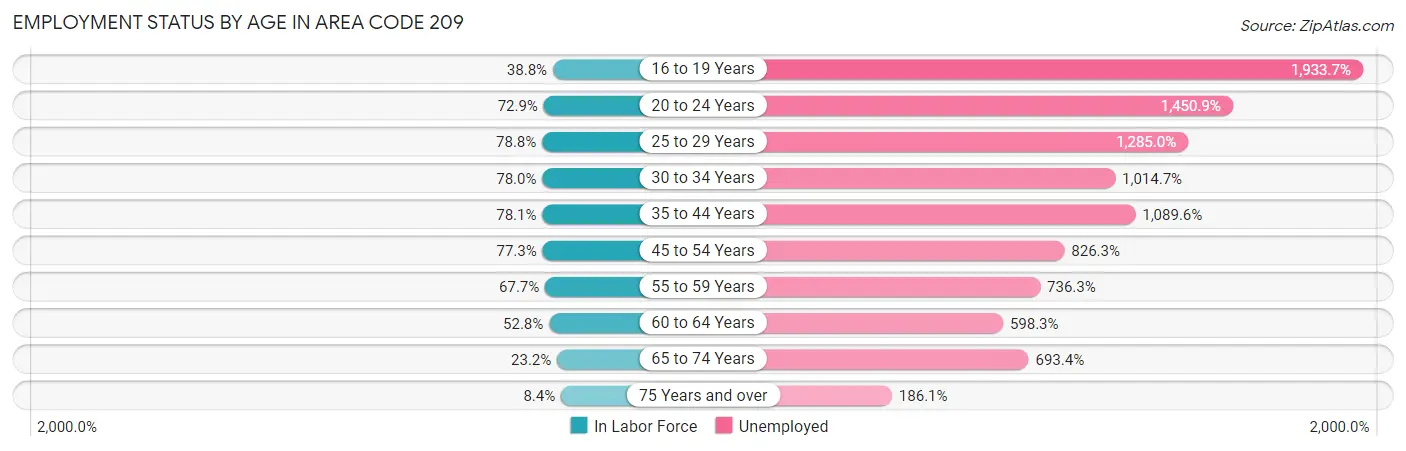
| Age Bracket | In Labor Force | Unemployed |
| 16 to 19 Years | 42,160 (38.8%) | 815,325 (1,933.7%) |
| 20 to 24 Years | 91,590 (72.9%) | 1,328,923 (1,450.9%) |
| 25 to 29 Years | 101,070 (78.8%) | 1,298,737 (1,285.0%) |
| 30 to 34 Years | 100,186 (78.0%) | 1,016,618 (1,014.7%) |
| 35 to 44 Years | 188,897 (78.1%) | 2,058,331 (1,089.6%) |
| 45 to 54 Years | 167,846 (77.3%) | 1,386,862 (826.3%) |
| 55 to 59 Years | 74,491 (67.6%) | 548,477 (736.3%) |
| 60 to 64 Years | 53,907 (52.8%) | 322,532 (598.3%) |
| 65 to 74 Years | 35,987 (23.2%) | 249,541 (693.4%) |
| 75 Years and over | 8,918 (8.4%) | 16,589 (186.1%) |
| Total | 799,457 (56.2%) | 76,828 (9.6%) |
Employment Status by Educational Attainment in Area Code 209
According to labor force statistics for Area Code 209, 71.4% of individuals (662,255) out of the total population between 25 and 64 years of age (927,918) are in the labor force, with 1,008.8% or 6,680,828 of them being unemployed. The group with the highest labor force participation rate are those with the educational attainment of bachelor's degree or higher, with 81.8% or 141,984 individuals in the labor force. Within the labor force, individuals with high school diploma education have the highest percentage of unemployment, with 1,034.2% or 1,977,153 of them being unemployed.
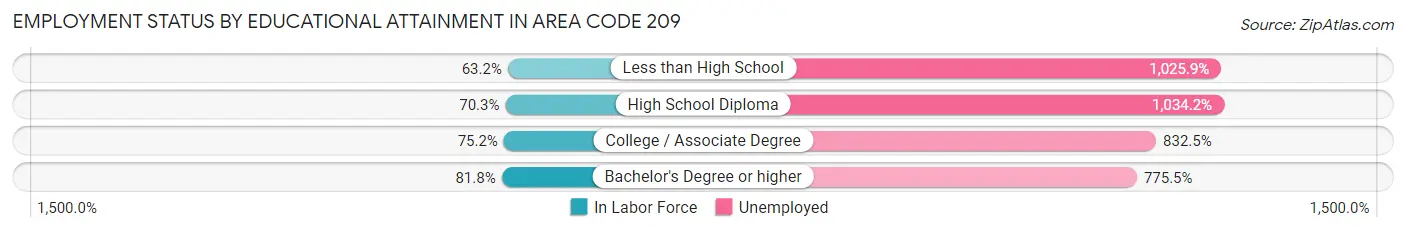
| Educational Attainment | In Labor Force | Unemployed |
| Less than High School | 114,989 (63.2%) | 1,865,907 (1,025.9%) |
| High School Diploma | 191,173 (70.3%) | 2,812,848 (1,034.2%) |
| College / Associate Degree | 225,847 (75.2%) | 2,501,504 (832.5%) |
| Bachelor's Degree or higher | 141,985 (81.8%) | 1,346,066 (775.5%) |
| Total | 662,291 (71.4%) | 9,360,837 (1,008.8%) |
Employment Occupations by Sex in Area Code 209
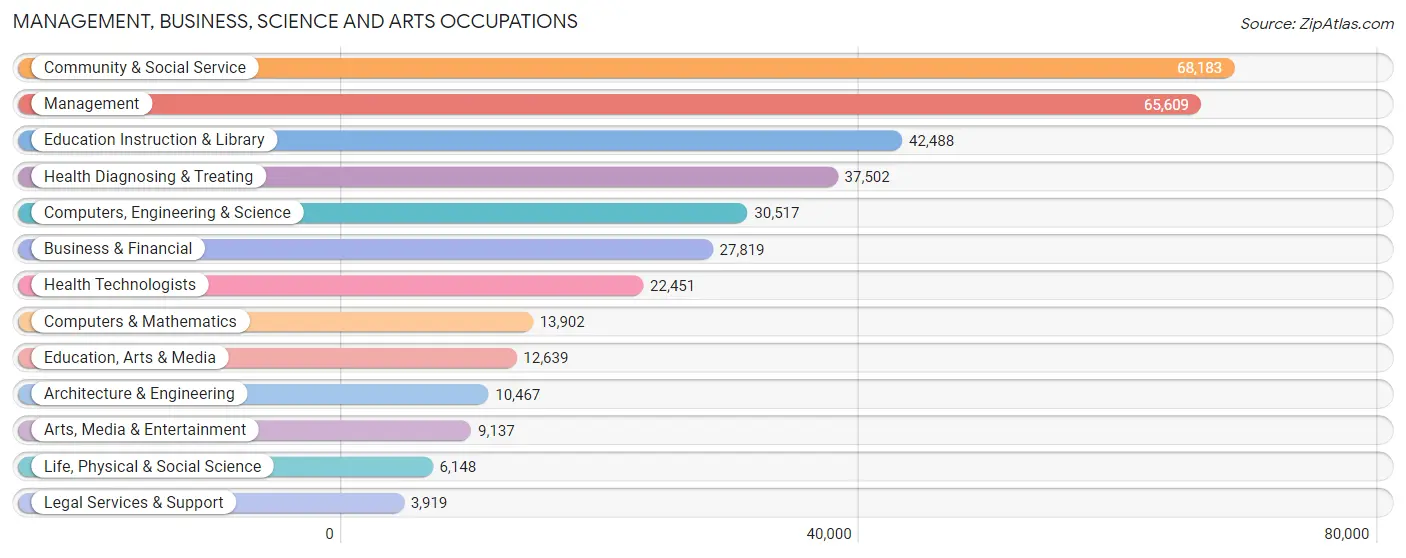
Management, Business, Science and Arts Occupations
The most common Management, Business, Science and Arts occupations in Area Code 209 are Community & Social Service (68,183 | 8.7%), Management (65,609 | 8.4%), Education Instruction & Library (42,488 | 5.4%), Health Diagnosing & Treating (37,502 | 4.8%), and Computers, Engineering & Science (30,517 | 3.9%).
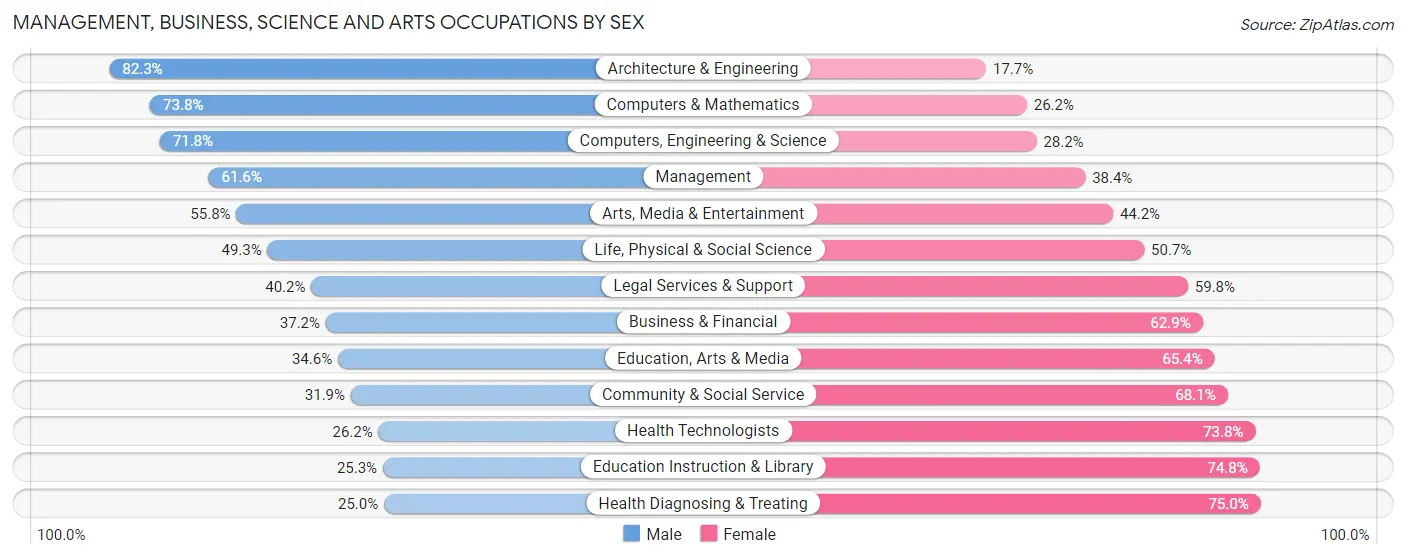
Management, Business, Science and Arts Occupations by Sex
Within the Management, Business, Science and Arts occupations in Area Code 209, the most male-oriented occupations are Architecture & Engineering (82.3%), Computers & Mathematics (73.8%), and Computers, Engineering & Science (71.8%), while the most female-oriented occupations are Health Diagnosing & Treating (75.0%), Education Instruction & Library (74.8%), and Health Technologists (73.8%).
| Occupation | Male | Female |
| Management | 40,422 (61.6%) | 25,187 (38.4%) |
| Business & Financial | 10,335 (37.1%) | 17,484 (62.8%) |
| Computers, Engineering & Science | 21,905 (71.8%) | 8,612 (28.2%) |
| Computers & Mathematics | 10,259 (73.8%) | 3,643 (26.2%) |
| Architecture & Engineering | 8,614 (82.3%) | 1,853 (17.7%) |
| Life, Physical & Social Science | 3,032 (49.3%) | 3,116 (50.7%) |
| Community & Social Service | 21,780 (31.9%) | 46,403 (68.1%) |
| Education, Arts & Media | 4,377 (34.6%) | 8,262 (65.4%) |
| Legal Services & Support | 1,575 (40.2%) | 2,344 (59.8%) |
| Education Instruction & Library | 10,728 (25.3%) | 31,760 (74.8%) |
| Arts, Media & Entertainment | 5,100 (55.8%) | 4,037 (44.2%) |
| Health Diagnosing & Treating | 9,382 (25.0%) | 28,120 (75.0%) |
| Health Technologists | 5,874 (26.2%) | 16,577 (73.8%) |
| Total (Category) | 103,824 (45.2%) | 125,806 (54.8%) |
| Total (Overall) | 437,582 (56.1%) | 342,588 (43.9%) |
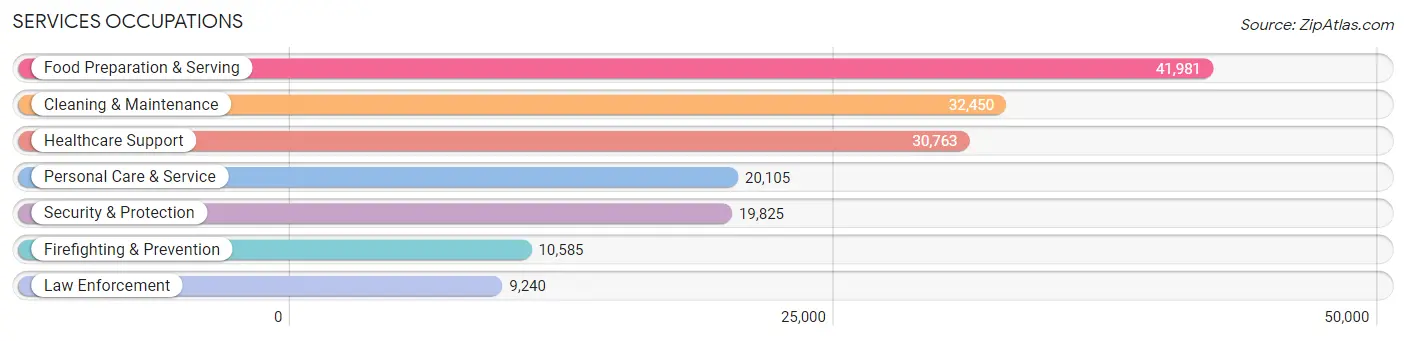
Services Occupations
The most common Services occupations in Area Code 209 are Food Preparation & Serving (41,981 | 5.4%), Cleaning & Maintenance (32,450 | 4.2%), Healthcare Support (30,763 | 3.9%), Personal Care & Service (20,105 | 2.6%), and Security & Protection (19,825 | 2.5%).
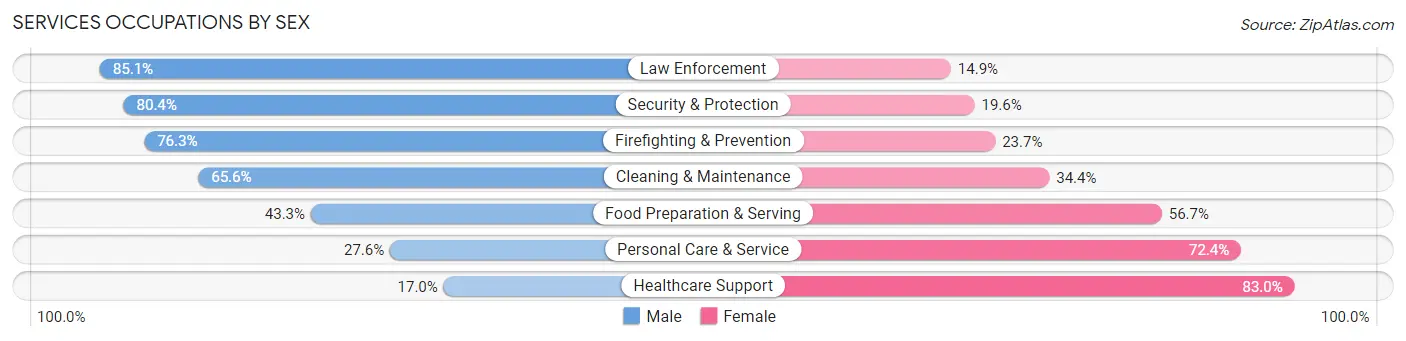
Services Occupations by Sex
Within the Services occupations in Area Code 209, the most male-oriented occupations are Law Enforcement (85.1%), Security & Protection (80.4%), and Firefighting & Prevention (76.3%), while the most female-oriented occupations are Healthcare Support (83.0%), Personal Care & Service (72.4%), and Food Preparation & Serving (56.7%).
| Occupation | Male | Female |
| Healthcare Support | 5,238 (17.0%) | 25,525 (83.0%) |
| Security & Protection | 15,937 (80.4%) | 3,888 (19.6%) |
| Firefighting & Prevention | 8,076 (76.3%) | 2,509 (23.7%) |
| Law Enforcement | 7,861 (85.1%) | 1,379 (14.9%) |
| Food Preparation & Serving | 18,185 (43.3%) | 23,796 (56.7%) |
| Cleaning & Maintenance | 21,287 (65.6%) | 11,163 (34.4%) |
| Personal Care & Service | 5,556 (27.6%) | 14,549 (72.4%) |
| Total (Category) | 66,203 (45.6%) | 78,921 (54.4%) |
| Total (Overall) | 437,582 (56.1%) | 342,588 (43.9%) |
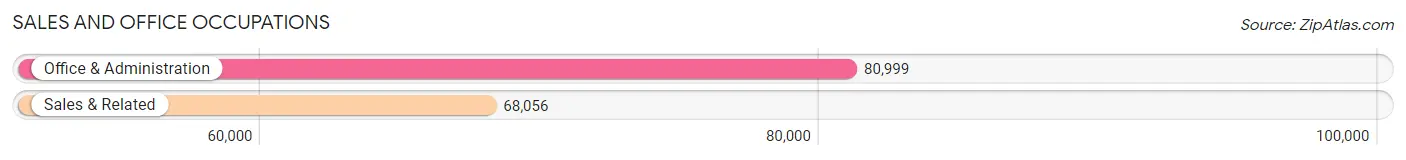
Sales and Office Occupations
The most common Sales and Office occupations in Area Code 209 are Office & Administration (80,999 | 10.4%), and Sales & Related (68,056 | 8.7%).
Sales and Office Occupations by Sex
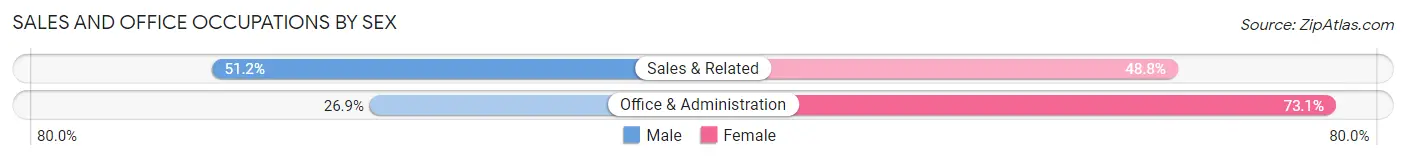
| Occupation | Male | Female |
| Sales & Related | 34,856 (51.2%) | 33,200 (48.8%) |
| Office & Administration | 21,782 (26.9%) | 59,217 (73.1%) |
| Total (Category) | 56,638 (38.0%) | 92,417 (62.0%) |
| Total (Overall) | 437,582 (56.1%) | 342,588 (43.9%) |
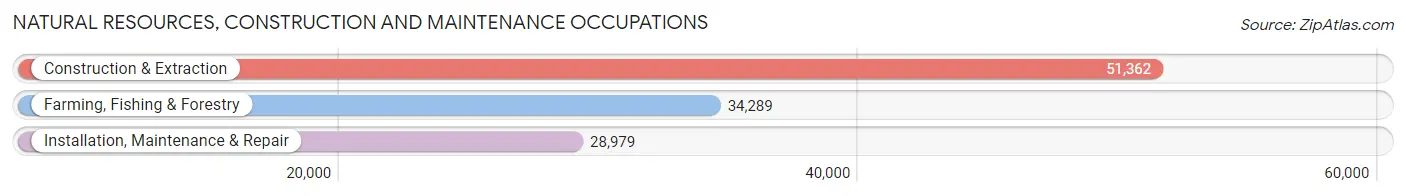
Natural Resources, Construction and Maintenance Occupations
The most common Natural Resources, Construction and Maintenance occupations in Area Code 209 are Construction & Extraction (51,362 | 6.6%), Farming, Fishing & Forestry (34,289 | 4.4%), and Installation, Maintenance & Repair (28,979 | 3.7%).
Natural Resources, Construction and Maintenance Occupations by Sex
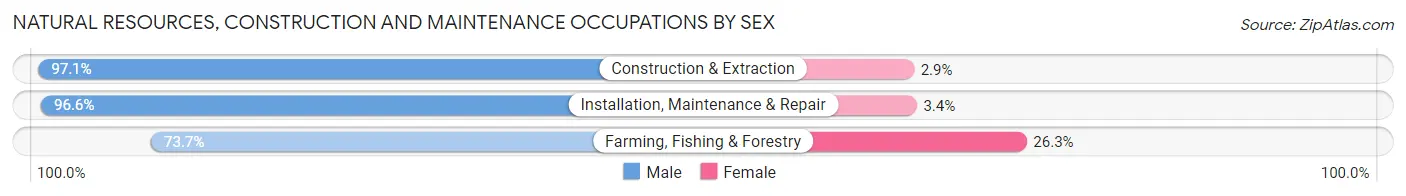
| Occupation | Male | Female |
| Farming, Fishing & Forestry | 25,264 (73.7%) | 9,025 (26.3%) |
| Construction & Extraction | 49,890 (97.1%) | 1,472 (2.9%) |
| Installation, Maintenance & Repair | 27,982 (96.6%) | 997 (3.4%) |
| Total (Category) | 103,136 (90.0%) | 11,494 (10.0%) |
| Total (Overall) | 437,582 (56.1%) | 342,588 (43.9%) |
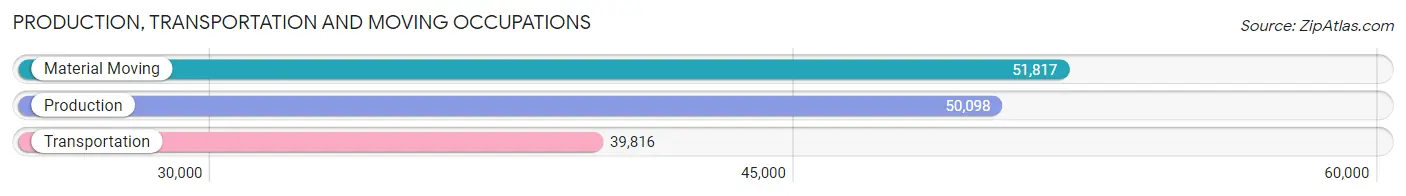
Production, Transportation and Moving Occupations
The most common Production, Transportation and Moving occupations in Area Code 209 are Material Moving (51,817 | 6.6%), Production (50,098 | 6.4%), and Transportation (39,816 | 5.1%).
Production, Transportation and Moving Occupations by Sex
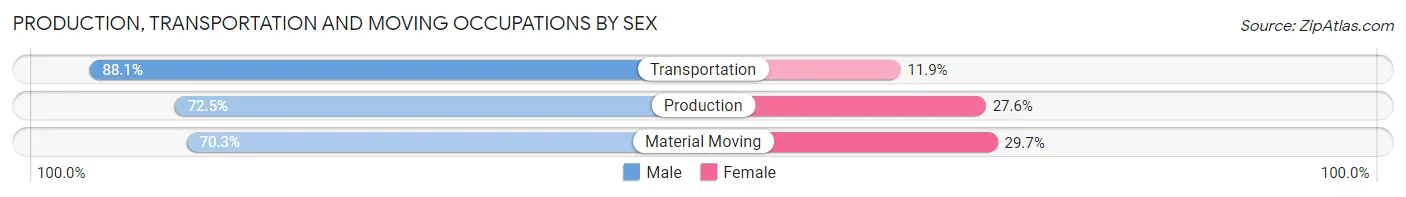
| Occupation | Male | Female |
| Production | 36,298 (72.5%) | 13,800 (27.6%) |
| Transportation | 35,073 (88.1%) | 4,743 (11.9%) |
| Material Moving | 36,410 (70.3%) | 15,407 (29.7%) |
| Total (Category) | 107,781 (76.0%) | 33,950 (23.9%) |
| Total (Overall) | 437,582 (56.1%) | 342,588 (43.9%) |
Employment Industries by Sex in Area Code 209
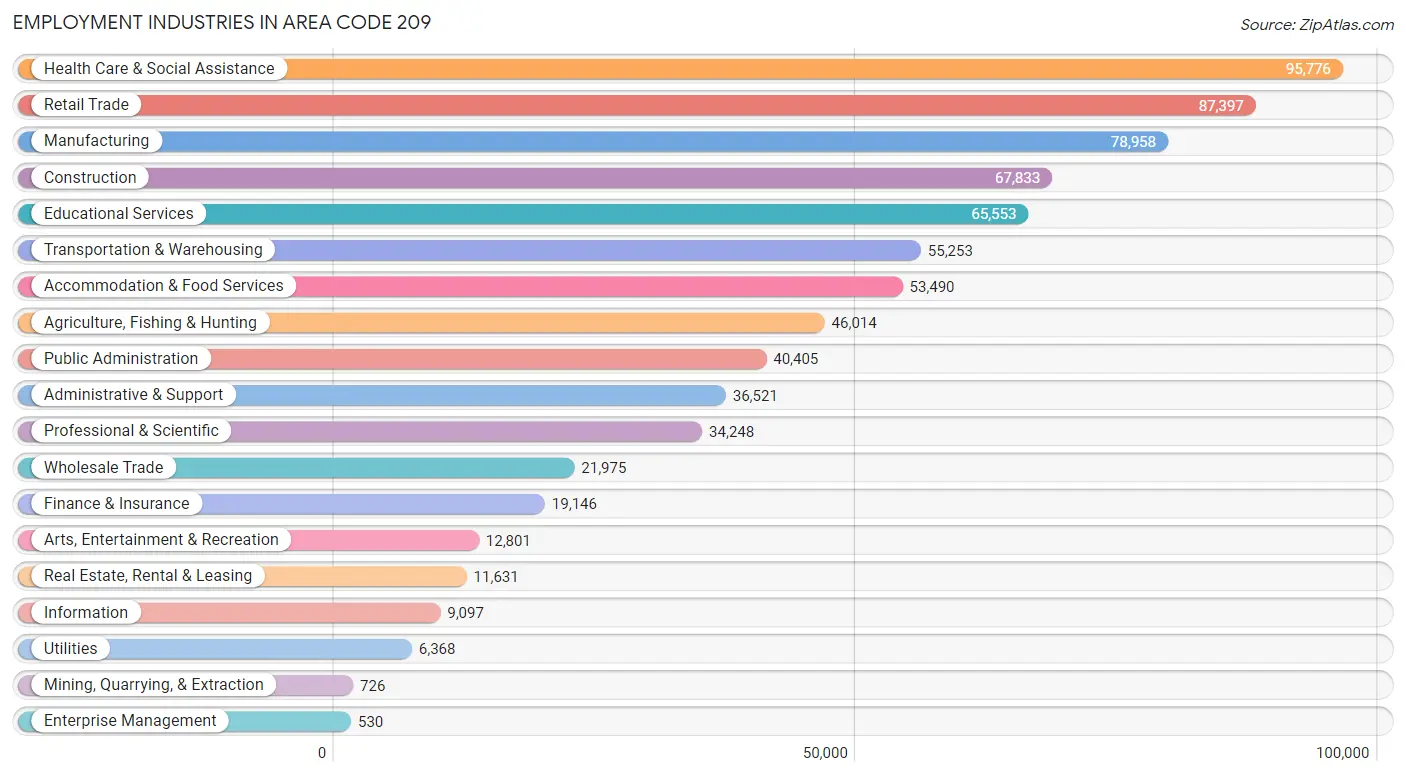
Employment Industries in Area Code 209
The major employment industries in Area Code 209 include Health Care & Social Assistance (95,776 | 12.3%), Retail Trade (87,397 | 11.2%), Manufacturing (78,958 | 10.1%), Construction (67,833 | 8.7%), and Educational Services (65,553 | 8.4%).
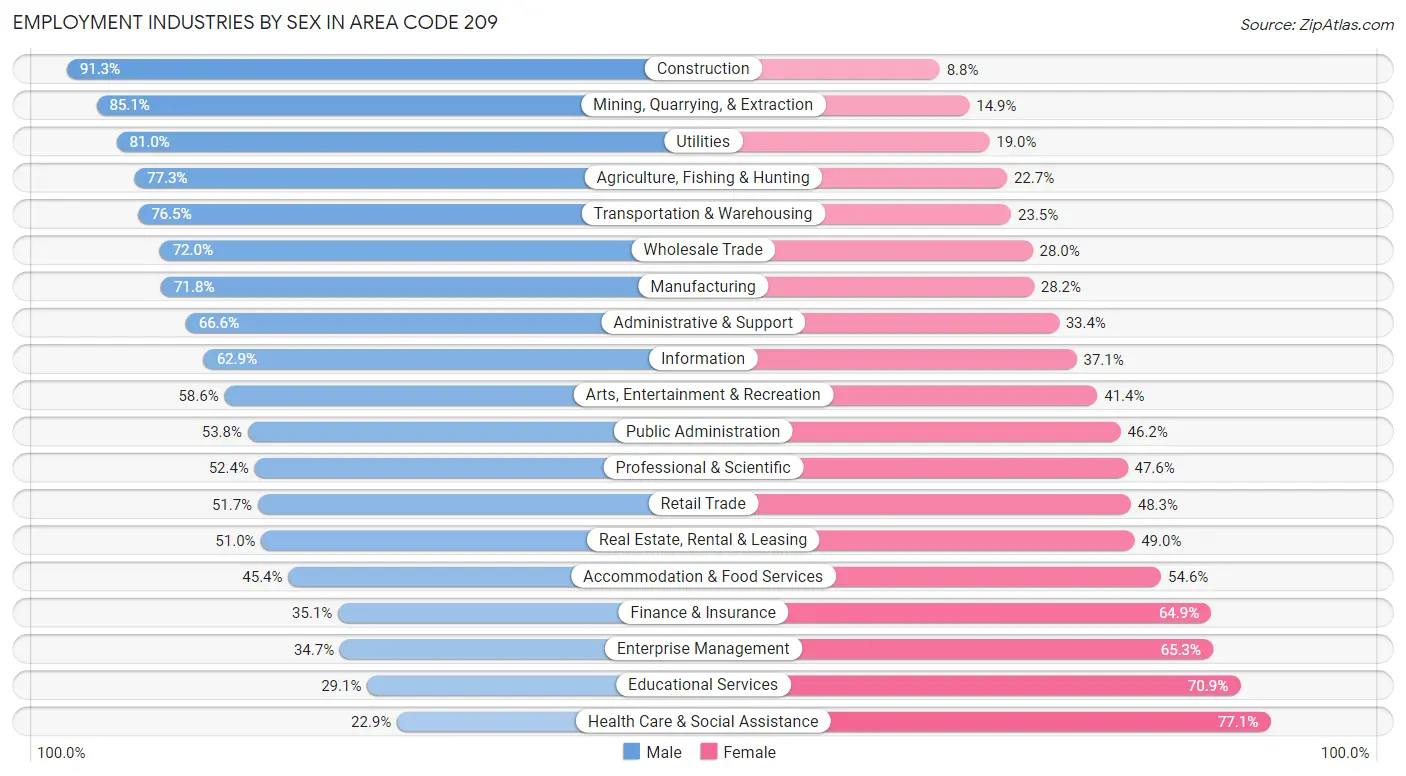
Employment Industries by Sex in Area Code 209
The Area Code 209 industries that see more men than women are Construction (91.2%), Mining, Quarrying, & Extraction (85.1%), and Utilities (81.0%), whereas the industries that tend to have a higher number of women are Health Care & Social Assistance (77.1%), Educational Services (70.9%), and Enterprise Management (65.3%).
| Industry | Male | Female |
| Agriculture, Fishing & Hunting | 35,579 (77.3%) | 10,435 (22.7%) |
| Mining, Quarrying, & Extraction | 618 (85.1%) | 108 (14.9%) |
| Construction | 61,895 (91.2%) | 5,938 (8.7%) |
| Manufacturing | 56,658 (71.8%) | 22,300 (28.2%) |
| Wholesale Trade | 15,826 (72.0%) | 6,149 (28.0%) |
| Retail Trade | 45,184 (51.7%) | 42,213 (48.3%) |
| Transportation & Warehousing | 42,250 (76.5%) | 13,003 (23.5%) |
| Utilities | 5,157 (81.0%) | 1,211 (19.0%) |
| Information | 5,724 (62.9%) | 3,373 (37.1%) |
| Finance & Insurance | 6,720 (35.1%) | 12,426 (64.9%) |
| Real Estate, Rental & Leasing | 5,930 (51.0%) | 5,701 (49.0%) |
| Professional & Scientific | 17,936 (52.4%) | 16,312 (47.6%) |
| Enterprise Management | 184 (34.7%) | 346 (65.3%) |
| Administrative & Support | 24,330 (66.6%) | 12,191 (33.4%) |
| Educational Services | 19,066 (29.1%) | 46,487 (70.9%) |
| Health Care & Social Assistance | 21,924 (22.9%) | 73,852 (77.1%) |
| Arts, Entertainment & Recreation | 7,505 (58.6%) | 5,296 (41.4%) |
| Accommodation & Food Services | 24,291 (45.4%) | 29,199 (54.6%) |
| Public Administration | 21,738 (53.8%) | 18,667 (46.2%) |
| Total | 437,582 (56.1%) | 342,588 (43.9%) |
Education in Area Code 209
School Enrollment in Area Code 209
The most common levels of schooling among the 505,361 students in Area Code 209 are high school (117,140 | 23.2%), middle school (113,150 | 22.4%), and elementary school (105,523 | 20.9%).
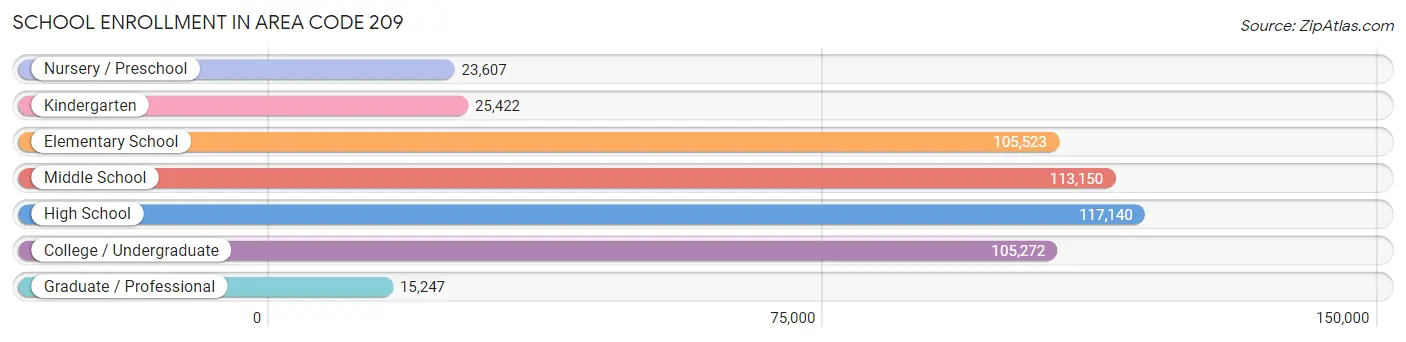
| School Level | # Students | % Students |
| Nursery / Preschool | 23,607 | 4.7% |
| Kindergarten | 25,422 | 5.0% |
| Elementary School | 105,523 | 20.9% |
| Middle School | 113,150 | 22.4% |
| High School | 117,140 | 23.2% |
| College / Undergraduate | 105,272 | 20.8% |
| Graduate / Professional | 15,247 | 3.0% |
| Total | 505,361 | 100.0% |
School Enrollment by Age by Funding Source in Area Code 209
Out of a total of 505,361 students who are enrolled in schools in Area Code 209, 50,099 (9.9%) attend a private institution, while the remaining 455,262 (90.1%) are enrolled in public schools. The age group of 35 years and over has the highest likelihood of being enrolled in private schools, with 7,062 (29.8% in the age bracket) enrolled. Conversely, the age group of 15 to 17 year olds has the lowest likelihood of being enrolled in a private school, with 78,568 (95.2% in the age bracket) attending a public institution.
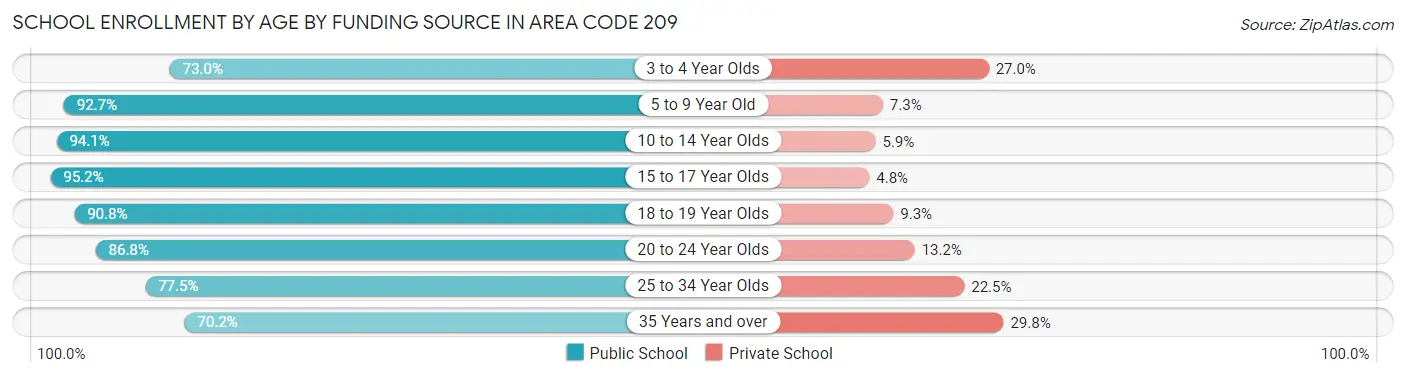
| Age Bracket | Public School | Private School |
| 3 to 4 Year Olds | 14,384 (73.0%) | 5,322 (27.0%) |
| 5 to 9 Year Old | 115,005 (92.7%) | 9,070 (7.3%) |
| 10 to 14 Year Olds | 134,848 (94.1%) | 8,514 (5.9%) |
| 15 to 17 Year Olds | 78,568 (95.2%) | 3,955 (4.8%) |
| 18 to 19 Year Olds | 31,922 (90.7%) | 3,254 (9.2%) |
| 20 to 24 Year Olds | 40,574 (86.8%) | 6,187 (13.2%) |
| 25 to 34 Year Olds | 23,288 (77.5%) | 6,750 (22.5%) |
| 35 Years and over | 16,658 (70.2%) | 7,062 (29.8%) |
| Total | 455,262 (90.1%) | 50,099 (9.9%) |
Educational Attainment by Field of Study in Area Code 209
Business (42,571 | 17.8%), science & technology (24,810 | 10.4%), education (23,110 | 9.7%), social sciences (21,107 | 8.8%), and bio, nature & agricultural (18,948 | 7.9%) are the most common fields of study among 239,436 individuals in Area Code 209 who have obtained a bachelor's degree or higher.
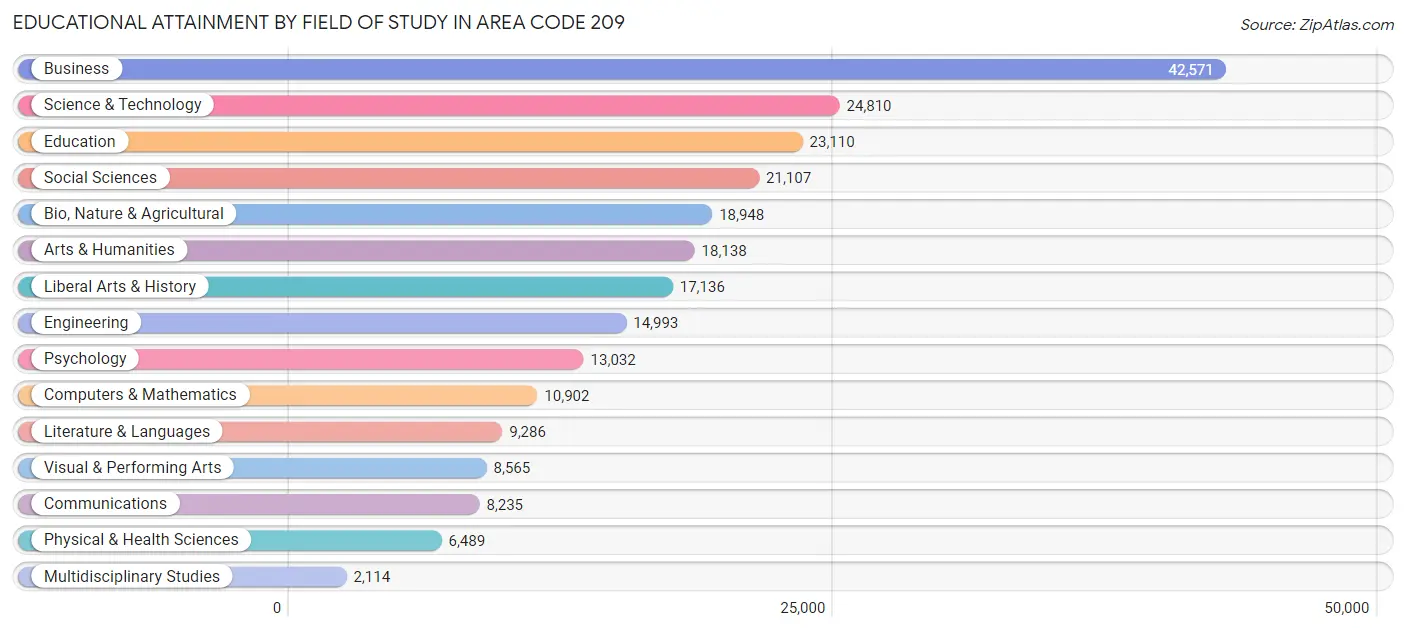
| Field of Study | # Graduates | % Graduates |
| Computers & Mathematics | 10,902 | 4.5% |
| Bio, Nature & Agricultural | 18,948 | 7.9% |
| Physical & Health Sciences | 6,489 | 2.7% |
| Psychology | 13,032 | 5.4% |
| Social Sciences | 21,107 | 8.8% |
| Engineering | 14,993 | 6.3% |
| Multidisciplinary Studies | 2,114 | 0.9% |
| Science & Technology | 24,810 | 10.4% |
| Business | 42,571 | 17.8% |
| Education | 23,110 | 9.7% |
| Literature & Languages | 9,286 | 3.9% |
| Liberal Arts & History | 17,136 | 7.2% |
| Visual & Performing Arts | 8,565 | 3.6% |
| Communications | 8,235 | 3.4% |
| Arts & Humanities | 18,138 | 7.6% |
| Total | 239,436 | 100.0% |
Transportation & Commute in Area Code 209
Vehicle Availability by Sex in Area Code 209
The most prevalent vehicle ownership categories in Area Code 209 are males with 2 vehicles (145,414, accounting for 34.5%) and females with 2 vehicles (111,543, making up 44.7%).
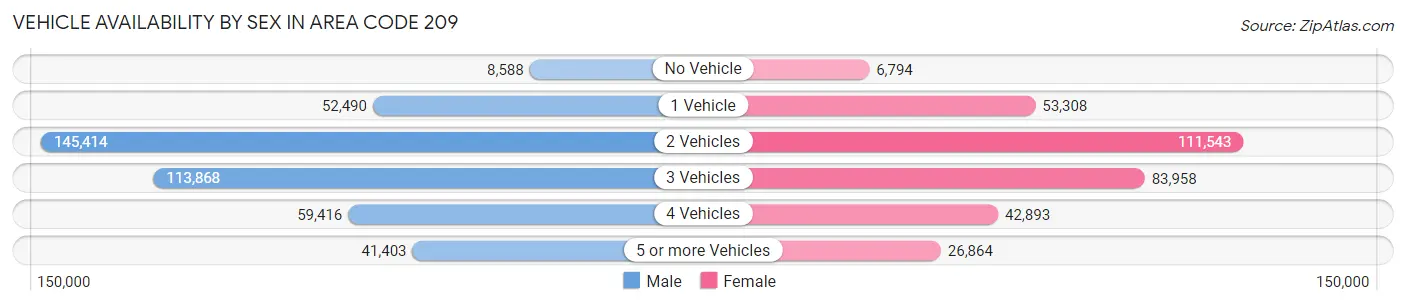
| Vehicles Available | Male | Female |
| No Vehicle | 8,588 (2.0%) | 6,794 (2.1%) |
| 1 Vehicle | 52,490 (12.5%) | 53,308 (16.4%) |
| 2 Vehicles | 145,414 (34.5%) | 111,543 (34.3%) |
| 3 Vehicles | 113,868 (27.0%) | 83,958 (25.8%) |
| 4 Vehicles | 59,416 (14.1%) | 42,893 (13.2%) |
| 5 or more Vehicles | 41,403 (9.8%) | 26,864 (8.3%) |
| Total | 421,179 (100.0%) | 325,360 (100.0%) |
Commute Time in Area Code 209
The most frequently occuring commute durations in Area Code 209 are 15 to 19 minutes (104,602 commuters, 15.1%), 10 to 14 minutes (95,507 commuters, 13.8%), and 20 to 24 minutes (86,753 commuters, 12.5%).
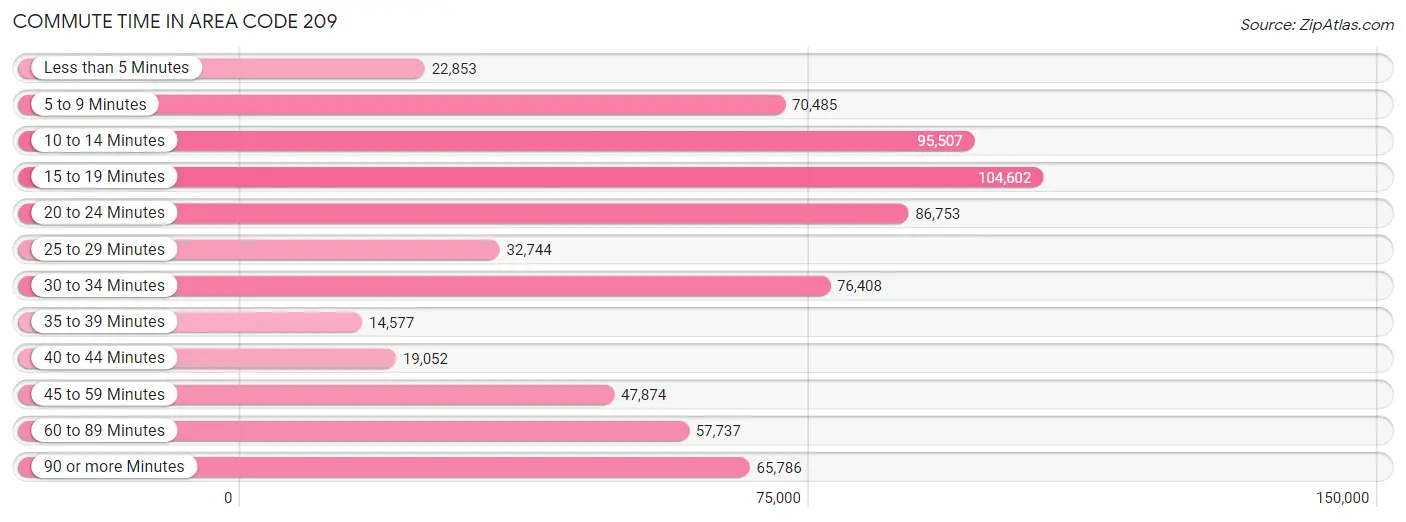
| Commute Time | # Commuters | % Commuters |
| Less than 5 Minutes | 22,853 | 3.3% |
| 5 to 9 Minutes | 70,485 | 10.2% |
| 10 to 14 Minutes | 95,507 | 13.8% |
| 15 to 19 Minutes | 104,602 | 15.1% |
| 20 to 24 Minutes | 86,753 | 12.5% |
| 25 to 29 Minutes | 32,744 | 4.7% |
| 30 to 34 Minutes | 76,408 | 11.0% |
| 35 to 39 Minutes | 14,577 | 2.1% |
| 40 to 44 Minutes | 19,052 | 2.7% |
| 45 to 59 Minutes | 47,874 | 6.9% |
| 60 to 89 Minutes | 57,737 | 8.3% |
| 90 or more Minutes | 65,786 | 9.5% |
Commute Time by Sex in Area Code 209
The most common commute times in Area Code 209 are 15 to 19 minutes (54,622 commuters, 13.7%) for males and 15 to 19 minutes (49,980 commuters, 16.9%) for females.
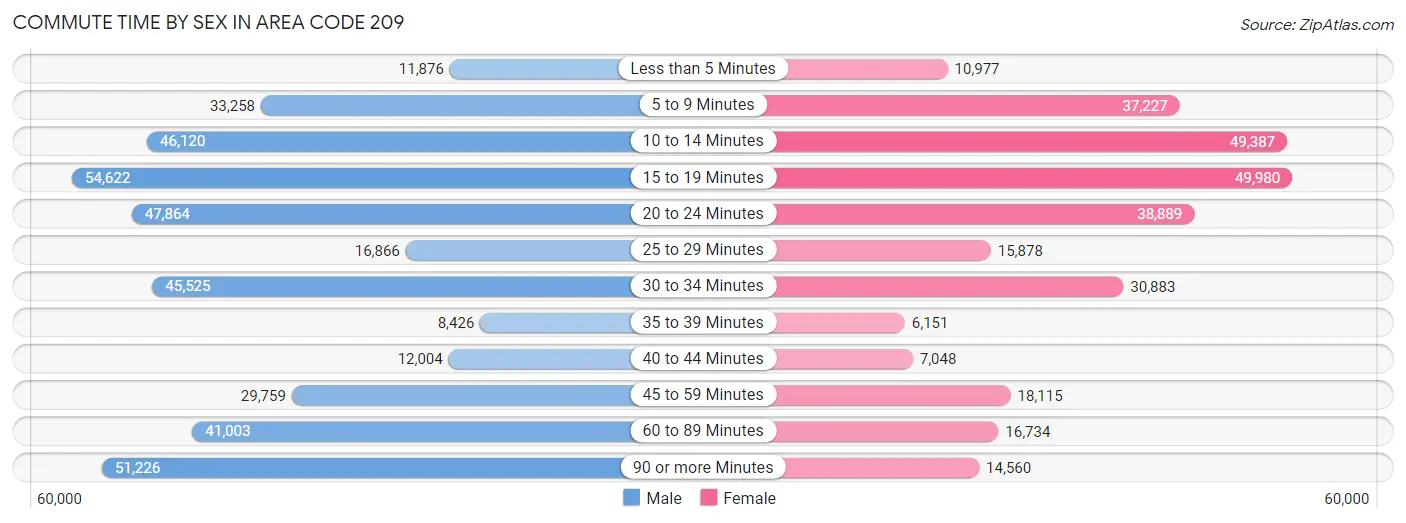
| Commute Time | Male | Female |
| Less than 5 Minutes | 11,876 (3.0%) | 10,977 (3.7%) |
| 5 to 9 Minutes | 33,258 (8.3%) | 37,227 (12.6%) |
| 10 to 14 Minutes | 46,120 (11.6%) | 49,387 (16.7%) |
| 15 to 19 Minutes | 54,622 (13.7%) | 49,980 (16.9%) |
| 20 to 24 Minutes | 47,864 (12.0%) | 38,889 (13.2%) |
| 25 to 29 Minutes | 16,866 (4.2%) | 15,878 (5.4%) |
| 30 to 34 Minutes | 45,525 (11.4%) | 30,883 (10.4%) |
| 35 to 39 Minutes | 8,426 (2.1%) | 6,151 (2.1%) |
| 40 to 44 Minutes | 12,004 (3.0%) | 7,048 (2.4%) |
| 45 to 59 Minutes | 29,759 (7.5%) | 18,115 (6.1%) |
| 60 to 89 Minutes | 41,003 (10.3%) | 16,734 (5.7%) |
| 90 or more Minutes | 51,226 (12.9%) | 14,560 (4.9%) |
Time of Departure to Work by Sex in Area Code 209
The most frequent times of departure to work in Area Code 209 are 12:00 AM to 4:59 AM (65,984, 16.6%) for males and 7:00 AM to 7:29 AM (44,545, 15.1%) for females.
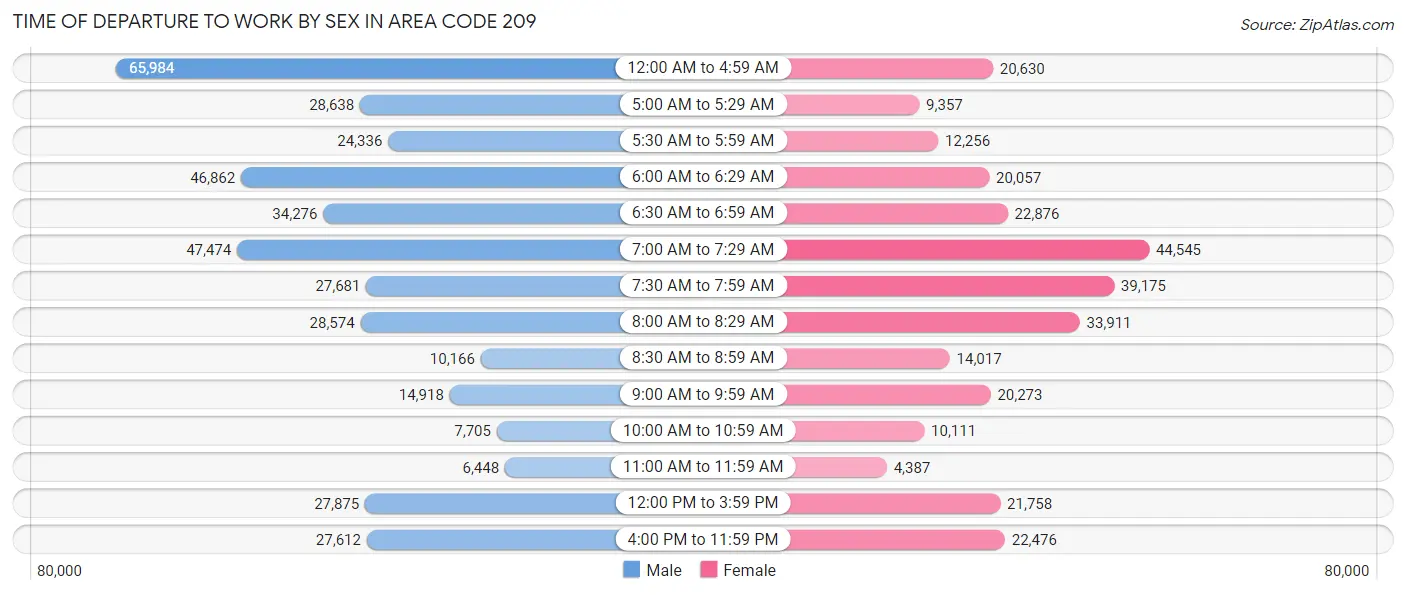
| Time of Departure | Male | Female |
| 12:00 AM to 4:59 AM | 65,984 (16.6%) | 20,630 (7.0%) |
| 5:00 AM to 5:29 AM | 28,638 (7.2%) | 9,357 (3.2%) |
| 5:30 AM to 5:59 AM | 24,336 (6.1%) | 12,256 (4.1%) |
| 6:00 AM to 6:29 AM | 46,862 (11.8%) | 20,057 (6.8%) |
| 6:30 AM to 6:59 AM | 34,276 (8.6%) | 22,876 (7.7%) |
| 7:00 AM to 7:29 AM | 47,474 (11.9%) | 44,545 (15.1%) |
| 7:30 AM to 7:59 AM | 27,681 (7.0%) | 39,175 (13.2%) |
| 8:00 AM to 8:29 AM | 28,574 (7.2%) | 33,911 (11.5%) |
| 8:30 AM to 8:59 AM | 10,166 (2.5%) | 14,017 (4.7%) |
| 9:00 AM to 9:59 AM | 14,918 (3.7%) | 20,273 (6.9%) |
| 10:00 AM to 10:59 AM | 7,705 (1.9%) | 10,111 (3.4%) |
| 11:00 AM to 11:59 AM | 6,448 (1.6%) | 4,387 (1.5%) |
| 12:00 PM to 3:59 PM | 27,875 (7.0%) | 21,758 (7.3%) |
| 4:00 PM to 11:59 PM | 27,612 (6.9%) | 22,476 (7.6%) |
| Total | 398,549 (100.0%) | 295,829 (100.0%) |
Housing Occupancy in Area Code 209
Occupancy by Ownership in Area Code 209
Of the total 584,566 dwellings in Area Code 209, owner-occupied units account for 353,646 (60.5%), while renter-occupied units make up 230,920 (39.5%).
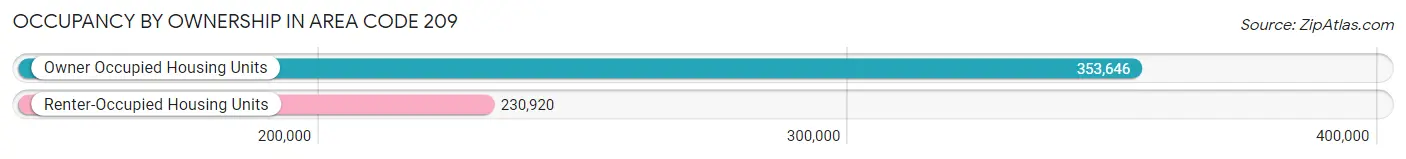
| Occupancy | # Housing Units | % Housing Units |
| Owner Occupied Housing Units | 353,646 | 60.5% |
| Renter-Occupied Housing Units | 230,920 | 39.5% |
| Total Occupied Housing Units | 584,566 | 100.0% |
Occupancy by Household Size in Area Code 209
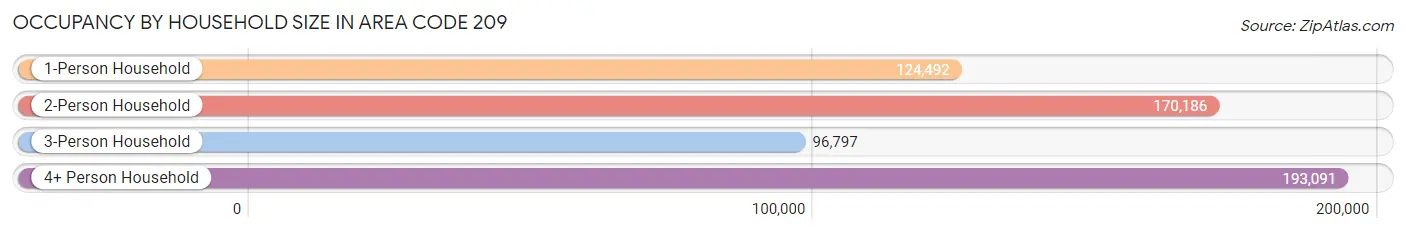
| Household Size | # Housing Units | % Housing Units |
| 1-Person Household | 124,492 | 21.3% |
| 2-Person Household | 170,186 | 29.1% |
| 3-Person Household | 96,797 | 16.6% |
| 4+ Person Household | 193,091 | 33.0% |
| Total Housing Units | 584,566 | 100.0% |
Occupancy by Ownership by Household Size in Area Code 209
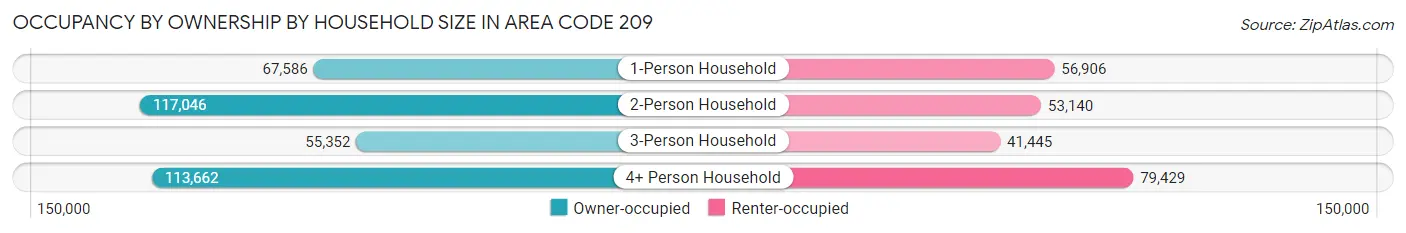
| Household Size | Owner-occupied | Renter-occupied |
| 1-Person Household | 67,586 (54.3%) | 56,906 (45.7%) |
| 2-Person Household | 117,046 (68.8%) | 53,140 (31.2%) |
| 3-Person Household | 55,352 (57.2%) | 41,445 (42.8%) |
| 4+ Person Household | 113,662 (58.9%) | 79,429 (41.1%) |
| Total Housing Units | 353,646 (60.5%) | 230,920 (39.5%) |
Occupancy by Educational Attainment in Area Code 209
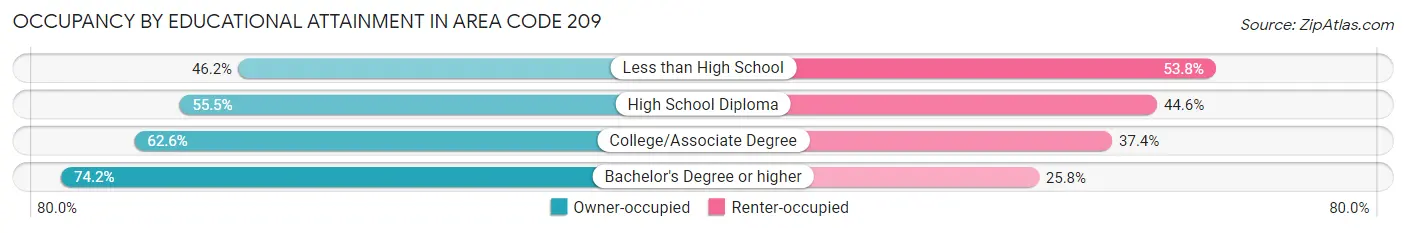
| Household Size | Owner-occupied | Renter-occupied |
| Less than High School | 46,134 (46.2%) | 53,812 (53.8%) |
| High School Diploma | 81,855 (55.4%) | 65,766 (44.6%) |
| College/Associate Degree | 131,362 (62.6%) | 78,553 (37.4%) |
| Bachelor's Degree or higher | 94,295 (74.2%) | 32,789 (25.8%) |
Occupancy by Age of Householder in Area Code 209
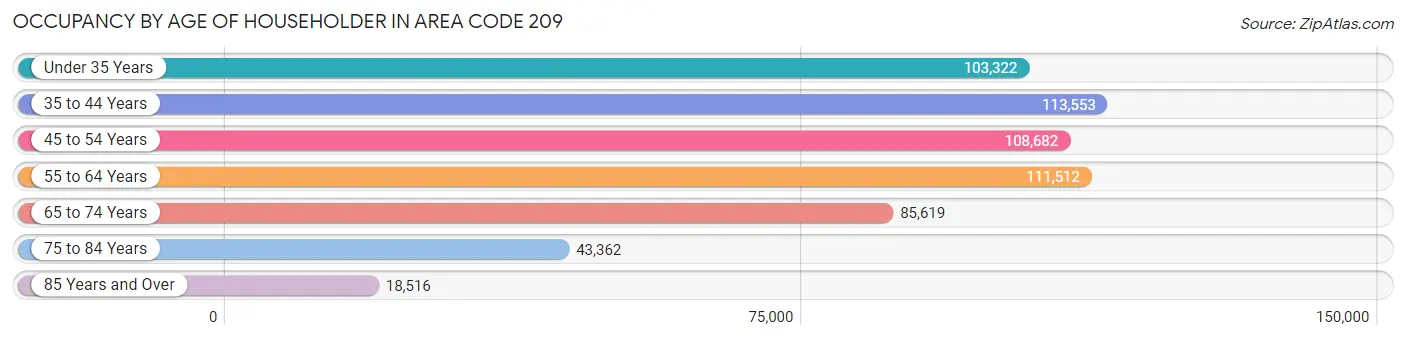
| Age Bracket | # Households | % Households |
| Under 35 Years | 103,322 | 17.7% |
| 35 to 44 Years | 113,553 | 19.4% |
| 45 to 54 Years | 108,682 | 18.6% |
| 55 to 64 Years | 111,512 | 19.1% |
| 65 to 74 Years | 85,619 | 14.6% |
| 75 to 84 Years | 43,362 | 7.4% |
| 85 Years and Over | 18,516 | 3.2% |
| Total | 584,566 | 100.0% |
Housing Finances in Area Code 209
Median Income by Occupancy in Area Code 209
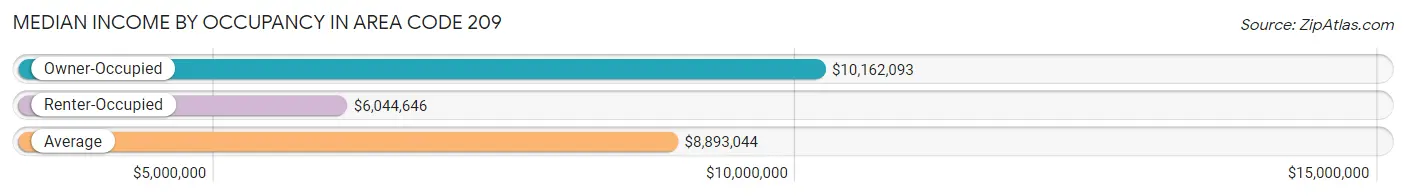
| Occupancy Type | # Households | Median Income |
| Owner-Occupied | 353,646 (60.5%) | $10,162,093 |
| Renter-Occupied | 230,920 (39.5%) | $6,044,646 |
| Average | 584,566 (100.0%) | $8,893,044 |
Occupancy by Householder Income Bracket in Area Code 209
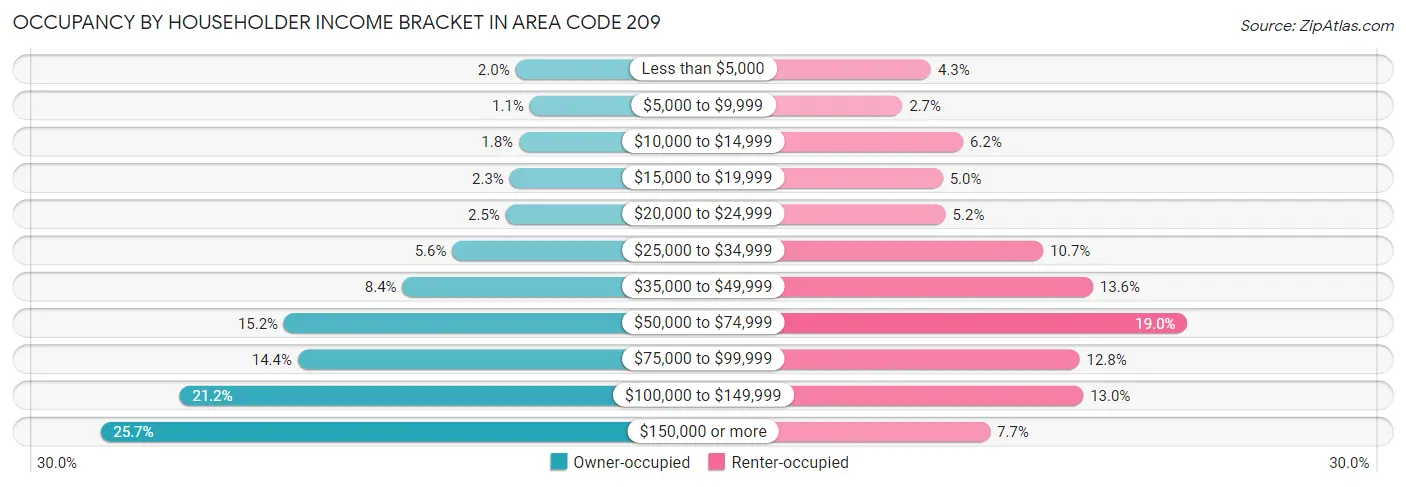
| Income Bracket | Owner-occupied | Renter-occupied |
| Less than $5,000 | 6,896 (1.9%) | 9,958 (4.3%) |
| $5,000 to $9,999 | 4,028 (1.1%) | 6,156 (2.7%) |
| $10,000 to $14,999 | 6,185 (1.8%) | 14,207 (6.1%) |
| $15,000 to $19,999 | 8,068 (2.3%) | 11,507 (5.0%) |
| $20,000 to $24,999 | 8,865 (2.5%) | 11,884 (5.1%) |
| $25,000 to $34,999 | 19,680 (5.6%) | 24,748 (10.7%) |
| $35,000 to $49,999 | 29,748 (8.4%) | 31,319 (13.6%) |
| $50,000 to $74,999 | 53,693 (15.2%) | 43,781 (19.0%) |
| $75,000 to $99,999 | 50,872 (14.4%) | 29,547 (12.8%) |
| $100,000 to $149,999 | 74,839 (21.2%) | 30,049 (13.0%) |
| $150,000 or more | 90,772 (25.7%) | 17,764 (7.7%) |
| Total | 353,646 (100.0%) | 230,920 (100.0%) |
Monthly Housing Cost Tiers in Area Code 209
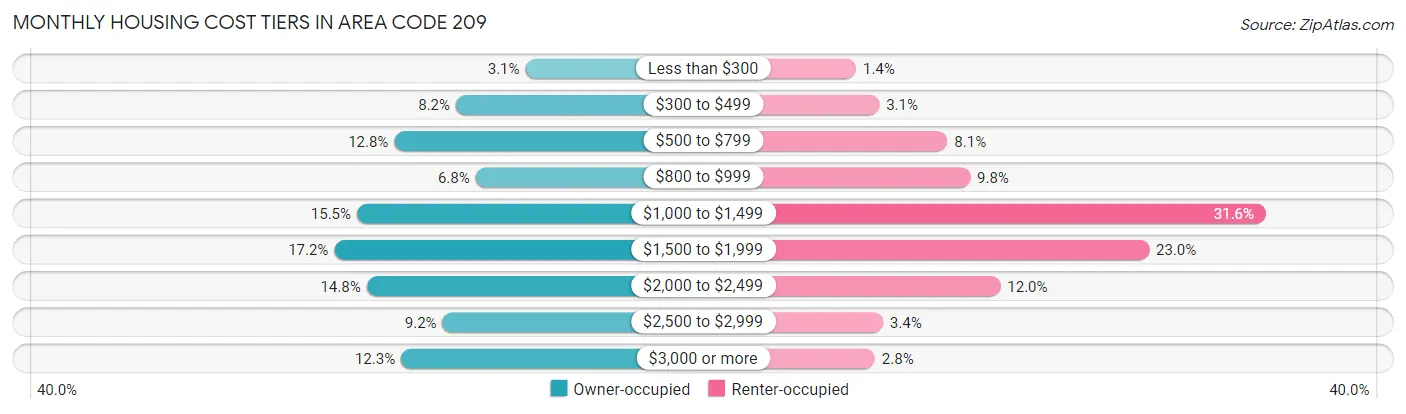
| Monthly Cost | Owner-occupied | Renter-occupied |
| Less than $300 | 11,048 (3.1%) | 3,166 (1.4%) |
| $300 to $499 | 29,154 (8.2%) | 7,104 (3.1%) |
| $500 to $799 | 45,209 (12.8%) | 18,711 (8.1%) |
| $800 to $999 | 23,995 (6.8%) | 22,562 (9.8%) |
| $1,000 to $1,499 | 54,913 (15.5%) | 72,857 (31.6%) |
| $1,500 to $1,999 | 60,844 (17.2%) | 53,002 (23.0%) |
| $2,000 to $2,499 | 52,407 (14.8%) | 27,714 (12.0%) |
| $2,500 to $2,999 | 32,644 (9.2%) | 7,729 (3.4%) |
| $3,000 or more | 43,432 (12.3%) | 6,384 (2.8%) |
| Total | 353,646 (100.0%) | 230,920 (100.0%) |
Physical Housing Characteristics in Area Code 209
Housing Structures in Area Code 209
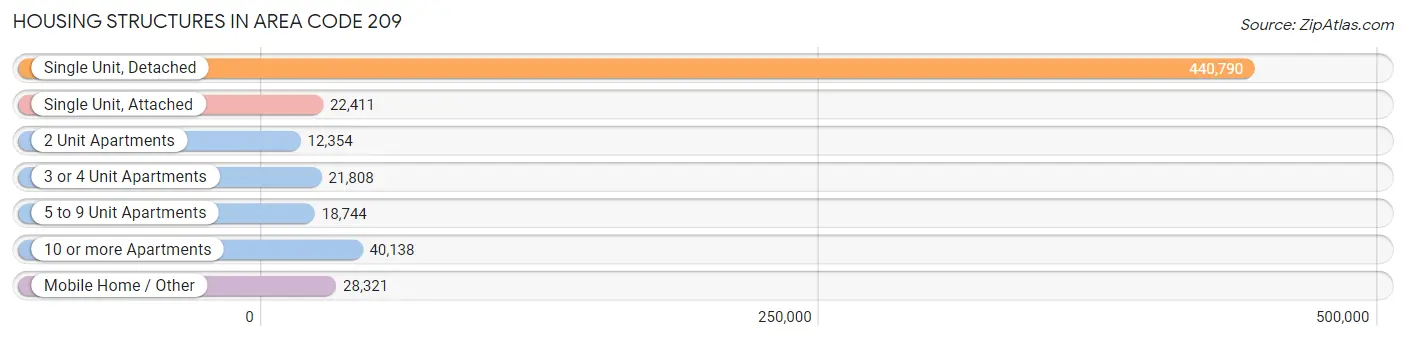
| Structure Type | # Housing Units | % Housing Units |
| Single Unit, Detached | 440,790 | 75.4% |
| Single Unit, Attached | 22,411 | 3.8% |
| 2 Unit Apartments | 12,354 | 2.1% |
| 3 or 4 Unit Apartments | 21,808 | 3.7% |
| 5 to 9 Unit Apartments | 18,744 | 3.2% |
| 10 or more Apartments | 40,138 | 6.9% |
| Mobile Home / Other | 28,321 | 4.8% |
| Total | 584,566 | 100.0% |
Housing Structures by Occupancy in Area Code 209
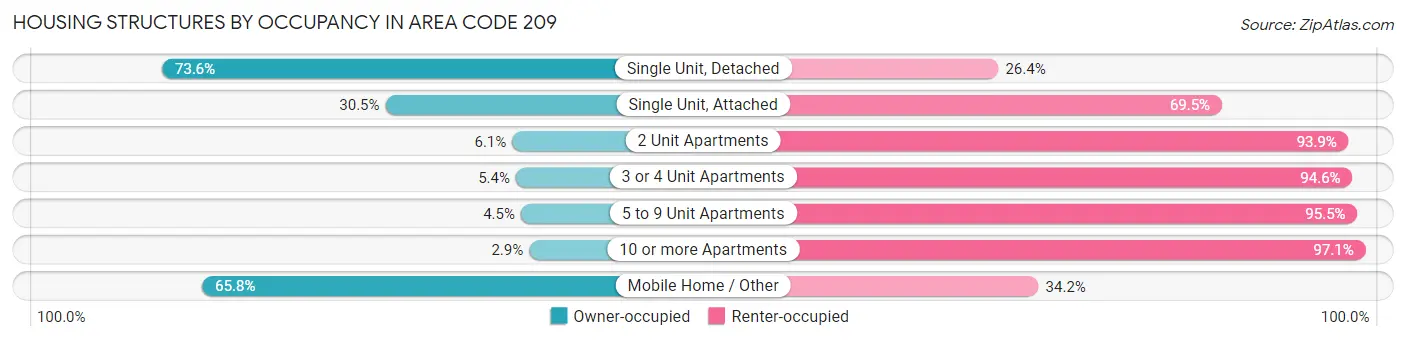
| Structure Type | Owner-occupied | Renter-occupied |
| Single Unit, Detached | 324,225 (73.6%) | 116,565 (26.4%) |
| Single Unit, Attached | 6,845 (30.5%) | 15,566 (69.5%) |
| 2 Unit Apartments | 759 (6.1%) | 11,595 (93.9%) |
| 3 or 4 Unit Apartments | 1,182 (5.4%) | 20,626 (94.6%) |
| 5 to 9 Unit Apartments | 836 (4.5%) | 17,908 (95.5%) |
| 10 or more Apartments | 1,156 (2.9%) | 38,982 (97.1%) |
| Mobile Home / Other | 18,643 (65.8%) | 9,678 (34.2%) |
| Total | 353,646 (60.5%) | 230,920 (39.5%) |
Housing Structures by Number of Rooms in Area Code 209
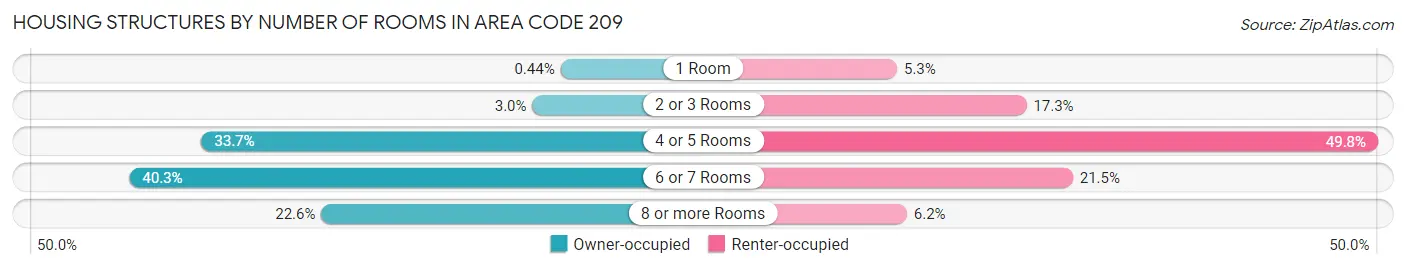
| Number of Rooms | Owner-occupied | Renter-occupied |
| 1 Room | 1,544 (0.4%) | 12,197 (5.3%) |
| 2 or 3 Rooms | 10,754 (3.0%) | 39,824 (17.2%) |
| 4 or 5 Rooms | 118,994 (33.7%) | 114,872 (49.7%) |
| 6 or 7 Rooms | 142,565 (40.3%) | 49,729 (21.5%) |
| 8 or more Rooms | 79,789 (22.6%) | 14,298 (6.2%) |
| Total | 353,646 (100.0%) | 230,920 (100.0%) |
Housing Structure by Heating Type in Area Code 209
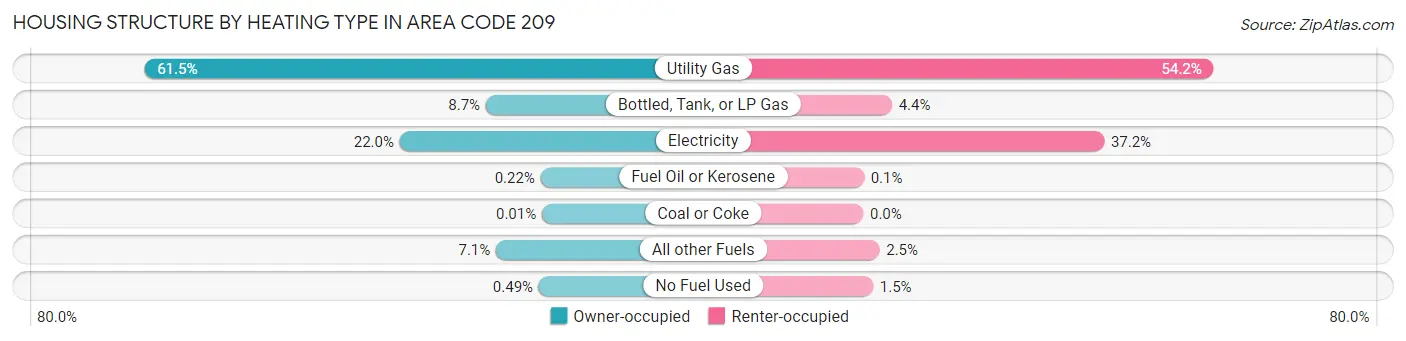
| Heating Type | Owner-occupied | Renter-occupied |
| Utility Gas | 217,505 (61.5%) | 125,141 (54.2%) |
| Bottled, Tank, or LP Gas | 30,684 (8.7%) | 10,237 (4.4%) |
| Electricity | 77,800 (22.0%) | 85,997 (37.2%) |
| Fuel Oil or Kerosene | 794 (0.2%) | 234 (0.1%) |
| Coal or Coke | 18 (0.0%) | 0 (0.0%) |
| All other Fuels | 25,127 (7.1%) | 5,798 (2.5%) |
| No Fuel Used | 1,718 (0.5%) | 3,513 (1.5%) |
| Total | 353,646 (100.0%) | 230,920 (100.0%) |
Household Vehicle Usage in Area Code 209
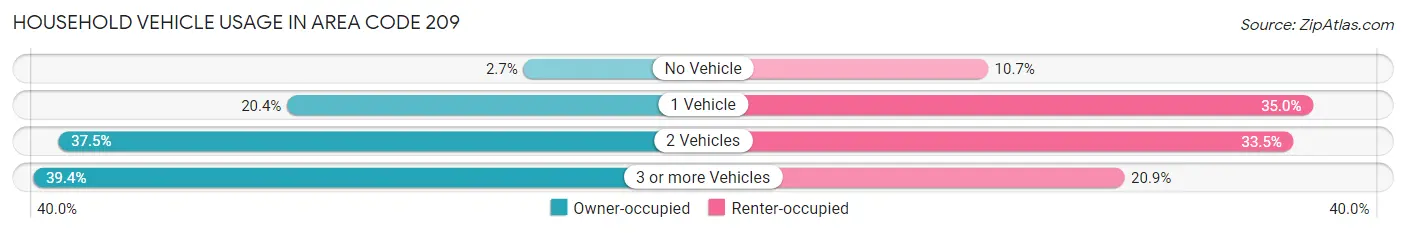
| Vehicles per Household | Owner-occupied | Renter-occupied |
| No Vehicle | 9,682 (2.7%) | 24,626 (10.7%) |
| 1 Vehicle | 72,126 (20.4%) | 80,746 (35.0%) |
| 2 Vehicles | 132,619 (37.5%) | 77,391 (33.5%) |
| 3 or more Vehicles | 139,219 (39.4%) | 48,157 (20.8%) |
| Total | 353,646 (100.0%) | 230,920 (100.0%) |
Real Estate & Mortgages in Area Code 209
Real Estate and Mortgage Overview in Area Code 209
| Characteristic | Without Mortgage | With Mortgage |
| Housing Units | 117,359 | 236,287 |
| Median Property Value | $42,623,900 | $48,053,500 |
| Median Household Income | $6,731,313 | $71,393 |
| Monthly Housing Costs | $68,817 | $43,031 |
| Real Estate Taxes | $247,539 | $4,744 |
Property Value by Mortgage Status in Area Code 209
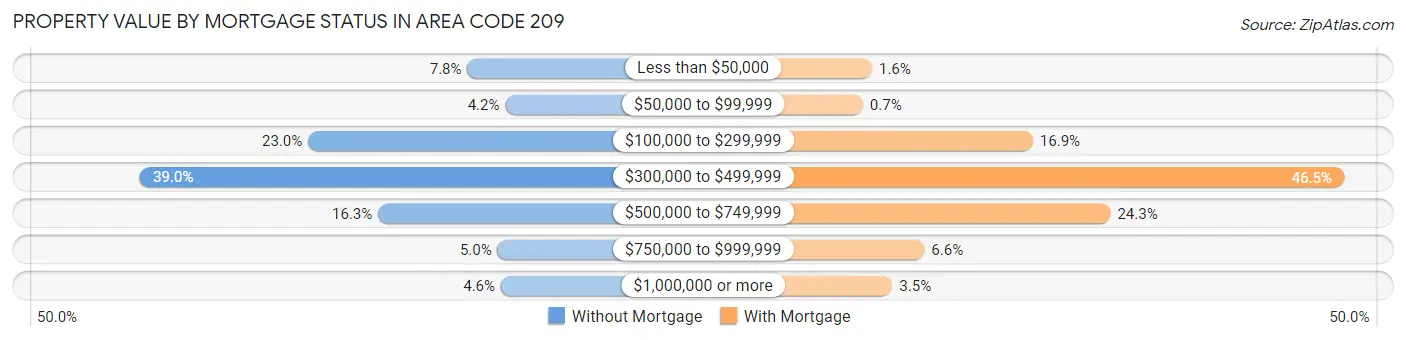
| Property Value | Without Mortgage | With Mortgage |
| Less than $50,000 | 9,189 (7.8%) | 3,705 (1.6%) |
| $50,000 to $99,999 | 4,953 (4.2%) | 1,647 (0.7%) |
| $100,000 to $299,999 | 26,998 (23.0%) | 39,906 (16.9%) |
| $300,000 to $499,999 | 45,786 (39.0%) | 109,864 (46.5%) |
| $500,000 to $749,999 | 19,164 (16.3%) | 57,365 (24.3%) |
| $750,000 to $999,999 | 5,819 (5.0%) | 15,498 (6.6%) |
| $1,000,000 or more | 5,450 (4.6%) | 8,302 (3.5%) |
| Total | 117,359 (100.0%) | 236,287 (100.0%) |
Household Income by Mortgage Status in Area Code 209
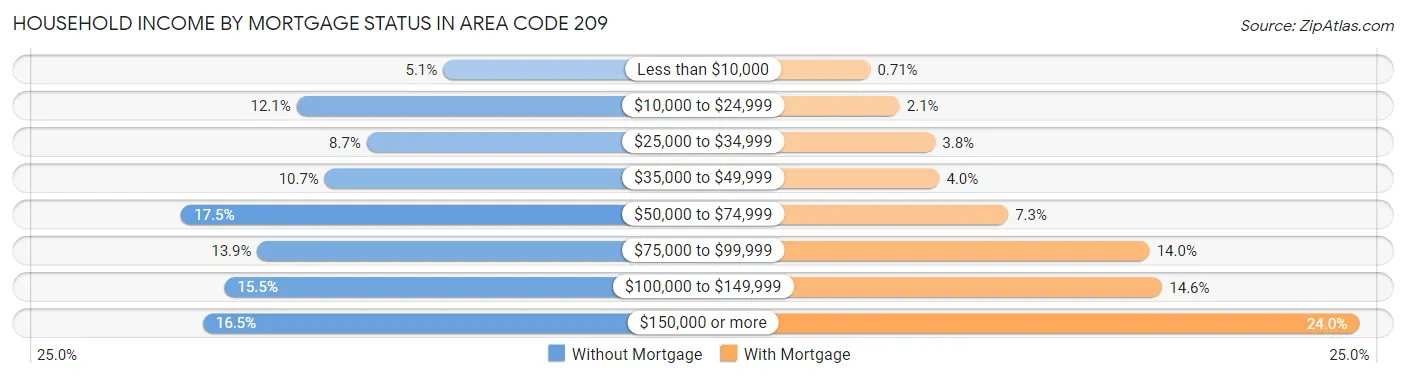
| Household Income | Without Mortgage | With Mortgage |
| Less than $10,000 | 5,947 (5.1%) | 1,669 (0.7%) |
| $10,000 to $24,999 | 14,141 (12.0%) | 4,977 (2.1%) |
| $25,000 to $34,999 | 10,222 (8.7%) | 8,977 (3.8%) |
| $35,000 to $49,999 | 12,570 (10.7%) | 9,458 (4.0%) |
| $50,000 to $74,999 | 20,586 (17.5%) | 17,178 (7.3%) |
| $75,000 to $99,999 | 16,341 (13.9%) | 33,107 (14.0%) |
| $100,000 to $149,999 | 18,173 (15.5%) | 34,531 (14.6%) |
| $150,000 or more | 19,379 (16.5%) | 56,666 (24.0%) |
| Total | 117,359 (100.0%) | 236,287 (100.0%) |
Property Value to Household Income Ratio in Area Code 209
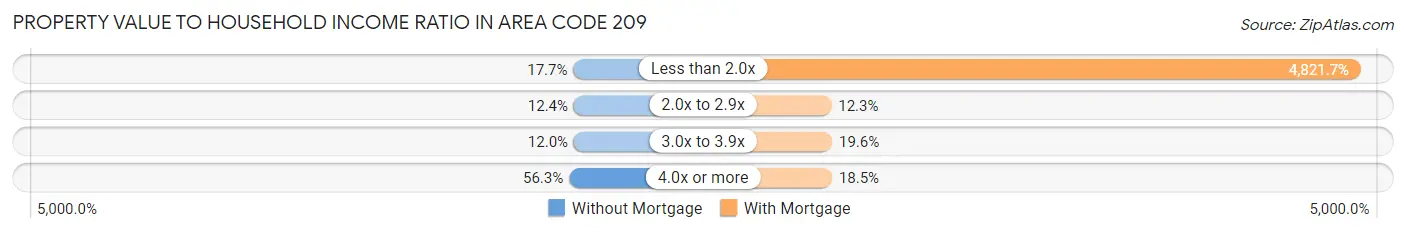
| Value-to-Income Ratio | Without Mortgage | With Mortgage |
| Less than 2.0x | 20,742 (17.7%) | 11,393,071 (4,821.7%) |
| 2.0x to 2.9x | 14,544 (12.4%) | 29,017 (12.3%) |
| 3.0x to 3.9x | 14,092 (12.0%) | 46,373 (19.6%) |
| 4.0x or more | 66,040 (56.3%) | 43,775 (18.5%) |
| Total | 117,359 (100.0%) | 236,287 (100.0%) |
Real Estate Taxes by Mortgage Status in Area Code 209
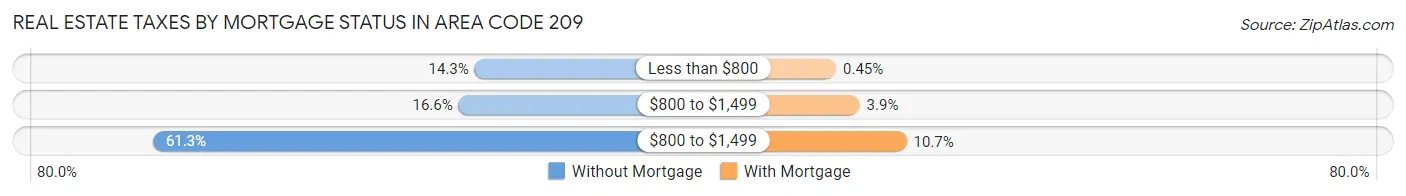
| Property Taxes | Without Mortgage | With Mortgage |
| Less than $800 | 16,728 (14.2%) | 1,072 (0.4%) |
| $800 to $1,499 | 19,468 (16.6%) | 9,187 (3.9%) |
| $800 to $1,499 | 71,877 (61.3%) | 25,386 (10.7%) |
| Total | 117,359 (100.0%) | 236,287 (100.0%) |
Health & Disability in Area Code 209
Health Insurance Coverage by Age in Area Code 209
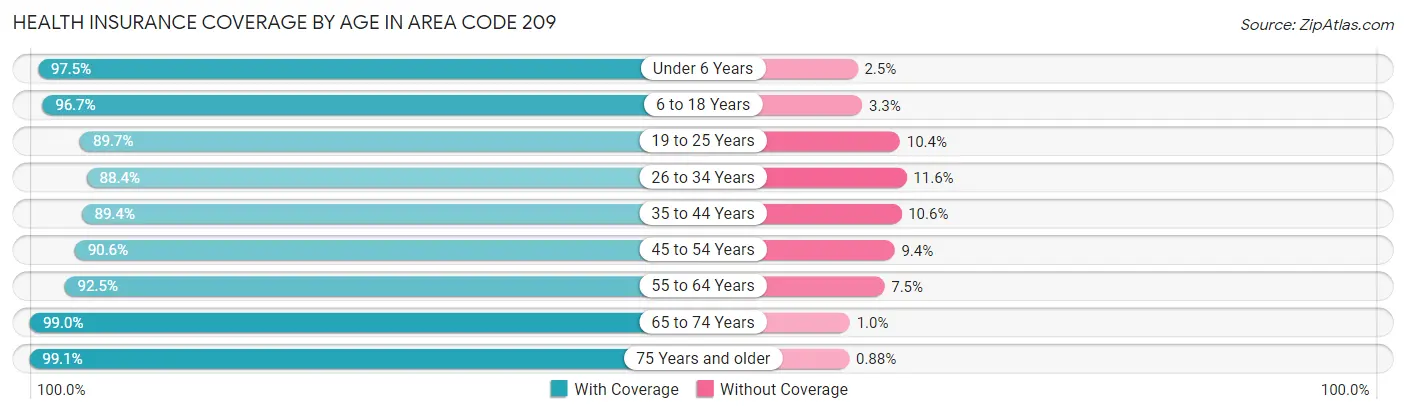
| Age Bracket | With Coverage | Without Coverage |
| Under 6 Years | 142,411 (97.5%) | 3,596 (2.5%) |
| 6 to 18 Years | 352,386 (96.7%) | 12,067 (3.3%) |
| 19 to 25 Years | 153,927 (89.6%) | 17,775 (10.3%) |
| 26 to 34 Years | 202,161 (88.4%) | 26,482 (11.6%) |
| 35 to 44 Years | 212,130 (89.4%) | 25,194 (10.6%) |
| 45 to 54 Years | 194,021 (90.6%) | 20,029 (9.4%) |
| 55 to 64 Years | 193,797 (92.5%) | 15,613 (7.5%) |
| 65 to 74 Years | 150,661 (99.0%) | 1,538 (1.0%) |
| 75 Years and older | 101,266 (99.1%) | 900 (0.9%) |
| Total | 1,702,760 (93.2%) | 123,194 (6.8%) |
Health Insurance Coverage by Citizenship Status in Area Code 209
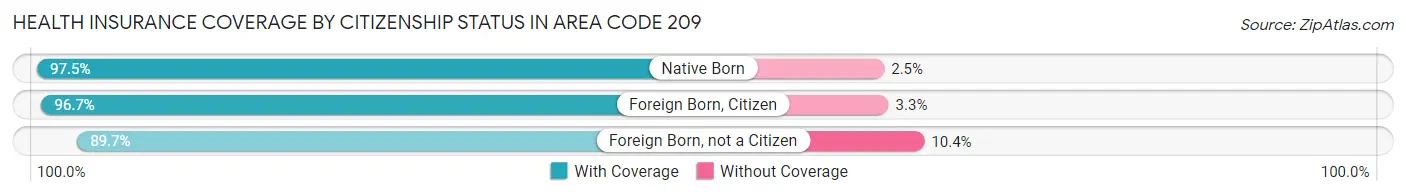
| Citizenship Status | With Coverage | Without Coverage |
| Native Born | 142,411 (97.5%) | 3,596 (2.5%) |
| Foreign Born, Citizen | 352,386 (96.7%) | 12,067 (3.3%) |
| Foreign Born, not a Citizen | 153,927 (89.6%) | 17,775 (10.3%) |
Health Insurance Coverage by Household Income in Area Code 209
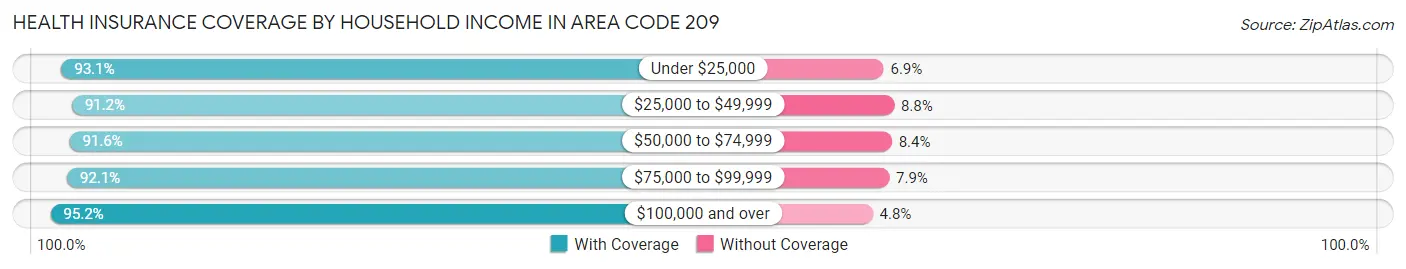
| Household Income | With Coverage | Without Coverage |
| Under $25,000 | 167,448 (93.1%) | 12,374 (6.9%) |
| $25,000 to $49,999 | 258,411 (91.2%) | 25,047 (8.8%) |
| $50,000 to $74,999 | 267,641 (91.6%) | 24,577 (8.4%) |
| $75,000 to $99,999 | 244,206 (92.1%) | 21,040 (7.9%) |
| $100,000 and over | 748,281 (95.2%) | 38,063 (4.8%) |
Public vs Private Health Insurance Coverage by Age in Area Code 209
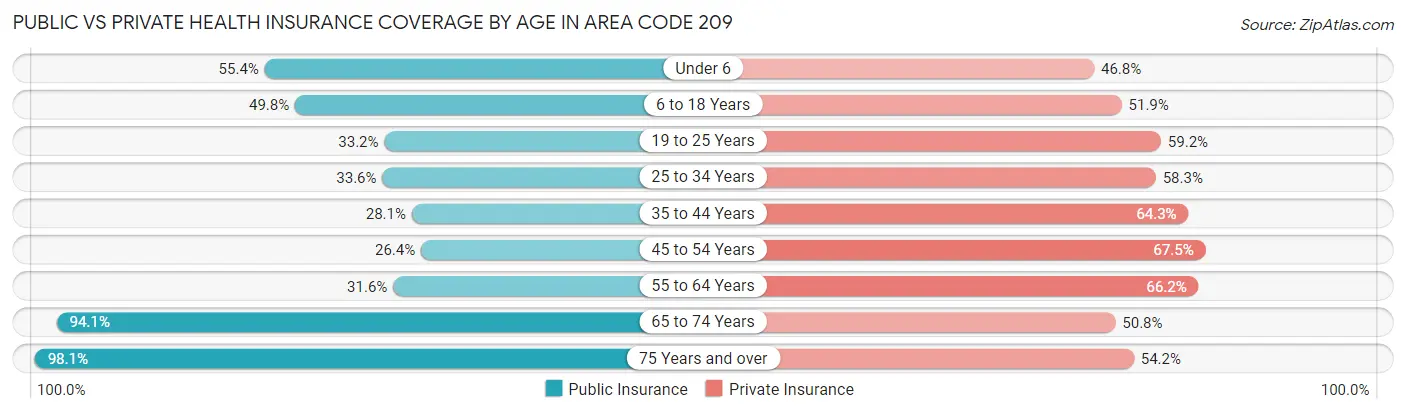
| Age Bracket | Public Insurance | Private Insurance |
| Under 6 | 80,946 (55.4%) | 68,354 (46.8%) |
| 6 to 18 Years | 181,515 (49.8%) | 189,311 (51.9%) |
| 19 to 25 Years | 57,045 (33.2%) | 101,691 (59.2%) |
| 25 to 34 Years | 76,798 (33.6%) | 133,228 (58.3%) |
| 35 to 44 Years | 66,767 (28.1%) | 152,695 (64.3%) |
| 45 to 54 Years | 56,548 (26.4%) | 144,498 (67.5%) |
| 55 to 64 Years | 66,144 (31.6%) | 138,663 (66.2%) |
| 65 to 74 Years | 143,174 (94.1%) | 77,283 (50.8%) |
| 75 Years and over | 100,233 (98.1%) | 55,372 (54.2%) |
| Total | 829,170 (45.4%) | 1,061,095 (58.1%) |
Disability Status by Sex by Age in Area Code 209
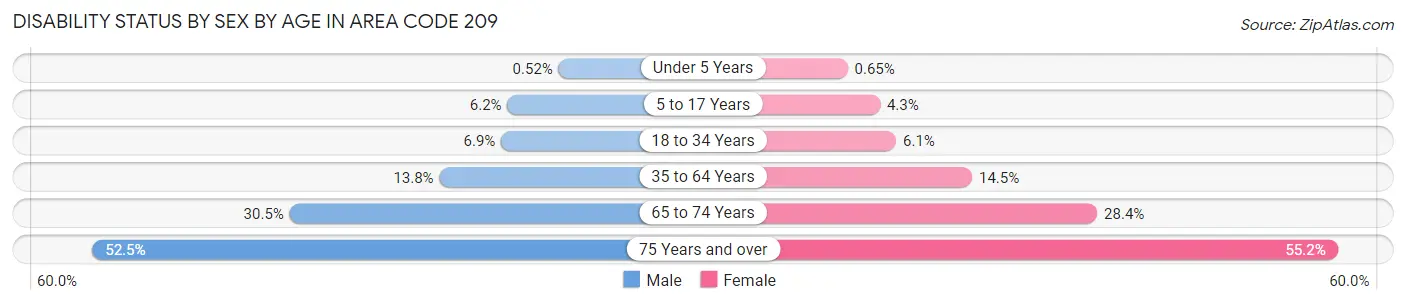
| Age Bracket | Male | Female |
| Under 5 Years | 329 (0.5%) | 381 (0.6%) |
| 5 to 17 Years | 11,524 (6.2%) | 7,493 (4.3%) |
| 18 to 34 Years | 15,233 (6.9%) | 12,570 (6.0%) |
| 35 to 64 Years | 45,780 (13.8%) | 47,736 (14.5%) |
| 65 to 74 Years | 21,771 (30.5%) | 22,974 (28.4%) |
| 75 Years and over | 22,739 (52.5%) | 32,469 (55.2%) |
Disability Class by Sex by Age in Area Code 209
Disability Class: Hearing Difficulty
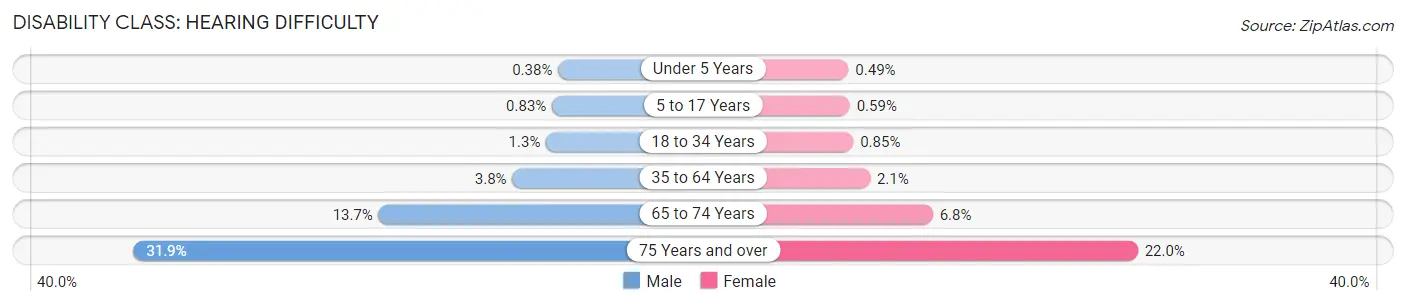
| Age Bracket | Male | Female |
| Under 5 Years | 241 (0.4%) | 287 (0.5%) |
| 5 to 17 Years | 1,539 (0.8%) | 1,050 (0.6%) |
| 18 to 34 Years | 2,796 (1.3%) | 1,757 (0.9%) |
| 35 to 64 Years | 12,552 (3.8%) | 6,870 (2.1%) |
| 65 to 74 Years | 9,793 (13.7%) | 5,455 (6.8%) |
| 75 Years and over | 13,836 (31.9%) | 12,926 (22.0%) |
Disability Class: Vision Difficulty
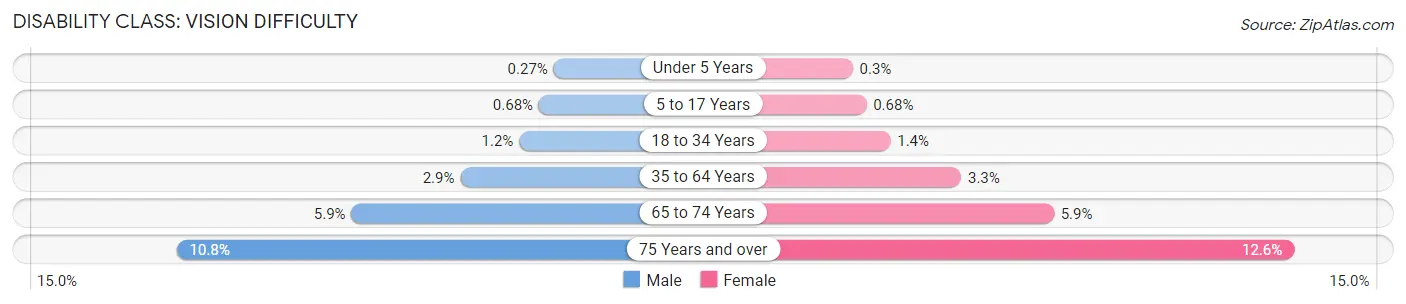
| Age Bracket | Male | Female |
| Under 5 Years | 168 (0.3%) | 176 (0.3%) |
| 5 to 17 Years | 1,256 (0.7%) | 1,202 (0.7%) |
| 18 to 34 Years | 2,696 (1.2%) | 2,806 (1.3%) |
| 35 to 64 Years | 9,506 (2.9%) | 10,922 (3.3%) |
| 65 to 74 Years | 4,214 (5.9%) | 4,765 (5.9%) |
| 75 Years and over | 4,666 (10.8%) | 7,403 (12.6%) |
Disability Class: Cognitive Difficulty
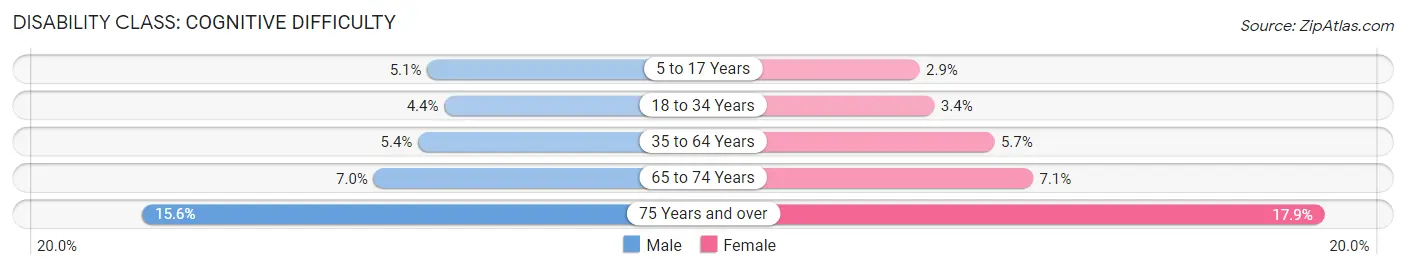
| Age Bracket | Male | Female |
| 5 to 17 Years | 9,334 (5.1%) | 5,063 (2.9%) |
| 18 to 34 Years | 9,714 (4.4%) | 7,100 (3.4%) |
| 35 to 64 Years | 17,893 (5.4%) | 18,577 (5.7%) |
| 65 to 74 Years | 5,028 (7.0%) | 5,716 (7.1%) |
| 75 Years and over | 6,781 (15.6%) | 10,542 (17.9%) |
Disability Class: Ambulatory Difficulty
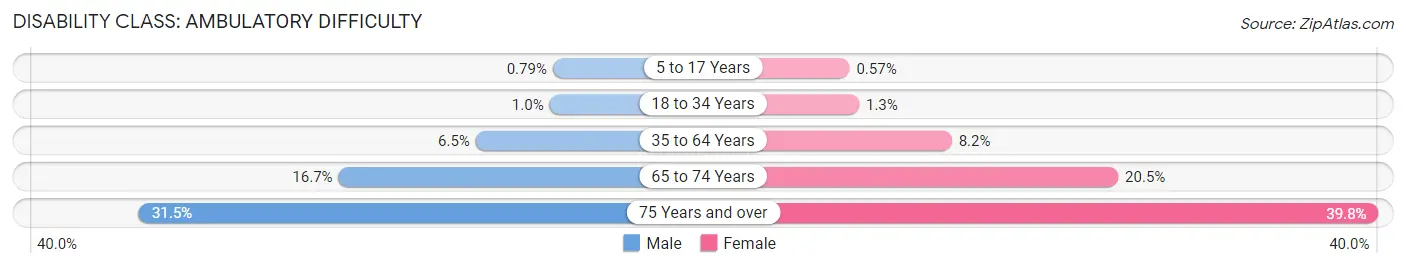
| Age Bracket | Male | Female |
| 5 to 17 Years | 1,466 (0.8%) | 1,008 (0.6%) |
| 18 to 34 Years | 2,258 (1.0%) | 2,670 (1.3%) |
| 35 to 64 Years | 21,596 (6.5%) | 26,837 (8.2%) |
| 65 to 74 Years | 11,928 (16.7%) | 16,575 (20.5%) |
| 75 Years and over | 13,659 (31.5%) | 23,433 (39.8%) |
Disability Class: Self-Care Difficulty
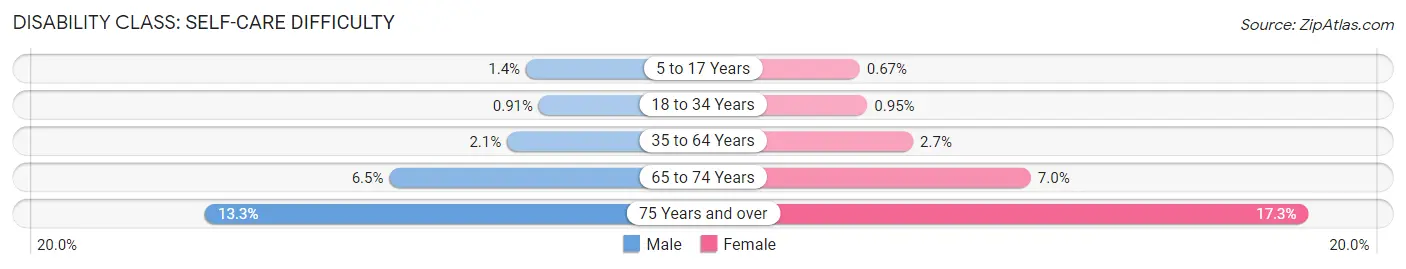
| Age Bracket | Male | Female |
| 5 to 17 Years | 2,577 (1.4%) | 1,191 (0.7%) |
| 18 to 34 Years | 2,012 (0.9%) | 1,985 (0.9%) |
| 35 to 64 Years | 6,945 (2.1%) | 8,712 (2.6%) |
| 65 to 74 Years | 4,611 (6.5%) | 5,672 (7.0%) |
| 75 Years and over | 5,766 (13.3%) | 10,190 (17.3%) |
Technology Access in Area Code 209
Computing Device Access in Area Code 209
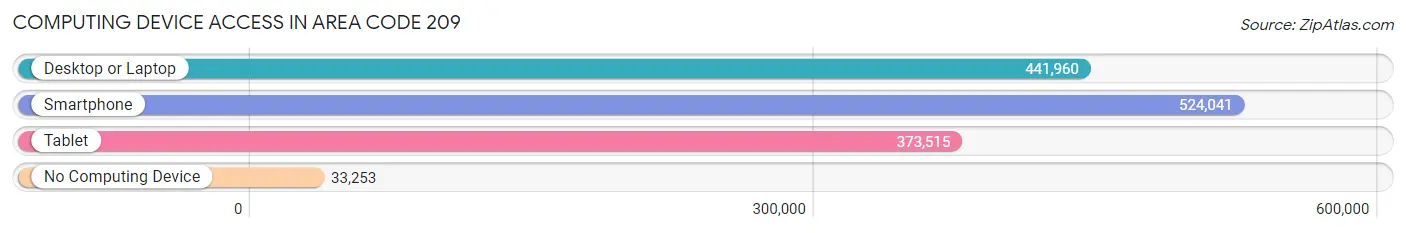
| Device Type | # Households | % Households |
| Desktop or Laptop | 441,960 | 75.6% |
| Smartphone | 524,041 | 89.6% |
| Tablet | 373,515 | 63.9% |
| No Computing Device | 33,253 | 5.7% |
| Total | 584,566 | 100.0% |
Internet Access in Area Code 209
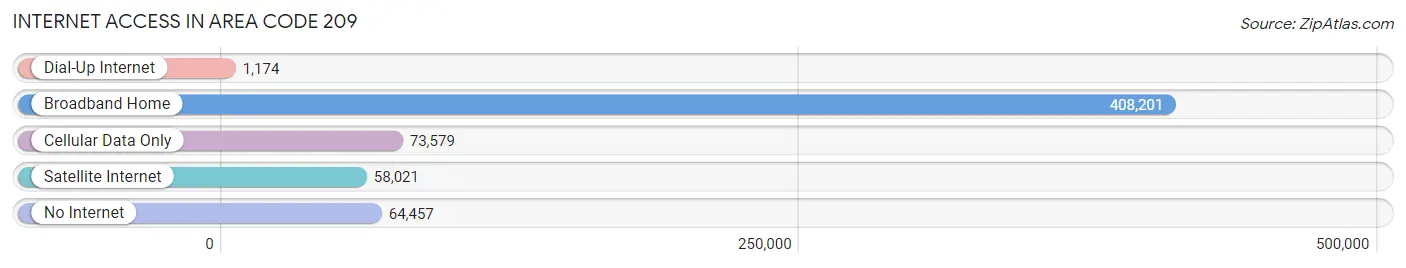
| Internet Type | # Households | % Households |
| Dial-Up Internet | 1,174 | 0.2% |
| Broadband Home | 408,201 | 69.8% |
| Cellular Data Only | 73,579 | 12.6% |
| Satellite Internet | 58,021 | 9.9% |
| No Internet | 64,457 | 11.0% |
| Total | 584,566 | 100.0% |
Area Code 209 Summary
Geography
Area code 209 is a telephone area code in the North American Numbering Plan (NANP) for the northern San Joaquin Valley and Sierra Foothills regions of California. It serves the cities of Stockton, Modesto, Turlock, Merced, Tracy, Lodi, Manteca, Ripon, Sonora, and Lathrop.
Social
Area code 209 is home to a diverse population of people from all walks of life. The area is known for its agricultural production, and is home to many small towns and rural communities. It is also home to a vibrant arts and culture scene, with many festivals and events taking place throughout the year.
Economics
Area code 209 is an important economic hub for the state of California. It is home to many large companies, including E&J Gallo Winery, Foster Farms, and Del Monte Foods. The area is also home to a number of universities and colleges, including the University of the Pacific, California State University Stanislaus, and Modesto Junior College.
Demographics
Area code 209 is home to a population of over 1.5 million people. The population is diverse, with a mix of ethnicities and backgrounds. The median household income is around $50,000, and the unemployment rate is around 8%. The area is also home to a large number of immigrants, with over 20% of the population being foreign-born.
Common Questions
What is Per Capita Income in Area Code 209?
Per Capita income in Area Code 209 is $35,075.
What is the Median Family Income in Area Code 209?
Median Family Income in Area Code 209 is $87,586.
What is the Median Household income in Area Code 209?
Median Household Income in Area Code 209 is $76,664.
What is Income or Wage Gap in Area Code 209?
Income or Wage Gap in Area Code 209 is 33.5%.
Women in Area Code 209 earn 66.5 cents for every dollar earned by a man.
What is Family Income Deficit in Area Code 209?
Family Income Deficit in Area Code 209 is $11,158.
Families that are below poverty line in Area Code 209 earn $11,158 less on average than the poverty threshold level.
What is Inequality or Gini Index in Area Code 209?
Inequality or Gini Index in Area Code 209 is 53.48.
What is the Total Population of Area Code 209?
Total Population of Area Code 209 is 1,850,257.
What is the Total Male Population of Area Code 209?
Total Male Population of Area Code 209 is 933,587.
What is the Total Female Population of Area Code 209?
Total Female Population of Area Code 209 is 916,670.
What is the Ratio of Males per 100 Females in Area Code 209?
There are 101.85 Males per 100 Females in Area Code 209.
What is the Ratio of Females per 100 Males in Area Code 209?
There are 98.19 Females per 100 Males in Area Code 209.
What is the Median Population Age in Area Code 209?
Median Population Age in Area Code 209 is 40.8 Years.
What is the Average Family Size in Area Code 209
Average Family Size in Area Code 209 is 3.4 People.
What is the Average Household Size in Area Code 209
Average Household Size in Area Code 209 is 2.9 People.
How Large is the Labor Force in Area Code 209?
There are 799,457 People in the Labor Forcein in Area Code 209.
What is the Percentage of People in the Labor Force in Area Code 209?
56.2% of People are in the Labor Force in Area Code 209.
What is the Unemployment Rate in Area Code 209?
Unemployment Rate in Area Code 209 is 9.6%.