Contra Costa County, CA Map & Demographics
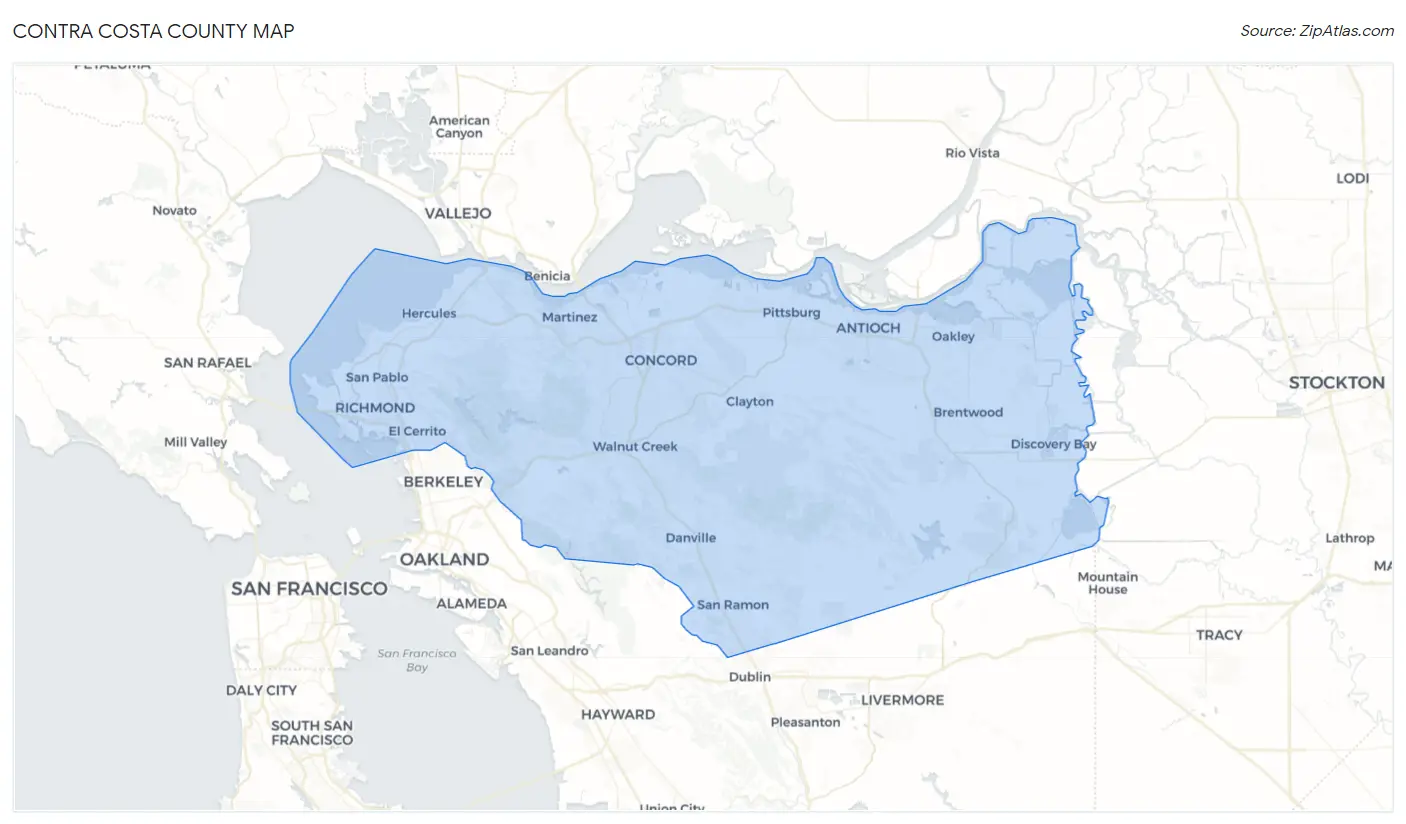
Contra Costa County Map
Contra Costa County Overview
$59,083
PER CAPITA INCOME
$139,078
AVG FAMILY INCOME
$120,020
AVG HOUSEHOLD INCOME
31.5%
WAGE / INCOME GAP [ % ]
68.5¢/ $1
WAGE / INCOME GAP [ $ ]
$12,072
FAMILY INCOME DEFICIT
0.47
INEQUALITY / GINI INDEX
1,162,648
TOTAL POPULATION
573,074
MALE POPULATION
589,574
FEMALE POPULATION
97.20
MALES / 100 FEMALES
102.88
FEMALES / 100 MALES
40.1
MEDIAN AGE
3.3
AVG FAMILY SIZE
2.8
AVG HOUSEHOLD SIZE
609,772
LABOR FORCE [ PEOPLE ]
65.1%
PERCENT IN LABOR FORCE
5.8%
UNEMPLOYMENT RATE
Income in Contra Costa County
Income Overview in Contra Costa County
Per Capita Income in Contra Costa County is $59,083, while median incomes of families and households are $139,078 and $120,020 respectively.
| Characteristic | Number | Measure |
| Per Capita Income | 1,162,648 | $59,083 |
| Median Family Income | 291,850 | $139,078 |
| Mean Family Income | 291,850 | $185,632 |
| Median Household Income | 408,537 | $120,020 |
| Mean Household Income | 408,537 | $165,199 |
| Income Deficit | 291,850 | $12,072 |
| Wage / Income Gap (%) | 1,162,648 | 31.52% |
| Wage / Income Gap ($) | 1,162,648 | 68.48¢ per $1 |
| Gini / Inequality Index | 1,162,648 | 0.47 |
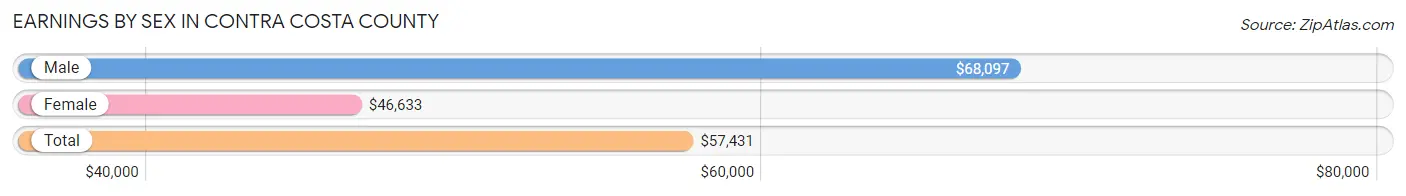
Earnings by Sex in Contra Costa County
Average Earnings in Contra Costa County are $57,431, $68,097 for men and $46,633 for women, a difference of 31.5%.
| Sex | Number | Average Earnings |
| Male | 330,653 (52.9%) | $68,097 |
| Female | 294,358 (47.1%) | $46,633 |
| Total | 625,011 (100.0%) | $57,431 |
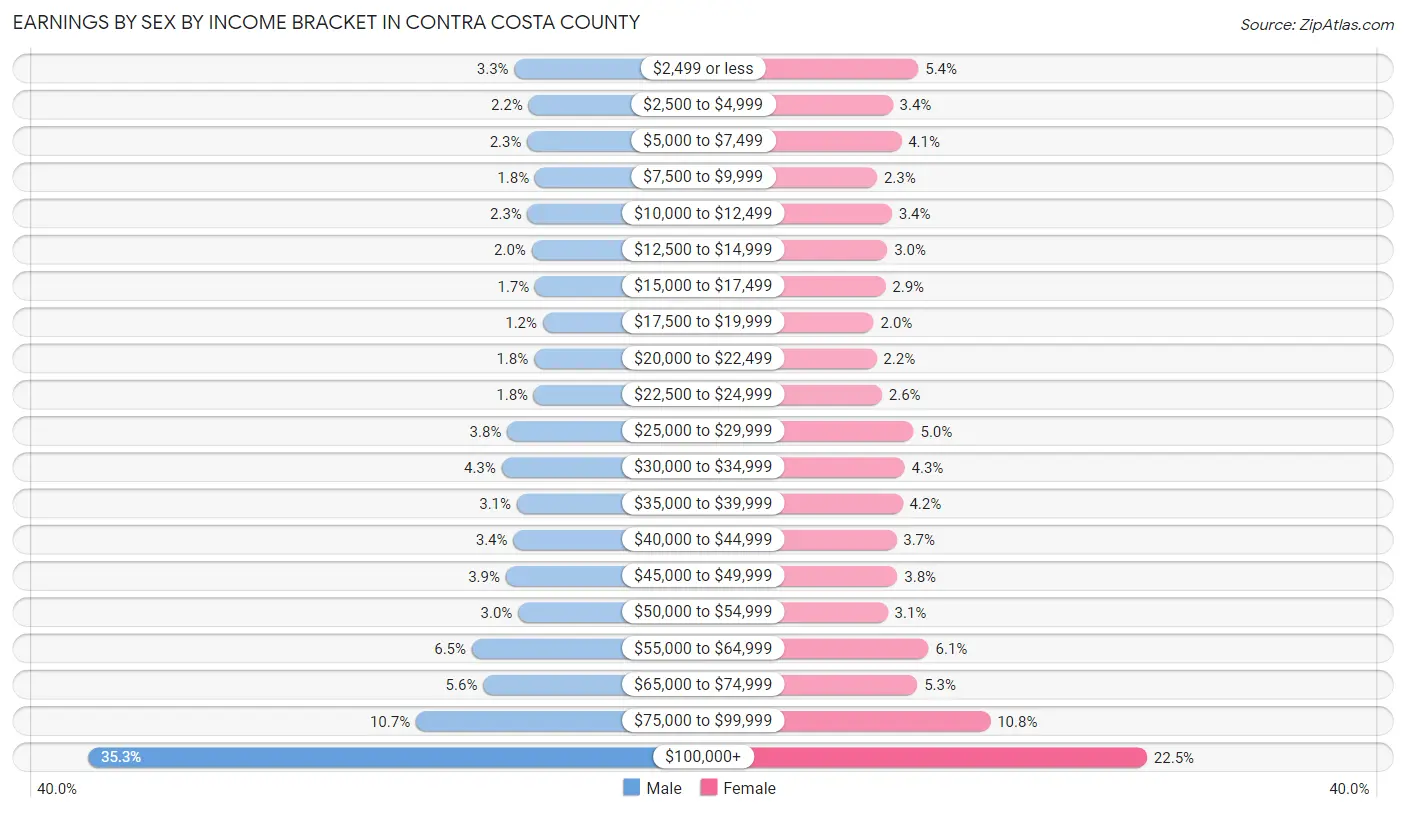
Earnings by Sex by Income Bracket in Contra Costa County
The most common earnings brackets in Contra Costa County are $100,000+ for men (116,561 | 35.2%) and $100,000+ for women (66,209 | 22.5%).
| Income | Male | Female |
| $2,499 or less | 10,879 (3.3%) | 15,783 (5.4%) |
| $2,500 to $4,999 | 7,373 (2.2%) | 10,110 (3.4%) |
| $5,000 to $7,499 | 7,701 (2.3%) | 12,024 (4.1%) |
| $7,500 to $9,999 | 5,790 (1.8%) | 6,656 (2.3%) |
| $10,000 to $12,499 | 7,603 (2.3%) | 9,912 (3.4%) |
| $12,500 to $14,999 | 6,621 (2.0%) | 8,916 (3.0%) |
| $15,000 to $17,499 | 5,756 (1.7%) | 8,521 (2.9%) |
| $17,500 to $19,999 | 3,827 (1.2%) | 5,910 (2.0%) |
| $20,000 to $22,499 | 6,031 (1.8%) | 6,548 (2.2%) |
| $22,500 to $24,999 | 6,053 (1.8%) | 7,731 (2.6%) |
| $25,000 to $29,999 | 12,668 (3.8%) | 14,706 (5.0%) |
| $30,000 to $34,999 | 14,042 (4.3%) | 12,754 (4.3%) |
| $35,000 to $39,999 | 10,280 (3.1%) | 12,285 (4.2%) |
| $40,000 to $44,999 | 11,156 (3.4%) | 10,906 (3.7%) |
| $45,000 to $49,999 | 13,036 (3.9%) | 11,161 (3.8%) |
| $50,000 to $54,999 | 9,951 (3.0%) | 8,997 (3.1%) |
| $55,000 to $64,999 | 21,411 (6.5%) | 18,051 (6.1%) |
| $65,000 to $74,999 | 18,626 (5.6%) | 15,543 (5.3%) |
| $75,000 to $99,999 | 35,288 (10.7%) | 31,635 (10.7%) |
| $100,000+ | 116,561 (35.2%) | 66,209 (22.5%) |
| Total | 330,653 (100.0%) | 294,358 (100.0%) |
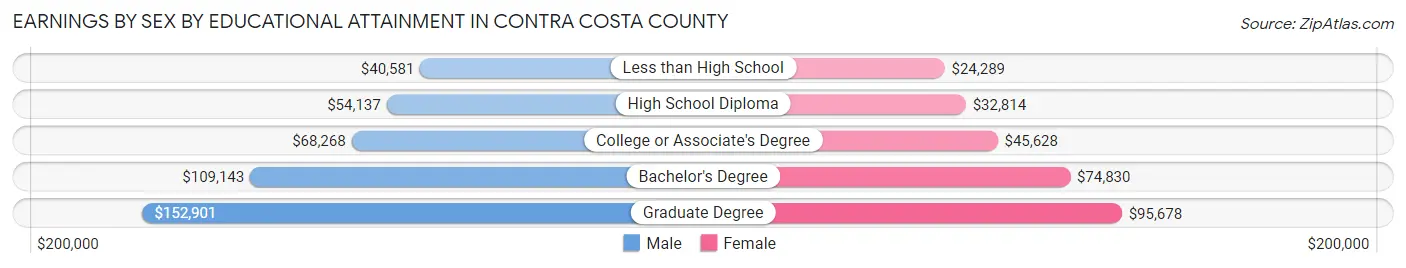
Earnings by Sex by Educational Attainment in Contra Costa County
Average earnings in Contra Costa County are $77,757 for men and $55,566 for women, a difference of 28.5%. Men with an educational attainment of graduate degree enjoy the highest average annual earnings of $152,901, while those with less than high school education earn the least with $40,581. Women with an educational attainment of graduate degree earn the most with the average annual earnings of $95,678, while those with less than high school education have the smallest earnings of $24,289.
| Educational Attainment | Male Income | Female Income |
| Less than High School | $40,581 | $24,289 |
| High School Diploma | $54,137 | $32,814 |
| College or Associate's Degree | $68,268 | $45,628 |
| Bachelor's Degree | $109,143 | $74,830 |
| Graduate Degree | $152,901 | $95,678 |
| Total | $77,757 | $55,566 |
Family Income in Contra Costa County
Family Income Brackets in Contra Costa County
According to the Contra Costa County family income data, there are 93,976 families falling into the $200,000+ income range, which is the most common income bracket and makes up 32.2% of all families. Conversely, the $10,000 to $14,999 income bracket is the least frequent group with only 3,210 families (1.1%) belonging to this category.
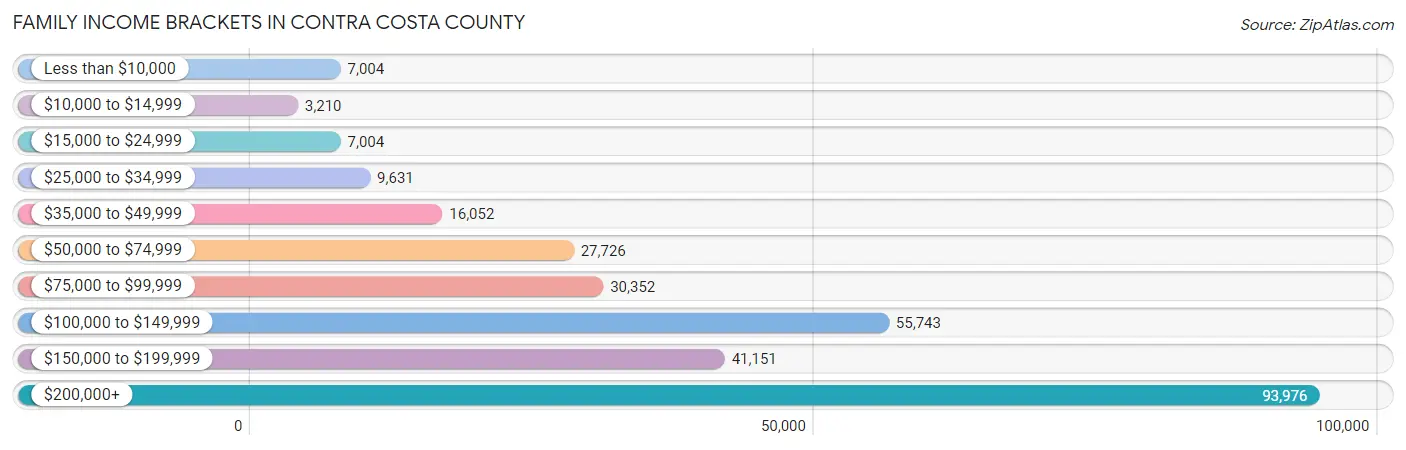
| Income Bracket | # Families | % Families |
| Less than $10,000 | 7,004 | 2.4% |
| $10,000 to $14,999 | 3,210 | 1.1% |
| $15,000 to $24,999 | 7,004 | 2.4% |
| $25,000 to $34,999 | 9,631 | 3.3% |
| $35,000 to $49,999 | 16,052 | 5.5% |
| $50,000 to $74,999 | 27,726 | 9.5% |
| $75,000 to $99,999 | 30,352 | 10.4% |
| $100,000 to $149,999 | 55,743 | 19.1% |
| $150,000 to $199,999 | 41,151 | 14.1% |
| $200,000+ | 93,976 | 32.2% |
Family Income by Famaliy Size in Contra Costa County
4-person families (62,601 | 21.4%) account for the highest median family income in Contra Costa County with $170,512 per family, while 2-person families (115,337 | 39.5%) have the highest median income of $59,751 per family member.
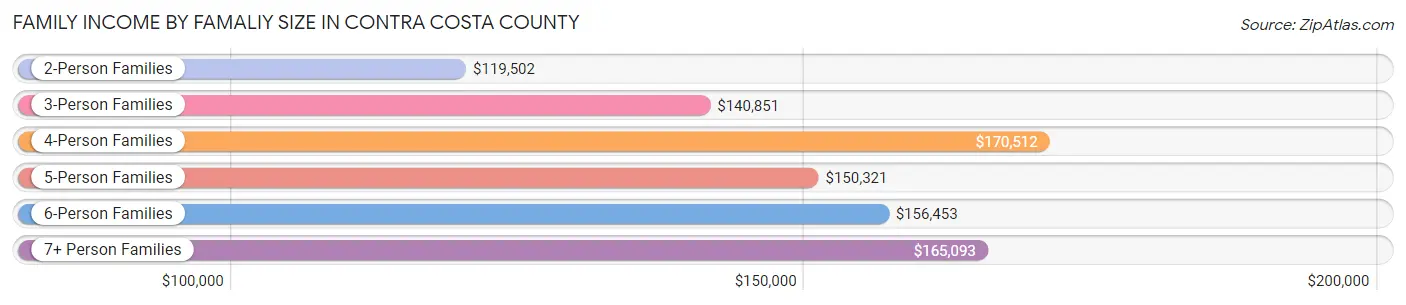
| Income Bracket | # Families | Median Income |
| 2-Person Families | 115,337 (39.5%) | $119,502 |
| 3-Person Families | 69,779 (23.9%) | $140,851 |
| 4-Person Families | 62,601 (21.4%) | $170,512 |
| 5-Person Families | 26,816 (9.2%) | $150,321 |
| 6-Person Families | 10,705 (3.7%) | $156,453 |
| 7+ Person Families | 6,612 (2.3%) | $165,093 |
| Total | 291,850 (100.0%) | $139,078 |
Family Income by Number of Earners in Contra Costa County
The median family income in Contra Costa County is $139,078, with families comprising 3+ earners (43,734) having the highest median family income of $184,872, while families with no earners (34,441) have the lowest median family income of $77,751, accounting for 15.0% and 11.8% of families, respectively.
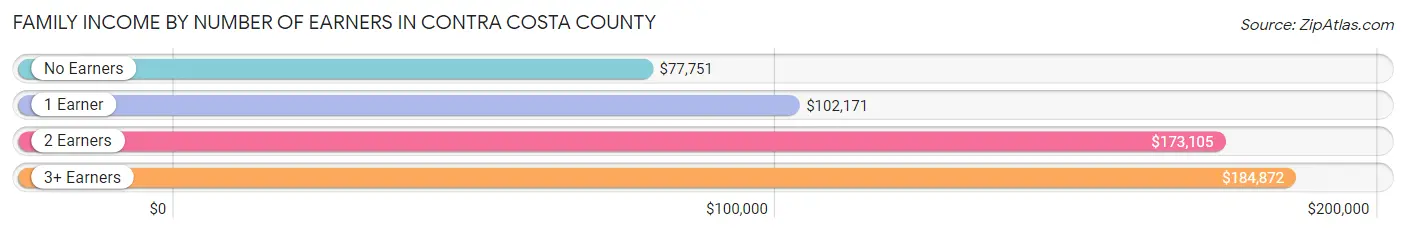
| Number of Earners | # Families | Median Income |
| No Earners | 34,441 (11.8%) | $77,751 |
| 1 Earner | 90,121 (30.9%) | $102,171 |
| 2 Earners | 123,554 (42.3%) | $173,105 |
| 3+ Earners | 43,734 (15.0%) | $184,872 |
| Total | 291,850 (100.0%) | $139,078 |
Household Income in Contra Costa County
Household Income Brackets in Contra Costa County
With 109,488 households falling in the category, the $200,000+ income range is the most frequent in Contra Costa County, accounting for 26.8% of all households. In contrast, only 9,805 households (2.4%) fall into the $10,000 to $14,999 income bracket, making it the least populous group.
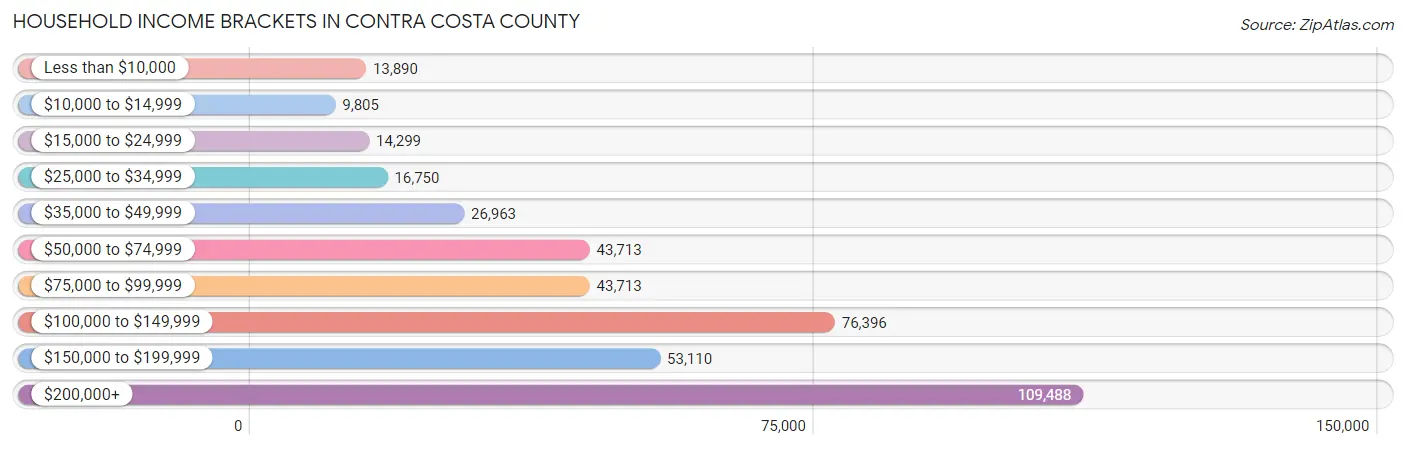
| Income Bracket | # Households | % Households |
| Less than $10,000 | 13,890 | 3.4% |
| $10,000 to $14,999 | 9,805 | 2.4% |
| $15,000 to $24,999 | 14,299 | 3.5% |
| $25,000 to $34,999 | 16,750 | 4.1% |
| $35,000 to $49,999 | 26,963 | 6.6% |
| $50,000 to $74,999 | 43,713 | 10.7% |
| $75,000 to $99,999 | 43,713 | 10.7% |
| $100,000 to $149,999 | 76,396 | 18.7% |
| $150,000 to $199,999 | 53,110 | 13.0% |
| $200,000+ | 109,488 | 26.8% |
Household Income by Householder Age in Contra Costa County
The median household income in Contra Costa County is $120,020, with the highest median household income of $145,846 found in the 45 to 64 years age bracket for the primary householder. A total of 166,168 households (40.7%) fall into this category. Meanwhile, the 15 to 24 years age bracket for the primary householder has the lowest median household income of $65,037, with 6,673 households (1.6%) in this group.
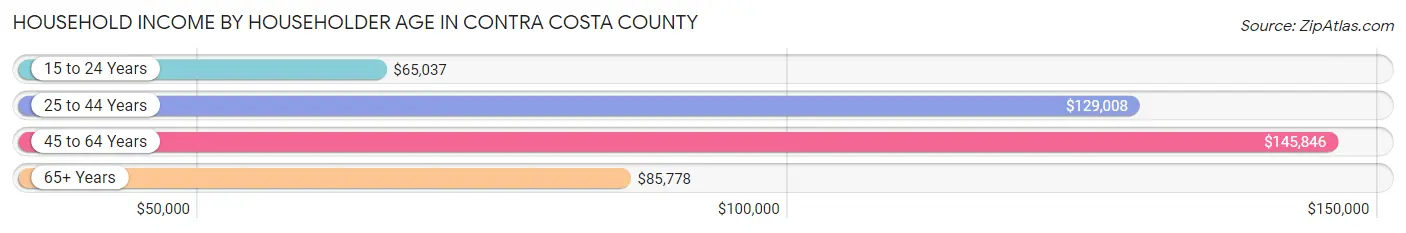
| Income Bracket | # Households | Median Income |
| 15 to 24 Years | 6,673 (1.6%) | $65,037 |
| 25 to 44 Years | 125,542 (30.7%) | $129,008 |
| 45 to 64 Years | 166,168 (40.7%) | $145,846 |
| 65+ Years | 110,154 (27.0%) | $85,778 |
| Total | 408,537 (100.0%) | $120,020 |
Poverty in Contra Costa County
Income Below Poverty by Sex and Age in Contra Costa County
With 7.6% poverty level for males and 8.9% for females among the residents of Contra Costa County, 15 year old males and 16 and 17 year old females are the most vulnerable to poverty, with 958 males (12.6%) and 1,889 females (12.4%) in their respective age groups living below the poverty level.
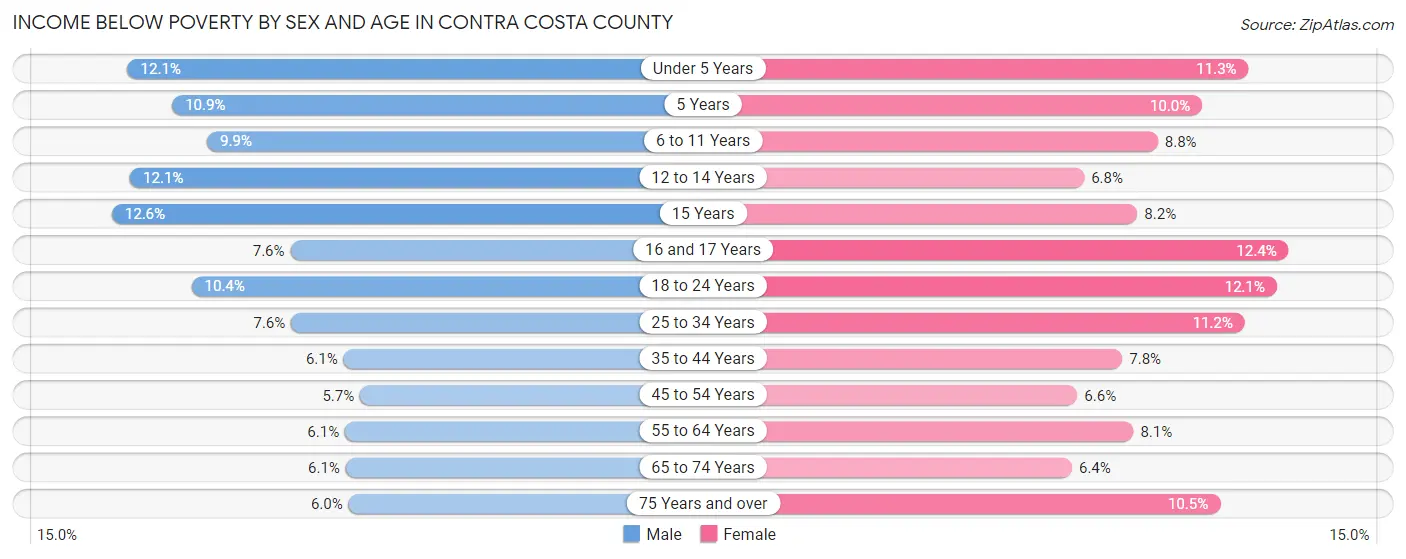
| Age Bracket | Male | Female |
| Under 5 Years | 3,822 (12.1%) | 3,421 (11.3%) |
| 5 Years | 747 (10.9%) | 690 (10.0%) |
| 6 to 11 Years | 4,310 (9.9%) | 3,610 (8.8%) |
| 12 to 14 Years | 2,857 (12.1%) | 1,555 (6.8%) |
| 15 Years | 958 (12.6%) | 670 (8.2%) |
| 16 and 17 Years | 1,276 (7.6%) | 1,889 (12.4%) |
| 18 to 24 Years | 5,028 (10.3%) | 5,549 (12.1%) |
| 25 to 34 Years | 5,489 (7.6%) | 7,995 (11.2%) |
| 35 to 44 Years | 4,885 (6.1%) | 6,311 (7.8%) |
| 45 to 54 Years | 4,498 (5.7%) | 5,268 (6.6%) |
| 55 to 64 Years | 4,561 (6.1%) | 6,300 (8.1%) |
| 65 to 74 Years | 3,098 (6.1%) | 3,804 (6.4%) |
| 75 Years and over | 1,915 (6.0%) | 4,749 (10.5%) |
| Total | 43,444 (7.6%) | 51,811 (8.9%) |
Income Above Poverty by Sex and Age in Contra Costa County
According to the poverty statistics in Contra Costa County, males aged 45 to 54 years and females aged 65 to 74 years are the age groups that are most secure financially, with 94.3% of males and 93.6% of females in these age groups living above the poverty line.
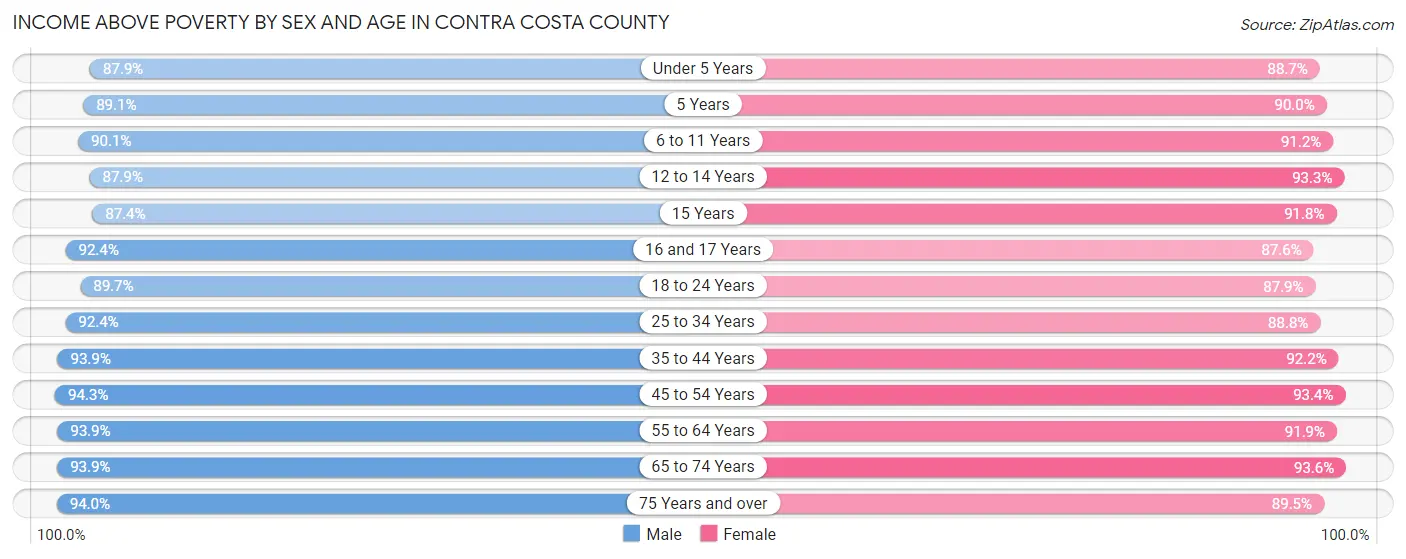
| Age Bracket | Male | Female |
| Under 5 Years | 27,698 (87.9%) | 26,799 (88.7%) |
| 5 Years | 6,115 (89.1%) | 6,192 (90.0%) |
| 6 to 11 Years | 39,122 (90.1%) | 37,421 (91.2%) |
| 12 to 14 Years | 20,835 (87.9%) | 21,469 (93.2%) |
| 15 Years | 6,661 (87.4%) | 7,475 (91.8%) |
| 16 and 17 Years | 15,509 (92.4%) | 13,296 (87.6%) |
| 18 to 24 Years | 43,562 (89.6%) | 40,258 (87.9%) |
| 25 to 34 Years | 66,965 (92.4%) | 63,257 (88.8%) |
| 35 to 44 Years | 74,997 (93.9%) | 74,508 (92.2%) |
| 45 to 54 Years | 75,029 (94.3%) | 74,982 (93.4%) |
| 55 to 64 Years | 70,479 (93.9%) | 71,284 (91.9%) |
| 65 to 74 Years | 48,040 (93.9%) | 55,518 (93.6%) |
| 75 Years and over | 30,126 (94.0%) | 40,364 (89.5%) |
| Total | 525,138 (92.4%) | 532,823 (91.1%) |
Income Below Poverty Among Married-Couple Families in Contra Costa County
The poverty statistics for married-couple families in Contra Costa County show that 3.1% or 6,805 of the total 221,482 families live below the poverty line. Families with 5 or more children have the highest poverty rate of 15.8%, comprising of 118 families. On the other hand, families with no children have the lowest poverty rate of 2.2%, which includes 2,556 families.
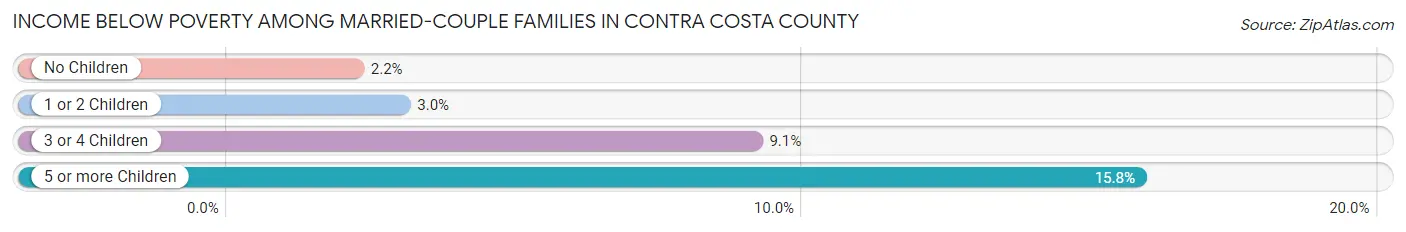
| Children | Above Poverty | Below Poverty |
| No Children | 114,002 (97.8%) | 2,556 (2.2%) |
| 1 or 2 Children | 85,116 (97.0%) | 2,631 (3.0%) |
| 3 or 4 Children | 14,931 (90.9%) | 1,500 (9.1%) |
| 5 or more Children | 628 (84.2%) | 118 (15.8%) |
| Total | 214,677 (96.9%) | 6,805 (3.1%) |
Income Below Poverty Among Single-Parent Households in Contra Costa County
According to the poverty data in Contra Costa County, 8.4% or 1,805 single-father households and 16.4% or 8,040 single-mother households are living below the poverty line. Among single-father households, those with 5 or more children have the highest poverty rate, with 37 households (56.1%) experiencing poverty. Likewise, among single-mother households, those with 5 or more children have the highest poverty rate, with 179 households (47.0%) falling below the poverty line.
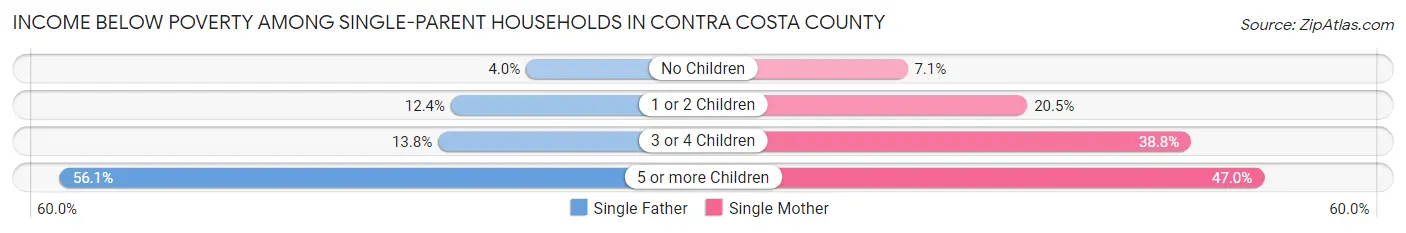
| Children | Single Father | Single Mother |
| No Children | 418 (4.0%) | 1,526 (7.1%) |
| 1 or 2 Children | 1,171 (12.4%) | 4,737 (20.5%) |
| 3 or 4 Children | 179 (13.8%) | 1,598 (38.8%) |
| 5 or more Children | 37 (56.1%) | 179 (47.0%) |
| Total | 1,805 (8.4%) | 8,040 (16.4%) |
Income Below Poverty Among Married-Couple vs Single-Parent Households in Contra Costa County
The poverty data for Contra Costa County shows that 6,805 of the married-couple family households (3.1%) and 9,845 of the single-parent households (14.0%) are living below the poverty level. Within the married-couple family households, those with 5 or more children have the highest poverty rate, with 118 households (15.8%) falling below the poverty line. Among the single-parent households, those with 5 or more children have the highest poverty rate, with 216 household (48.3%) living below poverty.
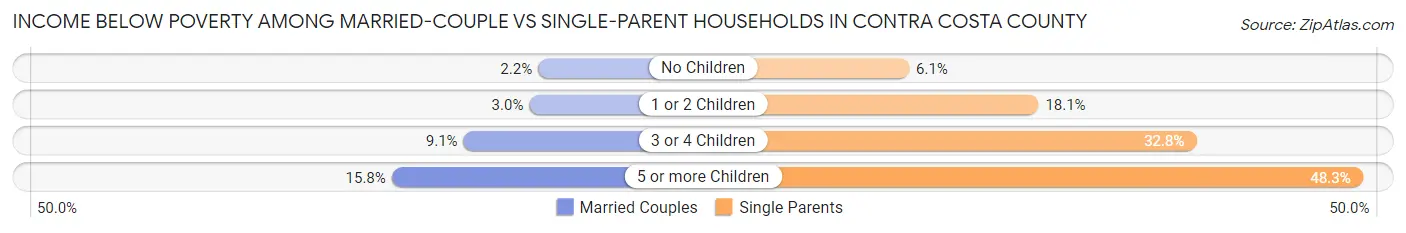
| Children | Married-Couple Families | Single-Parent Households |
| No Children | 2,556 (2.2%) | 1,944 (6.1%) |
| 1 or 2 Children | 2,631 (3.0%) | 5,908 (18.1%) |
| 3 or 4 Children | 1,500 (9.1%) | 1,777 (32.8%) |
| 5 or more Children | 118 (15.8%) | 216 (48.3%) |
| Total | 6,805 (3.1%) | 9,845 (14.0%) |
Race in Contra Costa County
The most populous races in Contra Costa County are White / Caucasian (542,206 | 46.6%), Hispanic or Latino (306,895 | 26.4%), and Asian (212,568 | 18.3%).
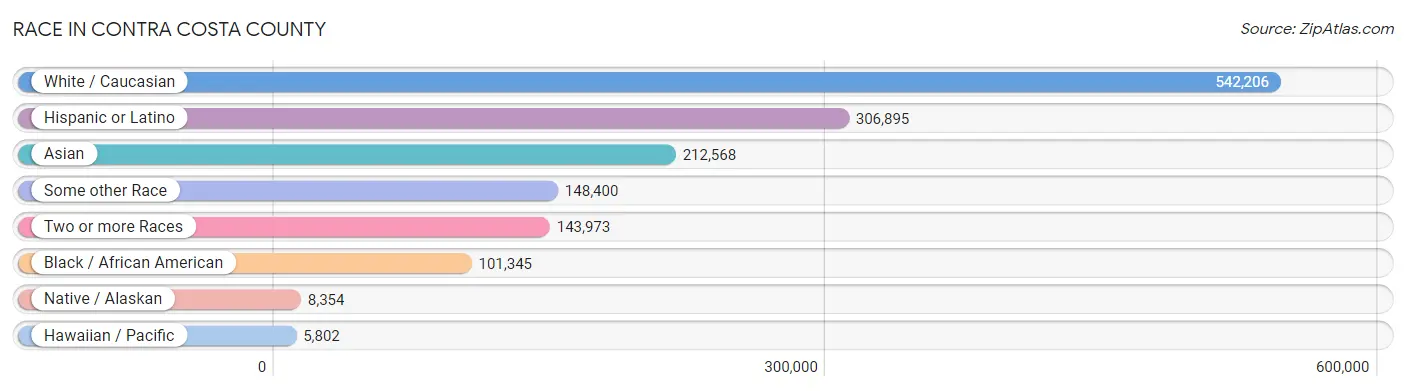
| Race | # Population | % Population |
| Asian | 212,568 | 18.3% |
| Black / African American | 101,345 | 8.7% |
| Hawaiian / Pacific | 5,802 | 0.5% |
| Hispanic or Latino | 306,895 | 26.4% |
| Native / Alaskan | 8,354 | 0.7% |
| White / Caucasian | 542,206 | 46.6% |
| Two or more Races | 143,973 | 12.4% |
| Some other Race | 148,400 | 12.8% |
| Total | 1,162,648 | 100.0% |
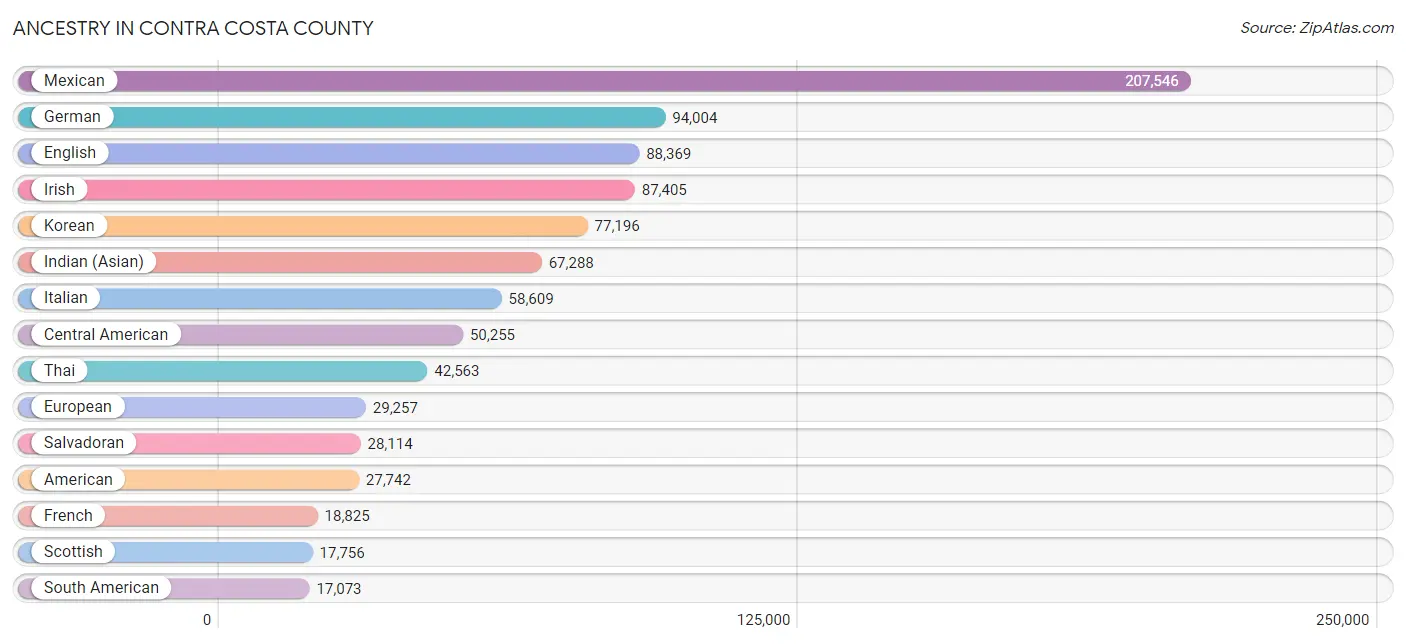
Ancestry in Contra Costa County
The most populous ancestries reported in Contra Costa County are Mexican (207,546 | 17.8%), German (94,004 | 8.1%), English (88,369 | 7.6%), Irish (87,405 | 7.5%), and Korean (77,196 | 6.6%), together accounting for 47.7% of all Contra Costa County residents.
| Ancestry | # Population | % Population |
| Afghan | 5,374 | 0.5% |
| African | 5,771 | 0.5% |
| Alaska Native | 33 | 0.0% |
| Albanian | 291 | 0.0% |
| Aleut | 43 | 0.0% |
| Alsatian | 16 | 0.0% |
| American | 27,742 | 2.4% |
| Apache | 1,052 | 0.1% |
| Arab | 12,536 | 1.1% |
| Argentinean | 1,219 | 0.1% |
| Armenian | 2,159 | 0.2% |
| Assyrian / Chaldean / Syriac | 229 | 0.0% |
| Australian | 1,189 | 0.1% |
| Austrian | 2,246 | 0.2% |
| Bahamian | 12 | 0.0% |
| Bangladeshi | 296 | 0.0% |
| Barbadian | 60 | 0.0% |
| Basque | 569 | 0.1% |
| Belgian | 1,043 | 0.1% |
| Belizean | 283 | 0.0% |
| Bermudan | 36 | 0.0% |
| Bhutanese | 16,969 | 1.5% |
| Blackfeet | 1,673 | 0.1% |
| Bolivian | 497 | 0.0% |
| Brazilian | 3,428 | 0.3% |
| British | 7,421 | 0.6% |
| British West Indian | 11 | 0.0% |
| Bulgarian | 759 | 0.1% |
| Burmese | 13,944 | 1.2% |
| Cajun | 137 | 0.0% |
| Cambodian | 801 | 0.1% |
| Canadian | 1,737 | 0.2% |
| Cape Verdean | 174 | 0.0% |
| Carpatho Rusyn | 34 | 0.0% |
| Celtic | 160 | 0.0% |
| Central American | 50,255 | 4.3% |
| Central American Indian | 2,319 | 0.2% |
| Cherokee | 4,547 | 0.4% |
| Chickasaw | 227 | 0.0% |
| Chilean | 986 | 0.1% |
| Chinese | 10 | 0.0% |
| Chippewa | 227 | 0.0% |
| Choctaw | 1,065 | 0.1% |
| Colombian | 3,276 | 0.3% |
| Comanche | 48 | 0.0% |
| Costa Rican | 1,019 | 0.1% |
| Cree | 49 | 0.0% |
| Creek | 663 | 0.1% |
| Croatian | 1,307 | 0.1% |
| Cuban | 1,991 | 0.2% |
| Cypriot | 52 | 0.0% |
| Czech | 2,511 | 0.2% |
| Czechoslovakian | 513 | 0.0% |
| Danish | 6,386 | 0.5% |
| Delaware | 8 | 0.0% |
| Dominican | 1,144 | 0.1% |
| Dutch | 8,925 | 0.8% |
| Dutch West Indian | 56 | 0.0% |
| Eastern European | 4,896 | 0.4% |
| Ecuadorian | 1,197 | 0.1% |
| Egyptian | 2,232 | 0.2% |
| English | 88,369 | 7.6% |
| Estonian | 203 | 0.0% |
| Ethiopian | 1,298 | 0.1% |
| European | 29,257 | 2.5% |
| Fijian | 2 | 0.0% |
| Filipino | 3,895 | 0.3% |
| Finnish | 2,512 | 0.2% |
| French | 18,825 | 1.6% |
| French American Indian | 38 | 0.0% |
| French Canadian | 2,829 | 0.2% |
| German | 94,004 | 8.1% |
| German Russian | 56 | 0.0% |
| Ghanaian | 529 | 0.1% |
| Greek | 4,509 | 0.4% |
| Guamanian / Chamorro | 1,294 | 0.1% |
| Guatemalan | 9,213 | 0.8% |
| Guyanese | 156 | 0.0% |
| Haitian | 620 | 0.1% |
| Honduran | 2,116 | 0.2% |
| Hopi | 42 | 0.0% |
| Houma | 26 | 0.0% |
| Hungarian | 3,083 | 0.3% |
| Icelander | 202 | 0.0% |
| Indian (Asian) | 67,288 | 5.8% |
| Indonesian | 708 | 0.1% |
| Inupiat | 65 | 0.0% |
| Iranian | 8,291 | 0.7% |
| Iraqi | 207 | 0.0% |
| Irish | 87,405 | 7.5% |
| Iroquois | 108 | 0.0% |
| Israeli | 739 | 0.1% |
| Italian | 58,609 | 5.0% |
| Jamaican | 1,459 | 0.1% |
| Japanese | 1,765 | 0.2% |
| Jordanian | 270 | 0.0% |
| Kenyan | 664 | 0.1% |
| Korean | 77,196 | 6.6% |
| Laotian | 2,415 | 0.2% |
| Latvian | 416 | 0.0% |
| Lebanese | 1,693 | 0.2% |
| Liberian | 113 | 0.0% |
| Lithuanian | 1,428 | 0.1% |
| Luxembourger | 42 | 0.0% |
| Macedonian | 42 | 0.0% |
| Malaysian | 4,426 | 0.4% |
| Maltese | 351 | 0.0% |
| Mexican | 207,546 | 17.8% |
| Mexican American Indian | 4,288 | 0.4% |
| Mongolian | 283 | 0.0% |
| Moroccan | 413 | 0.0% |
| Native Hawaiian | 3,273 | 0.3% |
| Navajo | 480 | 0.0% |
| Nepalese | 724 | 0.1% |
| New Zealander | 107 | 0.0% |
| Nicaraguan | 8,794 | 0.8% |
| Nigerian | 3,282 | 0.3% |
| Northern European | 3,370 | 0.3% |
| Norwegian | 13,638 | 1.2% |
| Okinawan | 111 | 0.0% |
| Osage | 41 | 0.0% |
| Ottawa | 3 | 0.0% |
| Paiute | 25 | 0.0% |
| Pakistani | 1,747 | 0.2% |
| Palestinian | 652 | 0.1% |
| Panamanian | 746 | 0.1% |
| Paraguayan | 59 | 0.0% |
| Pennsylvania German | 242 | 0.0% |
| Peruvian | 8,485 | 0.7% |
| Pima | 62 | 0.0% |
| Polish | 14,335 | 1.2% |
| Portuguese | 15,817 | 1.4% |
| Potawatomi | 11 | 0.0% |
| Pueblo | 210 | 0.0% |
| Puerto Rican | 9,043 | 0.8% |
| Puget Sound Salish | 9 | 0.0% |
| Romanian | 1,305 | 0.1% |
| Russian | 11,527 | 1.0% |
| Salvadoran | 28,114 | 2.4% |
| Samoan | 3,496 | 0.3% |
| Scandinavian | 3,339 | 0.3% |
| Scotch-Irish | 7,237 | 0.6% |
| Scottish | 17,756 | 1.5% |
| Seminole | 152 | 0.0% |
| Serbian | 596 | 0.1% |
| Sierra Leonean | 25 | 0.0% |
| Sioux | 265 | 0.0% |
| Slavic | 582 | 0.1% |
| Slovak | 900 | 0.1% |
| Slovene | 582 | 0.1% |
| South African | 429 | 0.0% |
| South American | 17,073 | 1.5% |
| South American Indian | 657 | 0.1% |
| Soviet Union | 117 | 0.0% |
| Spaniard | 6,923 | 0.6% |
| Spanish | 5,470 | 0.5% |
| Spanish American | 268 | 0.0% |
| Spanish American Indian | 197 | 0.0% |
| Sri Lankan | 14,687 | 1.3% |
| Subsaharan African | 13,083 | 1.1% |
| Sudanese | 20 | 0.0% |
| Swedish | 12,193 | 1.1% |
| Swiss | 3,356 | 0.3% |
| Syrian | 531 | 0.1% |
| Thai | 42,563 | 3.7% |
| Tlingit-Haida | 36 | 0.0% |
| Tohono O'Odham | 67 | 0.0% |
| Tongan | 973 | 0.1% |
| Trinidadian and Tobagonian | 194 | 0.0% |
| Turkish | 1,850 | 0.2% |
| U.S. Virgin Islander | 55 | 0.0% |
| Ukrainian | 3,974 | 0.3% |
| Uruguayan | 157 | 0.0% |
| Venezuelan | 983 | 0.1% |
| Vietnamese | 497 | 0.0% |
| Welsh | 6,184 | 0.5% |
| West Indian | 248 | 0.0% |
| Yaqui | 479 | 0.0% |
| Yugoslavian | 940 | 0.1% |
| Yup'ik | 20 | 0.0% |
| Zimbabwean | 11 | 0.0% | View All 181 Rows |
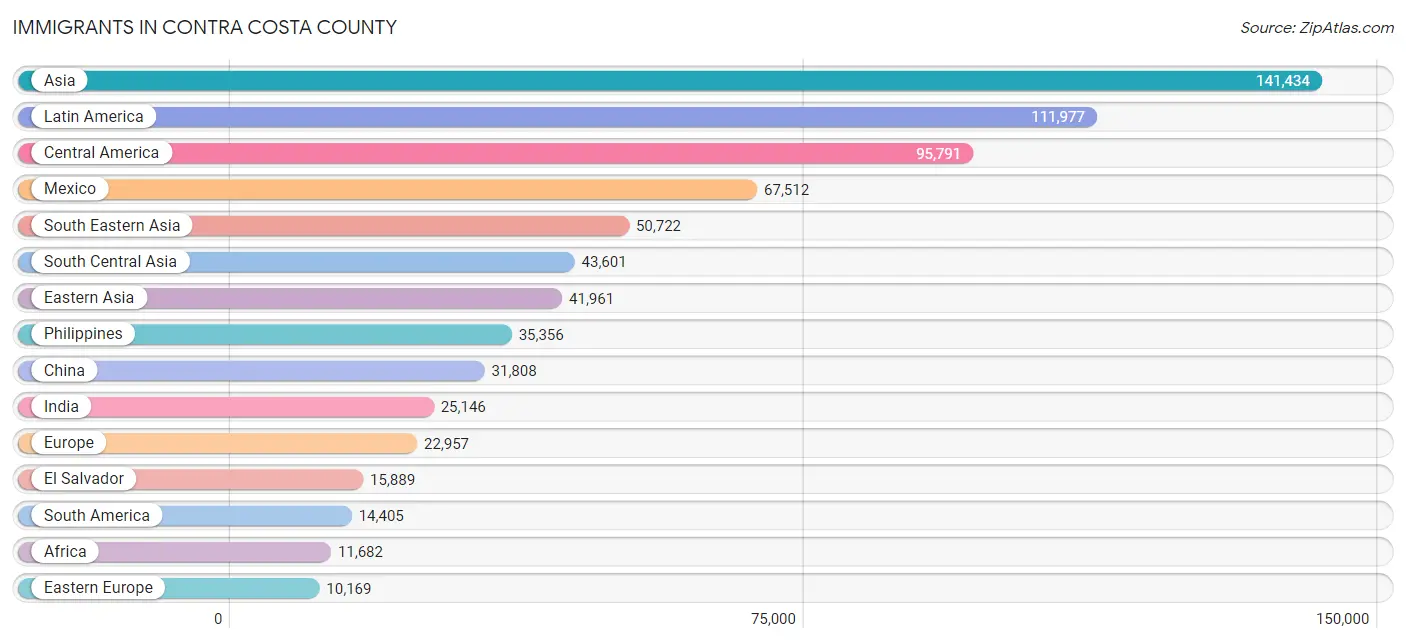
Immigrants in Contra Costa County
The most numerous immigrant groups reported in Contra Costa County came from Asia (141,434 | 12.2%), Latin America (111,977 | 9.6%), Central America (95,791 | 8.2%), Mexico (67,512 | 5.8%), and South Eastern Asia (50,722 | 4.4%), together accounting for 40.2% of all Contra Costa County residents.
| Immigration Origin | # Population | % Population |
| Afghanistan | 4,342 | 0.4% |
| Africa | 11,682 | 1.0% |
| Albania | 48 | 0.0% |
| Argentina | 900 | 0.1% |
| Armenia | 320 | 0.0% |
| Asia | 141,434 | 12.2% |
| Australia | 821 | 0.1% |
| Austria | 138 | 0.0% |
| Azores | 81 | 0.0% |
| Bahamas | 60 | 0.0% |
| Bangladesh | 359 | 0.0% |
| Barbados | 72 | 0.0% |
| Belarus | 554 | 0.1% |
| Belgium | 213 | 0.0% |
| Belize | 100 | 0.0% |
| Bolivia | 151 | 0.0% |
| Bosnia and Herzegovina | 262 | 0.0% |
| Brazil | 3,803 | 0.3% |
| Bulgaria | 563 | 0.1% |
| Cambodia | 416 | 0.0% |
| Cameroon | 535 | 0.1% |
| Canada | 3,912 | 0.3% |
| Caribbean | 1,781 | 0.2% |
| Central America | 95,791 | 8.2% |
| Chile | 630 | 0.1% |
| China | 31,808 | 2.7% |
| Colombia | 1,525 | 0.1% |
| Costa Rica | 387 | 0.0% |
| Croatia | 116 | 0.0% |
| Cuba | 258 | 0.0% |
| Czechoslovakia | 390 | 0.0% |
| Denmark | 353 | 0.0% |
| Dominica | 5 | 0.0% |
| Dominican Republic | 264 | 0.0% |
| Eastern Africa | 2,308 | 0.2% |
| Eastern Asia | 41,961 | 3.6% |
| Eastern Europe | 10,169 | 0.9% |
| Ecuador | 410 | 0.0% |
| Egypt | 1,675 | 0.1% |
| El Salvador | 15,889 | 1.4% |
| England | 1,713 | 0.2% |
| Eritrea | 241 | 0.0% |
| Ethiopia | 811 | 0.1% |
| Europe | 22,957 | 2.0% |
| Fiji | 1,422 | 0.1% |
| France | 1,047 | 0.1% |
| Germany | 2,380 | 0.2% |
| Ghana | 755 | 0.1% |
| Greece | 200 | 0.0% |
| Guatemala | 5,456 | 0.5% |
| Guyana | 153 | 0.0% |
| Haiti | 382 | 0.0% |
| Honduras | 1,352 | 0.1% |
| Hong Kong | 5,402 | 0.5% |
| Hungary | 407 | 0.0% |
| India | 25,146 | 2.2% |
| Indonesia | 1,335 | 0.1% |
| Iran | 6,356 | 0.5% |
| Iraq | 244 | 0.0% |
| Ireland | 645 | 0.1% |
| Israel | 870 | 0.1% |
| Italy | 617 | 0.1% |
| Jamaica | 545 | 0.1% |
| Japan | 2,215 | 0.2% |
| Jordan | 337 | 0.0% |
| Kazakhstan | 298 | 0.0% |
| Kenya | 668 | 0.1% |
| Korea | 7,256 | 0.6% |
| Kuwait | 207 | 0.0% |
| Laos | 2,051 | 0.2% |
| Latin America | 111,977 | 9.6% |
| Latvia | 188 | 0.0% |
| Lebanon | 555 | 0.1% |
| Liberia | 226 | 0.0% |
| Lithuania | 83 | 0.0% |
| Malaysia | 597 | 0.1% |
| Mexico | 67,512 | 5.8% |
| Micronesia | 47 | 0.0% |
| Middle Africa | 1,065 | 0.1% |
| Moldova | 216 | 0.0% |
| Morocco | 312 | 0.0% |
| Nepal | 2,606 | 0.2% |
| Netherlands | 517 | 0.0% |
| Nicaragua | 4,543 | 0.4% |
| Nigeria | 2,296 | 0.2% |
| Northern Africa | 3,794 | 0.3% |
| Northern Europe | 5,826 | 0.5% |
| Norway | 40 | 0.0% |
| Oceania | 3,487 | 0.3% |
| Pakistan | 3,444 | 0.3% |
| Panama | 527 | 0.1% |
| Peru | 5,729 | 0.5% |
| Philippines | 35,356 | 3.0% |
| Poland | 1,050 | 0.1% |
| Portugal | 605 | 0.1% |
| Romania | 567 | 0.1% |
| Russia | 2,843 | 0.2% |
| Saudi Arabia | 196 | 0.0% |
| Scotland | 378 | 0.0% |
| Serbia | 43 | 0.0% |
| Sierra Leone | 14 | 0.0% |
| Singapore | 445 | 0.0% |
| South Africa | 649 | 0.1% |
| South America | 14,405 | 1.2% |
| South Central Asia | 43,601 | 3.7% |
| South Eastern Asia | 50,722 | 4.4% |
| Southern Europe | 2,114 | 0.2% |
| Spain | 608 | 0.1% |
| Sri Lanka | 480 | 0.0% |
| Sudan | 74 | 0.0% |
| Sweden | 243 | 0.0% |
| Switzerland | 374 | 0.0% |
| Syria | 97 | 0.0% |
| Taiwan | 5,219 | 0.4% |
| Thailand | 1,593 | 0.1% |
| Trinidad and Tobago | 119 | 0.0% |
| Turkey | 628 | 0.1% |
| Uganda | 239 | 0.0% |
| Ukraine | 2,094 | 0.2% |
| Uruguay | 65 | 0.0% |
| Uzbekistan | 347 | 0.0% |
| Venezuela | 855 | 0.1% |
| Vietnam | 8,365 | 0.7% |
| Western Africa | 3,452 | 0.3% |
| Western Asia | 4,536 | 0.4% |
| Western Europe | 4,669 | 0.4% |
| Yemen | 863 | 0.1% |
| Zaire | 29 | 0.0% |
| Zimbabwe | 32 | 0.0% | View All 129 Rows |
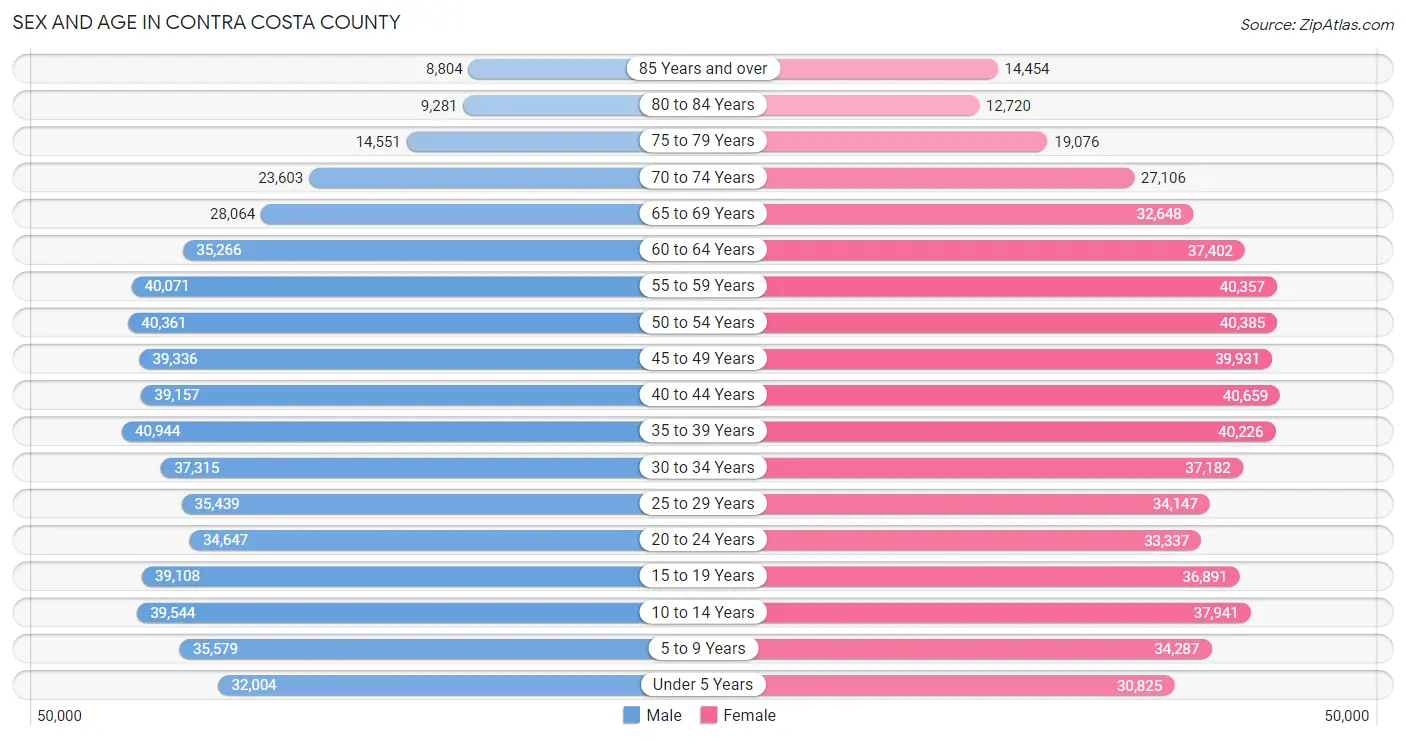
Sex and Age in Contra Costa County
Sex and Age in Contra Costa County
The most populous age groups in Contra Costa County are 35 to 39 Years (40,944 | 7.1%) for men and 40 to 44 Years (40,659 | 6.9%) for women.
| Age Bracket | Male | Female |
| Under 5 Years | 32,004 (5.6%) | 30,825 (5.2%) |
| 5 to 9 Years | 35,579 (6.2%) | 34,287 (5.8%) |
| 10 to 14 Years | 39,544 (6.9%) | 37,941 (6.4%) |
| 15 to 19 Years | 39,108 (6.8%) | 36,891 (6.3%) |
| 20 to 24 Years | 34,647 (6.0%) | 33,337 (5.7%) |
| 25 to 29 Years | 35,439 (6.2%) | 34,147 (5.8%) |
| 30 to 34 Years | 37,315 (6.5%) | 37,182 (6.3%) |
| 35 to 39 Years | 40,944 (7.1%) | 40,226 (6.8%) |
| 40 to 44 Years | 39,157 (6.8%) | 40,659 (6.9%) |
| 45 to 49 Years | 39,336 (6.9%) | 39,931 (6.8%) |
| 50 to 54 Years | 40,361 (7.0%) | 40,385 (6.9%) |
| 55 to 59 Years | 40,071 (7.0%) | 40,357 (6.9%) |
| 60 to 64 Years | 35,266 (6.1%) | 37,402 (6.3%) |
| 65 to 69 Years | 28,064 (4.9%) | 32,648 (5.5%) |
| 70 to 74 Years | 23,603 (4.1%) | 27,106 (4.6%) |
| 75 to 79 Years | 14,551 (2.5%) | 19,076 (3.2%) |
| 80 to 84 Years | 9,281 (1.6%) | 12,720 (2.2%) |
| 85 Years and over | 8,804 (1.5%) | 14,454 (2.5%) |
| Total | 573,074 (100.0%) | 589,574 (100.0%) |
Families and Households in Contra Costa County
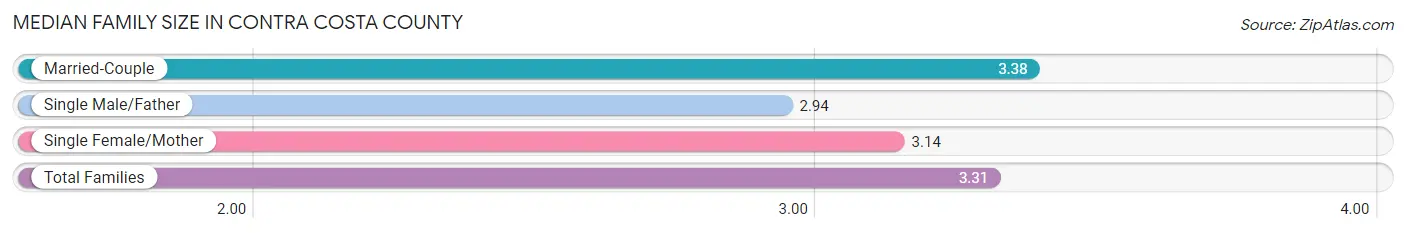
Median Family Size in Contra Costa County
The median family size in Contra Costa County is 3.31 persons per family, with married-couple families (221,482 | 75.9%) accounting for the largest median family size of 3.38 persons per family. On the other hand, single male/father families (21,384 | 7.3%) represent the smallest median family size with 2.94 persons per family.
| Family Type | # Families | Family Size |
| Married-Couple | 221,482 (75.9%) | 3.38 |
| Single Male/Father | 21,384 (7.3%) | 2.94 |
| Single Female/Mother | 48,984 (16.8%) | 3.14 |
| Total Families | 291,850 (100.0%) | 3.31 |
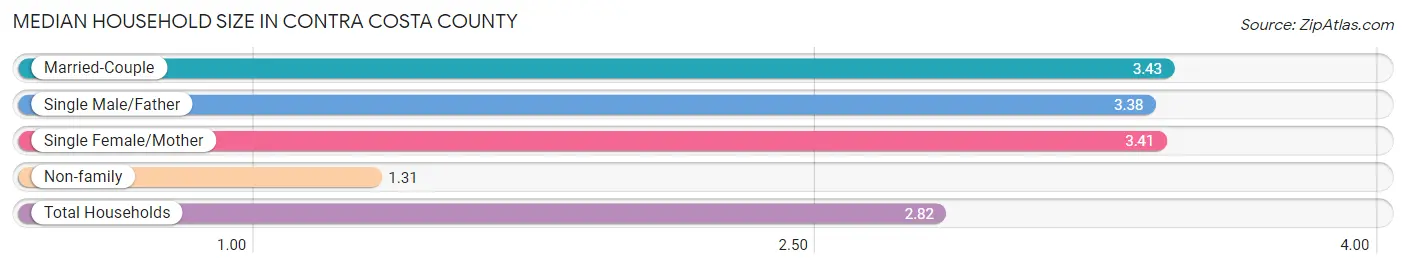
Median Household Size in Contra Costa County
The median household size in Contra Costa County is 2.82 persons per household, with married-couple households (221,482 | 54.2%) accounting for the largest median household size of 3.43 persons per household. non-family households (116,687 | 28.6%) represent the smallest median household size with 1.31 persons per household.
| Household Type | # Households | Household Size |
| Married-Couple | 221,482 (54.2%) | 3.43 |
| Single Male/Father | 21,384 (5.2%) | 3.38 |
| Single Female/Mother | 48,984 (12.0%) | 3.41 |
| Non-family | 116,687 (28.6%) | 1.31 |
| Total Households | 408,537 (100.0%) | 2.82 |
Household Size by Marriage Status in Contra Costa County
Out of a total of 408,537 households in Contra Costa County, 291,850 (71.4%) are family households, while 116,687 (28.6%) are nonfamily households. The most numerous type of family households are 2-person households, comprising 106,001, and the most common type of nonfamily households are 1-person households, comprising 90,023.
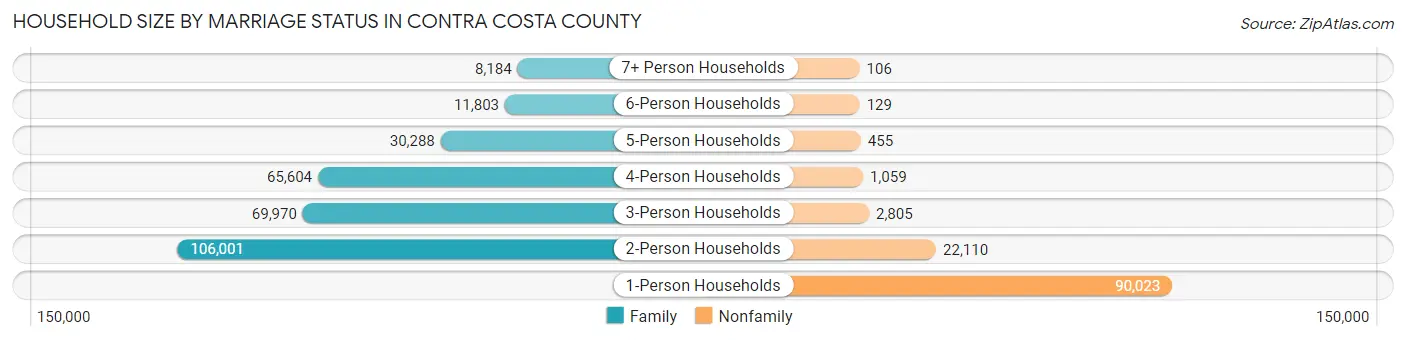
| Household Size | Family Households | Nonfamily Households |
| 1-Person Households | - | 90,023 (22.0%) |
| 2-Person Households | 106,001 (26.0%) | 22,110 (5.4%) |
| 3-Person Households | 69,970 (17.1%) | 2,805 (0.7%) |
| 4-Person Households | 65,604 (16.1%) | 1,059 (0.3%) |
| 5-Person Households | 30,288 (7.4%) | 455 (0.1%) |
| 6-Person Households | 11,803 (2.9%) | 129 (0.0%) |
| 7+ Person Households | 8,184 (2.0%) | 106 (0.0%) |
| Total | 291,850 (71.4%) | 116,687 (28.6%) |
Female Fertility in Contra Costa County
Fertility by Age in Contra Costa County
Average fertility rate in Contra Costa County is 56.0 births per 1,000 women. Women in the age bracket of 20 to 34 years have the highest fertility rate with 88.0 births per 1,000 women. Women in the age bracket of 20 to 34 years acount for 60.8% of all women with births.
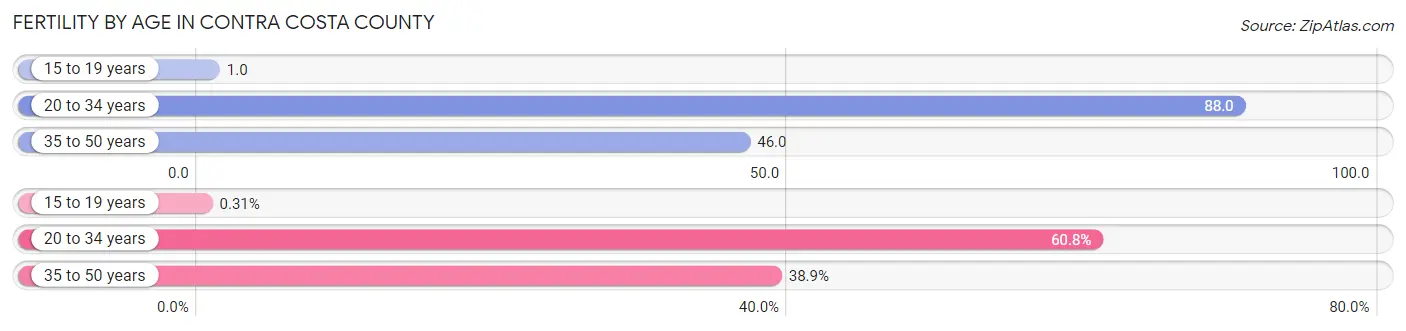
| Age Bracket | Women with Births | Births / 1,000 Women |
| 15 to 19 years | 47 (0.3%) | 1.0 |
| 20 to 34 years | 9,209 (60.8%) | 88.0 |
| 35 to 50 years | 5,902 (38.9%) | 46.0 |
| Total | 15,158 (100.0%) | 56.0 |
Fertility by Age by Marriage Status in Contra Costa County
72.4% of women with births (15,158) in Contra Costa County are married. The highest percentage of unmarried women with births falls into 15 to 19 years age bracket with 100.0% of them unmarried at the time of birth, while the lowest percentage of unmarried women with births belong to 35 to 50 years age bracket with 16.4% of them unmarried.
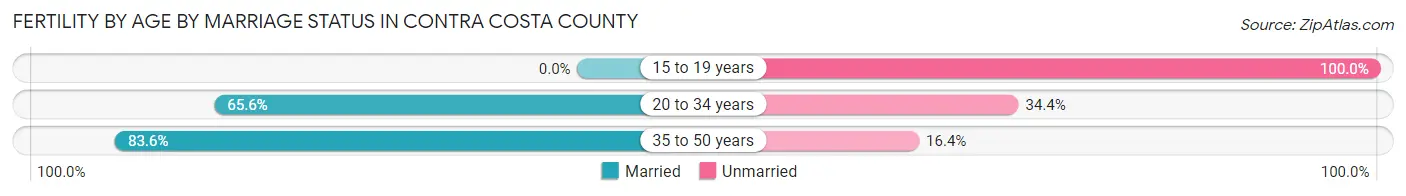
| Age Bracket | Married | Unmarried |
| 15 to 19 years | 0 (0.0%) | 47 (100.0%) |
| 20 to 34 years | 6,041 (65.6%) | 3,168 (34.4%) |
| 35 to 50 years | 4,934 (83.6%) | 968 (16.4%) |
| Total | 10,974 (72.4%) | 4,184 (27.6%) |
Fertility by Education in Contra Costa County
Average fertility rate in Contra Costa County is 56.0 births per 1,000 women. Women with the education attainment of graduate degree have the highest fertility rate of 69.0 births per 1,000 women, while women with the education attainment of less than high school have the lowest fertility at 36.0 births per 1,000 women. Women with the education attainment of bachelor's degree represent 31.3% of all women with births.
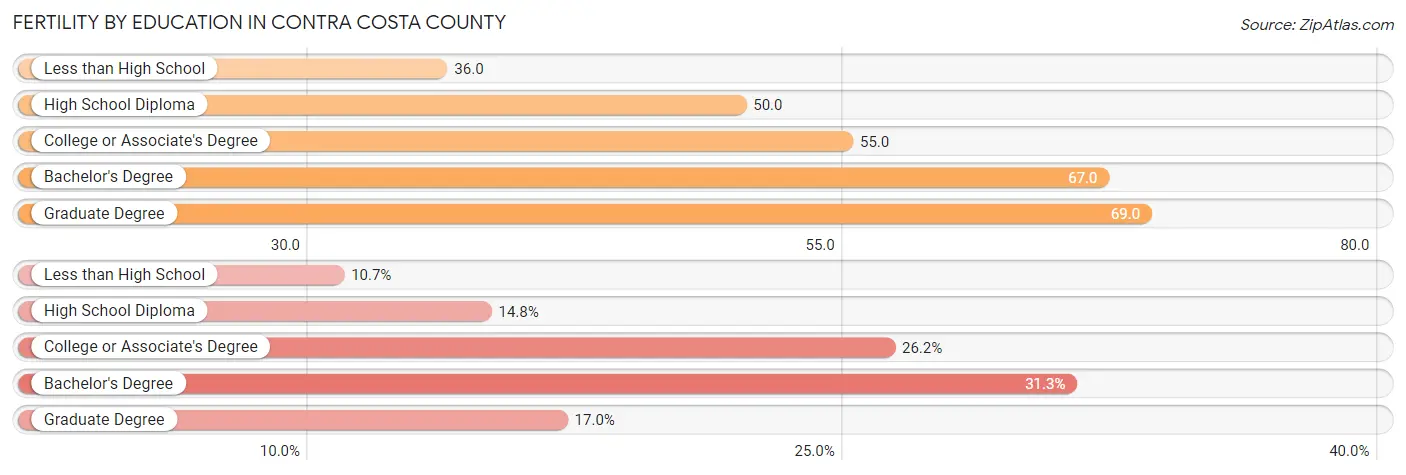
| Educational Attainment | Women with Births | Births / 1,000 Women |
| Less than High School | 1,622 (10.7%) | 36.0 |
| High School Diploma | 2,249 (14.8%) | 50.0 |
| College or Associate's Degree | 3,969 (26.2%) | 55.0 |
| Bachelor's Degree | 4,744 (31.3%) | 67.0 |
| Graduate Degree | 2,574 (17.0%) | 69.0 |
| Total | 15,158 (100.0%) | 56.0 |
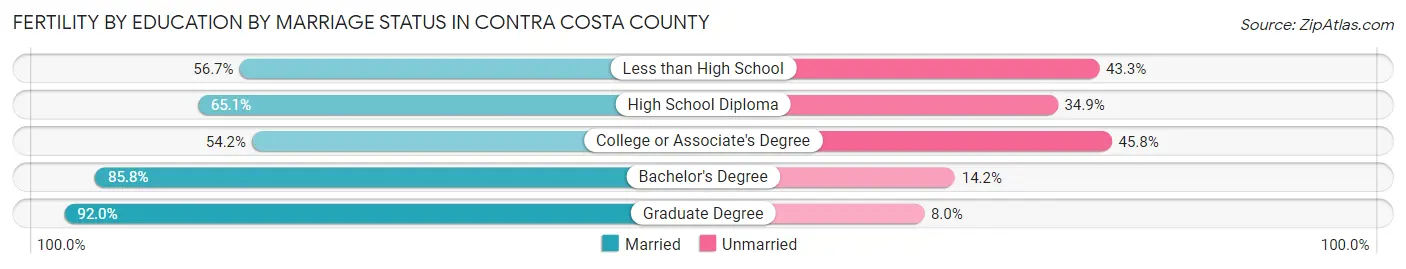
Fertility by Education by Marriage Status in Contra Costa County
27.6% of women with births in Contra Costa County are unmarried. Women with the educational attainment of graduate degree are most likely to be married with 92.0% of them married at childbirth, while women with the educational attainment of college or associate's degree are least likely to be married with 45.8% of them unmarried at childbirth.
| Educational Attainment | Married | Unmarried |
| Less than High School | 920 (56.7%) | 702 (43.3%) |
| High School Diploma | 1,464 (65.1%) | 785 (34.9%) |
| College or Associate's Degree | 2,151 (54.2%) | 1,818 (45.8%) |
| Bachelor's Degree | 4,070 (85.8%) | 674 (14.2%) |
| Graduate Degree | 2,368 (92.0%) | 206 (8.0%) |
| Total | 10,974 (72.4%) | 4,184 (27.6%) |
Employment Characteristics in Contra Costa County
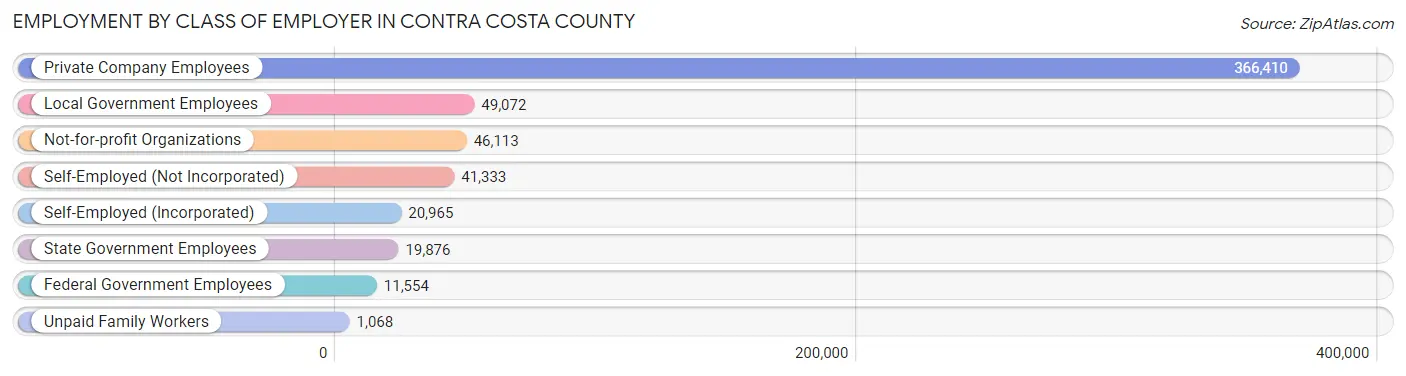
Employment by Class of Employer in Contra Costa County
Among the 556,391 employed individuals in Contra Costa County, private company employees (366,410 | 65.8%), local government employees (49,072 | 8.8%), and not-for-profit organizations (46,113 | 8.3%) make up the most common classes of employment.
| Employer Class | # Employees | % Employees |
| Private Company Employees | 366,410 | 65.8% |
| Self-Employed (Incorporated) | 20,965 | 3.8% |
| Self-Employed (Not Incorporated) | 41,333 | 7.4% |
| Not-for-profit Organizations | 46,113 | 8.3% |
| Local Government Employees | 49,072 | 8.8% |
| State Government Employees | 19,876 | 3.6% |
| Federal Government Employees | 11,554 | 2.1% |
| Unpaid Family Workers | 1,068 | 0.2% |
| Total | 556,391 | 100.0% |
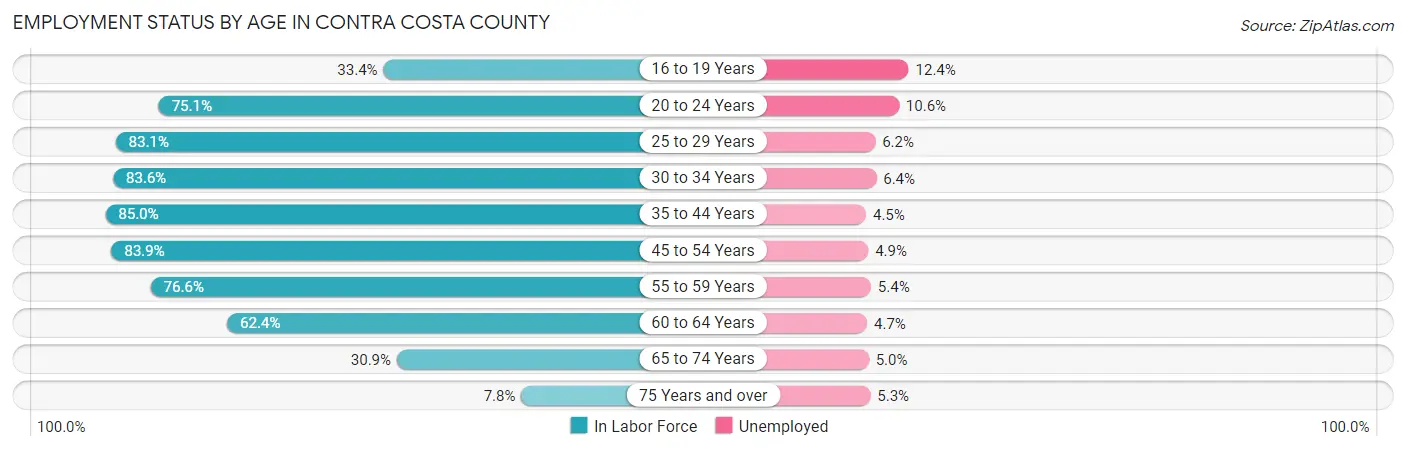
Employment Status by Age in Contra Costa County
According to the labor force statistics for Contra Costa County, out of the total population over 16 years of age (936,669), 65.1% or 609,772 individuals are in the labor force, with 5.8% or 35,367 of them unemployed. The age group with the highest labor force participation rate is 35 to 44 years, with 85.0% or 136,838 individuals in the labor force. Within the labor force, the 16 to 19 years age range has the highest percentage of unemployed individuals, with 12.4% or 2,493 of them being unemployed.
| Age Bracket | In Labor Force | Unemployed |
| 16 to 19 Years | 20,107 (33.4%) | 2,493 (12.4%) |
| 20 to 24 Years | 51,056 (75.1%) | 5,412 (10.6%) |
| 25 to 29 Years | 57,826 (83.1%) | 3,585 (6.2%) |
| 30 to 34 Years | 62,279 (83.6%) | 3,986 (6.4%) |
| 35 to 44 Years | 136,838 (85.0%) | 6,158 (4.5%) |
| 45 to 54 Years | 134,251 (83.9%) | 6,578 (4.9%) |
| 55 to 59 Years | 61,608 (76.6%) | 3,327 (5.4%) |
| 60 to 64 Years | 45,345 (62.4%) | 2,131 (4.7%) |
| 65 to 74 Years | 34,429 (30.9%) | 1,721 (5.0%) |
| 75 Years and over | 6,153 (7.8%) | 326 (5.3%) |
| Total | 609,772 (65.1%) | 35,367 (5.8%) |
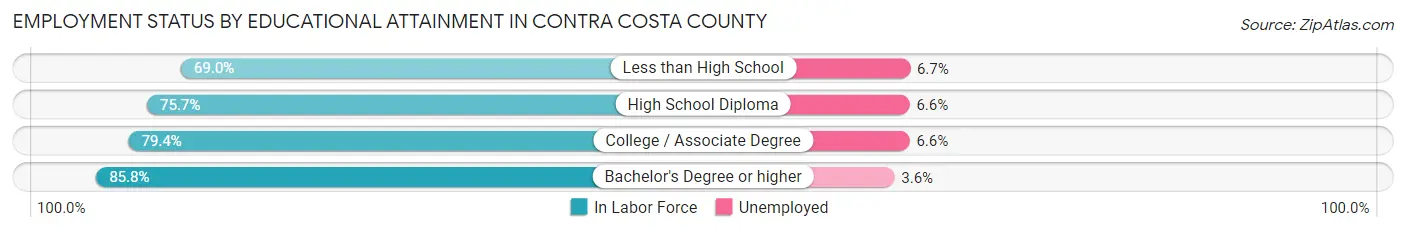
Employment Status by Educational Attainment in Contra Costa County
According to labor force statistics for Contra Costa County, 80.6% of individuals (498,251) out of the total population between 25 and 64 years of age (618,178) are in the labor force, with 5.2% or 25,909 of them being unemployed. The group with the highest labor force participation rate are those with the educational attainment of bachelor's degree or higher, with 85.8% or 238,523 individuals in the labor force. Within the labor force, individuals with less than high school education have the highest percentage of unemployment, with 6.7% or 2,973 of them being unemployed.
| Educational Attainment | In Labor Force | Unemployed |
| Less than High School | 44,371 (69.0%) | 4,309 (6.7%) |
| High School Diploma | 80,343 (75.7%) | 7,005 (6.6%) |
| College / Associate Degree | 134,774 (79.4%) | 11,203 (6.6%) |
| Bachelor's Degree or higher | 238,523 (85.8%) | 10,008 (3.6%) |
| Total | 498,251 (80.6%) | 32,145 (5.2%) |
Employment Occupations by Sex in Contra Costa County
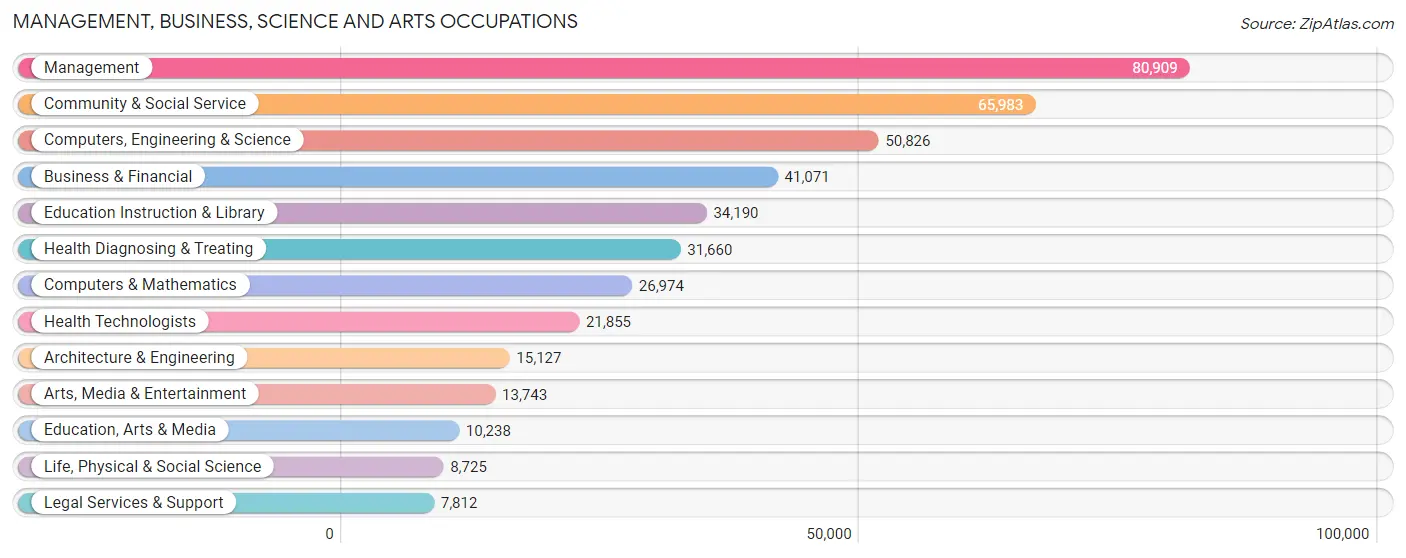
Management, Business, Science and Arts Occupations
The most common Management, Business, Science and Arts occupations in Contra Costa County are Management (80,909 | 14.1%), Community & Social Service (65,983 | 11.5%), Computers, Engineering & Science (50,826 | 8.9%), Business & Financial (41,071 | 7.2%), and Education Instruction & Library (34,190 | 6.0%).
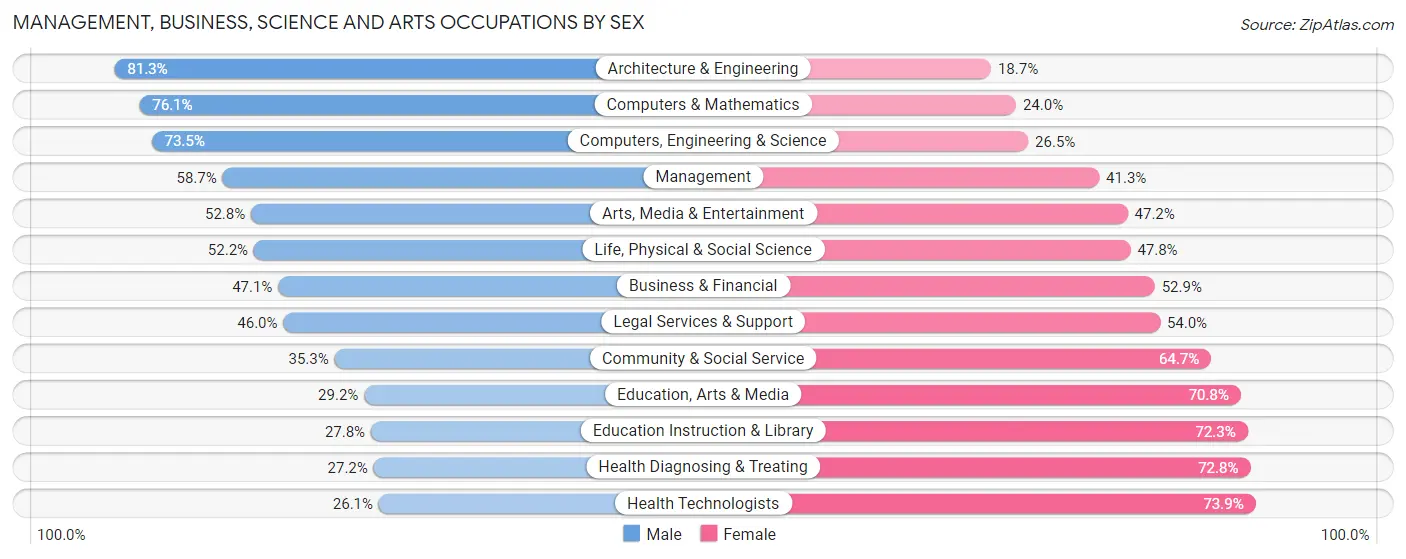
Management, Business, Science and Arts Occupations by Sex
Within the Management, Business, Science and Arts occupations in Contra Costa County, the most male-oriented occupations are Architecture & Engineering (81.3%), Computers & Mathematics (76.0%), and Computers, Engineering & Science (73.5%), while the most female-oriented occupations are Health Technologists (73.9%), Health Diagnosing & Treating (72.8%), and Education Instruction & Library (72.3%).
| Occupation | Male | Female |
| Management | 47,494 (58.7%) | 33,415 (41.3%) |
| Business & Financial | 19,346 (47.1%) | 21,725 (52.9%) |
| Computers, Engineering & Science | 37,360 (73.5%) | 13,466 (26.5%) |
| Computers & Mathematics | 20,514 (76.0%) | 6,460 (23.9%) |
| Architecture & Engineering | 12,294 (81.3%) | 2,833 (18.7%) |
| Life, Physical & Social Science | 4,552 (52.2%) | 4,173 (47.8%) |
| Community & Social Service | 23,320 (35.3%) | 42,663 (64.7%) |
| Education, Arts & Media | 2,986 (29.2%) | 7,252 (70.8%) |
| Legal Services & Support | 3,595 (46.0%) | 4,217 (54.0%) |
| Education Instruction & Library | 9,487 (27.8%) | 24,703 (72.3%) |
| Arts, Media & Entertainment | 7,252 (52.8%) | 6,491 (47.2%) |
| Health Diagnosing & Treating | 8,608 (27.2%) | 23,052 (72.8%) |
| Health Technologists | 5,704 (26.1%) | 16,151 (73.9%) |
| Total (Category) | 136,128 (50.3%) | 134,321 (49.7%) |
| Total (Overall) | 305,758 (53.3%) | 267,895 (46.7%) |
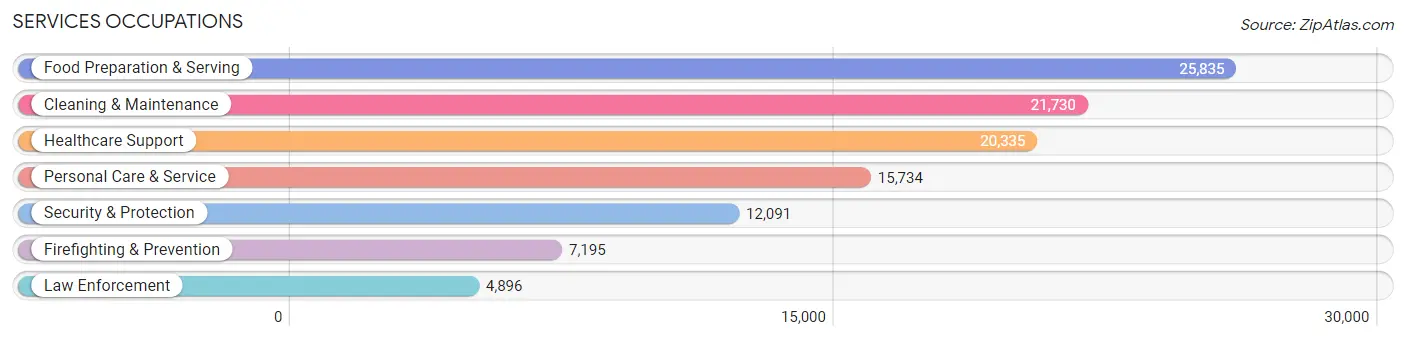
Services Occupations
The most common Services occupations in Contra Costa County are Food Preparation & Serving (25,835 | 4.5%), Cleaning & Maintenance (21,730 | 3.8%), Healthcare Support (20,335 | 3.5%), Personal Care & Service (15,734 | 2.7%), and Security & Protection (12,091 | 2.1%).
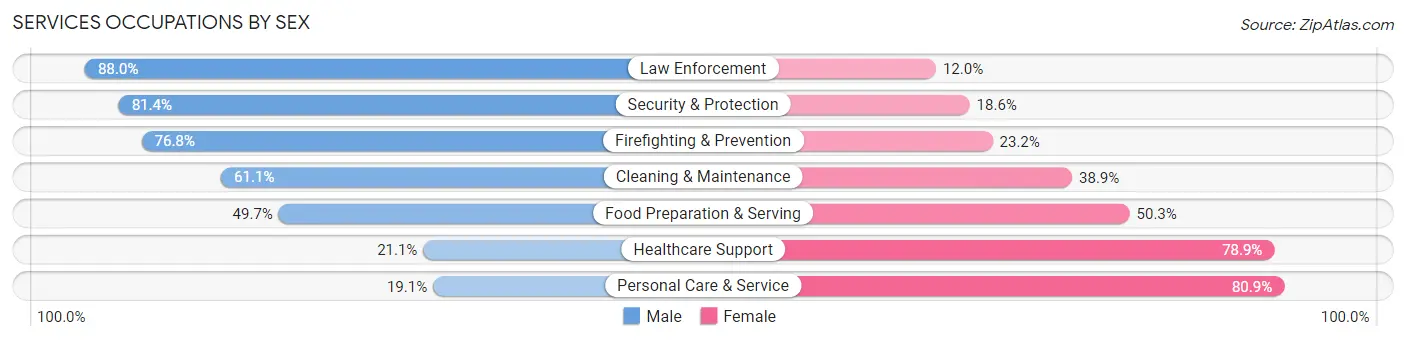
Services Occupations by Sex
Within the Services occupations in Contra Costa County, the most male-oriented occupations are Law Enforcement (88.0%), Security & Protection (81.4%), and Firefighting & Prevention (76.8%), while the most female-oriented occupations are Personal Care & Service (80.9%), Healthcare Support (78.9%), and Food Preparation & Serving (50.3%).
| Occupation | Male | Female |
| Healthcare Support | 4,284 (21.1%) | 16,051 (78.9%) |
| Security & Protection | 9,837 (81.4%) | 2,254 (18.6%) |
| Firefighting & Prevention | 5,527 (76.8%) | 1,668 (23.2%) |
| Law Enforcement | 4,310 (88.0%) | 586 (12.0%) |
| Food Preparation & Serving | 12,838 (49.7%) | 12,997 (50.3%) |
| Cleaning & Maintenance | 13,273 (61.1%) | 8,457 (38.9%) |
| Personal Care & Service | 3,010 (19.1%) | 12,724 (80.9%) |
| Total (Category) | 43,242 (45.2%) | 52,483 (54.8%) |
| Total (Overall) | 305,758 (53.3%) | 267,895 (46.7%) |
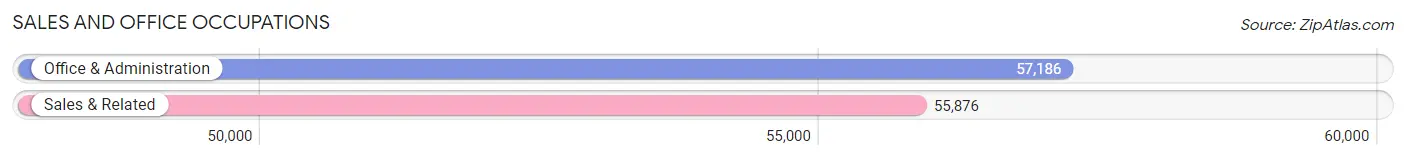
Sales and Office Occupations
The most common Sales and Office occupations in Contra Costa County are Office & Administration (57,186 | 10.0%), and Sales & Related (55,876 | 9.7%).
Sales and Office Occupations by Sex
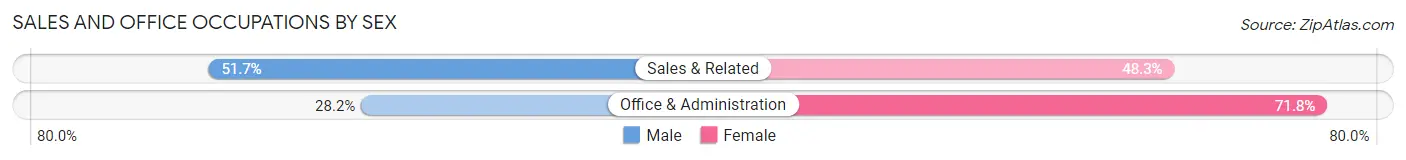
| Occupation | Male | Female |
| Sales & Related | 28,892 (51.7%) | 26,984 (48.3%) |
| Office & Administration | 16,138 (28.2%) | 41,048 (71.8%) |
| Total (Category) | 45,030 (39.8%) | 68,032 (60.2%) |
| Total (Overall) | 305,758 (53.3%) | 267,895 (46.7%) |
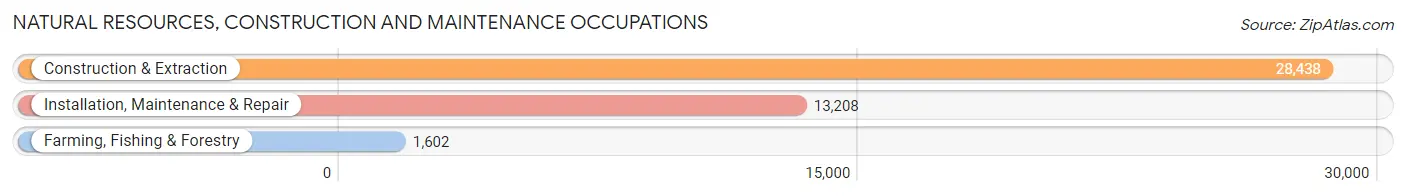
Natural Resources, Construction and Maintenance Occupations
The most common Natural Resources, Construction and Maintenance occupations in Contra Costa County are Construction & Extraction (28,438 | 5.0%), Installation, Maintenance & Repair (13,208 | 2.3%), and Farming, Fishing & Forestry (1,602 | 0.3%).
Natural Resources, Construction and Maintenance Occupations by Sex
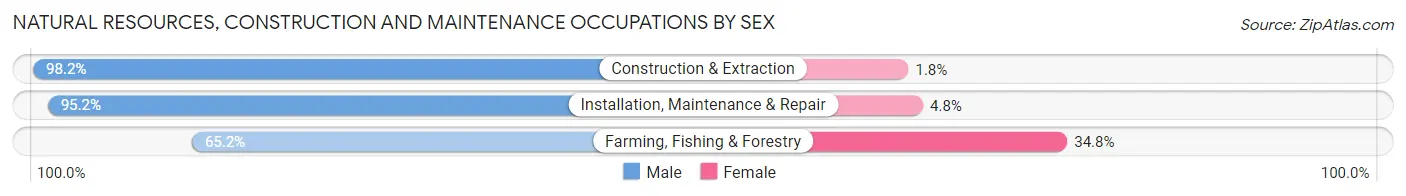
| Occupation | Male | Female |
| Farming, Fishing & Forestry | 1,044 (65.2%) | 558 (34.8%) |
| Construction & Extraction | 27,930 (98.2%) | 508 (1.8%) |
| Installation, Maintenance & Repair | 12,571 (95.2%) | 637 (4.8%) |
| Total (Category) | 41,545 (96.1%) | 1,703 (3.9%) |
| Total (Overall) | 305,758 (53.3%) | 267,895 (46.7%) |
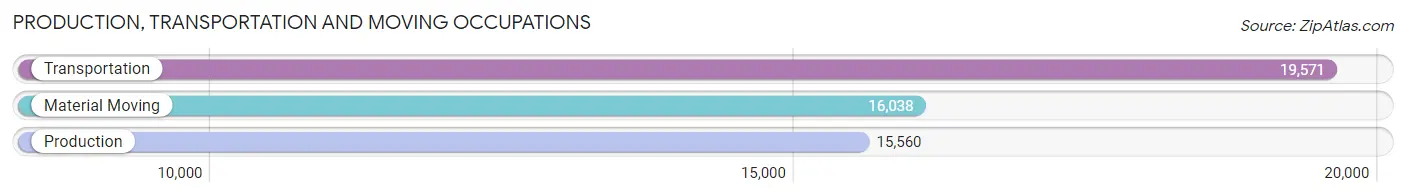
Production, Transportation and Moving Occupations
The most common Production, Transportation and Moving occupations in Contra Costa County are Transportation (19,571 | 3.4%), Material Moving (16,038 | 2.8%), and Production (15,560 | 2.7%).
Production, Transportation and Moving Occupations by Sex
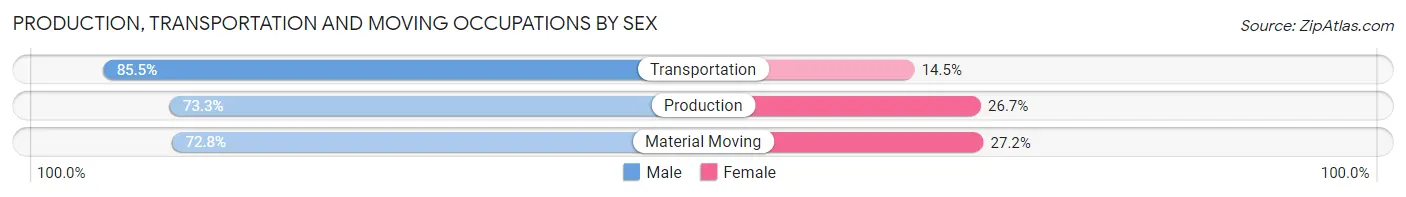
| Occupation | Male | Female |
| Production | 11,404 (73.3%) | 4,156 (26.7%) |
| Transportation | 16,728 (85.5%) | 2,843 (14.5%) |
| Material Moving | 11,681 (72.8%) | 4,357 (27.2%) |
| Total (Category) | 39,813 (77.8%) | 11,356 (22.2%) |
| Total (Overall) | 305,758 (53.3%) | 267,895 (46.7%) |
Employment Industries by Sex in Contra Costa County
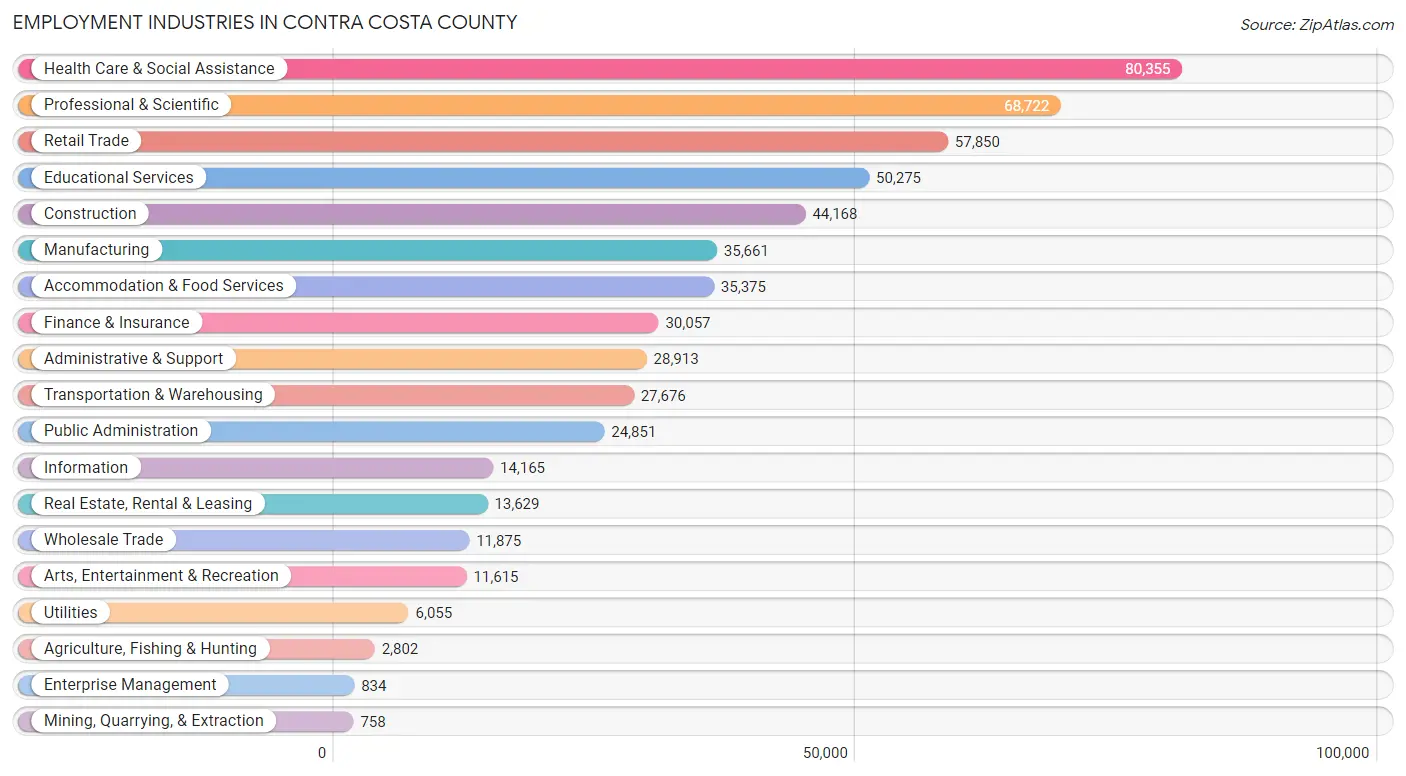
Employment Industries in Contra Costa County
The major employment industries in Contra Costa County include Health Care & Social Assistance (80,355 | 14.0%), Professional & Scientific (68,722 | 12.0%), Retail Trade (57,850 | 10.1%), Educational Services (50,275 | 8.8%), and Construction (44,168 | 7.7%).
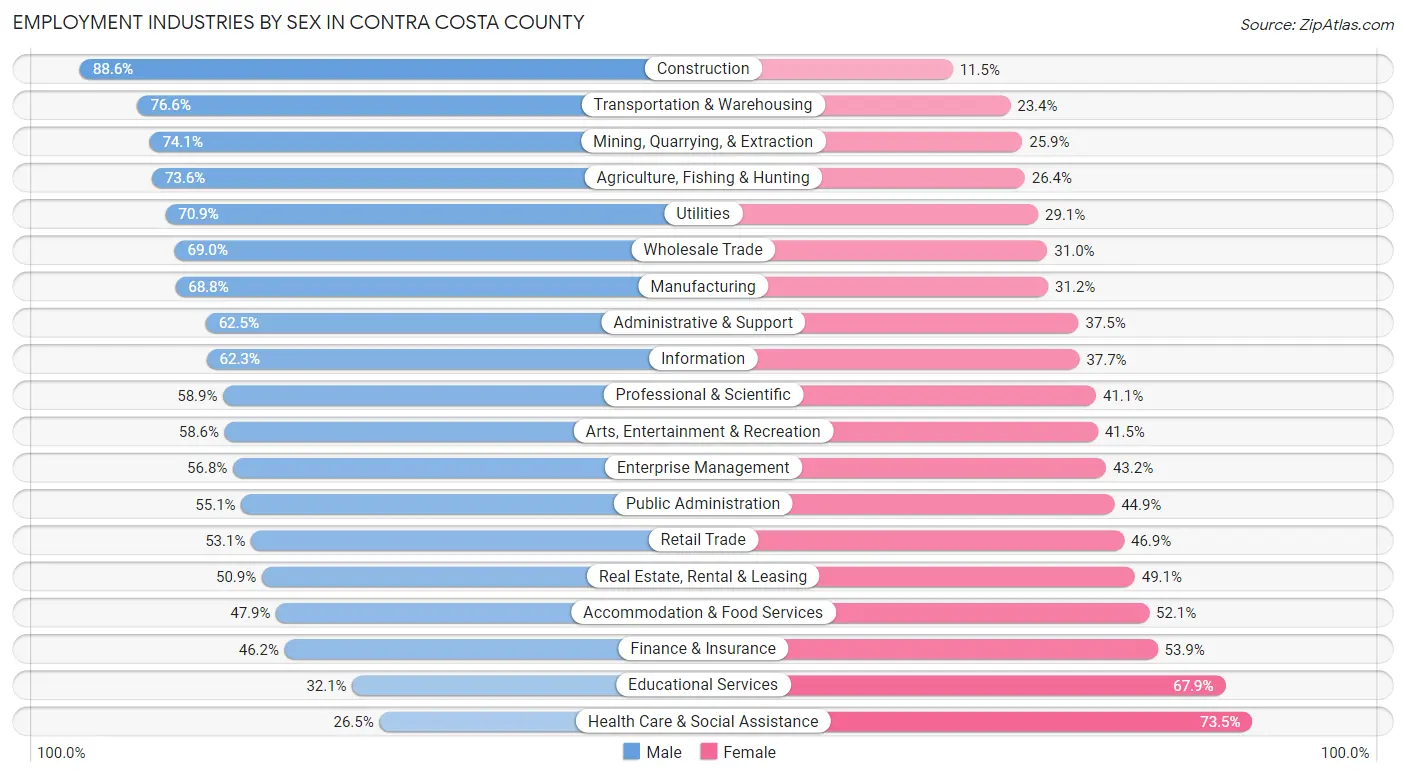
Employment Industries by Sex in Contra Costa County
The Contra Costa County industries that see more men than women are Construction (88.5%), Transportation & Warehousing (76.6%), and Mining, Quarrying, & Extraction (74.1%), whereas the industries that tend to have a higher number of women are Health Care & Social Assistance (73.5%), Educational Services (67.9%), and Finance & Insurance (53.8%).
| Industry | Male | Female |
| Agriculture, Fishing & Hunting | 2,063 (73.6%) | 739 (26.4%) |
| Mining, Quarrying, & Extraction | 562 (74.1%) | 196 (25.9%) |
| Construction | 39,110 (88.5%) | 5,058 (11.5%) |
| Manufacturing | 24,536 (68.8%) | 11,125 (31.2%) |
| Wholesale Trade | 8,189 (69.0%) | 3,686 (31.0%) |
| Retail Trade | 30,713 (53.1%) | 27,137 (46.9%) |
| Transportation & Warehousing | 21,209 (76.6%) | 6,467 (23.4%) |
| Utilities | 4,292 (70.9%) | 1,763 (29.1%) |
| Information | 8,827 (62.3%) | 5,338 (37.7%) |
| Finance & Insurance | 13,870 (46.2%) | 16,187 (53.8%) |
| Real Estate, Rental & Leasing | 6,932 (50.9%) | 6,697 (49.1%) |
| Professional & Scientific | 40,462 (58.9%) | 28,260 (41.1%) |
| Enterprise Management | 474 (56.8%) | 360 (43.2%) |
| Administrative & Support | 18,071 (62.5%) | 10,842 (37.5%) |
| Educational Services | 16,160 (32.1%) | 34,115 (67.9%) |
| Health Care & Social Assistance | 21,329 (26.5%) | 59,026 (73.5%) |
| Arts, Entertainment & Recreation | 6,801 (58.6%) | 4,814 (41.4%) |
| Accommodation & Food Services | 16,946 (47.9%) | 18,429 (52.1%) |
| Public Administration | 13,700 (55.1%) | 11,151 (44.9%) |
| Total | 305,758 (53.3%) | 267,895 (46.7%) |
Education in Contra Costa County
School Enrollment in Contra Costa County
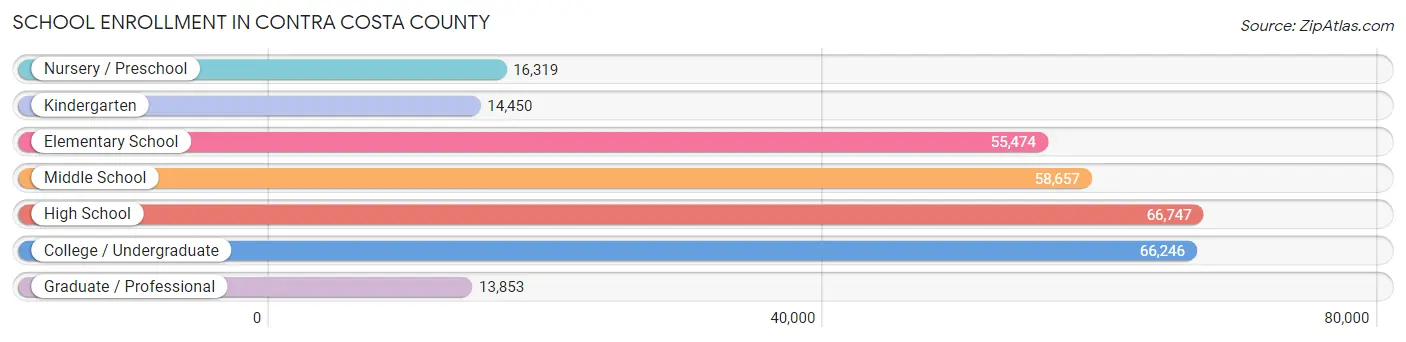
The most common levels of schooling among the 291,746 students in Contra Costa County are high school (66,747 | 22.9%), college / undergraduate (66,246 | 22.7%), and middle school (58,657 | 20.1%).
| School Level | # Students | % Students |
| Nursery / Preschool | 16,319 | 5.6% |
| Kindergarten | 14,450 | 5.0% |
| Elementary School | 55,474 | 19.0% |
| Middle School | 58,657 | 20.1% |
| High School | 66,747 | 22.9% |
| College / Undergraduate | 66,246 | 22.7% |
| Graduate / Professional | 13,853 | 4.8% |
| Total | 291,746 | 100.0% |
School Enrollment by Age by Funding Source in Contra Costa County
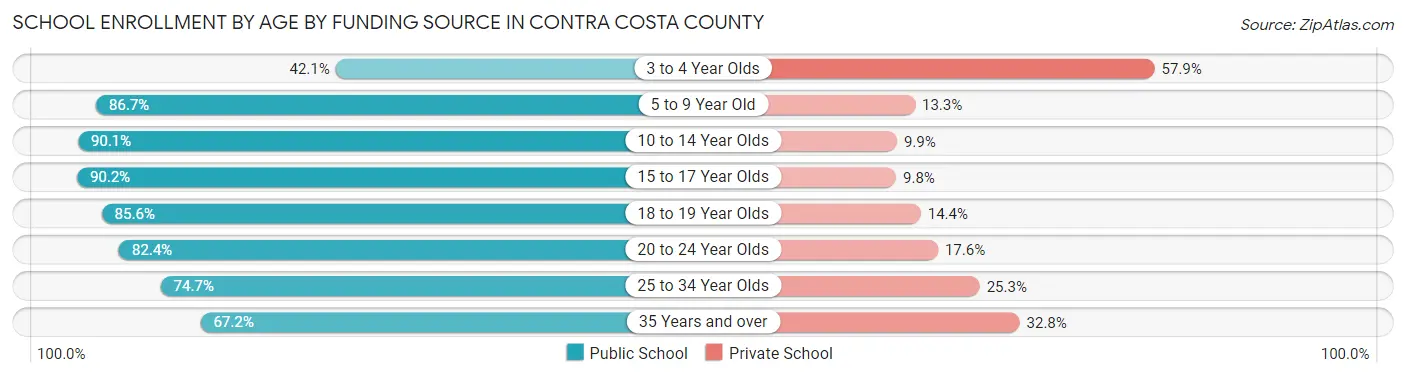
Out of a total of 291,746 students who are enrolled in schools in Contra Costa County, 47,555 (16.3%) attend a private institution, while the remaining 244,191 (83.7%) are enrolled in public schools. The age group of 3 to 4 year olds has the highest likelihood of being enrolled in private schools, with 7,597 (57.9% in the age bracket) enrolled. Conversely, the age group of 15 to 17 year olds has the lowest likelihood of being enrolled in a private school, with 42,197 (90.2% in the age bracket) attending a public institution.
| Age Bracket | Public School | Private School |
| 3 to 4 Year Olds | 5,522 (42.1%) | 7,597 (57.9%) |
| 5 to 9 Year Old | 57,875 (86.7%) | 8,870 (13.3%) |
| 10 to 14 Year Olds | 68,343 (90.1%) | 7,532 (9.9%) |
| 15 to 17 Year Olds | 42,197 (90.2%) | 4,562 (9.8%) |
| 18 to 19 Year Olds | 18,990 (85.6%) | 3,184 (14.4%) |
| 20 to 24 Year Olds | 26,201 (82.4%) | 5,585 (17.6%) |
| 25 to 34 Year Olds | 13,610 (74.7%) | 4,620 (25.3%) |
| 35 Years and over | 11,468 (67.2%) | 5,590 (32.8%) |
| Total | 244,191 (83.7%) | 47,555 (16.3%) |
Educational Attainment by Field of Study in Contra Costa County
Business (69,358 | 17.9%), social sciences (42,259 | 10.9%), engineering (39,877 | 10.3%), science & technology (32,478 | 8.4%), and bio, nature & agricultural (27,815 | 7.2%) are the most common fields of study among 386,649 individuals in Contra Costa County who have obtained a bachelor's degree or higher.
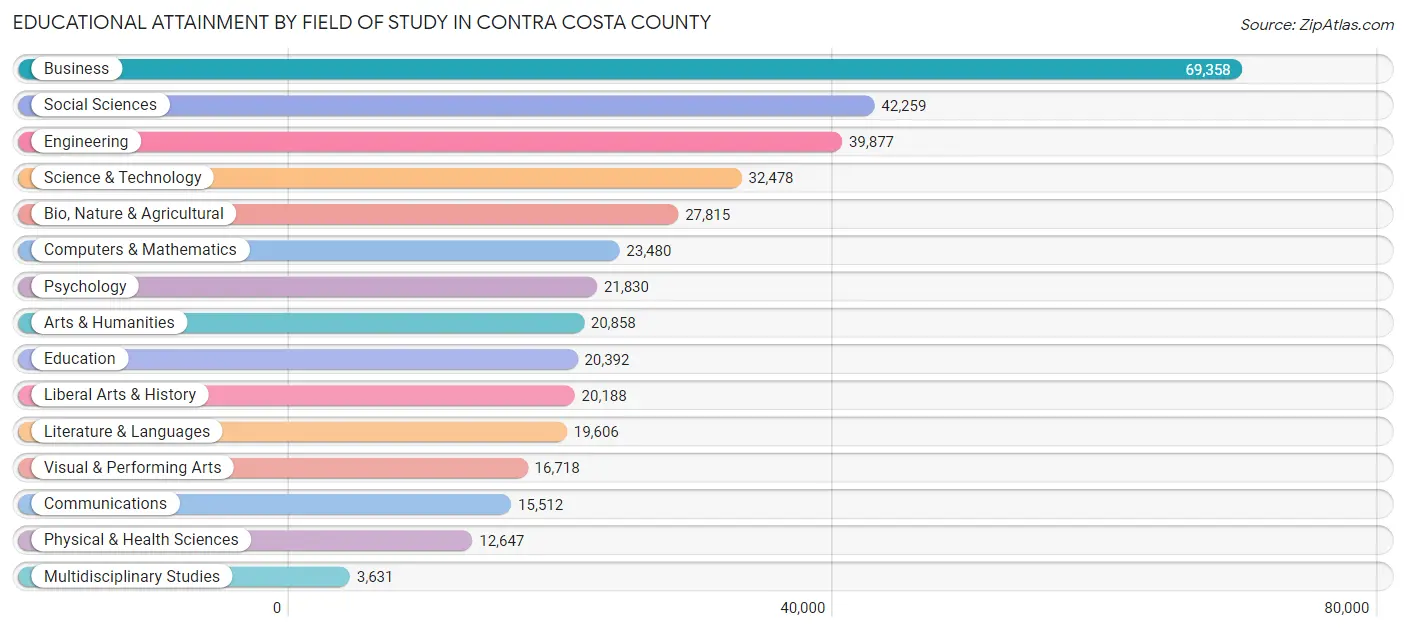
| Field of Study | # Graduates | % Graduates |
| Computers & Mathematics | 23,480 | 6.1% |
| Bio, Nature & Agricultural | 27,815 | 7.2% |
| Physical & Health Sciences | 12,647 | 3.3% |
| Psychology | 21,830 | 5.7% |
| Social Sciences | 42,259 | 10.9% |
| Engineering | 39,877 | 10.3% |
| Multidisciplinary Studies | 3,631 | 0.9% |
| Science & Technology | 32,478 | 8.4% |
| Business | 69,358 | 17.9% |
| Education | 20,392 | 5.3% |
| Literature & Languages | 19,606 | 5.1% |
| Liberal Arts & History | 20,188 | 5.2% |
| Visual & Performing Arts | 16,718 | 4.3% |
| Communications | 15,512 | 4.0% |
| Arts & Humanities | 20,858 | 5.4% |
| Total | 386,649 | 100.0% |
Transportation & Commute in Contra Costa County
Vehicle Availability by Sex in Contra Costa County
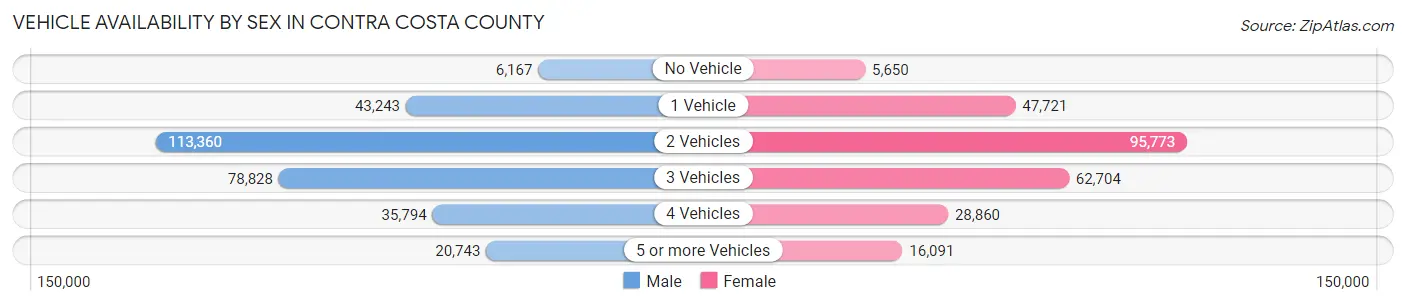
The most prevalent vehicle ownership categories in Contra Costa County are males with 2 vehicles (113,360, accounting for 38.0%) and females with 2 vehicles (95,773, making up 44.1%).
| Vehicles Available | Male | Female |
| No Vehicle | 6,167 (2.1%) | 5,650 (2.2%) |
| 1 Vehicle | 43,243 (14.5%) | 47,721 (18.6%) |
| 2 Vehicles | 113,360 (38.0%) | 95,773 (37.3%) |
| 3 Vehicles | 78,828 (26.4%) | 62,704 (24.4%) |
| 4 Vehicles | 35,794 (12.0%) | 28,860 (11.2%) |
| 5 or more Vehicles | 20,743 (7.0%) | 16,091 (6.3%) |
| Total | 298,135 (100.0%) | 256,799 (100.0%) |
Commute Time in Contra Costa County
The most frequently occuring commute durations in Contra Costa County are 60 to 89 minutes (69,729 commuters, 15.1%), 45 to 59 minutes (54,760 commuters, 11.8%), and 15 to 19 minutes (54,446 commuters, 11.8%).
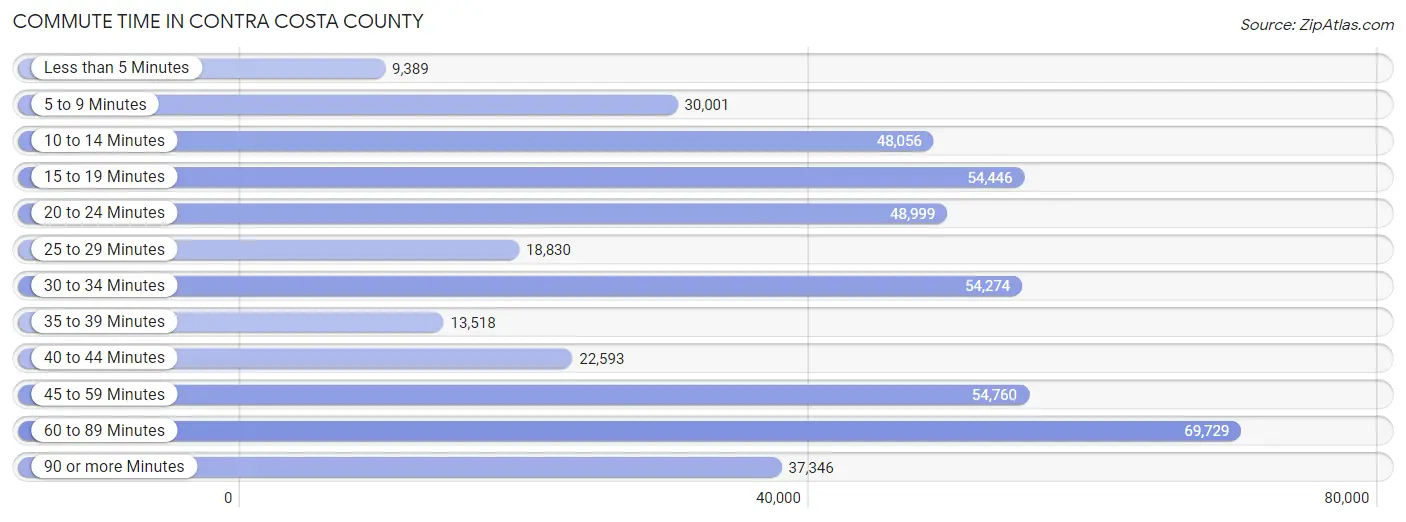
| Commute Time | # Commuters | % Commuters |
| Less than 5 Minutes | 9,389 | 2.0% |
| 5 to 9 Minutes | 30,001 | 6.5% |
| 10 to 14 Minutes | 48,056 | 10.4% |
| 15 to 19 Minutes | 54,446 | 11.8% |
| 20 to 24 Minutes | 48,999 | 10.6% |
| 25 to 29 Minutes | 18,830 | 4.1% |
| 30 to 34 Minutes | 54,274 | 11.7% |
| 35 to 39 Minutes | 13,518 | 2.9% |
| 40 to 44 Minutes | 22,593 | 4.9% |
| 45 to 59 Minutes | 54,760 | 11.8% |
| 60 to 89 Minutes | 69,729 | 15.1% |
| 90 or more Minutes | 37,346 | 8.1% |
Commute Time by Sex in Contra Costa County
The most common commute times in Contra Costa County are 60 to 89 minutes (42,796 commuters, 17.0%) for males and 15 to 19 minutes (28,805 commuters, 13.7%) for females.
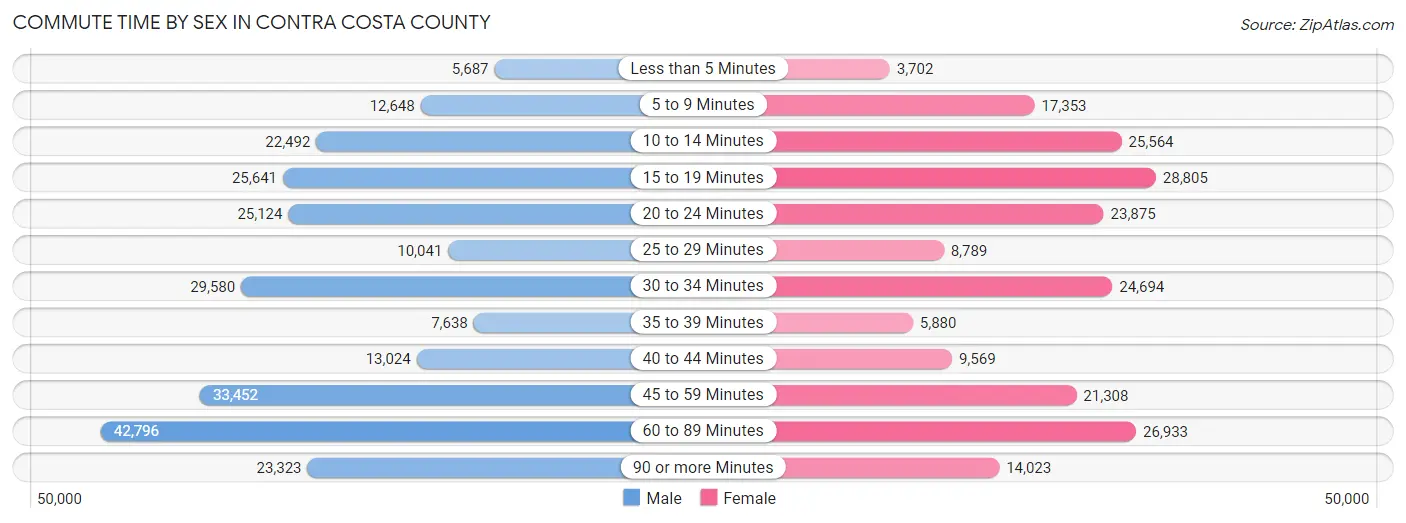
| Commute Time | Male | Female |
| Less than 5 Minutes | 5,687 (2.3%) | 3,702 (1.8%) |
| 5 to 9 Minutes | 12,648 (5.0%) | 17,353 (8.2%) |
| 10 to 14 Minutes | 22,492 (8.9%) | 25,564 (12.1%) |
| 15 to 19 Minutes | 25,641 (10.2%) | 28,805 (13.7%) |
| 20 to 24 Minutes | 25,124 (10.0%) | 23,875 (11.3%) |
| 25 to 29 Minutes | 10,041 (4.0%) | 8,789 (4.2%) |
| 30 to 34 Minutes | 29,580 (11.8%) | 24,694 (11.7%) |
| 35 to 39 Minutes | 7,638 (3.0%) | 5,880 (2.8%) |
| 40 to 44 Minutes | 13,024 (5.2%) | 9,569 (4.5%) |
| 45 to 59 Minutes | 33,452 (13.3%) | 21,308 (10.1%) |
| 60 to 89 Minutes | 42,796 (17.0%) | 26,933 (12.8%) |
| 90 or more Minutes | 23,323 (9.3%) | 14,023 (6.7%) |
Time of Departure to Work by Sex in Contra Costa County
The most frequent times of departure to work in Contra Costa County are 7:00 AM to 7:29 AM (31,097, 12.4%) for males and 7:00 AM to 7:29 AM (27,843, 13.2%) for females.
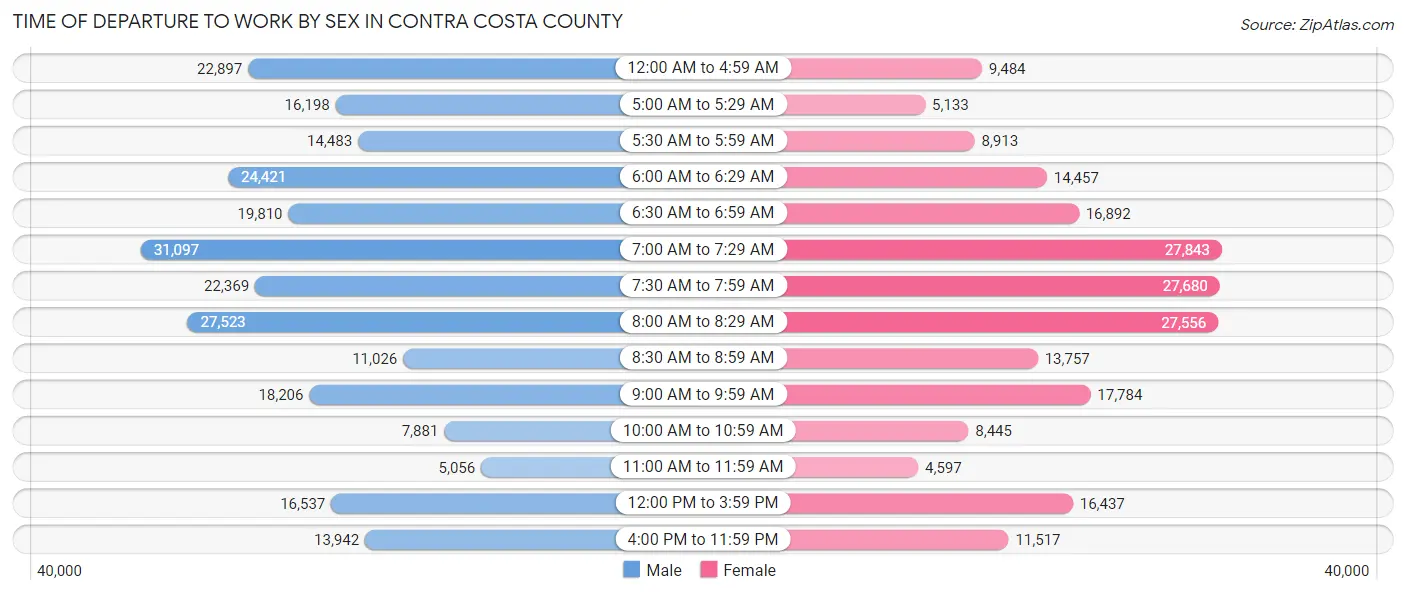
| Time of Departure | Male | Female |
| 12:00 AM to 4:59 AM | 22,897 (9.1%) | 9,484 (4.5%) |
| 5:00 AM to 5:29 AM | 16,198 (6.4%) | 5,133 (2.4%) |
| 5:30 AM to 5:59 AM | 14,483 (5.8%) | 8,913 (4.2%) |
| 6:00 AM to 6:29 AM | 24,421 (9.7%) | 14,457 (6.9%) |
| 6:30 AM to 6:59 AM | 19,810 (7.9%) | 16,892 (8.0%) |
| 7:00 AM to 7:29 AM | 31,097 (12.4%) | 27,843 (13.2%) |
| 7:30 AM to 7:59 AM | 22,369 (8.9%) | 27,680 (13.2%) |
| 8:00 AM to 8:29 AM | 27,523 (11.0%) | 27,556 (13.1%) |
| 8:30 AM to 8:59 AM | 11,026 (4.4%) | 13,757 (6.5%) |
| 9:00 AM to 9:59 AM | 18,206 (7.2%) | 17,784 (8.5%) |
| 10:00 AM to 10:59 AM | 7,881 (3.1%) | 8,445 (4.0%) |
| 11:00 AM to 11:59 AM | 5,056 (2.0%) | 4,597 (2.2%) |
| 12:00 PM to 3:59 PM | 16,537 (6.6%) | 16,437 (7.8%) |
| 4:00 PM to 11:59 PM | 13,942 (5.5%) | 11,517 (5.5%) |
| Total | 251,446 (100.0%) | 210,495 (100.0%) |
Housing Occupancy in Contra Costa County
Occupancy by Ownership in Contra Costa County
Of the total 408,537 dwellings in Contra Costa County, owner-occupied units account for 274,388 (67.2%), while renter-occupied units make up 134,149 (32.8%).
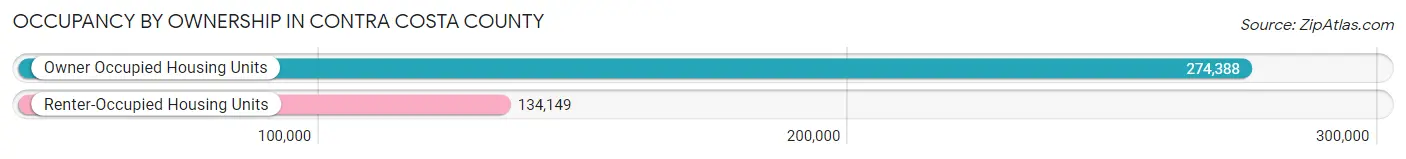
| Occupancy | # Housing Units | % Housing Units |
| Owner Occupied Housing Units | 274,388 | 67.2% |
| Renter-Occupied Housing Units | 134,149 | 32.8% |
| Total Occupied Housing Units | 408,537 | 100.0% |
Occupancy by Household Size in Contra Costa County
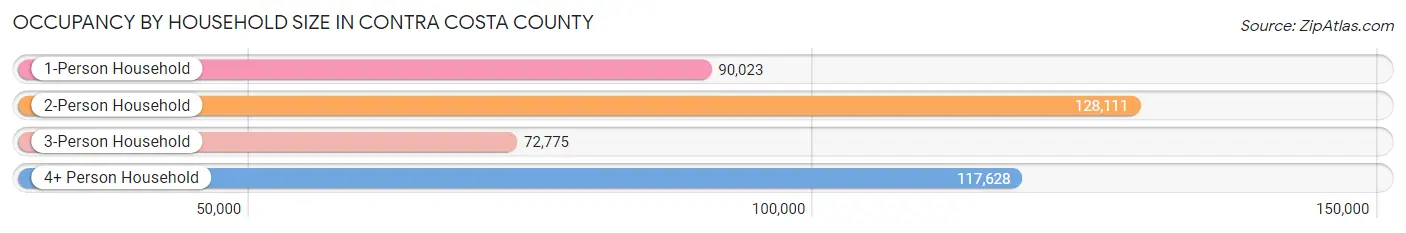
| Household Size | # Housing Units | % Housing Units |
| 1-Person Household | 90,023 | 22.0% |
| 2-Person Household | 128,111 | 31.4% |
| 3-Person Household | 72,775 | 17.8% |
| 4+ Person Household | 117,628 | 28.8% |
| Total Housing Units | 408,537 | 100.0% |
Occupancy by Ownership by Household Size in Contra Costa County
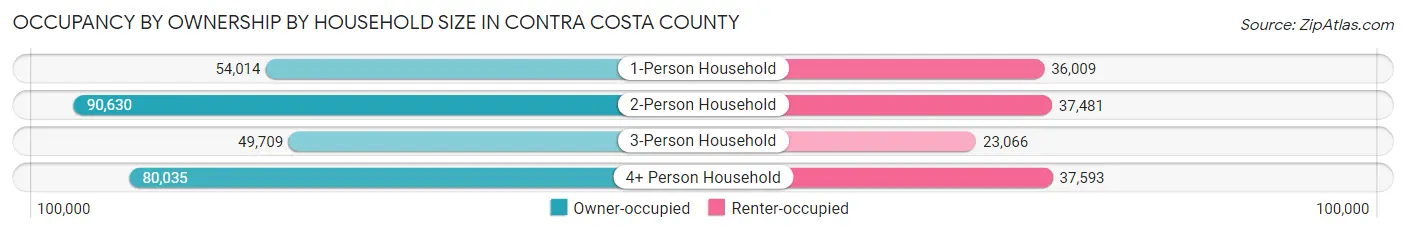
| Household Size | Owner-occupied | Renter-occupied |
| 1-Person Household | 54,014 (60.0%) | 36,009 (40.0%) |
| 2-Person Household | 90,630 (70.7%) | 37,481 (29.3%) |
| 3-Person Household | 49,709 (68.3%) | 23,066 (31.7%) |
| 4+ Person Household | 80,035 (68.0%) | 37,593 (32.0%) |
| Total Housing Units | 274,388 (67.2%) | 134,149 (32.8%) |
Occupancy by Educational Attainment in Contra Costa County
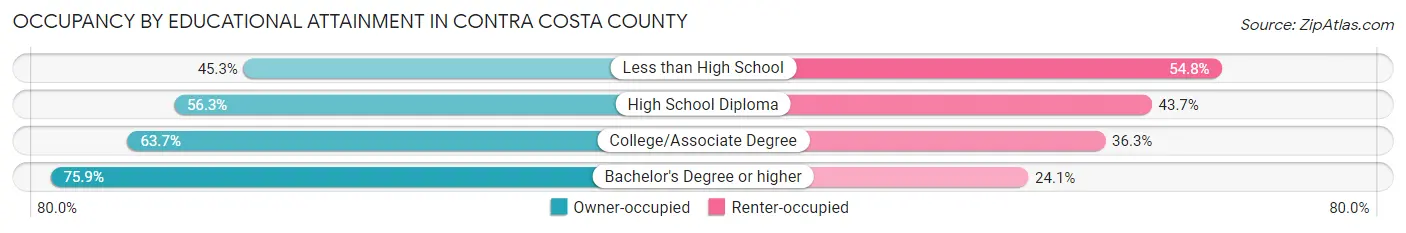
| Household Size | Owner-occupied | Renter-occupied |
| Less than High School | 14,068 (45.3%) | 17,019 (54.7%) |
| High School Diploma | 33,451 (56.3%) | 25,954 (43.7%) |
| College/Associate Degree | 75,657 (63.7%) | 43,147 (36.3%) |
| Bachelor's Degree or higher | 151,212 (75.9%) | 48,029 (24.1%) |
Occupancy by Age of Householder in Contra Costa County
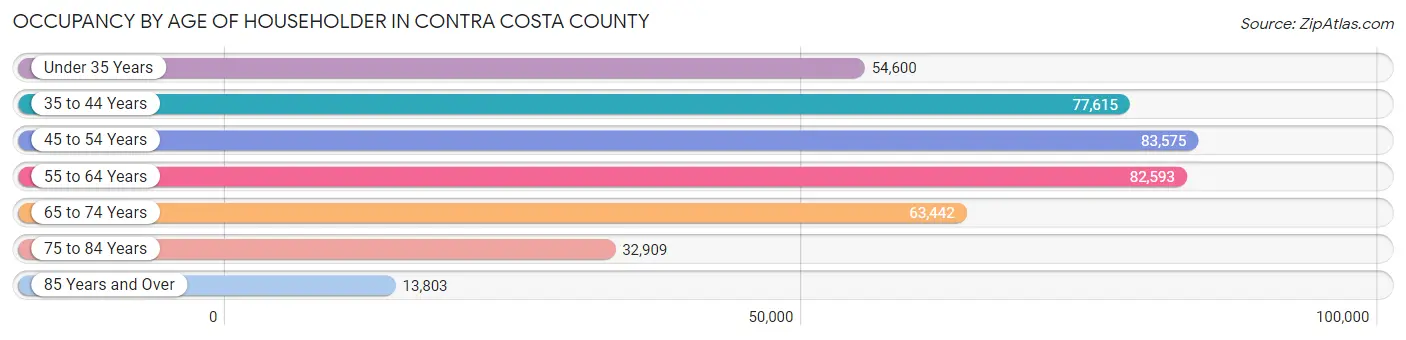
| Age Bracket | # Households | % Households |
| Under 35 Years | 54,600 | 13.4% |
| 35 to 44 Years | 77,615 | 19.0% |
| 45 to 54 Years | 83,575 | 20.5% |
| 55 to 64 Years | 82,593 | 20.2% |
| 65 to 74 Years | 63,442 | 15.5% |
| 75 to 84 Years | 32,909 | 8.1% |
| 85 Years and Over | 13,803 | 3.4% |
| Total | 408,537 | 100.0% |
Housing Finances in Contra Costa County
Median Income by Occupancy in Contra Costa County
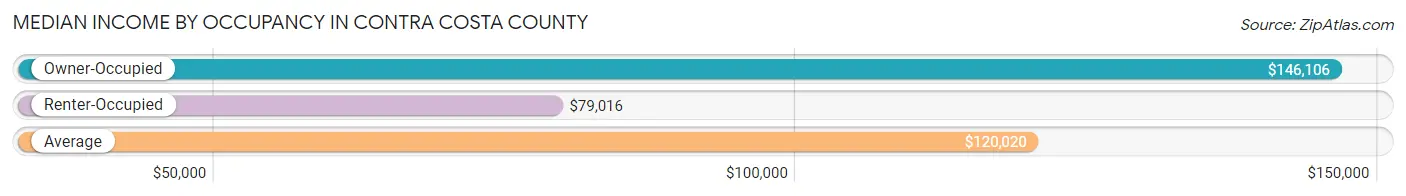
| Occupancy Type | # Households | Median Income |
| Owner-Occupied | 274,388 (67.2%) | $146,106 |
| Renter-Occupied | 134,149 (32.8%) | $79,016 |
| Average | 408,537 (100.0%) | $120,020 |
Occupancy by Householder Income Bracket in Contra Costa County
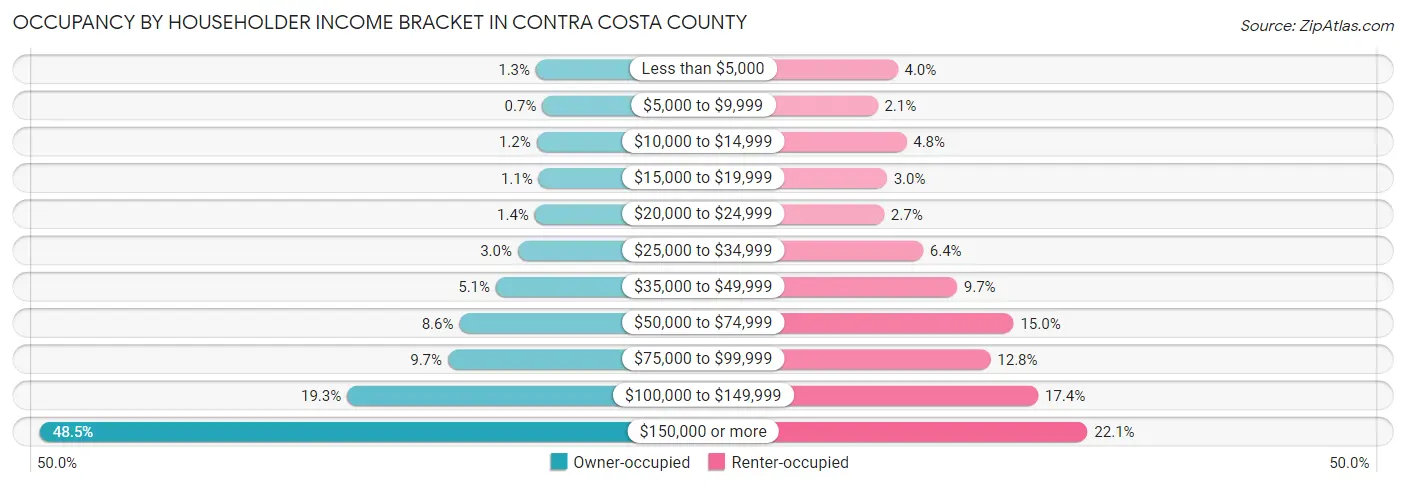
| Income Bracket | Owner-occupied | Renter-occupied |
| Less than $5,000 | 3,606 (1.3%) | 5,366 (4.0%) |
| $5,000 to $9,999 | 1,921 (0.7%) | 2,803 (2.1%) |
| $10,000 to $14,999 | 3,394 (1.2%) | 6,483 (4.8%) |
| $15,000 to $19,999 | 2,879 (1.1%) | 3,989 (3.0%) |
| $20,000 to $24,999 | 3,894 (1.4%) | 3,624 (2.7%) |
| $25,000 to $34,999 | 8,327 (3.0%) | 8,594 (6.4%) |
| $35,000 to $49,999 | 14,056 (5.1%) | 12,942 (9.7%) |
| $50,000 to $74,999 | 23,594 (8.6%) | 20,179 (15.0%) |
| $75,000 to $99,999 | 26,588 (9.7%) | 17,225 (12.8%) |
| $100,000 to $149,999 | 52,936 (19.3%) | 23,318 (17.4%) |
| $150,000 or more | 133,193 (48.5%) | 29,626 (22.1%) |
| Total | 274,388 (100.0%) | 134,149 (100.0%) |
Monthly Housing Cost Tiers in Contra Costa County
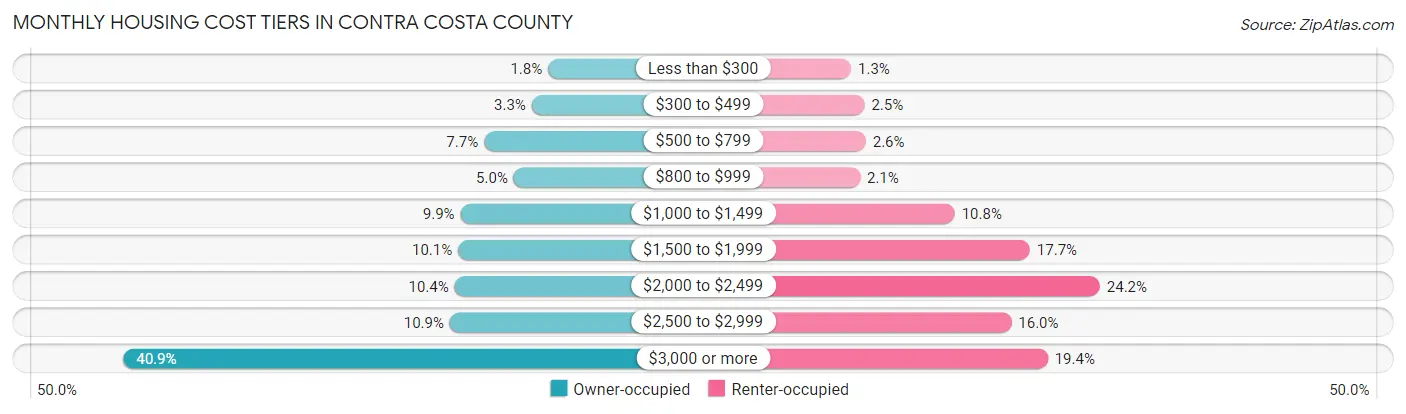
| Monthly Cost | Owner-occupied | Renter-occupied |
| Less than $300 | 4,973 (1.8%) | 1,686 (1.3%) |
| $300 to $499 | 9,120 (3.3%) | 3,338 (2.5%) |
| $500 to $799 | 21,145 (7.7%) | 3,499 (2.6%) |
| $800 to $999 | 13,647 (5.0%) | 2,794 (2.1%) |
| $1,000 to $1,499 | 27,119 (9.9%) | 14,484 (10.8%) |
| $1,500 to $1,999 | 27,719 (10.1%) | 23,769 (17.7%) |
| $2,000 to $2,499 | 28,595 (10.4%) | 32,417 (24.2%) |
| $2,500 to $2,999 | 29,811 (10.9%) | 21,478 (16.0%) |
| $3,000 or more | 112,259 (40.9%) | 25,966 (19.4%) |
| Total | 274,388 (100.0%) | 134,149 (100.0%) |
Physical Housing Characteristics in Contra Costa County
Housing Structures in Contra Costa County
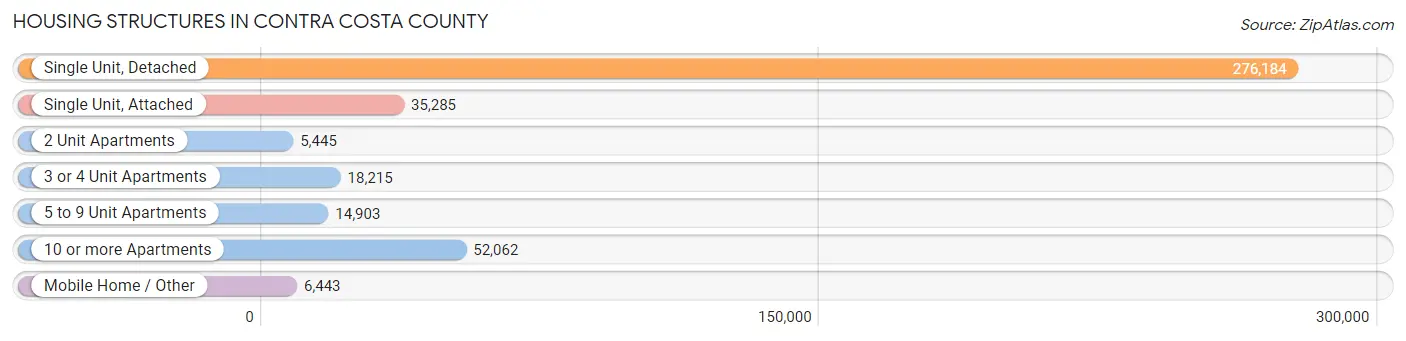
| Structure Type | # Housing Units | % Housing Units |
| Single Unit, Detached | 276,184 | 67.6% |
| Single Unit, Attached | 35,285 | 8.6% |
| 2 Unit Apartments | 5,445 | 1.3% |
| 3 or 4 Unit Apartments | 18,215 | 4.5% |
| 5 to 9 Unit Apartments | 14,903 | 3.6% |
| 10 or more Apartments | 52,062 | 12.7% |
| Mobile Home / Other | 6,443 | 1.6% |
| Total | 408,537 | 100.0% |
Housing Structures by Occupancy in Contra Costa County
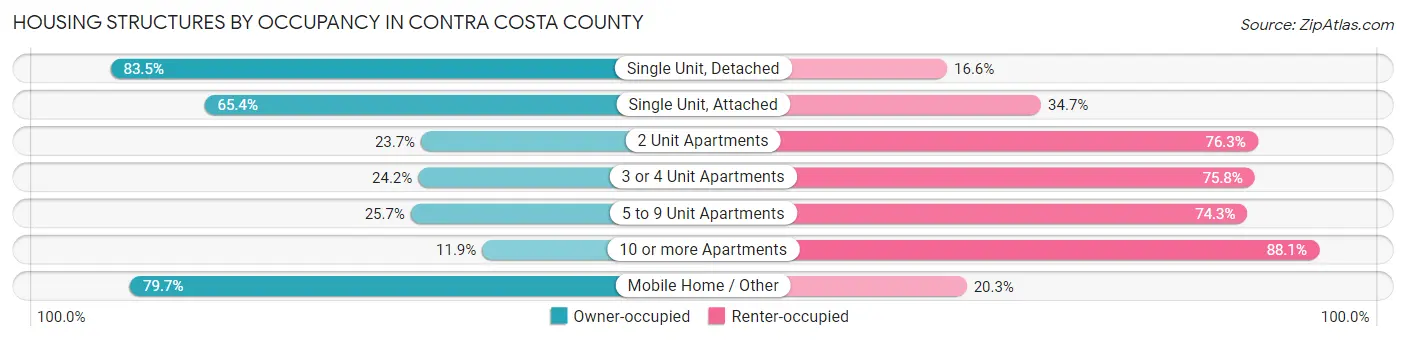
| Structure Type | Owner-occupied | Renter-occupied |
| Single Unit, Detached | 230,464 (83.5%) | 45,720 (16.6%) |
| Single Unit, Attached | 23,057 (65.3%) | 12,228 (34.6%) |
| 2 Unit Apartments | 1,290 (23.7%) | 4,155 (76.3%) |
| 3 or 4 Unit Apartments | 4,416 (24.2%) | 13,799 (75.8%) |
| 5 to 9 Unit Apartments | 3,824 (25.7%) | 11,079 (74.3%) |
| 10 or more Apartments | 6,203 (11.9%) | 45,859 (88.1%) |
| Mobile Home / Other | 5,134 (79.7%) | 1,309 (20.3%) |
| Total | 274,388 (67.2%) | 134,149 (32.8%) |
Housing Structures by Number of Rooms in Contra Costa County
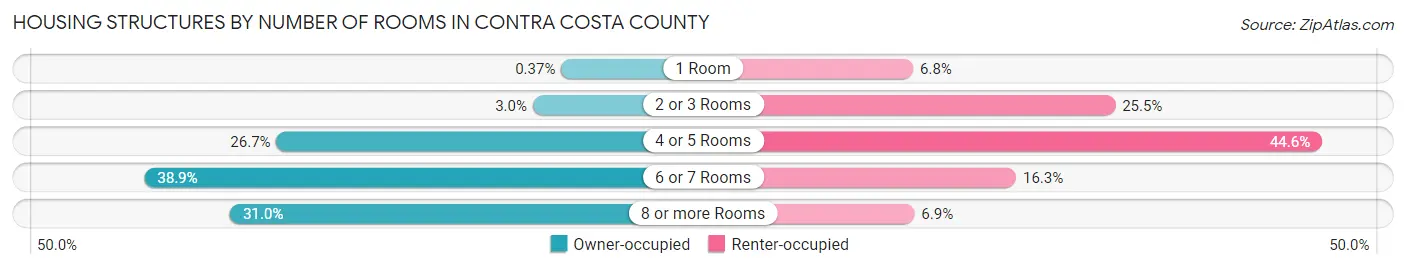
| Number of Rooms | Owner-occupied | Renter-occupied |
| 1 Room | 1,011 (0.4%) | 9,085 (6.8%) |
| 2 or 3 Rooms | 8,229 (3.0%) | 34,152 (25.5%) |
| 4 or 5 Rooms | 73,289 (26.7%) | 59,805 (44.6%) |
| 6 or 7 Rooms | 106,790 (38.9%) | 21,859 (16.3%) |
| 8 or more Rooms | 85,069 (31.0%) | 9,248 (6.9%) |
| Total | 274,388 (100.0%) | 134,149 (100.0%) |
Housing Structure by Heating Type in Contra Costa County
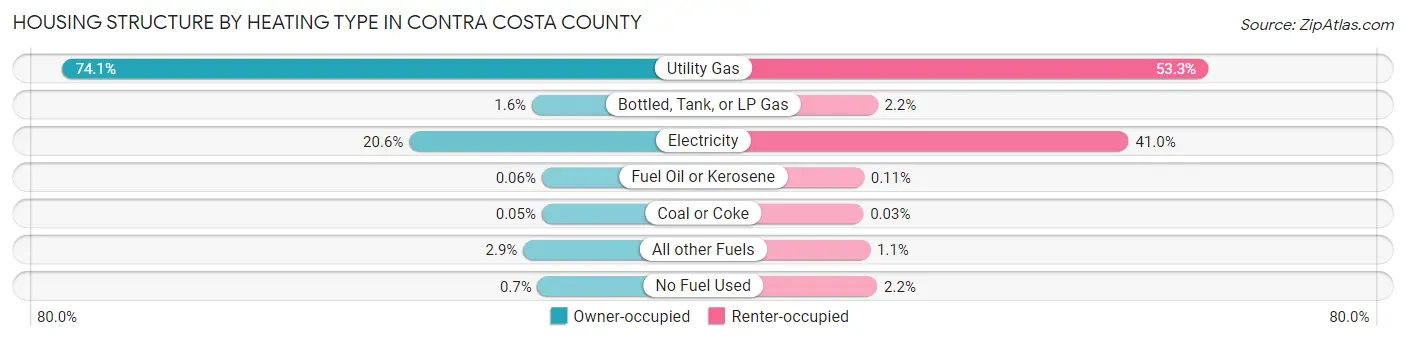
| Heating Type | Owner-occupied | Renter-occupied |
| Utility Gas | 203,406 (74.1%) | 71,509 (53.3%) |
| Bottled, Tank, or LP Gas | 4,318 (1.6%) | 3,010 (2.2%) |
| Electricity | 56,386 (20.5%) | 55,053 (41.0%) |
| Fuel Oil or Kerosene | 167 (0.1%) | 141 (0.1%) |
| Coal or Coke | 148 (0.1%) | 45 (0.0%) |
| All other Fuels | 8,041 (2.9%) | 1,462 (1.1%) |
| No Fuel Used | 1,922 (0.7%) | 2,929 (2.2%) |
| Total | 274,388 (100.0%) | 134,149 (100.0%) |
Household Vehicle Usage in Contra Costa County
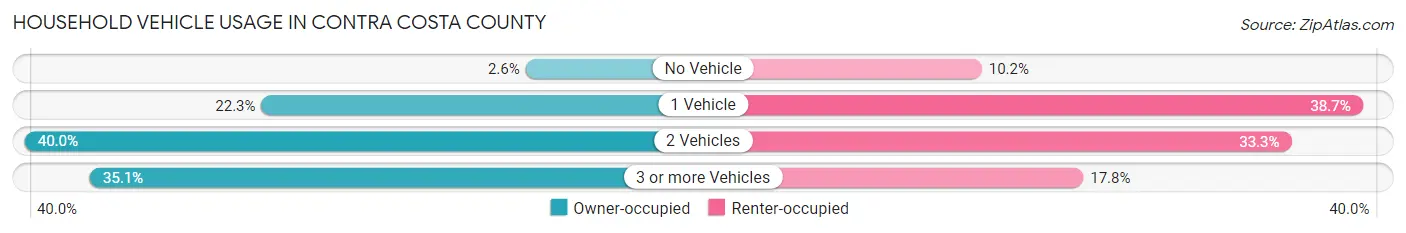
| Vehicles per Household | Owner-occupied | Renter-occupied |
| No Vehicle | 7,093 (2.6%) | 13,708 (10.2%) |
| 1 Vehicle | 61,250 (22.3%) | 51,847 (38.7%) |
| 2 Vehicles | 109,693 (40.0%) | 44,716 (33.3%) |
| 3 or more Vehicles | 96,352 (35.1%) | 23,878 (17.8%) |
| Total | 274,388 (100.0%) | 134,149 (100.0%) |
Real Estate & Mortgages in Contra Costa County
Real Estate and Mortgage Overview in Contra Costa County
| Characteristic | Without Mortgage | With Mortgage |
| Housing Units | 75,799 | 198,589 |
| Median Property Value | $739,200 | $804,800 |
| Median Household Income | $102,241 | $108,854 |
| Monthly Housing Costs | $886 | $110,869 |
| Real Estate Taxes | $4,758 | $2,535 |
Property Value by Mortgage Status in Contra Costa County
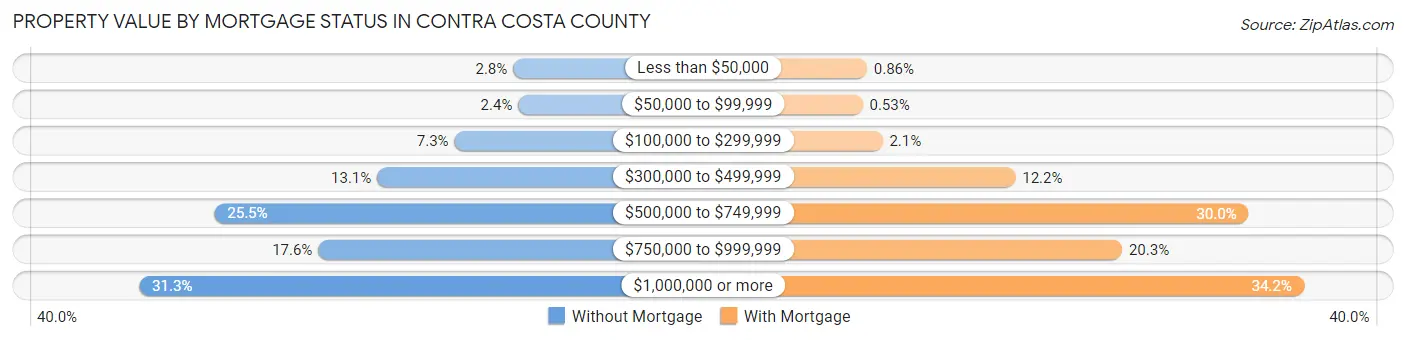
| Property Value | Without Mortgage | With Mortgage |
| Less than $50,000 | 2,110 (2.8%) | 1,698 (0.9%) |
| $50,000 to $99,999 | 1,808 (2.4%) | 1,043 (0.5%) |
| $100,000 to $299,999 | 5,497 (7.2%) | 4,075 (2.1%) |
| $300,000 to $499,999 | 9,962 (13.1%) | 24,168 (12.2%) |
| $500,000 to $749,999 | 19,358 (25.5%) | 59,472 (29.9%) |
| $750,000 to $999,999 | 13,363 (17.6%) | 40,313 (20.3%) |
| $1,000,000 or more | 23,701 (31.3%) | 67,820 (34.2%) |
| Total | 75,799 (100.0%) | 198,589 (100.0%) |
Household Income by Mortgage Status in Contra Costa County
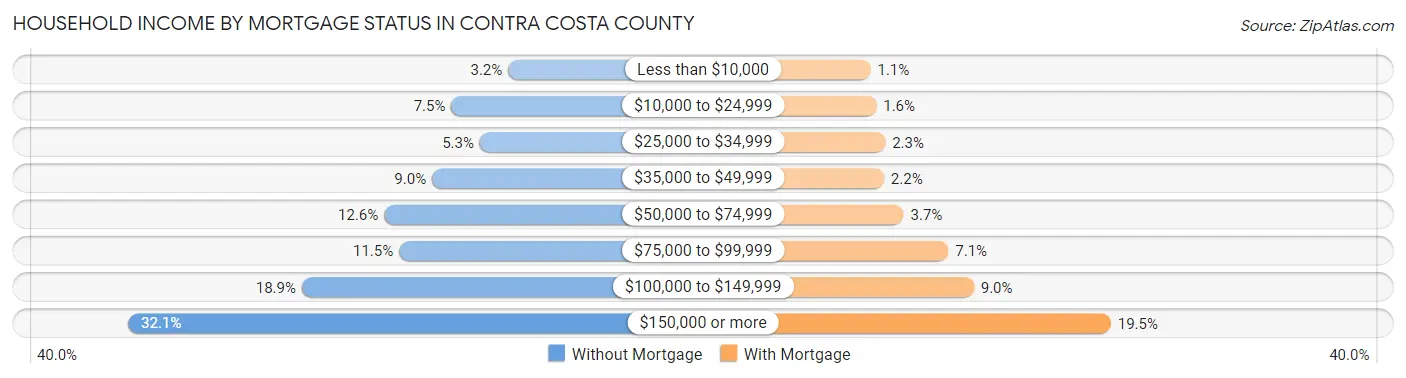
| Household Income | Without Mortgage | With Mortgage |
| Less than $10,000 | 2,396 (3.2%) | 2,264 (1.1%) |
| $10,000 to $24,999 | 5,676 (7.5%) | 3,131 (1.6%) |
| $25,000 to $34,999 | 4,033 (5.3%) | 4,491 (2.3%) |
| $35,000 to $49,999 | 6,794 (9.0%) | 4,294 (2.2%) |
| $50,000 to $74,999 | 9,562 (12.6%) | 7,262 (3.7%) |
| $75,000 to $99,999 | 8,691 (11.5%) | 14,032 (7.1%) |
| $100,000 to $149,999 | 14,308 (18.9%) | 17,897 (9.0%) |
| $150,000 or more | 24,339 (32.1%) | 38,628 (19.5%) |
| Total | 75,799 (100.0%) | 198,589 (100.0%) |
Property Value to Household Income Ratio in Contra Costa County
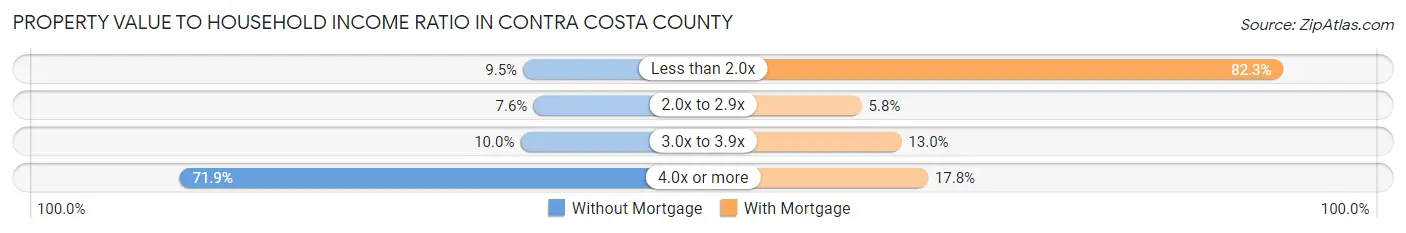
| Value-to-Income Ratio | Without Mortgage | With Mortgage |
| Less than 2.0x | 7,198 (9.5%) | 163,513 (82.3%) |
| 2.0x to 2.9x | 5,782 (7.6%) | 11,424 (5.8%) |
| 3.0x to 3.9x | 7,570 (10.0%) | 25,778 (13.0%) |
| 4.0x or more | 54,464 (71.9%) | 35,354 (17.8%) |
| Total | 75,799 (100.0%) | 198,589 (100.0%) |
Real Estate Taxes by Mortgage Status in Contra Costa County
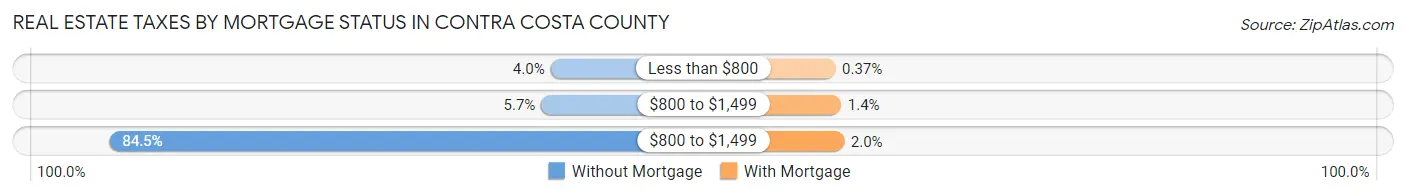
| Property Taxes | Without Mortgage | With Mortgage |
| Less than $800 | 2,997 (4.0%) | 744 (0.4%) |
| $800 to $1,499 | 4,286 (5.7%) | 2,822 (1.4%) |
| $800 to $1,499 | 64,060 (84.5%) | 3,908 (2.0%) |
| Total | 75,799 (100.0%) | 198,589 (100.0%) |
Health & Disability in Contra Costa County
Health Insurance Coverage by Age in Contra Costa County
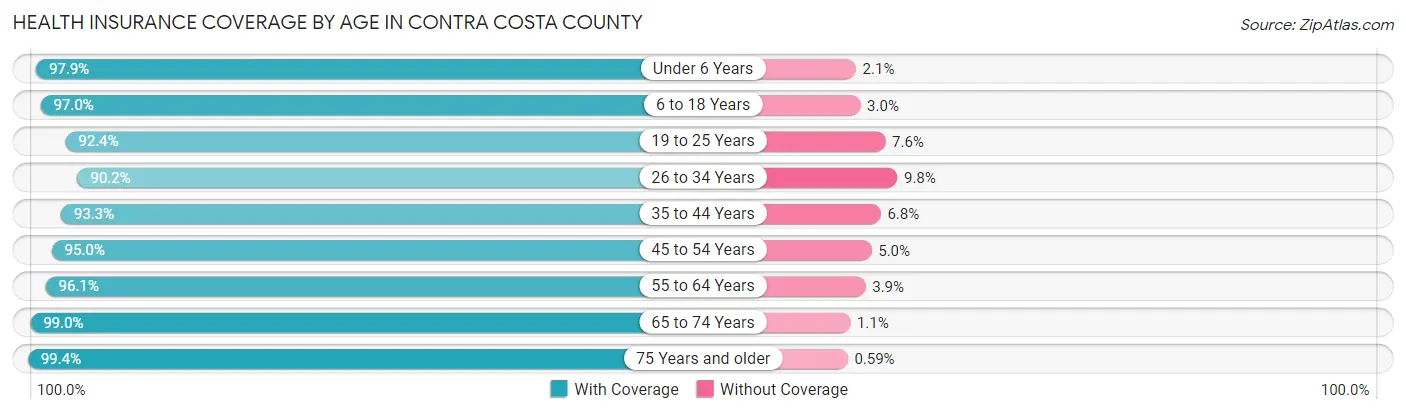
| Age Bracket | With Coverage | Without Coverage |
| Under 6 Years | 75,057 (97.9%) | 1,627 (2.1%) |
| 6 to 18 Years | 191,204 (97.0%) | 5,840 (3.0%) |
| 19 to 25 Years | 85,726 (92.4%) | 7,064 (7.6%) |
| 26 to 34 Years | 117,773 (90.2%) | 12,858 (9.8%) |
| 35 to 44 Years | 149,779 (93.2%) | 10,846 (6.8%) |
| 45 to 54 Years | 151,672 (95.0%) | 8,027 (5.0%) |
| 55 to 64 Years | 146,664 (96.1%) | 5,960 (3.9%) |
| 65 to 74 Years | 109,296 (99.0%) | 1,164 (1.1%) |
| 75 Years and older | 76,701 (99.4%) | 453 (0.6%) |
| Total | 1,103,872 (95.4%) | 53,839 (4.6%) |
Health Insurance Coverage by Citizenship Status in Contra Costa County
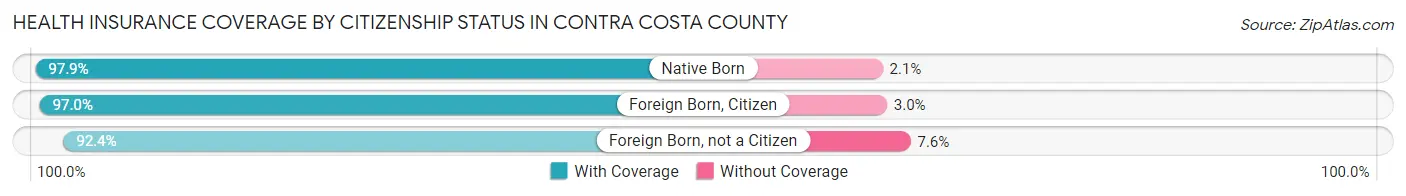
| Citizenship Status | With Coverage | Without Coverage |
| Native Born | 75,057 (97.9%) | 1,627 (2.1%) |
| Foreign Born, Citizen | 191,204 (97.0%) | 5,840 (3.0%) |
| Foreign Born, not a Citizen | 85,726 (92.4%) | 7,064 (7.6%) |
Health Insurance Coverage by Household Income in Contra Costa County
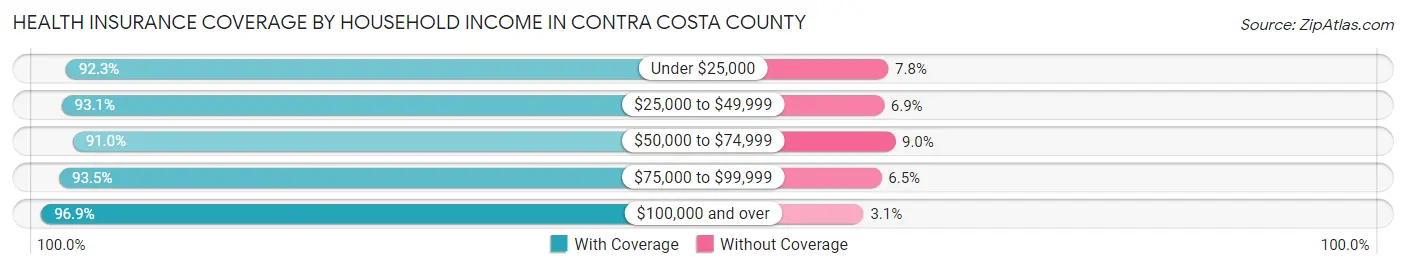
| Household Income | With Coverage | Without Coverage |
| Under $25,000 | 65,467 (92.2%) | 5,499 (7.7%) |
| $25,000 to $49,999 | 91,735 (93.1%) | 6,838 (6.9%) |
| $50,000 to $74,999 | 100,480 (91.0%) | 9,988 (9.0%) |
| $75,000 to $99,999 | 107,776 (93.5%) | 7,457 (6.5%) |
| $100,000 and over | 731,750 (96.9%) | 23,581 (3.1%) |
Public vs Private Health Insurance Coverage by Age in Contra Costa County
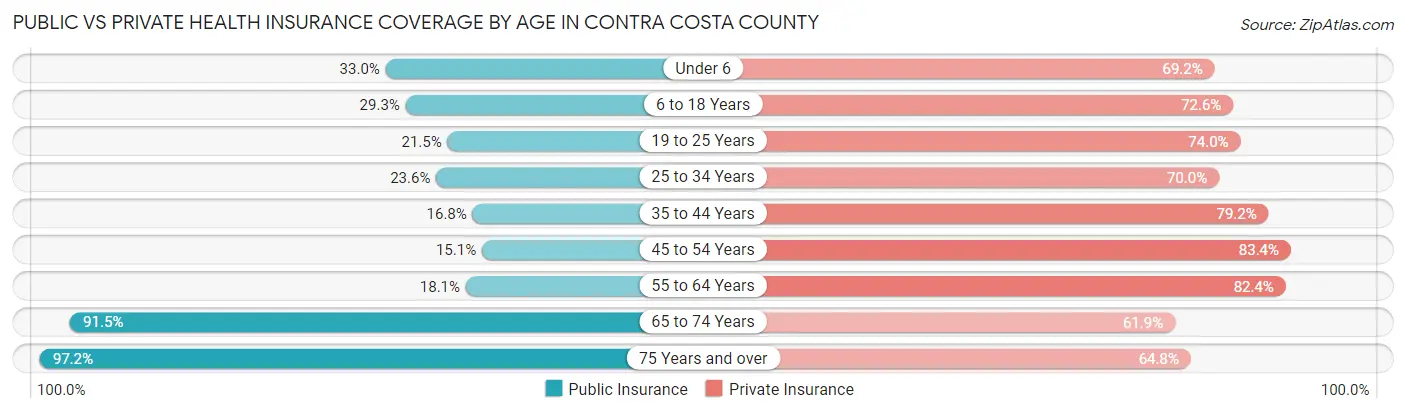
| Age Bracket | Public Insurance | Private Insurance |
| Under 6 | 25,292 (33.0%) | 53,049 (69.2%) |
| 6 to 18 Years | 57,680 (29.3%) | 143,136 (72.6%) |
| 19 to 25 Years | 19,950 (21.5%) | 68,643 (74.0%) |
| 25 to 34 Years | 30,816 (23.6%) | 91,456 (70.0%) |
| 35 to 44 Years | 27,055 (16.8%) | 127,227 (79.2%) |
| 45 to 54 Years | 24,107 (15.1%) | 133,107 (83.4%) |
| 55 to 64 Years | 27,622 (18.1%) | 125,745 (82.4%) |
| 65 to 74 Years | 101,111 (91.5%) | 68,320 (61.9%) |
| 75 Years and over | 74,967 (97.2%) | 49,962 (64.8%) |
| Total | 388,600 (33.6%) | 860,645 (74.3%) |
Disability Status by Sex by Age in Contra Costa County
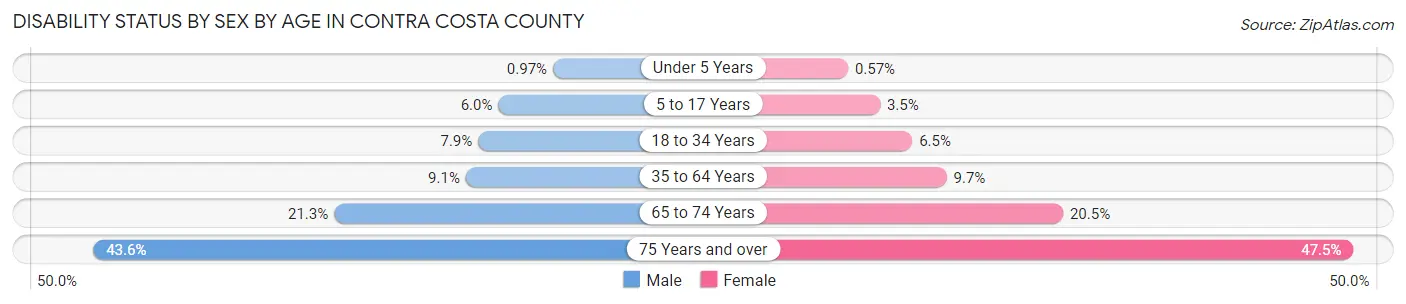
| Age Bracket | Male | Female |
| Under 5 Years | 312 (1.0%) | 176 (0.6%) |
| 5 to 17 Years | 6,011 (6.0%) | 3,383 (3.5%) |
| 18 to 34 Years | 9,591 (7.9%) | 7,726 (6.5%) |
| 35 to 64 Years | 21,236 (9.1%) | 23,210 (9.7%) |
| 65 to 74 Years | 10,881 (21.3%) | 12,176 (20.5%) |
| 75 Years and over | 13,981 (43.6%) | 21,417 (47.5%) |
Disability Class by Sex by Age in Contra Costa County
Disability Class: Hearing Difficulty
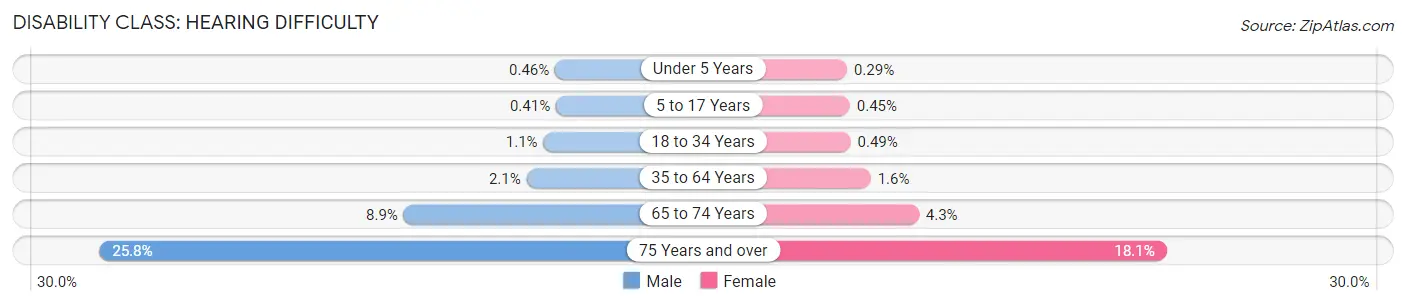
| Age Bracket | Male | Female |
| Under 5 Years | 146 (0.5%) | 89 (0.3%) |
| 5 to 17 Years | 406 (0.4%) | 433 (0.4%) |
| 18 to 34 Years | 1,348 (1.1%) | 581 (0.5%) |
| 35 to 64 Years | 4,811 (2.1%) | 3,851 (1.6%) |
| 65 to 74 Years | 4,548 (8.9%) | 2,547 (4.3%) |
| 75 Years and over | 8,279 (25.8%) | 8,157 (18.1%) |
Disability Class: Vision Difficulty
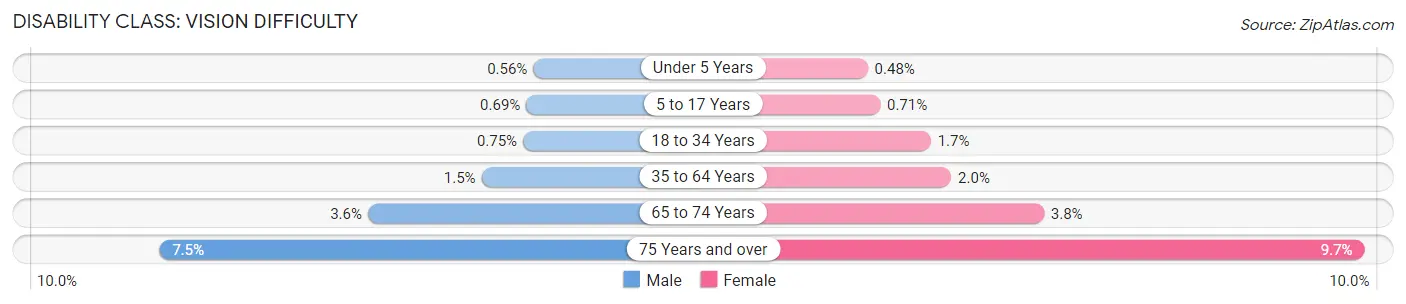
| Age Bracket | Male | Female |
| Under 5 Years | 179 (0.6%) | 147 (0.5%) |
| 5 to 17 Years | 690 (0.7%) | 683 (0.7%) |
| 18 to 34 Years | 903 (0.7%) | 1,953 (1.7%) |
| 35 to 64 Years | 3,568 (1.5%) | 4,853 (2.0%) |
| 65 to 74 Years | 1,855 (3.6%) | 2,226 (3.7%) |
| 75 Years and over | 2,404 (7.5%) | 4,377 (9.7%) |
Disability Class: Cognitive Difficulty
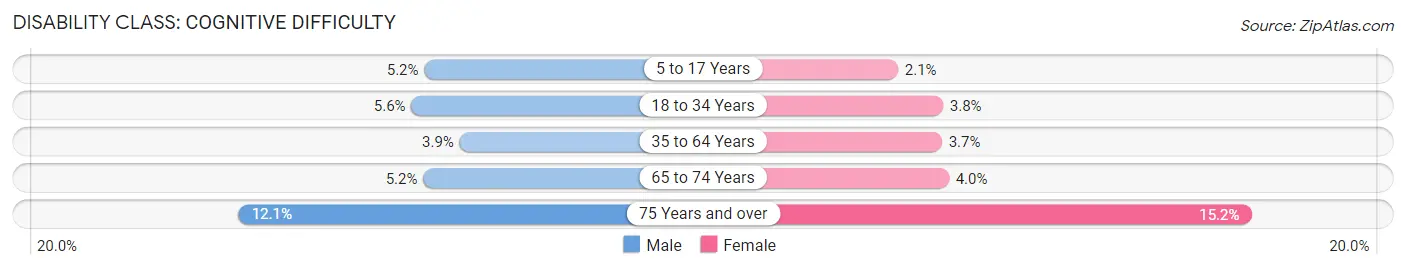
| Age Bracket | Male | Female |
| 5 to 17 Years | 5,131 (5.2%) | 1,985 (2.1%) |
| 18 to 34 Years | 6,832 (5.6%) | 4,423 (3.7%) |
| 35 to 64 Years | 9,030 (3.8%) | 8,844 (3.7%) |
| 65 to 74 Years | 2,660 (5.2%) | 2,353 (4.0%) |
| 75 Years and over | 3,861 (12.0%) | 6,856 (15.2%) |
Disability Class: Ambulatory Difficulty
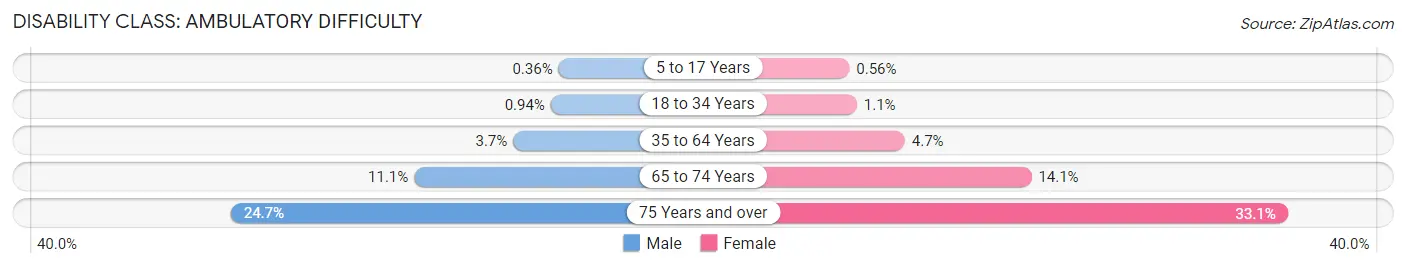
| Age Bracket | Male | Female |
| 5 to 17 Years | 358 (0.4%) | 535 (0.6%) |
| 18 to 34 Years | 1,138 (0.9%) | 1,326 (1.1%) |
| 35 to 64 Years | 8,746 (3.7%) | 11,174 (4.7%) |
| 65 to 74 Years | 5,665 (11.1%) | 8,354 (14.1%) |
| 75 Years and over | 7,911 (24.7%) | 14,932 (33.1%) |
Disability Class: Self-Care Difficulty
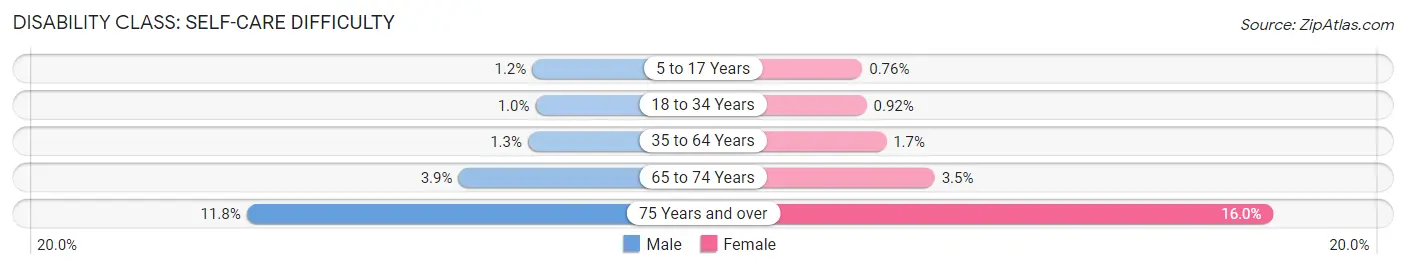
| Age Bracket | Male | Female |
| 5 to 17 Years | 1,155 (1.2%) | 727 (0.8%) |
| 18 to 34 Years | 1,265 (1.0%) | 1,081 (0.9%) |
| 35 to 64 Years | 3,098 (1.3%) | 3,939 (1.7%) |
| 65 to 74 Years | 1,993 (3.9%) | 2,044 (3.5%) |
| 75 Years and over | 3,767 (11.8%) | 7,229 (16.0%) |
Technology Access in Contra Costa County
Computing Device Access in Contra Costa County
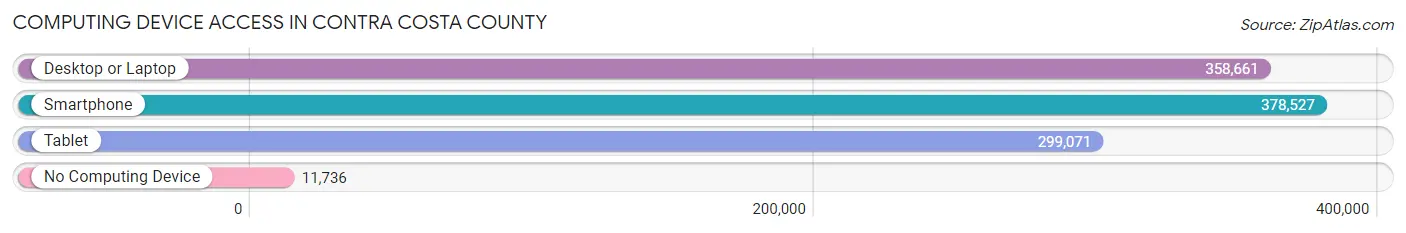
| Device Type | # Households | % Households |
| Desktop or Laptop | 358,661 | 87.8% |
| Smartphone | 378,527 | 92.6% |
| Tablet | 299,071 | 73.2% |
| No Computing Device | 11,736 | 2.9% |
| Total | 408,537 | 100.0% |
Internet Access in Contra Costa County
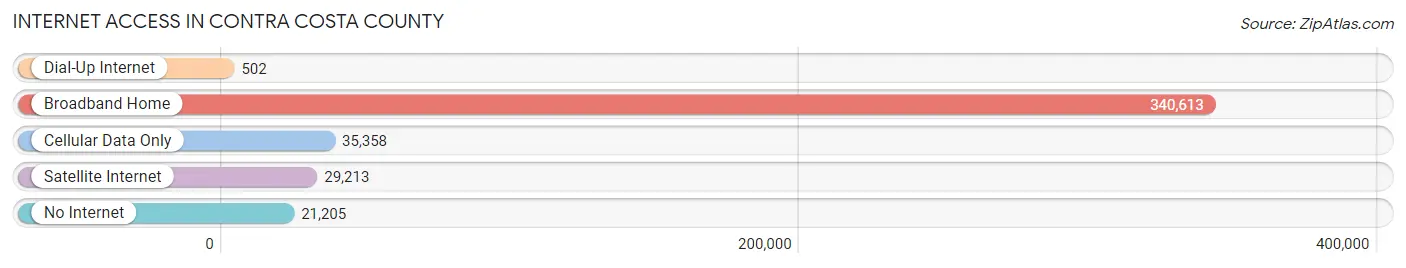
| Internet Type | # Households | % Households |
| Dial-Up Internet | 502 | 0.1% |
| Broadband Home | 340,613 | 83.4% |
| Cellular Data Only | 35,358 | 8.6% |
| Satellite Internet | 29,213 | 7.1% |
| No Internet | 21,205 | 5.2% |
| Total | 408,537 | 100.0% |
Contra Costa County Summary
Contra Costa County is located in the San Francisco Bay Area of California. It is the ninth most populous county in the state and the third most populous in the Bay Area. The county is bordered by Alameda County to the north, San Joaquin County to the east, Solano County to the south, and San Francisco Bay to the west. The county seat is Martinez.
History
Contra Costa County was established in 1850 as one of the original 27 counties of California. It was named for the Contra Costa Mountains, which were named by Spanish explorers in the late 18th century. The county was originally part of the Rancho El Pinole Mexican land grant.
In the early 19th century, the area was populated by Native Americans, including the Ohlone, Miwok, and Yokuts tribes. The first European settlers arrived in the area in the 1830s, and the county was officially established in 1850.
In the late 19th century, the county experienced a period of rapid growth, as the population increased from around 10,000 in 1870 to over 100,000 by 1900. This growth was largely due to the influx of immigrants from Europe and Asia, as well as the development of the county’s agricultural and industrial sectors.
Geography
Contra Costa County covers an area of 804 square miles, making it the fourth largest county in California. The county is located in the San Francisco Bay Area, and is bordered by Alameda County to the north, San Joaquin County to the east, Solano County to the south, and San Francisco Bay to the west.
The county is divided into two distinct regions: the East Bay and the West Bay. The East Bay is home to the cities of Richmond, El Cerrito, and San Pablo, as well as the unincorporated communities of Bay Point, Crockett, and Port Costa. The West Bay is home to the cities of Concord, Walnut Creek, and Pleasant Hill, as well as the unincorporated communities of Alamo, Lafayette, and Moraga.
The county is home to several mountain ranges, including the Diablo Range, the Berkeley Hills, and the Contra Costa Mountains. The highest point in the county is Mount Diablo, which stands at 3,849 feet.
Economy
Contra Costa County has a diverse economy, with a mix of industries including manufacturing, retail, healthcare, and technology. The county is home to several major employers, including Chevron, Kaiser Permanente, and Safeway.
The county’s largest industry is manufacturing, which accounts for over 20% of the county’s total employment. The county is home to several major manufacturing companies, including Chevron, Dow Chemical, and Shell Oil.
The county’s second largest industry is retail, which accounts for over 15% of the county’s total employment. The county is home to several major retail companies, including Macy’s, Target, and Walmart.
The county’s third largest industry is healthcare, which accounts for over 10% of the county’s total employment. The county is home to several major healthcare companies, including Kaiser Permanente, Sutter Health, and UCSF Medical Center.
Demographics
As of the 2010 census, Contra Costa County had a population of 1,049,025. The racial makeup of the county was 57.2% White, 18.3% Asian, 14.2% Hispanic or Latino, 8.2% Black or African American, 0.7% Native American, and 0.5% Pacific Islander.
The median household income in the county was $77,844, and the median family income was $90,890. The per capita income in the county was $37,890.
Conclusion
Contra Costa County is located in the San Francisco Bay Area of California. It is the ninth most populous county in the state and the third most populous in the Bay Area. The county is bordered by Alameda County to the north, San Joaquin County to the east, Solano County to the south, and San Francisco Bay to the west. The county was established in 1850 and has a diverse economy, with a mix of industries including manufacturing, retail, healthcare, and technology. As of the 2010 census, Contra Costa County had a population of 1,049,025, with a median household income of $77,844 and a median family income of $90,890.
Common Questions
What is Per Capita Income in Contra Costa County?
Per Capita income in Contra Costa County is $59,083.
What is the Median Family Income in Contra Costa County?
Median Family Income in Contra Costa County is $139,078.
What is the Median Household income in Contra Costa County?
Median Household Income in Contra Costa County is $120,020.
What is Income or Wage Gap in Contra Costa County?
Income or Wage Gap in Contra Costa County is 31.5%.
Women in Contra Costa County earn 68.5 cents for every dollar earned by a man.
What is Family Income Deficit in Contra Costa County?
Family Income Deficit in Contra Costa County is $12,072.
Families that are below poverty line in Contra Costa County earn $12,072 less on average than the poverty threshold level.
What is Inequality or Gini Index in Contra Costa County?
Inequality or Gini Index in Contra Costa County is 0.47.
What is the Total Population of Contra Costa County?
Total Population of Contra Costa County is 1,162,648.
What is the Total Male Population of Contra Costa County?
Total Male Population of Contra Costa County is 573,074.
What is the Total Female Population of Contra Costa County?
Total Female Population of Contra Costa County is 589,574.
What is the Ratio of Males per 100 Females in Contra Costa County?
There are 97.20 Males per 100 Females in Contra Costa County.
What is the Ratio of Females per 100 Males in Contra Costa County?
There are 102.88 Females per 100 Males in Contra Costa County.
What is the Median Population Age in Contra Costa County?
Median Population Age in Contra Costa County is 40.1 Years.
What is the Average Family Size in Contra Costa County
Average Family Size in Contra Costa County is 3.3 People.
What is the Average Household Size in Contra Costa County
Average Household Size in Contra Costa County is 2.8 People.
How Large is the Labor Force in Contra Costa County?
There are 609,772 People in the Labor Forcein in Contra Costa County.
What is the Percentage of People in the Labor Force in Contra Costa County?
65.1% of People are in the Labor Force in Contra Costa County.
What is the Unemployment Rate in Contra Costa County?
Unemployment Rate in Contra Costa County is 5.8%.