Cities with the Highest Percentage of Births to Unmarried Women under the Age of 20 in Oklahoma
RELATED REPORTS & OPTIONS
Highest Illegitimacy | Women 15-19
Oklahoma
Compare Cities
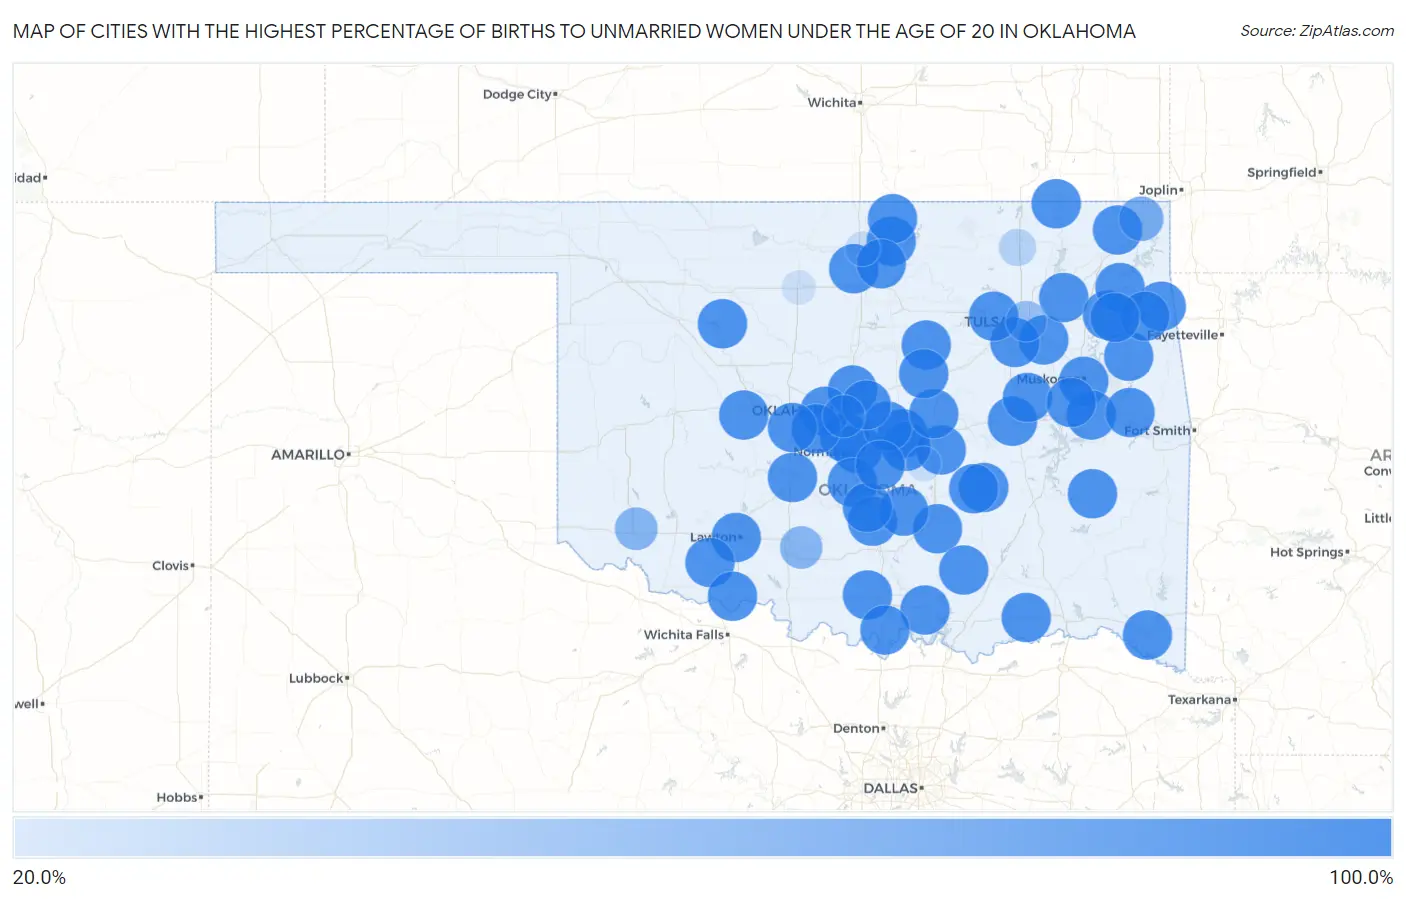
Map of Cities with the Highest Percentage of Births to Unmarried Women under the Age of 20 in Oklahoma
0.0%
100.0%
Cities with the Highest Percentage of Births to Unmarried Women under the Age of 20 in Oklahoma
| City | % Unmarried | vs State | vs National | |
| 1. | Norman | 100.0% | 70.9%(+29.1)#1 | 86.9%(+13.1)#105 |
| 2. | Broken Arrow | 100.0% | 70.9%(+29.1)#2 | 86.9%(+13.1)#130 |
| 3. | Edmond | 100.0% | 70.9%(+29.1)#3 | 86.9%(+13.1)#177 |
| 4. | Lawton | 100.0% | 70.9%(+29.1)#4 | 86.9%(+13.1)#187 |
| 5. | Moore | 100.0% | 70.9%(+29.1)#5 | 86.9%(+13.1)#292 |
| 6. | Muskogee | 100.0% | 70.9%(+29.1)#6 | 86.9%(+13.1)#457 |
| 7. | Shawnee | 100.0% | 70.9%(+29.1)#7 | 86.9%(+13.1)#521 |
| 8. | Jenks | 100.0% | 70.9%(+29.1)#8 | 86.9%(+13.1)#576 |
| 9. | Ponca City | 100.0% | 70.9%(+29.1)#9 | 86.9%(+13.1)#602 |
| 10. | Bethany | 100.0% | 70.9%(+29.1)#10 | 86.9%(+13.1)#662 |
| 11. | Mustang | 100.0% | 70.9%(+29.1)#11 | 86.9%(+13.1)#666 |
| 12. | Sand Springs | 100.0% | 70.9%(+29.1)#12 | 86.9%(+13.1)#679 |
| 13. | Claremore | 100.0% | 70.9%(+29.1)#13 | 86.9%(+13.1)#684 |
| 14. | Ada | 100.0% | 70.9%(+29.1)#14 | 86.9%(+13.1)#749 |
| 15. | Tahlequah | 100.0% | 70.9%(+29.1)#15 | 86.9%(+13.1)#752 |
| 16. | Chickasha | 100.0% | 70.9%(+29.1)#16 | 86.9%(+13.1)#761 |
| 17. | Cushing | 100.0% | 70.9%(+29.1)#17 | 86.9%(+13.1)#1,013 |
| 18. | Seminole | 100.0% | 70.9%(+29.1)#18 | 86.9%(+13.1)#1,057 |
| 19. | Idabel | 100.0% | 70.9%(+29.1)#19 | 86.9%(+13.1)#1,061 |
| 20. | Purcell | 100.0% | 70.9%(+29.1)#20 | 86.9%(+13.1)#1,069 |
| 21. | Tecumseh | 100.0% | 70.9%(+29.1)#21 | 86.9%(+13.1)#1,083 |
| 22. | Pauls Valley | 100.0% | 70.9%(+29.1)#22 | 86.9%(+13.1)#1,099 |
| 23. | Henryetta | 100.0% | 70.9%(+29.1)#23 | 86.9%(+13.1)#1,116 |
| 24. | Lone Grove | 100.0% | 70.9%(+29.1)#24 | 86.9%(+13.1)#1,148 |
| 25. | Hinton | 100.0% | 70.9%(+29.1)#25 | 86.9%(+13.1)#1,159 |
| 26. | Mcloud | 100.0% | 70.9%(+29.1)#26 | 86.9%(+13.1)#1,181 |
| 27. | Madill | 100.0% | 70.9%(+29.1)#27 | 86.9%(+13.1)#1,208 |
| 28. | Jones | 100.0% | 70.9%(+29.1)#28 | 86.9%(+13.1)#1,277 |
| 29. | Wilburton | 100.0% | 70.9%(+29.1)#29 | 86.9%(+13.1)#1,291 |
| 30. | Marietta | 100.0% | 70.9%(+29.1)#30 | 86.9%(+13.1)#1,292 |
| 31. | Newkirk | 100.0% | 70.9%(+29.1)#31 | 86.9%(+13.1)#1,421 |
| 32. | Prague | 100.0% | 70.9%(+29.1)#32 | 86.9%(+13.1)#1,422 |
| 33. | Morris | 100.0% | 70.9%(+29.1)#33 | 86.9%(+13.1)#1,475 |
| 34. | Warner | 100.0% | 70.9%(+29.1)#34 | 86.9%(+13.1)#1,480 |
| 35. | Locust Grove | 100.0% | 70.9%(+29.1)#35 | 86.9%(+13.1)#1,513 |
| 36. | Vian | 100.0% | 70.9%(+29.1)#36 | 86.9%(+13.1)#1,527 |
| 37. | Stratford | 100.0% | 70.9%(+29.1)#37 | 86.9%(+13.1)#1,532 |
| 38. | Union City | 100.0% | 70.9%(+29.1)#38 | 86.9%(+13.1)#1,537 |
| 39. | Colcord | 100.0% | 70.9%(+29.1)#39 | 86.9%(+13.1)#1,674 |
| 40. | Boswell | 100.0% | 70.9%(+29.1)#40 | 86.9%(+13.1)#1,689 |
| 41. | South Coffeyville | 100.0% | 70.9%(+29.1)#41 | 86.9%(+13.1)#1,718 |
| 42. | Paoli | 100.0% | 70.9%(+29.1)#42 | 86.9%(+13.1)#1,725 |
| 43. | Billings | 100.0% | 70.9%(+29.1)#43 | 86.9%(+13.1)#1,809 |
| 44. | Wapanucka | 100.0% | 70.9%(+29.1)#44 | 86.9%(+13.1)#1,817 |
| 45. | Chattanooga | 100.0% | 70.9%(+29.1)#45 | 86.9%(+13.1)#1,821 |
| 46. | Spavinaw | 100.0% | 70.9%(+29.1)#46 | 86.9%(+13.1)#1,827 |
| 47. | Calvin | 100.0% | 70.9%(+29.1)#47 | 86.9%(+13.1)#1,834 |
| 48. | Randlett | 100.0% | 70.9%(+29.1)#48 | 86.9%(+13.1)#1,851 |
| 49. | Tonkawa Tribal Housing | 100.0% | 70.9%(+29.1)#49 | 86.9%(+13.1)#1,861 |
| 50. | Twin Oaks | 100.0% | 70.9%(+29.1)#50 | 86.9%(+13.1)#1,870 |
| 51. | Chance | 100.0% | 70.9%(+29.1)#51 | 86.9%(+13.1)#1,871 |
| 52. | Marland | 100.0% | 70.9%(+29.1)#52 | 86.9%(+13.1)#1,880 |
| 53. | Snake Creek | 100.0% | 70.9%(+29.1)#53 | 86.9%(+13.1)#1,882 |
| 54. | Bluejacket | 100.0% | 70.9%(+29.1)#54 | 86.9%(+13.1)#1,896 |
| 55. | Oktaha | 100.0% | 70.9%(+29.1)#55 | 86.9%(+13.1)#1,897 |
| 56. | Longdale | 100.0% | 70.9%(+29.1)#56 | 86.9%(+13.1)#1,929 |
| 57. | Etowah | 100.0% | 70.9%(+29.1)#57 | 86.9%(+13.1)#1,937 |
| 58. | Atwood | 100.0% | 70.9%(+29.1)#58 | 86.9%(+13.1)#1,939 |
| 59. | Kendrick | 100.0% | 70.9%(+29.1)#59 | 86.9%(+13.1)#1,941 |
| 60. | Miami | 74.2% | 70.9%(+3.30)#60 | 86.9%(-12.7)#2,037 |
| 61. | Altus | 65.0% | 70.9%(-5.90)#61 | 86.9%(-21.9)#2,065 |
| 62. | Oklahoma City | 63.6% | 70.9%(-7.30)#62 | 86.9%(-23.3)#2,071 |
| 63. | Duncan | 63.6% | 70.9%(-7.30)#63 | 86.9%(-23.3)#2,072 |
| 64. | Tulsa | 54.8% | 70.9%(-16.1)#64 | 86.9%(-32.1)#2,084 |
| 65. | Bartlesville | 36.4% | 70.9%(-34.5)#65 | 86.9%(-50.5)#2,106 |
| 66. | Tonkawa | 25.0% | 70.9%(-45.9)#66 | 86.9%(-61.9)#2,126 |
| 67. | Maud | 25.0% | 70.9%(-45.9)#67 | 86.9%(-61.9)#2,127 |
| 68. | Enid | 22.1% | 70.9%(-48.8)#68 | 86.9%(-64.8)#2,131 |
Common Questions
What are the Top 10 Cities with the Highest Percentage of Births to Unmarried Women under the Age of 20 in Oklahoma?
Top 10 Cities with the Highest Percentage of Births to Unmarried Women under the Age of 20 in Oklahoma are:
#1
100.0%
#2
100.0%
#3
100.0%
#4
100.0%
#5
100.0%
#6
100.0%
#7
100.0%
#8
100.0%
#9
100.0%
#10
100.0%
What city has the Highest Percentage of Births to Unmarried Women under the Age of 20 in Oklahoma?
Norman has the Highest Percentage of Births to Unmarried Women under the Age of 20 in Oklahoma with 100.0%.
What is the Percentage of Births to Unmarried Women under the Age of 20 in the State of Oklahoma?
Percentage of Births to Unmarried Women under the Age of 20 in Oklahoma is 70.9%.
What is the Percentage of Births to Unmarried Women under the Age of 20 in the United States?
Percentage of Births to Unmarried Women under the Age of 20 in the United States is 86.9%.