Cities with the Highest Percentage of Births to Unmarried Women under the Age of 20 in Tennessee

RELATED REPORTS & OPTIONS

Highest Illegitimacy | Women 15-19
Population
Families and Households
Female Fertility
Female Fertility (Unmarried)
Race (Community Size)
Race (Percentage)
Ancestry (Community Size)
AfghanAfricanAlaska NativeAlaskan AthabascanAlbanianAleutAlsatianAmericanApacheArabArapahoArgentineanArmenianAssyrian / Chaldean / SyriacAustralianAustrianBahamianBangladeshiBarbadianBasqueBelgianBelizeanBermudanBhutaneseBlackfeetBolivianBrazilianBritishBritish West IndianBulgarianBurmeseCajunCambodianCanadianCape VerdeanCarpatho RusynCelticCentral AmericanCentral American IndianCherokeeCheyenneChickasawChileanChineseChippewaChoctawColombianColvilleComancheCosta RicanCreeCreekCroatianCrowCubanCypriotCzechCzechoslovakianDanishDelawareDominicanDutchDutch West IndianEastern EuropeanEcuadorianEgyptianEnglishEstonianEthiopianEuropeanFijianFilipinoFinnishFrenchFrench American IndianFrench CanadianGermanGerman RussianGhanaianGreekGuamanian / ChamorroGuatemalanGuyaneseHaitianHmongHonduranHopiHoumaHungarianIcelanderIndian (Asian)IndonesianInupiatIranianIraqiIrishIroquoisIsraeliItalianJamaicanJapaneseJordanianKenyanKiowaKoreanLaotianLatvianLebaneseLiberianLithuanianLumbeeLuxembourgerMacedonianMalaysianMalteseMarshalleseMenomineeMexicanMexican American IndianMongolianMoroccanNative HawaiianNavajoNepaleseNew ZealanderNicaraguanNigerianNorthern EuropeanNorwegianOkinawanOsageOttawaPaiutePakistaniPalestinianPanamanianParaguayanPennsylvania GermanPeruvianPimaPolishPortuguesePotawatomiPuebloPuerto RicanPuget Sound SalishRomanianRussianSalvadoranSamoanScandinavianScotch-IrishScottishSeminoleSenegaleseSerbianShoshoneSierra LeoneanSiouxSlavicSlovakSloveneSomaliSouth AfricanSouth AmericanSouth American IndianSoviet UnionSpaniardSpanishSpanish AmericanSpanish American IndianSri LankanSubsaharan AfricanSudaneseSwedishSwissSyrianTaiwaneseThaiTlingit-HaidaTohono O'OdhamTonganTrinidadian and TobagonianTsimshianTurkishU.S. Virgin IslanderUgandanUkrainianUruguayanUteVenezuelanVietnameseWelshWest IndianYakamaYaquiYugoslavianYumanYup'ikZimbabwean
Ancestry (Percentage)
AfghanAfricanAlaska NativeAlaskan AthabascanAlbanianAleutAlsatianAmericanApacheArabArapahoArgentineanArmenianAssyrian / Chaldean / SyriacAustralianAustrianBahamianBangladeshiBarbadianBasqueBelgianBelizeanBermudanBhutaneseBlackfeetBolivianBrazilianBritishBritish West IndianBulgarianBurmeseCajunCambodianCanadianCape VerdeanCarpatho RusynCelticCentral AmericanCentral American IndianCherokeeCheyenneChickasawChileanChineseChippewaChoctawColombianColvilleComancheCosta RicanCreeCreekCroatianCrowCubanCypriotCzechCzechoslovakianDanishDelawareDominicanDutchDutch West IndianEastern EuropeanEcuadorianEgyptianEnglishEstonianEthiopianEuropeanFijianFilipinoFinnishFrenchFrench American IndianFrench CanadianGermanGerman RussianGhanaianGreekGuamanian / ChamorroGuatemalanGuyaneseHaitianHmongHonduranHopiHoumaHungarianIcelanderIndian (Asian)IndonesianInupiatIranianIraqiIrishIroquoisIsraeliItalianJamaicanJapaneseJordanianKenyanKiowaKoreanLaotianLatvianLebaneseLiberianLithuanianLumbeeLuxembourgerMacedonianMalaysianMalteseMarshalleseMenomineeMexicanMexican American IndianMongolianMoroccanNative HawaiianNavajoNepaleseNew ZealanderNicaraguanNigerianNorthern EuropeanNorwegianOkinawanOsageOttawaPaiutePakistaniPalestinianPanamanianParaguayanPennsylvania GermanPeruvianPimaPolishPortuguesePotawatomiPuebloPuerto RicanPuget Sound SalishRomanianRussianSalvadoranSamoanScandinavianScotch-IrishScottishSeminoleSenegaleseSerbianShoshoneSierra LeoneanSiouxSlavicSlovakSloveneSomaliSouth AfricanSouth AmericanSouth American IndianSoviet UnionSpaniardSpanishSpanish AmericanSpanish American IndianSri LankanSubsaharan AfricanSudaneseSwedishSwissSyrianTaiwaneseThaiTlingit-HaidaTohono O'OdhamTonganTrinidadian and TobagonianTsimshianTurkishU.S. Virgin IslanderUgandanUkrainianUruguayanUteVenezuelanVietnameseWelshWest IndianYakamaYaquiYugoslavianYumanYup'ikZimbabwean
Immigrant Origin (Total)
AfghanistanAfricaAlbaniaArgentinaArmeniaAsiaAustraliaAustriaAzoresBahamasBangladeshBarbadosBelarusBelgiumBelizeBoliviaBosnia and HerzegovinaBrazilBulgariaBurma / MyanmarCabo VerdeCambodiaCameroonCanadaCaribbeanCentral AmericaChileChinaColombiaCongoCosta RicaCroatiaCubaCzechoslovakiaDenmarkDominicaDominican RepublicEastern AfricaEastern AsiaEastern EuropeEcuadorEgyptEl SalvadorEnglandEritreaEthiopiaEuropeFijiFranceGermanyGhanaGreeceGrenadaGuatemalaGuyanaHaitiHondurasHong KongHungaryIndiaIndonesiaIranIraqIrelandIsraelItalyJamaicaJapanJordanKazakhstanKenyaKoreaKuwaitLaosLatin AmericaLatviaLebanonLiberiaLithuaniaMalaysiaMexicoMicronesiaMiddle AfricaMoldovaMoroccoNepalNetherlandsNicaraguaNigeriaNorth MacedoniaNorthern AfricaNorthern EuropeNorwayOceaniaPakistanPanamaPeruPhilippinesPolandPortugalRomaniaRussiaSaudi ArabiaScotlandSenegalSerbiaSierra LeoneSingaporeSomaliaSouth AfricaSouth AmericaSouth Central AsiaSouth Eastern AsiaSouthern EuropeSpainSri LankaSt. Vincent and the GrenadinesSudanSwedenSwitzerlandSyriaTaiwanThailandTrinidad and TobagoTurkeyUgandaUkraineUruguayUzbekistanVenezuelaVietnamWest IndiesWestern AfricaWestern AsiaWestern EuropeYemenZaireZimbabwe
Immigrant Origin (Percentage)
AfghanistanAfricaAlbaniaArgentinaArmeniaAsiaAustraliaAustriaAzoresBahamasBangladeshBarbadosBelarusBelgiumBelizeBoliviaBosnia and HerzegovinaBrazilBulgariaBurma / MyanmarCabo VerdeCambodiaCameroonCanadaCaribbeanCentral AmericaChileChinaColombiaCongoCosta RicaCroatiaCubaCzechoslovakiaDenmarkDominicaDominican RepublicEastern AfricaEastern AsiaEastern EuropeEcuadorEgyptEl SalvadorEnglandEritreaEthiopiaEuropeFijiFranceGermanyGhanaGreeceGrenadaGuatemalaGuyanaHaitiHondurasHong KongHungaryIndiaIndonesiaIranIraqIrelandIsraelItalyJamaicaJapanJordanKazakhstanKenyaKoreaKuwaitLaosLatin AmericaLatviaLebanonLiberiaLithuaniaMalaysiaMexicoMicronesiaMiddle AfricaMoldovaMoroccoNepalNetherlandsNicaraguaNigeriaNorth MacedoniaNorthern AfricaNorthern EuropeNorwayOceaniaPakistanPanamaPeruPhilippinesPolandPortugalRomaniaRussiaSaudi ArabiaScotlandSenegalSerbiaSierra LeoneSingaporeSomaliaSouth AfricaSouth AmericaSouth Central AsiaSouth Eastern AsiaSouthern EuropeSpainSri LankaSt. Vincent and the GrenadinesSudanSwedenSwitzerlandSyriaTaiwanThailandTrinidad and TobagoTurkeyUgandaUkraineUruguayUzbekistanVenezuelaVietnamWest IndiesWestern AfricaWestern AsiaWestern EuropeYemenZaireZimbabwe
Income
Income (Families)
Income (Households)
Poverty
Poverty (Families)
Unemployment
Employment Occupations
Employment Industries
Employer Class
Commute Time
Commute Means
School Enrollment
Education by Degree Field
Occupancy
Finances
Physical Characteristics
Tennessee
Compare Cities
Comparison Subject

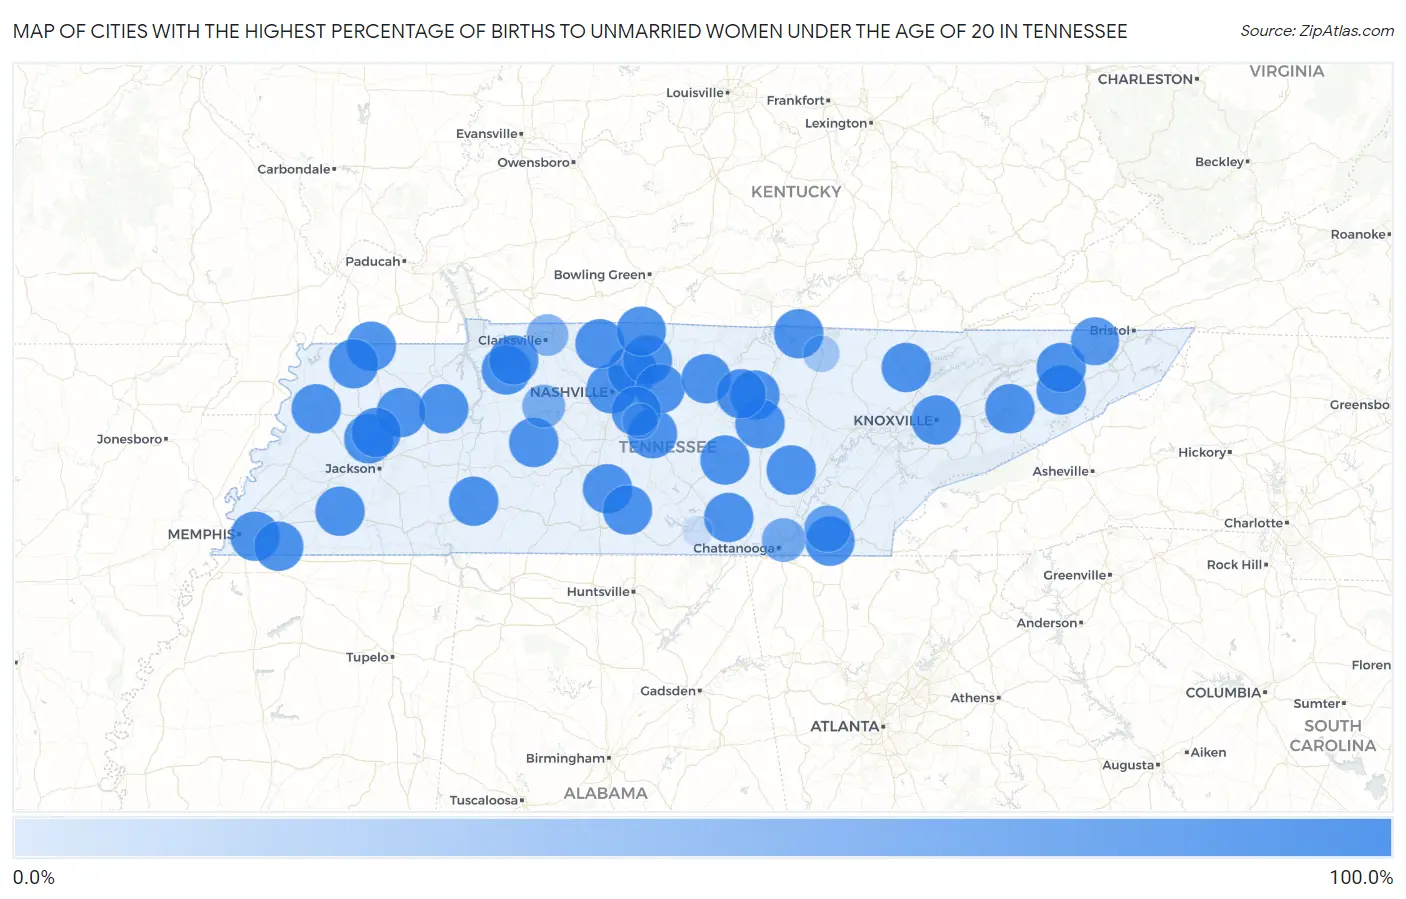
Map of Cities with the Highest Percentage of Births to Unmarried Women under the Age of 20 in Tennessee

0.0%
100.0%
Cities with the Highest Percentage of Births to Unmarried Women under the Age of 20 in Tennessee Map

Cities with the Highest Percentage of Births to Unmarried Women under the Age of 20 in Tennessee

City % Unmarried vs State vs National
1.Nashville100.0%85.2%(+14.8)#186.9%(+13.1)#5
2.Memphis100.0%85.2%(+14.8)#286.9%(+13.1)#9
3.Knoxville100.0%85.2%(+14.8)#386.9%(+13.1)#62
4.Murfreesboro100.0%85.2%(+14.8)#486.9%(+13.1)#86
5.Hendersonville100.0%85.2%(+14.8)#586.9%(+13.1)#297
6.Collierville100.0%85.2%(+14.8)#686.9%(+13.1)#355
7.Gallatin100.0%85.2%(+14.8)#786.9%(+13.1)#392
8.Lebanon100.0%85.2%(+14.8)#886.9%(+13.1)#435
9.La Vergne100.0%85.2%(+14.8)#986.9%(+13.1)#444
10.Cookeville100.0%85.2%(+14.8)#1086.9%(+13.1)#478
11.Springfield100.0%85.2%(+14.8)#1186.9%(+13.1)#701
12.Dyersburg100.0%85.2%(+14.8)#1286.9%(+13.1)#762
13.Greeneville100.0%85.2%(+14.8)#1386.9%(+13.1)#778
14.Mcminnville100.0%85.2%(+14.8)#1486.9%(+13.1)#832
15.Portland100.0%85.2%(+14.8)#1586.9%(+13.1)#848
16.Lewisburg100.0%85.2%(+14.8)#1686.9%(+13.1)#874
17.Humboldt100.0%85.2%(+14.8)#1786.9%(+13.1)#1,031
18.Sparta100.0%85.2%(+14.8)#1886.9%(+13.1)#1,150
19.Whiteville100.0%85.2%(+14.8)#1986.9%(+13.1)#1,164
20.Wildwood Lake100.0%85.2%(+14.8)#2086.9%(+13.1)#1,215
21.Centerville100.0%85.2%(+14.8)#2186.9%(+13.1)#1,232
22.Jacksboro100.0%85.2%(+14.8)#2286.9%(+13.1)#1,298
23.Clifton100.0%85.2%(+14.8)#2386.9%(+13.1)#1,317
24.Pikeville100.0%85.2%(+14.8)#2486.9%(+13.1)#1,324
25.Carthage100.0%85.2%(+14.8)#2586.9%(+13.1)#1,332
26.South Fulton100.0%85.2%(+14.8)#2686.9%(+13.1)#1,353
27.Tracy City100.0%85.2%(+14.8)#2786.9%(+13.1)#1,402
28.Baxter100.0%85.2%(+14.8)#2886.9%(+13.1)#1,502
29.Erin100.0%85.2%(+14.8)#2986.9%(+13.1)#1,508
30.Bruceton100.0%85.2%(+14.8)#3086.9%(+13.1)#1,540
31.Byrdstown100.0%85.2%(+14.8)#3186.9%(+13.1)#1,545
32.Trezevant100.0%85.2%(+14.8)#3286.9%(+13.1)#1,582
33.Fowlkes100.0%85.2%(+14.8)#3386.9%(+13.1)#1,656
34.Baneberry100.0%85.2%(+14.8)#3486.9%(+13.1)#1,743
35.Petersburg100.0%85.2%(+14.8)#3586.9%(+13.1)#1,764
36.Gibson100.0%85.2%(+14.8)#3686.9%(+13.1)#1,767
37.Baileyton100.0%85.2%(+14.8)#3786.9%(+13.1)#1,797
38.Cumberland City100.0%85.2%(+14.8)#3886.9%(+13.1)#1,853
39.Rives100.0%85.2%(+14.8)#3986.9%(+13.1)#1,914
40.Kingsport92.6%85.2%(+7.40)#4086.9%(+5.70)#1,961
41.Cleveland84.0%85.2%(-1.20)#4186.9%(-2.90)#1,996
42.Chattanooga70.4%85.2%(-14.8)#4286.9%(-16.5)#2,048
43.Dickson66.7%85.2%(-18.5)#4386.9%(-20.2)#2,057
44.Clarksville59.7%85.2%(-25.5)#4486.9%(-27.2)#2,077
45.Jamestown33.3%85.2%(-51.9)#4586.9%(-53.6)#2,112
46.Smyrna29.1%85.2%(-56.1)#4686.9%(-57.8)#2,118
47.Cowan2.7%85.2%(-82.5)#4786.9%(-84.2)#2,143

Common Questions

What are the Top 10 Cities with the Highest Percentage of Births to Unmarried Women under the Age of 20 in Tennessee?
Top 10 Cities with the Highest Percentage of Births to Unmarried Women under the Age of 20 in Tennessee are:
#1
100.0%
#2
100.0%
#3
100.0%
#4
100.0%
#5
100.0%
#6
100.0%
#7
100.0%
#8
100.0%
#9
100.0%
#10
100.0%
What city has the Highest Percentage of Births to Unmarried Women under the Age of 20 in Tennessee?
Nashville has the Highest Percentage of Births to Unmarried Women under the Age of 20 in Tennessee with 100.0%.
What is the Percentage of Births to Unmarried Women under the Age of 20 in the State of Tennessee?
Percentage of Births to Unmarried Women under the Age of 20 in Tennessee is 85.2%.
What is the Percentage of Births to Unmarried Women under the Age of 20 in the United States?
Percentage of Births to Unmarried Women under the Age of 20 in the United States is 86.9%.