Cities with the Highest Percentage of Births to Unmarried Women under the Age of 20 in Texas
RELATED REPORTS & OPTIONS
Highest Illegitimacy | Women 15-19
Texas
Compare Cities
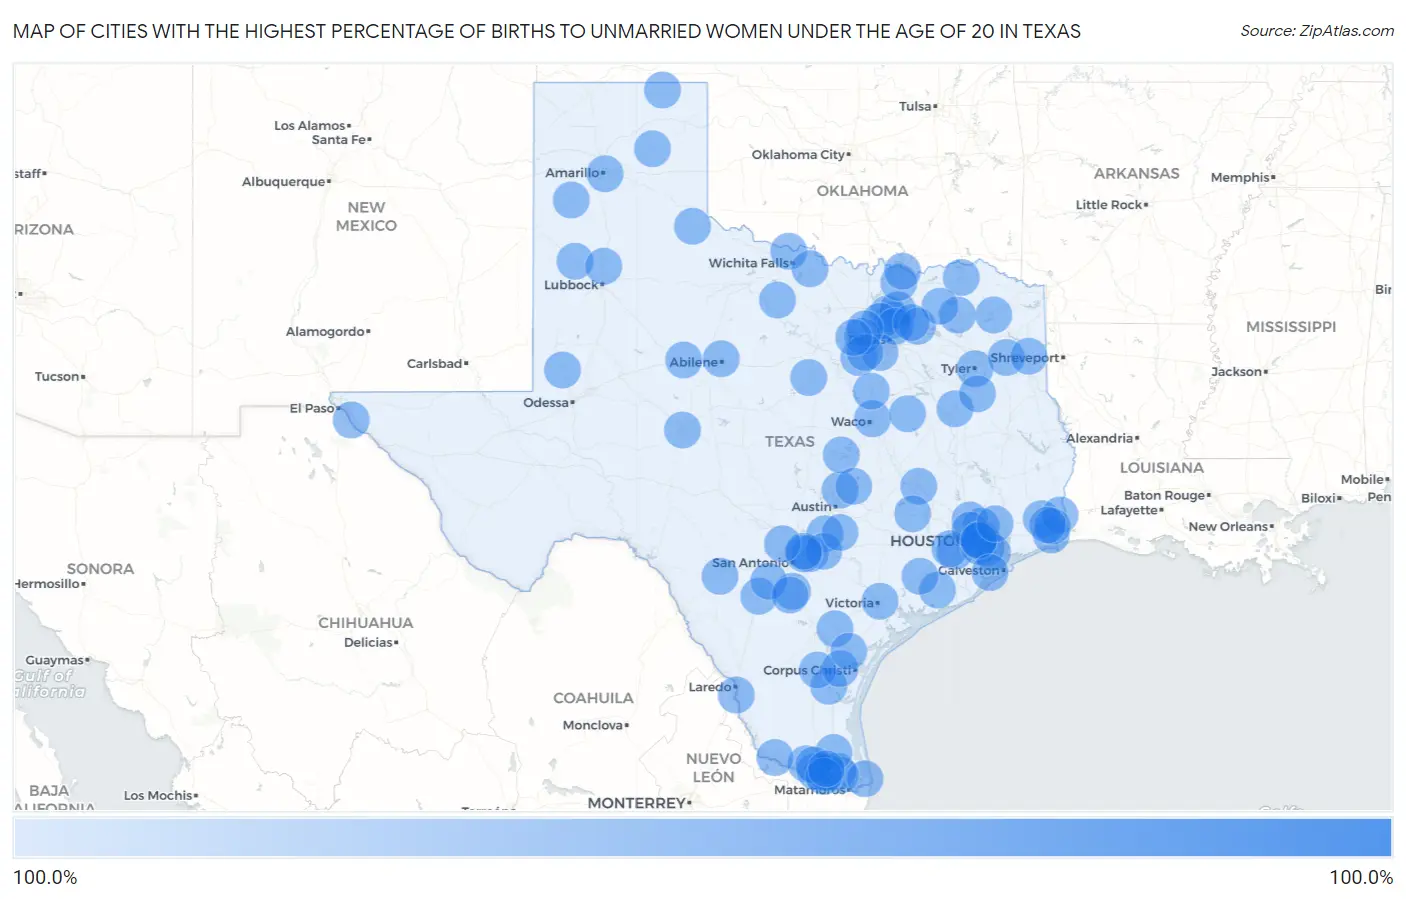
Map of Cities with the Highest Percentage of Births to Unmarried Women under the Age of 20 in Texas
0.0%
100.0%
Cities with the Highest Percentage of Births to Unmarried Women under the Age of 20 in Texas
| City | % Unmarried | vs State | vs National | |
| 1. | Plano | 100.0% | 81.3%(+18.7)#1 | 86.9%(+13.1)#32 |
| 2. | Frisco | 100.0% | 81.3%(+18.7)#2 | 86.9%(+13.1)#53 |
| 3. | Amarillo | 100.0% | 81.3%(+18.7)#3 | 86.9%(+13.1)#55 |
| 4. | Mckinney | 100.0% | 81.3%(+18.7)#4 | 86.9%(+13.1)#60 |
| 5. | Pasadena | 100.0% | 81.3%(+18.7)#5 | 86.9%(+13.1)#88 |
| 6. | Mcallen | 100.0% | 81.3%(+18.7)#6 | 86.9%(+13.1)#92 |
| 7. | Abilene | 100.0% | 81.3%(+18.7)#7 | 86.9%(+13.1)#107 |
| 8. | Lewisville | 100.0% | 81.3%(+18.7)#8 | 86.9%(+13.1)#110 |
| 9. | Round Rock | 100.0% | 81.3%(+18.7)#9 | 86.9%(+13.1)#116 |
| 10. | College Station | 100.0% | 81.3%(+18.7)#10 | 86.9%(+13.1)#117 |
| 11. | Richardson | 100.0% | 81.3%(+18.7)#11 | 86.9%(+13.1)#118 |
| 12. | Beaumont | 100.0% | 81.3%(+18.7)#12 | 86.9%(+13.1)#127 |
| 13. | Sugar Land | 100.0% | 81.3%(+18.7)#13 | 86.9%(+13.1)#143 |
| 14. | Tyler | 100.0% | 81.3%(+18.7)#14 | 86.9%(+13.1)#151 |
| 15. | San Angelo | 100.0% | 81.3%(+18.7)#15 | 86.9%(+13.1)#169 |
| 16. | Atascocita | 100.0% | 81.3%(+18.7)#16 | 86.9%(+13.1)#195 |
| 17. | Longview | 100.0% | 81.3%(+18.7)#17 | 86.9%(+13.1)#216 |
| 18. | Harlingen | 100.0% | 81.3%(+18.7)#18 | 86.9%(+13.1)#251 |
| 19. | San Marcos | 100.0% | 81.3%(+18.7)#19 | 86.9%(+13.1)#269 |
| 20. | Victoria | 100.0% | 81.3%(+18.7)#20 | 86.9%(+13.1)#278 |
| 21. | Spring | 100.0% | 81.3%(+18.7)#21 | 86.9%(+13.1)#285 |
| 22. | Port Arthur | 100.0% | 81.3%(+18.7)#22 | 86.9%(+13.1)#324 |
| 23. | Burleson | 100.0% | 81.3%(+18.7)#23 | 86.9%(+13.1)#371 |
| 24. | Cedar Hill | 100.0% | 81.3%(+18.7)#24 | 86.9%(+13.1)#372 |
| 25. | Haltom City | 100.0% | 81.3%(+18.7)#25 | 86.9%(+13.1)#388 |
| 26. | Keller | 100.0% | 81.3%(+18.7)#26 | 86.9%(+13.1)#389 |
| 27. | Sherman | 100.0% | 81.3%(+18.7)#27 | 86.9%(+13.1)#405 |
| 28. | Weslaco | 100.0% | 81.3%(+18.7)#28 | 86.9%(+13.1)#425 |
| 29. | Harker Heights | 100.0% | 81.3%(+18.7)#29 | 86.9%(+13.1)#501 |
| 30. | Cibolo | 100.0% | 81.3%(+18.7)#30 | 86.9%(+13.1)#505 |
| 31. | Seguin | 100.0% | 81.3%(+18.7)#31 | 86.9%(+13.1)#530 |
| 32. | Kingsville | 100.0% | 81.3%(+18.7)#32 | 86.9%(+13.1)#582 |
| 33. | Denison | 100.0% | 81.3%(+18.7)#33 | 86.9%(+13.1)#593 |
| 34. | San Benito | 100.0% | 81.3%(+18.7)#34 | 86.9%(+13.1)#596 |
| 35. | Cloverleaf | 100.0% | 81.3%(+18.7)#35 | 86.9%(+13.1)#597 |
| 36. | Paris | 100.0% | 81.3%(+18.7)#36 | 86.9%(+13.1)#598 |
| 37. | Marshall | 100.0% | 81.3%(+18.7)#37 | 86.9%(+13.1)#614 |
| 38. | Pecan Grove | 100.0% | 81.3%(+18.7)#38 | 86.9%(+13.1)#628 |
| 39. | Stephenville | 100.0% | 81.3%(+18.7)#39 | 86.9%(+13.1)#656 |
| 40. | Alamo | 100.0% | 81.3%(+18.7)#40 | 86.9%(+13.1)#682 |
| 41. | Universal City | 100.0% | 81.3%(+18.7)#41 | 86.9%(+13.1)#683 |
| 42. | Orange | 100.0% | 81.3%(+18.7)#42 | 86.9%(+13.1)#693 |
| 43. | Palestine | 100.0% | 81.3%(+18.7)#43 | 86.9%(+13.1)#702 |
| 44. | Alice | 100.0% | 81.3%(+18.7)#44 | 86.9%(+13.1)#717 |
| 45. | Bay City | 100.0% | 81.3%(+18.7)#45 | 86.9%(+13.1)#719 |
| 46. | Brenham | 100.0% | 81.3%(+18.7)#46 | 86.9%(+13.1)#720 |
| 47. | Pampa | 100.0% | 81.3%(+18.7)#47 | 86.9%(+13.1)#737 |
| 48. | Taylor | 100.0% | 81.3%(+18.7)#48 | 86.9%(+13.1)#750 |
| 49. | Mercedes | 100.0% | 81.3%(+18.7)#49 | 86.9%(+13.1)#754 |
| 50. | South Houston | 100.0% | 81.3%(+18.7)#50 | 86.9%(+13.1)#763 |
| 51. | Mount Pleasant | 100.0% | 81.3%(+18.7)#51 | 86.9%(+13.1)#765 |
| 52. | Sulphur Springs | 100.0% | 81.3%(+18.7)#52 | 86.9%(+13.1)#766 |
| 53. | Rendon | 100.0% | 81.3%(+18.7)#53 | 86.9%(+13.1)#775 |
| 54. | Aldine | 100.0% | 81.3%(+18.7)#54 | 86.9%(+13.1)#776 |
| 55. | Uvalde | 100.0% | 81.3%(+18.7)#55 | 86.9%(+13.1)#781 |
| 56. | Rio Grande City | 100.0% | 81.3%(+18.7)#56 | 86.9%(+13.1)#782 |
| 57. | Royse City | 100.0% | 81.3%(+18.7)#57 | 86.9%(+13.1)#789 |
| 58. | Hereford | 100.0% | 81.3%(+18.7)#58 | 86.9%(+13.1)#797 |
| 59. | Lockhart | 100.0% | 81.3%(+18.7)#59 | 86.9%(+13.1)#808 |
| 60. | Jacksonville | 100.0% | 81.3%(+18.7)#60 | 86.9%(+13.1)#824 |
| 61. | Beeville | 100.0% | 81.3%(+18.7)#61 | 86.9%(+13.1)#835 |
| 62. | Port Neches | 100.0% | 81.3%(+18.7)#62 | 86.9%(+13.1)#836 |
| 63. | Seabrook | 100.0% | 81.3%(+18.7)#63 | 86.9%(+13.1)#838 |
| 64. | Andrews | 100.0% | 81.3%(+18.7)#64 | 86.9%(+13.1)#844 |
| 65. | El Campo | 100.0% | 81.3%(+18.7)#65 | 86.9%(+13.1)#880 |
| 66. | Selma | 100.0% | 81.3%(+18.7)#66 | 86.9%(+13.1)#909 |
| 67. | Burkburnett | 100.0% | 81.3%(+18.7)#67 | 86.9%(+13.1)#910 |
| 68. | Pleasanton | 100.0% | 81.3%(+18.7)#68 | 86.9%(+13.1)#917 |
| 69. | Galena Park | 100.0% | 81.3%(+18.7)#69 | 86.9%(+13.1)#919 |
| 70. | Sweetwater | 100.0% | 81.3%(+18.7)#70 | 86.9%(+13.1)#924 |
| 71. | Bellmead | 100.0% | 81.3%(+18.7)#71 | 86.9%(+13.1)#927 |
| 72. | Raymondville | 100.0% | 81.3%(+18.7)#72 | 86.9%(+13.1)#934 |
| 73. | Robstown | 100.0% | 81.3%(+18.7)#73 | 86.9%(+13.1)#937 |
| 74. | San Elizario | 100.0% | 81.3%(+18.7)#74 | 86.9%(+13.1)#946 |
| 75. | Scenic Oaks | 100.0% | 81.3%(+18.7)#75 | 86.9%(+13.1)#948 |
| 76. | Jacinto City | 100.0% | 81.3%(+18.7)#76 | 86.9%(+13.1)#963 |
| 77. | Commerce | 100.0% | 81.3%(+18.7)#77 | 86.9%(+13.1)#981 |
| 78. | Pearsall | 100.0% | 81.3%(+18.7)#78 | 86.9%(+13.1)#987 |
| 79. | Dayton | 100.0% | 81.3%(+18.7)#79 | 86.9%(+13.1)#989 |
| 80. | Murillo | 100.0% | 81.3%(+18.7)#80 | 86.9%(+13.1)#994 |
| 81. | Perryton | 100.0% | 81.3%(+18.7)#81 | 86.9%(+13.1)#999 |
| 82. | Hillsboro | 100.0% | 81.3%(+18.7)#82 | 86.9%(+13.1)#1,019 |
| 83. | Hitchcock | 100.0% | 81.3%(+18.7)#83 | 86.9%(+13.1)#1,046 |
| 84. | Mexia | 100.0% | 81.3%(+18.7)#84 | 86.9%(+13.1)#1,065 |
| 85. | Littlefield | 100.0% | 81.3%(+18.7)#85 | 86.9%(+13.1)#1,101 |
| 86. | Childress | 100.0% | 81.3%(+18.7)#86 | 86.9%(+13.1)#1,108 |
| 87. | Sinton | 100.0% | 81.3%(+18.7)#87 | 86.9%(+13.1)#1,124 |
| 88. | Port Isabel | 100.0% | 81.3%(+18.7)#88 | 86.9%(+13.1)#1,143 |
| 89. | Lavon | 100.0% | 81.3%(+18.7)#89 | 86.9%(+13.1)#1,151 |
| 90. | Progreso | 100.0% | 81.3%(+18.7)#90 | 86.9%(+13.1)#1,152 |
| 91. | Lake Worth | 100.0% | 81.3%(+18.7)#91 | 86.9%(+13.1)#1,165 |
| 92. | Rio Bravo | 100.0% | 81.3%(+18.7)#92 | 86.9%(+13.1)#1,176 |
| 93. | Devine | 100.0% | 81.3%(+18.7)#93 | 86.9%(+13.1)#1,182 |
| 94. | Jourdanton | 100.0% | 81.3%(+18.7)#94 | 86.9%(+13.1)#1,199 |
| 95. | Central Gardens | 100.0% | 81.3%(+18.7)#95 | 86.9%(+13.1)#1,223 |
| 96. | Abernathy | 100.0% | 81.3%(+18.7)#96 | 86.9%(+13.1)#1,250 |
| 97. | Indian Hills | 100.0% | 81.3%(+18.7)#97 | 86.9%(+13.1)#1,256 |
| 98. | Henrietta | 100.0% | 81.3%(+18.7)#98 | 86.9%(+13.1)#1,260 |
| 99. | Reno City Parker And Tarrant Counties | 100.0% | 81.3%(+18.7)#99 | 86.9%(+13.1)#1,267 |
| 100. | Olney | 100.0% | 81.3%(+18.7)#100 | 86.9%(+13.1)#1,268 |
Common Questions
What are the Top 10 Cities with the Highest Percentage of Births to Unmarried Women under the Age of 20 in Texas?
Top 10 Cities with the Highest Percentage of Births to Unmarried Women under the Age of 20 in Texas are:
#1
100.0%
#2
100.0%
#3
100.0%
#4
100.0%
#5
100.0%
#6
100.0%
#7
100.0%
#8
100.0%
#9
100.0%
#10
100.0%
What city has the Highest Percentage of Births to Unmarried Women under the Age of 20 in Texas?
Plano has the Highest Percentage of Births to Unmarried Women under the Age of 20 in Texas with 100.0%.
What is the Percentage of Births to Unmarried Women under the Age of 20 in the State of Texas?
Percentage of Births to Unmarried Women under the Age of 20 in Texas is 81.3%.
What is the Percentage of Births to Unmarried Women under the Age of 20 in the United States?
Percentage of Births to Unmarried Women under the Age of 20 in the United States is 86.9%.