Cities with the Highest Percentage of Births to Unmarried Women under the Age of 20 in Virginia

RELATED REPORTS & OPTIONS

Highest Illegitimacy | Women 15-19
Population
Families and Households
Female Fertility
Female Fertility (Unmarried)
Race (Community Size)
Race (Percentage)
Ancestry (Community Size)
AfghanAfricanAlaska NativeAlaskan AthabascanAlbanianAleutAlsatianAmericanApacheArabArapahoArgentineanArmenianAssyrian / Chaldean / SyriacAustralianAustrianBahamianBangladeshiBarbadianBasqueBelgianBelizeanBermudanBhutaneseBlackfeetBolivianBrazilianBritishBritish West IndianBulgarianBurmeseCajunCambodianCanadianCape VerdeanCarpatho RusynCelticCentral AmericanCentral American IndianCherokeeCheyenneChickasawChileanChineseChippewaChoctawColombianColvilleComancheCosta RicanCreeCreekCroatianCrowCubanCypriotCzechCzechoslovakianDanishDelawareDominicanDutchDutch West IndianEastern EuropeanEcuadorianEgyptianEnglishEstonianEthiopianEuropeanFijianFilipinoFinnishFrenchFrench American IndianFrench CanadianGermanGerman RussianGhanaianGreekGuamanian / ChamorroGuatemalanGuyaneseHaitianHmongHonduranHopiHoumaHungarianIcelanderIndian (Asian)IndonesianInupiatIranianIraqiIrishIroquoisIsraeliItalianJamaicanJapaneseJordanianKenyanKiowaKoreanLaotianLatvianLebaneseLiberianLithuanianLumbeeLuxembourgerMacedonianMalaysianMalteseMarshalleseMenomineeMexicanMexican American IndianMongolianMoroccanNative HawaiianNavajoNepaleseNew ZealanderNicaraguanNigerianNorthern EuropeanNorwegianOkinawanOsageOttawaPaiutePakistaniPalestinianPanamanianParaguayanPennsylvania GermanPeruvianPimaPolishPortuguesePotawatomiPuebloPuerto RicanPuget Sound SalishRomanianRussianSalvadoranSamoanScandinavianScotch-IrishScottishSeminoleSenegaleseSerbianShoshoneSierra LeoneanSiouxSlavicSlovakSloveneSomaliSouth AfricanSouth AmericanSouth American IndianSoviet UnionSpaniardSpanishSpanish AmericanSpanish American IndianSri LankanSubsaharan AfricanSudaneseSwedishSwissSyrianTaiwaneseThaiTlingit-HaidaTohono O'OdhamTonganTrinidadian and TobagonianTsimshianTurkishU.S. Virgin IslanderUgandanUkrainianUruguayanUteVenezuelanVietnameseWelshWest IndianYakamaYaquiYugoslavianYumanYup'ikZimbabwean
Ancestry (Percentage)
AfghanAfricanAlaska NativeAlaskan AthabascanAlbanianAleutAlsatianAmericanApacheArabArapahoArgentineanArmenianAssyrian / Chaldean / SyriacAustralianAustrianBahamianBangladeshiBarbadianBasqueBelgianBelizeanBermudanBhutaneseBlackfeetBolivianBrazilianBritishBritish West IndianBulgarianBurmeseCajunCambodianCanadianCape VerdeanCarpatho RusynCelticCentral AmericanCentral American IndianCherokeeCheyenneChickasawChileanChineseChippewaChoctawColombianColvilleComancheCosta RicanCreeCreekCroatianCrowCubanCypriotCzechCzechoslovakianDanishDelawareDominicanDutchDutch West IndianEastern EuropeanEcuadorianEgyptianEnglishEstonianEthiopianEuropeanFijianFilipinoFinnishFrenchFrench American IndianFrench CanadianGermanGerman RussianGhanaianGreekGuamanian / ChamorroGuatemalanGuyaneseHaitianHmongHonduranHopiHoumaHungarianIcelanderIndian (Asian)IndonesianInupiatIranianIraqiIrishIroquoisIsraeliItalianJamaicanJapaneseJordanianKenyanKiowaKoreanLaotianLatvianLebaneseLiberianLithuanianLumbeeLuxembourgerMacedonianMalaysianMalteseMarshalleseMenomineeMexicanMexican American IndianMongolianMoroccanNative HawaiianNavajoNepaleseNew ZealanderNicaraguanNigerianNorthern EuropeanNorwegianOkinawanOsageOttawaPaiutePakistaniPalestinianPanamanianParaguayanPennsylvania GermanPeruvianPimaPolishPortuguesePotawatomiPuebloPuerto RicanPuget Sound SalishRomanianRussianSalvadoranSamoanScandinavianScotch-IrishScottishSeminoleSenegaleseSerbianShoshoneSierra LeoneanSiouxSlavicSlovakSloveneSomaliSouth AfricanSouth AmericanSouth American IndianSoviet UnionSpaniardSpanishSpanish AmericanSpanish American IndianSri LankanSubsaharan AfricanSudaneseSwedishSwissSyrianTaiwaneseThaiTlingit-HaidaTohono O'OdhamTonganTrinidadian and TobagonianTsimshianTurkishU.S. Virgin IslanderUgandanUkrainianUruguayanUteVenezuelanVietnameseWelshWest IndianYakamaYaquiYugoslavianYumanYup'ikZimbabwean
Immigrant Origin (Total)
AfghanistanAfricaAlbaniaArgentinaArmeniaAsiaAustraliaAustriaAzoresBahamasBangladeshBarbadosBelarusBelgiumBelizeBoliviaBosnia and HerzegovinaBrazilBulgariaBurma / MyanmarCabo VerdeCambodiaCameroonCanadaCaribbeanCentral AmericaChileChinaColombiaCongoCosta RicaCroatiaCubaCzechoslovakiaDenmarkDominicaDominican RepublicEastern AfricaEastern AsiaEastern EuropeEcuadorEgyptEl SalvadorEnglandEritreaEthiopiaEuropeFijiFranceGermanyGhanaGreeceGrenadaGuatemalaGuyanaHaitiHondurasHong KongHungaryIndiaIndonesiaIranIraqIrelandIsraelItalyJamaicaJapanJordanKazakhstanKenyaKoreaKuwaitLaosLatin AmericaLatviaLebanonLiberiaLithuaniaMalaysiaMexicoMicronesiaMiddle AfricaMoldovaMoroccoNepalNetherlandsNicaraguaNigeriaNorth MacedoniaNorthern AfricaNorthern EuropeNorwayOceaniaPakistanPanamaPeruPhilippinesPolandPortugalRomaniaRussiaSaudi ArabiaScotlandSenegalSerbiaSierra LeoneSingaporeSomaliaSouth AfricaSouth AmericaSouth Central AsiaSouth Eastern AsiaSouthern EuropeSpainSri LankaSt. Vincent and the GrenadinesSudanSwedenSwitzerlandSyriaTaiwanThailandTrinidad and TobagoTurkeyUgandaUkraineUruguayUzbekistanVenezuelaVietnamWest IndiesWestern AfricaWestern AsiaWestern EuropeYemenZaireZimbabwe
Immigrant Origin (Percentage)
AfghanistanAfricaAlbaniaArgentinaArmeniaAsiaAustraliaAustriaAzoresBahamasBangladeshBarbadosBelarusBelgiumBelizeBoliviaBosnia and HerzegovinaBrazilBulgariaBurma / MyanmarCabo VerdeCambodiaCameroonCanadaCaribbeanCentral AmericaChileChinaColombiaCongoCosta RicaCroatiaCubaCzechoslovakiaDenmarkDominicaDominican RepublicEastern AfricaEastern AsiaEastern EuropeEcuadorEgyptEl SalvadorEnglandEritreaEthiopiaEuropeFijiFranceGermanyGhanaGreeceGrenadaGuatemalaGuyanaHaitiHondurasHong KongHungaryIndiaIndonesiaIranIraqIrelandIsraelItalyJamaicaJapanJordanKazakhstanKenyaKoreaKuwaitLaosLatin AmericaLatviaLebanonLiberiaLithuaniaMalaysiaMexicoMicronesiaMiddle AfricaMoldovaMoroccoNepalNetherlandsNicaraguaNigeriaNorth MacedoniaNorthern AfricaNorthern EuropeNorwayOceaniaPakistanPanamaPeruPhilippinesPolandPortugalRomaniaRussiaSaudi ArabiaScotlandSenegalSerbiaSierra LeoneSingaporeSomaliaSouth AfricaSouth AmericaSouth Central AsiaSouth Eastern AsiaSouthern EuropeSpainSri LankaSt. Vincent and the GrenadinesSudanSwedenSwitzerlandSyriaTaiwanThailandTrinidad and TobagoTurkeyUgandaUkraineUruguayUzbekistanVenezuelaVietnamWest IndiesWestern AfricaWestern AsiaWestern EuropeYemenZaireZimbabwe
Income
Income (Families)
Income (Households)
Poverty
Poverty (Families)
Unemployment
Employment Occupations
Employment Industries
Employer Class
Commute Time
Commute Means
School Enrollment
Education by Degree Field
Occupancy
Finances
Physical Characteristics
Virginia
Compare Cities
Comparison Subject

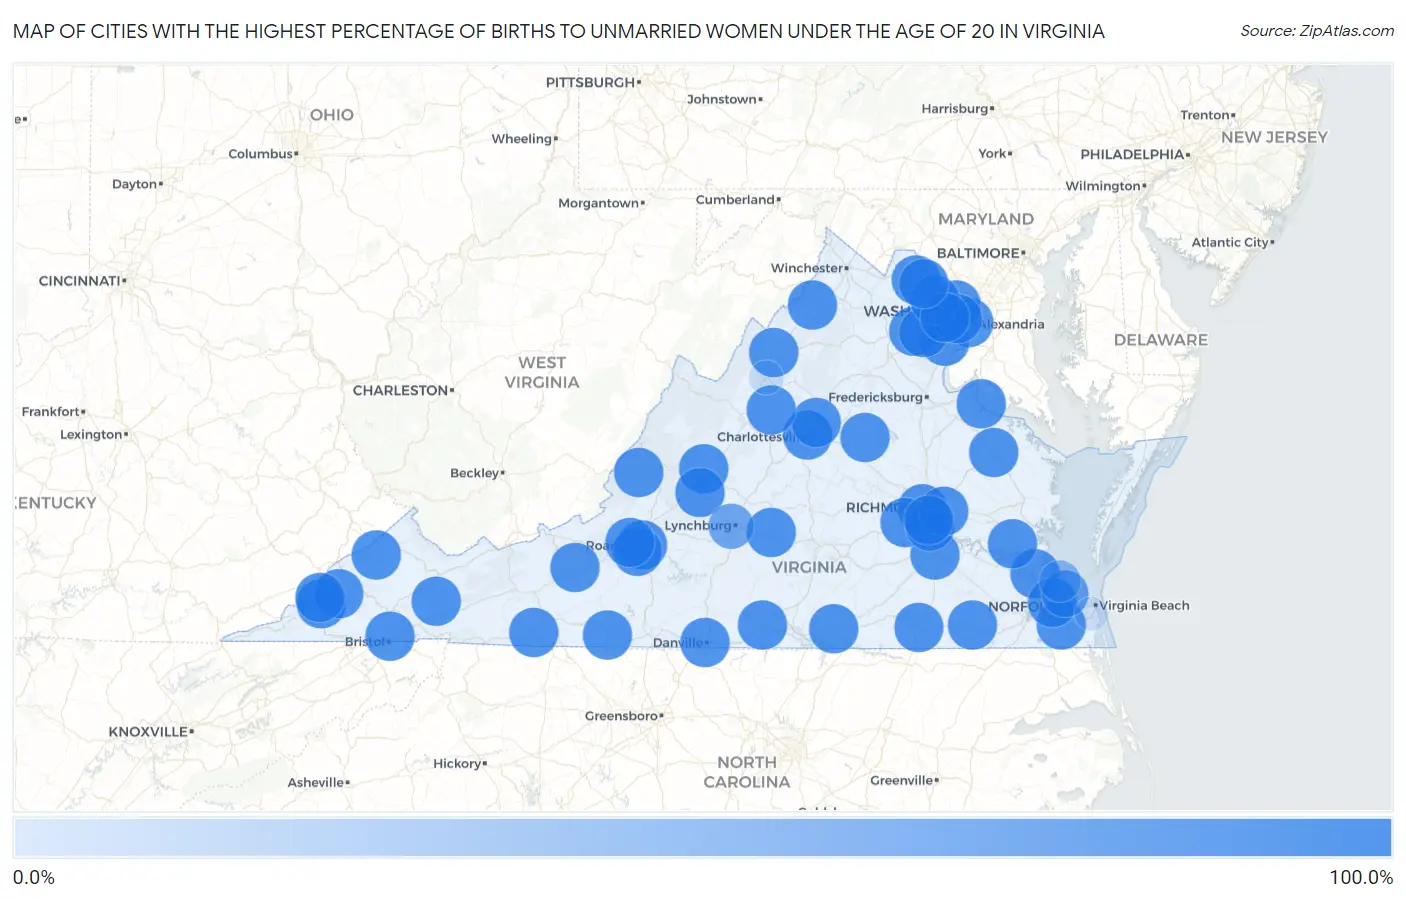
Map of Cities with the Highest Percentage of Births to Unmarried Women under the Age of 20 in Virginia

0.0%
100.0%
Cities with the Highest Percentage of Births to Unmarried Women under the Age of 20 in Virginia Map

Cities with the Highest Percentage of Births to Unmarried Women under the Age of 20 in Virginia

City % Unmarried vs State vs National
1.Chesapeake100.0%92.0%(+8.00)#186.9%(+13.1)#41
2.Richmond100.0%92.0%(+8.00)#286.9%(+13.1)#43
3.Newport News100.0%92.0%(+8.00)#386.9%(+13.1)#69
4.Alexandria100.0%92.0%(+8.00)#486.9%(+13.1)#83
5.Roanoke100.0%92.0%(+8.00)#586.9%(+13.1)#170
6.Portsmouth100.0%92.0%(+8.00)#686.9%(+13.1)#172
7.Mclean100.0%92.0%(+8.00)#786.9%(+13.1)#367
8.Leesburg100.0%92.0%(+8.00)#886.9%(+13.1)#373
9.Lake Ridge100.0%92.0%(+8.00)#986.9%(+13.1)#396
10.Linton Hall100.0%92.0%(+8.00)#1086.9%(+13.1)#412
11.Manassas100.0%92.0%(+8.00)#1186.9%(+13.1)#414
12.Danville100.0%92.0%(+8.00)#1286.9%(+13.1)#415
13.Annandale100.0%92.0%(+8.00)#1386.9%(+13.1)#417
14.Petersburg100.0%92.0%(+8.00)#1486.9%(+13.1)#495
15.Cave Spring100.0%92.0%(+8.00)#1586.9%(+13.1)#574
16.Salem100.0%92.0%(+8.00)#1686.9%(+13.1)#580
17.Herndon100.0%92.0%(+8.00)#1786.9%(+13.1)#601
18.Fairfax100.0%92.0%(+8.00)#1886.9%(+13.1)#606
19.Bristol100.0%92.0%(+8.00)#1986.9%(+13.1)#731
20.Radford100.0%92.0%(+8.00)#2086.9%(+13.1)#753
21.Williamsburg100.0%92.0%(+8.00)#2186.9%(+13.1)#777
22.Brandermill100.0%92.0%(+8.00)#2286.9%(+13.1)#815
23.Lansdowne100.0%92.0%(+8.00)#2386.9%(+13.1)#862
24.University Of Virginia100.0%92.0%(+8.00)#2486.9%(+13.1)#959
25.Hollymead100.0%92.0%(+8.00)#2586.9%(+13.1)#996
26.South Boston100.0%92.0%(+8.00)#2686.9%(+13.1)#1,027
27.Bellwood100.0%92.0%(+8.00)#2786.9%(+13.1)#1,034
28.Sandston100.0%92.0%(+8.00)#2886.9%(+13.1)#1,056
29.Galax100.0%92.0%(+8.00)#2986.9%(+13.1)#1,068
30.Bensley100.0%92.0%(+8.00)#3086.9%(+13.1)#1,098
31.Covington100.0%92.0%(+8.00)#3186.9%(+13.1)#1,113
32.Emporia100.0%92.0%(+8.00)#3286.9%(+13.1)#1,114
33.Big Stone Gap100.0%92.0%(+8.00)#3386.9%(+13.1)#1,137
34.Broadway100.0%92.0%(+8.00)#3486.9%(+13.1)#1,197
35.Colonial Beach100.0%92.0%(+8.00)#3586.9%(+13.1)#1,210
36.Norton100.0%92.0%(+8.00)#3686.9%(+13.1)#1,222
37.Louisa100.0%92.0%(+8.00)#3786.9%(+13.1)#1,376
38.Appomattox100.0%92.0%(+8.00)#3886.9%(+13.1)#1,378
39.Saltville100.0%92.0%(+8.00)#3986.9%(+13.1)#1,385
40.East Lexington100.0%92.0%(+8.00)#4086.9%(+13.1)#1,397
41.Tappahannock100.0%92.0%(+8.00)#4186.9%(+13.1)#1,418
42.Courtland100.0%92.0%(+8.00)#4286.9%(+13.1)#1,470
43.Appalachia100.0%92.0%(+8.00)#4386.9%(+13.1)#1,477
44.Stuart100.0%92.0%(+8.00)#4486.9%(+13.1)#1,489
45.Glasgow100.0%92.0%(+8.00)#4586.9%(+13.1)#1,525
46.Harriston100.0%92.0%(+8.00)#4686.9%(+13.1)#1,611
47.Maurertown100.0%92.0%(+8.00)#4786.9%(+13.1)#1,619
48.Haysi100.0%92.0%(+8.00)#4886.9%(+13.1)#1,752
49.Baskerville100.0%92.0%(+8.00)#4986.9%(+13.1)#1,907
50.Norfolk87.9%92.0%(-4.10)#5086.9%(+1.000)#1,980
51.Lynchburg78.3%92.0%(-13.7)#5186.9%(-8.60)#2,021
52.Hampton59.3%92.0%(-32.7)#5286.9%(-27.6)#2,079
53.Harrisonburg21.6%92.0%(-70.4)#5386.9%(-65.3)#2,132
54.Virginia Beach18.0%92.0%(-74.0)#5486.9%(-68.9)#2,135

Common Questions

What are the Top 10 Cities with the Highest Percentage of Births to Unmarried Women under the Age of 20 in Virginia?
Top 10 Cities with the Highest Percentage of Births to Unmarried Women under the Age of 20 in Virginia are:
#1
100.0%
#2
100.0%
#3
100.0%
#4
100.0%
#5
100.0%
#6
100.0%
#7
100.0%
#8
100.0%
#9
100.0%
#10
100.0%
What city has the Highest Percentage of Births to Unmarried Women under the Age of 20 in Virginia?
Chesapeake has the Highest Percentage of Births to Unmarried Women under the Age of 20 in Virginia with 100.0%.
What is the Percentage of Births to Unmarried Women under the Age of 20 in the State of Virginia?
Percentage of Births to Unmarried Women under the Age of 20 in Virginia is 92.0%.
What is the Percentage of Births to Unmarried Women under the Age of 20 in the United States?
Percentage of Births to Unmarried Women under the Age of 20 in the United States is 86.9%.