Cities with the Highest Percentage of Births to Unmarried Women under the Age of 20 in Arkansas

RELATED REPORTS & OPTIONS

Highest Illegitimacy | Women 15-19
Population
Families and Households
Female Fertility
Female Fertility (Unmarried)
Race (Community Size)
Race (Percentage)
Ancestry (Community Size)
AfghanAfricanAlaska NativeAlaskan AthabascanAlbanianAleutAlsatianAmericanApacheArabArapahoArgentineanArmenianAssyrian / Chaldean / SyriacAustralianAustrianBahamianBangladeshiBarbadianBasqueBelgianBelizeanBermudanBhutaneseBlackfeetBolivianBrazilianBritishBritish West IndianBulgarianBurmeseCajunCambodianCanadianCape VerdeanCarpatho RusynCelticCentral AmericanCentral American IndianCherokeeCheyenneChickasawChileanChineseChippewaChoctawColombianColvilleComancheCosta RicanCreeCreekCroatianCrowCubanCypriotCzechCzechoslovakianDanishDelawareDominicanDutchDutch West IndianEastern EuropeanEcuadorianEgyptianEnglishEstonianEthiopianEuropeanFijianFilipinoFinnishFrenchFrench American IndianFrench CanadianGermanGerman RussianGhanaianGreekGuamanian / ChamorroGuatemalanGuyaneseHaitianHmongHonduranHopiHoumaHungarianIcelanderIndian (Asian)IndonesianInupiatIranianIraqiIrishIroquoisIsraeliItalianJamaicanJapaneseJordanianKenyanKiowaKoreanLaotianLatvianLebaneseLiberianLithuanianLumbeeLuxembourgerMacedonianMalaysianMalteseMarshalleseMenomineeMexicanMexican American IndianMongolianMoroccanNative HawaiianNavajoNepaleseNew ZealanderNicaraguanNigerianNorthern EuropeanNorwegianOkinawanOsageOttawaPaiutePakistaniPalestinianPanamanianParaguayanPennsylvania GermanPeruvianPimaPolishPortuguesePotawatomiPuebloPuerto RicanPuget Sound SalishRomanianRussianSalvadoranSamoanScandinavianScotch-IrishScottishSeminoleSenegaleseSerbianShoshoneSierra LeoneanSiouxSlavicSlovakSloveneSomaliSouth AfricanSouth AmericanSouth American IndianSoviet UnionSpaniardSpanishSpanish AmericanSpanish American IndianSri LankanSubsaharan AfricanSudaneseSwedishSwissSyrianTaiwaneseThaiTlingit-HaidaTohono O'OdhamTonganTrinidadian and TobagonianTsimshianTurkishU.S. Virgin IslanderUgandanUkrainianUruguayanUteVenezuelanVietnameseWelshWest IndianYakamaYaquiYugoslavianYumanYup'ikZimbabwean
Ancestry (Percentage)
AfghanAfricanAlaska NativeAlaskan AthabascanAlbanianAleutAlsatianAmericanApacheArabArapahoArgentineanArmenianAssyrian / Chaldean / SyriacAustralianAustrianBahamianBangladeshiBarbadianBasqueBelgianBelizeanBermudanBhutaneseBlackfeetBolivianBrazilianBritishBritish West IndianBulgarianBurmeseCajunCambodianCanadianCape VerdeanCarpatho RusynCelticCentral AmericanCentral American IndianCherokeeCheyenneChickasawChileanChineseChippewaChoctawColombianColvilleComancheCosta RicanCreeCreekCroatianCrowCubanCypriotCzechCzechoslovakianDanishDelawareDominicanDutchDutch West IndianEastern EuropeanEcuadorianEgyptianEnglishEstonianEthiopianEuropeanFijianFilipinoFinnishFrenchFrench American IndianFrench CanadianGermanGerman RussianGhanaianGreekGuamanian / ChamorroGuatemalanGuyaneseHaitianHmongHonduranHopiHoumaHungarianIcelanderIndian (Asian)IndonesianInupiatIranianIraqiIrishIroquoisIsraeliItalianJamaicanJapaneseJordanianKenyanKiowaKoreanLaotianLatvianLebaneseLiberianLithuanianLumbeeLuxembourgerMacedonianMalaysianMalteseMarshalleseMenomineeMexicanMexican American IndianMongolianMoroccanNative HawaiianNavajoNepaleseNew ZealanderNicaraguanNigerianNorthern EuropeanNorwegianOkinawanOsageOttawaPaiutePakistaniPalestinianPanamanianParaguayanPennsylvania GermanPeruvianPimaPolishPortuguesePotawatomiPuebloPuerto RicanPuget Sound SalishRomanianRussianSalvadoranSamoanScandinavianScotch-IrishScottishSeminoleSenegaleseSerbianShoshoneSierra LeoneanSiouxSlavicSlovakSloveneSomaliSouth AfricanSouth AmericanSouth American IndianSoviet UnionSpaniardSpanishSpanish AmericanSpanish American IndianSri LankanSubsaharan AfricanSudaneseSwedishSwissSyrianTaiwaneseThaiTlingit-HaidaTohono O'OdhamTonganTrinidadian and TobagonianTsimshianTurkishU.S. Virgin IslanderUgandanUkrainianUruguayanUteVenezuelanVietnameseWelshWest IndianYakamaYaquiYugoslavianYumanYup'ikZimbabwean
Immigrant Origin (Total)
AfghanistanAfricaAlbaniaArgentinaArmeniaAsiaAustraliaAustriaAzoresBahamasBangladeshBarbadosBelarusBelgiumBelizeBoliviaBosnia and HerzegovinaBrazilBulgariaBurma / MyanmarCabo VerdeCambodiaCameroonCanadaCaribbeanCentral AmericaChileChinaColombiaCongoCosta RicaCroatiaCubaCzechoslovakiaDenmarkDominicaDominican RepublicEastern AfricaEastern AsiaEastern EuropeEcuadorEgyptEl SalvadorEnglandEritreaEthiopiaEuropeFijiFranceGermanyGhanaGreeceGrenadaGuatemalaGuyanaHaitiHondurasHong KongHungaryIndiaIndonesiaIranIraqIrelandIsraelItalyJamaicaJapanJordanKazakhstanKenyaKoreaKuwaitLaosLatin AmericaLatviaLebanonLiberiaLithuaniaMalaysiaMexicoMicronesiaMiddle AfricaMoldovaMoroccoNepalNetherlandsNicaraguaNigeriaNorth MacedoniaNorthern AfricaNorthern EuropeNorwayOceaniaPakistanPanamaPeruPhilippinesPolandPortugalRomaniaRussiaSaudi ArabiaScotlandSenegalSerbiaSierra LeoneSingaporeSomaliaSouth AfricaSouth AmericaSouth Central AsiaSouth Eastern AsiaSouthern EuropeSpainSri LankaSt. Vincent and the GrenadinesSudanSwedenSwitzerlandSyriaTaiwanThailandTrinidad and TobagoTurkeyUgandaUkraineUruguayUzbekistanVenezuelaVietnamWest IndiesWestern AfricaWestern AsiaWestern EuropeYemenZaireZimbabwe
Immigrant Origin (Percentage)
AfghanistanAfricaAlbaniaArgentinaArmeniaAsiaAustraliaAustriaAzoresBahamasBangladeshBarbadosBelarusBelgiumBelizeBoliviaBosnia and HerzegovinaBrazilBulgariaBurma / MyanmarCabo VerdeCambodiaCameroonCanadaCaribbeanCentral AmericaChileChinaColombiaCongoCosta RicaCroatiaCubaCzechoslovakiaDenmarkDominicaDominican RepublicEastern AfricaEastern AsiaEastern EuropeEcuadorEgyptEl SalvadorEnglandEritreaEthiopiaEuropeFijiFranceGermanyGhanaGreeceGrenadaGuatemalaGuyanaHaitiHondurasHong KongHungaryIndiaIndonesiaIranIraqIrelandIsraelItalyJamaicaJapanJordanKazakhstanKenyaKoreaKuwaitLaosLatin AmericaLatviaLebanonLiberiaLithuaniaMalaysiaMexicoMicronesiaMiddle AfricaMoldovaMoroccoNepalNetherlandsNicaraguaNigeriaNorth MacedoniaNorthern AfricaNorthern EuropeNorwayOceaniaPakistanPanamaPeruPhilippinesPolandPortugalRomaniaRussiaSaudi ArabiaScotlandSenegalSerbiaSierra LeoneSingaporeSomaliaSouth AfricaSouth AmericaSouth Central AsiaSouth Eastern AsiaSouthern EuropeSpainSri LankaSt. Vincent and the GrenadinesSudanSwedenSwitzerlandSyriaTaiwanThailandTrinidad and TobagoTurkeyUgandaUkraineUruguayUzbekistanVenezuelaVietnamWest IndiesWestern AfricaWestern AsiaWestern EuropeYemenZaireZimbabwe
Income
Income (Families)
Income (Households)
Poverty
Poverty (Families)
Unemployment
Employment Occupations
Employment Industries
Employer Class
Commute Time
Commute Means
School Enrollment
Education by Degree Field
Occupancy
Finances
Physical Characteristics
Arkansas
Compare Cities
Comparison Subject

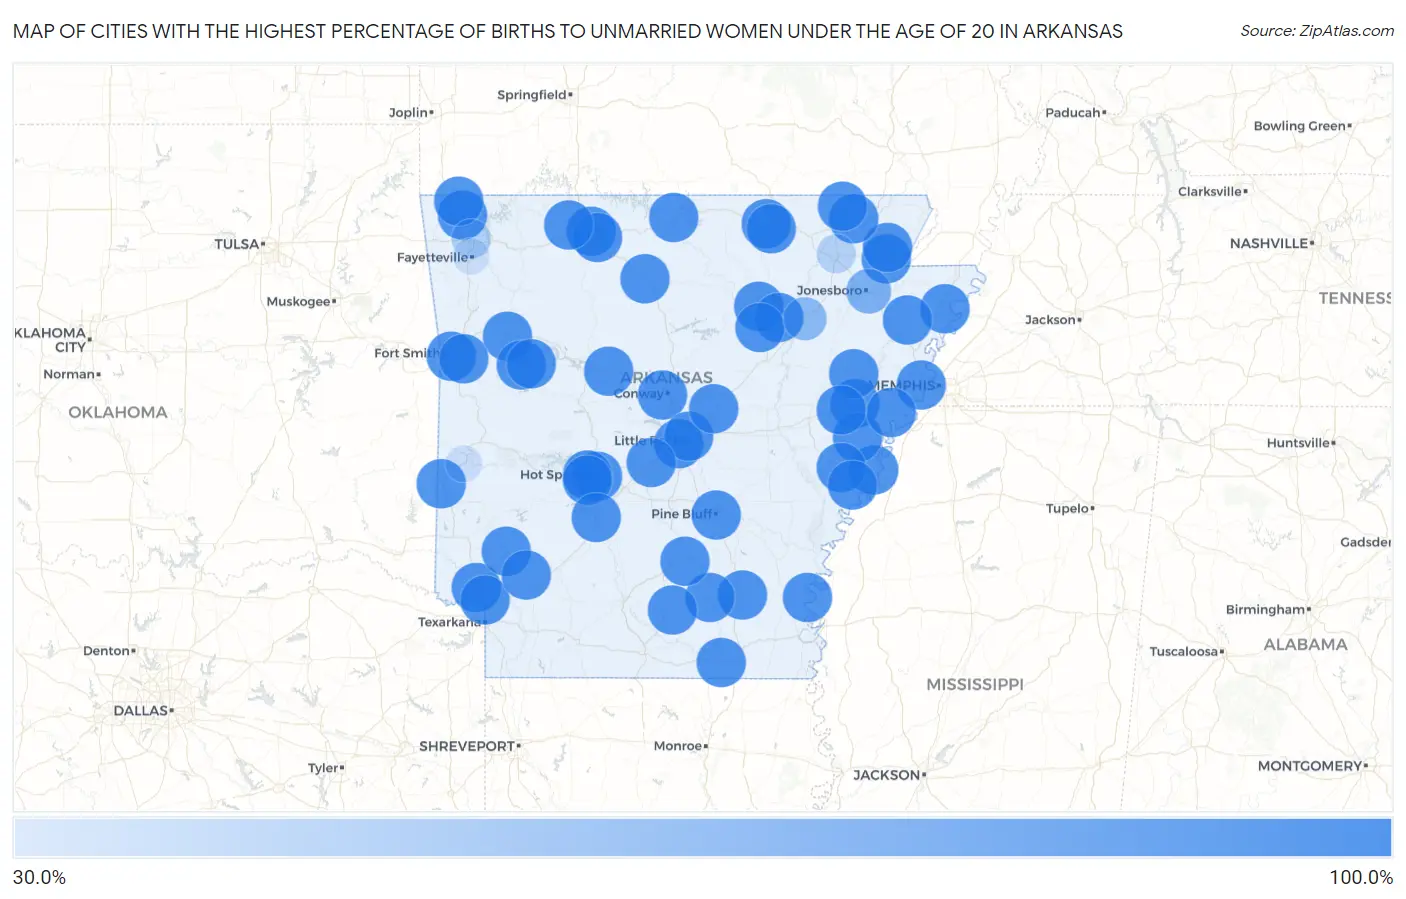
Map of Cities with the Highest Percentage of Births to Unmarried Women under the Age of 20 in Arkansas

0.0%
100.0%
Cities with the Highest Percentage of Births to Unmarried Women under the Age of 20 in Arkansas Map

Cities with the Highest Percentage of Births to Unmarried Women under the Age of 20 in Arkansas

City % Unmarried vs State vs National
1.Little Rock100.0%80.3%(+19.7)#186.9%(+13.1)#52
2.Fort Smith100.0%80.3%(+19.7)#286.9%(+13.1)#192
3.Conway100.0%80.3%(+19.7)#386.9%(+13.1)#280
4.North Little Rock100.0%80.3%(+19.7)#486.9%(+13.1)#284
5.Bentonville100.0%80.3%(+19.7)#586.9%(+13.1)#333
6.Pine Bluff100.0%80.3%(+19.7)#686.9%(+13.1)#422
7.Hot Springs100.0%80.3%(+19.7)#786.9%(+13.1)#448
8.Benton100.0%80.3%(+19.7)#886.9%(+13.1)#474
9.Bella Vista100.0%80.3%(+19.7)#986.9%(+13.1)#531
10.Paragould100.0%80.3%(+19.7)#1086.9%(+13.1)#537
11.Cabot100.0%80.3%(+19.7)#1186.9%(+13.1)#566
12.West Memphis100.0%80.3%(+19.7)#1286.9%(+13.1)#604
13.Harrison100.0%80.3%(+19.7)#1386.9%(+13.1)#850
14.Forrest City100.0%80.3%(+19.7)#1486.9%(+13.1)#855
15.Mountain Home100.0%80.3%(+19.7)#1586.9%(+13.1)#860
16.Helena West Helena100.0%80.3%(+19.7)#1686.9%(+13.1)#968
17.Monticello100.0%80.3%(+19.7)#1786.9%(+13.1)#1,008
18.Wynne100.0%80.3%(+19.7)#1886.9%(+13.1)#1,018
19.Osceola100.0%80.3%(+19.7)#1986.9%(+13.1)#1,064
20.Warren100.0%80.3%(+19.7)#2086.9%(+13.1)#1,130
21.Cherokee Village100.0%80.3%(+19.7)#2186.9%(+13.1)#1,146
22.Crossett100.0%80.3%(+19.7)#2286.9%(+13.1)#1,160
23.Piney100.0%80.3%(+19.7)#2386.9%(+13.1)#1,171
24.Ashdown100.0%80.3%(+19.7)#2486.9%(+13.1)#1,188
25.Southside100.0%80.3%(+19.7)#2586.9%(+13.1)#1,189
26.Rockwell100.0%80.3%(+19.7)#2686.9%(+13.1)#1,192
27.Nashville100.0%80.3%(+19.7)#2786.9%(+13.1)#1,198
28.Marianna100.0%80.3%(+19.7)#2886.9%(+13.1)#1,225
29.Ozark100.0%80.3%(+19.7)#2986.9%(+13.1)#1,229
30.Paris100.0%80.3%(+19.7)#3086.9%(+13.1)#1,254
31.Atkins100.0%80.3%(+19.7)#3186.9%(+13.1)#1,284
32.Lepanto100.0%80.3%(+19.7)#3286.9%(+13.1)#1,456
33.Marshall100.0%80.3%(+19.7)#3386.9%(+13.1)#1,524
34.Oak Grove Heights100.0%80.3%(+19.7)#3486.9%(+13.1)#1,550
35.Highland100.0%80.3%(+19.7)#3586.9%(+13.1)#1,570
36.Marvell100.0%80.3%(+19.7)#3686.9%(+13.1)#1,596
37.Hughes100.0%80.3%(+19.7)#3786.9%(+13.1)#1,607
38.Palestine100.0%80.3%(+19.7)#3886.9%(+13.1)#1,688
39.Caddo Valley100.0%80.3%(+19.7)#3986.9%(+13.1)#1,692
40.Central City100.0%80.3%(+19.7)#4086.9%(+13.1)#1,703
41.Kingsland100.0%80.3%(+19.7)#4186.9%(+13.1)#1,780
42.Bellefonte100.0%80.3%(+19.7)#4286.9%(+13.1)#1,785
43.Arkansas City100.0%80.3%(+19.7)#4386.9%(+13.1)#1,791
44.Subiaco100.0%80.3%(+19.7)#4486.9%(+13.1)#1,793
45.Biggers100.0%80.3%(+19.7)#4586.9%(+13.1)#1,808
46.Lake View100.0%80.3%(+19.7)#4686.9%(+13.1)#1,815
47.Maynard100.0%80.3%(+19.7)#4786.9%(+13.1)#1,826
48.Alpena100.0%80.3%(+19.7)#4886.9%(+13.1)#1,835
49.Batavia100.0%80.3%(+19.7)#4986.9%(+13.1)#1,838
50.Cove100.0%80.3%(+19.7)#5086.9%(+13.1)#1,869
51.Harrell100.0%80.3%(+19.7)#5186.9%(+13.1)#1,889
52.Oil Trough100.0%80.3%(+19.7)#5286.9%(+13.1)#1,903
53.Ogden100.0%80.3%(+19.7)#5386.9%(+13.1)#1,922
54.Pleasant Plains100.0%80.3%(+19.7)#5486.9%(+13.1)#1,927
55.Washington100.0%80.3%(+19.7)#5586.9%(+13.1)#1,938
56.Jonesboro75.6%80.3%(-4.70)#5686.9%(-11.3)#2,034
57.Newport67.9%80.3%(-12.4)#5786.9%(-19.0)#2,054
58.Springdale48.4%80.3%(-31.9)#5886.9%(-38.5)#2,092
59.Walnut Ridge46.2%80.3%(-34.1)#5986.9%(-40.7)#2,097
60.Mena35.1%80.3%(-45.2)#6086.9%(-51.8)#2,107
61.Fayetteville34.1%80.3%(-46.2)#6186.9%(-52.8)#2,109

Common Questions

What are the Top 10 Cities with the Highest Percentage of Births to Unmarried Women under the Age of 20 in Arkansas?
Top 10 Cities with the Highest Percentage of Births to Unmarried Women under the Age of 20 in Arkansas are:
#1
100.0%
#2
100.0%
#3
100.0%
#4
100.0%
#5
100.0%
#6
100.0%
#7
100.0%
#8
100.0%
#9
100.0%
#10
100.0%
What city has the Highest Percentage of Births to Unmarried Women under the Age of 20 in Arkansas?
Little Rock has the Highest Percentage of Births to Unmarried Women under the Age of 20 in Arkansas with 100.0%.
What is the Percentage of Births to Unmarried Women under the Age of 20 in the State of Arkansas?
Percentage of Births to Unmarried Women under the Age of 20 in Arkansas is 80.3%.
What is the Percentage of Births to Unmarried Women under the Age of 20 in the United States?
Percentage of Births to Unmarried Women under the Age of 20 in the United States is 86.9%.